
Atmospheric Dispersion of Gaseous Amine Emitted from Absorption-Based Carbon Capture Plants in Saskatchewan, Canada


1
Department of Mining and Petroleum Engineering, Faculty of Engineering, Chulalongkorn University, Bangkok 10330, Thailand
2
Faculty of Engineering and Applied Science, University of Regina, 3737 Wascana Parkway, Regina, SK S4S 0A2, Canada
3
Department of Chemical Technology, Faculty of Science, Chulalongkorn University, Bangkok 10330, Thailand
*
Author to whom correspondence should be addressed.
Energies 2022, 15(3), 1221; https://doi.org/10.3390/en15031221
Submission received: 10 January 2022
/
Revised: 31 January 2022
/
Accepted: 1 February 2022
/
Published: 8 February 2022
(This article belongs to the Special Issue High Efficiency Processes for Gas Separation & Purification)
Abstract
:Carbon capture and storage (CCS) is a key strategy to reduce carbon dioxide (CO2) emissions from industrial point sources. Gas absorption into aqueous amine solutions is an immediate technology for carbon capture that has been tested in many demonstration plants. One concern of using the amine-based carbon capture process is the environmental impacts and health risk caused by emissions of gaseous amines from the process to the atmosphere. This work applied the knowledge of air dispersion modelling to map out the atmospheric dispersion and resulting ground surface level concentration of gaseous amine, namely Monoethanolamine (MEA), from a coal-fired power plant (with a carbon capture unit) and in surrounding areas, in case of an accidental leaking of amine from the CCS system to the atmosphere. The chosen study area was centered on a coal-fired power plant in the province of Saskatchewan, Canada. The Environmental Protection (EPA) approved air pollution model (CALPUFF), together with meteorological and geophysical data were used for gaseous amine dispersion simulation. The results were presented, and the ground amine concentrations were found to vary with wind patterns (wind direction and wind speed). The maximum ground surface amine concentrations standard is 15.2 µg/m3. However, the results showed that when using the water wash unit, the MEA concentrations were well below the standard level, compared to those without the water wash unit. It is essential for CO2 capture plants located in highly populated areas to be equipped with water wash units.
1. Introduction
Global energy-related carbon dioxide emissions are estimated to increase by 1.5 billion tons in 2021, causing an almost 5% increase of CO2 from about 33 billion tons from 2019 [1,2]. Excessive emissions of carbon dioxide (CO2) from coal fired power plants are currently of great concern. It is expected to grow by 4.5% because of economic recovery from the Covid crisis [1,2]. According to the COP 26 meeting in Glasgow, United Kingdom [2], member countries committed to limit the increase in 1.5 degrees Celsius. This requires a reduction in GHG emissions of 7.6% each year between 2020 and 2030 [3,4]. However, financial markets are also providing encouraging signs for clean energy investment. These could put the world on track to reach net-zero emissions in 2050 [4,5,6].
The climate crisis will become one of the greatest existential threats to humanity if global warming cannot be limited to a maximum of +2 °C above pre-industrial levels by the end of this century. UNFCCC reported that the nationally determined contributions would predictably put the world on track for 2.7 °C to 3.0 °C warming compared to pre-industrial levels [1,3,7,8,9]. To limit the growth rate of temperature, governments and current policies are working on reducing carbon dioxide (CO2) emissions, especially fossil fuel CO2. Carbon capture and storage (CCS) technologies are necessary for control of CO2 emissions [9,10,11,12,13,14,15,16,17,18]. CCS is the process of trapping, storing, and isolating excess carbon dioxide from power plants, and it will need to be applied in large scale industrial point sources, such as coal-fired power plants and cement plants [10,11,12,13].
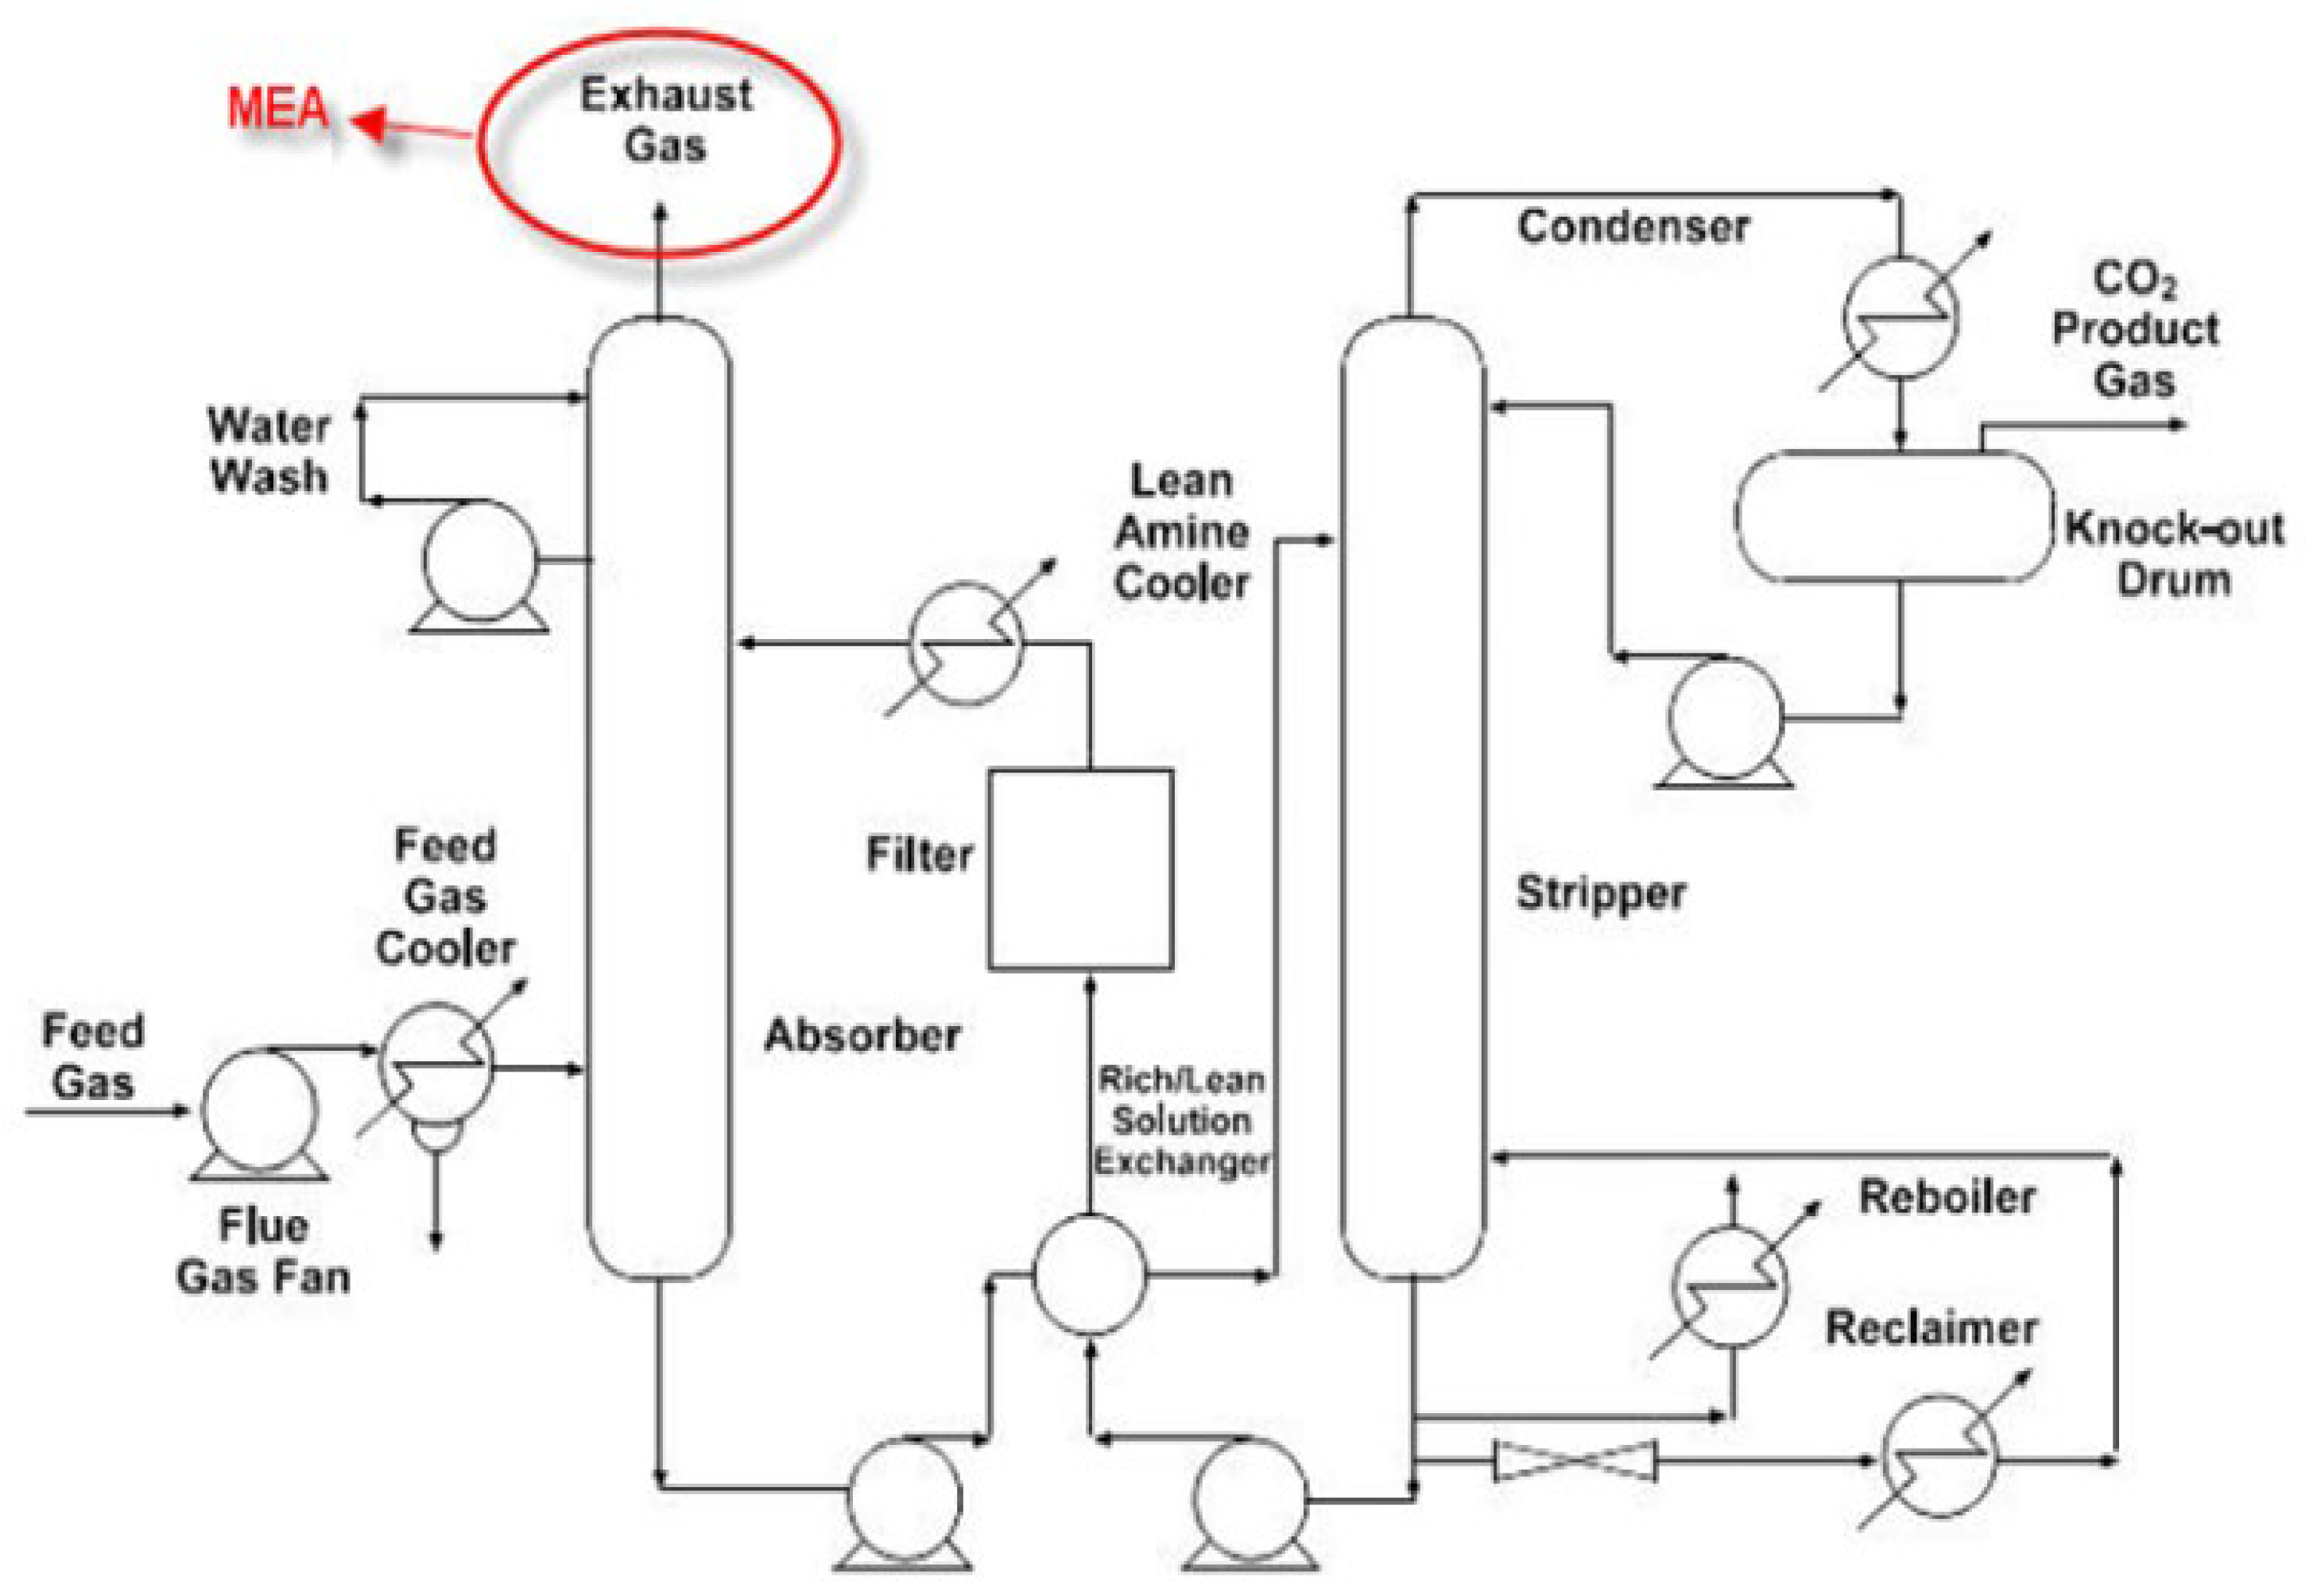
It was estimated that CCS could help reduce CO2 emissions by 17% in 2030, and even by 19% by 2035 (Khatib 2011). Carbon capture amine-based absorption process is an immediate technology that can be used for post-combustion flue gas treatment since it is a mature technology that has been used for acid gas treatment for many decades, the detail is as shown in Figure 1. Amine-based chemical absorption in Figure 1. consists of two main processes. One is an absorption process, where CO2 in the flue gas is absorbed into the liquid solvent; and the other is a regeneration process which uses the heat of the solvent regeneration in the stripper of the CO2 capture. In the absorption process, flue gas entered into the system then cooled by direct water contact, and fine particles could also be removed using the gas stream. The lean amine (low content of CO2 reaction products) was brought into contact with cooled flue gas in a packed absorber tower (amine scrubber), then flue gas exited on the top of the absorber with water washed systems, to reduce high concentration of the solvent emission droplets to the atmosphere. In regeneration process, rich amine (high content of CO2 reaction product) exited the base of the scrubber and was pumped to the top of the amine stripping tower, then a heat exchanger heated the rich amine and recovered heat from the amine regenerators’ process back to the absorber [14,15,17,18].
However, there are concerns about the environmental impacts and health risk caused by the CCS. As amines are used to absorb CO2 in CCS processes, the leaking of gaseous amines and their degradation products cause environmental impacts and health risk. Effects of amines on humans and animal health risks are shown in Table 1 [17,18,19,20,21,22,23,24,25,26].
The degree of impact and health risk is dependent on exposure level or dosage (i.e., amine concentration and exposure duration). Exposure to higher dosages leads to more severe impacts. Due to such impacts, a number of studies were implemented to gain a better understanding of the causes and impacts of gaseous amines, and to develop a strategy for emission prevention and control by process design, operation, and monitoring. The purpose was to ensure that the carbon capture unit will be properly designed and operated to avoid negative environmental impacts and health risks [17,18,19,20,24,25,26]. The following are some examples of the studies and findings:
- (1)
- According to the Commonwealth Scientific and Industrial Research Organisation (CSIRO) report on chemical transport dispersion modelling for amine, the simulation for a point source case study in Norway showed the highest Monoethanolamine (MEA) concentration of 0.1 to 0.46 ppb after 1 h [11].
- (2)
- The Japanese company, Mitsubishi, built a pilot plant for CO2 capture process testing with high efficiency and low pressure loss packing. They could control amine emissions with the treated gas to less than 0.1 ppm [27].
- (3)
- The Norwegian institute for air research reported on amine emissions from the CO2 capture unit operated at a power plant at Kårstø in Norway which has a capturing capacity of 1.05 million tons/year. They studied atmospheric amine degradation by using the CONDEP model (NILU operative at the Norwegian Institute using for in house model using gaussian dispersion model). The amine emission was based on the maximum tolerated dose method and yearly average of the data downscale to short term calculation without validating data, because amine emission right now has no equipment capable of monitoring it. The results showed that about 1 to 4 ppm amine was found 38 km from the plant, and the maximum annual concentration of 16.4 mg/m3 was found within 4 to 8 km from the plant [20,28].
- (4)
- Shao [22] reported that the maximum amine concentration of 11 µg/m3 was found 10 km from the 420 MW Kårstø power plant, Norway, which simulated the amine emission when inputted in a process as a critical load.
Despite the availability of all these studies, there is still a knowledge gap regarding the spatial and temporal distribution of atmospheric gaseous amines. In our work, we applied the EPA approved air quality model (CALPUFF provided by the U.S. Environmental Protection Agency, Washington, DC, USA) to quantify the amount (ground surface concentrations) of the atmospheric gaseous emissions of the amine and map its distribution around the emission source. This would help to identify potential negative impacts from gaseous amine emissions on the surrounding areas based on the local air quality standards [29].
2. Materials and Methods
2.1. Dispersion Model
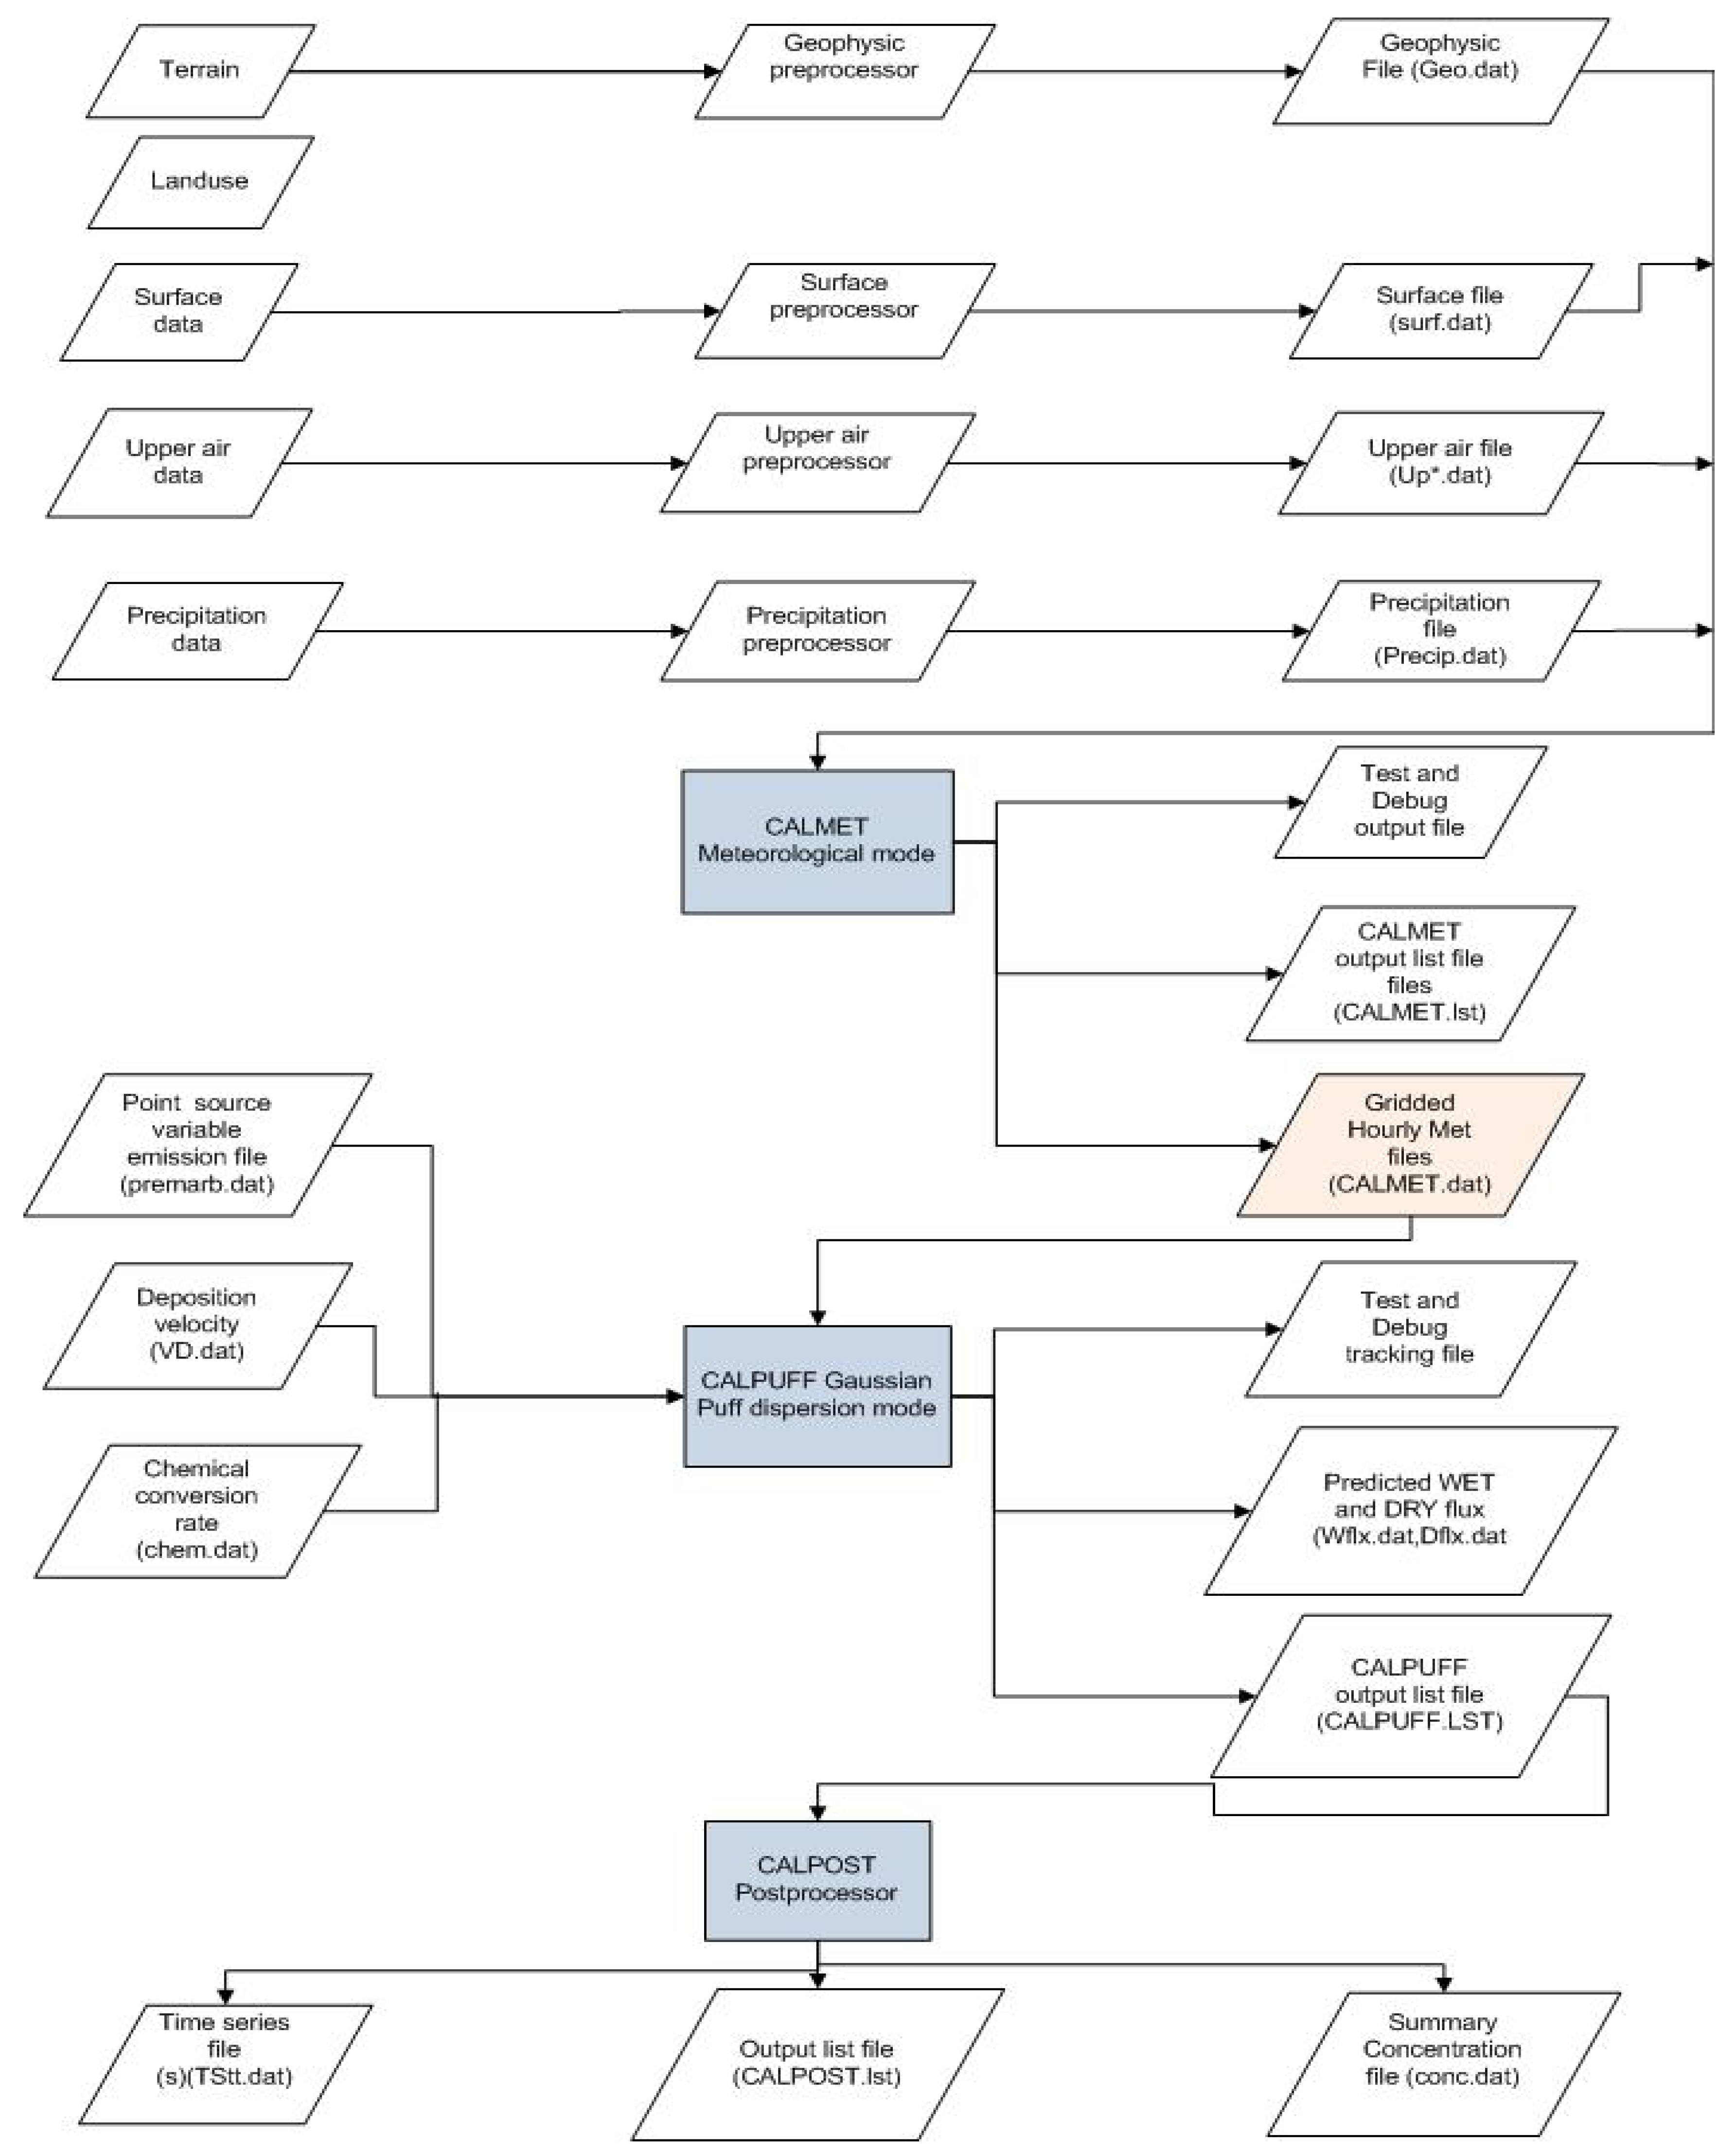
In this work, the dispersion model software called CALPUFF View was used for simulating spatial and temporal distribution of leaking gaseous amine. CALPUFF View is a multi-layer, multi-species, non-steady-state puff dispersion model that simulates the effects of time and space with varying meteorological conditions on pollution transport, transformation, and removal. This model uses a Gaussian equation to characterize the atmospheric processes that disperse a pollutant emitted by a source, based on emissions and meteorological inputs [29,30,31,32]. The concept of this model can be summarized as shown in Figure 2. Equations used in CALPUFF are as follows.
For a horizontally symmetric puff, the equation becomes:
where C is the ground-level concentration (g/m3) at the distance s (m) from the source, Q is the pollutant mass in the puff (g), σx is the standard deviation (m) of the Gaussian distribution in the along-wind direction, σy is the standard deviation (m) of the Gaussian distribution in the cross-wind direction, da is the distance (m) from the puff center to the receptor in the along-wind direction, dc is the distance (m) from the puff center to the receptor in the cross-wind direction, R is the distance from the center of the puff to the receptor, s is the distance travelled by the puff (m), H is the effective height above the ground of the puff center (m), h is the mixed-layer height (m), G is vertical term (m) of Gaussian equation.
The basic point source plume rise relationships are based on the Briggs equation. The plume rises due to buoyancy and momentum during neutral or unstable conditions. Zn is:
where, Fm is the momentum flux (m4/s2), F is the buoyancy flux (m4/s2), us is the stack height wind speed (m/s), x is the downwind distance (m), β1 is the neutral entrainment parameter (≈0.60), βj is the jet entrainment coefficient (βj = 1/3+ us/w), and w is the stack gas exit speed (m/s).
2.2. Study Area
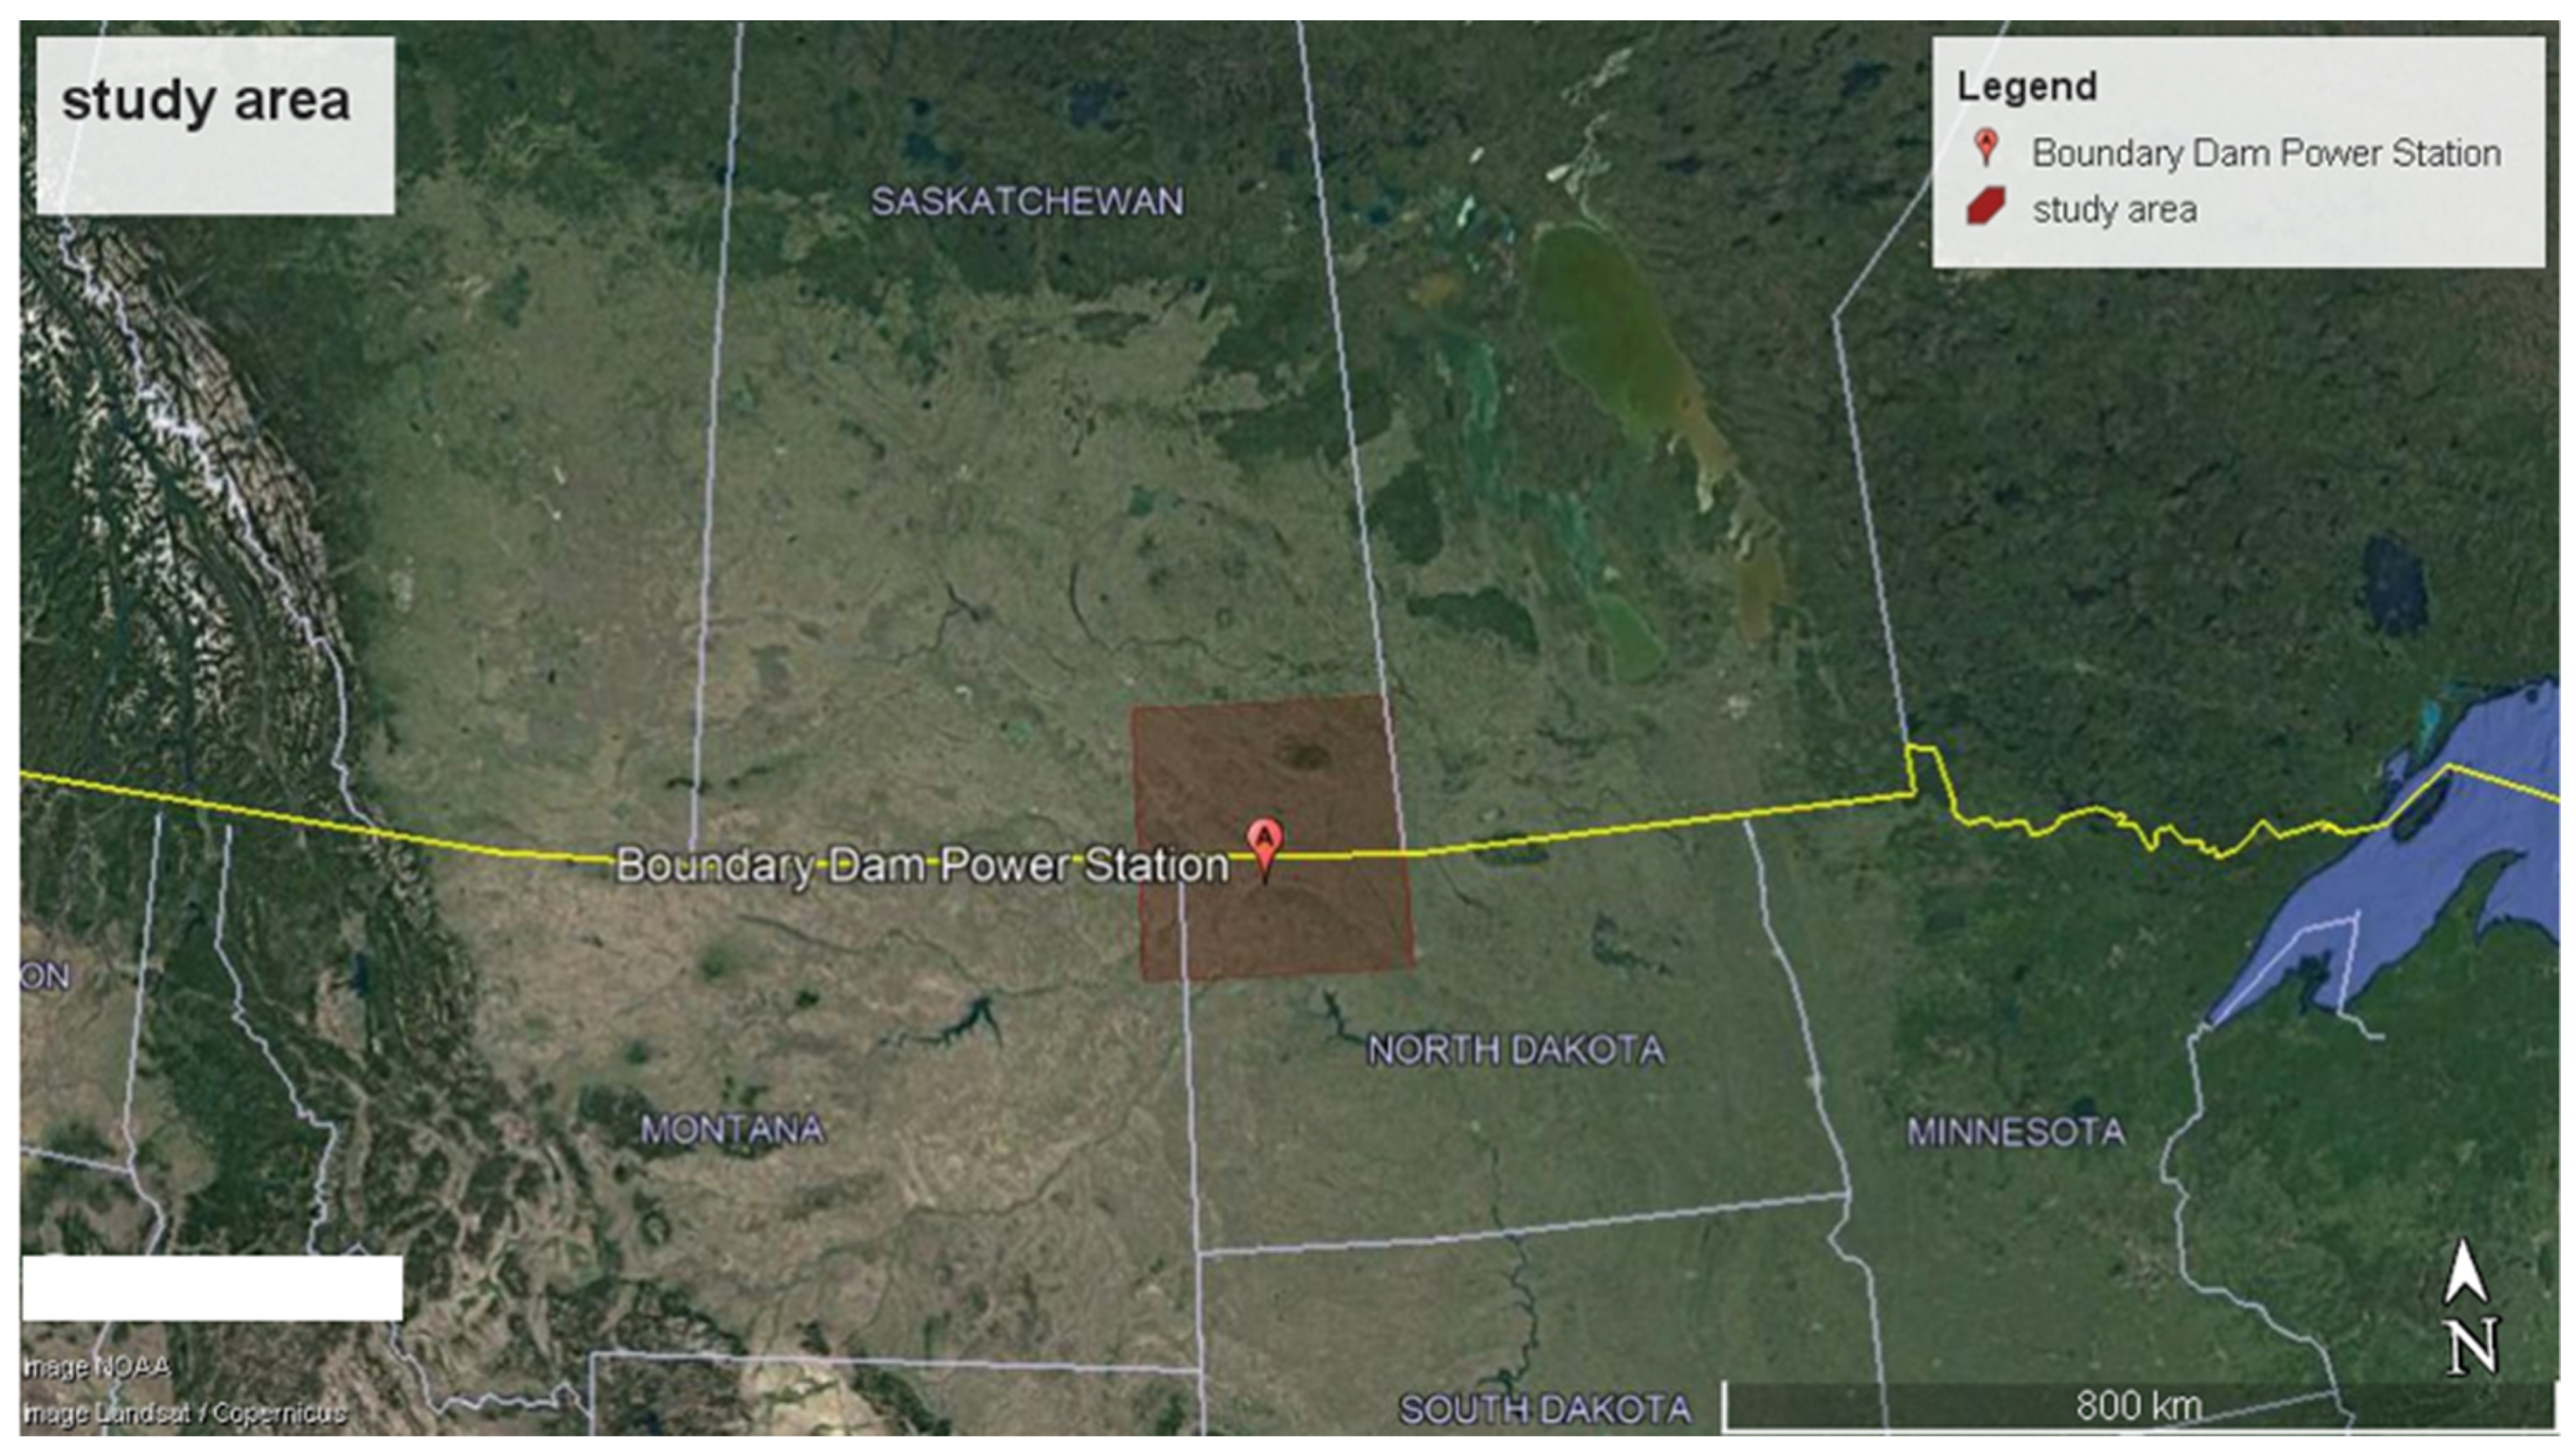
We chose to use the information of a coal-fired power plant that installed an absorption-based carbon capture unit in the province of Saskatchewan in Canada as our case study, as shown in Figure 3. The study area was within a radius of 100 km around the power plant (using the longest distance the CALPUFF model can simulate), which is between the US border (Montana and North Dakota) and Canada (Saskatchewan). Most of the land was used as agricultural land and grassland areas [33]. Monoethanolamine (MEA) was chosen to be the amine used in the CO2 capture unit [23,34,35]. The information on the power plant and its carbon capture unit that was used in our simulation is given in Table 2. It should be noted that in the actual operation of this power plant, a proprietary amine solvent was used instead of MEA [15,16].
2.3. Input Data
Five types of input data were required for gaseous amine dispersion simulation: meteorological, geophysical, land use, and physical and chemical data [31].
2.3.1. Meteorological Data
The CALMET sub-model required surface and upper air meteorological data; twice daily upper air sounding data were used. The pre-processors for the raw meteorological data were written to accommodate the U.S. National Climatic Data Centre (NCDC) file formats [31]. A summary of the required meteorological data is given in Table 3.
2.3.2. Geophysical Data and Land Use Data
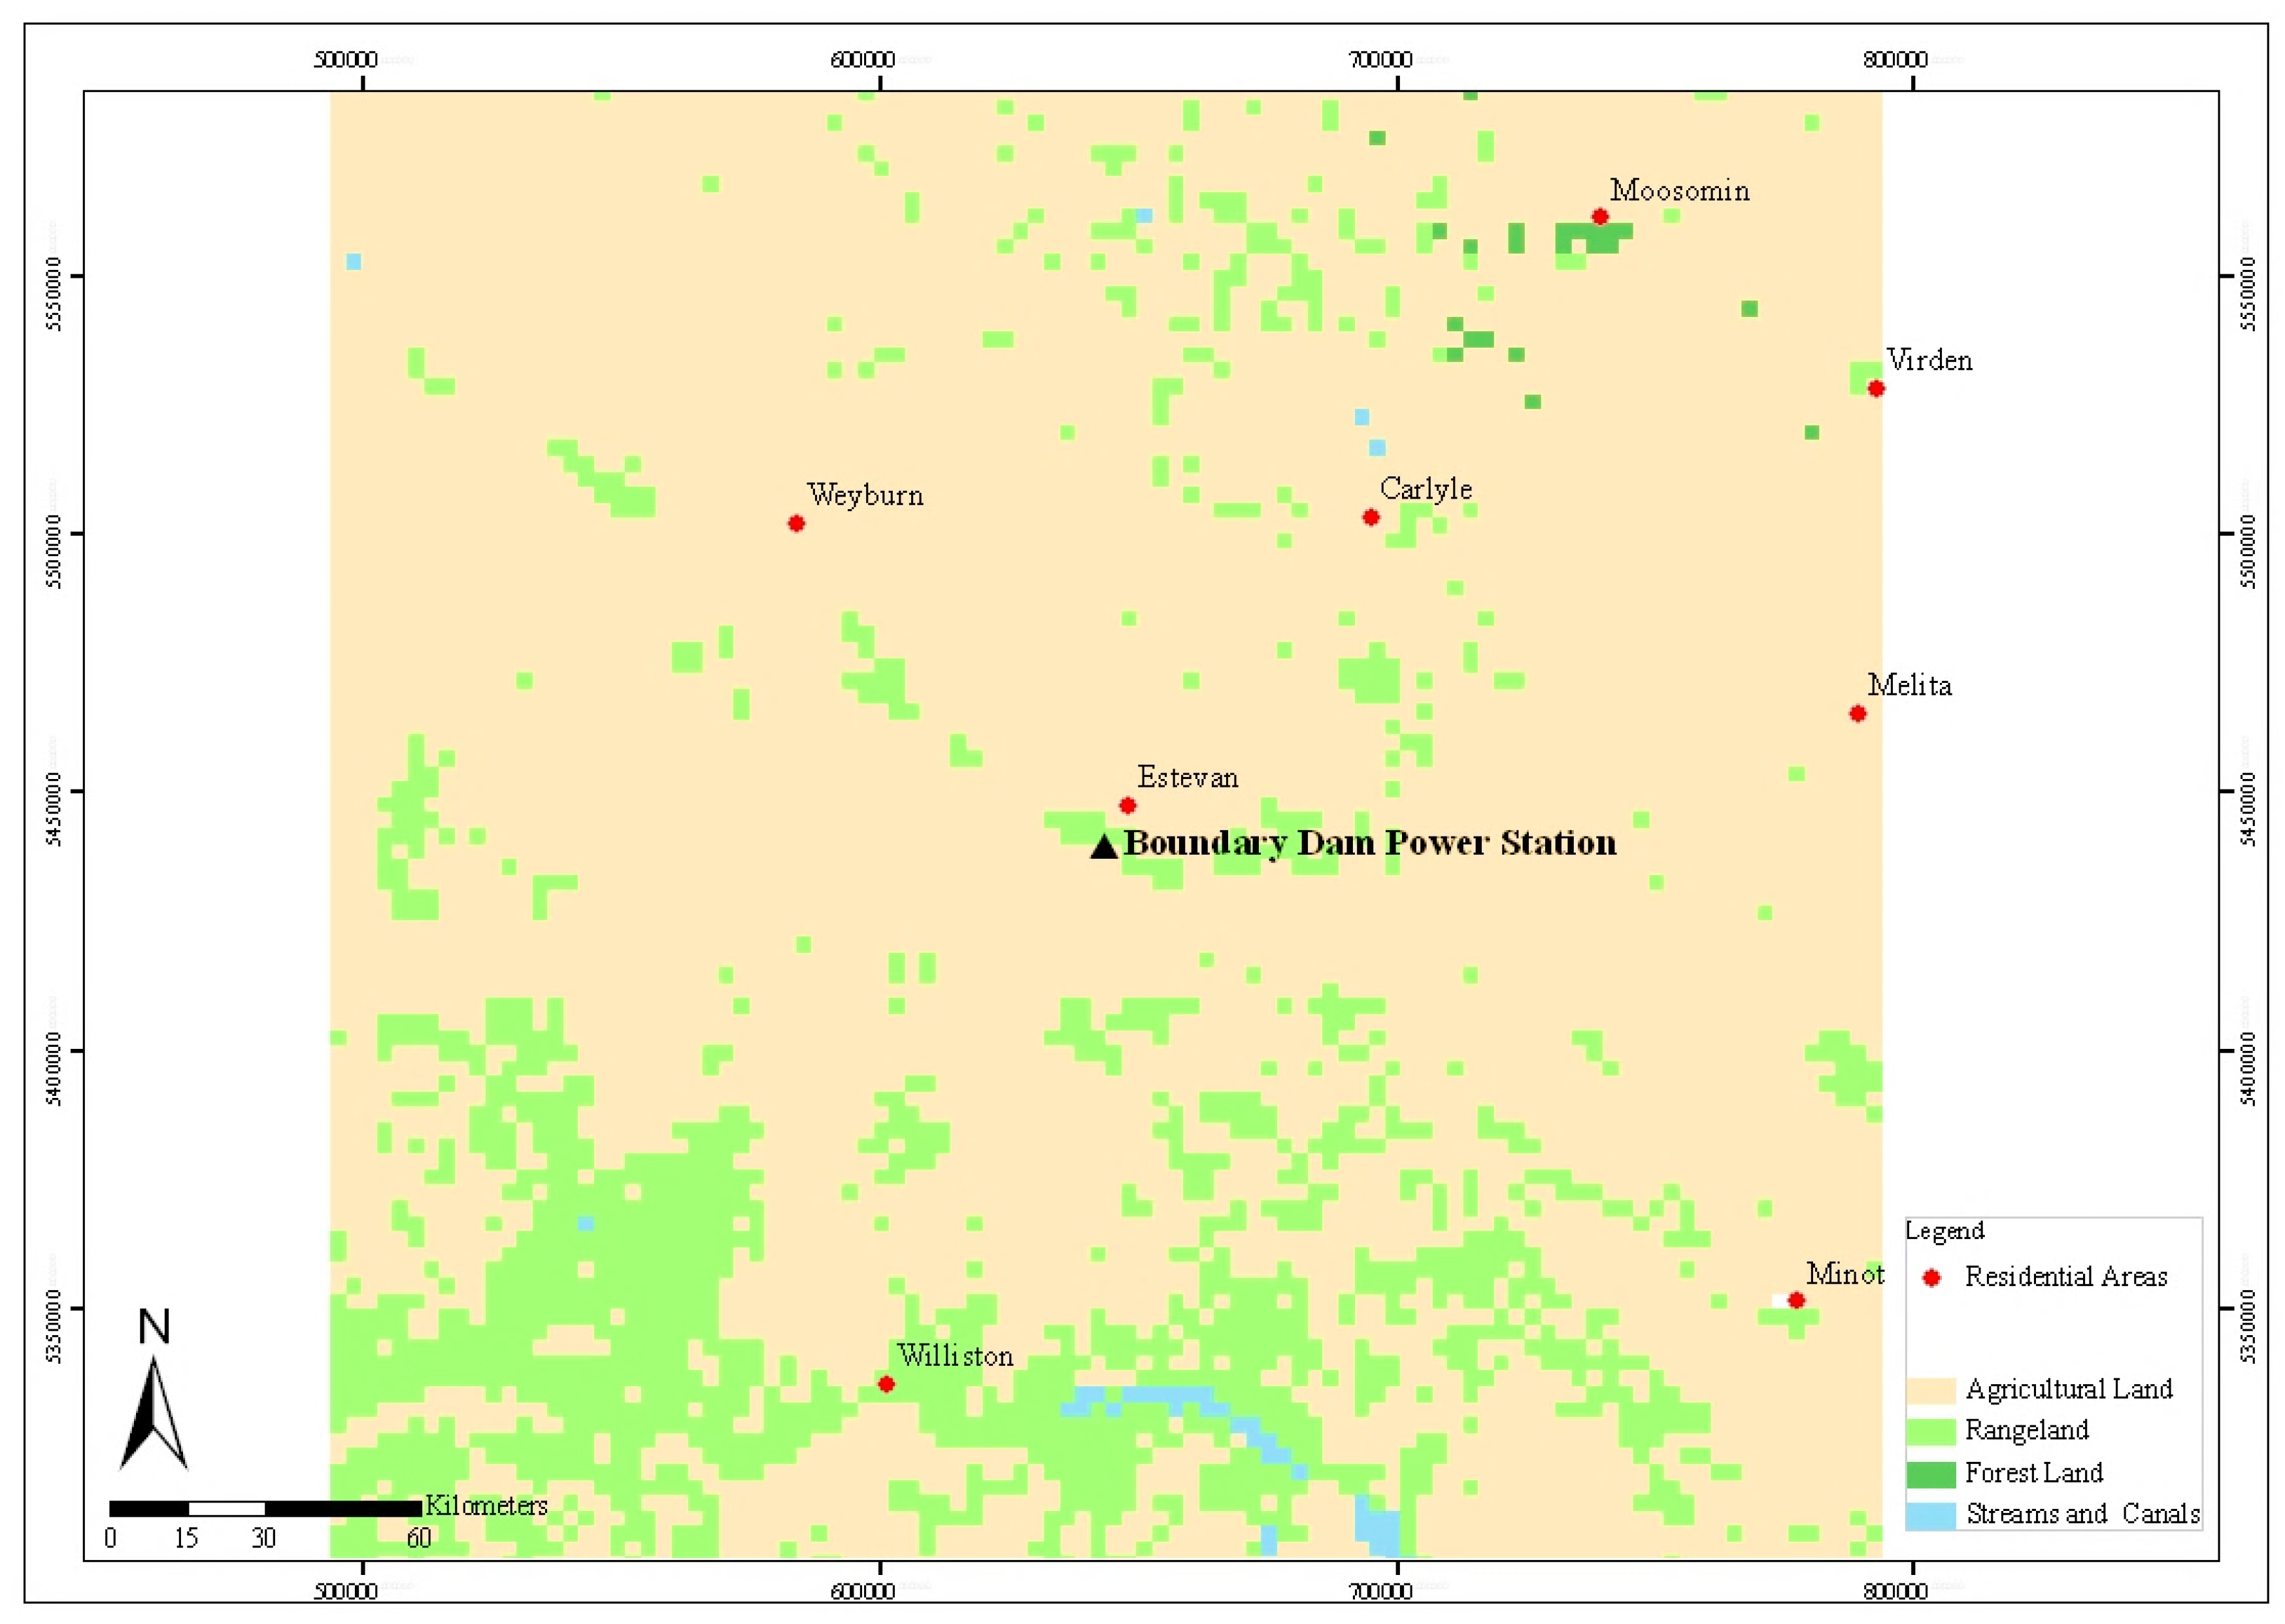
Gridded terrain elevations for the modeling domain were the digital elevation model (DEM) files produced by the United States Geological Survey (USGS) USGS (http://earthexplorer.usgs.gov/, accessed on 7 January 2022). Data were provided in files covering 1 degree by 1 degree blocks of latitude and longitude. The 1-degree DEMs were produced by the Defense Mapping Agency using cartographic and photographic sources. USGS 1:250,000 scale topographic maps were the primary source of 1-degree DEMs. One degree DEM data consisted of an array of 1201 by 1201 elevations referenced on the geographic (latitude/longitude) coordinate system of the World Geodetic System 1984 Datum. Elevations were in meters relative to mean sea level, and the spacing of the elevations along each profile was 3 arc-seconds, which corresponded to a spacing of approximately 90 m. The modeling domain used in this study covered an area of 300 km by 300 km. A resolution of 3 km in the horizontal was used to represent the variations of the terrain elevations in the area. USGS elevations within each grid cell were averaged to produce a mean elevation representing each grid point elevation. The 3 km resolution produced a workable number of grid cells (100 × 100). Land use has effects on albedo, bowen ratio, soil heat flux, anthropogenic heat flux, and vegetative leaf area index. The land used wad provided by the Government of Saskatchewan, and they were classified according to the U.S. Geological Survey, as shown in Figure 4 [31,33].
2.4. CALPUFF Processing Data
CALPUFF model processed the dispersion model by using: (1) geophysical dataset preprocessing, which included terrain elevation data, to calculate a modelling grid from digitized data and land use data, which is calculated from the land cover fraction values. The terrain elevation data and land use data are specific to modelling domain; (2) meteorological, geophysical, and land use data were used to calculate, with gaussian equation (Equations (1)–(4)), chemical transformation, chemical reaction, and deposition process based on wet and dry deposition. It should be noted that in the actual operation of this power plant, a proprietary amine solvent was used, not MEA. Some data are from theoretical calculations [31,33,35] and some details of CALPUFF parameters are given in Table 4.
This study calculated and also compared amine emissions predicted by each different method for the same amine unit (i.e., same source) and analyzed the predicted emissions for trends (e.g., consistently and predicting the highest emissions rate). It was found that the calculated emission rate of MEA was 415.251 kg/h in the case of an accidental leaking of amine from the CCS system to the atmosphere. This amount was based on the failure of the MEA storage tank (for the maximum operation), in which the content was emptied within 1 h.
3. Results and Discussion
The results were simulated in case of an accidental failure of the MEA storage tank, which was not a normal case.
3.1. Annual Wind Direction Frequencies and Ground-Level Concentrations of Gaseous MEA
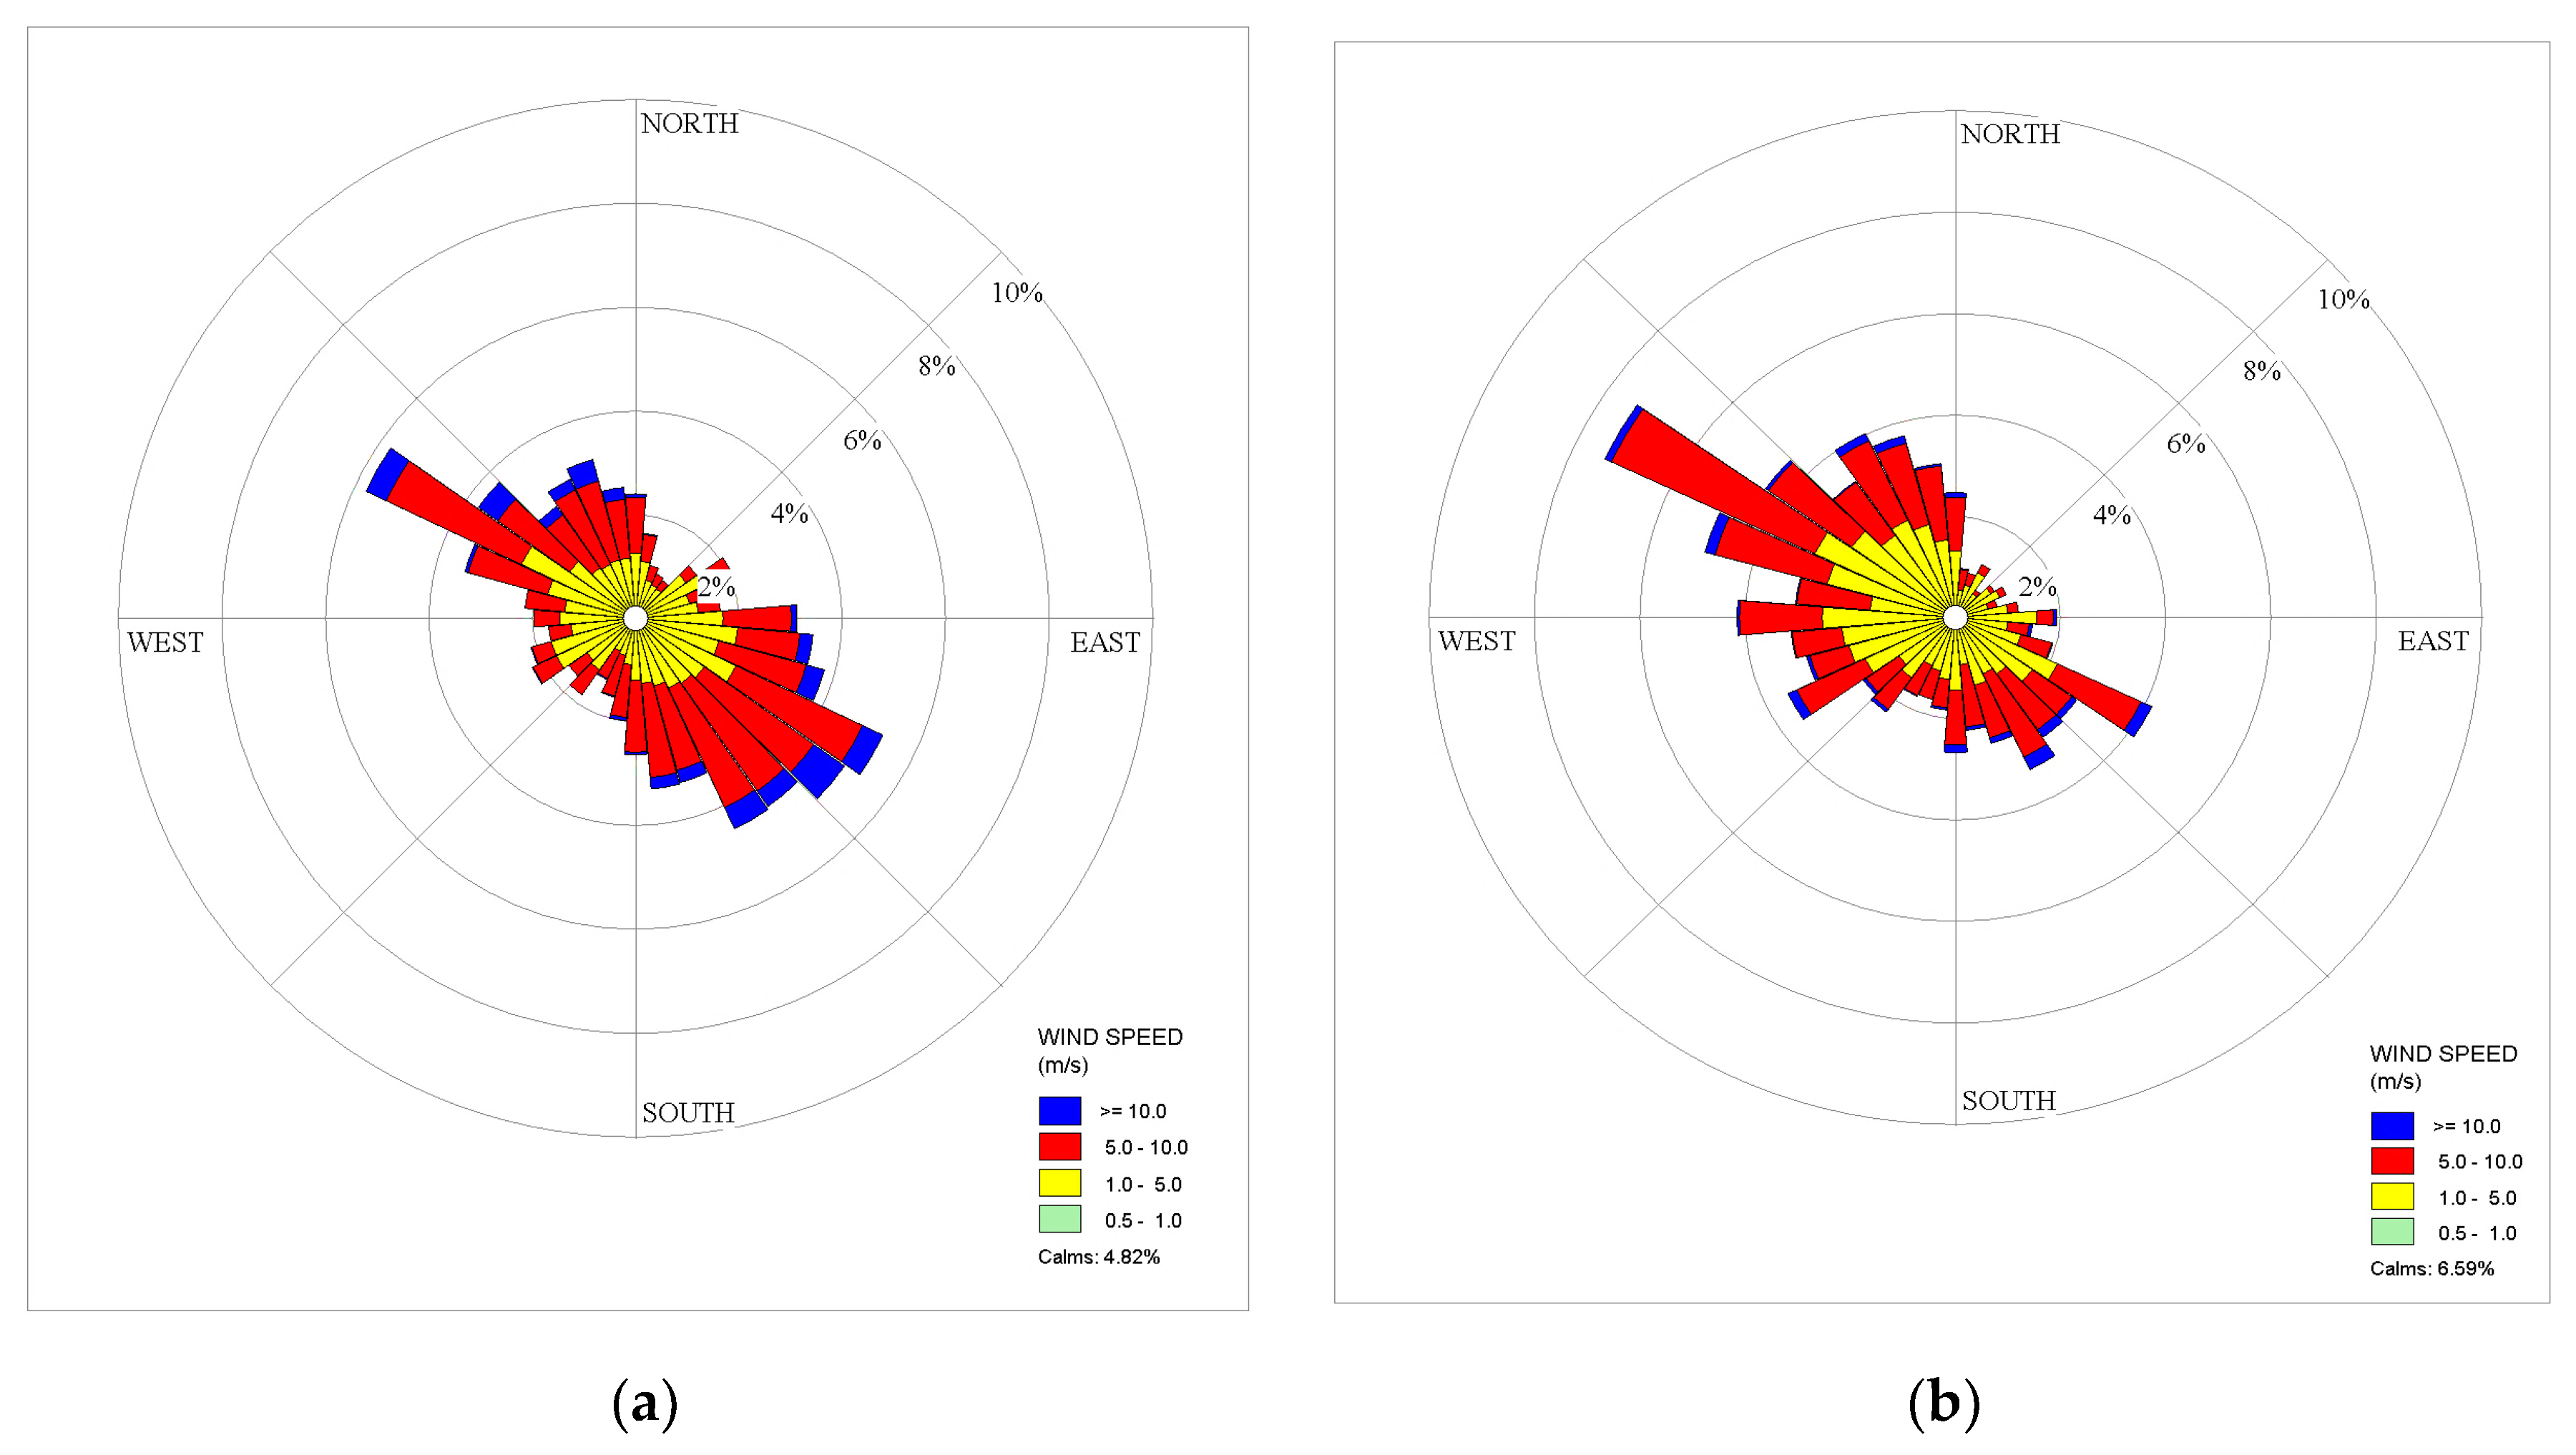
The simulations were carried out to predict ground-level atmospheric concentrations of gaseous MEA over the study area. Wind direction and wind speed were found to have a great effect on the MEA concentration distribution. The highest frequency of wind direction and wind speed in each season was used in the model, as shown in Figure 5. The simulated results are shown in Figure 6.
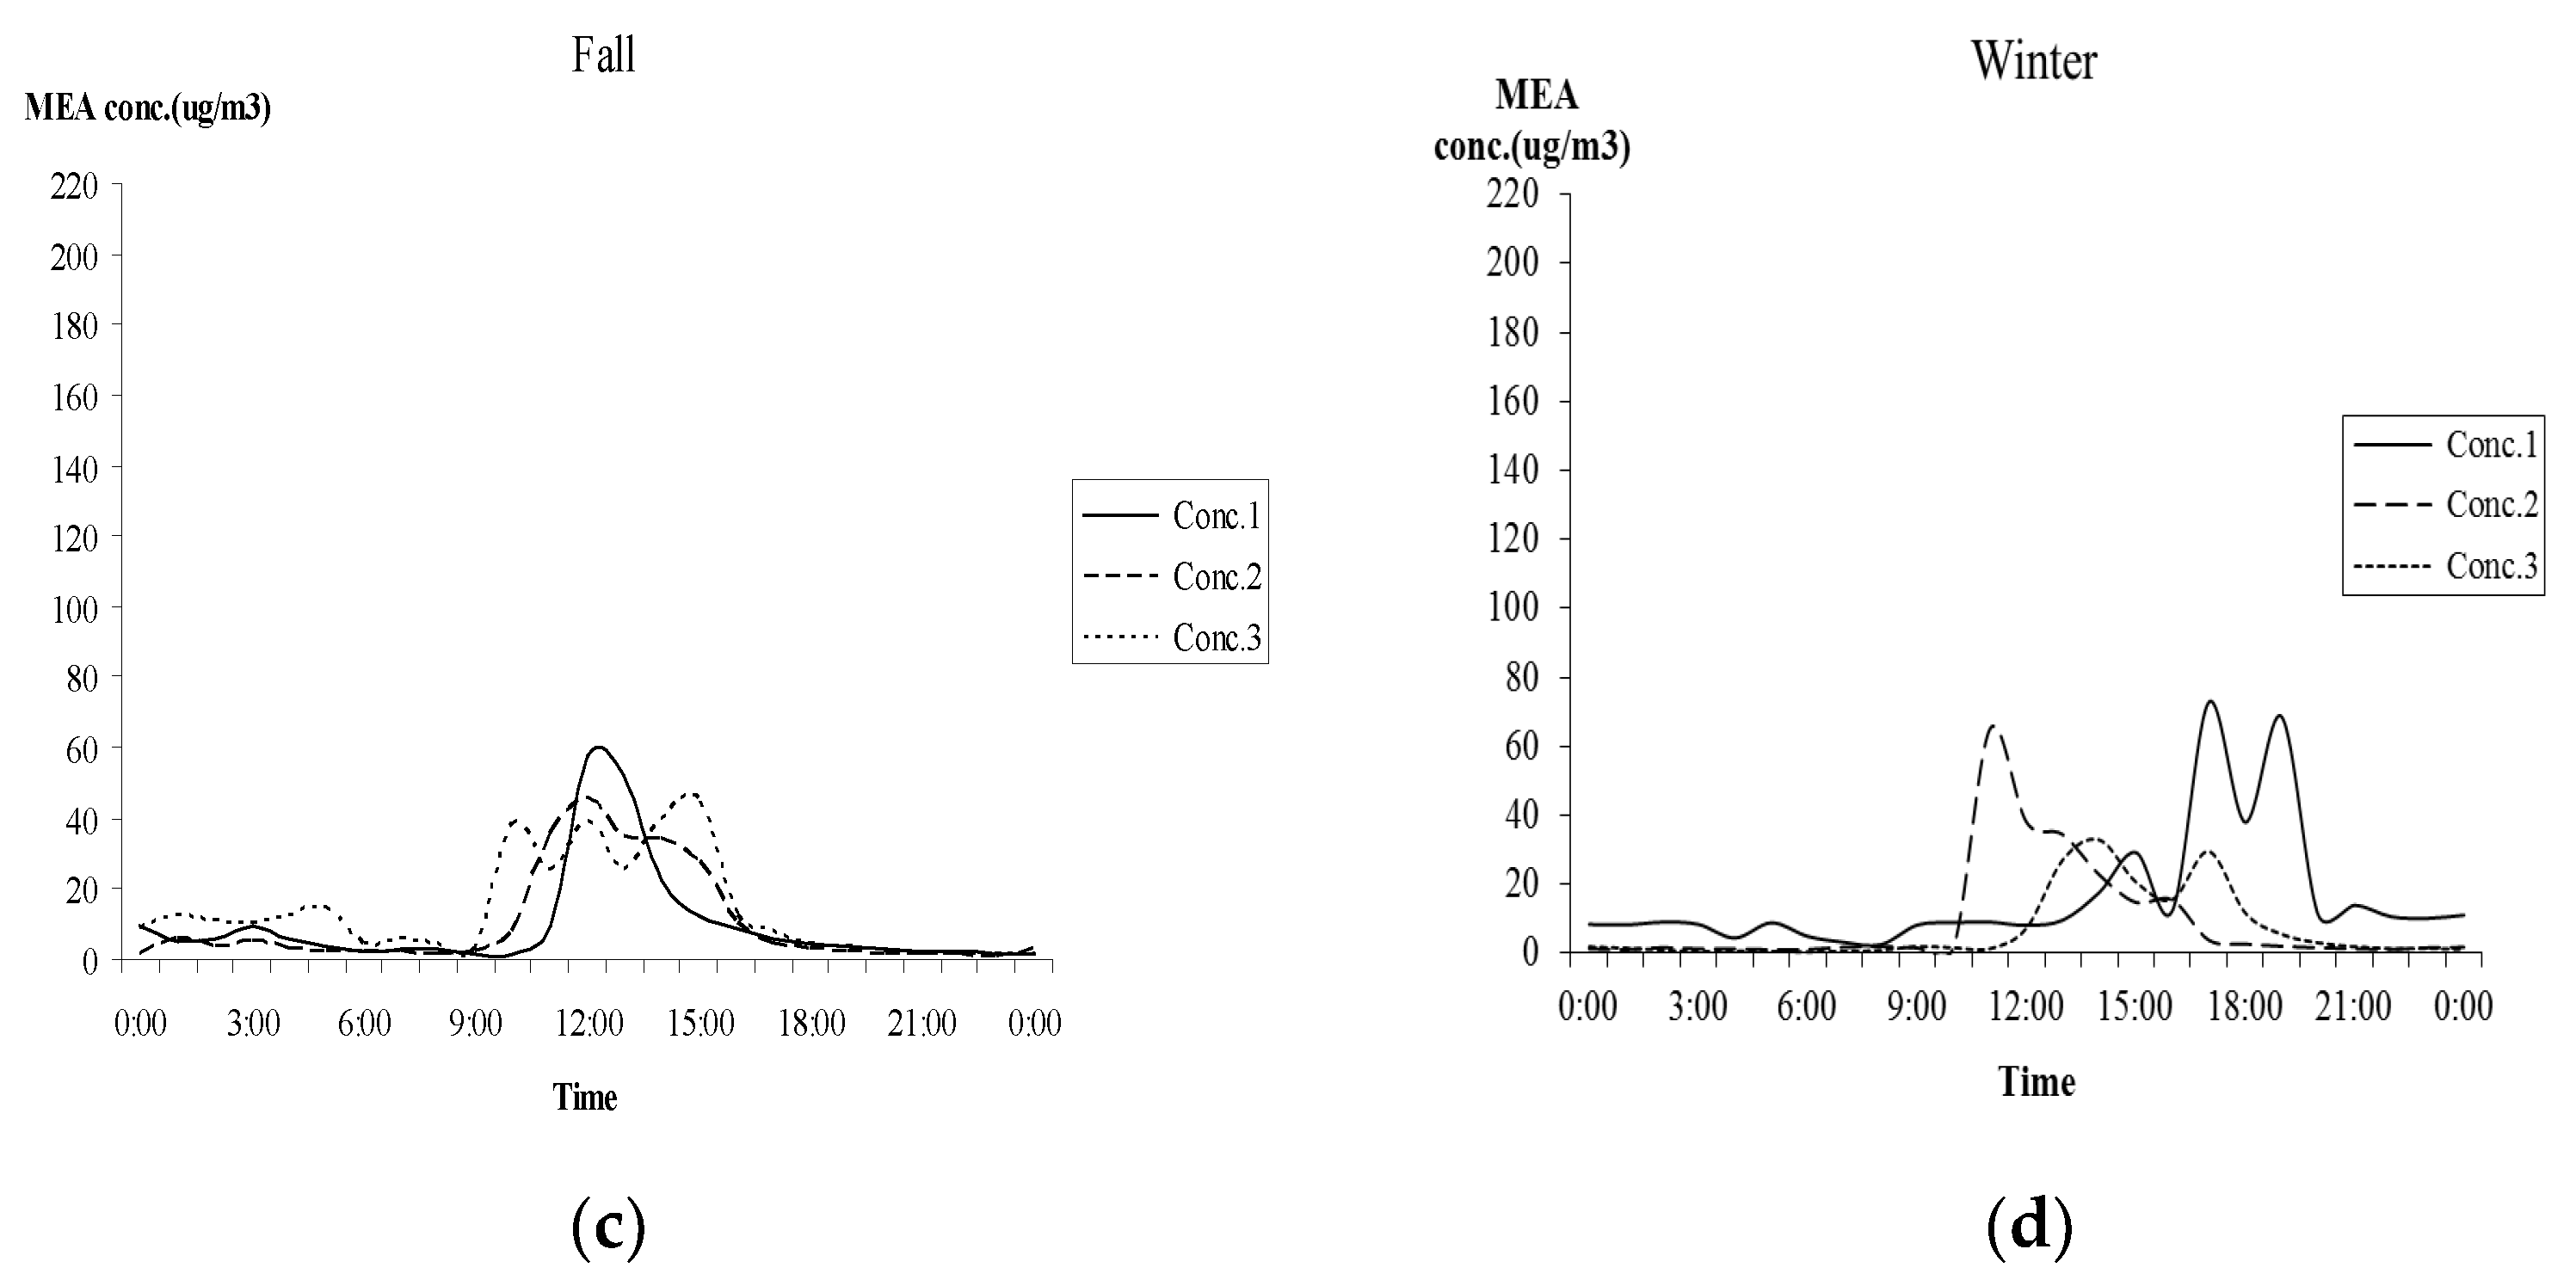
The results show that if the MEA storage tank was damaged, causing the MEA to leak at the rate of 415.251 kg/h, the simulated gaseous MEA concentrations at the ground surface are as follows. In spring, summer, fall, and winter, safe MEA concentrations (less than 10 µg/m3) were found outside the radius of 2.3 km, 14 km, 15 km, and 15 km from the source, respectively, as shown in Figure 6. The directions of spreading in spring, summer, fall, and winter were north and northeast, northwest and south, southeast and west, and east, respectively, as shown in Figure 7. High concentrations were found in the afternoon, as shown in Figure 7.
3.2. Ground-Level Concentrations of Gaseous MEA (with and Without Emission Reduction Technology)
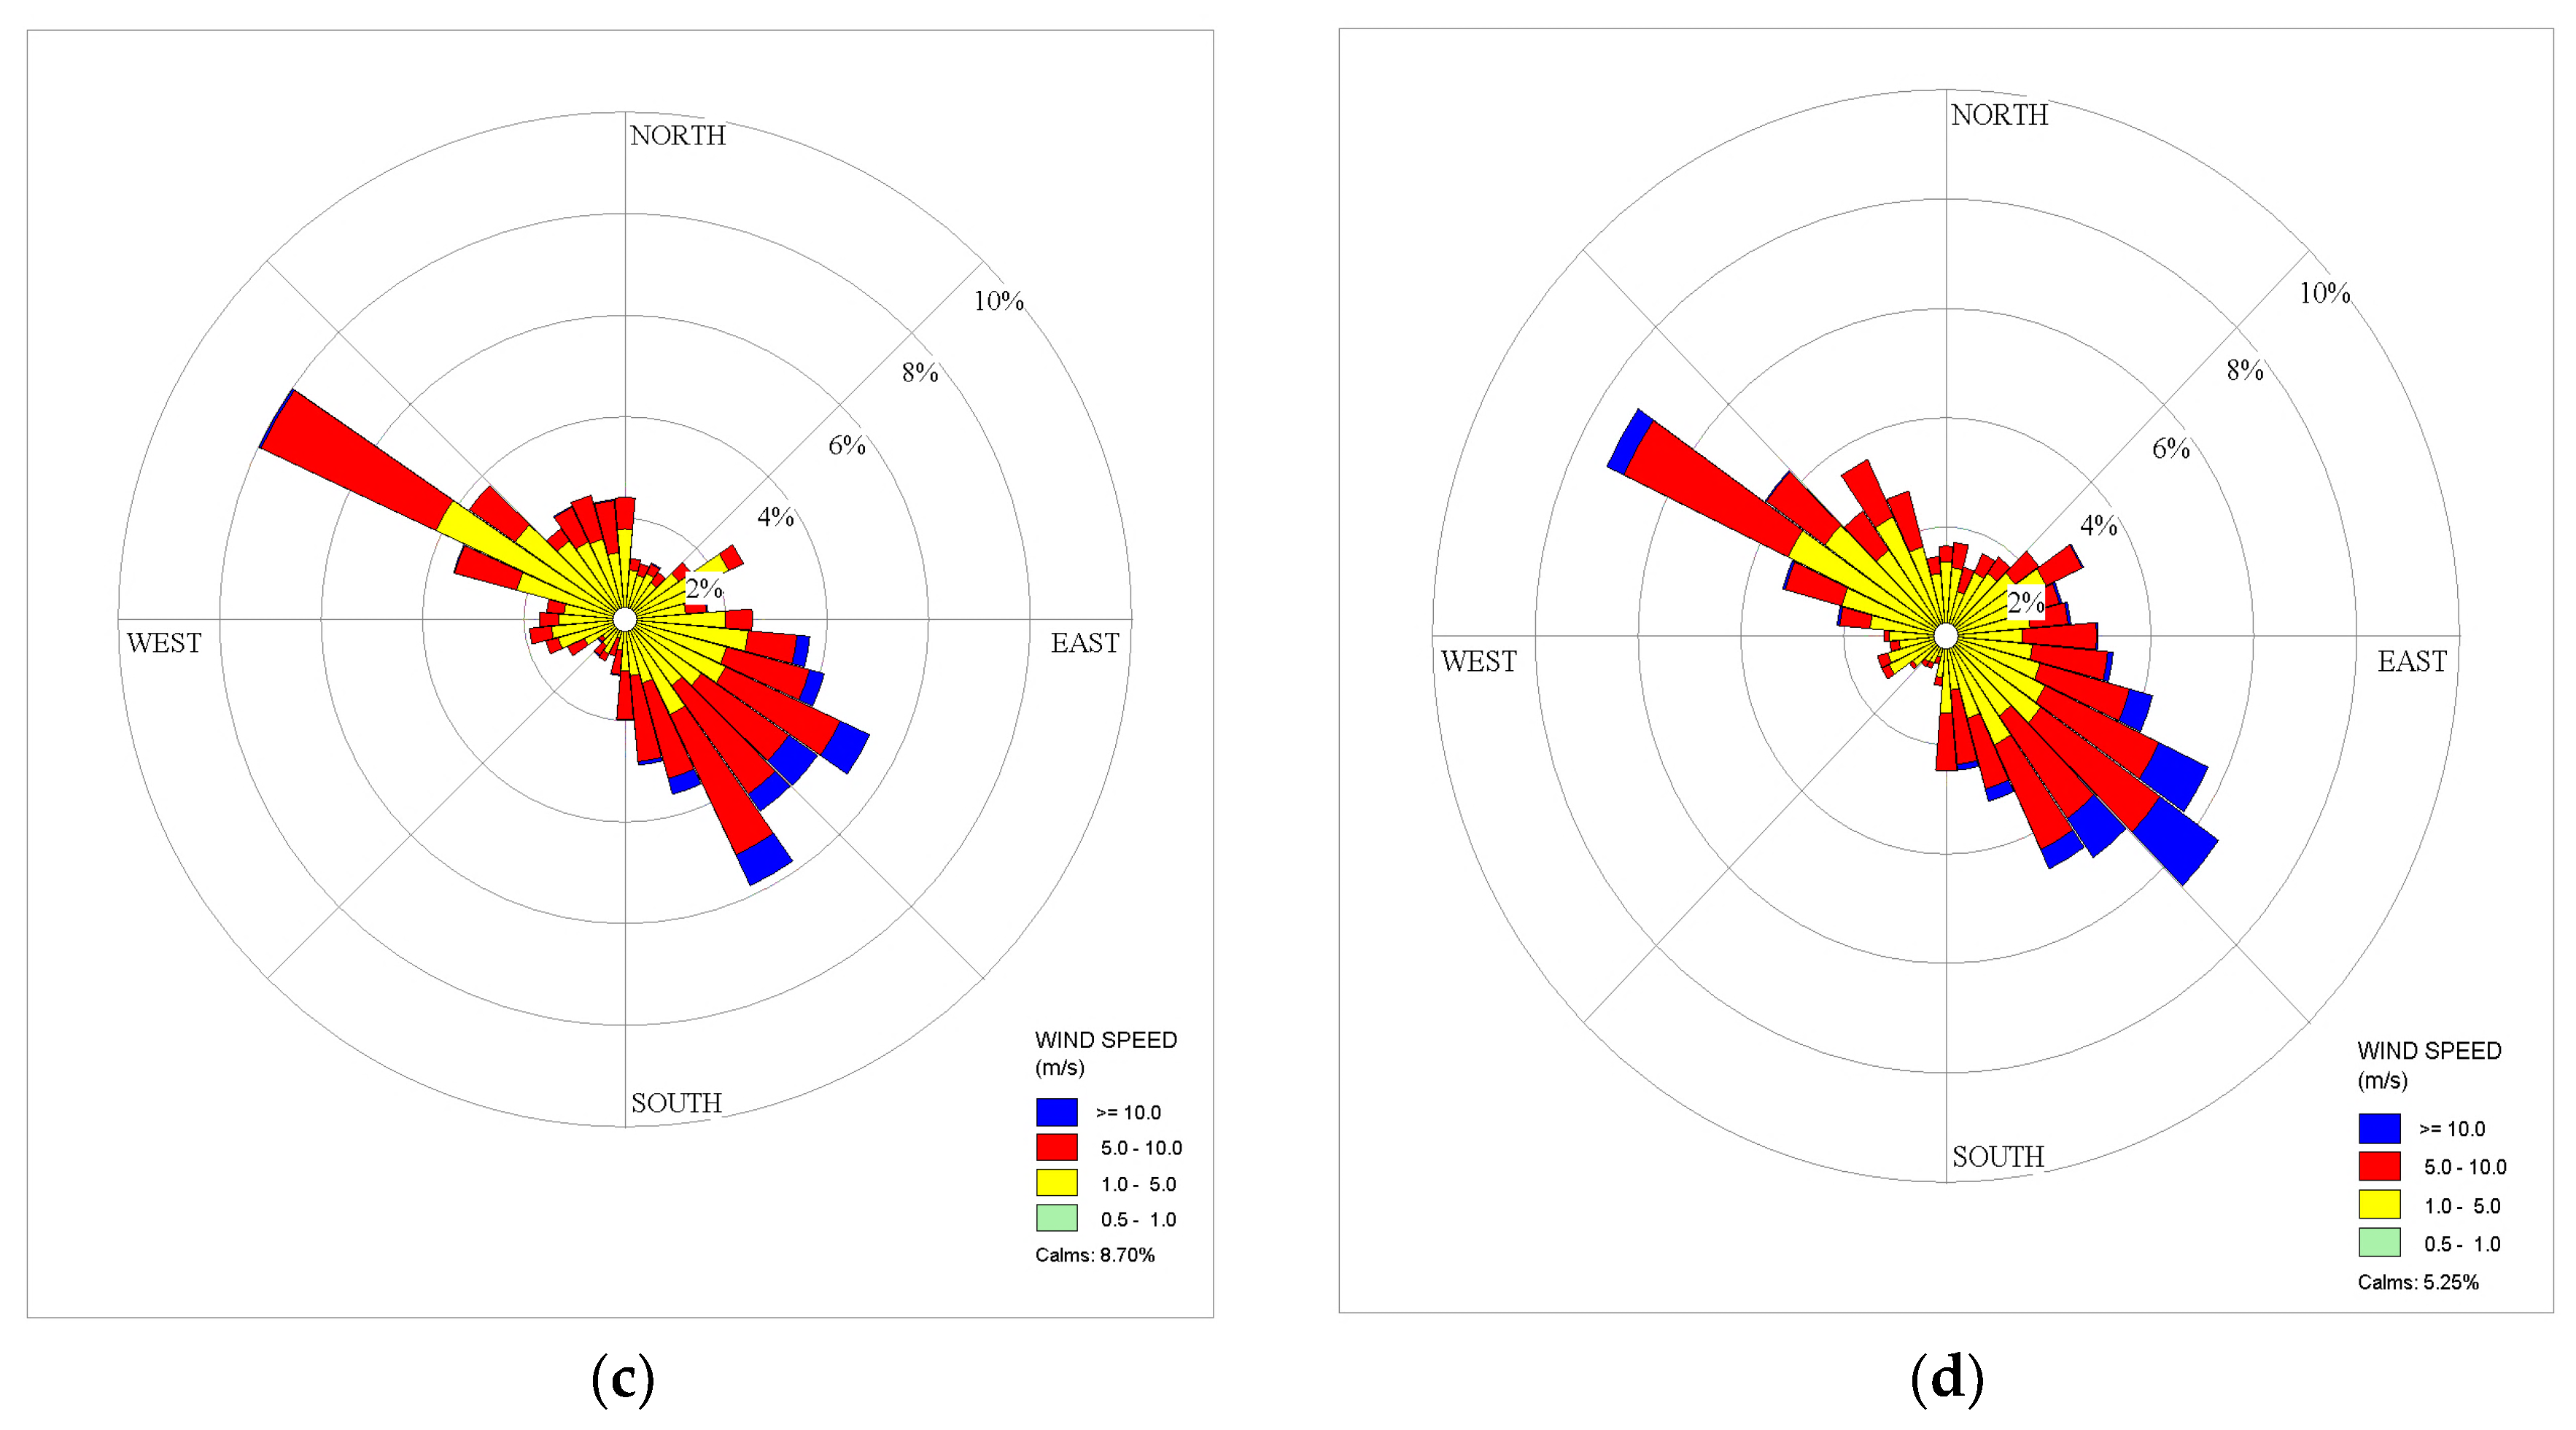
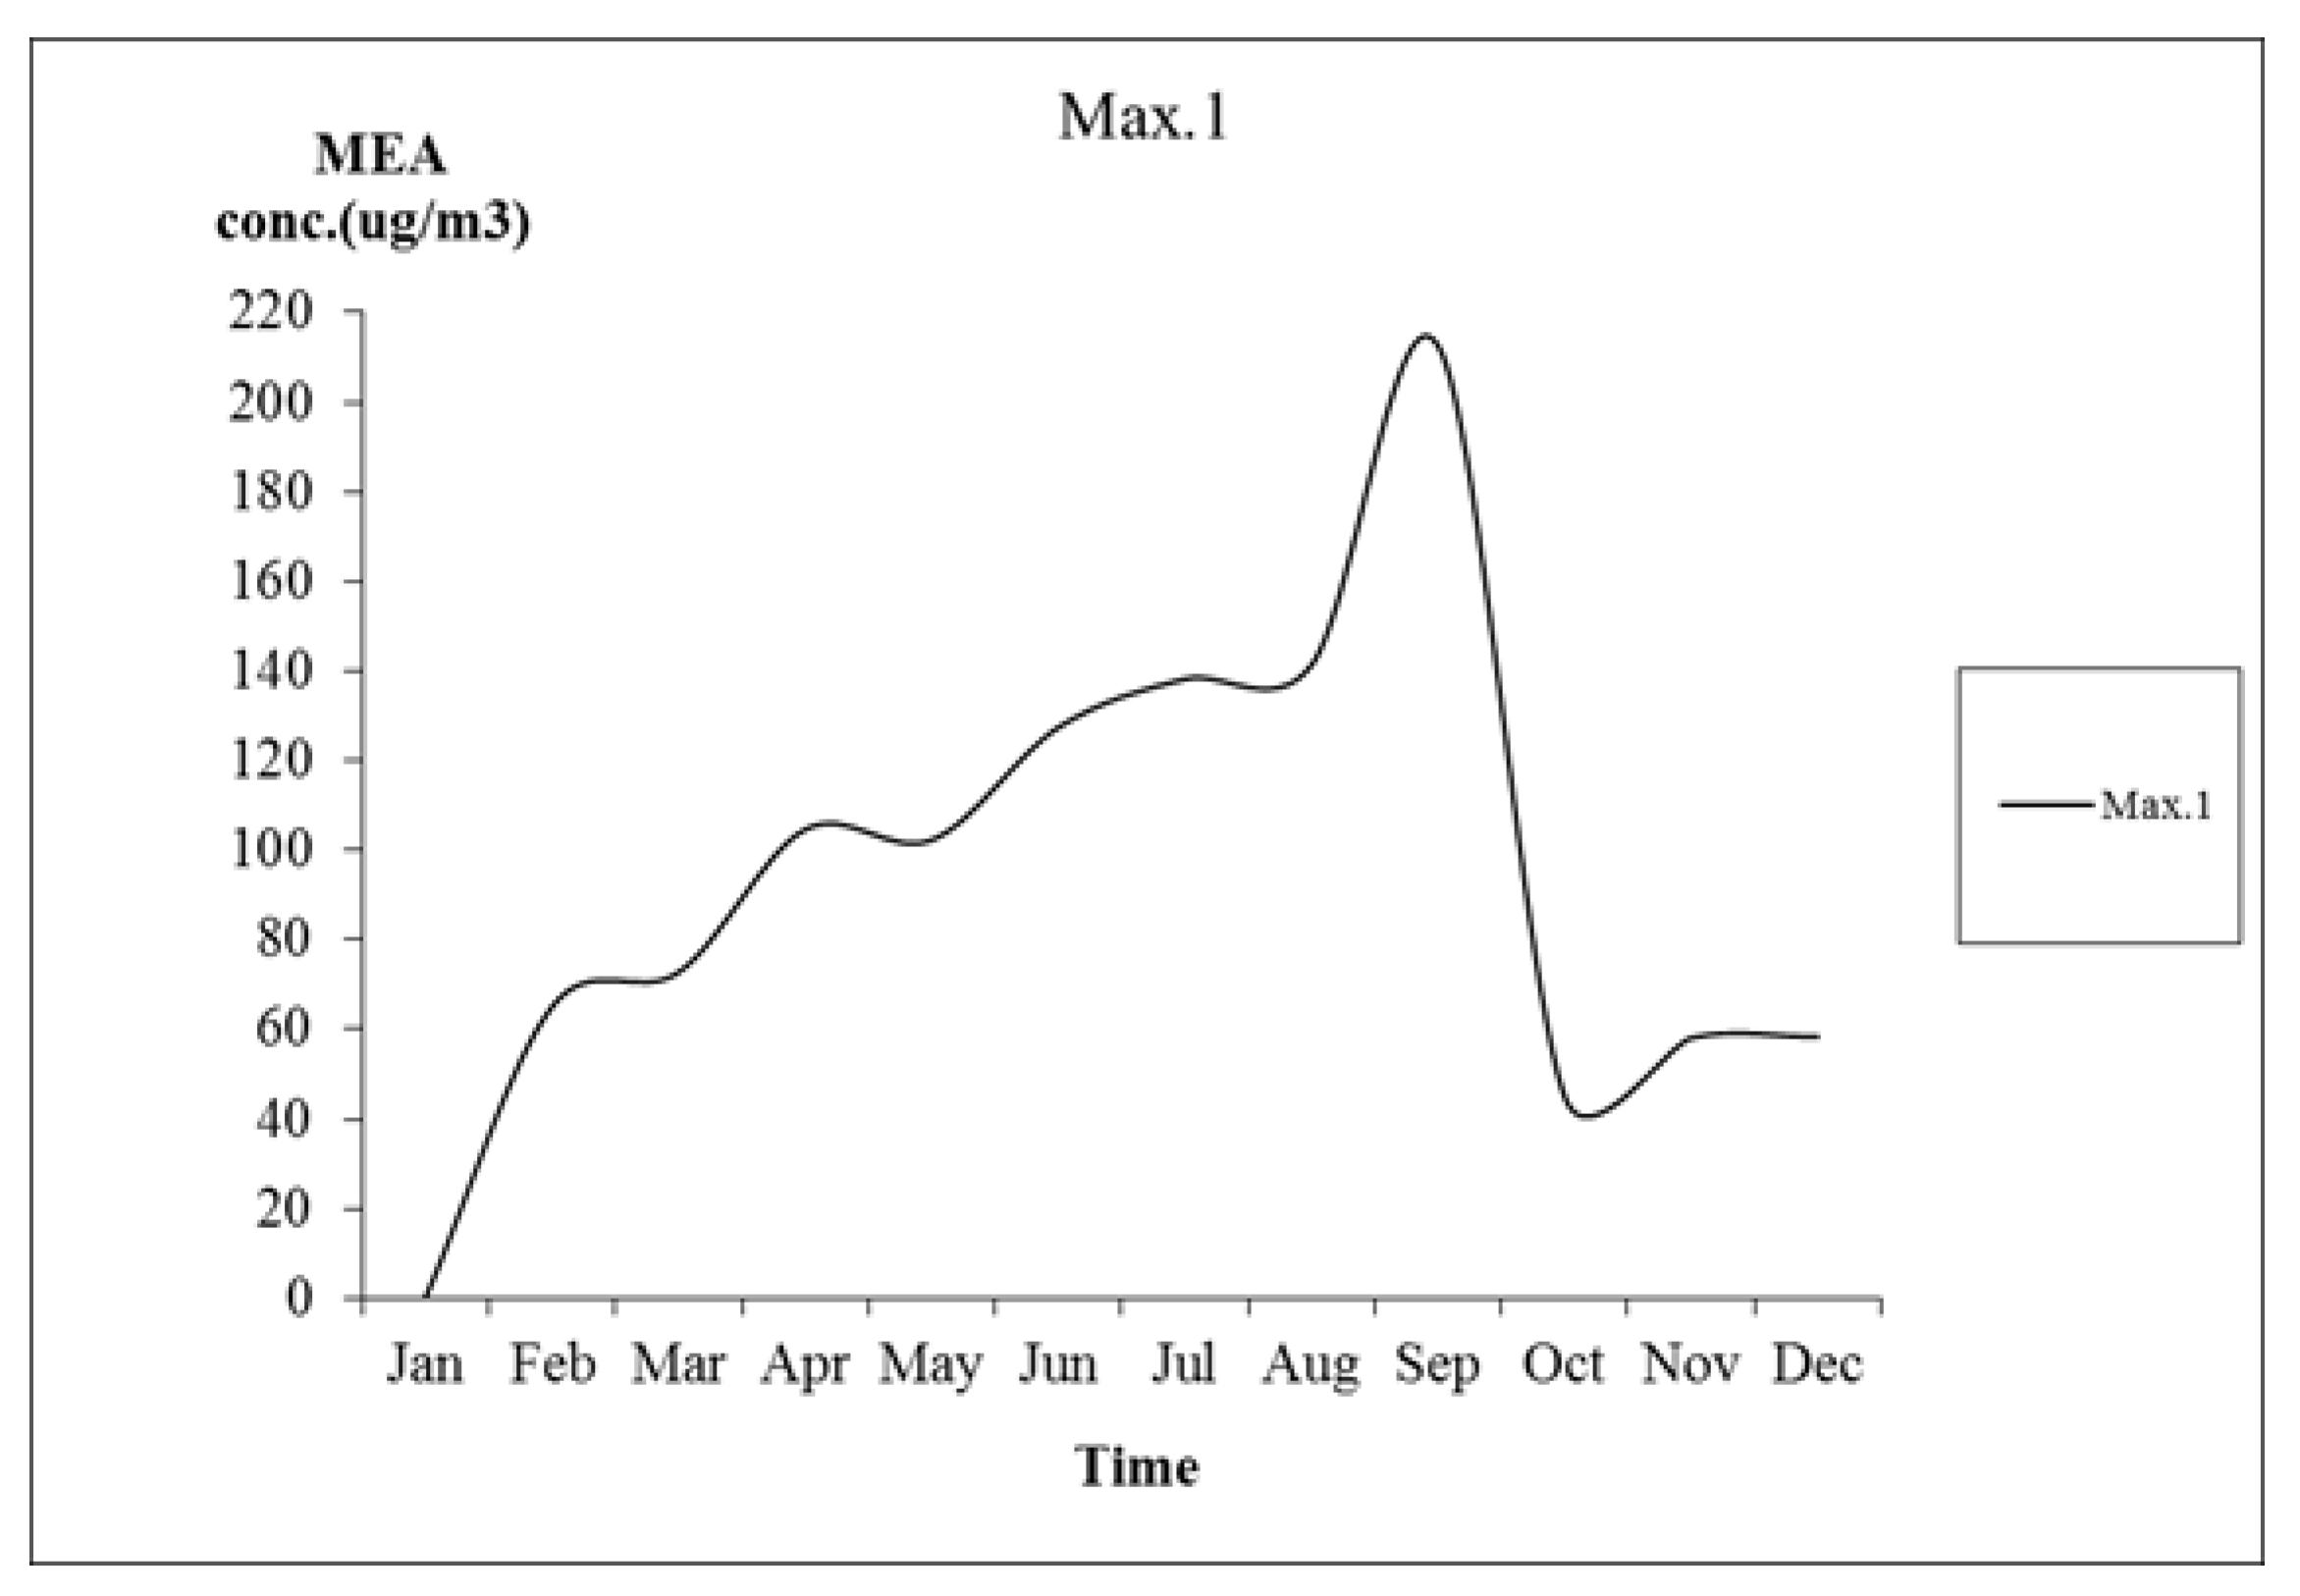
Water wash is a common technology to reduce gaseous MEA concentrations [32,37]. This study presents the simulated MEA concentration, with and without a water wash technology. The water wash can be done by installing a springer system at the MEA storage tank to reduce the spreading of leaking MEA. In case of an accident, if the MEA storage tank is damaged, the springer will release the water to reduce the spreading of the gaseous MEA. In case of no water wash, the results show that the maximum ground MEA concentrations in the surrounding areas were as high as 213 µg/m3, much higher than the safe concentration (10 µg/m3 MEA) [31], as shown in Figure 8.
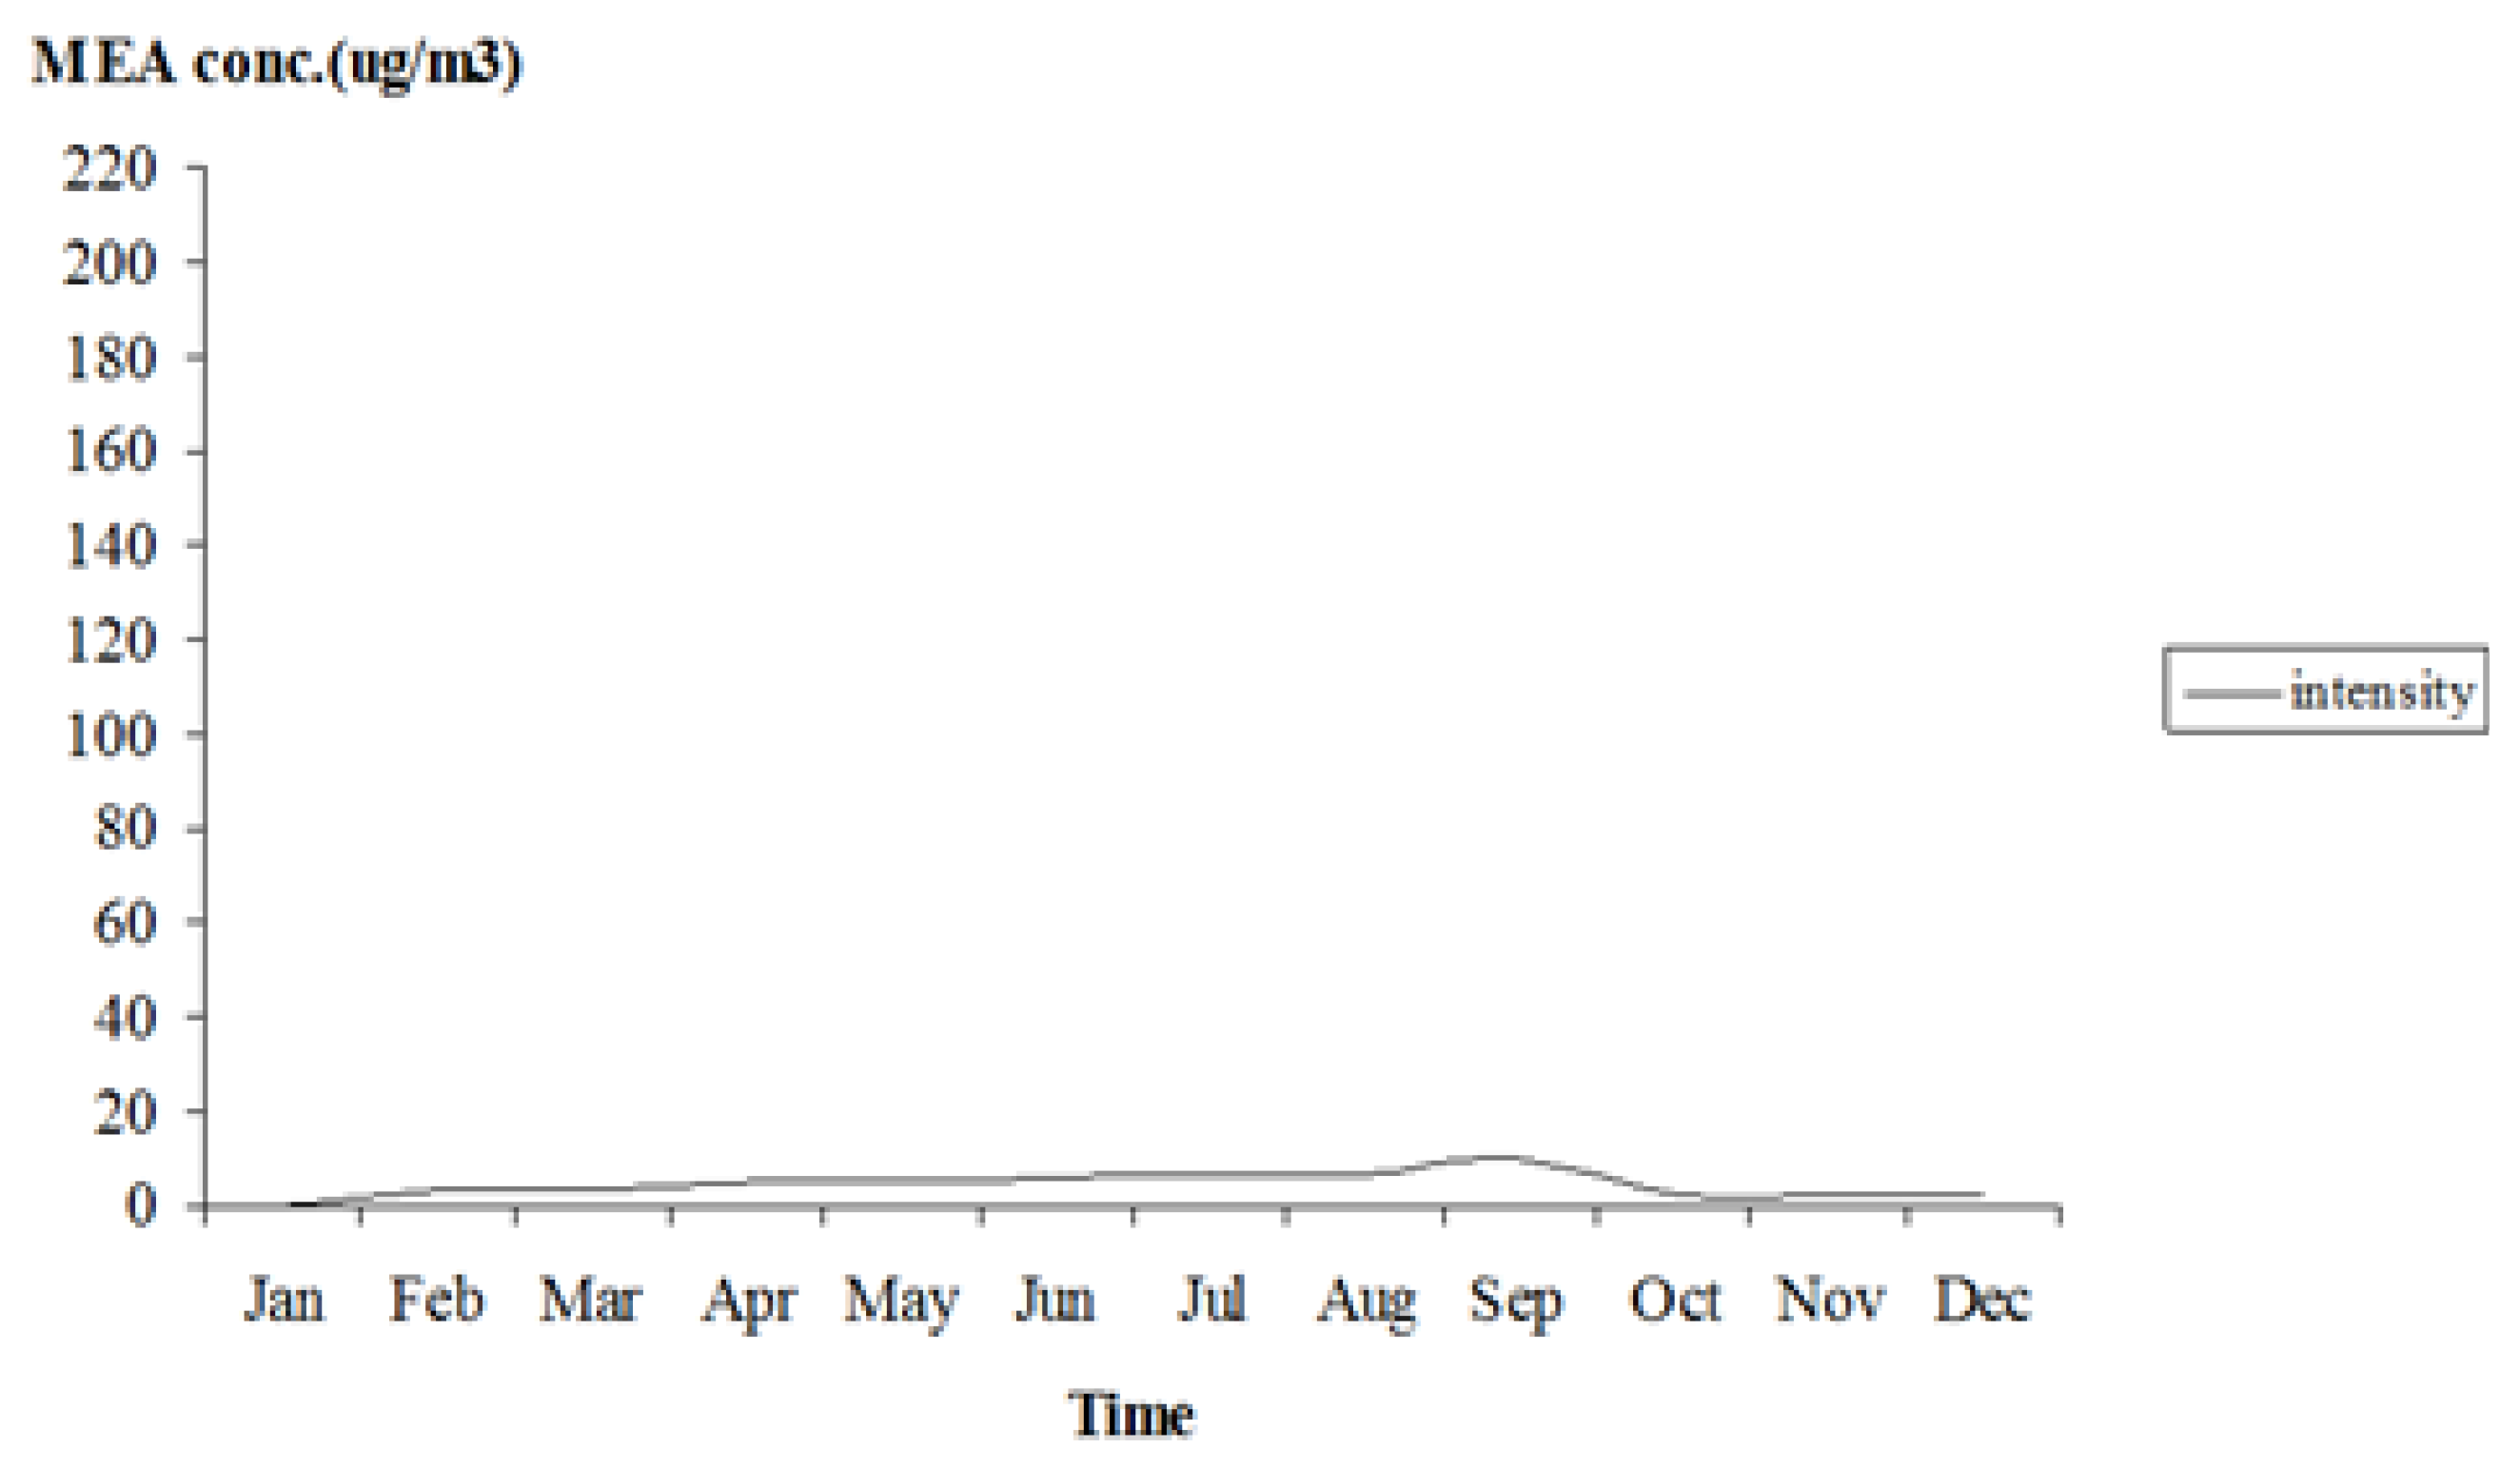
If the water wash system is used, the simulated gaseous MEA concentration is reduced to 10 µg/m3, as shown in Figure 9.
4. Conclusions and Recommendations
Carbon capture by using the amine-based absorption process has been an effective and widely used technology for many decades. However, if there is an accident in the CCS system, amine solvent can be leaked along with gases into the atmosphere. However, if a water wash system is used, the leaking amine concentrations will be well below the standard level. It is essential for CO2 capture plants that are located in highly populated areas to be equipped with water wash units. Presently, societies are focused on reducing CO2 while paying less attention on the disadvantages of CCS, such as the leaking of amine. This study applied the air dispersion model, CALPUFF, to estimate ground surface concentrations of gaseous MEA emitted from the absorption-based carbon capture unit at the coal-fired power plant. The gaseous MEA ground surface concentrations and their distribution over surrounding areas vary with wind direction and wind speed. High deposition of gaseous MEA can be expected in spring and summer, compared to that in fall and winter. The results show that during daytime, the concentrations are higher than those during nighttime. In addition, the higher the surrounding temperature, the higher the concentrations. Without the water wash system, MEA ground surface concentrations are likely to exceed the threshold limit and cause health risk in surrounding communities. It was found that 95% efficiency of the water wash system can reduce gaseous MEA at the source so that the distributed ground surface MEA concentrations were below the threshold value and safe to human health. Therefore, it is recommended that the water wash system should be used in CO2 capture plants located in highly populated areas to reduce the environmental impact and human health risk.
A suitable design of operating temperature of impure CO2 is essential, because amine solvent can catch fire in the process. Amine solvent should be kept at 15–25 °C [22], and amine gas should be kept below its flashpoint (200 °C), to avoid catching fire [22,38]. Amine fire can be generated by an acid mist contaminated with O2, SOx, and NOx (which cause amine degradation). These chemical substances are hazardous to human health. The byproduct, sulfuric acid (H2SO3), is an extremely hazardous substance, which causes stinging, burning, and eye irritation. A deep breath of sulfuric acid vapor, even in small amounts, can cause coughing and a risk of laryngeal cancer depending on the human sensitive group, time, and concentration to which they were exposed [12,38,39]. Another byproduct, nitric Acid (HNO3), is an extremely hazardous gas, which has effects on the lungs caused by inhalation of a wide range of gases. These effects can occur immediately after exposure, but the most severe symptoms are often delayed between 6 to 24 h after gas exposure [25,40,41,42].
Due to the health risk caused by using amine in CO2 capture process, it is recommended for future research to focus on using safer chemical solutions instead of amine and designing more suitable carbon capture processes. Although the water wash process can significantly reduce MEA concentrations, the washed toxic substances must be left in the washing water. Future research on treating this water should be focused on, in order to solve the water pollution problem.
Any air pollution model requires meteorological and geographical data which vary from place to place, therefore, the results from this study may not be able to be used directly in other countries because of the differences in data. In other words, the results are site specific. However, the observation that the higher the ambient temperature, the higher the air pollution concentrations, is likely to be found in most places.
Author Contributions
Conceptualization, A.V. and P.P.; methodology, P.P.; software, P.P.; validation, P.P., A.V. and T.S.; formal analysis, P.P.; investigation, P.P.; resources, P.P., A.A. and A.V.; data curation, P.P and T.S.; writing—original draft preparation, P.P. and A.V.; writing—review and editing, P.P. and A.V.; visualization, P.P.; supervision, P.P.; project administration, A.V.; funding acquisition, A.V. All authors have read and agreed to the published version of the manuscript.
Funding
This research was funded by Natural Sciences and Engineering Research Council of Canada (NSERC) grant number [RGPIN-227585-2013].
Institutional Review Board Statement
Not applicable.
Informed Consent Statement
Not applicable.
Acknowledgments
This work was supported by equipment and manpower from the University of Regina and the Faculty of Engineering Chulalongkorn University for general support.
Conflicts of Interest
The authors declare no conflict of interest.
References
- International Energy Agency (IEA). World Energy Investment 2021. Global Energy Investments Set to Recover in 2021 but Remain far from a Net Zero Pathway. 2021. Available online: https://www.iea.org/news/global-energy-investments-set-to-recover-in-2021-but-remain-far-from-a-net-zero-pathway (accessed on 18 November 2021).
- United Nations. Climate Change Conference (UNFCC), COP26 Negotiations Explained. In Proceedings of the Climate Change Conference, Glasgow, UK, 31 October–12 November 2021; Available online: https://ukcop26.org/wp-content/uploads/2021/11/COP26-Negotiations-Explained.pdf (accessed on 10 November 2021).
- Intergovernmental Panel on Climate Change (IPCC). Climate Change 2014: Synthesis Report. Contribution of Working Groups I, II and III to the Fifth Assessment; IPCC Reports and Publications: Geneva, Switzerland, 2014. [Google Scholar]
- Rogelj, J.; Shindell, D.; Jiang, K.; Fifita, S.; Forster, P.; Ginzburg, V.; Handa, C.; Kheshgi, H.; Kobayashi, S.; Kriegler, E.; et al. Chapter 2: Mitigation Pathways Compatible with 1.5 °C in the Context of Sustainable Development. In Global Warming of 1.5 °C an IPCC Special Report on the Impacts of Global Warming of 1.5 °C above Pre-Industrial Levels and Related Global Greenhouse Gas Emission Pathways, in the Context of Strengthening the Global Response to the Threat of Climate Change; Intergovernmental Panel on Climate Change, IPCC Reports and Publications: Geneva, Switzerland, 2018. [Google Scholar]
- Budinis, S.; Krevor, S.; Mac Dowell, N.; Brandon, N.; Hawkes, A. An assessment of CCS costs, barriers and potential. Energy Strat. Rev. 2018, 22, 61–81. [Google Scholar] [CrossRef]
- United Nations Environment Programme (UNEP). The Emissions Gap Report 2018. An Annual Assessment Tracking Climate Policy Action Over the Past Six Years, Which Provided the Basis for the Analysis Presented in this Perspective; UNEP Publications: Stockholm, Sweden, 2018. [Google Scholar]
- Intergovernmental Panel on Climate Change (IPCC). Special Report. Global Warming of 1.5 °C; Cambridge University Press: Cambridge, UK, 2018. [Google Scholar]
- Khatib, H. IEA World Energy Outlook 2010—A comment. Energy Policy 2011, 39, 2507–2511. [Google Scholar] [CrossRef]
- Schinko, T. Overcoming Political Climate-Change Apathy in the Era of #FridaysForFuture. One Earth 2020, 2, 20–23. [Google Scholar] [CrossRef] [Green Version]
- Abrantes, I.; Ferreira, A.F.; Silva, A.; Costa, M. Sustainable aviation fuels and imminent technologies—CO2 emissions evolution towards 2050. J. Clean. Prod. 2021, 313, 127937. [Google Scholar] [CrossRef]
- Alataş, S. Do environmental technologies help to reduce transport sector CO2 emissions? Evidence from the EU15 countries. Res. Transp. Econ. 2021, 101047. [Google Scholar] [CrossRef]
- Finney, K.N.; Akram, M.; Diego, M.E.; Yang, X.; Pourkashanian, M. Chapter 2—Carbon Capture Technologies. In Bioenergy with Carbon Capture and Storage.1; Magalhães Pires, J.C., Cunha Gonçalves, A.L.D., Eds.; Academic Press: New York, NY, USA, 2019; pp. 15–45. [Google Scholar]
- Jana, K.; De, S. Overview of CCS: A Strategy of Meeting CO2 Emission Targets. In Encyclopedia of Renewable and Sustainable Materials; Hashmi, S., Choudhury, I.A., Eds.; Elsevier: Oxford, UK, 2020; pp. 628–639. [Google Scholar] [CrossRef]
- Osmundsen, P.; Emhjellen, M. CCS from the gas-fired power station at Kårstø? A commercial analysis. Energy Policy 2010, 38, 7818–7826. [Google Scholar] [CrossRef]
- Terwel, B.W.; Harinck, F.; Ellemers, N.; Daamen, D.D. Going beyond the properties of CO2 capture and storage (CCS) technology: How trust in stakeholders affects public acceptance of CCS. Int. J. Greenh. Gas Control 2011, 5, 181–188. [Google Scholar] [CrossRef]
- Rackley, S.A. Chapter 6—Absorption Capture Systems. In Carbon Capture and Storage; Butterworth-Heinemann: Boston, MA, USA, 2010; pp. 3–131. [Google Scholar] [CrossRef]
- Thitakamol, B.; Veawab, A.; Aroonwilas, A. Environmental impacts of absorption-based CO2 capture unit for post-combustion treatment of flue gas from coal-fired power plant. Int. J. Greenh. Gas Control 2007, 1, 318–342. [Google Scholar] [CrossRef]
- Aroonwilas, A.; Veawab, A. Integration of CO2 capture unit using single- and blended-amines into supercritical coal-fired power plants: Implications for emission and energy management. Int. J. Greenh. Gas Control 2020, 1, 143–150. [Google Scholar] [CrossRef]
- Gjernes, E.; Helgesen, L.I.; Maree, Y. Health and environmental impact of amine based post combustion CO2 capture. Energy Proc. 2013, 37, 735–742. [Google Scholar] [CrossRef] [Green Version]
- Karl, M.; Brooks, S.; Wright, S.; Knudsen, S. The Norwegian Institute for Air Research (NILU) Amines Worst Case Studies: Worst Case Studies on Amine Emissions from CO2 Capture Plants; NILU Publications: Kjeller, Norway, 2009. [Google Scholar]
- National Institute for Occupational Safety and Health (NIOSH). NIOSH Pocket Guide to Chemical Hazards: Ethanolamine. In Emergency and Continuous Exposure Limits for Selected Airborne Contaminants: Volume 1; National Academies Press: New York, NY, USA, 1984. [Google Scholar] [CrossRef]
- Shao, R.; Stangeland, A. Amines Used in CO2 Capture—Health and Environmental Impacts; Bellona Publisher: Warsaw, Poland, 2009. [Google Scholar]
- Wilson, M.; Tontiwachwuthikul, P.; Chakma, A.; Idem, R.; Veawab, A.; Aroonwilas, A.; Mariz, C. Test results from a CO2 extraction pilot plant at boundary dam coal-fired power station. Energy 2004, 29, 1259–1267. [Google Scholar] [CrossRef]
- Badr, S.; Frutiger, J.; Hungerbuehler, K.; Papadokonstantakis, S. A framework for the environmental, health and safety hazard assessment for amine-based post combustion CO2 capture. Int. J. Greenh. Gas Control 2017, 56, 202–220. [Google Scholar] [CrossRef]
- Gouedard, C.; Picq, D.; Launay, F.; Carrette, P.-L. Amine degradation in CO2 capture. I. A review. Int. J. Greenh. Gas Control 2012, 10, 244–270. [Google Scholar] [CrossRef]
- Attalla, M. Environmental Impacts of Emissions from Post-combustion CO2 Capture –Regulatory Aspects. Energy Proc. 2010, 4, 2277–2284. [Google Scholar]
- Endo, T.; Kajiya, Y.; Nagayasu, H.; Iijima, M.; Ohishi, T.; Tanaka, H.; Mitchell, R. Current status of MHI CO2 capture plant technology, large scale demonstration project and road map to commercialization for coal fired flue gas application. Energy Proc. 2011, 4, 1513–1519. [Google Scholar] [CrossRef] [Green Version]
- Knudsen, S.; Karl, M.; Randall, S. Summary Report: Amine Emissions to Air during Carbon Capture; Norwegian Institute for Air Research; NILU Publications: Kjeller, Norway, 2009. [Google Scholar]
- Hayes, S.; Moore, G. Air quality model performance: A comparative analysis of 15 model evaluation studies. Atmos. Environ. 1986, 20, 1897–1911. [Google Scholar] [CrossRef]
- Environmental International Corporation (EIC); Fox, T.; United States Environmental Protection Agency (EPA). Documentation of the Evaluation of CALPUFF and Other Long Range Transport Models Using Tracer Field Experiment Data. 2012. Available online: https://www.epa.gov/sites/default/files/2020-10/documents/epa-454_r-12-003_0.pdf (accessed on 1 January 2020).
- Scire, J.S.; Strimaitis, D.G.; Yamartino, B.J. A User’s Guide for the CALPUFF Dispersion Model (Version 5); Earth Tech Inc.: Concord, NH, USA, 2000. [Google Scholar]
- Tartakovsky, D.; Stern, E.; Broday, D.M. Comparison of dry deposition estimates of AERMOD and CALPUFF from area sources in flat terrain. Atmos. Environ. 2016, 142, 430–432. [Google Scholar] [CrossRef]
- Saskatchewan. Saskatchewan Digital Landcover. 2020. Available online: https://geohub.saskatchewan.ca/datasets/a287612147ab4f0a9863148f76170f00/about (accessed on 15 January 2020).
- Soltani, S.M.; Fennell, P.; Mac Dowell, N. A parametric study of CO2 capture from gas-fired power plants using monoethanolamine (MEA). Int. J. Greenh. Gas Control 2017, 63, 321–328. [Google Scholar] [CrossRef] [Green Version]
- International Energy Agency (IEA). Integrated Carbon Capture and Storage Project at Saskpower’s Boundary Dam Power Station, a World’s First in Carbon Capture and Storage; IEA Publications: Indianapolis, IN, USA, 2014. [Google Scholar]
- SaskPower. Clean Coal Project Description. In Saskatchewan Environment Environmental Impact Assessment Process; Saskatchewan Environment Press: Regina, WC, Canada, 2007. [Google Scholar]
- Stec, M.; Tatarczuk, A.; Więcław-Solny, L.; Krótki, A.; Spietz, T.; Wilk, A.; Śpiewak, D. Demonstration of a post-combustion carbon capture pilot plant using amine-based solvents at the Łaziska Power Plant in Poland. Clean Technol. Environ. Policy 2015, 18, 151–160. [Google Scholar] [CrossRef] [Green Version]
- Chanchey, A.; Saiwan, C.; Supap, T.; Idem, R.; Tontiwachwuthikul, P. Off-gas emission in CO2 capture process using aqueous monoethanolamine solution. Energy Proc. 2011, 4, 504–511. [Google Scholar] [CrossRef] [Green Version]
- Yang, J.H.; Koedrith, P.; Kang, D.S.; Kee, N.K.; Jung, J.-H.; Lee, C.M.; Ahn, Y.-S.; Seo, Y.R. A Putative Adverse Outcome Pathway Relevant to Carcinogenicity Induced by Sulfuric Acid in Strong Inorganic Acid Mists. J. Cancer Prev. 2019, 24, 139–145. [Google Scholar] [CrossRef] [PubMed] [Green Version]
- Jayalakshmi, T.K.; Shah, S.; Lobo, I.; Uppe, A.; Mehta, A. Acute lung injury following exposure to nitric acid. Lung India 2009, 26, 149–151. [Google Scholar] [CrossRef] [PubMed]
- Lurati, A. Occupational-Related Chemical Injuries. Work. Heal. Saf. 2015, 63, 284–287. [Google Scholar] [CrossRef] [PubMed]
- Murphy, C.M.; Akbarnia, H.; Rose, S.R. Fatal Pulmonary Edema After Acute Occupational Exposure to Nitric Acid. J. Emerg. Med. 2010, 39, 39–43. [Google Scholar] [CrossRef]
Figure 1.
A simplified process flow diagram of the absorption-based carbon capture process.

Figure 2.
Flow chart explaining the concept of this study.

Figure 3.
Study area.

Figure 4.
Land use map.

Figure 5.
The highest wind direction and wind speed in each season: (a) spring, (b) summer, (c) fall, and (d) winter.
Figure 5.
The highest wind direction and wind speed in each season: (a) spring, (b) summer, (c) fall, and (d) winter.


Figure 6.
Concentration distributions of MEA for (a) spring, (b) summer, (c) fall, and (d) winter.


Figure 7.
Variation of ground MEA concentrations with time of the day (a) spring, (b) summer, (c) fall, and (d) winter.
Figure 7.
Variation of ground MEA concentrations with time of the day (a) spring, (b) summer, (c) fall, and (d) winter.


Figure 8.
The seasonal variation of MEA concentration without water wash.

Figure 9.
Ground concentrations of MEA when 95% water-wash is applied to the carbon capture unit.


Table 1.
Effects of amines on human and animal health risks.
| Effects | Exposure Level |
|---|---|
| Irritation to human eyes, skin, and respiratory system | Low concentrations |
| Human lung irritation | High concentrations |
| Human marked erythema | 10 µg/m3 for 1.5 h |
| Alterations in animal kidney and liver weight | 640 mg/kg |
| Animal—microscopic pathological changes in liver and kidneys | 1200 mg/kg |
| Death of four out of six guinea pigs | 233 ppm/h |
| Animal respiratory distress, lethargy, and mild degenerative changes in the liver and kidneys | 100 ppm |
| Animal skin irritation, lethargy, and temporary weight loss | 12 ppm |
| Latitude 49° 05′46″N | Longitude 103° 01′51″W |
|---|---|
| Stack base elevation above MSL (m) | 565.06 |
| Stack height (m) | 148 |
| Stack diameter (m) | 2 |
| Exit velocity (m/s) | 30 |
| Exit temperature (K) | 313 |
| Emission rate (kg/day) | 9966 |
| Based on advance MEA plant | 57,000 |
| (Btu/lb mole CO2) | |
| CO2 captured (Btu/lb mole CO2) | 14,237.18 |
| (90% of CO2 in flue gas) | |
| Max. MEA emission (no water wash) | 0.7 |
| (kg/tonne CO2 capture) |
Table 3.
Meteorological input data required by the CALPUFF [31].
Table 3.
Meteorological input data required by the CALPUFF [31].
| Meteorological Data | Geophysical Data | Upper Air Data |
|---|---|---|
| (Hourly Observation) | (Twice-Daily Observed Vertical Profile) | |
| Wind Speed | Terrain elevations | Wind Speed |
| Wind direction | Land use categories | Wind direction |
| Temperature | Albedo | Temperature |
| Cloud cover | Bowen ratio | Pressure |
| Ceiling height | Soil heat flux | Elevation |
| Surface pressure | Anthropogenic heat flux | |
| Relative humidity | Vegetative leaf area index | |
| Precipitation rates | ||
| Precipitation type code |
| Input Parameters | Description | Value |
|---|---|---|
| One point source | Stack | 1 |
| Base elevation (MSL) | Point source parameter | 553.03 m |
| Stack height | Point source parameter | 148 m |
| Stack diameter | Additional parameter | 2 m |
| Exit velocity | Additional parameter | 30 and 42 m/s |
| Exit temperature | Additional parameter | 313.15 K and 433.15 K |
| Momentum flux facture | Additional parameter | 1 |
| Emission rate | Species MEA | 415.251 kg/h |
| MEA | Species and deposition | 0.107 cm2/s |
| ||
| Pollutant diffusivity | 1 |
| Aqueousphase dissociation constant, α * | 8 |
| Pollutant reactivity | 0.01 s/cm |
| (Henry’s Law coefficient at 25 °C) | The mesophyll resistance depends on the solubility and reactivity of the pollutant, H (dimensionless) | 0.000000322 atm m3/mol |
α * is the aqueous phase dissociation constant.
Publisher’s Note: MDPI stays neutral with regard to jurisdictional claims in published maps and institutional affiliations. |
© 2022 by the authors. Licensee MDPI, Basel, Switzerland. This article is an open access article distributed under the terms and conditions of the Creative Commons Attribution (CC BY) license (https://creativecommons.org/licenses/by/4.0/).
Share and Cite
MDPI and ACS Style
Pakchotanon, P.; Veawab, A.; Aroonwilas, A.; Sema, T. Atmospheric Dispersion of Gaseous Amine Emitted from Absorption-Based Carbon Capture Plants in Saskatchewan, Canada. Energies 2022, 15, 1221. https://doi.org/10.3390/en15031221
AMA Style
Pakchotanon P, Veawab A, Aroonwilas A, Sema T. Atmospheric Dispersion of Gaseous Amine Emitted from Absorption-Based Carbon Capture Plants in Saskatchewan, Canada. Energies. 2022; 15(3):1221. https://doi.org/10.3390/en15031221
Chicago/Turabian StylePakchotanon, Pet, Amornvadee Veawab, Adisorn Aroonwilas, and Teerawat Sema. 2022. "Atmospheric Dispersion of Gaseous Amine Emitted from Absorption-Based Carbon Capture Plants in Saskatchewan, Canada" Energies 15, no. 3: 1221. https://doi.org/10.3390/en15031221
Note that from the first issue of 2016, this journal uses article numbers instead of page numbers. See further details here.