
Investigation of Biomass Integrated Air Gasification Regenerative Gas Turbine Power Plants
by
 , and
, and
Momin Elhadi Abdalla
1, 
Salah Ahmed Abdalla
2,
Syed Ali Ammar Taqvi
3 ,
,
Salman Raza Naqvi
4 and
Wei-Hsin Chen
5,6,7,*
1
Chemical Engineering Department, University of Khartoum, Khartoum 11111, Sudan
2
Energy Research Centre, University of Khartoum, Khartoum 11115, Sudan
3
Department of Chemical Engineering, NED University of Engineering & Technology, Karachi 75270, Pakistan
4
School of Chemical & Materials Engineering, National University of Sciences & Technology, Islamabad 44000, Pakistan
5
Department of Aeronautics and Astronautics, National Cheng Kung University, Tainan 701, Taiwan
6
Research Center for Smart Sustainable Circular Economy, Tunghai University, Taichung 407, Taiwan
7
Department of Mechanical Engineering, National Chin-Yi University of Technology, Taichung 411, Taiwan
*
Author to whom correspondence should be addressed.
Energies 2022, 15(3), 741; https://doi.org/10.3390/en15030741
Submission received: 9 December 2021
/
Revised: 9 January 2022
/
Accepted: 13 January 2022
/
Published: 20 January 2022
(This article belongs to the Topic Sustainable Energy Technology)
Abstract
:The results show that Wood Chips of Acacia Nilotica trees available in Sudan lands can be successfully used in the gasification process and, on the same basis, as a bio-renewable energy resource. Simulation models were used to characterize the air gasification process integrated with a Regenerative Gas Turbine Unit. The results revealed that at a moisture content of 12%, gasification temperature of 1500 K, pressure of 20 bar, and air-like gasification medium, the biomass gasifier’s flow rate is higher at higher syngas rates. The results verified that there is an optimum ER for each syngas rate, in which the slow growth of the ER revealed the maximum gasifier biomass flow rate. For ER growth at lower levels, the specific fuel consumption (SFC) of the RGT Unit declines sharply from the maximum value reached at 0.27 kg/kW·h at an ER of 5% to the minimum value reached at 0.80 kg/kW·h at an ER of 25% for the lowest gasification temperature of 1000 K. Moreover, ER growths at low levels have a significant effect on the RGT plant’s performance, leading to increased RGT thermal efficiency. The increase in the biomass moisture content led to a sharp decrease in the RGT thermal efficiency. The RGT thermal efficiency remains high at higher gasification pressure. The results revealed that the syngas lower heating value remains high at lower produced syngas rates. At the optimum ER, the H2 mole fraction depicted a value of 1.25%, 0.85% of CO, and 10.50% of CH4 for a lower heating value of 38 MJ/kg syngas. It is shown that the gasification air entered into the gasifier decreases amid the increase in the biomass moisture content. At different syngas rates (3–10 kg/s) and optimum ER, the results predicted that the Wood Chip biomass flow rates decrease when the gasifier efficiency increases. The simulation model revealed that ER growths at lower levels have a significant effect on increasing the power of the RGT plant.
1. Introduction
Agriculture is considered the driver force of income and livelihood in Sudan. This sector occupies between 60% and 80% of the population and is regarded as the engine for raising other economic zone, such as trade, industry, and transport [1,2].
In Sudan, biomass is a vital renewable energy source because the carbon in biomass is observed as part of the biological carbon cycle widely produced on the land [3]. Biomass is a biological substance that consists of forest, agricultural, and paper waste [4,5] and various organic materials [6]. Because of the absence of a power supply in the rustic population, the rural population principally relies on biomass as a wellspring of energy [1]. Just around 10% of the whole population uses fossil fuels, primarily in urban areas. Biomass powers such as wood, cow waste, and agriculture garbage are primarily gathered from the local regime and have turned into an exchanged ware as cooking fuel. Biomass (such as wood, agricultural residue, and municipal waste) [7,8,9,10], with its sustainability and overall accessibility, is relied upon by numerous individuals to assume a key part in future energy scenarios.
The gasification process is usually accomplished in three steps [11]. Firstly, the gasification of biomass particles [12,13] happens through the drying step, which is pursued by the second process of the pyrolytic reactions [14,15], in a minimum oxygen environment, which results in a DE volatilization and declining of the biomass particle [16]. The end process is the formation of tar and char. The pyrolysis step occurs progressively from the surface and moves towards the center of the biomass particles [11]. During the gasification reactions, only a limited amount of air will be supplied to the gasifier to avoid any occurrence of the combustion reactions. The air provided should not be exactly the measure of air utilized for complete oxidation of the biomass. Through this process, the biomass will be converted into valuable products, such as a combustible mixture of gases known as syngas, producer gas, or wood gas [17,18,19,20]. This producer gas is also known as synthetic gas, which is composed of carbon monoxide (CO), methane (CH4), along with carbon dioxide (CO2), hydrogen (H2), and nitrogen (N2) [17,21]. Nitrogen is not an inflammable gas; thus, it is not preferred as a component in the producer gas, as it dilutes the syngas and has no energy value. The proportion of the thick biomass stage to the total reactor volume is an important factor in classifying the biomass gasifiers. According to this procedure, the gasifier can be categorized into (a) thick-phase gasifiers and (b) lean-phase gasifiers. In the lean-phase gasifier, such as the fluidized bed, the volume occupied by the biomass is very limited to about 0.05–0.20 m3. Most of the gasifiers used for heavy-duty utilization, particularly in the progressing countries, are the dense-phase reactors, such as the fixed bed reactors, with a dense factor of 0.30–0.08 m3. Other factors that affect the choice gasifier are the fuel, reactor size, ash content, and moisture. The fixed bed gasifiers have reasonably limited scope power age units and industrial heating applications [22].
There are four types of biomass gasifiers: co-current or downdraft gasifiers, counter or updraft current gasifiers, fluidized bed gasifiers, and cross-draft gasifiers. Furthermore, the gasification technique is chosen based on the accessible fuel value, capacity range, and producer gas quality [23,24,25,26,27]. Downdraft gasifiers have a thermal capacity range of 1 kW to 1 MW, whereas updraft gasifiers have a thermal capacity range of 1.1 MW to 12 MW, fluidized-bed gasifiers have a thermal capacity range of 1100 KW to 50,000 KW, and cross-draft gasifiers have a thermal capacity range of 10,000 KW to 200,000 KW [28]. A review [11,29] demonstrated that 2.5% were updraft type, 75% of the designs were downdraft type, 20% were fluidized bed systems, and 2.5% were of different other designs according to the gasifiers’ manufacturers in Canada, the United States, and Europe [29].
Due to the low initial cost and the stability of the electrical supply under different circumstances, the use of Gas Turbine Units in electricity generation has gained more opportunities. Another outstanding feature [30] of this equipment is its capability of quick starting using a wide variety of fuels [31], from natural gas, syngas to residual oil or powdered coal [32,33,34,35,36]. In addition, the availability of better materials for construction and the use of adequate blade cooling systems [37,38] to counter the inlet gas temperature, which can often exceed 1200 °C [39], have improved the use of GT power supply units. As a result, the overall thermal efficiency of a GT plant can be about 35%, which is almost the same as that of a conventional steam power plant [35]. It is also becoming more common in land vehicles, such as buses and trucks, trains, and ships. The GT is frequently used to power auxiliaries, such as pumps, blowers, and compressors, in the oil and gas industry [35,40]. Researchers have conducted research and utilized different methods [41] to raise the thermal efficiency of reformative GT cycles [35,42]. One of which is the reheating process used to raise the thermal efficiency of gas and steam turbine cycles. Similarly, regeneration improves both the simple GT and the steam turbine cycles’ thermal efficiency. The combined cycle [43,44], which combines a gas turbine and a steam turbine cycle, is a more-essential procedure for increasing the thermal efficiency of the power plant cycle [35,45,46].
This work aims to reinforce the understanding of a regenerative RGT as a thermal process utilizing the integration of the Biomass Gasification Unit at the combustor and applying similar design parameters to Khartoum North Station (GT,187 MW) in Sudan. The study pushes for establishing a qualified operational and conceptual design procedure and reviews for the Integrated Biomass Gasification for Regenerative Gas Turbine Unit “IBGRGT”. The work also presents a preliminary strategy to identify the performance and evaluation criterion of the Gasification of Biomass Process utilizing the effect of various operating conditions.
2. Materials and Methods
Acacia Nilotica Wood Chips, available in Sudan with an average size of 1 × 2 × 3 cm, were used as a feedstock and experimentally characterized according to the standard literature data [47,48,49,50,51]. The wood chip samples were processed for proximate analysis to identify the moisture content, ash content, volatile, and fixed carbon using the ASTM Standards mentioned in our previously published studies [19,21,26]. To identify the carbon, hydrogen, nitrogen, and oxygen content, ultimate analysis was performed using a Perkin Elemental Analyzer. The data from both analyses are shown in Table 1. As per the proximate analysis, the sample showed higher moisture content and volatiles with low ash content. The sample showed higher carbon and oxygen content. To reveal the heating value of the sample, bomb calorimetry was used. The results include the measured higher heating value of the Nilotica Biomass, which was a value of 19,094.94 kJ/kg, via a Calorimeter setup. Air was used as a gasification agent. The gasification system considered in this study is the cross-draft gasifier.
3. Modeling of Components
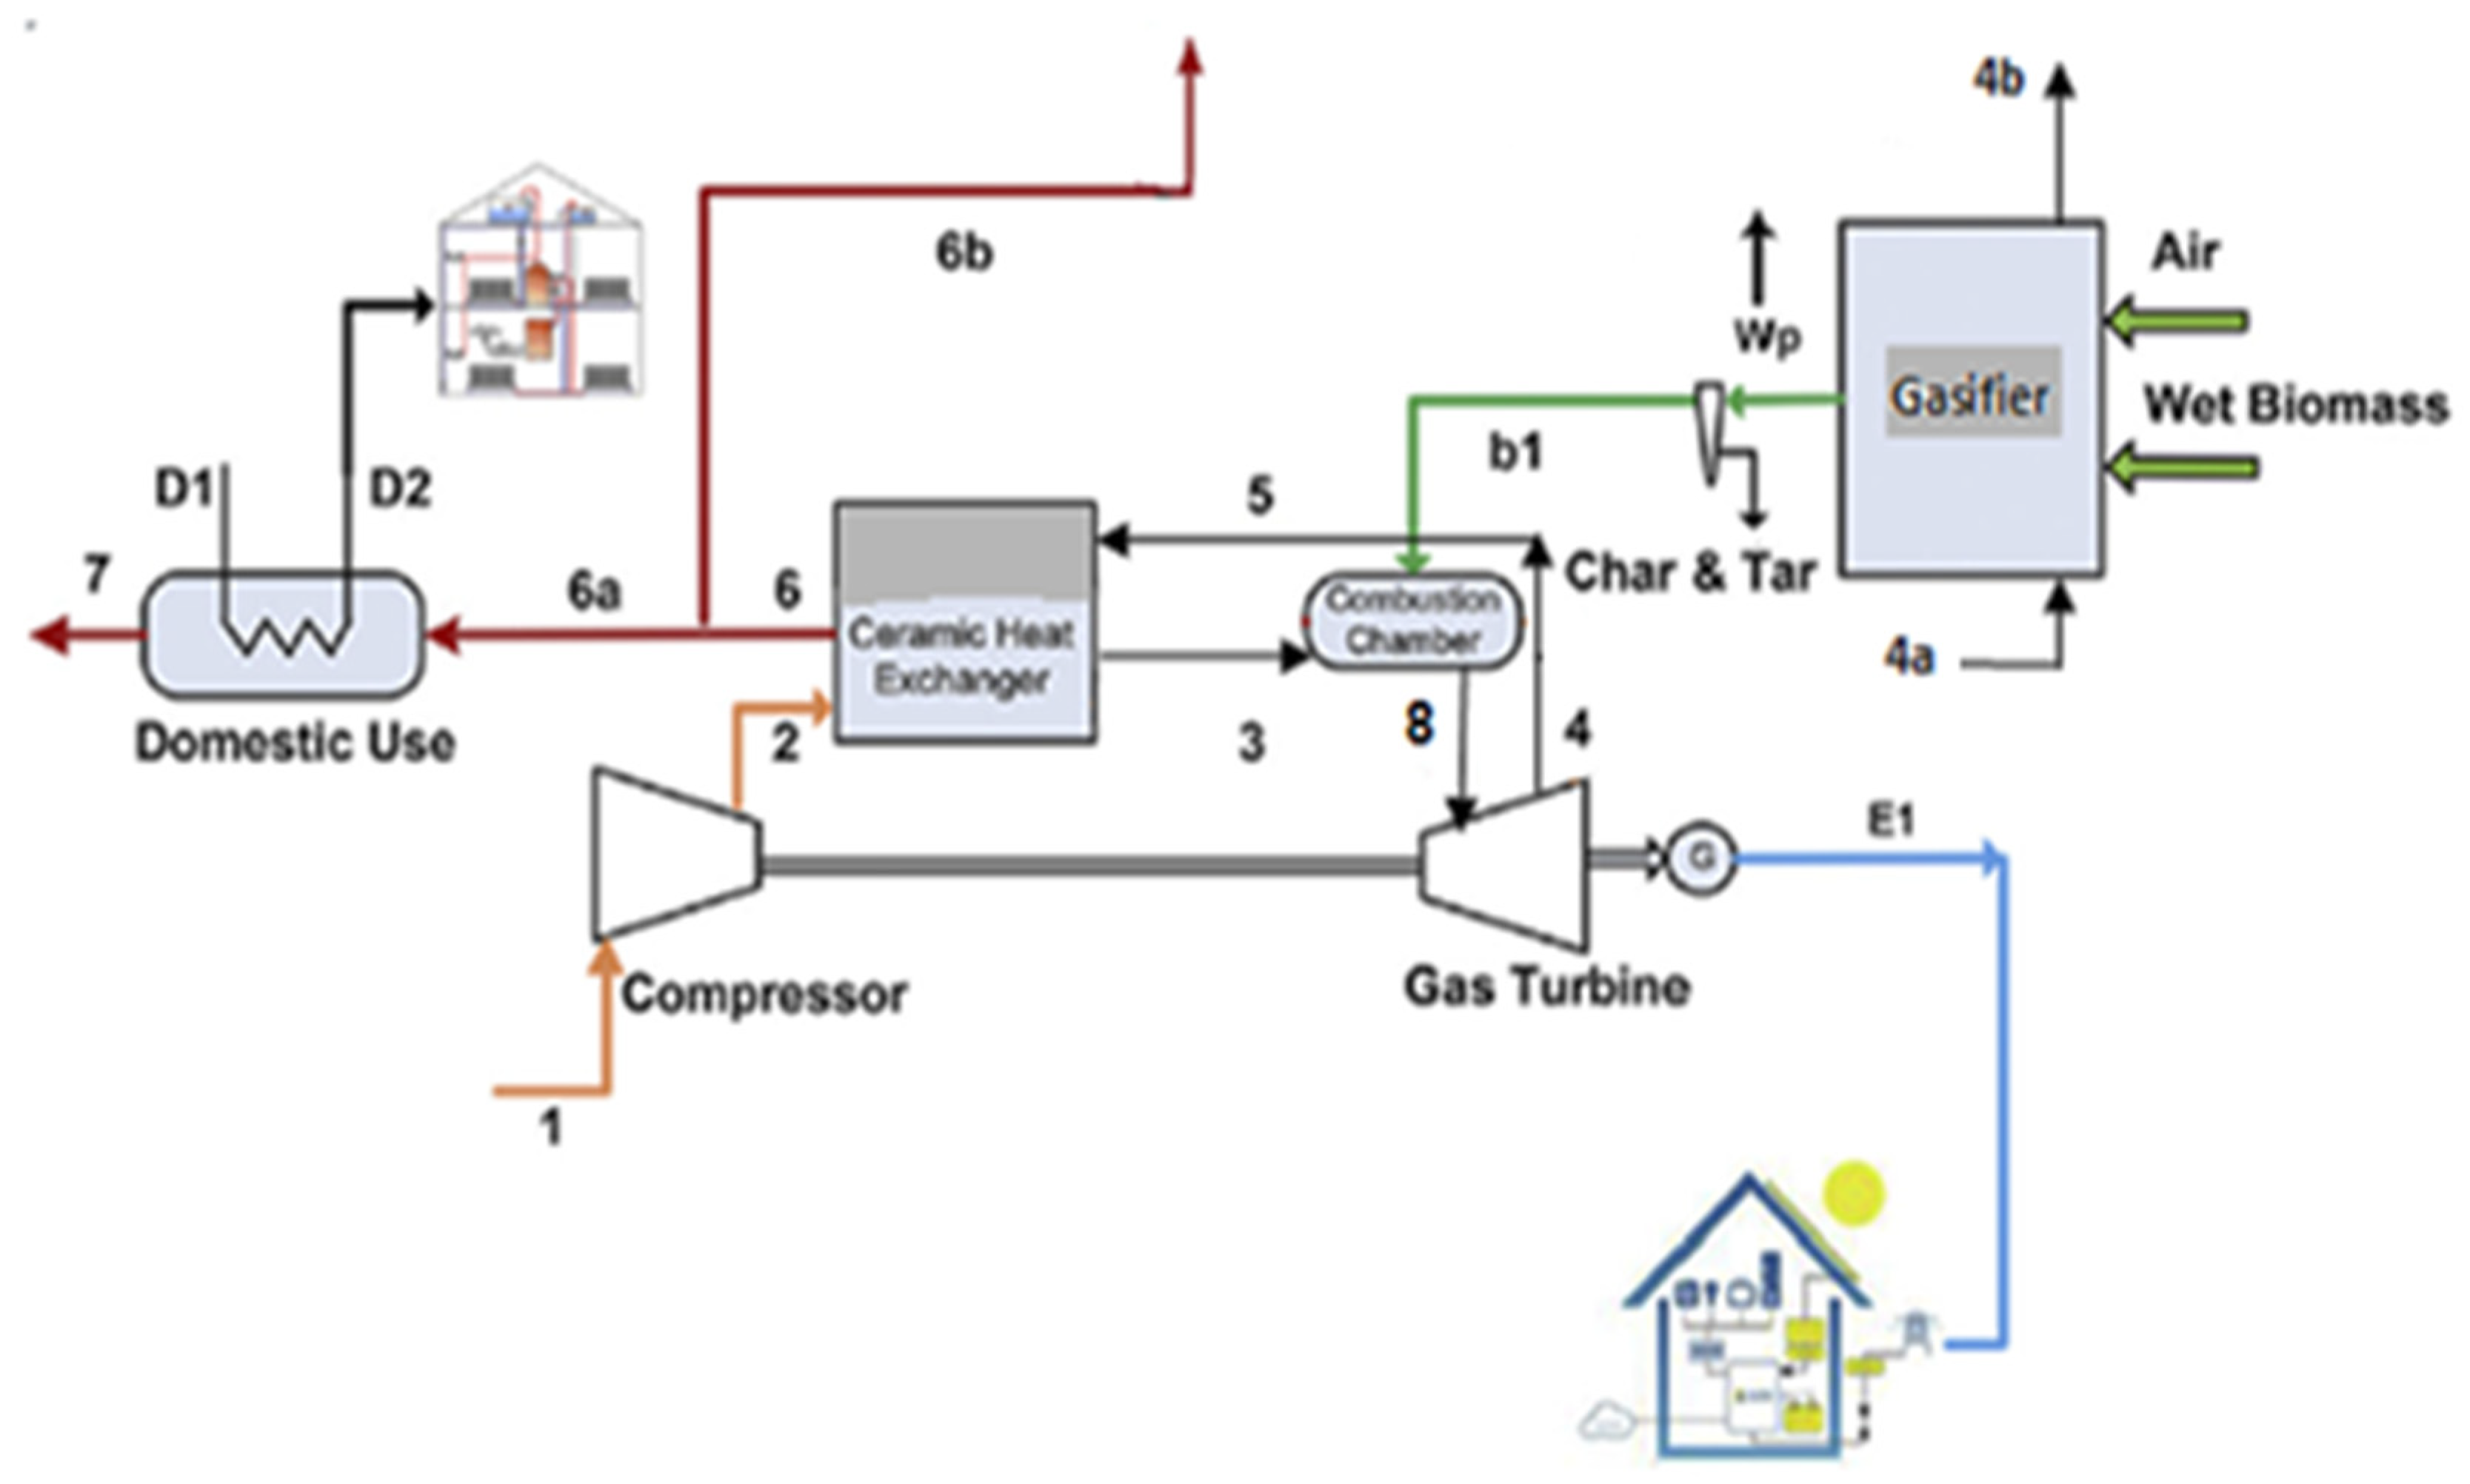
A schematic of a regenerative gas turbine and Biomass Integrated Unit (BIGT) [3] with a syngas producer is shown in Figure 1. The system comprises a hot air-driven gas turbine, compressor, combustor, and regenerator beside the Gassifier Unit. By using the gasification of dry biomass, the gasifier produces syngas [3]. The biomass material will be fed to the gasifier [52] at surrounding conditions described briefly in Figure 1. Since air is the gasification medium, gasification occurs in compressed air and produces syngas that enters the combustion chamber. A thermodynamic equilibrium method [7] based on a stoichiometric approach according to the method of Jarungthammachote and Dutta [53] was used for modeling the gasifier. The syngas composition is predicted using this model at the gasifier’s operational temperature and pressure. The global reaction of gasification can be written as [12,22,51]:
All coefficients from x1 to x6 will be calculated using atomic balancing and equilibrium constant equations. The following are the steps to take [3,42]:
The secondary gas-phase reactions can be derived by examining the equilibrium constant expression of the oxidation reactions [11] in the gasifier, which virtually approaches an equilibrium state. These are the reactions:
The reactions described above [3] are known as the methanation and the gas–water shift reaction, and their equilibrium constants are as follows:
Finally, the energy balance is applied for the calculation of the gasification temperature (Tgasif) as follows [54]:
which is the formation enthalpy in kJ/kmol, its value in the reference state is zero for all chemical compositions, and the enthalpy difference between the given state and the reference state [3]. The RGT power plants comprise four parts: compressor, combustion chamber (CC), turbine, and generator. The integrated biomass regenerative combined cycle arrangement considered in Figure 1 demonstrates how to utilize the hot turbine exhaust gas. The fresh atmospheric air from the surroundings is filtered and drawn continuously into the circuit; the energy is added by fuel combustion in the chamber unit [35]. The combustion products are spread through the turbine [55] and consequently produce electrical work, while the rest of the exhaust gases are discharged into the Biomass Gasifier and Regenerator Units. The needed power output of the gasifier, Q (MWth), is an essential input parameter set by the client [17]. Based on this, the designer calculates the amount of fuel to feed into the gasifier and the amount of gasifying medium required. The volume flow rate of the product gas, Vg (Nm3/s), is calculated by subtracting its lower heating value, LHVg (MJ/Nm3), from its ideal higher heating value, LHVg (MJ/Nm3) [17].
The lower heating value (LHV) or net heating value can be determined from gas formation (yi), according to [17]:
The net heating value or higher heating value (HHV) can be determined from gas formation (yi), according to [17]:
To find the biomass feed rate, the following formula is used, in which Mf, the needed power output, is divided by the LHV of the biomass (LHVbm) and by the gasifier efficiency (ηgef) [17]:
The following unified correlation for HHV is based on 15 existing correlations and 50 fuels, including liquid, coal, biomass, and gas, developed by Channiwala and Parikh [17].
The percentages of carbon, hydrogen, sulfur, oxygen, nitrogen, and ash, as determined by a final analysis on a dry basis, are C, H, S, O, N, and ASH. A critical parameter is the theoretical air demand for the entire combustion of a unit mass of fuel, mth, called the stoichiometric air requirement. Equation (16) [15] shows how to calculate it:
How to calculare the amount of air needed, Ma, is shown below [17]:
The gasification of a unit mass of biomass in an air-blown gasifier is calculated by multiplying it by another parameter, ER.
The air requirement of the gasifier, Mfa, at a fuel feed rate of Mf is the amount of actual air [17]:
The equivalence ratio (ER) [17] is a crucial design parameter for gasifiers. The stoichiometric air–fuel ratio is the ratio of the actual air–fuel ratio to the stoichiometric air–fuel ratio. This word refers to conditions when there is a lack of oxygen, such as those seen in a gasifier [17]:
EA denotes the excess air coefficient [17]. Fuel is gasified rather than combusted when the ER value is very below 1.0, which has a big impact on the quality of gas produced by a gasifier. A gasifier’s oxygen requirements, an air supply, or air-separation equipment that removes oxygen from the air can be used to fulfil this need. [17] Gasification efficiency is measured in cold-gas efficiency or hot-gas efficiency [17]. The energy intake above the potential energy output is known as cold-gas efficiency. With an LHV of Qg, the efficiency of gasifying Mf kg of solid fuel to produce Mg kg of the product gas is given as [17]:
where LHVf is the solid fuel’s lower heating value (LHV). The hot-gas efficiency, abbreviated as ηhg, is defined as [17]:
T0 is the fuel temperature entering the gasifier, and Tf is the gas temperature at the gasifier egress or the burner’s access [17]. Accordingly, the intake pressure at the compressor inlet was modeled with the following equation [16]:
where the intake pressure drop () was taken to be 0.005 bar, and the intake temperature was modeled as the ambient temperature [56]. The process on the temperature-entropy diagram [42] is represented in Figure 1. The compressor compression ratio () can be defined as [35,41]:
where P1 and P2 are the compressor’s inlet and outlet air pressure, respectively [18]. The isentropic outlet temperature leaving the compressor is modeled by the equation [35,57,58]:
The specific heat ratio for air was taken as 1.4 and was predicted at for the gas. The isentropic efficiency of the compressor and turbine was taken to be in the range of 85% to 90%. The isentropic compressor efficiency is expressed by the equation [59,60]:
where T1 and T2 are the compressor inlet and outlet air temperatures, respectively, and T2s is the compressor isentropic outlet temperature. The specific work required to run the compressor work (WC) is modeled with the following equation [60]:
Additionally, the specific heat of air is taken as . The specific heat of flue gas () is given by [60]:
From the energy balance, the combustion chamber equation is as follows [18,51]:
where is the fuel mass flow rate in (kg/s), is the air mass flow rate (kg/s), LHV is the fuel’s low heat value, Tit is the turbine inlet temperature, is the specific heat of fuel, and Tf is the temperature of the fuel. The specific heat of the flue gas was modeled with ; efficiency was set at 95%, and a pressure drop of was set in the combustor. Accordingly, the efficiency of the combustor is modeled as [35]:
The air–fuel ratio at the combustor was modeled according to the following equation [35]:
where the total mass flow rate is given by [35]:
The discharge gas of the turbine is predicted according to the equation [35]:
where the actual outlet temperature leaving the turbine at isentropic conditions is modeled according to [35]:
The regenerator effectiveness ε is modeled according to the equation [59]:
where is the combustor inlet temperature. The shaft work produced from the turbine is calculated by the equation [35]:
The mechanical () and generator () efficiencies were taken to be 92% and 95%, respectively.
The heat supplied is expressed with the equation [35]:
The heat supplied (per kg. air) to the combustor was modeled according to the equation [35]:
The GT efficiency is determined by the equation [35]:
Accordingly, the heat rate (HR), which is defined as the spent heat to generate unit energy of electricity, is determined by the equation [35,62]:
The specific fuel consumption (SFC) is determined by the equation [35]:
4. Results and Discussion
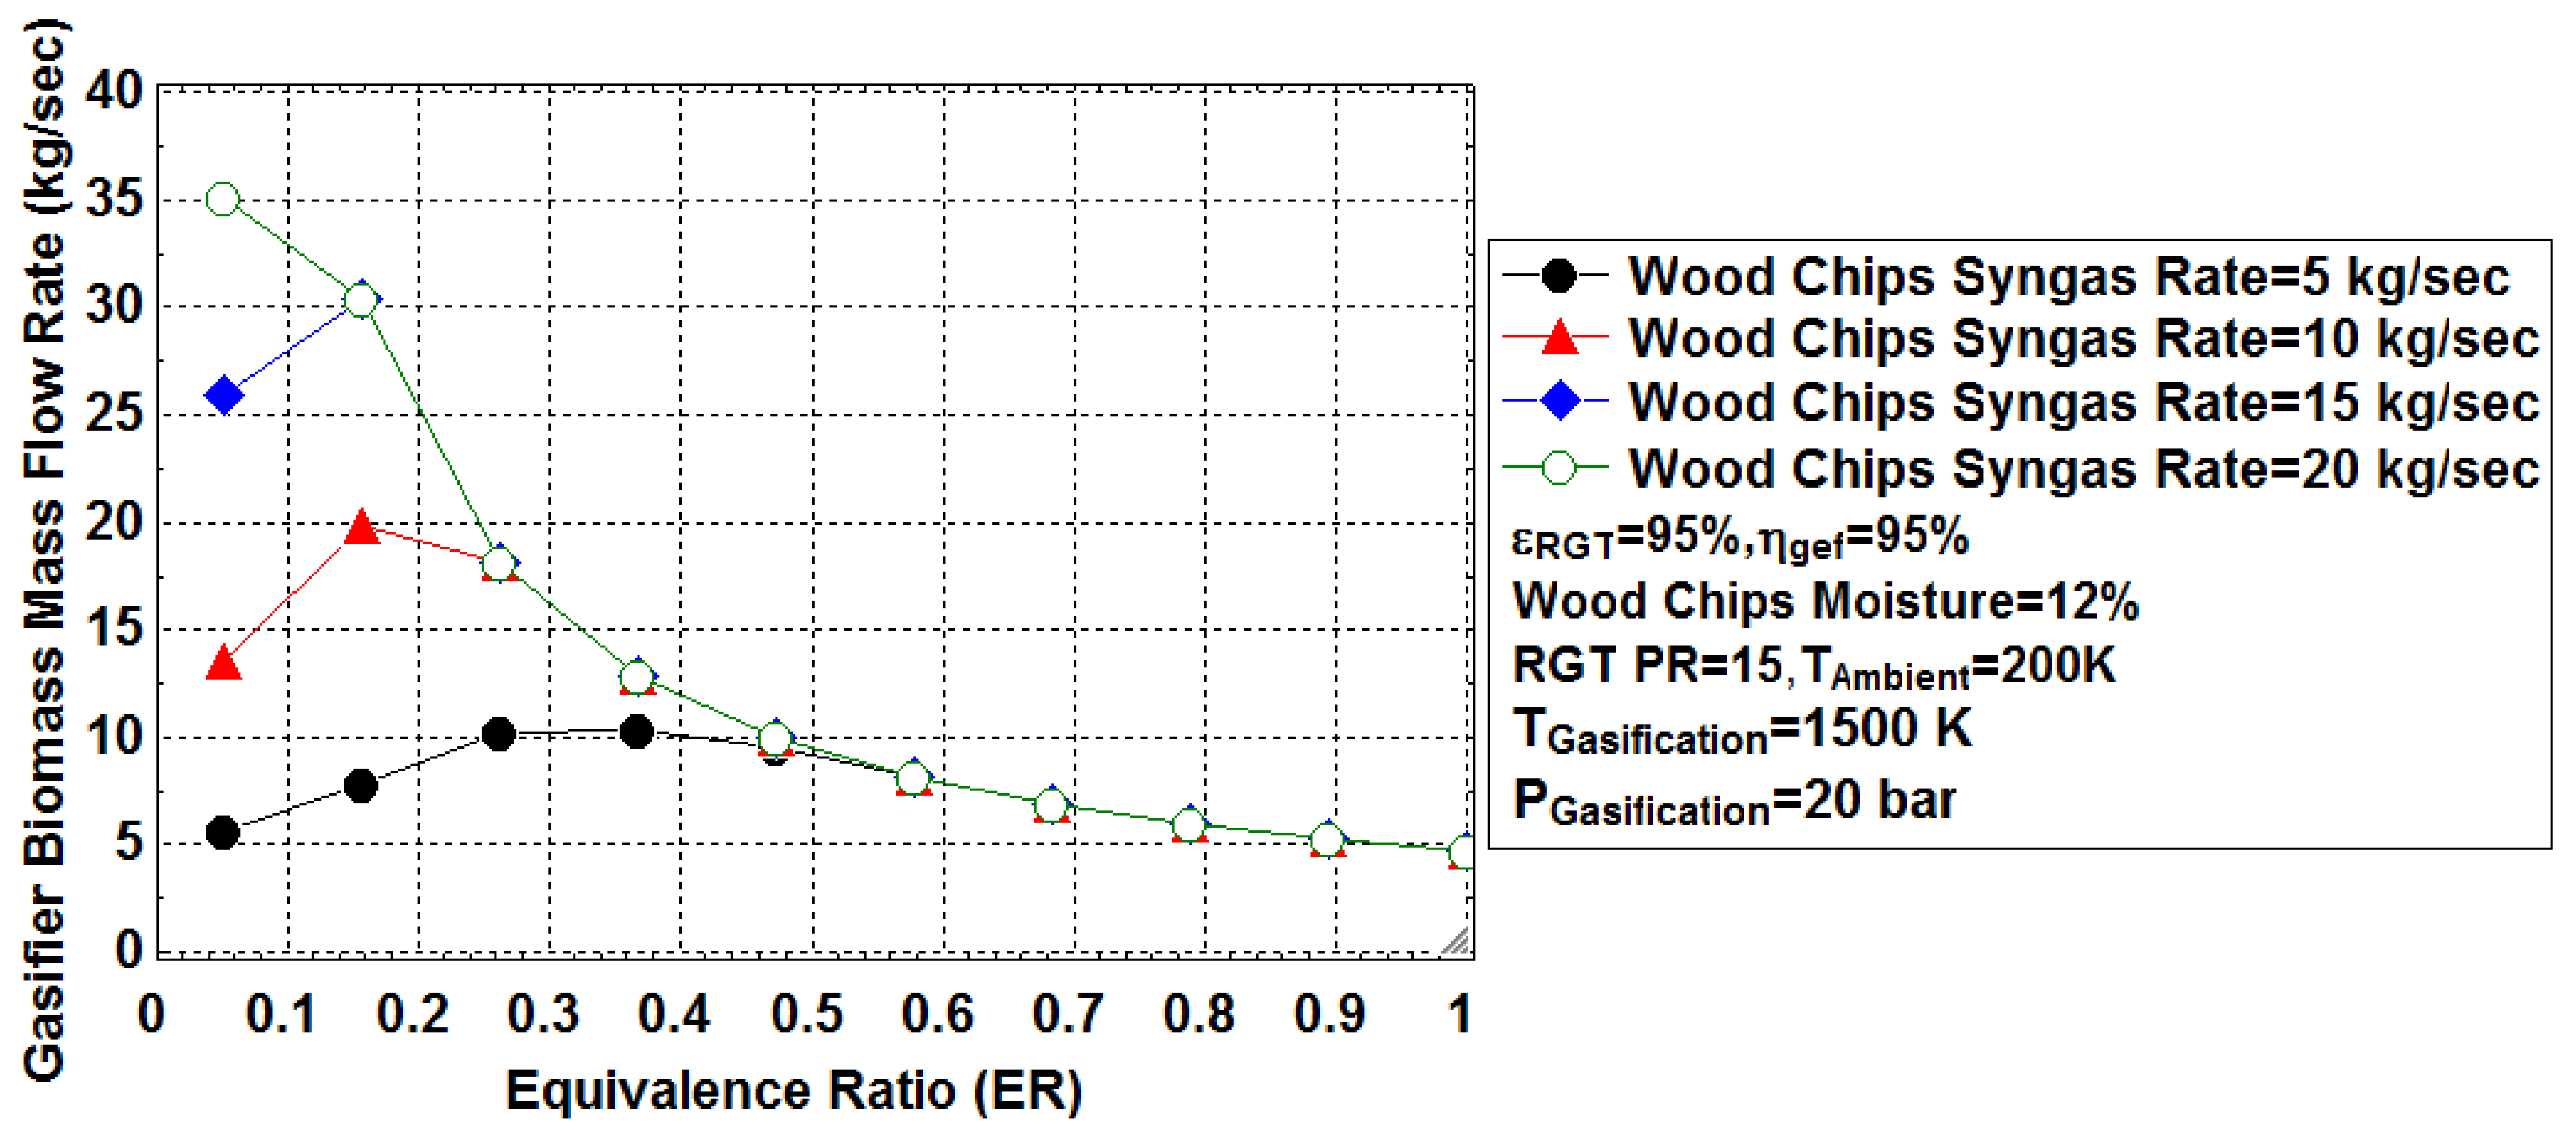
The gasification process was simulated using Acacia Nilotica Wood Chips biomass available in Sudan. A detailed energy analysis was derived from investigating the optimal design conditions of the system that integrates the Biomass Unit with the Regenerative Gas Turbine Power Plant. The work was executed with the Thermodynamics Engineering Equation Solver (EES) codes. The work investigated air as a gasification medium to produce syngas fuel for Wood Chips (Acacia Nilotica). Figure 2 depicts the effect of the equivalence ratio (ER) on the gasifier’s biomass mass flow rate at different syngas rates (5–20 kg/s). As observed, at a moisture content of 12%, gasification temperature of 1500 K, pressure of 20 bar, and air-like gasification medium, the biomass gasifier’s flow rate is higher at a higher syngas rate. The higher value of the biomass flow rate reached 35 kg/s of the wood chips at a yielded syngas rate of 20 kg/s. The results verified that there is an optimum ER for each syngas rate, in which the slow growth of the ER revealed the maximum gasifier’s biomass mass flow rate. After that, the further increases in the ER showed a slow downtrend due to increasing combustion products, changes of syngas constituents amid CO2, water vapor, nitrogen, and a massive decrease in the lower heating value of the syngas. The point of inflection can be regarded as the point of the optimal design of the system to derive the required biomass rate for the necessary air gasification to produce the assigned syngas rates. The produced syngas composition varies with the amount of supplied air to the process.
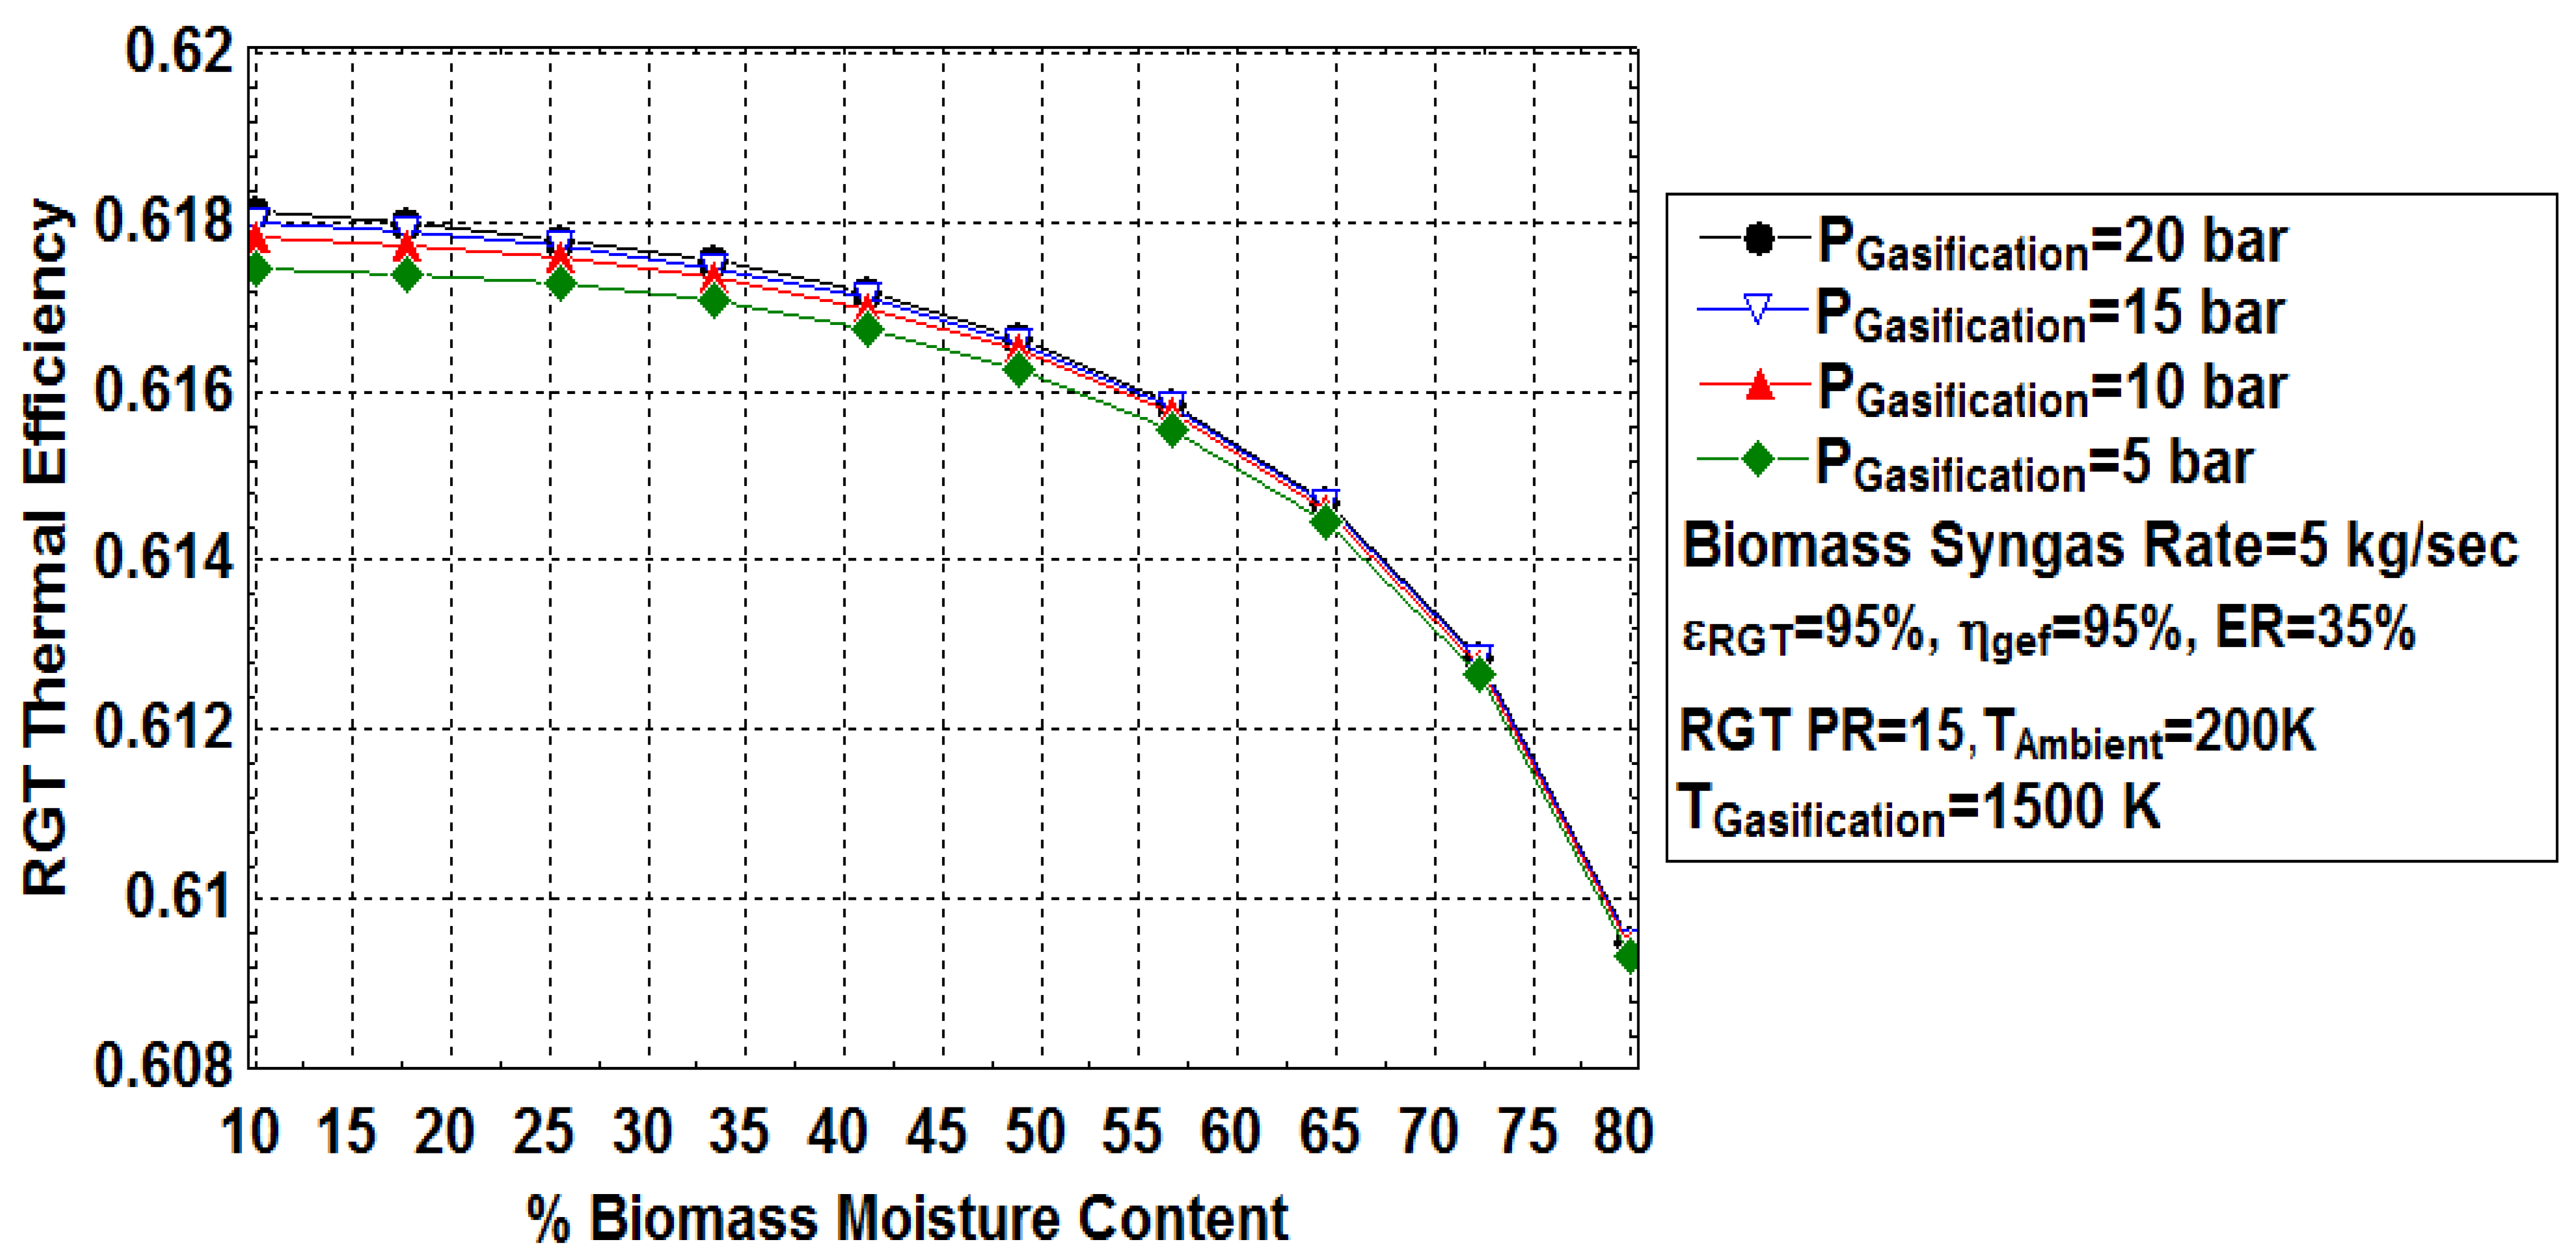
Important to note that increasing the biomass content leads to a sharp decrease in the gasifier’s efficiency. The simulation results observed that an increase in the syngas rate revealed an increase in the required biomass rate for gasification. However, the quality of the produced gas depends mainly on the amount of qualified air to achieve the high energy content of the gasification products [63]. Figure 3 displays the relationship between biomass moisture content and the RGT thermal efficiency at different gasification pressures (5–20 bar). As observed, the increase in the biomass moisture content leads to a sharp decrease in the RGT thermal efficiency.
At 200 K and a gasification temperature of 1500 K, the RGT thermal efficiency revealed a higher value of 62% at the lowest biomass moisture content of 10% and the lowest value of 61% at higher rates of moistures. The RGT thermal efficiency remains high at higher gasification pressure. Higher values of biomass moisture content led to the low energy content of the syngas, which yielded low values of RGT thermal efficiency. As the amount of moisture content decreases, higher amounts of water have to be evaporated [64]. Since the heat needed to vaporize this water is transferred from the syngas constituents at the gasifier outlet, the temperature’s products decrease, thus lowering the energy content and the syngas’ physical and chemical exergy [64].
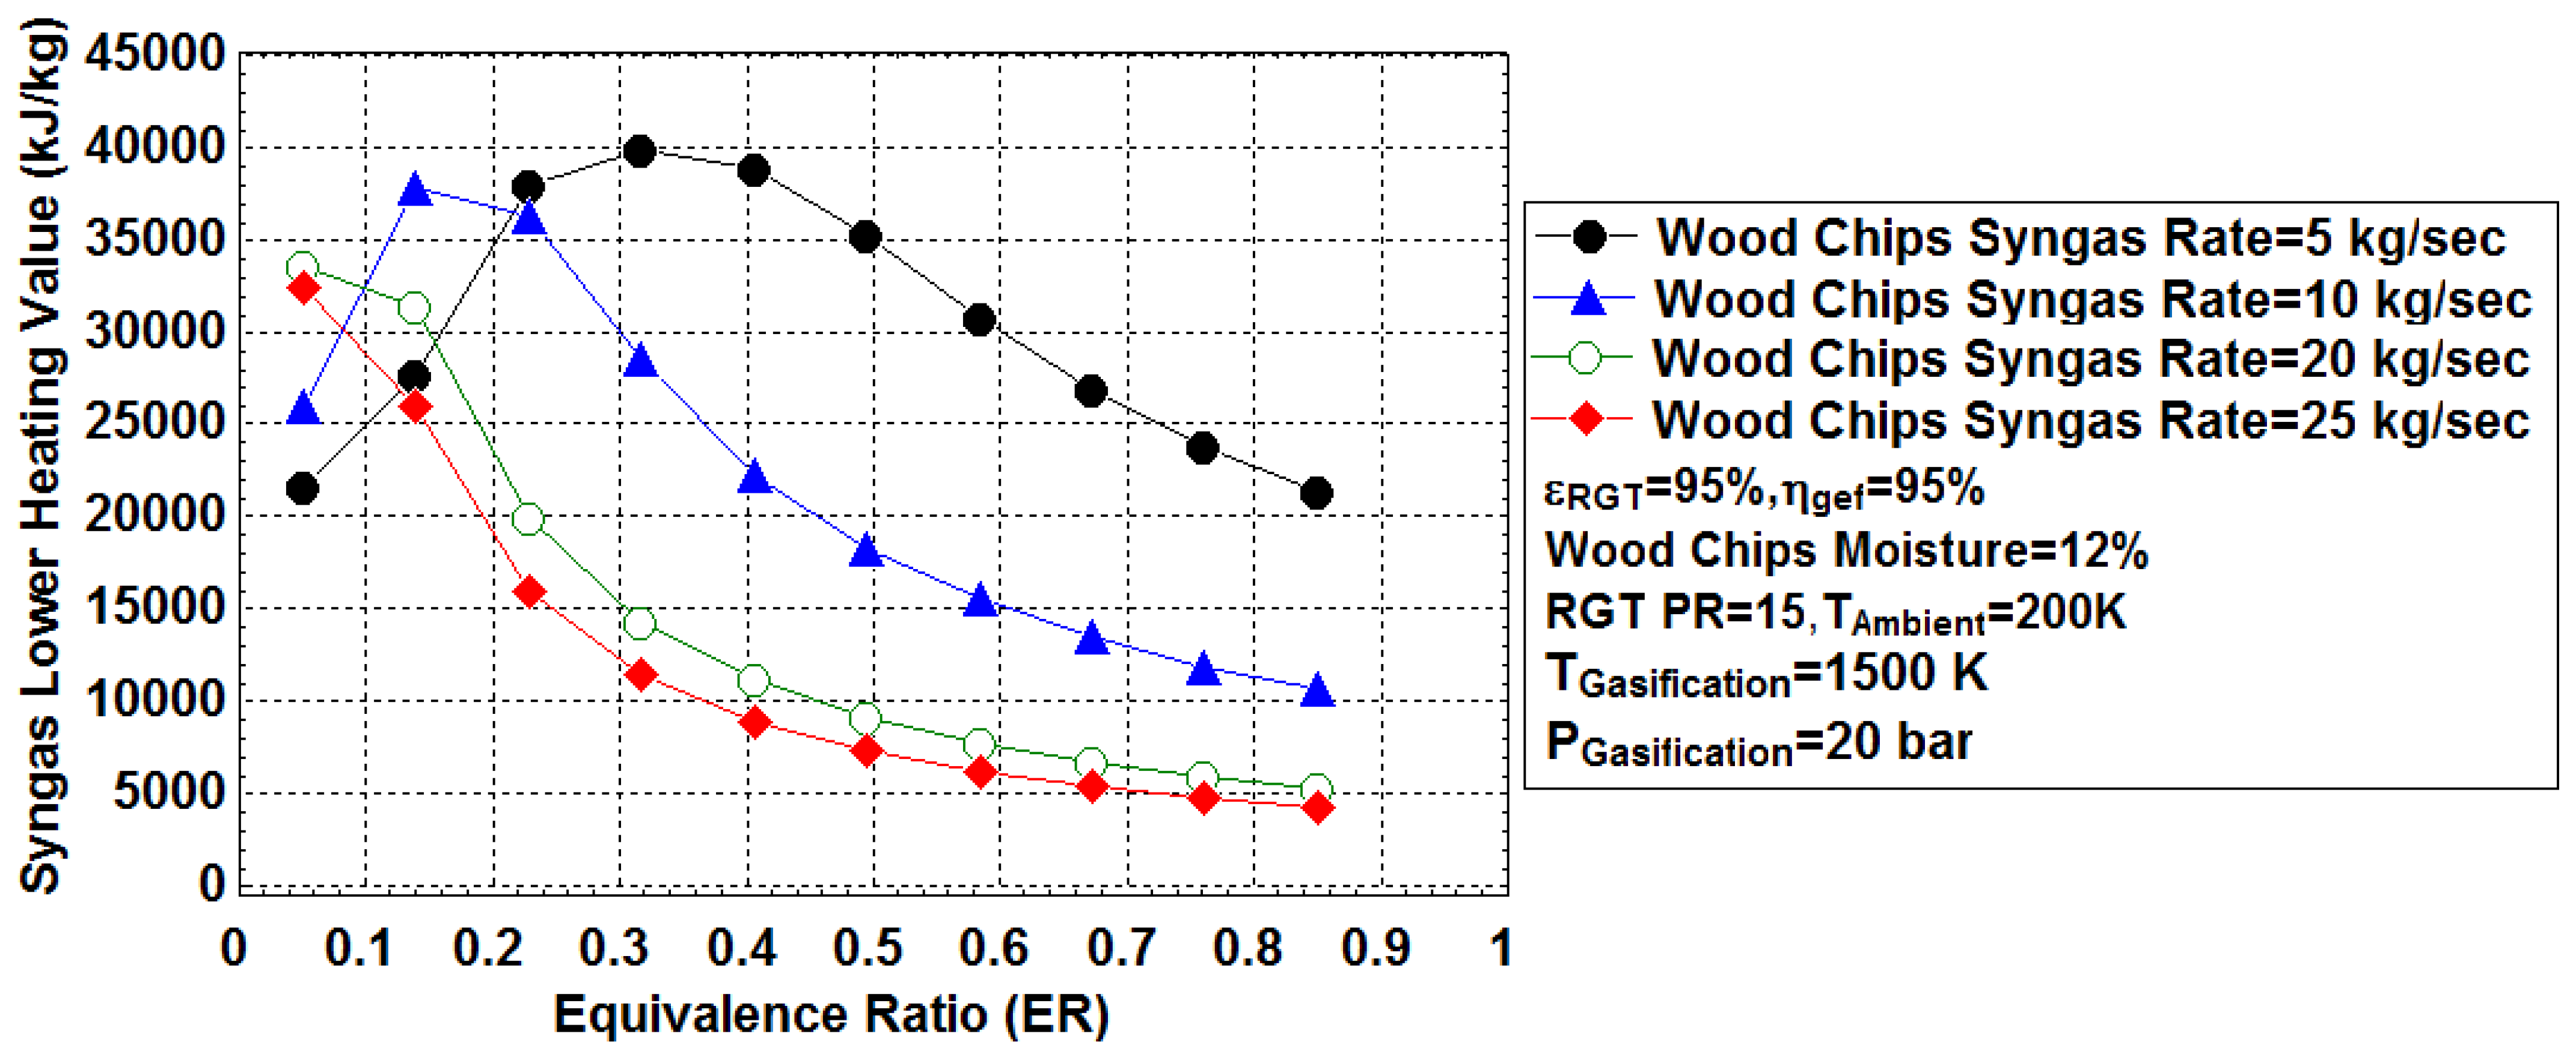
Lowering the moisture content of the biomass entering the gasifier raises the efficiencies of both the RGT and the Gasifier Unit. Further removal of the moisture will increase the chemical exergy of the product gas, and the physical exergy will be slightly increased [64]. The exergetic efficiency of the gasification process [17] decreases with the moisture content increase. In addition, with the increase in the moisture content, the CO2 and H2O production rate increases [65]. The increase in the gasification pressure has influenced the RGT thermal efficiency and the syngas LHV due to enhancement of the gasification reactions and the growth of the major constituents of the syngas product. Figure 4 shows the variation of the equivalence ratio (ER) with syngas lower heating value at different wood chips syngas rates (5–25 kg/s), at gasification pressure of 20 bar, the temperature of 1500 K, and moisture content of 12%. The profile exhibited an increase in the syngas LHV with the ER, till an optimum amount of the ER, subsequently the further increase in the ER has led to slow down the syngas LHV.
The results revealed that the syngas lower heating value remains high at lower produced syngas rates. This is attributed to the increase in the raw biomass materials, which influences increasing the irreversibilities sharply inside the gasifier, which causes a reduction in the gasifier efficiency. The calorific value of the produced syngas depends on the heating value of the consumed biomass [11]. The higher the biomass heating value, the higher the calorific value of the produced syngas. Tar content in the gasification product is always higher for fuel richer with ash [66]. The results observed that the amount of consumed biomass plays a significant role in the final syngas energy content.
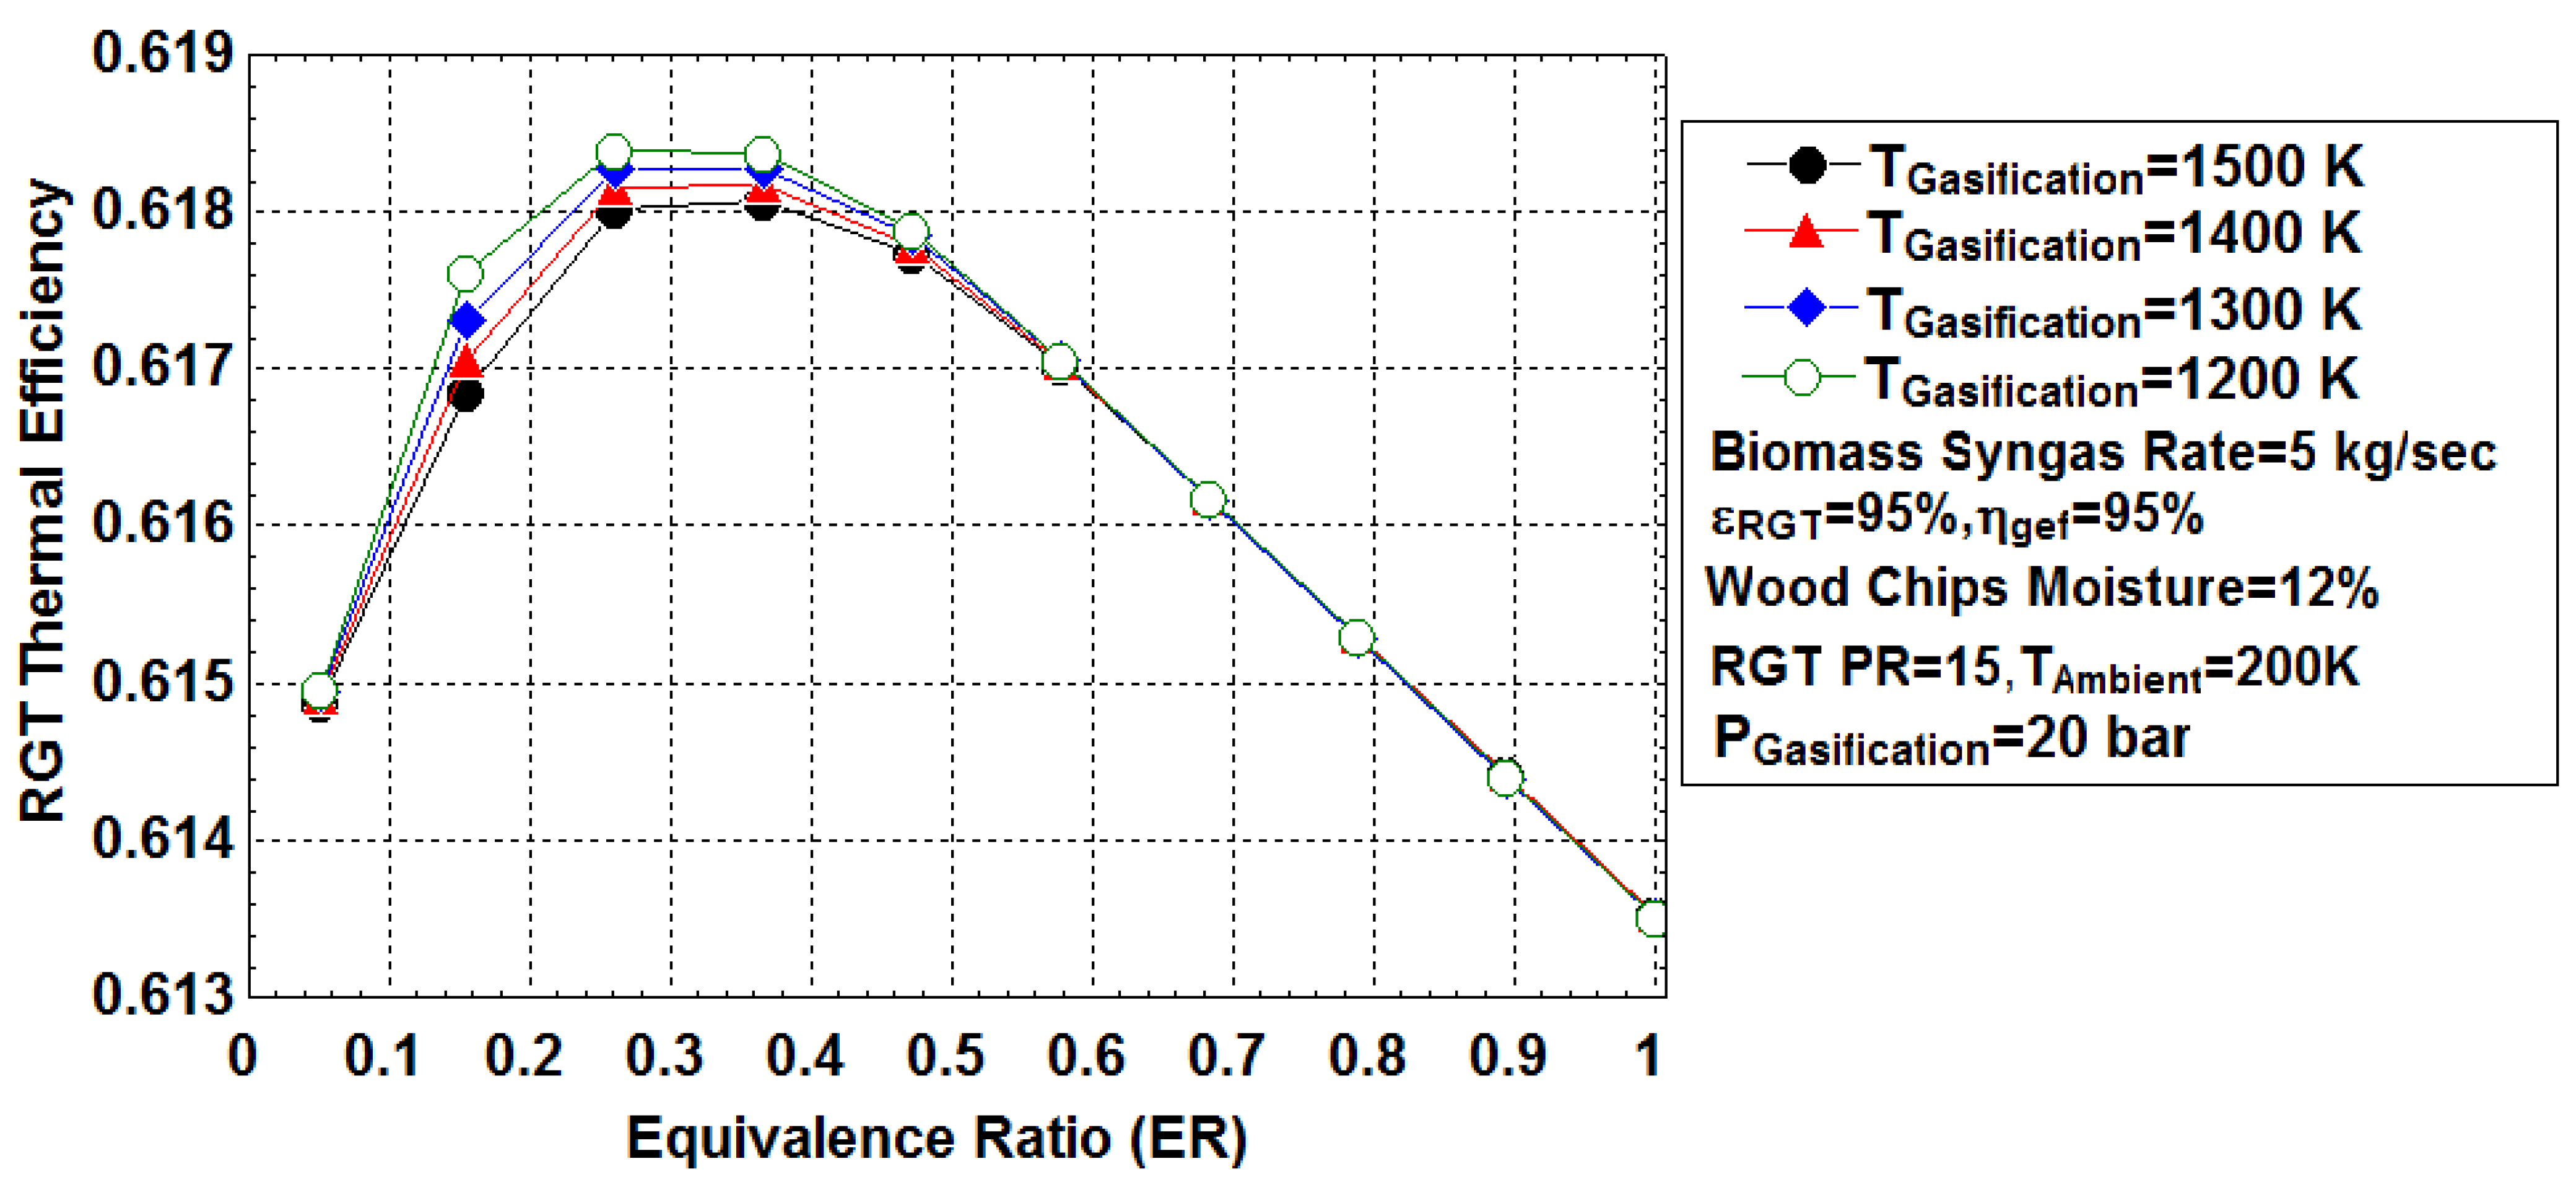
The gradual increase in the biomass should have a certain limit since a small amount of the required air will result in incomplete gasification of the biomass and produce less syngas energy content. The effect of the equivalence ratio (ER) on the RGT thermal efficiency at different gasification temperatures is presented in Figure 5. As observed, the simulation results revealed an optimum ER in which a higher RGT thermal efficiency occurred; thereafter, the additional amount of ER led to a decline in the thermal efficiency of the RGT Unit gradually. ER growths at low values have a significant effect on the performance of the RGT and lead to an increase in the RGT thermal efficiency. The low, moderate, and optimum ERs produce a high amount of the required syngas constituents, which revealed high syngas energy content and improved efficiency.
To some extent, the reduction in the temperature promotes the growth of CO and H2 concentrations and the decrease in the CH4 concentration in the syngas [67]. The increase in the temperature results in primary and secondary water–gas shift reactions, secondary cracking, and reforming of heavy hydrocarbons activity. Thus this results in increasing the concentration of the H2 in the syngas [54,68]. The activity of water gas shift reaction and Boudouard reactions will significantly increase due to temperature growth.
Consequently, the carbon reacts with CO and H2O vapor produces a lot of CO. However, the further temperature growth promotes combustion reactions and thus decreases of CH4 amount at the syngas [54,68] final products. Figure 6 presents the variation of the equivalence ratio (ER) and the percentage mole fractions of the syngas at a gasification temperature of 1500 K, pressure of 20 bar, regenerator effectiveness of 95%, gasifier efficiency of 95%, moisture content of 12%, and a produced amount of 5 kg/s syngas. The influence of the significant parameter, ER, is displayed and observed.
Additionally, the RGT thermal efficiency remains high at lower gasification temperatures. The optimum ER can be regarded as the point of the optimal design of the system to identify the amount of the required air to produce qualified syngas constituents and achieve a higher RGT thermal efficiency. Many reasons promote the temperature decrease for the gasification process, such as the ash, moisture, and the conditions of the gasification reactions.
The simulation results verified an increase in the syngas mole fractions amid increasing the ER to an optimum ER amount. The trend predicted a slowdown among the further increase if the ER. The moisture content of 12% is considered low and was reflected in the composition of the final syngas product. Beyond the optimal point of the ER, a massive decrease in the syngas energy content and the growth of the oxidative combustion reactions are occurring. The N2 and H2O vapor formation increase with the increase in the ER, while the formation of CO2, CH4, H2, and CO exhibited decreases upon increasing the ER. At the optimum ER, the H2 mole fraction depicted a value of 1.25%, 0.85% of CO, and 10.50% of CH4, for a lower heating value of 38 MJ/kg syngas. The highest value of the syngas composition is depicted by N2 since air is the gasification medium. Although a higher syngas energy content is observed, the amount of N2 in the produced gas could be reduced by using steam or oxygen as oxidizing agents [11].
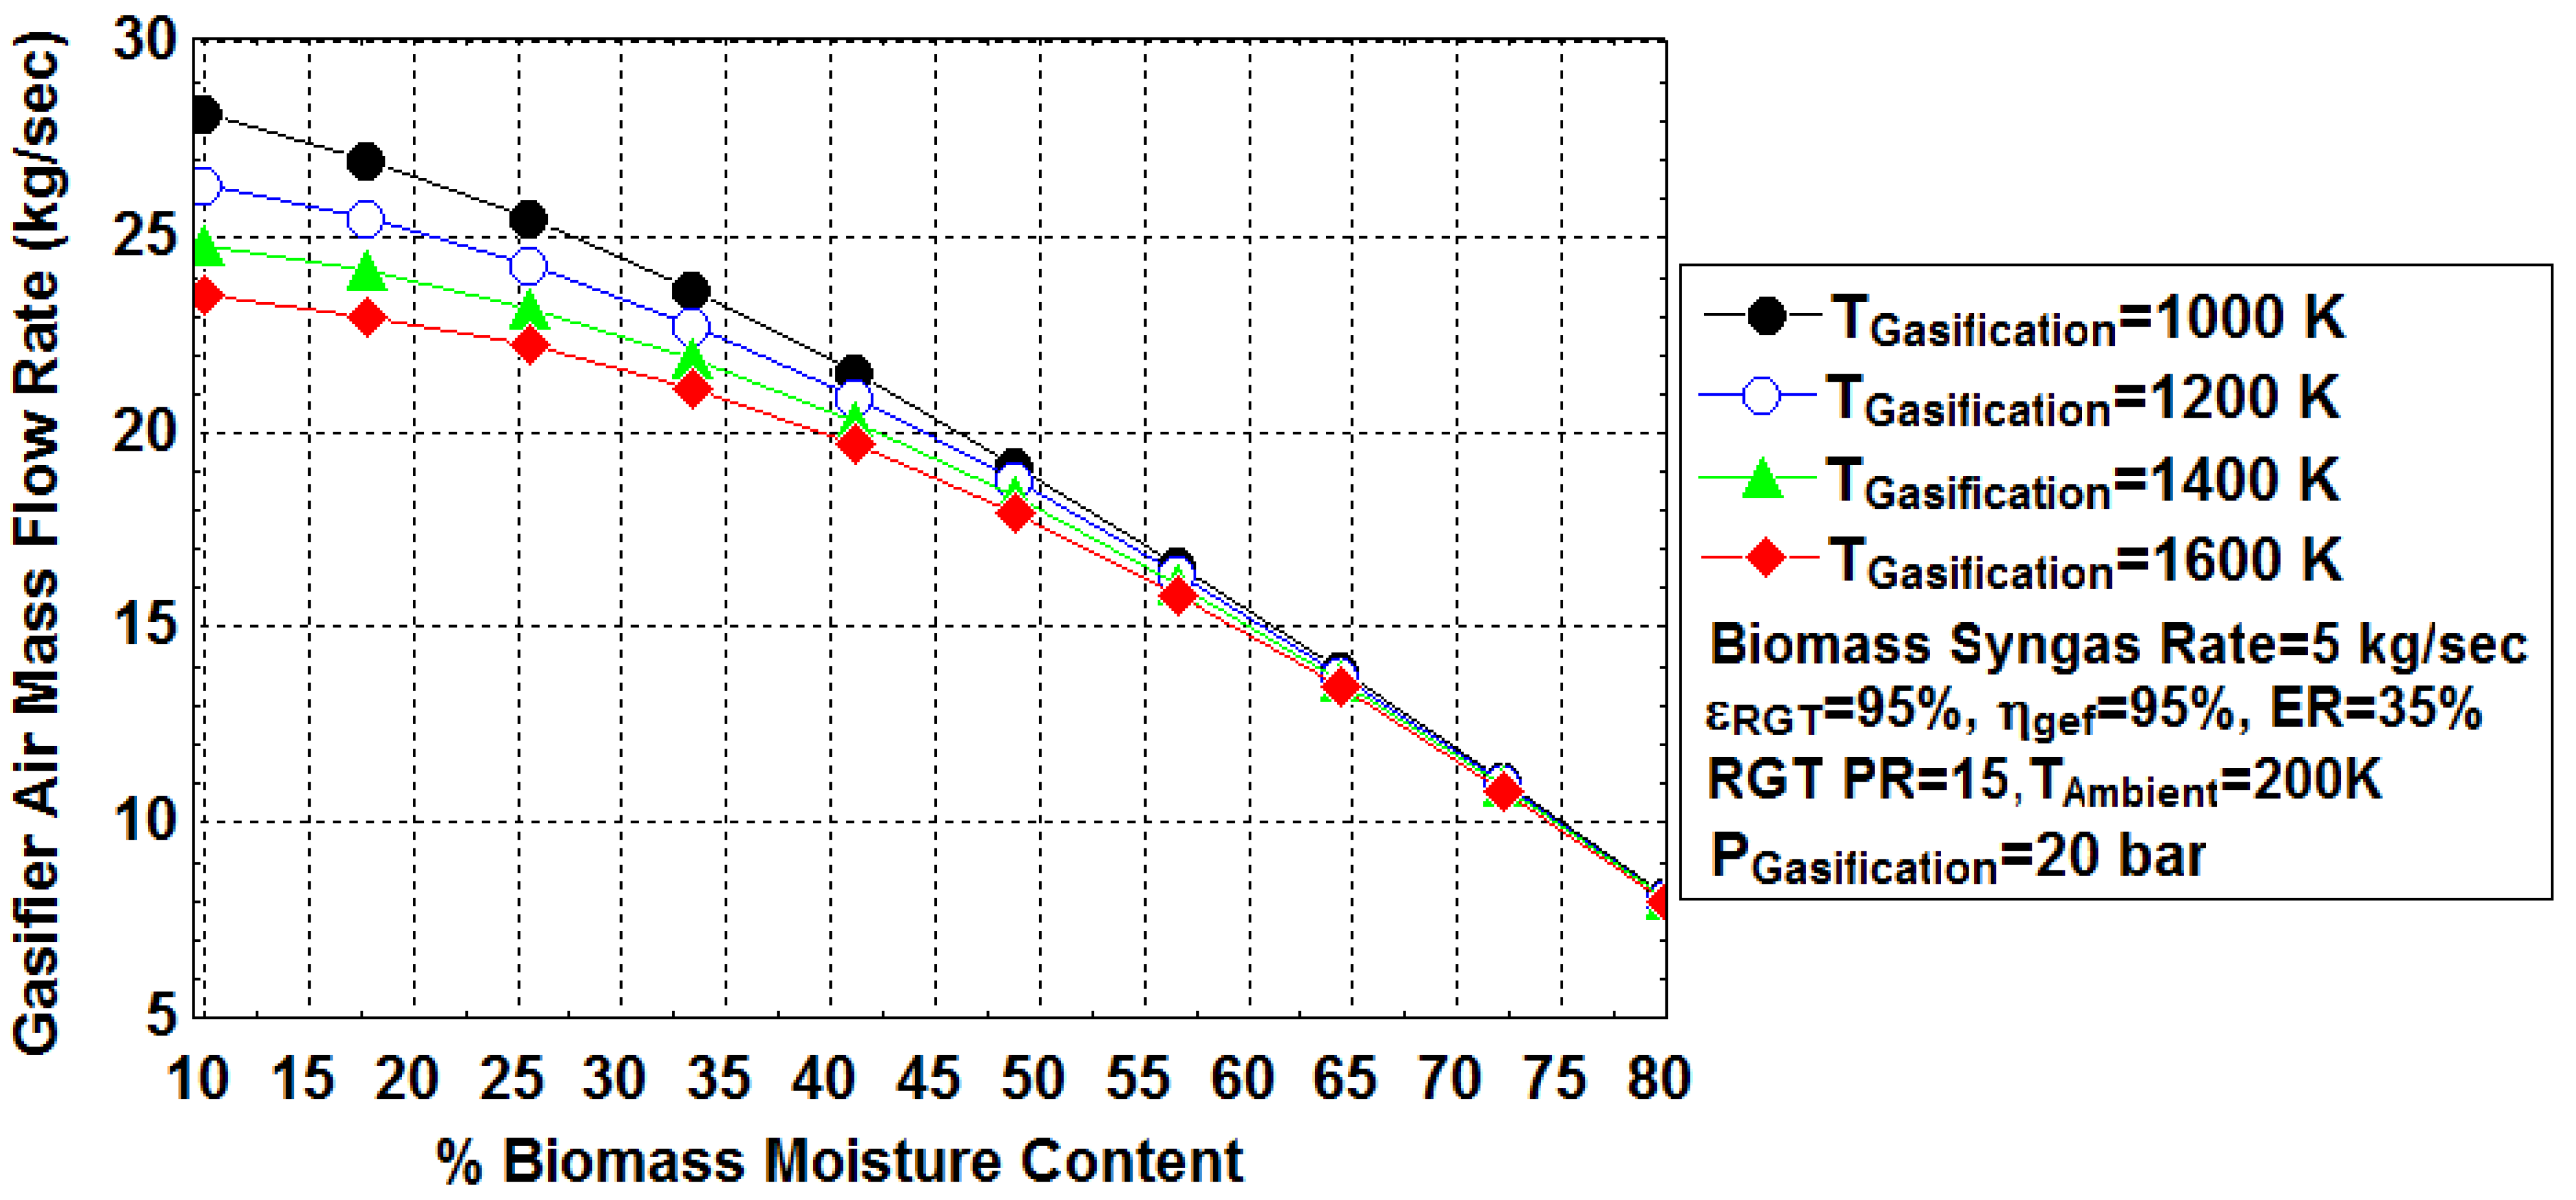
The influence of the biomass moisture content on the RGT actual gasification’s airflow rate can be observed in Figure 7. It is shown that the gasification air entered into the gasifier decreases amid the increase in the biomass moisture content. The biomass moisture content affects the quality of the consumed biomass. At a constant ER and syngas rate, increases in moisture content led to a decrease in the energy content of the syngas and an increase in the amount and the demand of the biomass flow rates, thus influencing a lower demand for the required air for the complete gasification process.
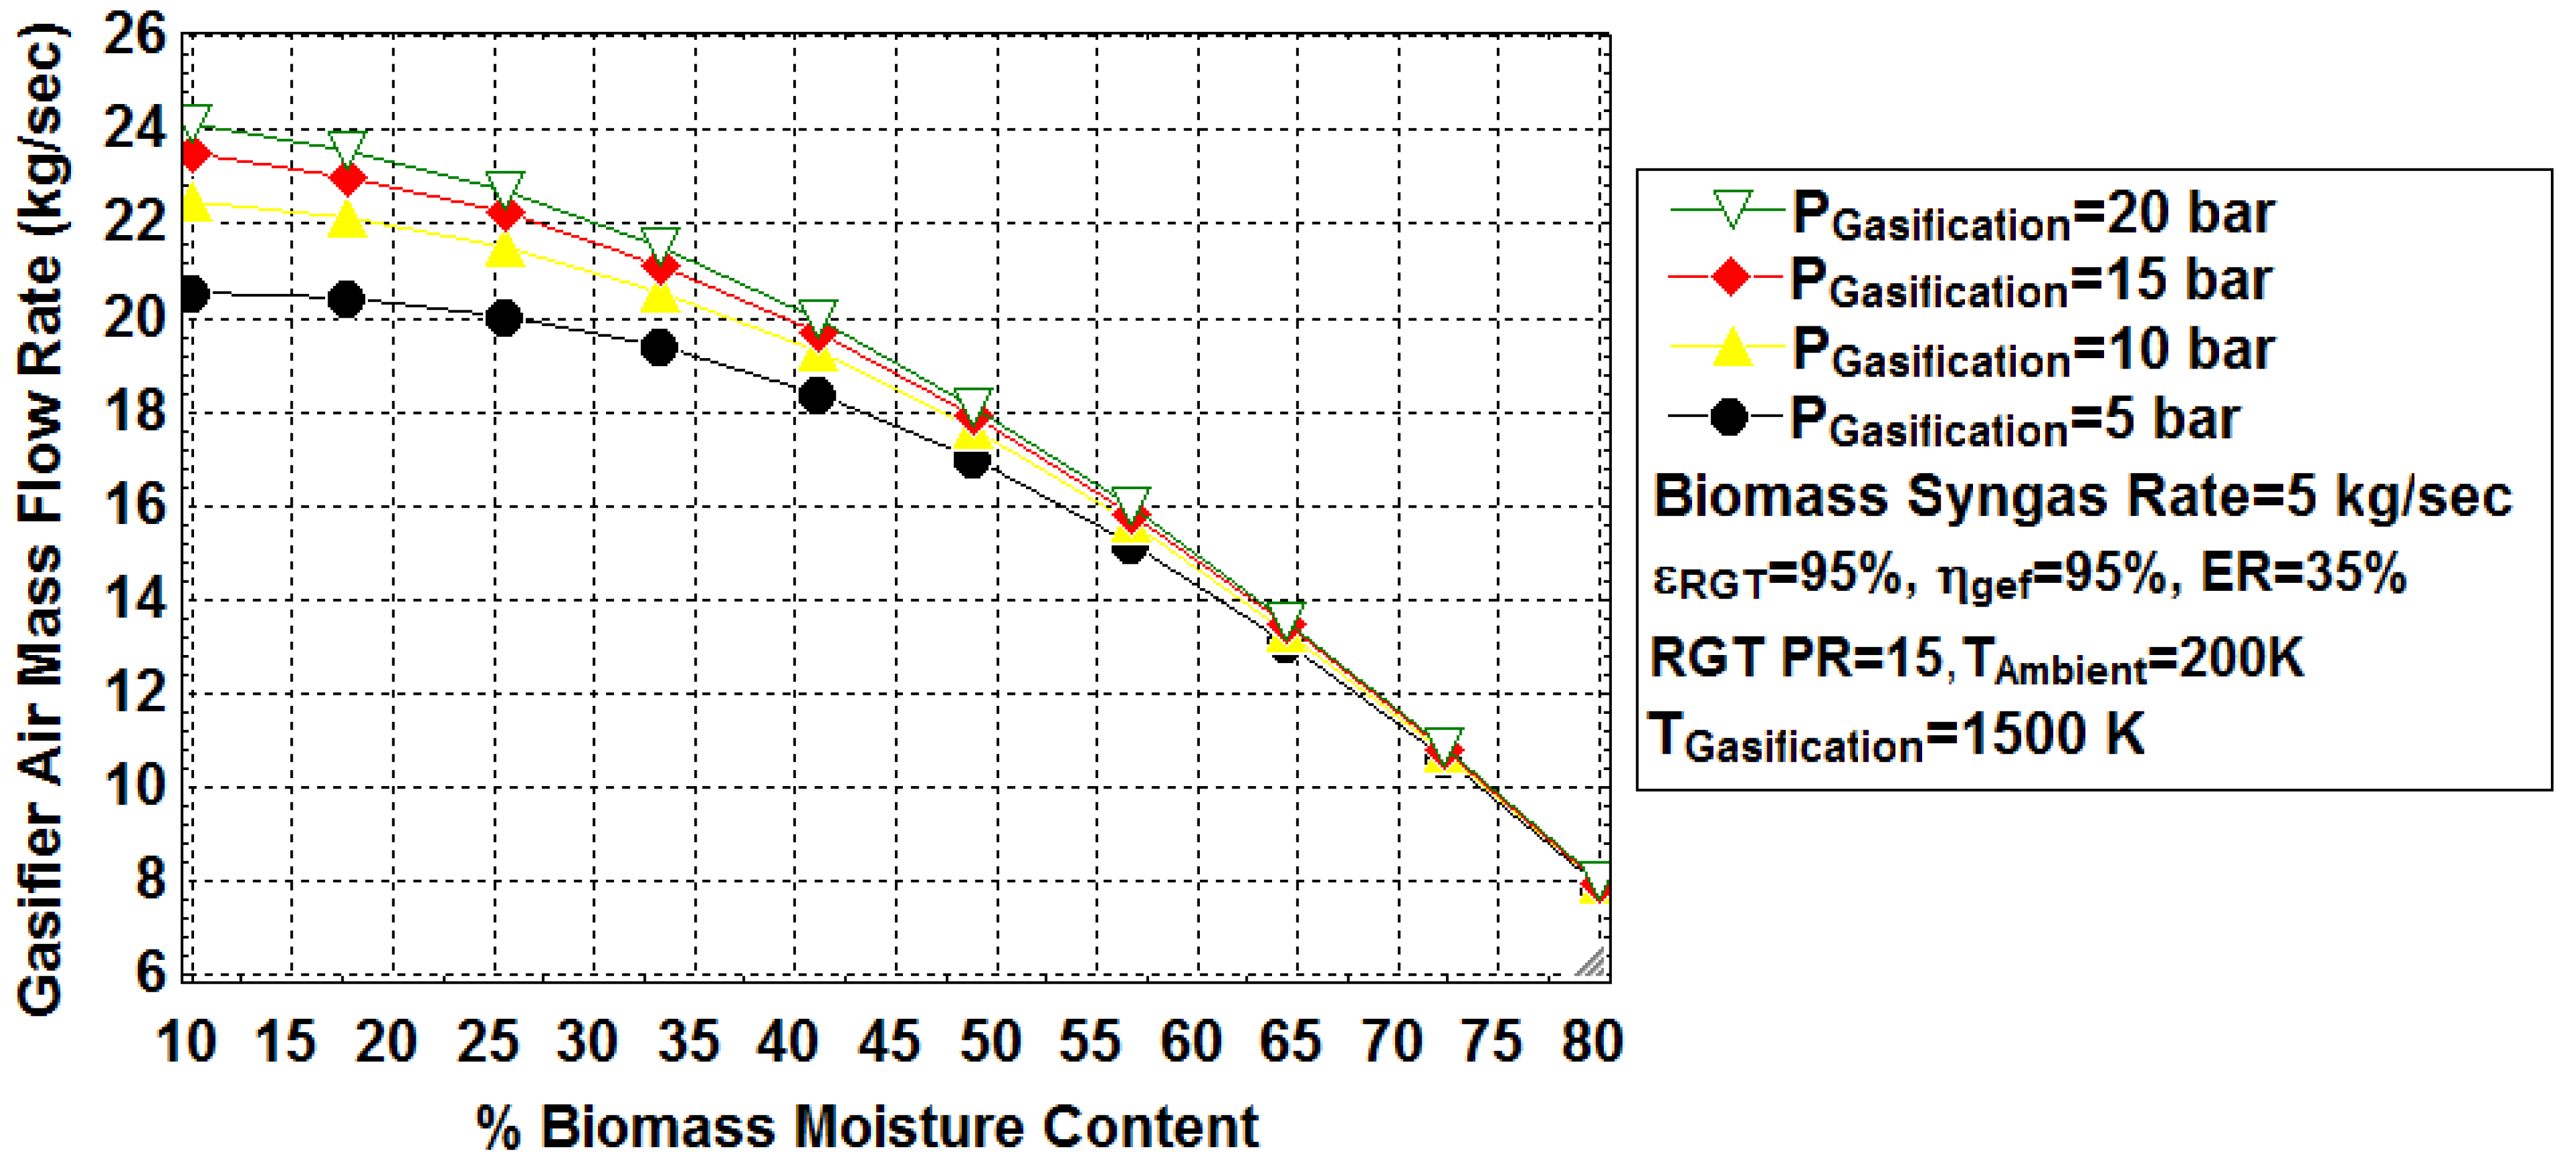
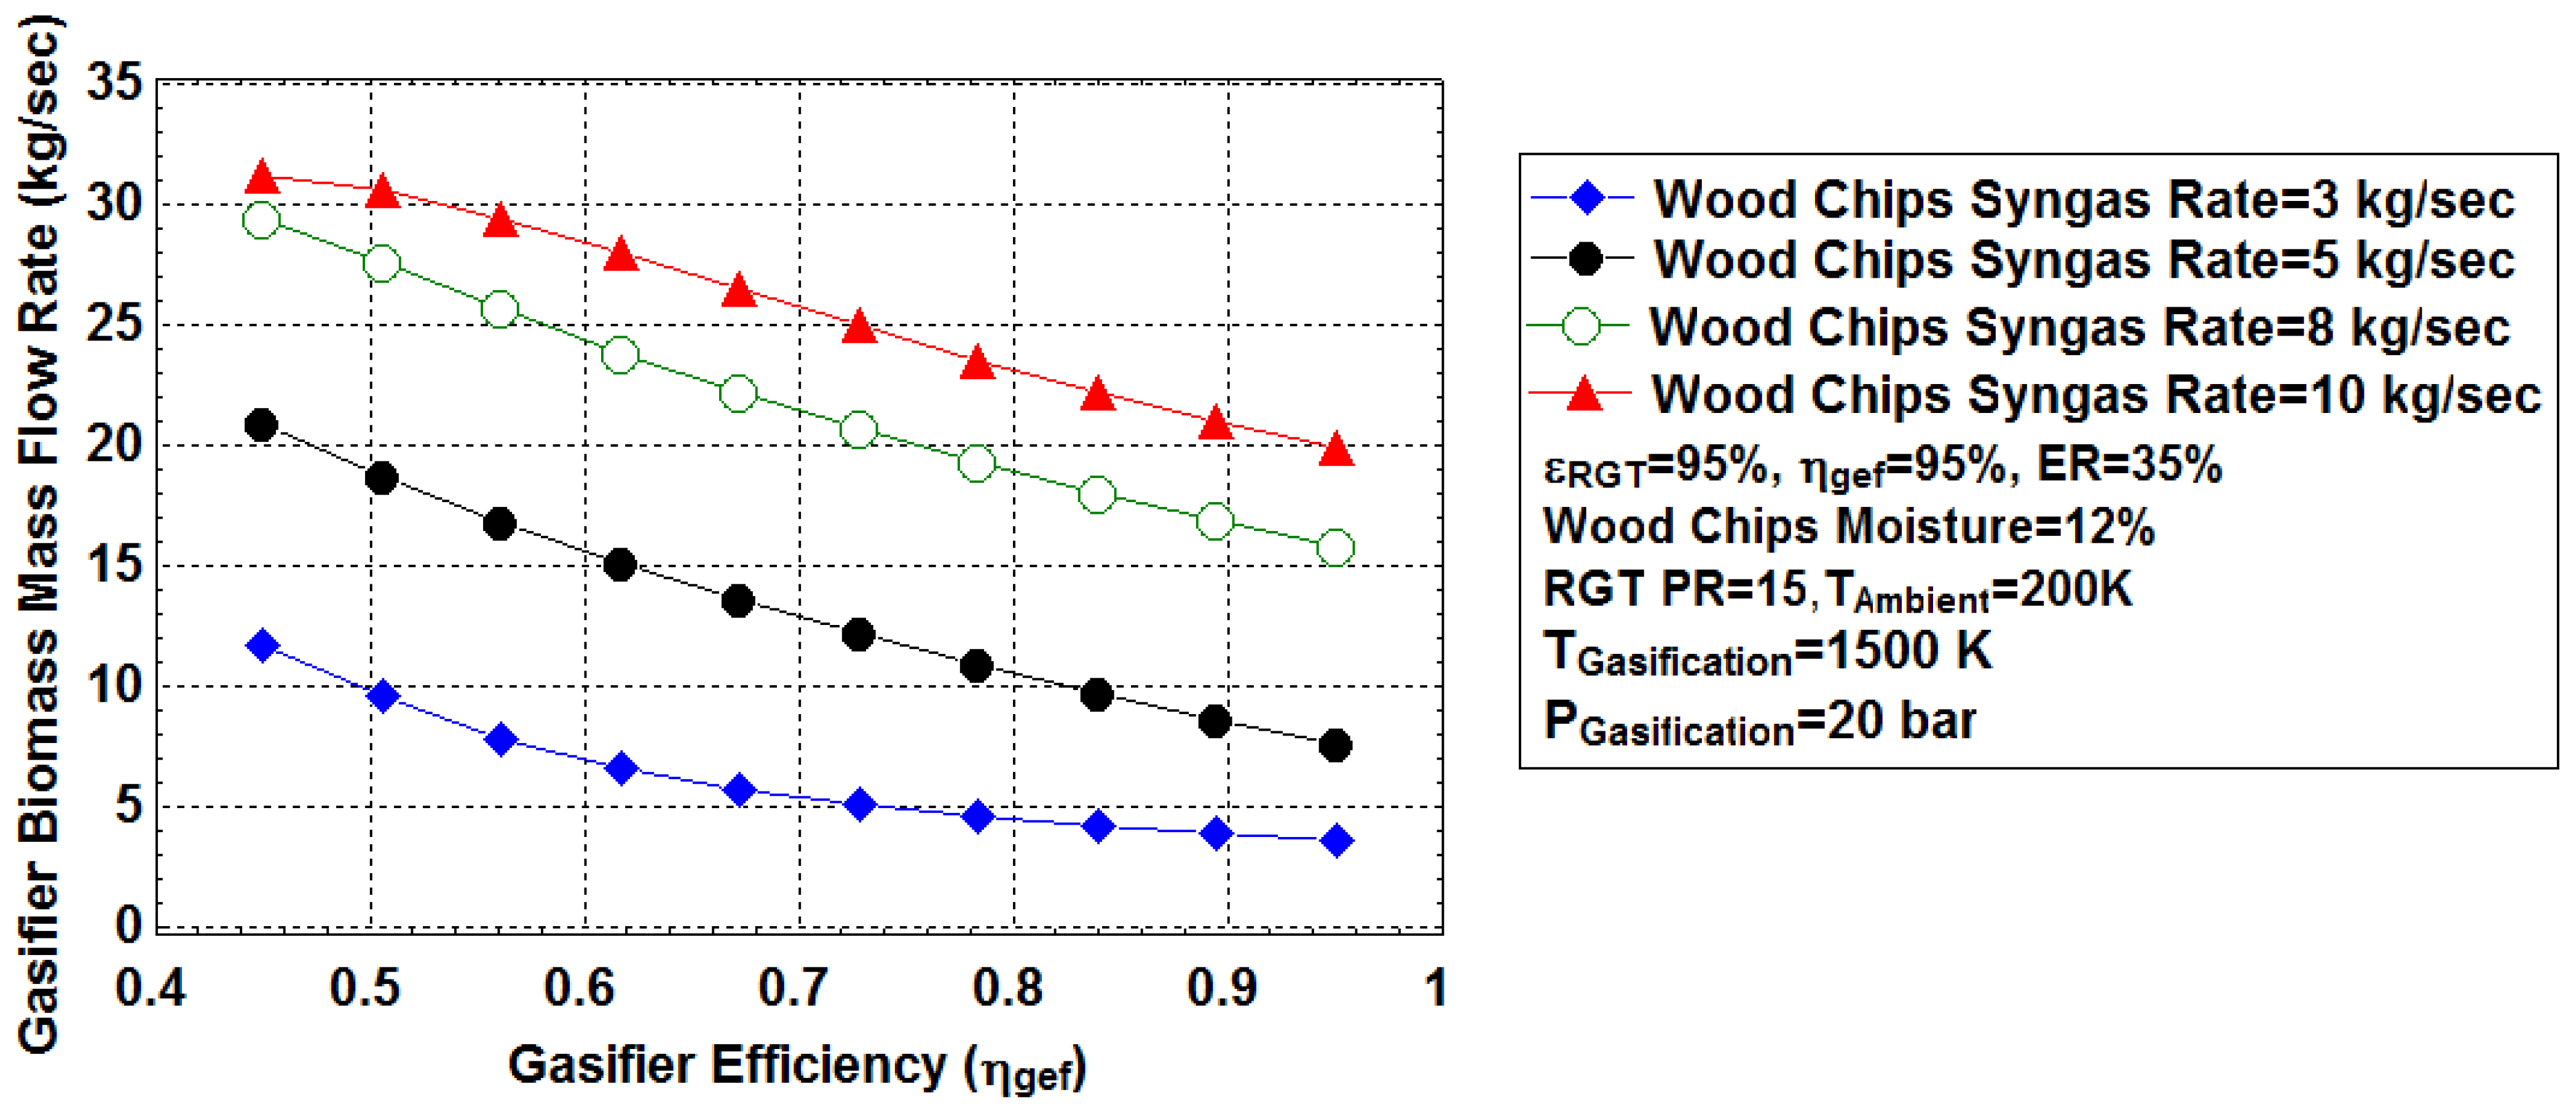
Further reduction in the gasification’s air amid increasing the biomass moisture content will diminish the gasification process and produce an unqualified syngas final product. In addition, the results demonstrate that increasing the gasification temperature has slowed down the amount of the actual air required for gasification. Literature data revealed that, as the initial moisture content increases, the gasification temperature slows down due to changes in the syngas composition and the effect of the water–gas shift, Boudouard, and combustion reactions [69,70,71]. Moreover, the influence of the gasification pressure resulted in an increase in the amount of the actual air required for gasification (see Figure 8) since the biomass flow rate is higher at a higher gasification pressure. With air used as a gasification medium, it was observed that the increase in the gasification pressure led to an acceleration of the reaction rate and the product’s conversion of the gasification reactions. Figure 9 shows the influence of the gasifier efficiency on the biomass flow rate for the gasification process. At different syngas rates (3–10 kg/s), an optimum ER of 35%, gasification temperature of 1500 K, pressure of 20 bar, and moisture content of 12%, the results predicted that the Acacia Nilotica Wood Chip biomass flow rate required for a complete gasification process decreases amid increases in gasifier efficiency. In addition, the demand for a higher biomass flow rate is attained at higher Wood Chip syngas rates. The irreversibilities of the gasifier are attributed to various factors during the gasification process, such as the quantity of the biomass flow rate, friction losses, pressure drops, releases of the high amount of gases, water corrosion, scale formation, the fusion of metals, tar and char formations, etc. In addition, results show that there is an optimum gasifier efficiency, in which the assigned biomass flow rate should be identified to minimize the possible source of irreversibilities at the gasification process.
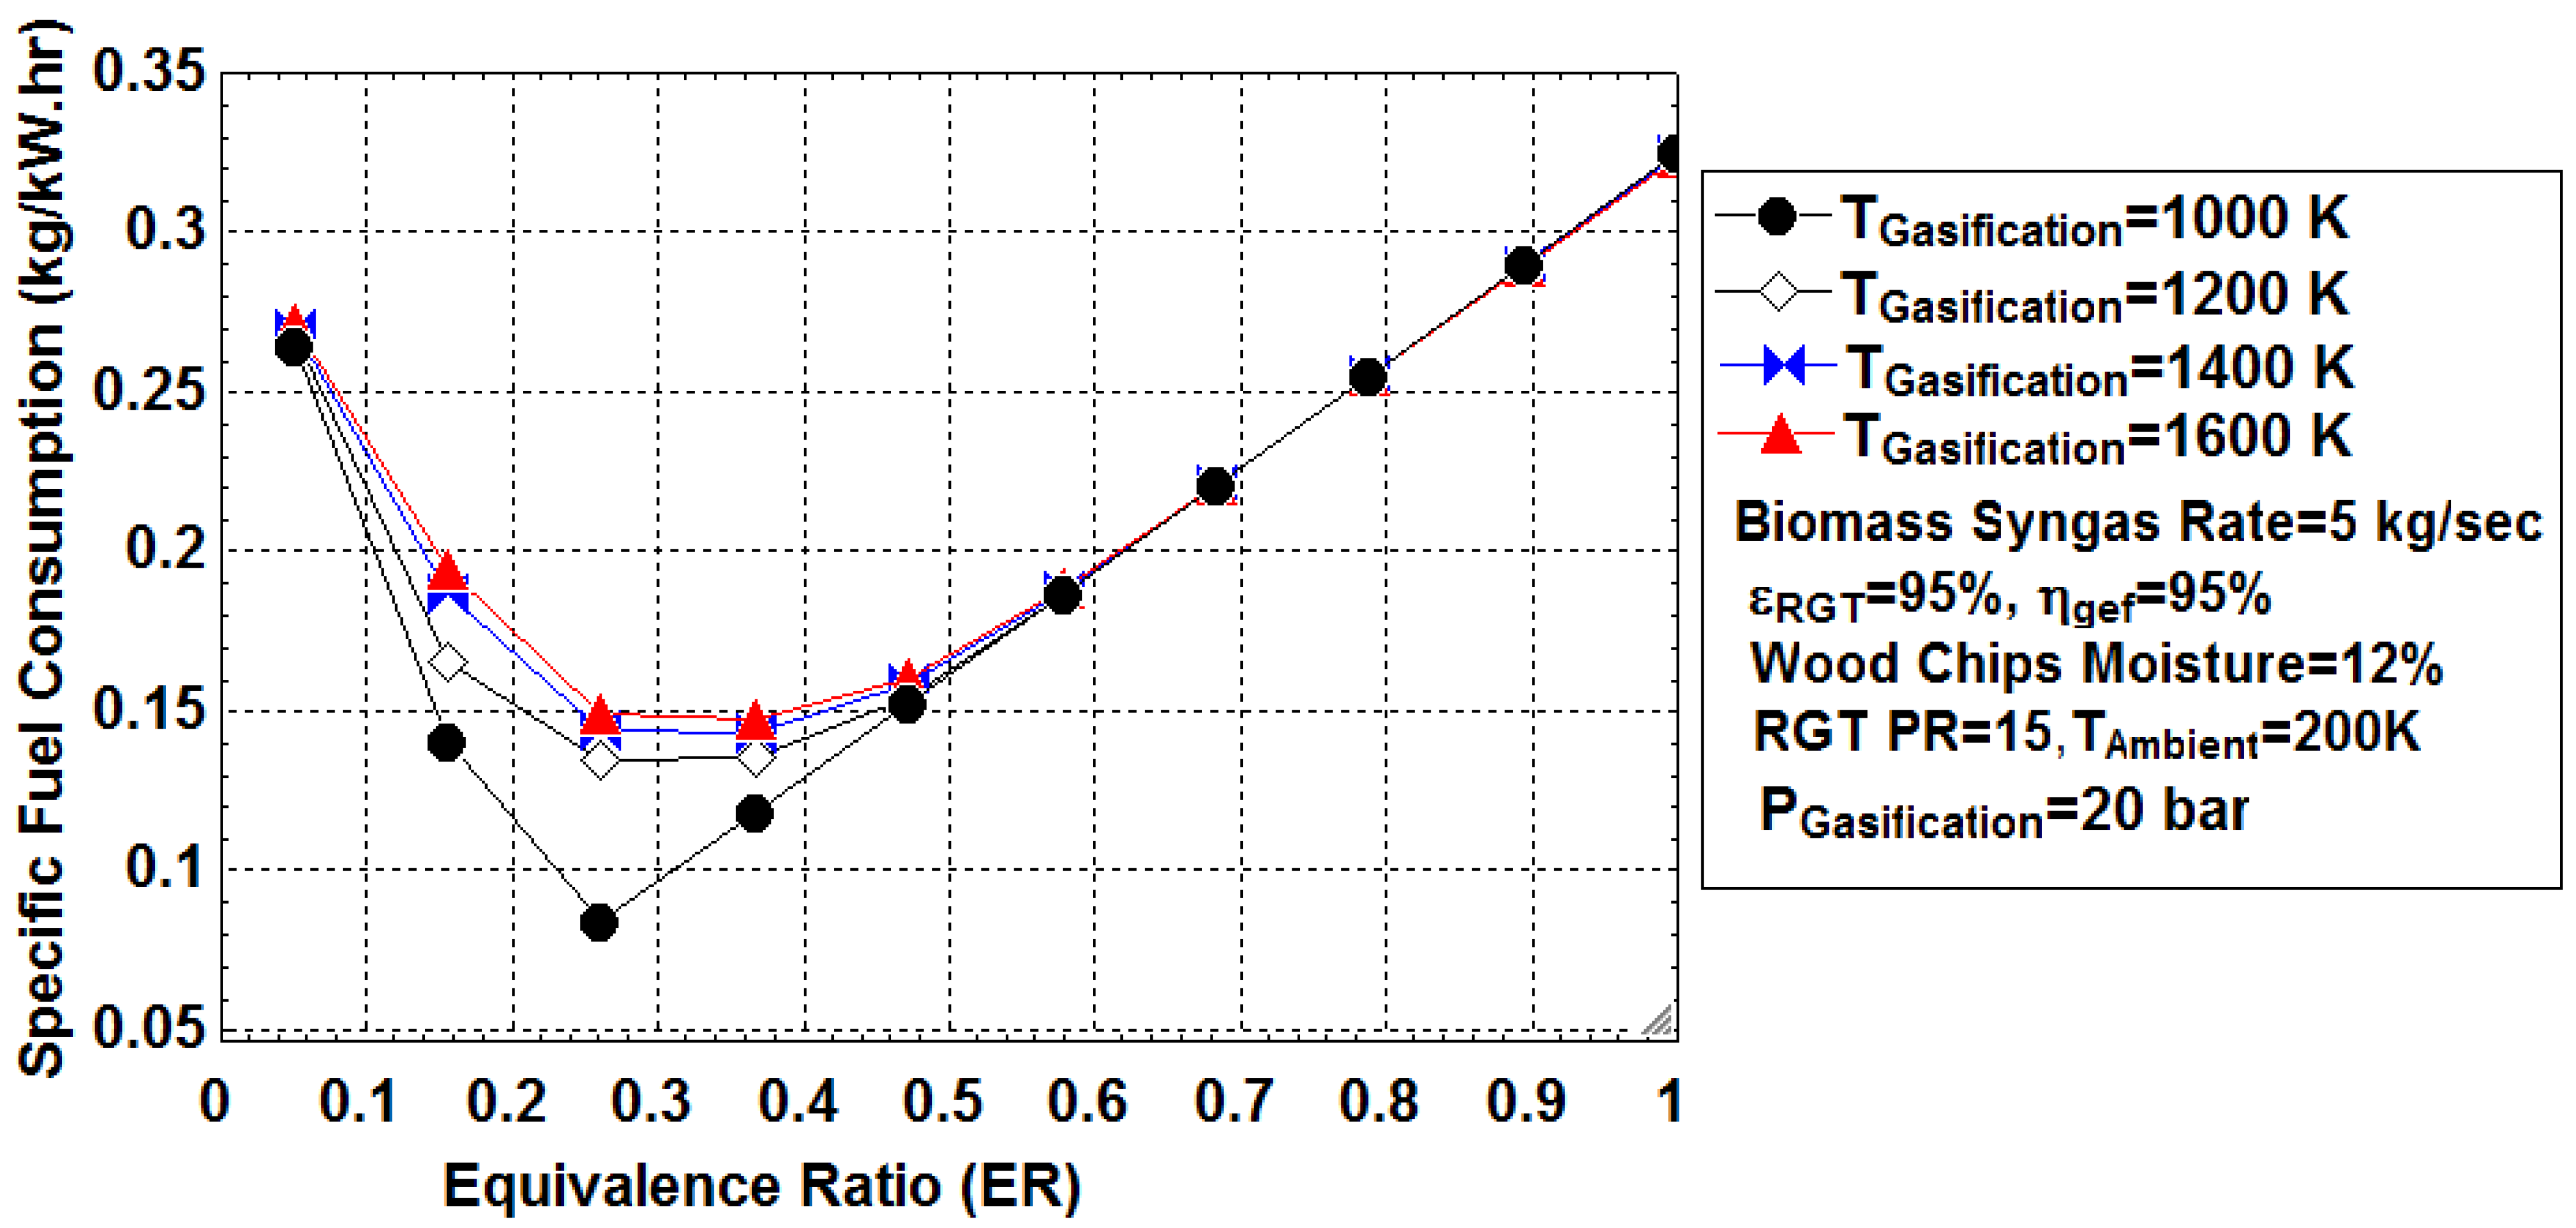
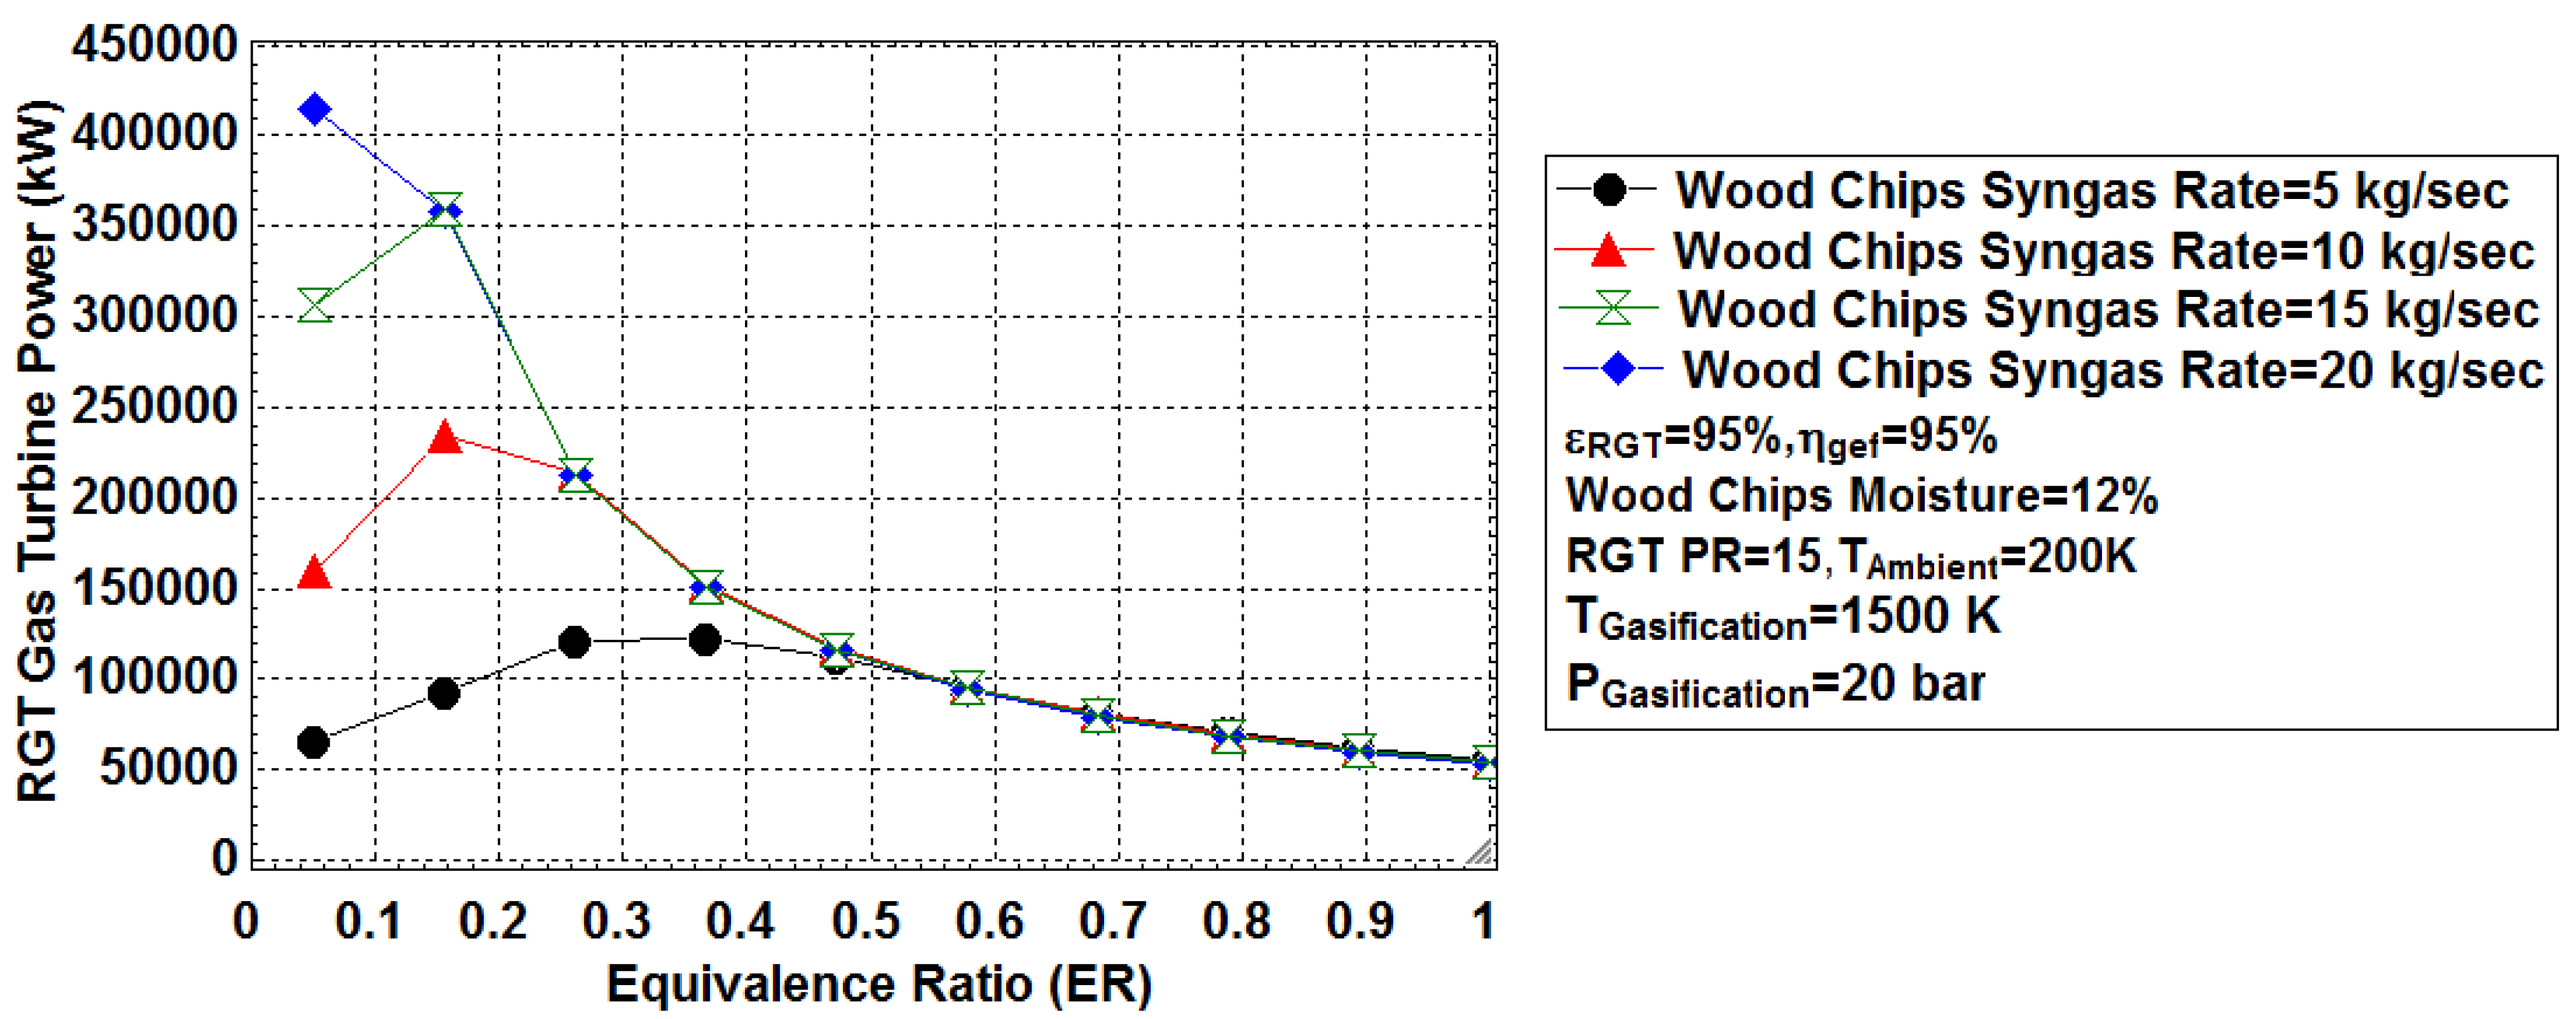
As plotted in Figure 10, at different gasification temperatures (1000–1600 K), pressure of 20 bar, biomass moisture content of 12%, and syngas rate of 5 kg/s, the ER shows a significant impact on the specific fuel consumption (SFC) of the RGT power plant. With ER growth at lower levels, the specific fuel consumption (SFC) of the RGT Unit sharply declines from the maximum value of 0.27 kg/kW·hr at an ER of 5% to the minimum value of 0.80 kg/kW·hr at an ER of 25% for the lowest gasification temperature of 1000 K. The results show that there is an optimum ER for each gasification temperature that ensures minimizing the SFC of the RGT power plant. Beyond the optimum ER, the trends predicted an inflection point, which exhibited an increase in the SFC. This is attributed to the excess amount of air released, resulting in more combustion reactions, changing the syngas composition, and slowing down the syngas’ lower heating value. The SFC of the RGT power plant reached 0.30 kg/kW·h at the higher ER of 95%. In addition, the results show that the SFC remains low at lower gasification temperatures. The influence of the ER on the RGT power plant at different syngas rates is shown in Figure 11. The simulation model revealed that ER growths at lower levels significantly affect the RGT power. The optimum ER delivered the highest RGT power, after which the syngas composition and combustion reaction will diminish the power due to a decrease in the LHV of the syngas fuel. At an ER of 5%, maximum power of 400 MW is reached at Acacia Nilotica Wood Chips’ syngas rate of 20 kg/s, whereas minimum power is reached at 50 MW for a syngas rate of 5 kg/s.
5. Conclusions
This work reviewed and investigated the integration of the Biomass Gasifier Unit with a Regenerative Gas Turbine power plant, including the effect of various parameters. Simulation models were used to characterize the gasification process of Acacia Nilotica Wood Chip biomass in Sudan. This type of biomass (Acacia Nilotica Wood) is of great interest due to its wide domestic uses and agricultural lands. A parametric analysis of the released syngas composition, actual gasifier air, temperature, pressure, LHV, moisture content, equivalence ratio, gasifier efficiency, thermal efficiency, power, and specific fuel consumption of the regenerative gas turbine power plant was carefully investigated to identify the optimal design points of the gasifier system and the working conditions of the RGT power unit using this type of biomass. With an average syngas LHV of 30,000 MJ/kg, the results revealed that such a type of biomass (Acacia Nilotica Wood Chips) could achieve high thermal efficiency and a valuable energy-saving process with the Regenerative Gas Turbine Unit.
Author Contributions
Conceptualization, M.E.A. and S.R.N.; methodology, M.E.A.; software, S.A.A.T.; validation, S.A.A.; formal analysis, M.E.A.; investigation, S.A.A.; resources, W.-H.C.; data curation, S.A.A.; writing—original draft preparation, M.E.A.; writing—review and editing, W.-H.C.; visualization, S.A.A.T.; supervision, S.R.N.; project administration, W.-H.C.; funding acquisition, W.-H.C. All authors have read and agreed to the published version of the manuscript.
Funding
This research was funded by IsdB-TWAS, grant number “506798/2019” under the scheme of the Postdoctoral Fellowship Program.
Institutional Review Board Statement
Not applicable.
Informed Consent Statement
Not applicable.
Data Availability Statement
The data used to support the findings of this study are included within the article.
Acknowledgments
The authors greatly acknowledge the technical support of the Chemical Engineering Department and the Energy Research Centre of the University of Khartoum, Faculty of Engineering, for providing the laboratory and facilitating the work. The financial, technical, and academic supervisions of the World Academy of Science (TWAS) and the Islamic Development Bank (IsDB) under the scheme of the Postdoctoral Fellowship program at the National University of Sciences & Technology, Pakistan, are greatly appreciated. The authors also acknowledge the financial support of the Ministry of Science and Technology, Taiwan, under the grant numbers MOST 109-2221-E-006-040-MY3, MOST 110-2622-E-006-001-CC1, and MOST 110-3116-F-006-003- for this research. This research is also supported in part by the Higher Education Sprout Project, Ministry of Education at the Headquarters of the University Advancement at National Cheng Kung University (NCKU).
Conflicts of Interest
The authors proclaimed that there is no conflict of interest for this work.
Nomenclature
| T | Temperature | (K) |
| S | Entropy | (kJ/kg·K) |
| P | Pressure | (kPa) |
| Compression Ratio | - | |
| Specific Heat Ratio | - | |
| Isentropic Compressor Efficiency | - | |
| Gasifier Efficiency | - | |
| Compressor Isentropic Temperature | (K) | |
| Specific Compressor Work | (MW) | |
| Air Mass | (kgair) | |
| Fuel Mass | (kg·fuel) | |
| Gas Mass | (kg·gas) | |
| Gasifier Stoichiometric Air Flow Rate | (kg air/kg dry fuel) | |
| CC | Combustion Chamber | - |
| ER | Equivalence Ratio | - |
| RGT | Regenerative Gas Turbine | - |
| IBG | Integrated Biomass Gasification | - |
| Mech | Mechanical | - |
| Gen | Generator | - |
| EES | Engineering Equation Solver | - |
| Combustor Inlet Temperature | (K) | |
| Combustor Pressure Drop | (bar) | |
| Combustor Efficiency | - | |
| Regenerator Effectiveness | - | |
| Turbine Shaft Work | (MW) | |
| Turbine Efficiency | - | |
| Syngas Mole Fraction | - | |
| GT Power | (MW) | |
| Heat Supplied | (kW) | |
| Heat Capacity of Air | (kJ/kg·K) | |
| Heat Capacity of Fuel | (kJ/kg·K) | |
| Heat Capacity of Flue Gas | (kJ/kg·K) | |
| Gasifier Actual Air Flow Rate | (kg air) | |
| ATM | Atmospheric | - |
| HHV | Higher Heating Value | (kJ/kg) |
| LHV | Lower HeatingValue | (kJ/kg) |
| TIT | Turbine Inlet Temperature | (K) |
| ASH | Ash Content | (wt%) |
| HR | Heat Rate | (MW) |
| SFC | Specific Fuel Consumption | (kg/kW·hr) |
References
- Mahgoub, F. Current Status of Agriculture and Future Challenges in Sudan; Nordiska Afrikainstitutet: Uppsala, Sweden, 2014. [Google Scholar]
- Naqvi, S.R.; Naqvi, M.; Taqvi, S.A.A.; Iqbal, F.; Inayat, A.; Khoja, A.H.; Mehran, M.T.; Ayoub, M.; Shahbaz, M.; Amin, N.A.S. Agro-Industrial residue gasification feasibility in captive power plants: A South-Asian case study. Energy 2021, 214, 118952. [Google Scholar] [CrossRef]
- Seitarides, T.; Athanasiou, C.; Zabaniotou, A. Modular biomass gasification-based solid oxide fuel cells (SOFC) for sustainable development. Renew. Sustain. Energy Rev. 2008, 12, 1251–1276. [Google Scholar] [CrossRef]
- Sanjay, Y.; Singh, O.; Prasad, B. Energy and exergy analysis of steam cooled reheat gas–steam combined cycle. Appl. Therm. Eng. 2007, 27, 2779–2790. [Google Scholar] [CrossRef]
- Ioannidou, O.; Zabaniotou, A. Agricultural residues as precursors for activated carbon production—A review. Renew. Sustain. Energy Rev. 2007, 11, 1966–2005. [Google Scholar] [CrossRef]
- Chandra, H.; Arora, A.; Kaushik, S.C.; Tripathi, A.; Rai, A. Thermodynamic analysis and parametric study of an intercooled–reheat closed-cycle gas turbine on the basis of a new isentropic exponent. Int. J. Sustain. Energy 2011, 30, 82–97. [Google Scholar] [CrossRef]
- Parvez, M.; Khalid, F. Thermodynamic investigation on sawdust and rice husk biomass integrated gasification for combined power and ejector cooling cycle. Curr. Altern. Energy 2017, 2, 19–26. [Google Scholar] [CrossRef]
- Rashid, T.; Taqvi, S.A.A.; Sher, F.; Rubab, S.; Thanabalan, M.; Bilal, M.; Islam, B. Enhanced lignin extraction and optimisation from oil palm biomass using neural network modelling. Fuel 2021, 293, 120485. [Google Scholar] [CrossRef]
- Beig, B.; Riaz, M.; Naqvi, S.R.; Hassan, M.; Zheng, Z.; Karimi, K.; Pugazhendhi, A.; Atabani, A.E.; Chi, N.T.L. Current challenges and innovative developments in pretreatment of lignocellulosic residues for biofuel production: A review. Fuel 2021, 287, 119670. [Google Scholar] [CrossRef]
- Shahbaz, M.; Al-Ansari, T.; Aslam, M.; Khan, Z.; Inayat, A.; Athar, M.; Naqvi, S.R.; Ahmed, M.A.; McKay, G. A state of the art review on biomass processing and conversion technologies to produce hydrogen and its recovery via membrane separation. Int. J. Hydrog. Energy 2020, 45, 15166–15195. [Google Scholar] [CrossRef]
- Ibrahim, T.K.; Rahman, M. Thermal impact of operating conditions on the performance of a combined cycle gas turbine. J. Appl. Res. Technol. 2012, 10, 567–577. [Google Scholar] [CrossRef]
- Littlewood, K. Gasification: Theory and application. Prog. Energy Combust. Sci. 1977, 3, 35–71. [Google Scholar] [CrossRef]
- Naqvi, S.R.; Taqvi, S.A.A.; Mehran, T.; Khoja, A.H.; Naqvi, M.; Bokhari, A.; Amin, N.A.S. Catalytic pyrolysis of biomass using shape-selective zeolites for bio-oil enhancement. In Bioenergy Resources and Technologies; Elsevier: Amsterdam, The Netherlands, 2021; pp. 39–60. [Google Scholar]
- French, R.; Czernik, S. Catalytic pyrolysis of biomass for biofuels production. Fuel Process. Technol. 2010, 91, 25–32. [Google Scholar] [CrossRef]
- Garcia-Perez, M.; Wang, X.S.; Shen, J.; Rhodes, M.J.; Tian, F.; Lee, W.J.; Wu, H.; Li, C.-Z. Fast pyrolysis of oil mallee woody biomass: Effect of temperature on the yield and quality of pyrolysis products. Ind. Eng. Chem. Res. 2008, 47, 1846–1854. [Google Scholar] [CrossRef]
- Elliott, C.D.; Neuenschwander, G.G.; Hart, T.R. Hydroprocessing bio-oil and products separation for coke production. Acs Sustain. Chem. Eng. 2013, 1, 389–392. [Google Scholar] [CrossRef]
- Basu, P. Biomass Gasification and Pyrolysis: Practical Design and Theory; Academic Press: Cambridge, MA, USA, 2010. [Google Scholar]
- Kollmann, F.F.; Côté, W.A., Jr. Principles of Wood Science and Technology. Volume I Solid Wood; Springer: Cham, Switzerland, 1968. [Google Scholar]
- Naqvi, S.R.; Tariq, R.; Hameed, Z.; Ali, I.; Naqvi, M.; Chen, W.-H.; Ceylan, S.; Rashid, H.; Ahmad, J.; Taqvi, S.A.; et al. Pyrolysis of high ash sewage sludge: Kinetics and thermodynamic analysis using Coats-Redfern method. Renew. Energy 2019, 131, 854–860. [Google Scholar] [CrossRef]
- Naqvi, S.R.; Jamshaid, S.; Naqvi, M.; Farooq, W.; Niazi, M.B.K.; Aman, Z.; Zubair, M.; Ali, M.; Shahbaz, M.; Inayat, A.; et al. Potential of biomass for bioenergy in Pakistan based on present case and future perspectives. Renew. Sustain. Energy Rev. 2018, 81, 1247–1258. [Google Scholar] [CrossRef] [Green Version]
- Naqvi, S.R.; Hameed, Z.; Tariq, R.; Taqvi, S.A.; Ali, I.; Niazi, M.B.K.; Noor, T.; Hussain, A.; Iqbal, N.; Shahbaz, M. Synergistic effect on co-pyrolysis of rice husk and sewage sludge by thermal behavior, kinetics, thermodynamic parameters and artificial neural network. Waste Manag. 2019, 85, 131–140. [Google Scholar] [CrossRef]
- Khanmohammadi., S.; Atashkari, K.; Kamali, R.K. Performance assessment and multi-objective optimization of a trrigeneration system with a modified biomass gasification model. Modares Mech. Eng. 2015, 15, 209–222. [Google Scholar]
- Hoque, M.E.; Rashid, F. Gasification Process Using Downdraft Fixed-Bed Gasifier for Different Feedstock. In Gasification; IntechOpen: London, UK, 2021. [Google Scholar]
- Kumar, R.M.D.; Anand, R. Production of biofuel from biomass downdraft gasification and its applications. In Advanced Biofuels; Elsevier: Amsterdam, The Netherlands, 2019; pp. 129–151. [Google Scholar]
- Kamble, A.D.; Saxena, V.K.; Chavan, P.D.; Mendhe, V.A. Co-Gasification of coal and biomass an emerging clean energy technology: Status and prospects of development in Indian context. Int. J. Min. Sci. Technol. 2019, 29, 171–186. [Google Scholar] [CrossRef]
- Hameed, Z.; Hameed, Z.; Naqvi, S.R.; Naqvi, M.; Ali, I.; Taqvi, S.A.A.; Gao, N.; Hussain, S.A.; Hussain, S. A comprehensive review on thermal coconversion of biomass, sludge, coal, and their blends using thermogravimetric analysis. J. Chem. 2020, 2020, 5024369. [Google Scholar] [CrossRef]
- Shahbaz, M.; Taqvi, S.A.; Loy, A.C.M.; Inayat, A.; Uddin, F.; Bokhari, A.; Naqvi, S.R. Artificial neural network approach for the steam gasification of palm oil waste using bottom ash and CaO. Renew. Energy 2019, 132, 243–254. [Google Scholar] [CrossRef]
- Dayton, D. Review of the Literature on Catalytic Biomass Tar Destruction: Milestone Completion Report; National Renewable Energy Laboratory: Golden, CO, USA, 2002. [Google Scholar]
- Knoef, H. Inventory of Biomass Gasifier Manufacturers and Installations, Final Report to European Commission; Contract DIS/1734/98-NL; Biomass Technology Group BV, University of Twente: Enschede, The Netherlands, 2000. [Google Scholar]
- Saxena, A.N.; Panwar, A.; Mishra, S.; Shukla, A.K.; Sahu, M.K. Parametric Investigation of Basic and Evaporative Inlet Air-Cooled Gas Turbine Cycle. In Advances in Engineering Design; Springer: Singapore, 2021; pp. 751–768. [Google Scholar]
- Mohapatra, A.K.; Sanjay, L.P. Parametric analysis of cooled gas turbine cycle with evaporative inlet air cooling. Int. J. Sci. Eng. Res. 2012, 3, h-2012. [Google Scholar]
- Farouk, N.; Sheng, L. Effect of Fuel Types on the Performance of Gas Turbines. Int. J. Comput. Sci. Issues (IJCSI) 2013, 10, 436. [Google Scholar]
- Mohapatra, A.K. Thermodynamic assessment of impact of inlet air cooling techniques on gas turbine and combined cycle performance. Energy 2014, 68, 191–203. [Google Scholar] [CrossRef]
- ISO. Natural Gas–Calculation of Calorific Values, Density, Relative Density and Wobbe Index from Composition; ISO: Geneve, Switzerland, 2005. [Google Scholar]
- Nag, P. Engineering Thermodynamics; Tata McGraw-Hill Education: New York, NY, USA, 2013. [Google Scholar]
- Naqvi, S.R.; Tariq, R.; Hameed, Z.; Ali, I.; Taqvi, S.A.; Naqvi, M.; Niazi, M.B.K.; Noor, T.; Farooq, W. Pyrolysis of high-ash sewage sludge: Thermo-kinetic study using TGA and artificial neural networks. Fuel 2018, 233, 529–538. [Google Scholar] [CrossRef]
- Rahman, M.; Ibrahim, T.K.; Kadirgama, K.; Mamat, R.; Bakar, R.A. Influence of operation conditions and ambient temperature on performance of gas turbine power plant. In Advanced Materials Research; Trans Tech Publications: Zurich, Switzerland, 2011. [Google Scholar]
- Gill, P.W.; Smith, J.H. Fundamentals of Internal Combustion Engines; Oxford and IBH Publishing Company: Delhi, India, 1972. [Google Scholar]
- Taylor, C.F. The Internal-Combustion Engine in Theory and Practice: Combustion, Fuels, Materials, Design; MIT Press: Cambridge, MA, USA, 1985; Volume 2. [Google Scholar]
- Johnke, T.; Mast, M. Power boosters—Technologies to enhance gas turbine power output on demand. Siemens Power Gener. Siemens Power J. 2002. Available online: https://www.cleanenergy.co.th/Article%20Boosting%20GT%20PowerN.html (accessed on 5 July 2021).
- Omar, H.; Kamel, A.; Alsanousi, M. Performance of Regenerative Gas Turbine Power Plant. Energy Power Eng. 2017, 9, 136. [Google Scholar] [CrossRef] [Green Version]
- Rh, P.; Green, D. Perry’s Chemical Engineers’ Handbook; McGraw-Hill: New York, NY, USA, 1997. [Google Scholar]
- La Villetta, M.; Costa, M.; Massarotti, N. Modelling approaches to biomass gasification: A review with emphasis on the stoichiometric method. Renew. Sustain. Energy Rev. 2017, 74, 71–88. [Google Scholar] [CrossRef]
- Ptasinski, K.J.; Prins, M.J.; Pierik, A. Exergetic evaluation of biomass gasification. Energy 2007, 32, 568–574. [Google Scholar] [CrossRef]
- Abdalla, M.E.; Pannir, S.; Hussein Ahmed, A.; Mahyob, A.; Abdalla, S.A. Regenerative Gas Turbine Power Plant: Performance & Evaluation; Purdue University: West Lafayette, IN, USA, 2021. [Google Scholar]
- Jones, R.; Goldmeer, J.; Monetti, B. Addressing Gas Turbine Fuel Flexibility; GE Energy Report GER4601 rev. B; SE Energy: Boston, MA, USA, 2011; Volume 29, p. 2012. [Google Scholar]
- Wei, L.; Xu, S.; Zhang, L.; Liu, C.; Zhu, H.; Liu, S. Steam gasification of biomass for hydrogen-rich gas in a free-fall reactor. Int. J. Hydrog. Energy 2007, 32, 24–31. [Google Scholar] [CrossRef]
- Erlich, C.; Fransson, T.H. Downdraft gasification of pellets made of wood, palm-oil residues respective bagasse: Experimental study. Appl. Energy 2011, 88, 899–908. [Google Scholar] [CrossRef]
- Saleem, M.; Ali, M.; Siddiqi, Z.; Al Qahtani, A. Preparation of activated carbon from acacia (Vachellia seyal) Tree Branches and application to treat wastewater containing methylene blue dye. Mod. Appl. Sci. 2017, 11, 102–108. [Google Scholar] [CrossRef] [Green Version]
- Khanmohammadi, S.; Atashkari, K.; Kouhikamali, R. Exergoeconomic multi-objective optimization of an externally fired gas turbine integrated with a biomass gasifier. Appl. Therm. Eng. 2015, 91, 848–859. [Google Scholar] [CrossRef]
- Karimi, M.H.; Chitgar, N.; Emadi, M.A.; Ahmadi, P.; Rosend, M.A. Performance assessment and optimization of a biomass-based solid oxide fuel cell and micro gas turbine system integrated with an organic Rankine cycle. Int. J. Hydrogen Energy 2020, 45, 6262–6277. [Google Scholar] [CrossRef]
- Javidmehr, M.; Joda, F.; Mohammadi, A. Thermodynamic and economic analyses and optimization of a multi-generation system composed by a compressed air storage, solar dish collector, micro gas turbine, organic Rankine cycle, and desalination system. Energy Convers. Manag. 2018, 168, 467–481. [Google Scholar] [CrossRef]
- Behzadi, A.; Houshfar, E.; Gholamian, E.; Ashjaee, M.; Habibollahzade, A. Multi-Criteria optimization and comparative performance analysis of a power plant fed by municipal solid waste using a gasifier or digester. Energy Convers. Manag. 2018, 171, 863–878. [Google Scholar] [CrossRef]
- Olgun, H.; Ozdogan, S.; Yinesor, G. Results with a bench scale downdraft biomass gasifier for agricultural and forestry residues. Biomass Bioenergy 2011, 35, 572–580. [Google Scholar] [CrossRef]
- Rajput, R. A Textbook of Power Plant Engineering; Laxmi Publications: New Delhi, India, 2005. [Google Scholar]
- Pode, R.; Diouf, B.; Pode, G. Sustainable rural electrification using rice husk biomass energy: A case study of Cambodia. Renew. Sustain. Energy Rev. 2015, 44, 530–542. [Google Scholar] [CrossRef]
- Moran, M.J.; Shapiro, H.N.; Boettner, D.D.; Bailey, M.B. Fundamentals of Engineering Thermodynamics; John Wiley & Sons: Hoboke, NJ, USA, 2010. [Google Scholar]
- Rahman, M.; Ibrahim, T.K.; Abdalla, A.N. Thermodynamic performance analysis of gas-turbine power-plant. Int. J. Phys. Sci. 2011, 6, 3539–3550. [Google Scholar]
- Saravanamuttoo, H.I.; Rogers, G.F.C.; Cohen, H. Gas Turbine Theory; Pearson Education: London, UK, 2009. [Google Scholar]
- Shi, H.; Si, W.; Li, X. The concept, design and performance of a novel rotary kiln type air-staged biomass gasifier. Energies 2016, 9, 67. [Google Scholar] [CrossRef] [Green Version]
- Alauddin, Z.A.Z. Performance and Characteristics of a Biomass Gasifier System. Ph.D. Thesis, University of Wales, Cardiff, UK, 1996. [Google Scholar]
- McKendry, P. Energy production from biomass (part 3): Gasification technologies. Bioresour. Technol. 2002, 83, 55–63. [Google Scholar] [CrossRef]
- Bridgwater, A.V. Progress in Thermochemical Biomass Conversion; John Wiley & Sons: Hoboke, NJ, USA, 2008. [Google Scholar]
- Kirsanovs, V.; Blumberga, D.; Veidenbergs, I.; Rochas, C.; Vigants, E.; Vigants, G. Experimental investigation of downdraft gasifier at various conditions. Energy Procedia 2017, 128, 332–338. [Google Scholar] [CrossRef]
- Taba, L.E.; Irfan, M.F.; Wan Daud, W.A.M.; Chakrabarti, M.H. The effect of temperature on various parameters in coal, biomass and CO-gasification: A review. Renew. Sustain. Energy Rev. 2012, 16, 5584–5596. [Google Scholar] [CrossRef]
- El-Emam, R.S.; Dincer, I. Thermal modeling and efficiency assessment of an integrated biomass gasification and solid oxide fuel cell system. Int. J. Hydrogen Energy 2015, 40, 7694–7706. [Google Scholar] [CrossRef]
- Zhang, X.; Li, H.; Liu, L.; Bai, C.; Wang, S.; Zeng, J.; Liu, X.; Li, N.; Zhang, G. Thermodynamic and economic analysis of biomass partial gasification process. Appl. Therm. Eng. 2018, 129, 410–420. [Google Scholar] [CrossRef]
- Jarungthammachote, S.; Dutta, A. Thermodynamic equilibrium model and second law analysis of a downdraft waste gasifier. Energy 2007, 32, 1660–1669. [Google Scholar] [CrossRef]
- Das, B.K.; Hoque, S. Assessment of the potential of biomass gasification for electricity generation in Bangladesh. J. Renew. Energy 2014, 2014, 429518. [Google Scholar] [CrossRef] [Green Version]
- Chen, W.-H.; Chen, C.-J.; Hung, C.-I.; Shen, C.-H.; Hsu, H.-W. A comparison of gasification phenomena among raw biomass, torrefied biomass and coal in an entrained-flow reactor. Appl. Energy 2013, 112, 421–430. [Google Scholar] [CrossRef]
- Arpia, A.A.; Nguyen, T.-B.; Chen, W.-C.; Dong, C.-D.; Ok, Y.S. Microwave-assisted gasification of biomass for sustainable and energy-efficient biohydrogen and biosyngas production: A state-of-the-art review. Chemosphere 2022, 287, 132014. [Google Scholar] [CrossRef] [PubMed]
Figure 1.
The regenerative gas turbine cycle integrated with the Biomass Gasifier Unit.

Figure 2.
Variation of the equivalence ratio with gasifier’s biomass mass flow rate at different Wood Chip syngas rates.
Figure 2.
Variation of the equivalence ratio with gasifier’s biomass mass flow rate at different Wood Chip syngas rates.

Figure 3.
Variation of biomass moisture content with RGT thermal efficiency at different gasification pressures.
Figure 3.
Variation of biomass moisture content with RGT thermal efficiency at different gasification pressures.

Figure 4.
Equivalence ratio versus syngas lower heating value at different Wood Chip syngas rates.

Figure 5.
Effect of the equivalence ratio on the RGT thermal efficiency for different gasification temperatures.
Figure 5.
Effect of the equivalence ratio on the RGT thermal efficiency for different gasification temperatures.

Figure 6.
Influence of rquivalence ratio on the composition of the syngas.

Figure 7.
Effect of biomass moisture content on the gasifier’s airflow rate at different gasification temperatures.
Figure 7.
Effect of biomass moisture content on the gasifier’s airflow rate at different gasification temperatures.

Figure 8.
Variation of biomass moisture content with the gasifier’s airflow rate at different gasification pressures.
Figure 8.
Variation of biomass moisture content with the gasifier’s airflow rate at different gasification pressures.

Figure 9.
Variation of gasifier efficiency with biomass flow rate at different Wood Chip syngas rates.
Figure 9.
Variation of gasifier efficiency with biomass flow rate at different Wood Chip syngas rates.

Figure 10.
Variation of equivalence ratio with the specific fuel consumption at different gasification temperatures.
Figure 10.
Variation of equivalence ratio with the specific fuel consumption at different gasification temperatures.

Figure 11.
Effect of the rquivalence ratio on the RGT Power at different Wood Chip syngas rates.


Table 1.
Ultimate and proximate analysis of Acacia Nilotica Wood Chips.
| Proximate Analysis (wt%) | Ultimate Analysis (wt%) | Lower Value of Heat (kJ/kg) | |||||||
|---|---|---|---|---|---|---|---|---|---|
| Water | Ash | Volatile | Fixed Carbon | C | H | O | N | S | |
| 37.88 | 1.43 | 68.49 | 30.08 | 48 | 6 | 44 | 0.40 | - | 19,094.94 |
Publisher’s Note: MDPI stays neutral with regard to jurisdictional claims in published maps and institutional affiliations. |
© 2022 by the authors. Licensee MDPI, Basel, Switzerland. This article is an open access article distributed under the terms and conditions of the Creative Commons Attribution (CC BY) license (https://creativecommons.org/licenses/by/4.0/).
Share and Cite
MDPI and ACS Style
Abdalla, M.E.; Abdalla, S.A.; Taqvi, S.A.A.; Naqvi, S.R.; Chen, W.-H. Investigation of Biomass Integrated Air Gasification Regenerative Gas Turbine Power Plants. Energies 2022, 15, 741. https://doi.org/10.3390/en15030741
AMA Style
Abdalla ME, Abdalla SA, Taqvi SAA, Naqvi SR, Chen W-H. Investigation of Biomass Integrated Air Gasification Regenerative Gas Turbine Power Plants. Energies. 2022; 15(3):741. https://doi.org/10.3390/en15030741
Chicago/Turabian StyleAbdalla, Momin Elhadi, Salah Ahmed Abdalla, Syed Ali Ammar Taqvi, Salman Raza Naqvi, and Wei-Hsin Chen. 2022. "Investigation of Biomass Integrated Air Gasification Regenerative Gas Turbine Power Plants" Energies 15, no. 3: 741. https://doi.org/10.3390/en15030741
Note that from the first issue of 2016, this journal uses article numbers instead of page numbers. See further details here.