Article

Evaluation of the Effect of Chassis Dynamometer Load Setting on CO2 Emissions and Energy Demand of a Full Hybrid Vehicle

1
Faculty of Mechanical Engineering and Aeronautics, Rzeszow University of Technology, 35-959 Rzeszow, Poland
2
Faculty of Engineering and Architecture, Kore University of Enna, Cittadella Universitaria, 94100 Enna, Italy
*
Author to whom correspondence should be addressed.
Energies 2022, 15(1), 122; https://doi.org/10.3390/en15010122
Submission received: 22 November 2021 / Revised: 19 December 2021 / Accepted: 21 December 2021 / Published: 24 December 2021
(This article belongs to the Special Issue CO2 Emissions from Vehicles)

Abstract

:
Among the solutions that make it possible to reduce CO2 emissions in the transport sector, particularly in urban traffic conditions, are hybrid vehicles. The share of driving performed in electric mode for hybrid vehicles is highly dependent on motion resistance. There are different methods for determining the motion resistance function during chassis dynamometer testing, leading to different test results. Therefore, the main objective of this study was to determine the effect of the chassis dynamometer load function on the energy demand and CO2 emissions of a full-hybrid passenger car. Emissions tests according to the New European Driving Cycle (NEDC) were carried out on a chassis dynamometer for three different methods of determining the car’s resistance to motion. The study showed that adopting the motion resistance function according to different methods, results in differences in CO2 emissions up to about 35% for the entire cycle. Therefore, the authors suggest that in the case of tests carried out with chassis dynamometers, it is necessary to also provide information on the chassis dynamometer loading function adopted for the tests.

Graphical Abstract

1. Introduction

The emission of pollutants in vehicle exhaust gases is a basic problem related to vehicle operation. Growing social awareness is exerting pressure on manufacturers, manifesting itself in increasingly lower limits for exhaust emissions expressed in successive editions of homologation standards. Due to the increasing problem of global warming, regulations regarding the emission of carbon dioxide (CO2) from vehicles will tend to become more stringent. The European Union is implementing several strategies to reduce vehicle emissions by 2030 and 2050; in particular, these strategies focus on reducing CO2 emissions [1]. This problem has been given high priority in the Transport White Paper [2] and more recent regulations touch on the recent European Green Deal [3].
Increasing blockades, especially of diesel cars, and the development of green strategies in the automotive sector have led to a growing interest in hybrid and electric cars [4,5]. The main reason for this is that these vehicles save on fuel costs and, additionally, because of their potentially large contribution to environmental protection [6,7].
The automotive sector in Europe is gradually evolving towards electrified power systems: a typology that includes both electric and plug-in hybrid cars, as well as full hybrids and mild hybrids. In a report by ACEA (European Automobile Manufacturers Association) on new registrations in the fourth quarter of 2020, the incidence of electric and plug-in hybrid cars within Europe was found to have reached a market share of 16.5% [8].
The energy demand of internal combustion engine vehicles is directly related to their fuel consumption and, therefore, also to CO2 emissions [9,10]. However, previous studies [11] indicate that there are discrepancies between certification test results and actual road test results [12,13]. This issue is, among other factors, due to the use of different methods for determining the load of chassis dynamometers, which lead to such discrepancies [14].
In the case of hybrid cars, it is possible to reduce fuel consumption and emissions of pollutants in exhaust gases, including CO2, depending on the share of driving in electric mode. This issue was analyzed, among others, in the paper [15] with reference to plug-in hybrid cars. The authors of the study presented the relationship between the average CO2 emission using the NEDC cycle and the range in pure electric mode, which for the PHEV analyzed ranged from 200 g/km for zero range in electric mode, to 50 g/km for 75 km range in electric mode. Driving in electric mode is highly dependent on engine load, which is related to the motion resistance acting on the wheels of the vehicle. This issue, in relation to hybrid cars, is very rarely addressed in the literature; therefore, it became the main focus of this paper.
The values of the motion resistance force functions as a function of travel speed are entered into the control software of chassis dyno through coefficients determined by various methods. The dynamometer reproduces the resistances acting on the car in real conditions; thus, the most optimum method is based on road coast-down tests, which can be used to determine the values of coefficients of Equation (1) (i.e., X0, X1, and X2):
F t , p = X 0 + X 1 · v + X 2 · v 2
where:
Ft,p—The sum of rolling resistance and drag force (N);
v—Speed (km/h);
X0—Constant road load coefficient (N);
X1—First-order road load coefficient, N/(km/h);
X2—Second-order road load coefficient, N/(km/h)2.
However, the feasibility of conducting road coast-down tests on public roads, particularly at higher speeds, is very limited. Such tests require a testing ground, preferably an airport runway, which severely limits their implementation in practice. Therefore, other alternative methods to determine the resistance function’s coefficients are used for testing cars on chassis dynamometers. One potential method to address this issue is to use the coefficients of the vehicle’s drag function as specified by the manufacturer. However, access to such data is very limited; in addition, the authors of tests using this method do not usually provide information regarding the coefficients of the traffic resistance function.
Therefore, the main purpose of this study is to highlight the influence of road load factor value on the results of CO2 emission and energy consumption tests during the investigation of cars on a chassis dynamometer. Increased knowledge about the effects of chassis dynamometer loading on car emissions and energy consumption results may also allow for improved simulation models in virtual test environments [16].
This paper focuses on tests performed on a full hybrid vehicle using an AVL (Anstalt für Verbrennungskraftmaschinen List) chassis dynamometer integrated with a climate chamber. The tests were conducted for three dynamometer load settings, namely, NEDC alternative, resistance calculated and WLTP alternative (Worldwide Harmonized Light Vehicle Test Procedure).

2. Description of the Research Methodology

The tests were performed on a passenger car, whose technical data are presented in Table 1. The car’s engine was powered by commercial unleaded petrol. The bench tests were carried out in the Automotive Emissions Laboratory of the Rzeszow University of Technology, which is equipped with an AVL chassis dynamometer integrated into a climatic chamber. The measurements of gaseous emissions (CO2, CO, and total hydrocarbons, THC) were carried out using the AVL AMA i60 system.
The accuracy specifications of the AMA i60 analysers are presented in Table 2. A detailed description of the test stand can be found in [17]. The bench tests were carried out under hot start conditions, with an engine coolant temperature of 85 ± 2 °C.
Figure 1 shows a view of the vehicle on the test stand.
The tests were carried out for the New European Driving Cycle (NEDC), under ambient temperature conditions in the climate chamber (20 ± 1 °C). In this paper, tests were conducted for three dynamometer load settings, which are summarized in Table 3.
For the NEDC procedure, with the vehicle manufacturer’s consent, the so-called alternative method (NEDC alternative) may also be used, which involves determining the brake load involved in absorbing the resistance force (Fc), depending on the mass of the vehicle (1250 kg in the case of the car used in this study), by selecting values of the coefficients A0 and B0 from the Table of Regulations [18]. In this case, the motion resistance function is expressed by Formula (2):
F c = F t + F p = A 0 + B 0   · v 2   ( N )
where:
Ft—Rolling resistance force (N);
Fp—Drag force (N);
A0, B0—Coefficients of the resistance function according to the NEDC Alternative method;
v—Speed of vehicle (km/h).
For the alternative method of the default road load calculation based on vehicle parameters of the WLTP procedure (WLTP alternative), the coefficient values were calculated according to [19]. According to this procedure, the road load function coefficients X0, X2 (X1 is the first order road load coefficient and according to [19] shall be set to zero) can be determined from Formulas (3) and (4) [20]:
X o = 0.14 · m t
X 2 = 2.8 · 10 6 · m t + 0.0170 · W · H
where:
mt—Test mass (kg);
W—Width of vehicle (m);
H—Height of vehicle (m).
The value of the test mass (mt) was determined as the sum of the actual vehicle mass, a mass representative of the vehicle load and a constant mass of 25 kg, according to Equation (5) [21]:
m t = m r o + 25 + φ · m v l = m r o + 25 + 0.15 · ( m l m r o m o 25 ) .  
where:
mro—Mass in running order (kg);
mo—Mass of optional equipment (kg);
mvl—Maximum vehicle load (kg);
ml—Technically permissible maximum laden mass (kg);
φ—The percentage of the vehicle load included in the definition of the test mass, equal to 15% for M1 category vehicles (passenger cars).
In the calculation method (resistance calculated), the values of traffic resistance as a function of travel speed were determined using Equation (6):
F c = F t + F p = m · g · f 0   · ( 1 + 5 · 10 5 · v 2 ) + 0.047 · A · c x · v 2
where:
Ft—Rolling resistance force (N),
Fp—Drag force (N),
m—Weight of the car (kg),
f0—Rolling resistance coefficient for travel speeds close to zero (f0 = 0.009),
g—Acceleration due to gravity, (m/s2),
v—Speed (km/h),
A—Frontal area of the car, (m2),
cx—Aerodynamic drag coefficient in the longitudinal direction.
In addition to the Fc force, there is also an inertial drag force during acceleration that depends on the mass of the car and the value of positive acceleration. The inertia drag force is usually calculated from Formula (7):
F b = m · δ · a   ( N )
where:
δ—Rotating mass factor (δ = 1.03);
a—Acceleration, (m/s2).
The total vehicle drag force, Fo, for a horizontal road is described by Equation (8):
F o = F t + F b + F p   ( N )
where:
Ft —Rolling resistance force (N);
Fp—Drag force (N);
Fb—Inertia drag force (N).
Figure 2 illustrates the dependence of force Fc for the analysed methods as a function of travel speed.

3. Results and Discussion

The emission factor results for the analysed traffic resistance functions for the NEDC cycle are shown in Figure 3, Figure 4 and Figure 5. Figure 3 shows the obtained CO2 emission values for the urban phase (UDC), extra-urban phase (EUDC) and the entire NEDC cycle. As shown, there is a proportional relationship between traffic resistance and CO2 emissions. For the resistances adopted according to the WLTP Alternative method, the emission factor values were the highest: 127 g/km (UDC), 161 g/km (EUDC) and 149 g/km (NEDC). In contrast, the lowest CO2 emission ratio values were obtained for the NEDC Alternative method. In this case, the emission ratio value for the urban part (UDC) was 76 g/km, for the non-urban part (EUDC) 130 g/km and for the whole cycle, the average ratio was 110 g/km. The relative differences in the CO2 emission factors for these two extreme cases of traffic resistance were about 45%, 25% and 31% for the UDC, EUDC and NEDC parts, respectively. For the other analysed cases, the CO2 emission factor values were proportional to the adopted traffic resistance values.
Figure 4 and Figure 5 show the dependence of CO2 emissions as a function of time for the analysed cycles. Figure 4 shows how instantaneous CO2 emissions changed during the tests conducted using different traffic resistance functions. These figures confirm that the higher the value of motion resistance, the higher the energy demand value, which is associated with higher CO2 emissions. Different ranges of CO2 emissions, whose values were close to zero, are also shown. For these ranges, the internal combustion engine was not running. In particular, the differences between the effects of the drag functions on CO2 emissions can be seen in Figure 5, which shows the cumulative emission values during the tests. The cumulative CO2 emission values, from highest to lowest, were obtained for the dynamometer load using the WLTP alternative method, followed by the resistance calculated and NEDC alternative methods.
Figure 5 also shows the ranges where the cumulative emission values are approximately constant. This corresponds to the drive operation in electric motor mode. It can be seen that the highest proportion of these phases occurs for the NEDC Alternative method and the lowest for the WLTP Alternative. This confirms the influence of traffic resistance on the drive control of the hybrid car and the contribution of pure electric mode driving.
Based on the exhaust emissions tests, the energy consumption (EC) was calculated using the carbon balance method. The energy consumption values for petrol fuelling were determined using Equation (9) [22]:
E C = 0.1154 L H V ( 0.866 · THC + 0.429 · CO + 0.273 · CO 2 ) ( kWh 100 km )
where:
THC—Total hydrocarbon mass emission (g/km);
CO—Carbon monoxide mass emission (g/km);
CO2—Carbon dioxide mass emission (g/km);
LHV—Lower heating value of petrol (MJ/kg).
The calculated average energy consumption results during testing for the analysed traffic resistance function methods are shown in Figure 6. Similar to the CO2 emissions, the energy consumption is proportional to traffic energy intensity. For the tests undertaken, according to the motion resistance function defined by the NEDC Alternative method, the energy consumption values were 29.2, 50.1 and 42.4 kWh/100 km for the urban part, non-urban part and whole cycle, respectively. The highest values were obtained for the tests carried out with resistance determined by the WLTP Alternative method. In this case, the values of the average run-time energy consumption were 48.9 kWh/100 km for the urban part, 62.2 kWh/100km for the non-urban part and 57.3 kWh/100 km for the whole cycle.
The energy consumption is proportional to the fuel consumption of the car engine, the results of which are shown in Table 4. As with CO2, the largest differences in fuel consumption values for the analyzed methods occur for the urban phase of the UDC, which is also related to the largest differences in drag function values for lower speeds. For the entire NEDC cycle, the differences in fuel consumption values for the WLTP alternative and NEDC alternative methods were approximately 35%.
Figure 7 and Figure 8 show, respectively, the dependence of CO2 emissions on the average driving speed (Vav) and the average values of the product of speed and positive acceleration, (aV)av, for the analysed tests. The driving speed and acceleration are among the basic parameters related to the car’s resistance to motion. These figures illustrate the advantage of using a hybrid drive system, given that CO2 emissions are significantly lower at lower driving speeds (UDC phase) than the equivalent values obtained for the internal combustion engine [23], which is due to the drive-in electric mode. At higher driving speeds, the contribution of the electric drive relative to the combustion drive is low, resulting in higher CO2 emissions similar to those of conventional combustion drives. This is particularly evident in Figure 7, which shows a comparison of the average CO2 emission rates versus average travel speed for all the analysed methods. As shown, the CO2 emission values are related to the adopted drag function; these values are lowest for the NEDC alternative method at the speed range corresponding to urban traffic (0–50 km/h). For the product of speed and acceleration (Figure 8), the CO2 emission values are observed to be higher in the initial (aV)av range (up to about 1 m2/s3) than for (aV)av values between about 2 and 4 m2/s3. At low speeds but high acceleration values, there is a large drag force value related to the inertial drag; this is associated with increased energy demand, resulting in higher CO2 emissions. Similar correlations between driving speed, CO2 emissions and energy consumption have been obtained in previous studies [24]. For plug-in electric cars, it is possible to even achieve zero CO2 emissions from the vehicle in urban traffic [25]. In this case, however, it is important to consider the CO2 emissions produced during electricity generation at the power plant.
Many works present also the results of tests on combustion-engine [26] and hybrid cars [27,28], which show the differences between the values of CO2 emission for NEDC and WLTP cycles. These differences result not only from different driving cycles, but also, as confirmed by the results obtained by the authors of this paper, may be associated with different traffic resistance adopted for testing according to the NEDC and WLTC (World-wide harmonized light duty test cycle) driving cycles.

4. Conclusions

Based on the findings of this study, the following key conclusions can be drawn:
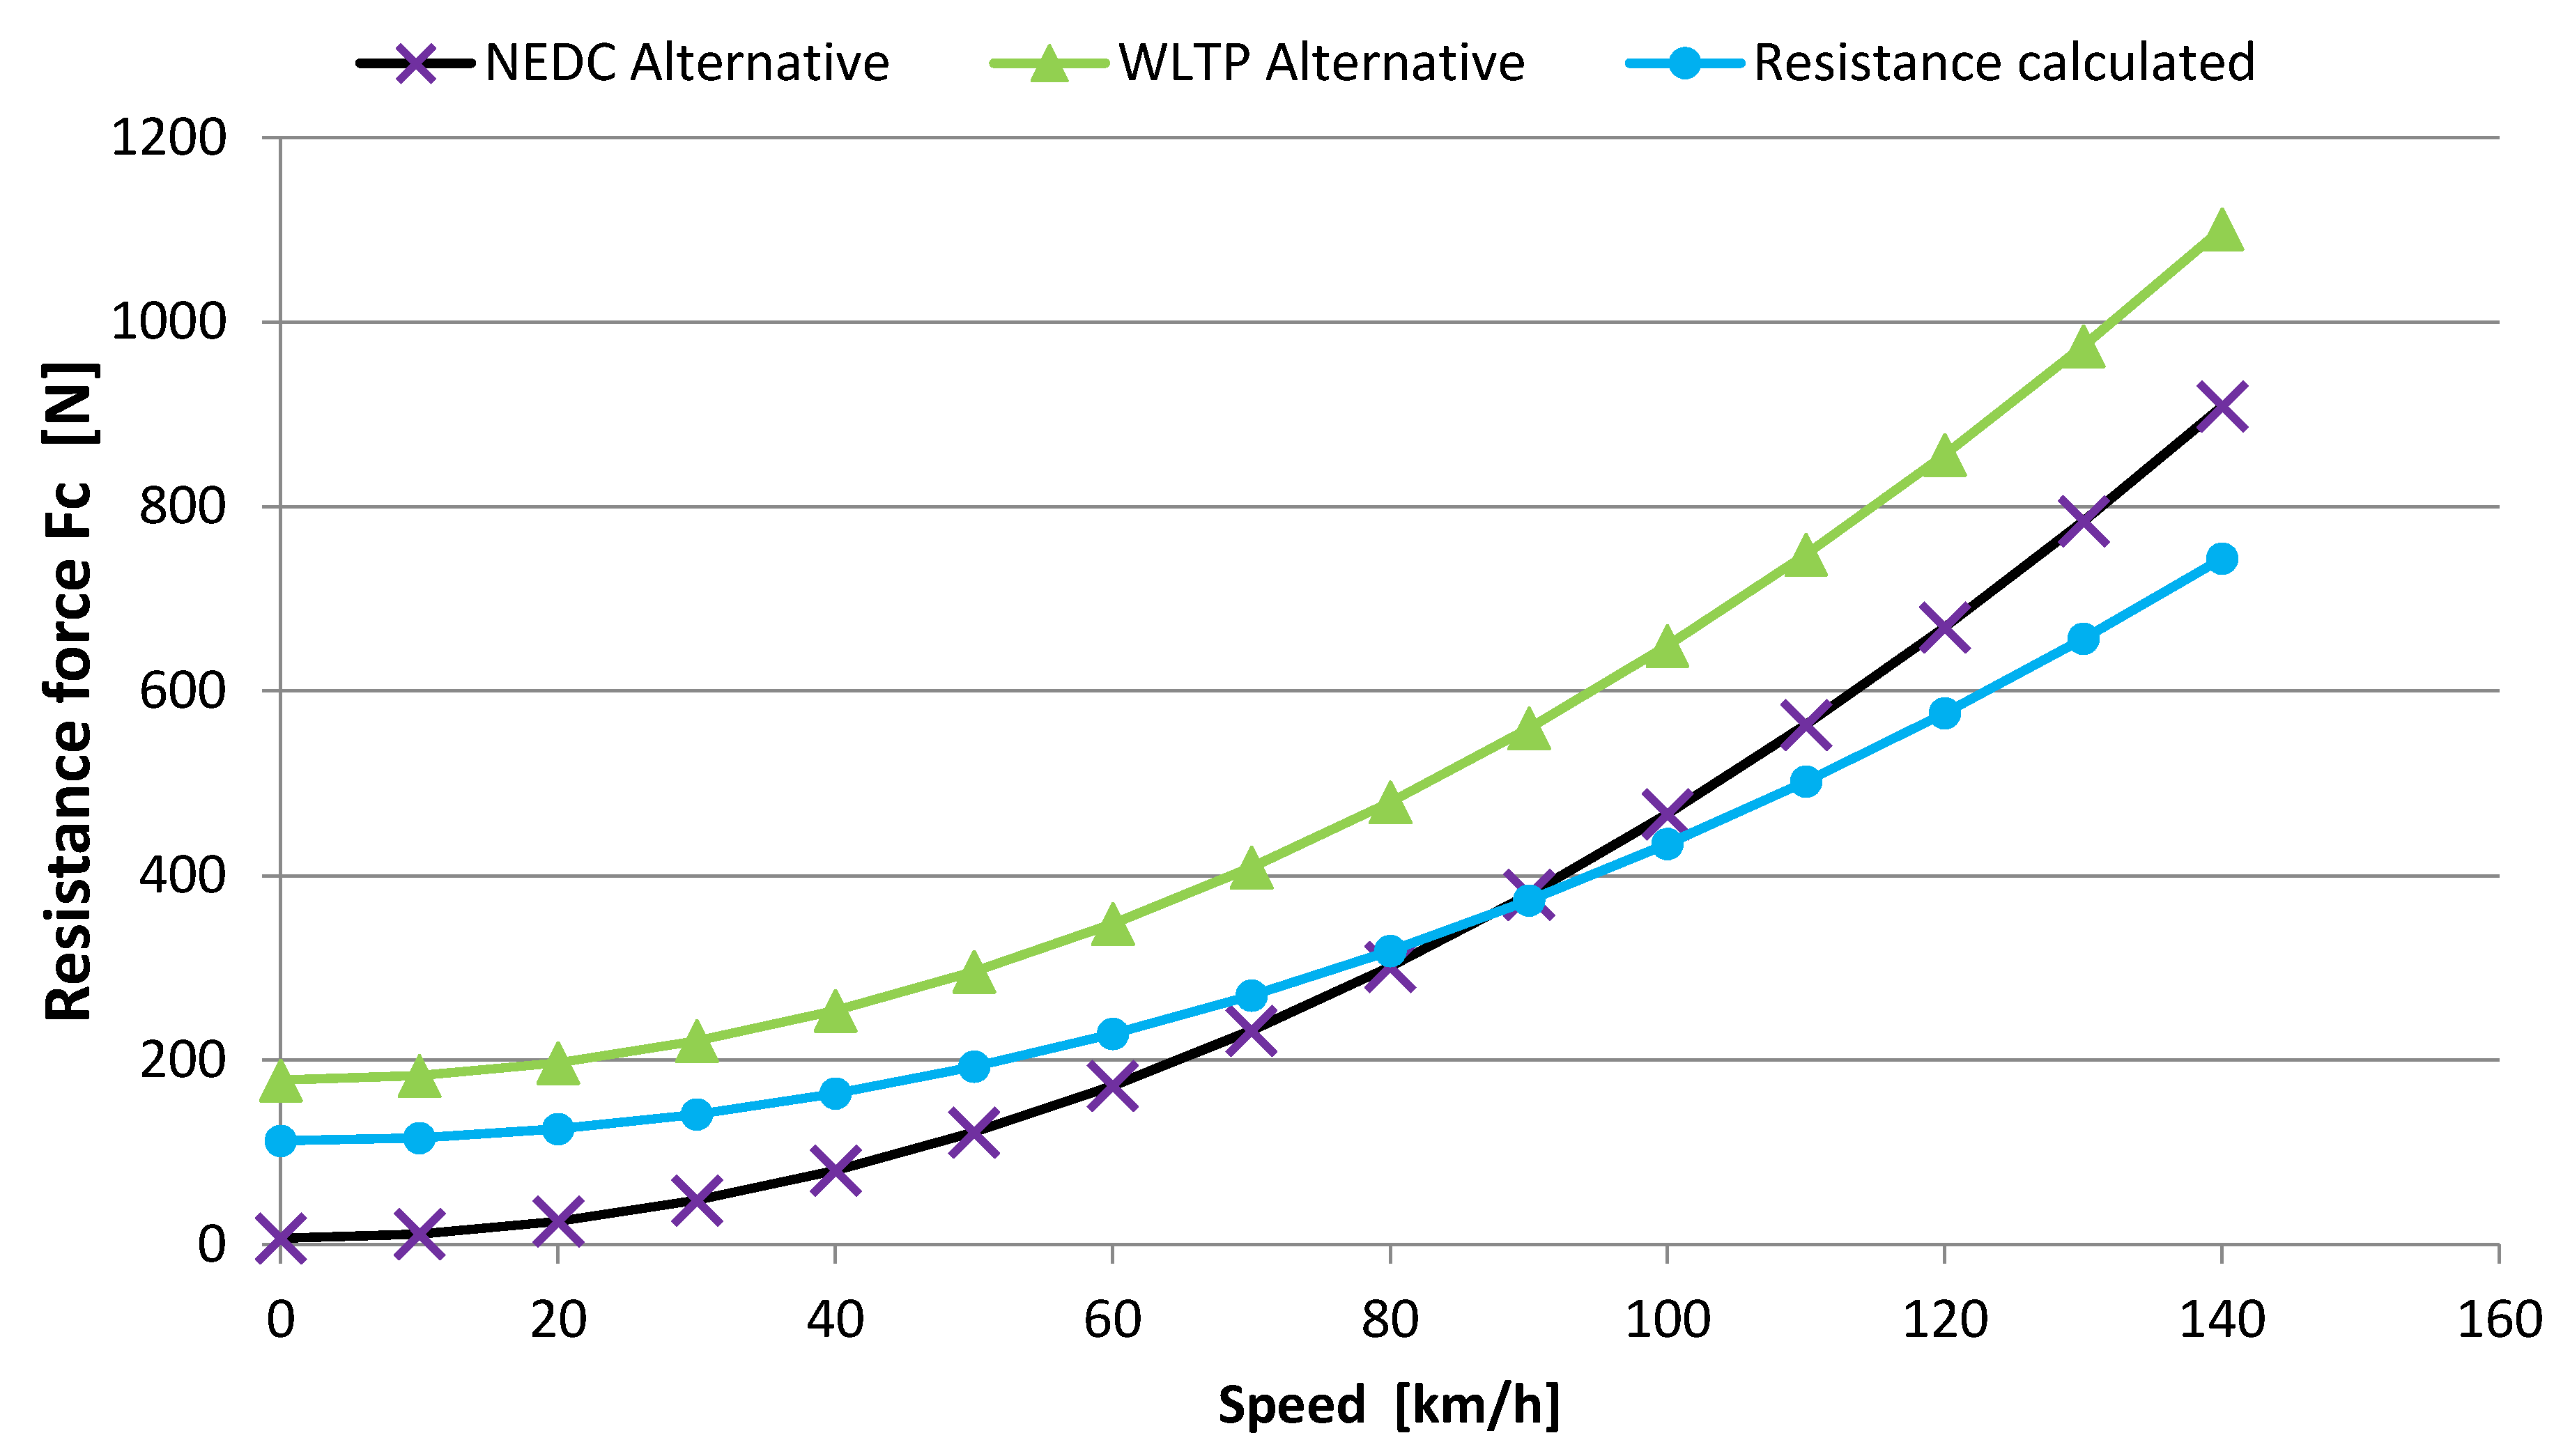
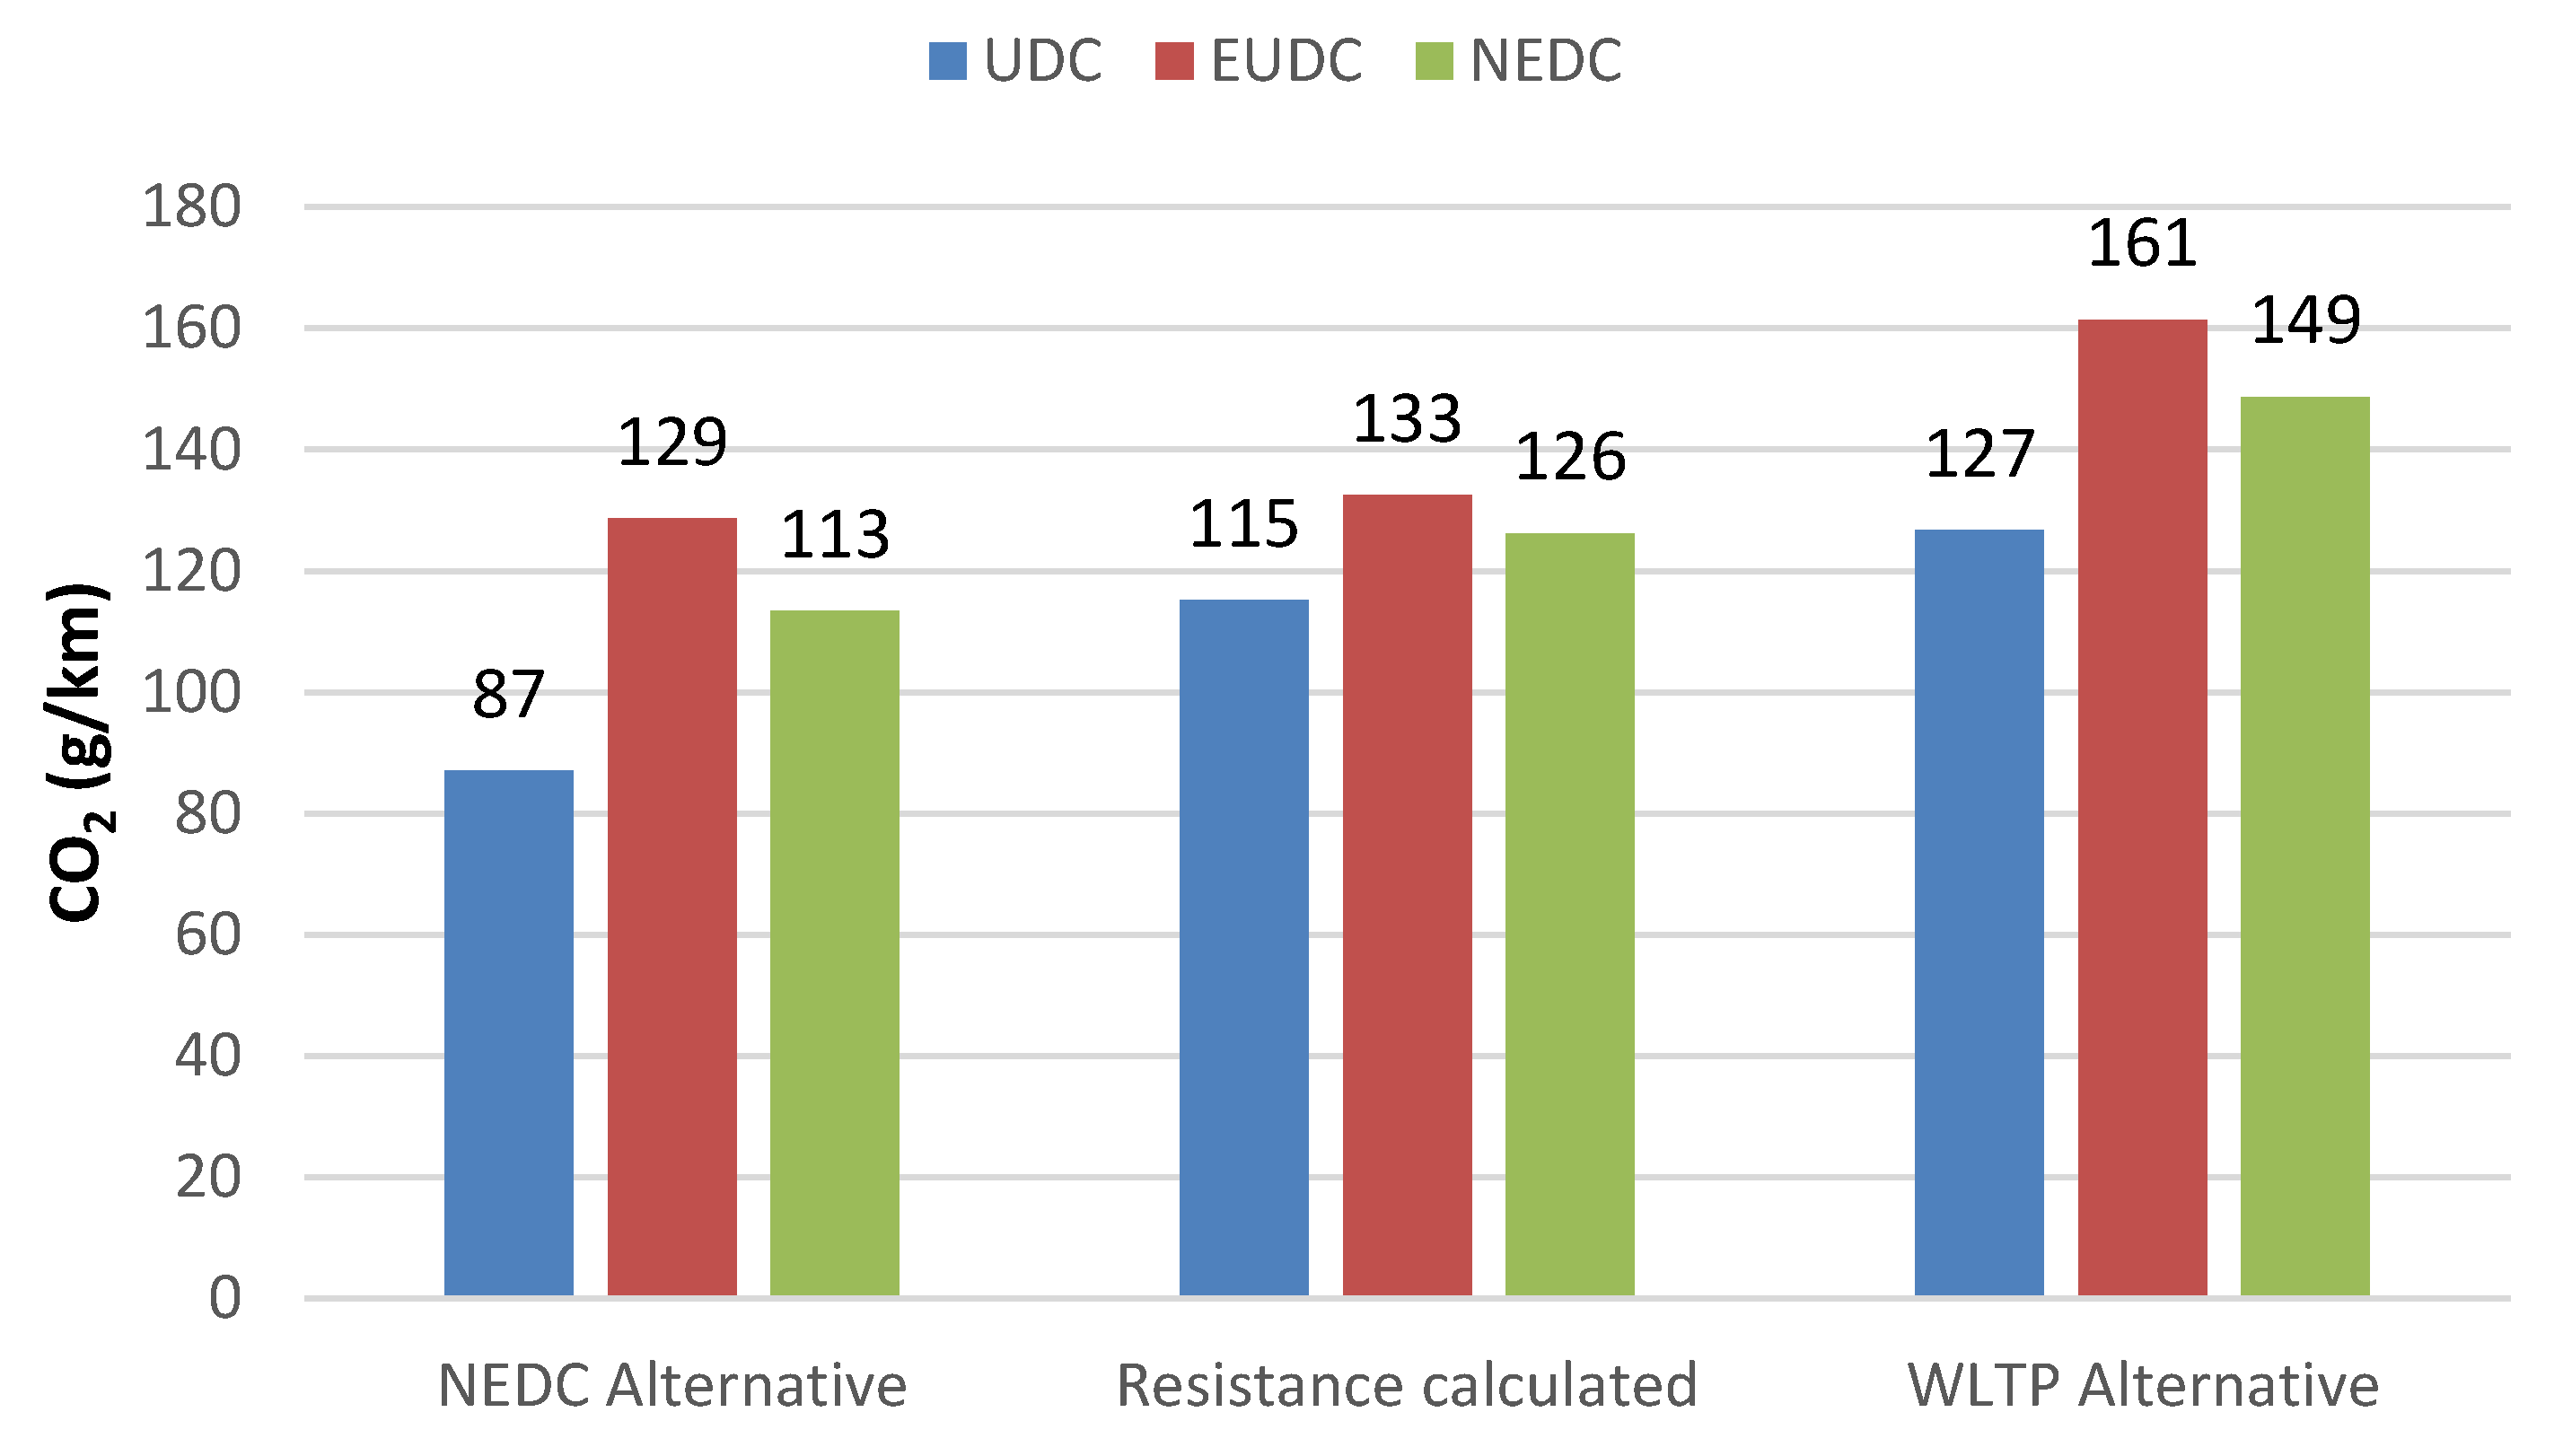
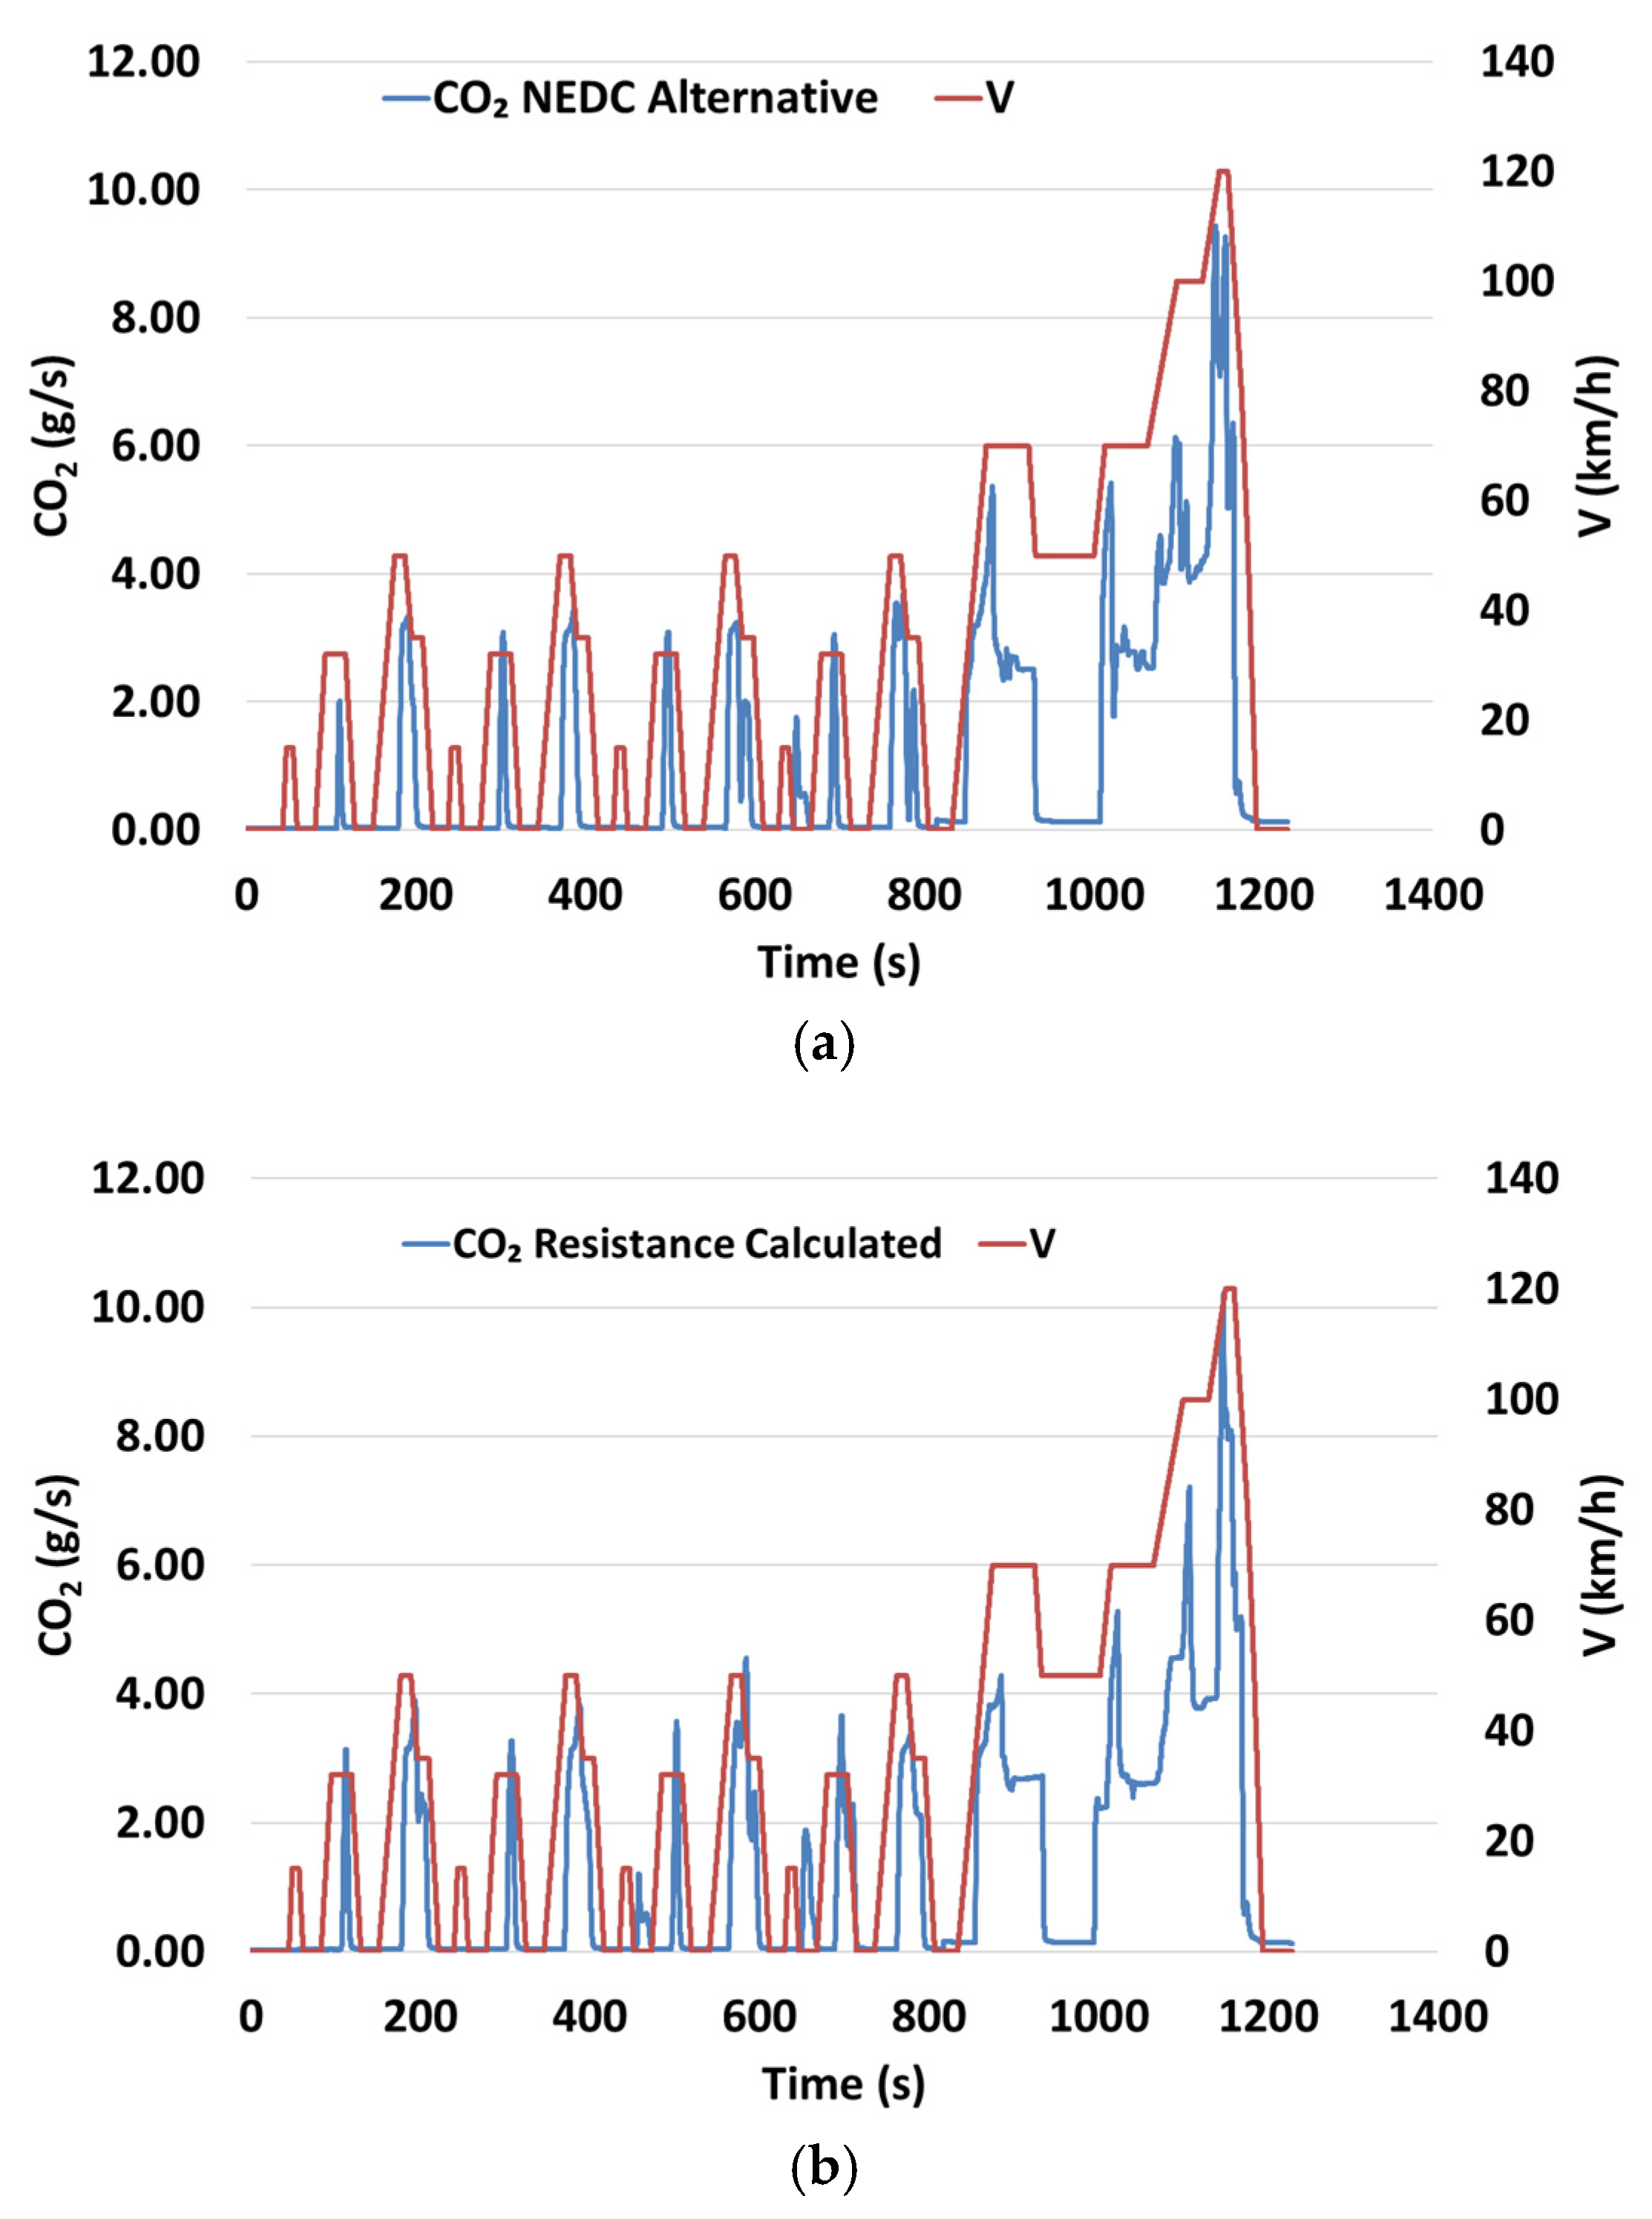
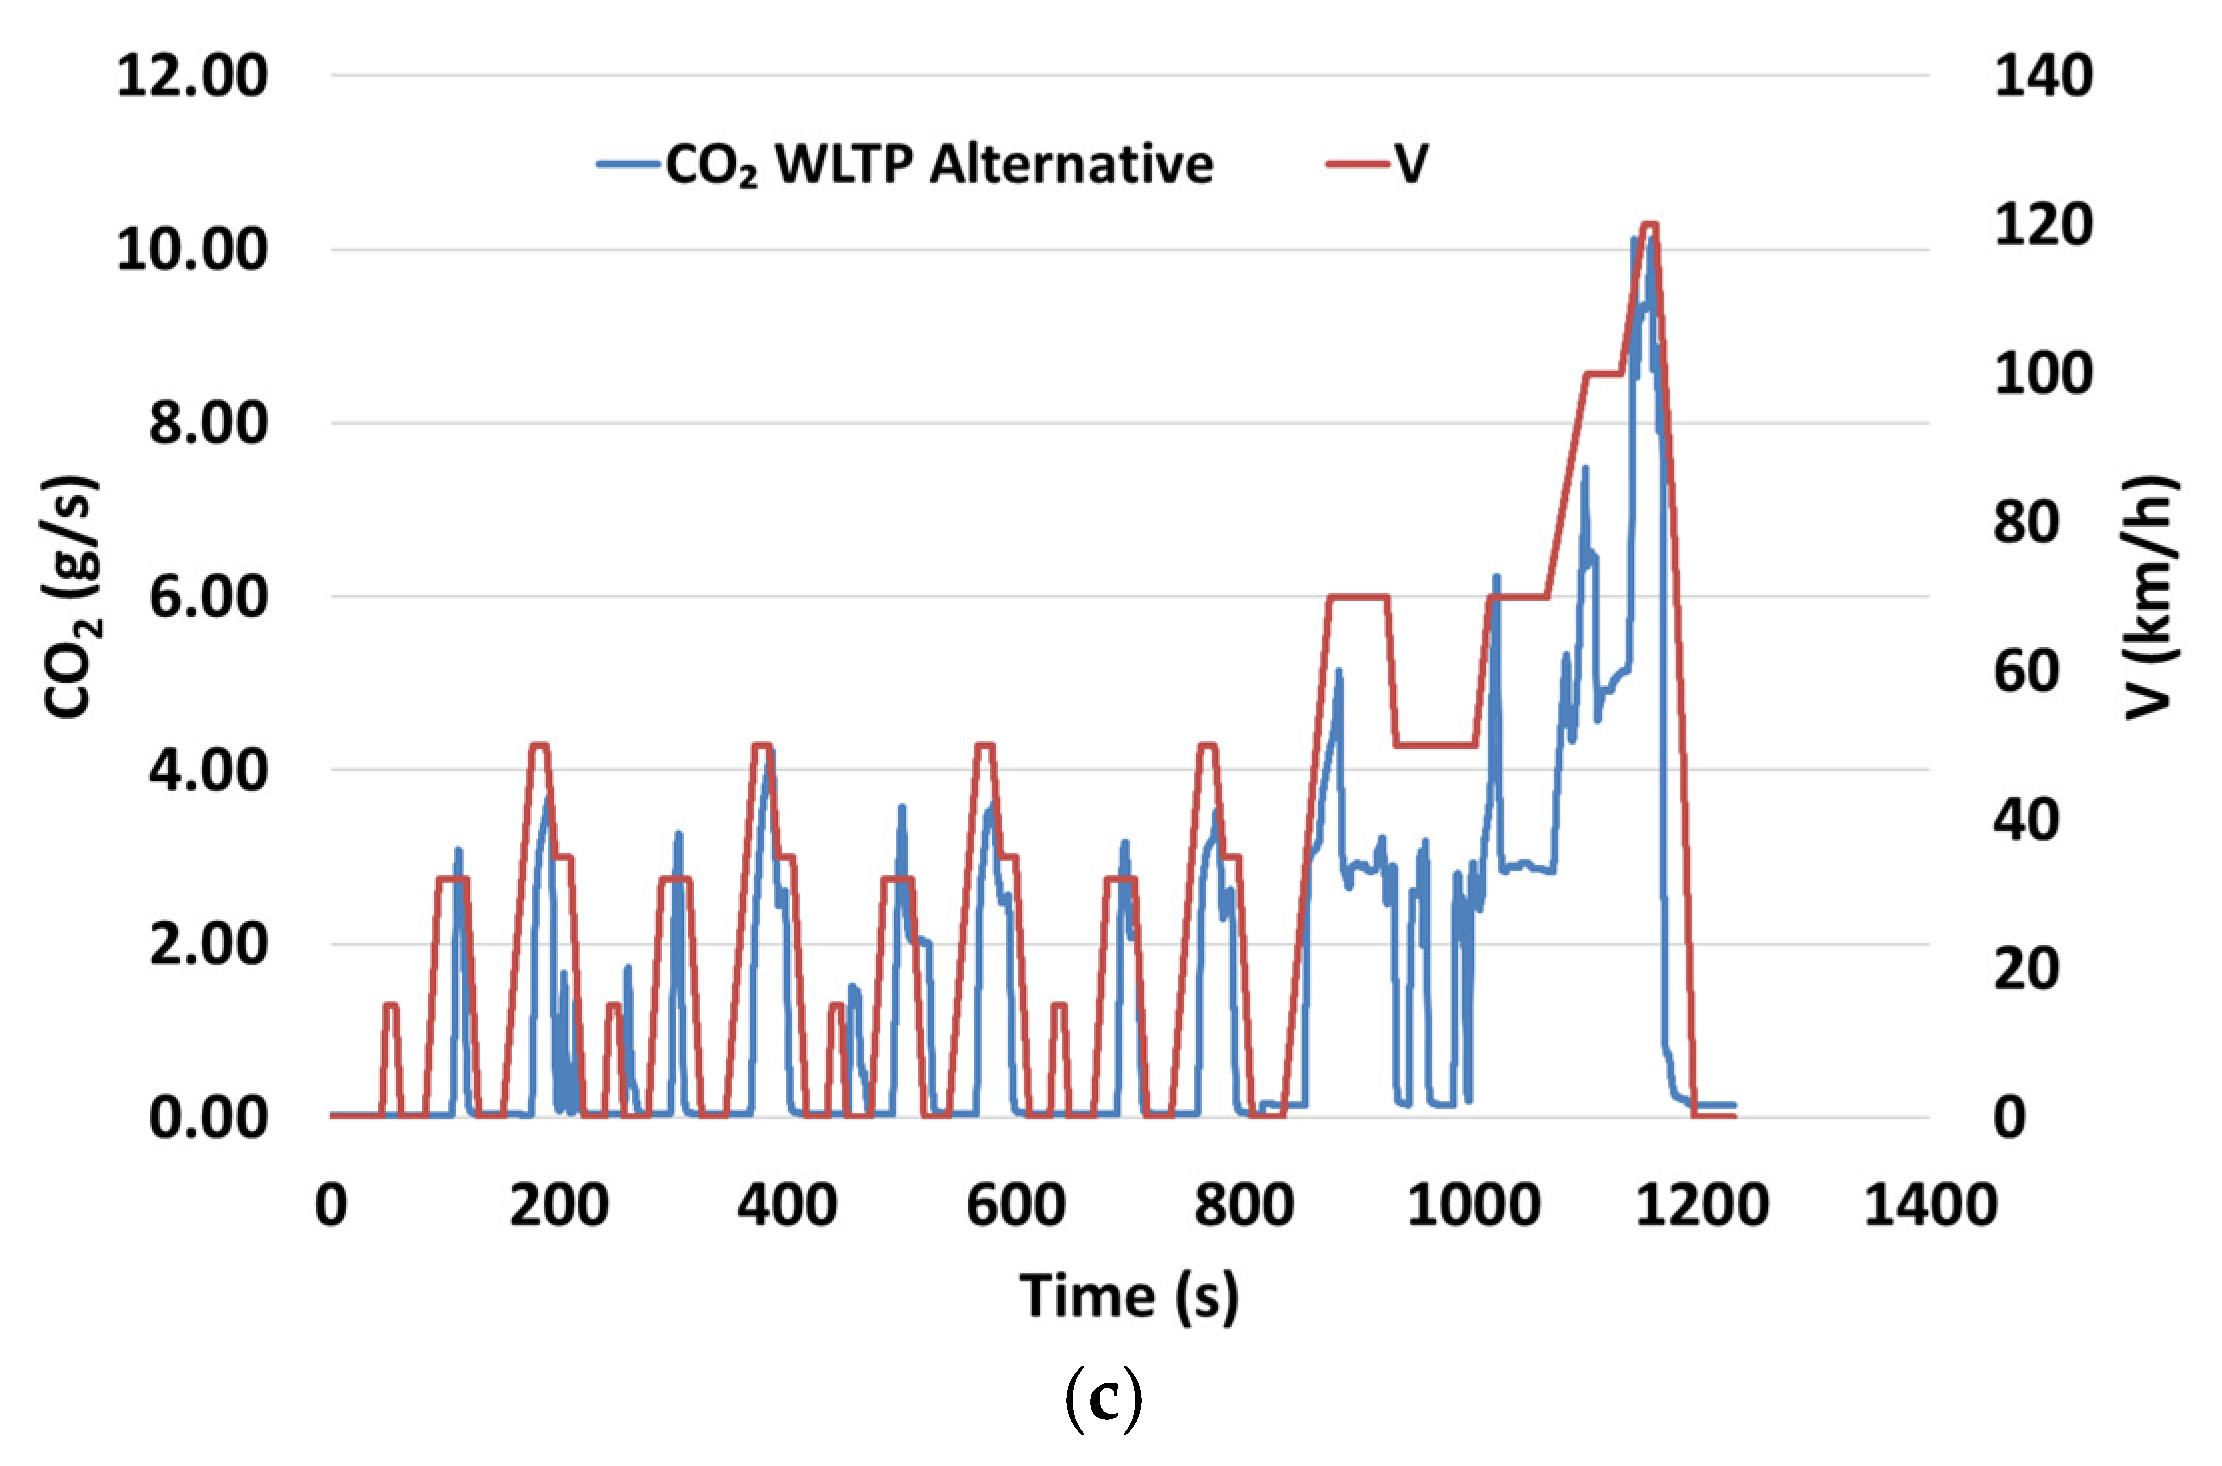
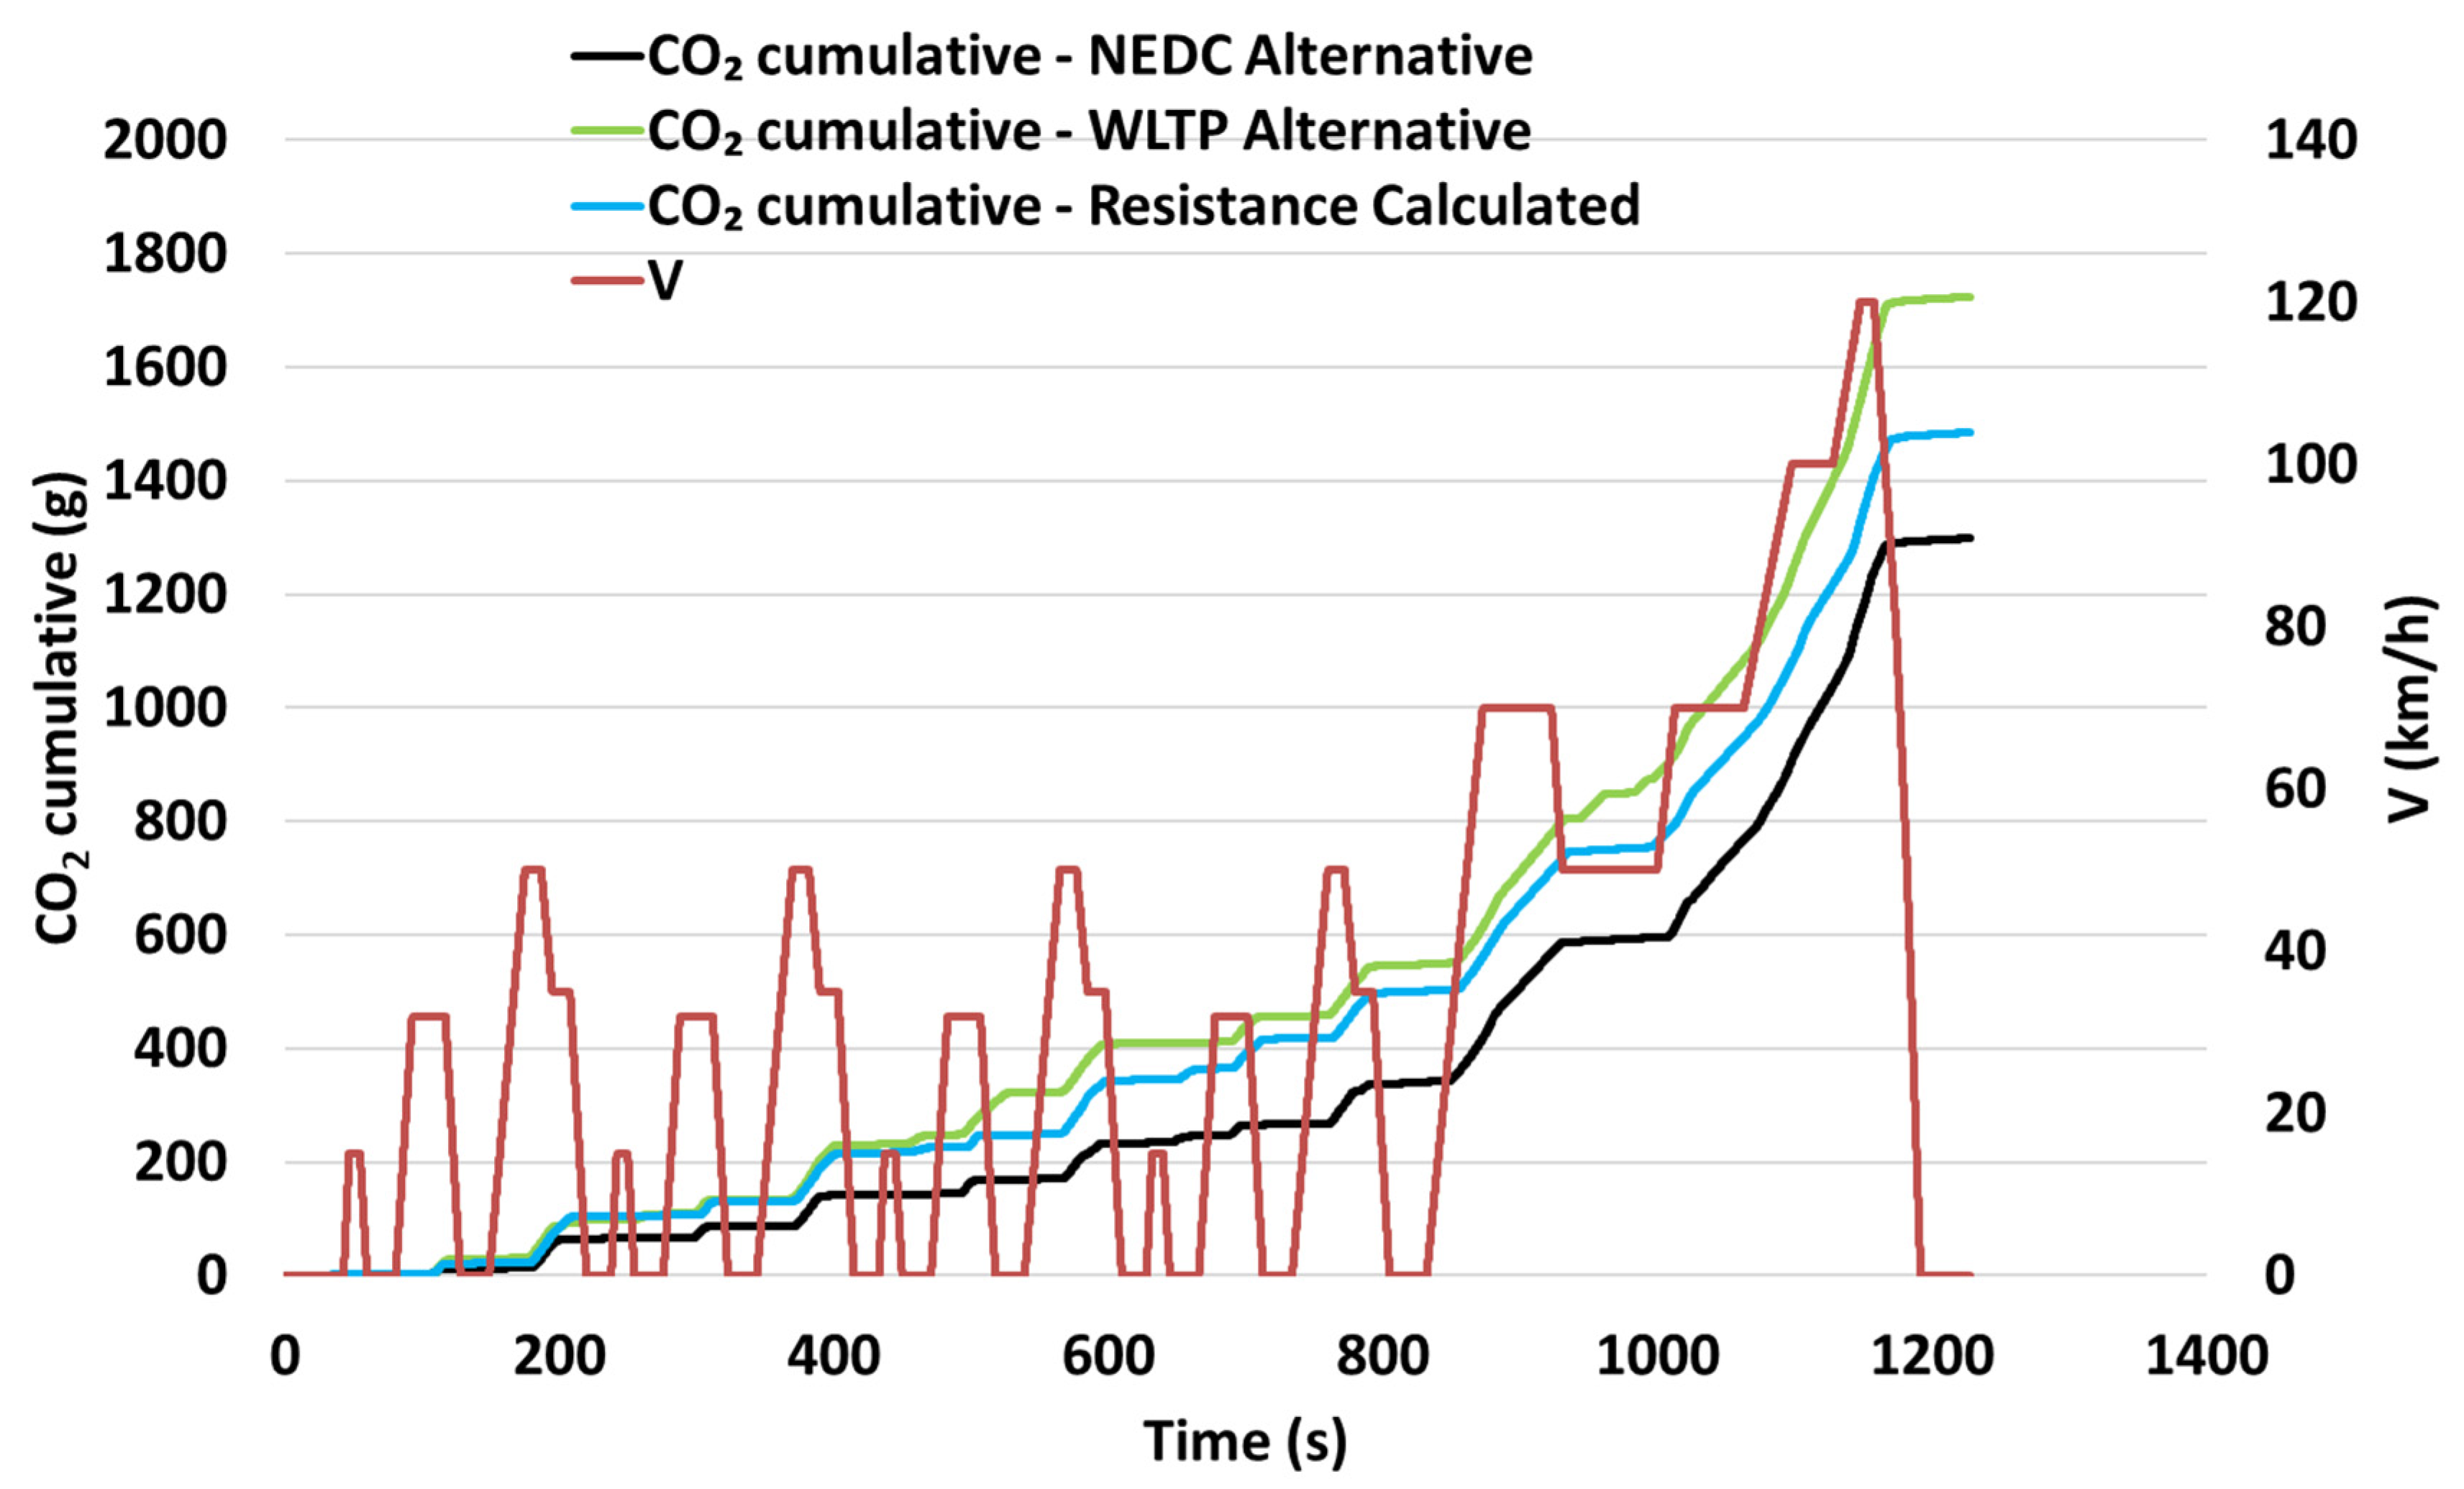
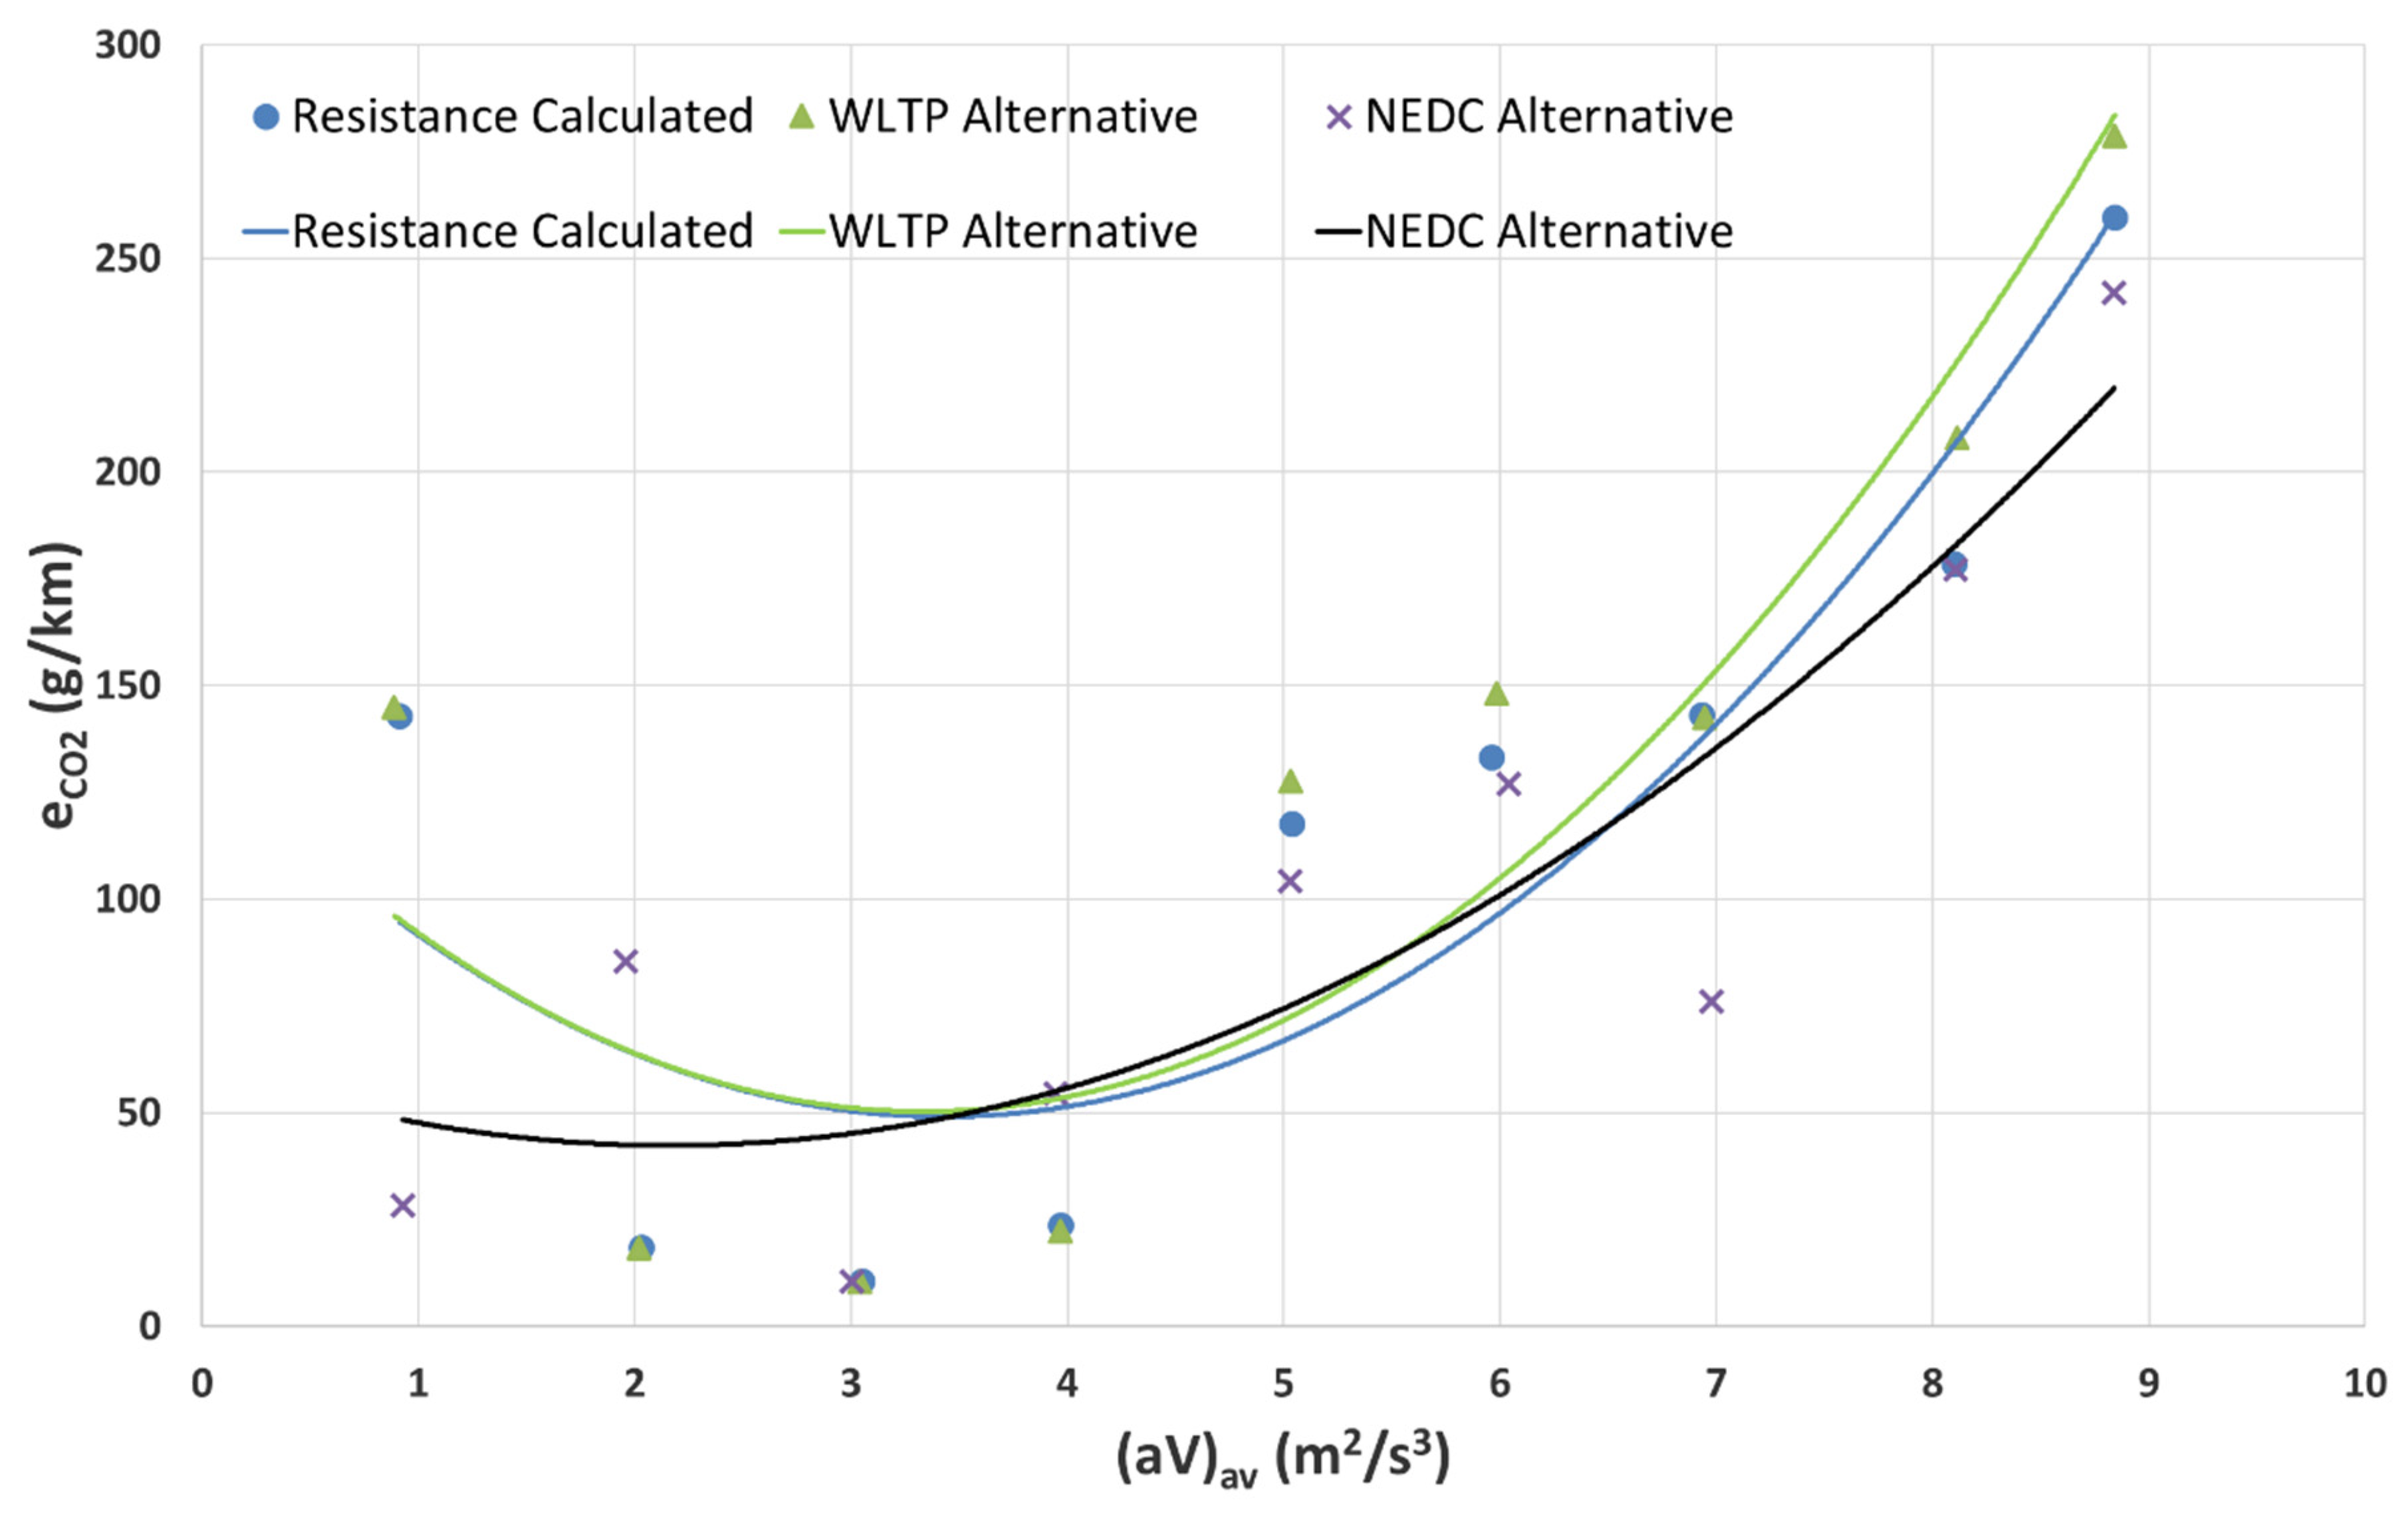
  • The main influence on CO2 emissions and energy consumption is the applied motion resistance function.
  • The adoption of different resistance functions resulted in differences in the values of average CO2 emissions, which can be as large as 35% for the entire NEDC cycle, for the full-hybrid car under testing.
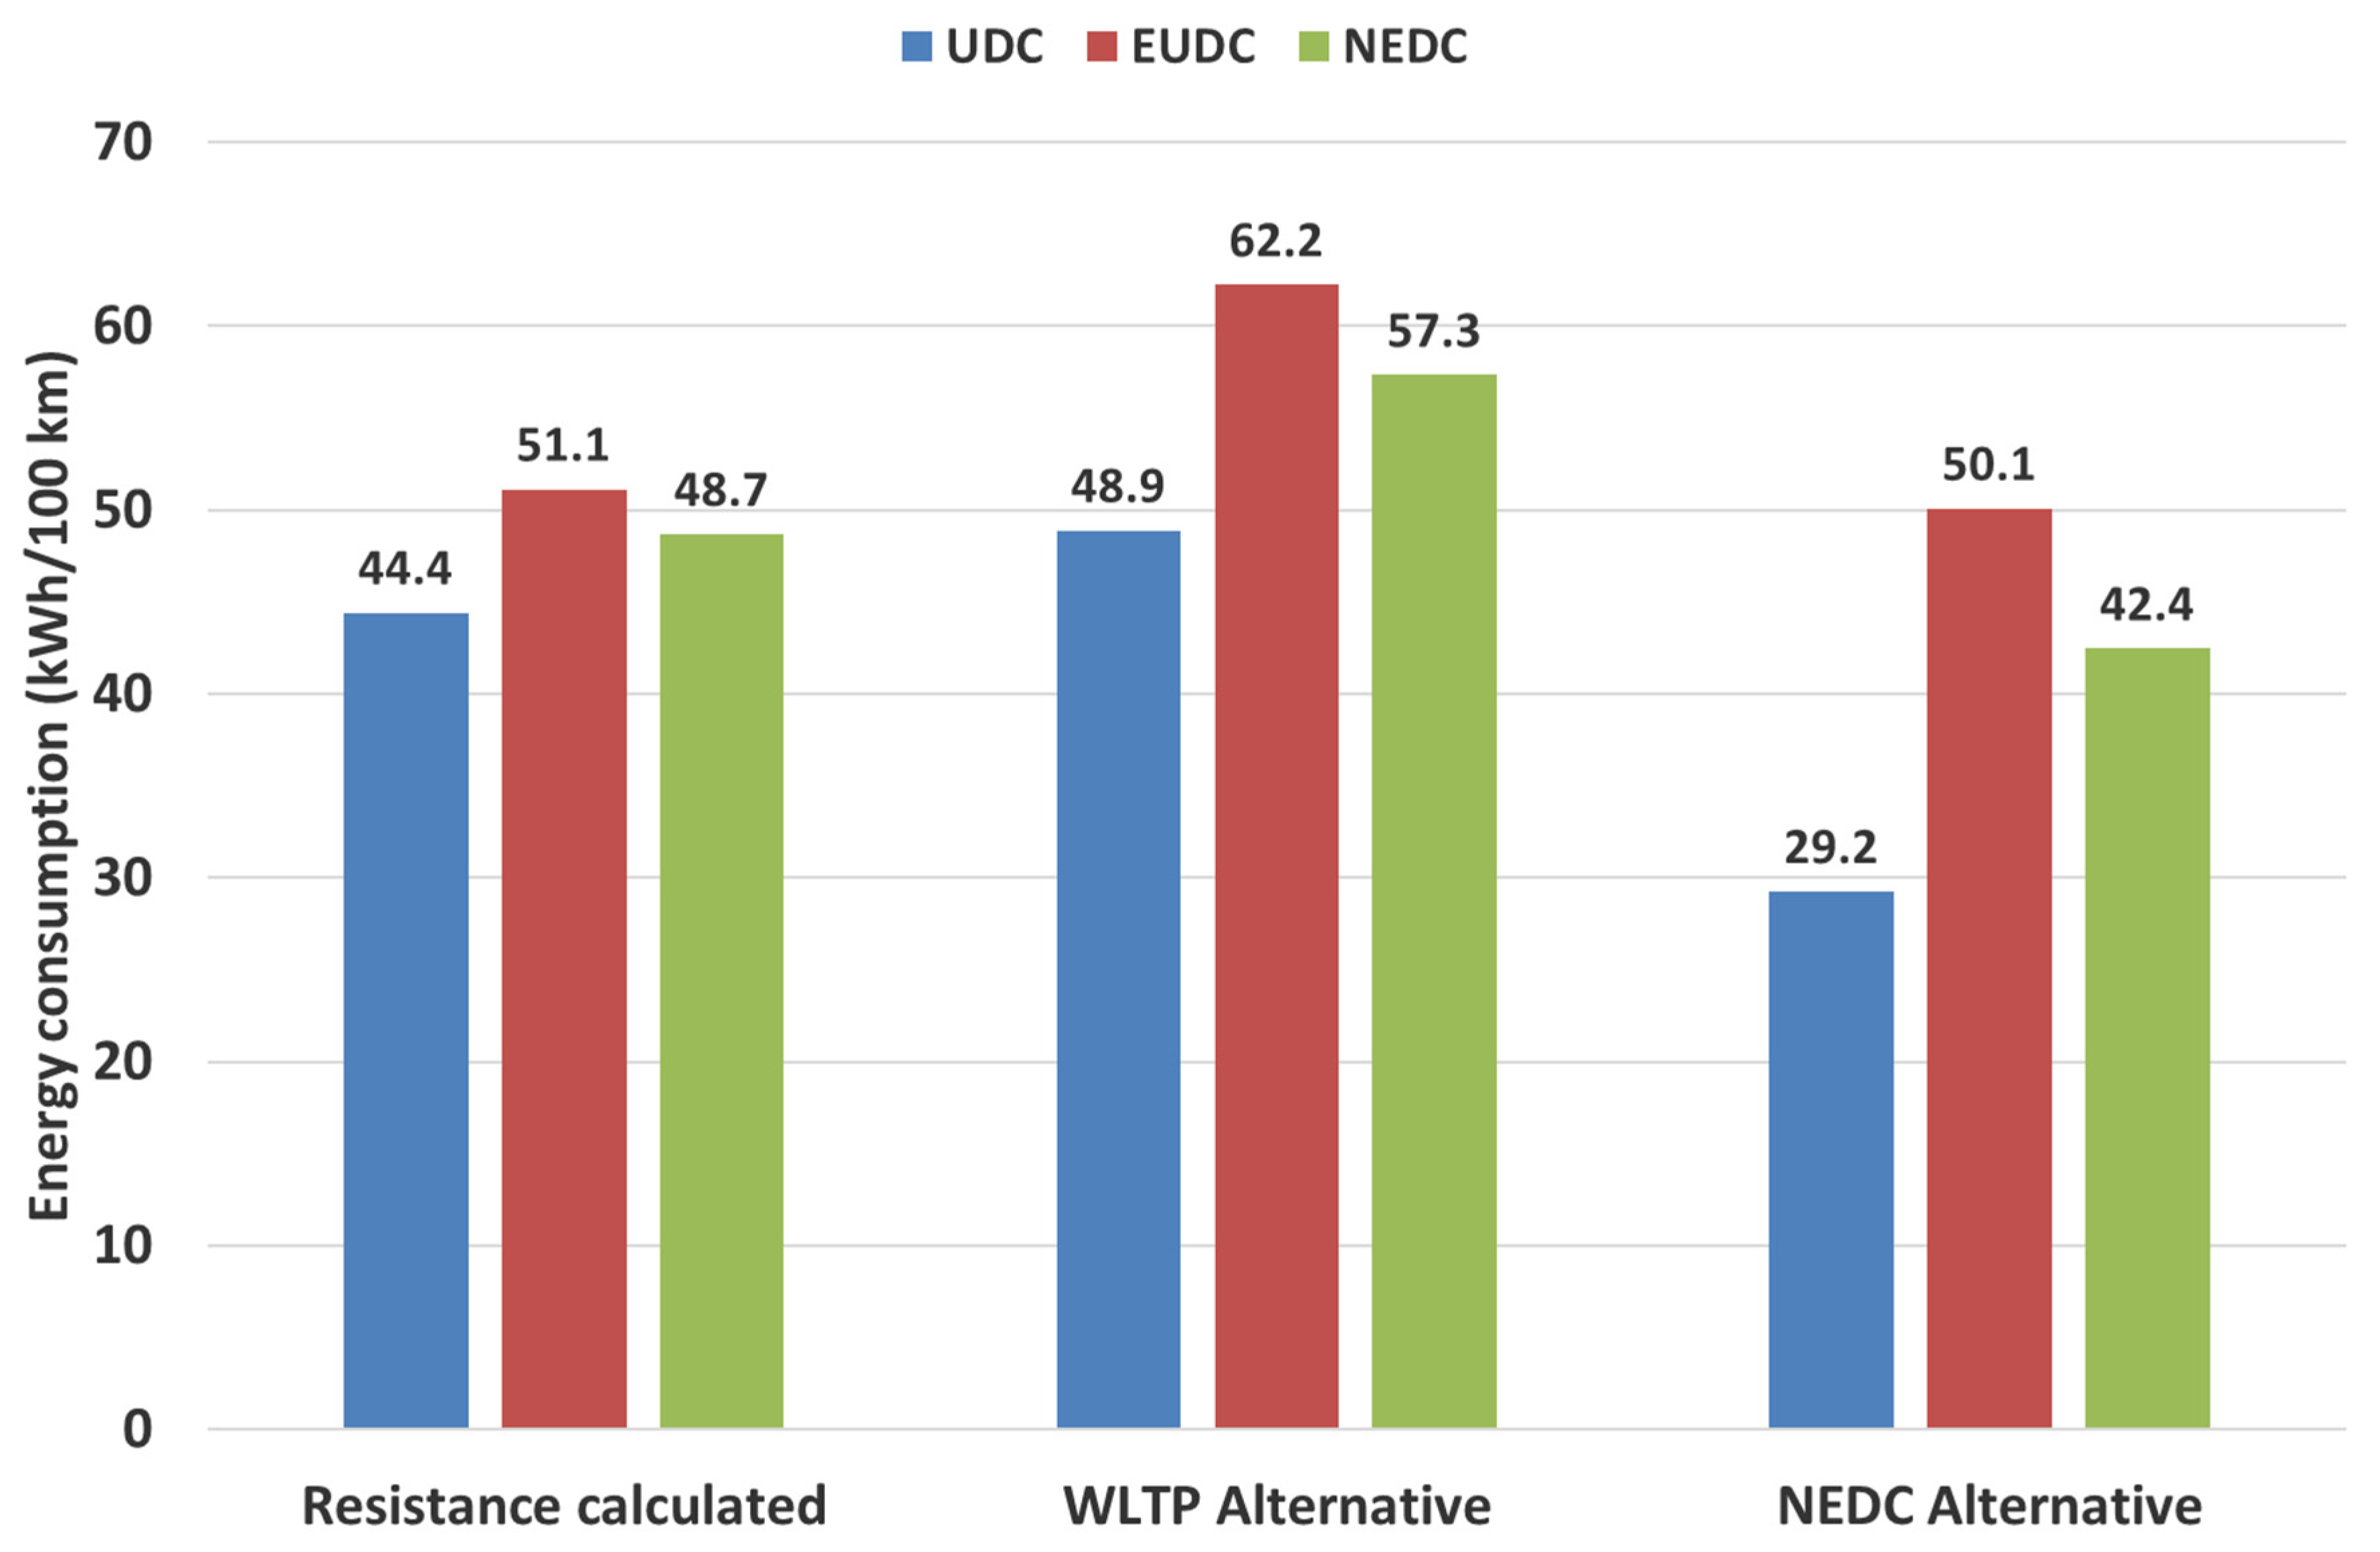
  • The highest CO2 emissions and energy consumption values were recorded for tests using the traffic resistance function determined according to the WLTP Alternative method.
  • The lowest CO2 emissions and energy consumption values were obtained for the NEDC Alternative method.
  • The CO2 emission values are related to the adopted drag function and are lowest for the NEDC Alternative method in the speed range corresponding to urban traffic conditions.
In the case of emission tests carried out on a chassis dynamometer, information about the load on the chassis dynamometer is essential for the presentation of the test results. We underscore the importance of this point and recommend that future emissions testing results provide these details.
Research has shown that due to CO2 emissions and energy (fuel) consumption, it is important to include factors related to drag in chassis dynamometer testing. This aspect is not only important when testing conventional combustion or hybrid cars, but also electric vehicles.
The results described in this paper can also serve as a database for a similar approach to optimize energy management in hybrid vehicles as that presented by Lü et al. [29]. In addition, the results of this study can be useful for optimizing simulations of CO2 emissions and energy consumption that are based on models of traffic characteristics [30,31].
Future work will be guided by studies conducted for other driving cycles as well as for plug-in hybrid and electric vehicles. The authors intend to conduct studies related to the energy consumption of cars (including electric cars) at reduced ambient temperatures using a climatic chamber.

Author Contributions

Conceptualization, A.J. and K.L.; methodology, A.J., P.W. (Paweł Woś) and M.M.; software, A.J. and M.M.; validation, A.J., A.U., K.B. and K.L.; formal analysis, M.M., K.B., M.J. and A.U.; investigation, K.L., A.J., M.M. and H.K.; resources, A.J., K.B., P.W. (Paweł Wojewoda), M.J., T.C. and M.M.; data curation, A.J.; writing—original draft preparation, A.J., T.C. and M.M.; writing—review and editing, A.J., P.W. (Paweł Woś), H.K., K.B., M.M., A.U. and T.C.; visualization, A.J. and P.W. (Paweł Wojewoda); supervision, A.J. All authors have read and agreed to the published version of the manuscript.

Funding

This work was supported by the Ministry of Infrastructure and Development as part of the Eastern Poland Development Operational Program in association with the European Regional Development Fund, which financed the research instruments.

Institutional Review Board Statement

Not applicable.

Informed Consent Statement

Not applicable.

Data Availability Statement

Data are contained within the article.

Conflicts of Interest

The authors declare no conflict of interest.

Abbreviations

AVLAnstalt für Verbrennungskraftmaschinen List
CLDChemiluminescence Detector
COCarbon monoxide
CO2Carbon dioxide
CH4Methane
ECEnergy consumption
EUDCExtra Urban Driving Cycle
FIDFlame Ionization Detector
IRDInfrared Detector
LHVLower heating value
NEDCNew European Driving Cycle
NOxNitrogen oxides
PEMSPortable Emissions Measurement Systems
RDEReal driving emissions
THCTotal hydrocarbons
TWCThree-way catalytic converter
UDCUrban Driving Cycle
WLTPWorldwide Harmonized Light Vehicle Test Procedure
WLTCWorld-wide harmonized Light duty Test Cycle

References

  1. Holden, E.; Gilpin, G.; Banister, D. Sustainable Mobility at Thirty. Sustainability 2019, 11, 1965. [Google Scholar] [CrossRef] [Green Version]
  2. Roadmap to a Single European Transport Area—Towards a Competitive and Resource Efficient Transport System. European Commission White Paper 2011. Available online: http://eur-lex.europa.eu/LexUriServ/LexUriServ.do?uri=COM:2011:0144:FIN:EN:PDF (accessed on 25 September 2021).
  3. Tsakalidis, A.; van Balen, M.; Gkoumas, K.; Pekar, F. Catalyzing Sustainable Transport Innovation through Policy Support and Monitoring: The Case of TRIMIS and the European Green Deal. Sustainability 2020, 12, 3171. [Google Scholar] [CrossRef] [Green Version]
  4. Fridstrøm, L.; Østli, V. Direct and cross price elasticities of demand for gasoline, diesel, hybrid and battery electric cars: The case of Norway. Eur. Transp. Res. Rev. 2021, 13, 3. [Google Scholar] [CrossRef]
  5. Ehsani, M.; Mi, C.C. Electric and Hybrid Vehicles [Scanning the Issue]. Proc. IEEE 2021, 109, 962–966. [Google Scholar] [CrossRef]
  6. Ma, C.; Madaniyazi, L.; Xie, Y. Impact of the Electric Vehicle Policies on Environment and Health in the Beijing-Tianjin-Hebei Region. Int. J. Environ. Res. Public Health 2021, 18, 623. [Google Scholar] [CrossRef] [PubMed]
  7. Gai, Y.; Minet, L.; Posen, I.D.; Smargiassi, A.; Tétreault, L.F.; Hatzopoulou, M. Health and climate benefits of electric vehicle deployment in the greater Toronto and Hamilton area. Environ. Pollut. 2020, 265, 114983. [Google Scholar] [CrossRef] [PubMed]
  8. New Vehicle Registrations in the Fourth Quarter of 2020 Information. 2020. Available online: https://www.acea.auto/ (accessed on 1 October 2020).
  9. Fontaras, G.; Zacharof, N.-G.; Ciuffo, B. Fuel consumption and CO2 emissions from passenger cars in Europe—Laboratory versus real-world emissions. Prog. Energy Combust. Sci. 2017, 60, 97–131. [Google Scholar] [CrossRef]
  10. Jaworski, A.; Mądziel, M.; Kuszewski, H.; Lejda, K.; Balawender, K.; Jaremcio, M.; Jakubowski, M.; Woś, P.; Lew, K. The Impact of Driving Resistances on the Emission of Exhaust Pollutants from Vehicles with the Spark Ignition Engine Fuelled by Petrol and LPG; SAE Technical Paper No. 2020-01-2206; SAE: Warrendale, PA, USA, 2020. [Google Scholar] [CrossRef]
  11. Kadijk, G.; Verbeek, R.; Smokers, R.; Spreen, J.; Patuleia, A.; Van Ras, M. Supporting Analysis Regarding Test Procedure Flexibilities and Technology Deployment for Review of the Light Duty Vehicle CO2 Regulations; European Commission: Brussel, Belgium, 2012. [Google Scholar] [CrossRef]
  12. Merkisz, J.; Pielecha, J.; Bielaczyc, P.; Woodburn, J.; Szalek, A. A Comparison of Tailpipe Gaseous Emissions from the RDE and WLTP Test Procedures on a Hybrid Passenger Car; SAE Technical Paper No. 2020-01-2217; SAE: Warrendale, PA, USA, 2020. [Google Scholar] [CrossRef]
  13. Tietge, U.; Zacharof, N.; Mock, P.; Franco, V.; German, J.; Bandivadekar, A.; Ligterink, N.; Lambrecht, U. From laboratory to road—A 2015 update of official and “real-world” fuel consumption and CO2 values for passenger cars in Europe. Int. Counc. Clean Transp. 2015, 49, 847129-102. [Google Scholar]
  14. Kadijk, G.; Ligterink, N. Road Load Determination of Passenger Cars. 2012. Available online: https://www.tno.nl/media/1971/road_load_determination_passenger_cars_tno_r10237.pdf (accessed on 3 April 2019).
  15. Riemersma, I.; Mock, P. Too Low to be True? How to Measure Fuel Consumption and CO2 Emissions of Plug-In Hybrid Vehicles, Today and in the Future. The International Council on Clean Transportation 2017. Available online: https://theicct.org/sites/default/files/publications/EU-PHEV_ICCT-Briefing-Paper_280717_vF.pdf (accessed on 21 November 2021).
  16. Merl, R.; Jung, C.; Huss, A.; Klumaier, K. Innovative Solutions for the Calibration of Hybrid Drives. ATZ Worldw. 2020, 122, 38–43. [Google Scholar] [CrossRef]
  17. Jaworski, A.; Kuszewski, H.; Ustrzycki, A.; Balawender, K. Analysis of the repeatability of exhaust pollutans emission research for cold and hot starts under controlled driving cycle conditions. Environ. Sci. Pollut. Res. 2018, 25, 17862–17877. [Google Scholar] [CrossRef] [Green Version]
  18. Regulation No 83 of the Economic Commission for Europe of the United Nations (UN/ECE)—Uniform Provisions Concerning the Approval of Vehicles with Regard to the Emission of Pollutants According to Engine Fuel Requirements. Available online: https://eur-lex.europa.eu/legal-content/EN/TXT/PDF/?uri=CELEX:42012X0215(01)&from=EN (accessed on 21 May 2016).
  19. Commission Regulation (EU) 2017/1151. Available online: https://eur-lex.europa.eu/legal-content/EN/TXT/PDF/?uri=CELEX:32017R1151&from=PL (accessed on 2 October 2021).
  20. Kühlwein, J. The Impact of Official Versus Real-World Road Loads on CO2 Emissions and Fuel Consumption of European Passenger Cars. The International Council on a Clean Transportation. White paper. 2016. Available online: https://www.theicct.org/sites/default/files/publications/ICCT_Coastdowns-EU_201605.pdf (accessed on 12 April 2019).
  21. Fontaras, G.; Ciuffo, B.; Zacharof, N.; Tsiakmakis, S.; Marotta, A.; Pavlovic, J.; Anagnostopoulos, K. The difference between reported and real-world CO2 emissions: How much improvement can be expected by WLTP introduction? Transp. Res. Procedia 2017, 25, 3933–3943. [Google Scholar] [CrossRef]
  22. Regulation No 101 of the Economic Commission for Europe of the United Nations (UN/ECE)—Uniform Provisions Concerning the Approval of Passenger Cars Equipped with an Internal Combustion Engine with Regard to the Measurement of the Emission of Carbon Dioxide and Fuel Consumption and of Categories M1 and N1 Vehicles Equipped with an Electric Power Train with Regard to the Measurement of Electric Energy Consumption and Range. Available online: https://op.europa.eu/en/publication-detail/-/publication/12faf0c9-6266-4af2-97e4-6a67b5fbaf44 (accessed on 2 November 2020).
  23. Lijewski, P.; Ziolkowski, A.; Daszkiewicz, P.; Andrzejewski, M.; Gallas, D. Comparison of CO2 emissions and fuel consumption of a hybrid vehicle and a vehicle with a direct gasoline injection engine. IOP Conf. Ser. Mater. Sci. Eng. 2018, 421, 042046. [Google Scholar] [CrossRef]
  24. Lorf, C.; Martinez-Botas, R.; Howey, D.; Lytton, L.; Cussons, B. Comparative analysis of the energy consumption and CO2 emissions of 40 electric, plug-in hybrid electric, hybrid electric and internal combustion engine vehicles. Transp. Res. 2013, 23, 12–19. [Google Scholar] [CrossRef]
  25. Skobiej, K.; Pielecha, J. Plug-in Hybrid Ecological Category in Real Driving Emissions. Energies 2021, 14, 2340. [Google Scholar] [CrossRef]
  26. Pavlovic, J.; Marotta, A.; Ciuffo, B. CO2 emissions and energy demands of vehicles tested under the NEDC and the new WLTP type approval test procedures. Appl. Energy 2016, 177, 661–670. [Google Scholar] [CrossRef]
  27. Tsiakmakis, S.; Fontaras, G.; Cubito, C.; Pavlovic, J.; Anagnostopoulos, K.; Ciuffo, B. From NEDC to WLTP: Effect on the Type-Approval CO2 Emissions of Light-Duty Vehicles; Publications Office of the European Union: Brussels, Belgium, 2017; p. 50. [Google Scholar]
  28. Liu, X.; Zhao, F.; Hao, H.; Chen, K.; Liu, Z.; Babiker, H.; Amer, A.A. From NEDC to WLTP: Effect on the Energy Consumption, NEV Credits, and Subsidies Policies of PHEV in the Chinese Market. Sustainability 2020, 12, 5747. [Google Scholar] [CrossRef]
  29. Lü, X.; Wu, Y.; Lian, J.; Zhang, Y.; Chen, C.; Wang, P.; Meng, L. Energy management of hybrid electric vehicles: A review of energy optimization of fuel cell hybrid power system based on genetic algorithm. Energy Conv. Manag. 2020, 205, 112474. [Google Scholar] [CrossRef]
  30. Jaworski, A.; Mądziel, M.; Lejda, K. Creating an emission model based on portable emission measurement system for the purpose of a roundabout. Environ. Sci. Pollut. Res. 2019, 26, 21641. [Google Scholar] [CrossRef] [PubMed] [Green Version]
  31. Mądziel, M.; Campisi, T.; Jaworski, A.; Kuszewski, H.; Woś, P. Assessing Vehicle Emissions from a Multi-Lane to Turbo Roundabout Conversion Using a Microsimulation Tool. Energies 2021, 14, 4399. [Google Scholar] [CrossRef]
Figure 1. Test stand: (a) photograph of a hybrid vehicle on the test bench, (b) test stand scheme: 1—Tested vehicle, 2—Chassis roller, 3—Climate chamber, 4—Driver’s assistance monitor, 5—Chassis dynamometer control system, 6—Constant volume sampling system, 7—Exhaust gas analysis system, 8—Exhaust gas system, 9—Control room, 10—Cooling fan, 11—Remote mixing unit.
Energies 15 00122 g001
Figure 2. Dependence of resistance force on vehicle speed for the analysed methods.
Energies 15 00122 g002
Figure 3. Comparison of CO2 emissions for the analysed dynamometer load setting methods, in urban (UDC) and extra-urban (EUDC) phases and for the entire NEDC cycle.
Energies 15 00122 g003
Figure 4. Dependence of velocity and CO2 emissions as a function of time for the analysed dynamometer load setting methods: (a) NEDC alternative, (b) resistance calculated and (c) WLTP alternative.
Energies 15 00122 g004aEnergies 15 00122 g004b
Figure 5. Comparison of variations in cumulative CO2 emissions for the analysed methods.
Energies 15 00122 g005
Figure 6. Comparison of energy consumption for individual phases of the cycle (UDC, EUDC) and the entire NEDC taking into account the dynamometer loading method.
Energies 15 00122 g006
Figure 7. Comparison of the relationship between CO2 emission rate and average speed for analysed dynamometer load settings.
Energies 15 00122 g007
Figure 8. Comparison of the relationship between the CO2 emission rate and the average product of speed and acceleration for the analysed dynamometer load settings.
Energies 15 00122 g008
Table 1. Technical data of the tested vehicle.
ParameterData
Year of production2020
Emission standardEuro 6 d
Engine capacity (cm3)1497
Compression ratio13:1
Engine working principleSpark ignition/ 4 stroke
Fuel typePetrol
Maximum net power (kW)/at (rpm)54/4800
Maximum engine torque (Nm)/at (rpm)111/3600–4400
Odometer (km × 1000)3.2
Transmission typeAutomatic
Fuel system (petrol)Multi-point indirect injection
Aftertreatment systemTWC
Electric motor (traction)Synchronous with permanent magnet
Maximum power of the electric motor (kW)45
Maximum torque of the electric motor (Nm)169
Traction batteryNickel-Metal Hydride
Kerb weight (kg)1123
Table 2. Accuracy specifications of AMA i60 analysers.
Parameter\AnalyzerFID i60 LCDIRD i60 CO2LIRD i60 L
Measured componentsTHC and CH4CO2CO
Reproducibility≤0.5% of range full scale≤0.5% of range full scale≤0.5% of range full scale
Linearity≤2% of measured value (10–100% of range full scale)
≤1% of range full scalewhichever is smaller
≤2% of measured value (10–100% of range full scale)
≤1% of range full scalewhichever is smaller
≤2% of measured value (10–100% of range full scale)
≤1% of range full scalewhichever is smaller
Table 3. Coefficients of resistance and equivalent inertia.
ParameterNEDC AlternativeResistance CalculatedWLTP Alternative
X0 (N)6.8112.39178.4
X1 (N/(km/h))000
X2 (N/(km/h)2)0.0460.03220.0471
Equivalent inertia (kg)125012741274
Table 4. Relationship between resistance forces method and engine fuel consumption.
Cycle PhaseFuel Consumption (dm3/100 km)
NEDC AlternativeResistance CalculatedWLTP Alternative
UDC3.3045.0185.522
EUDC5.6575.7757.031
NEDC4.7955.4996.476
Publisher’s Note: MDPI stays neutral with regard to jurisdictional claims in published maps and institutional affiliations.

