
The Effects of Module Temperature on the Energy Yield of Bifacial Photovoltaics: Data and Model

 , ,
, ,  and
and
Abstract
:1. Introduction
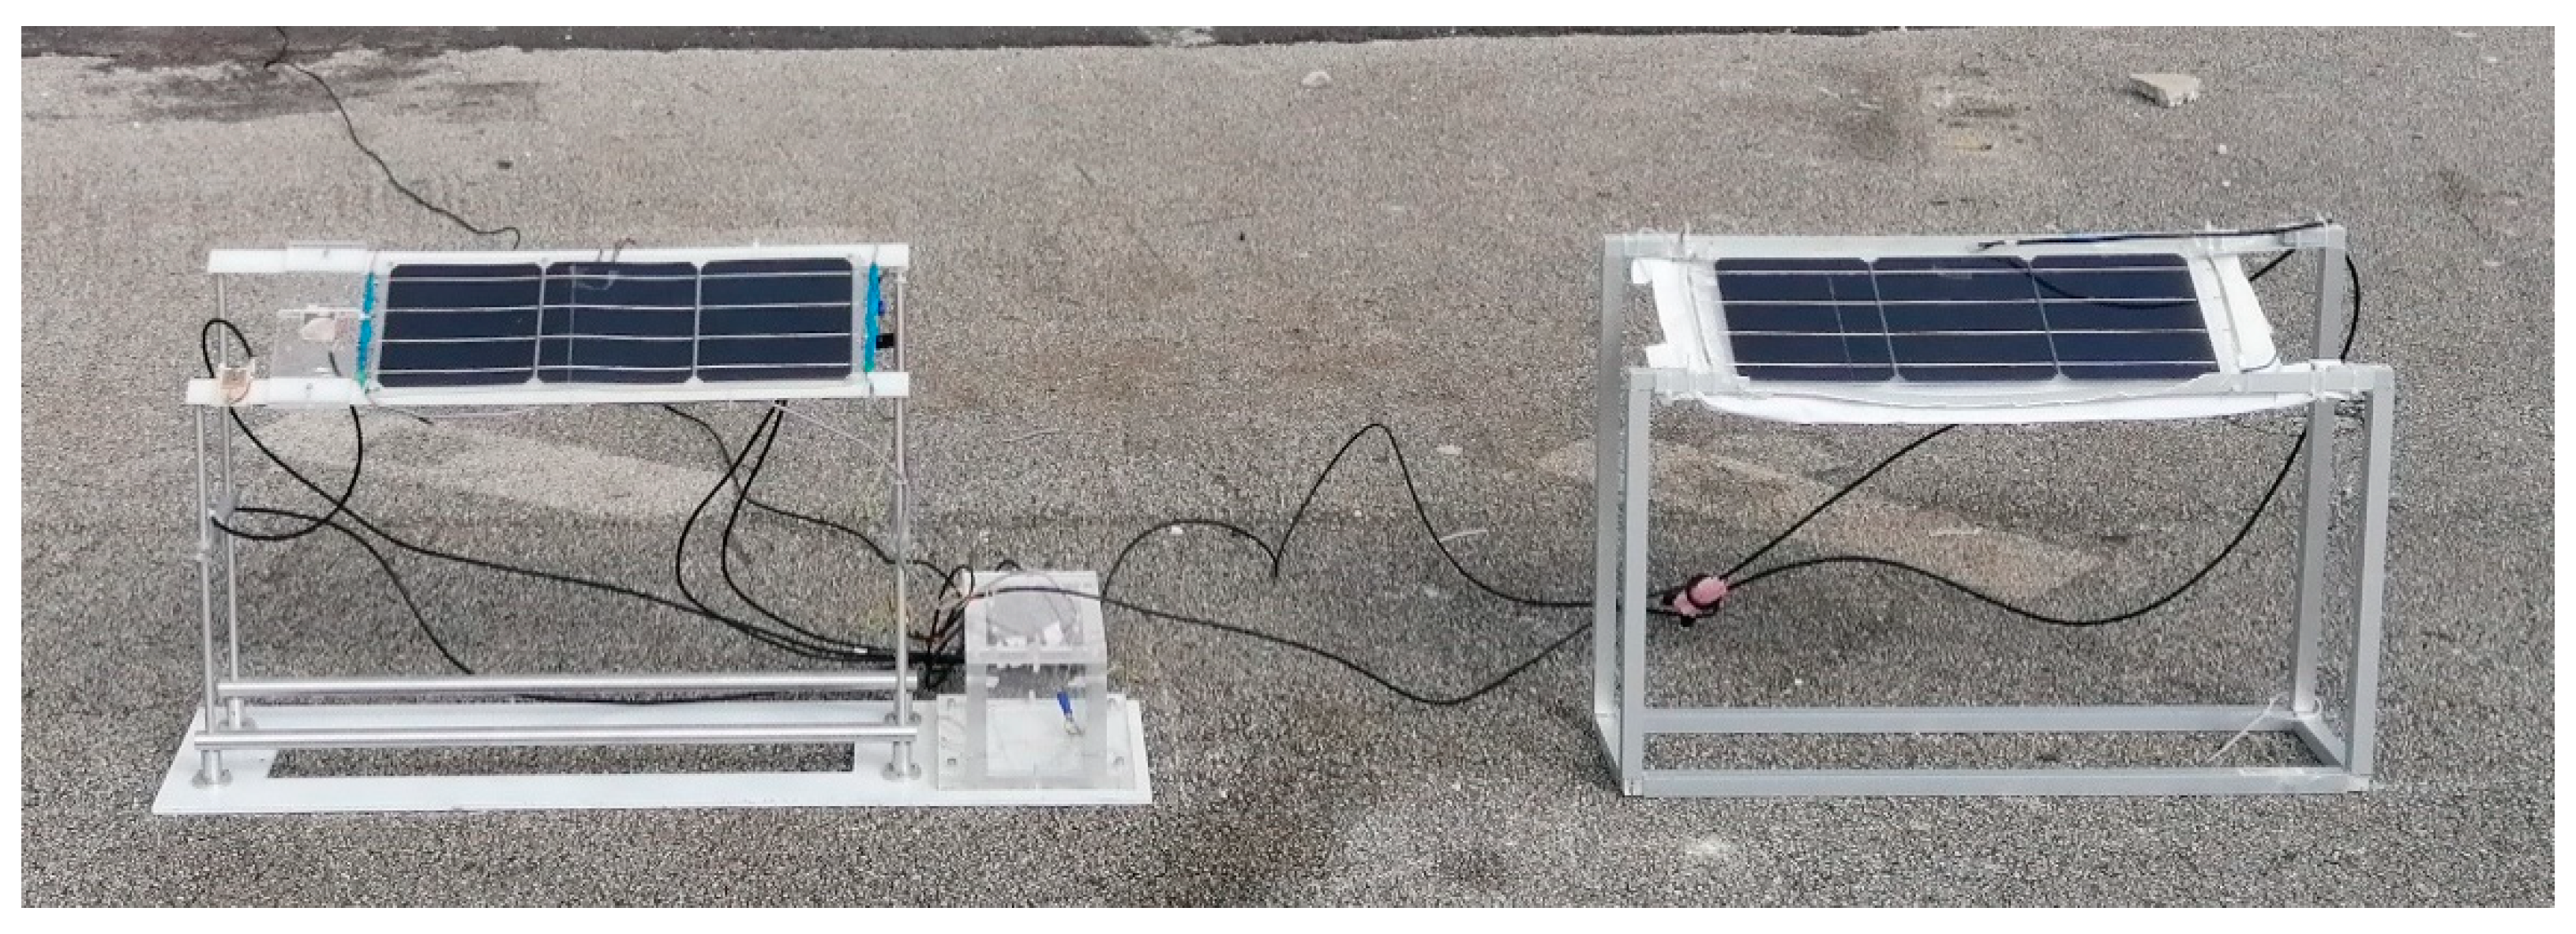
2. Experimental
3. Results and Discussion
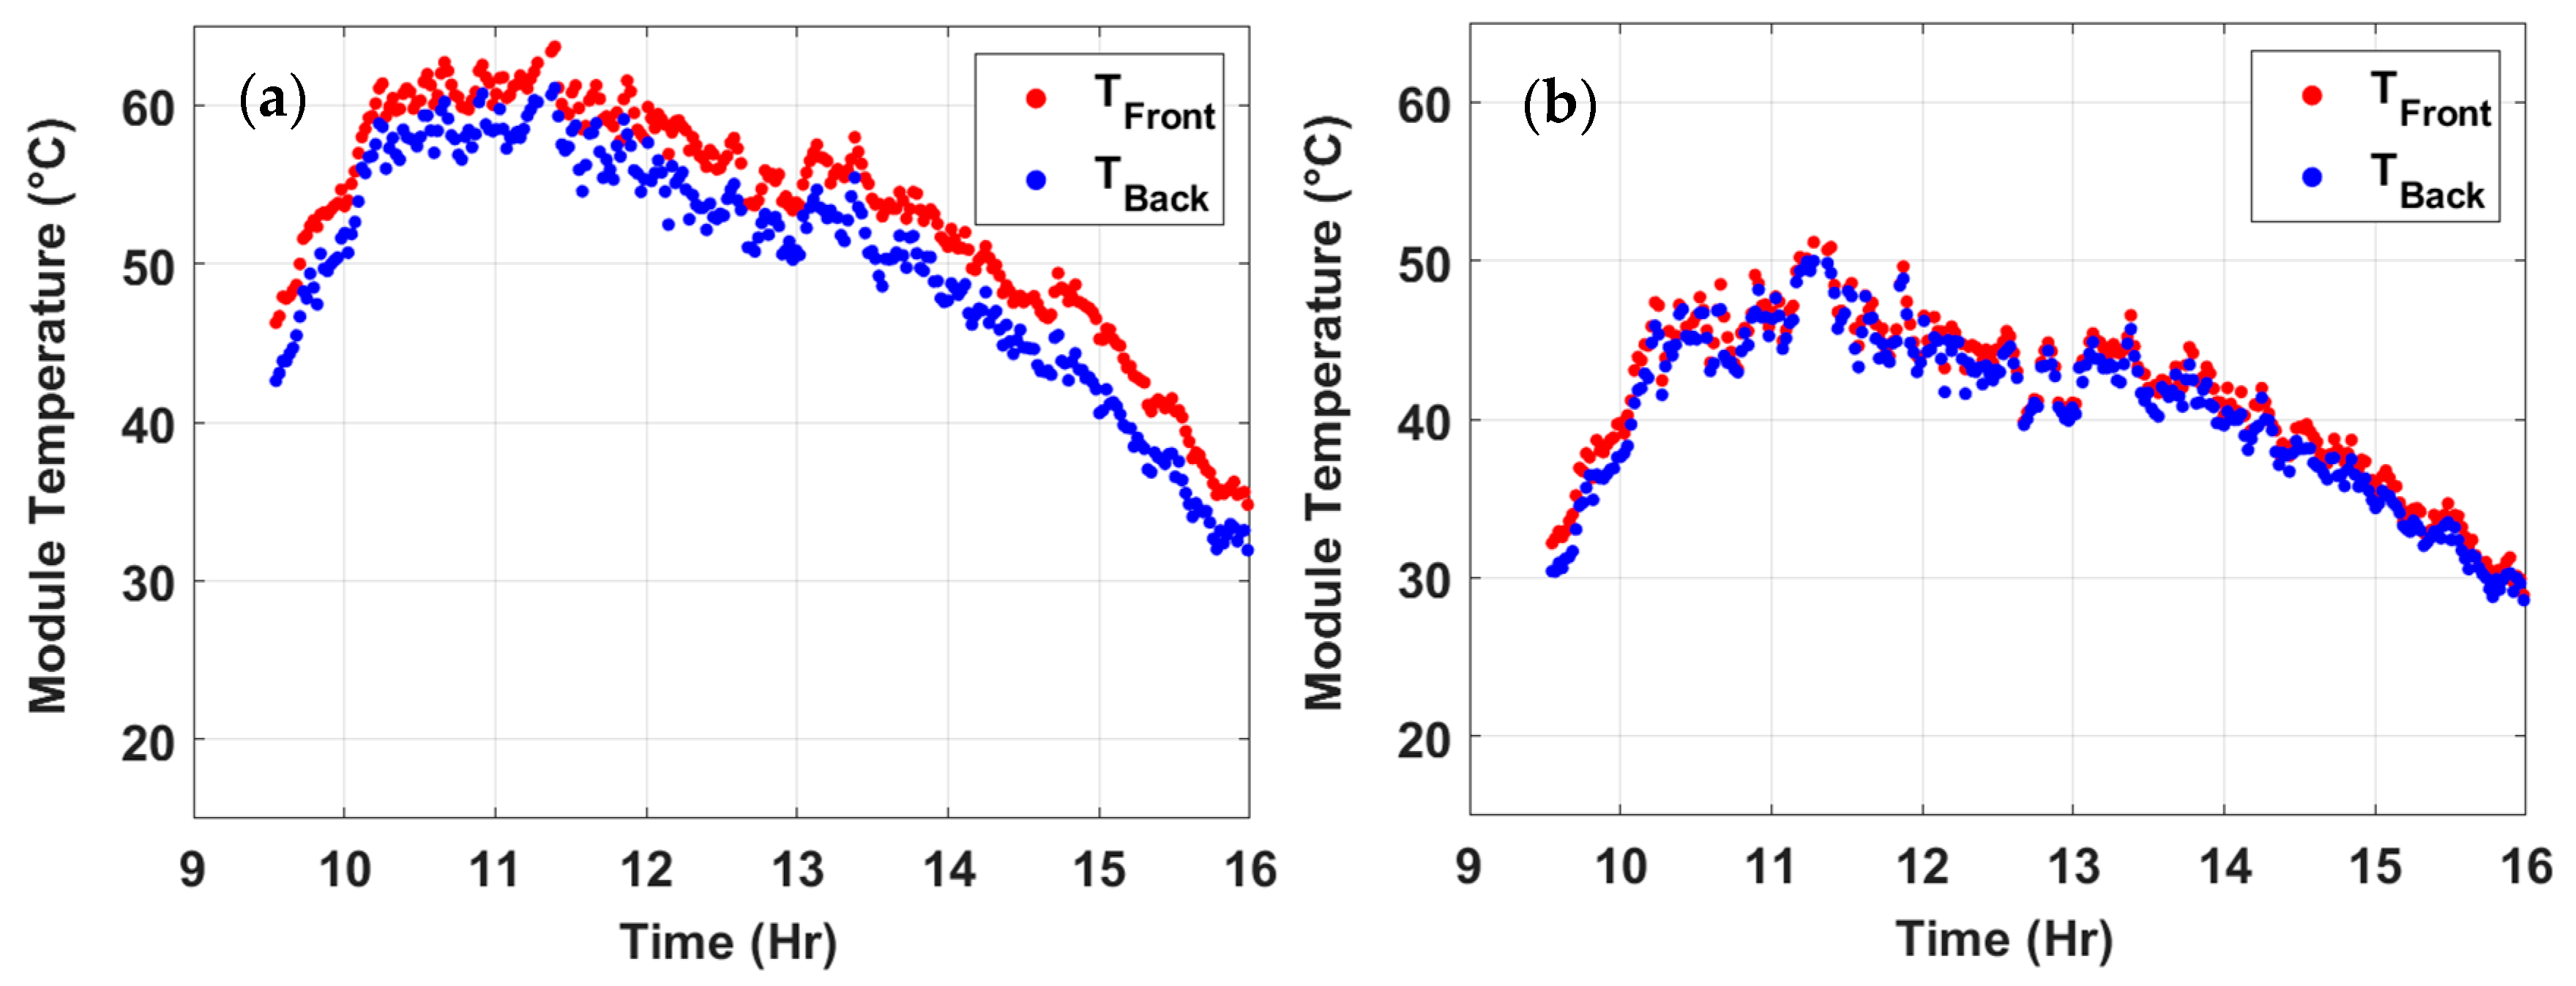
3.1. Module Temperature
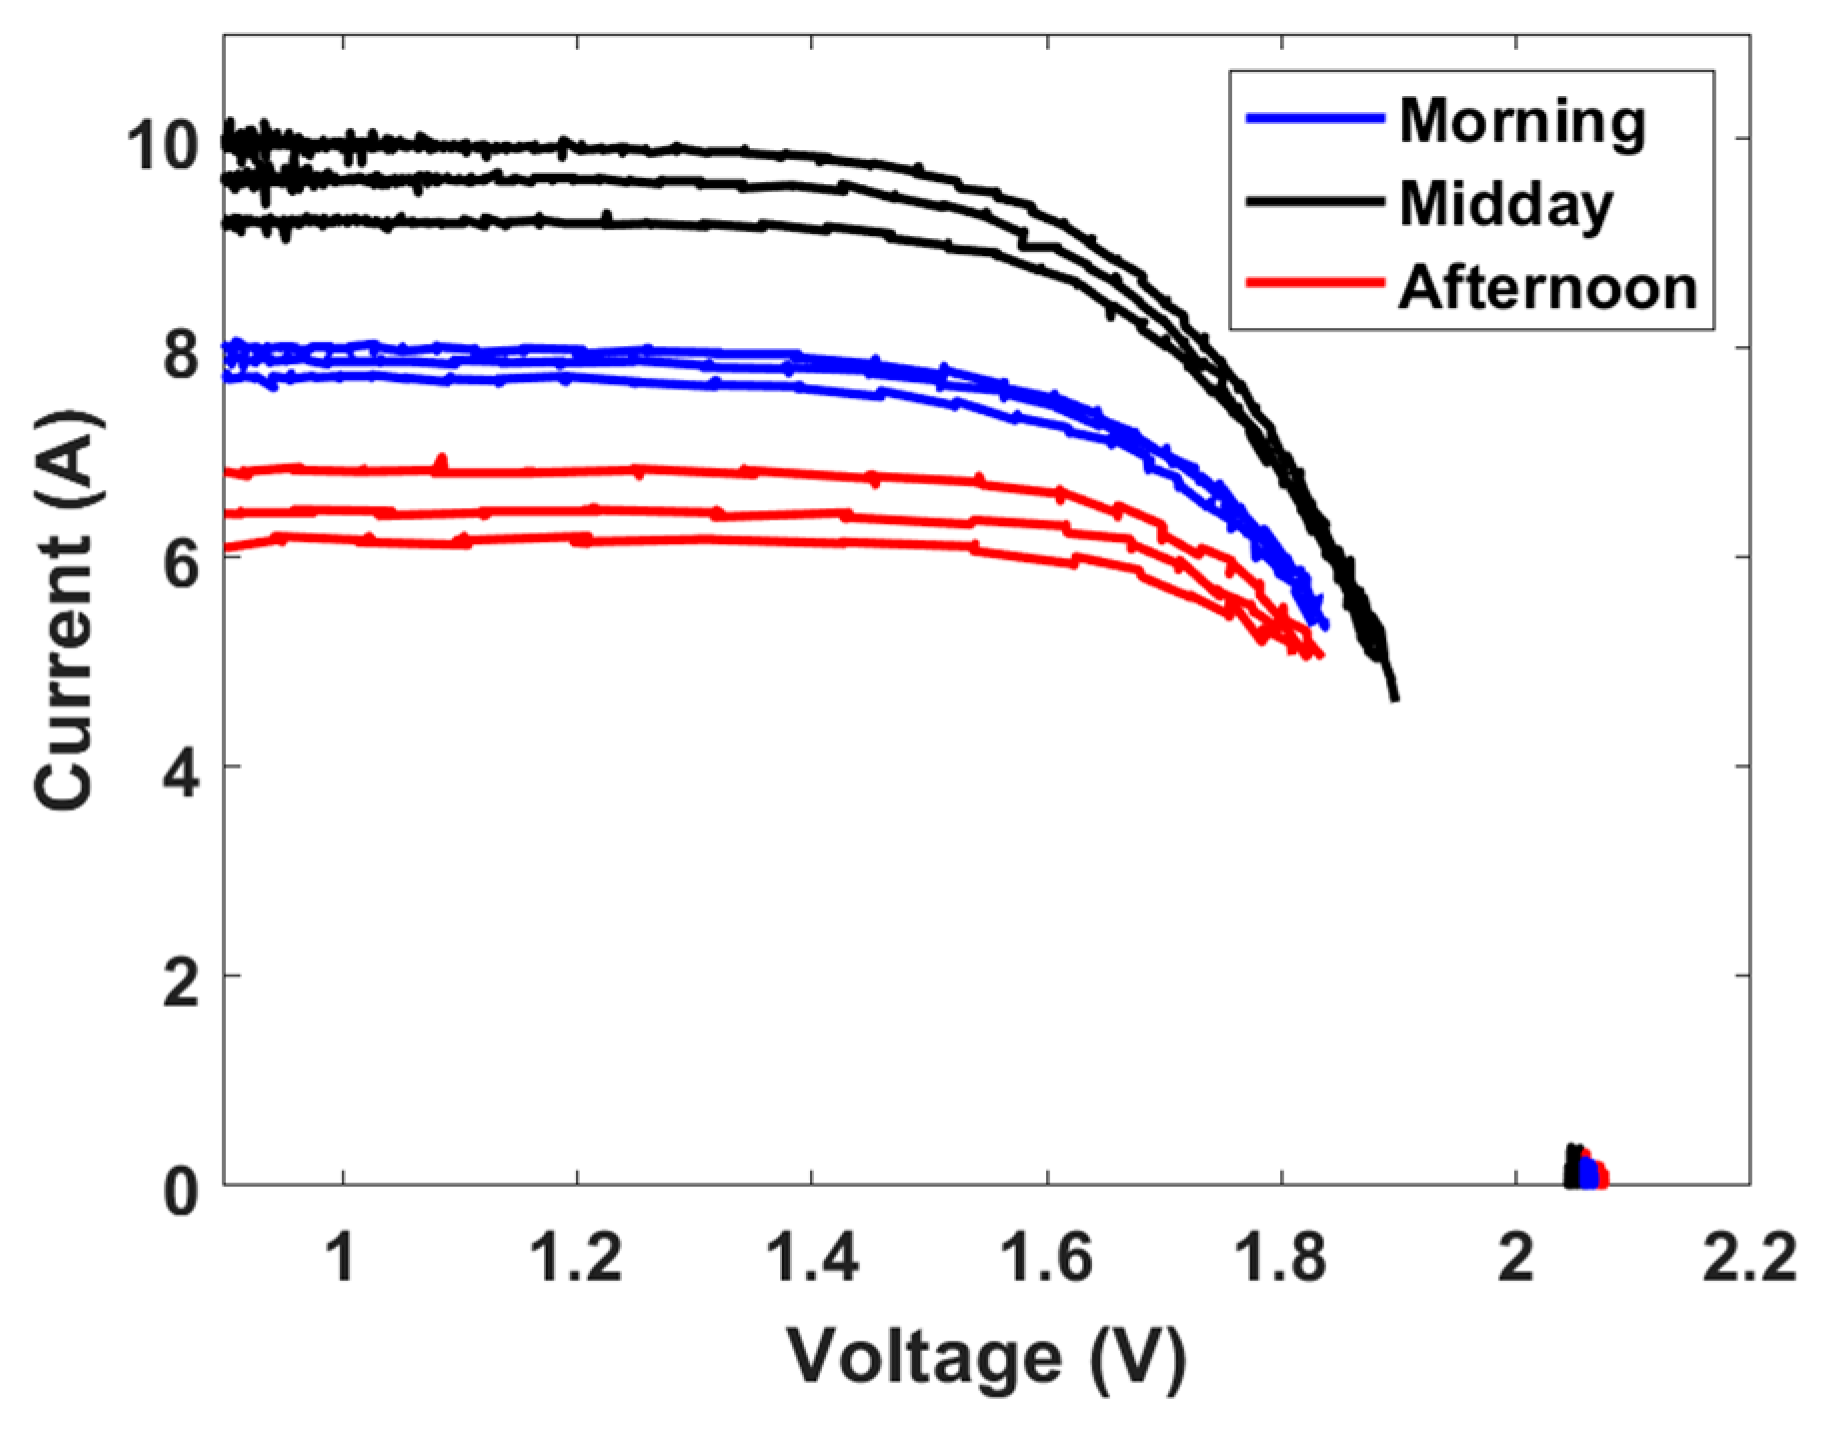
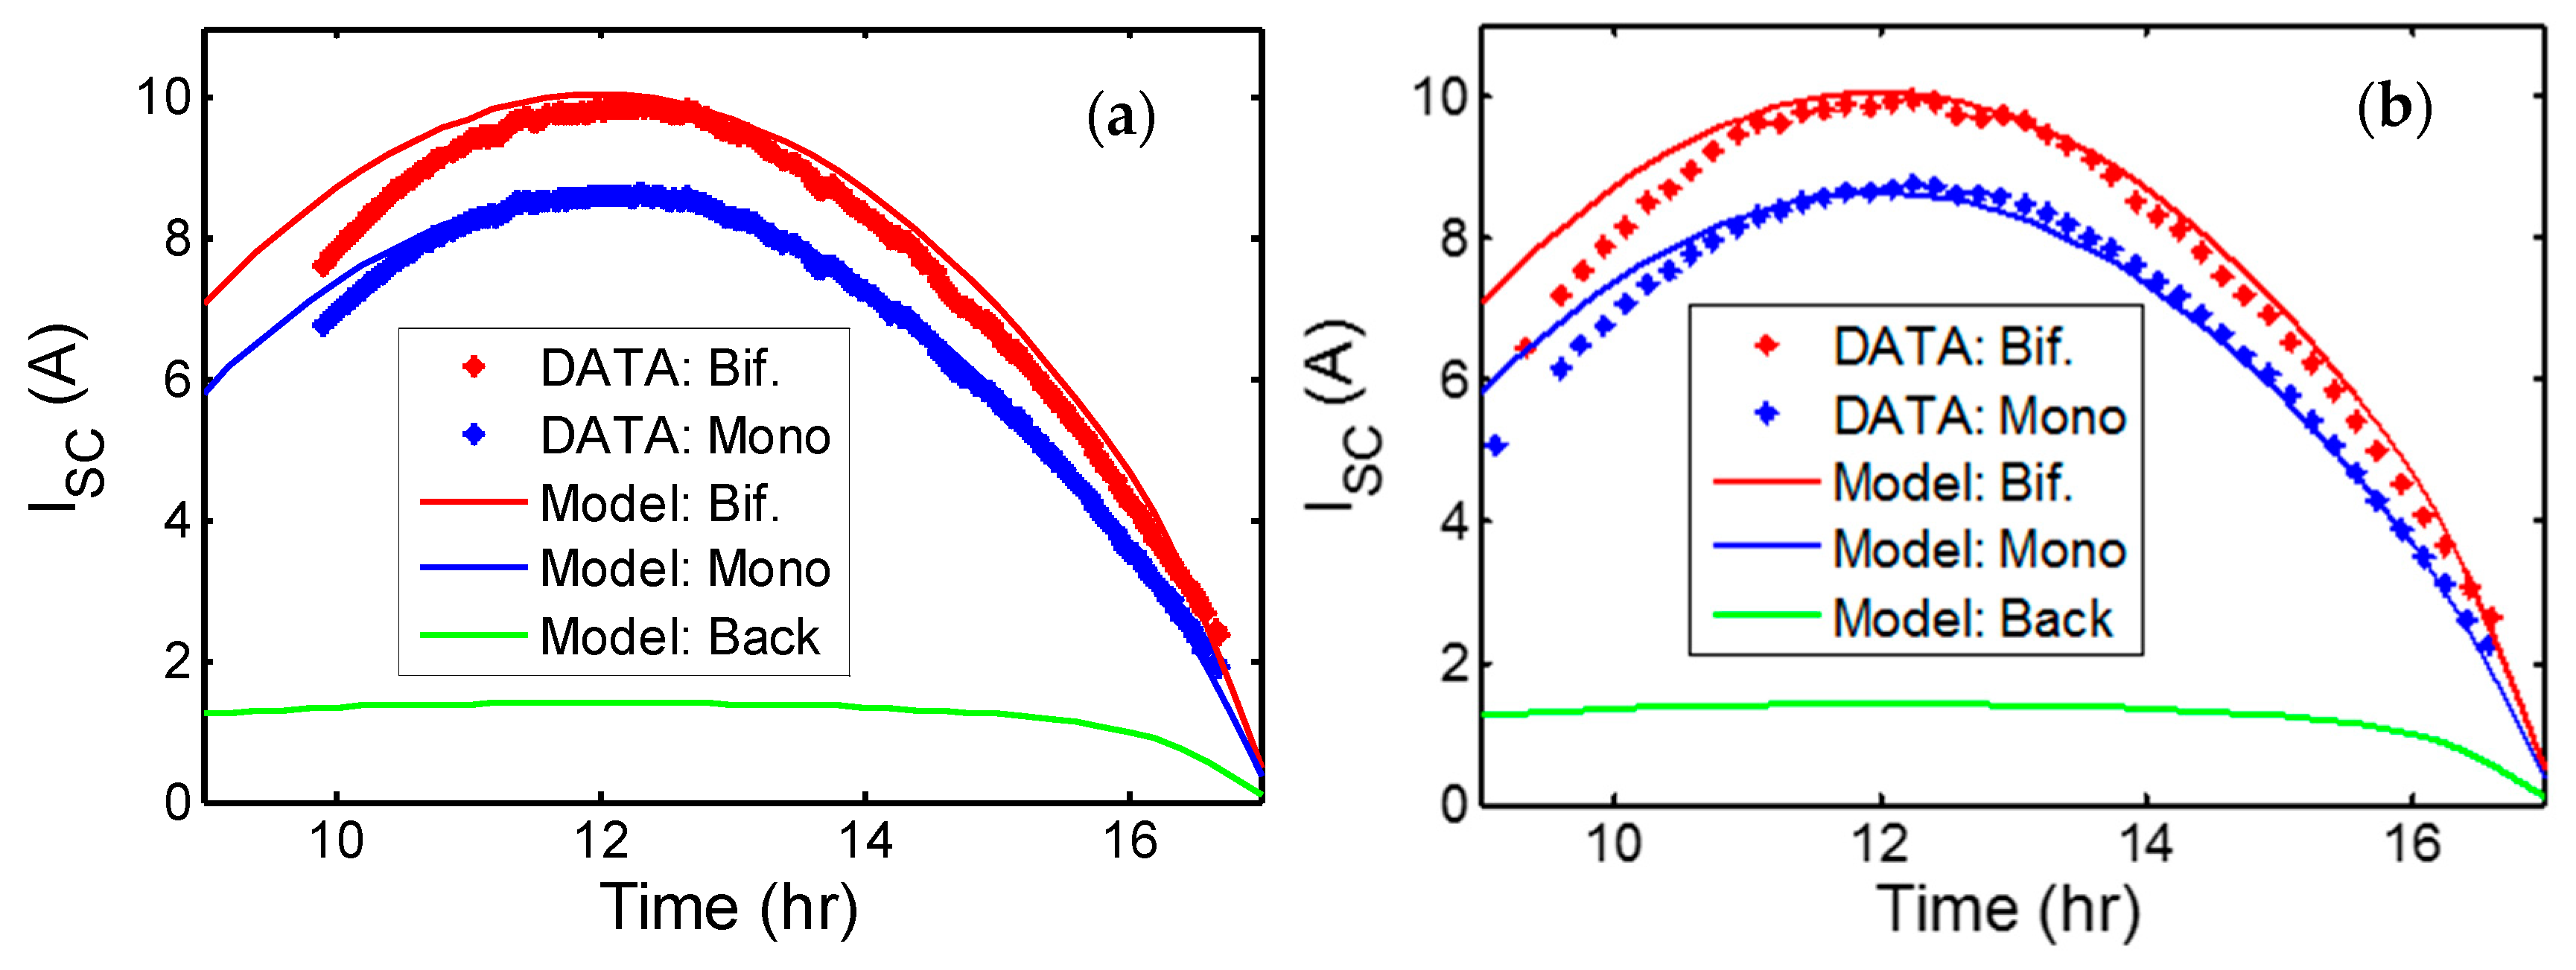
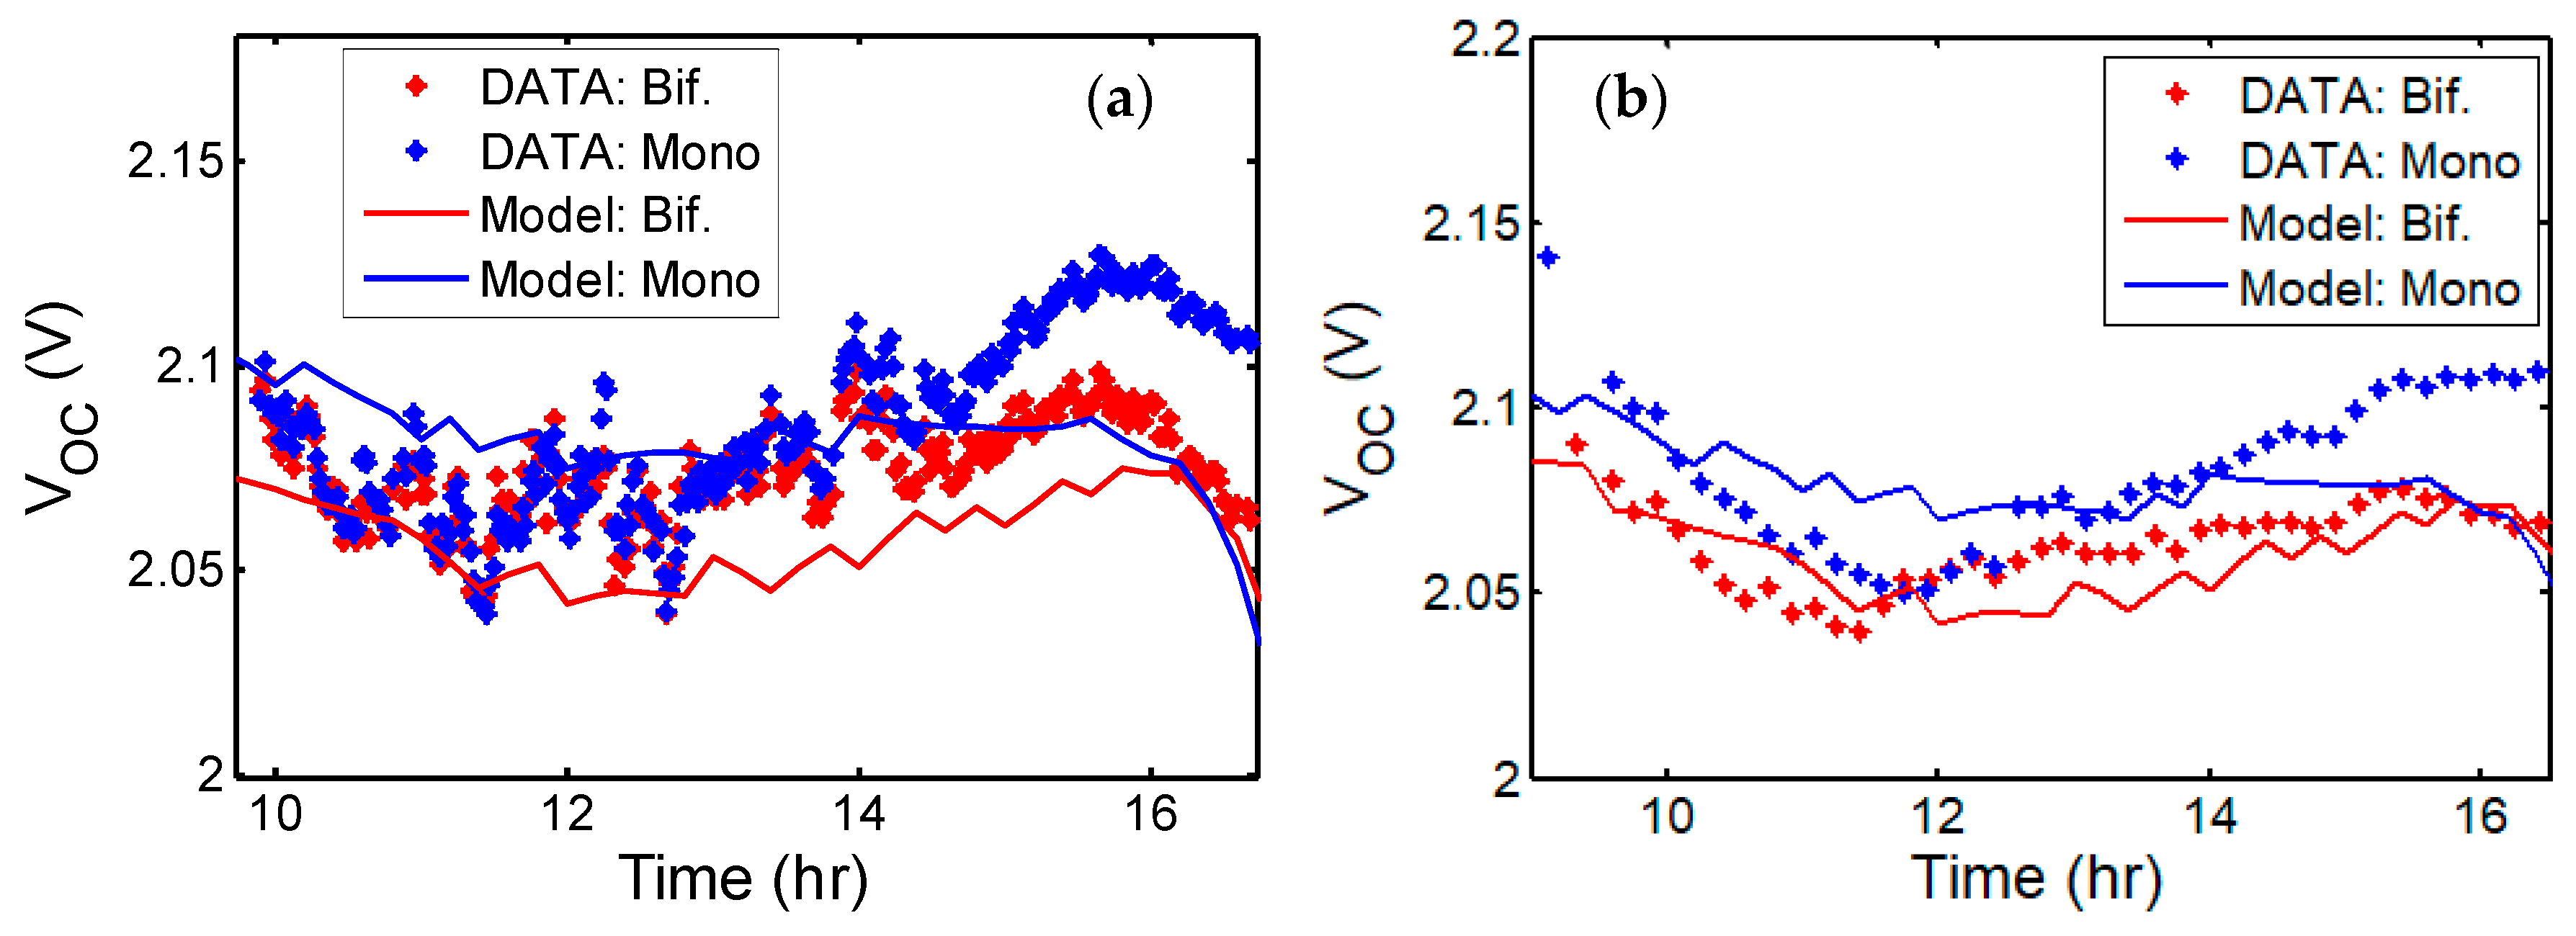
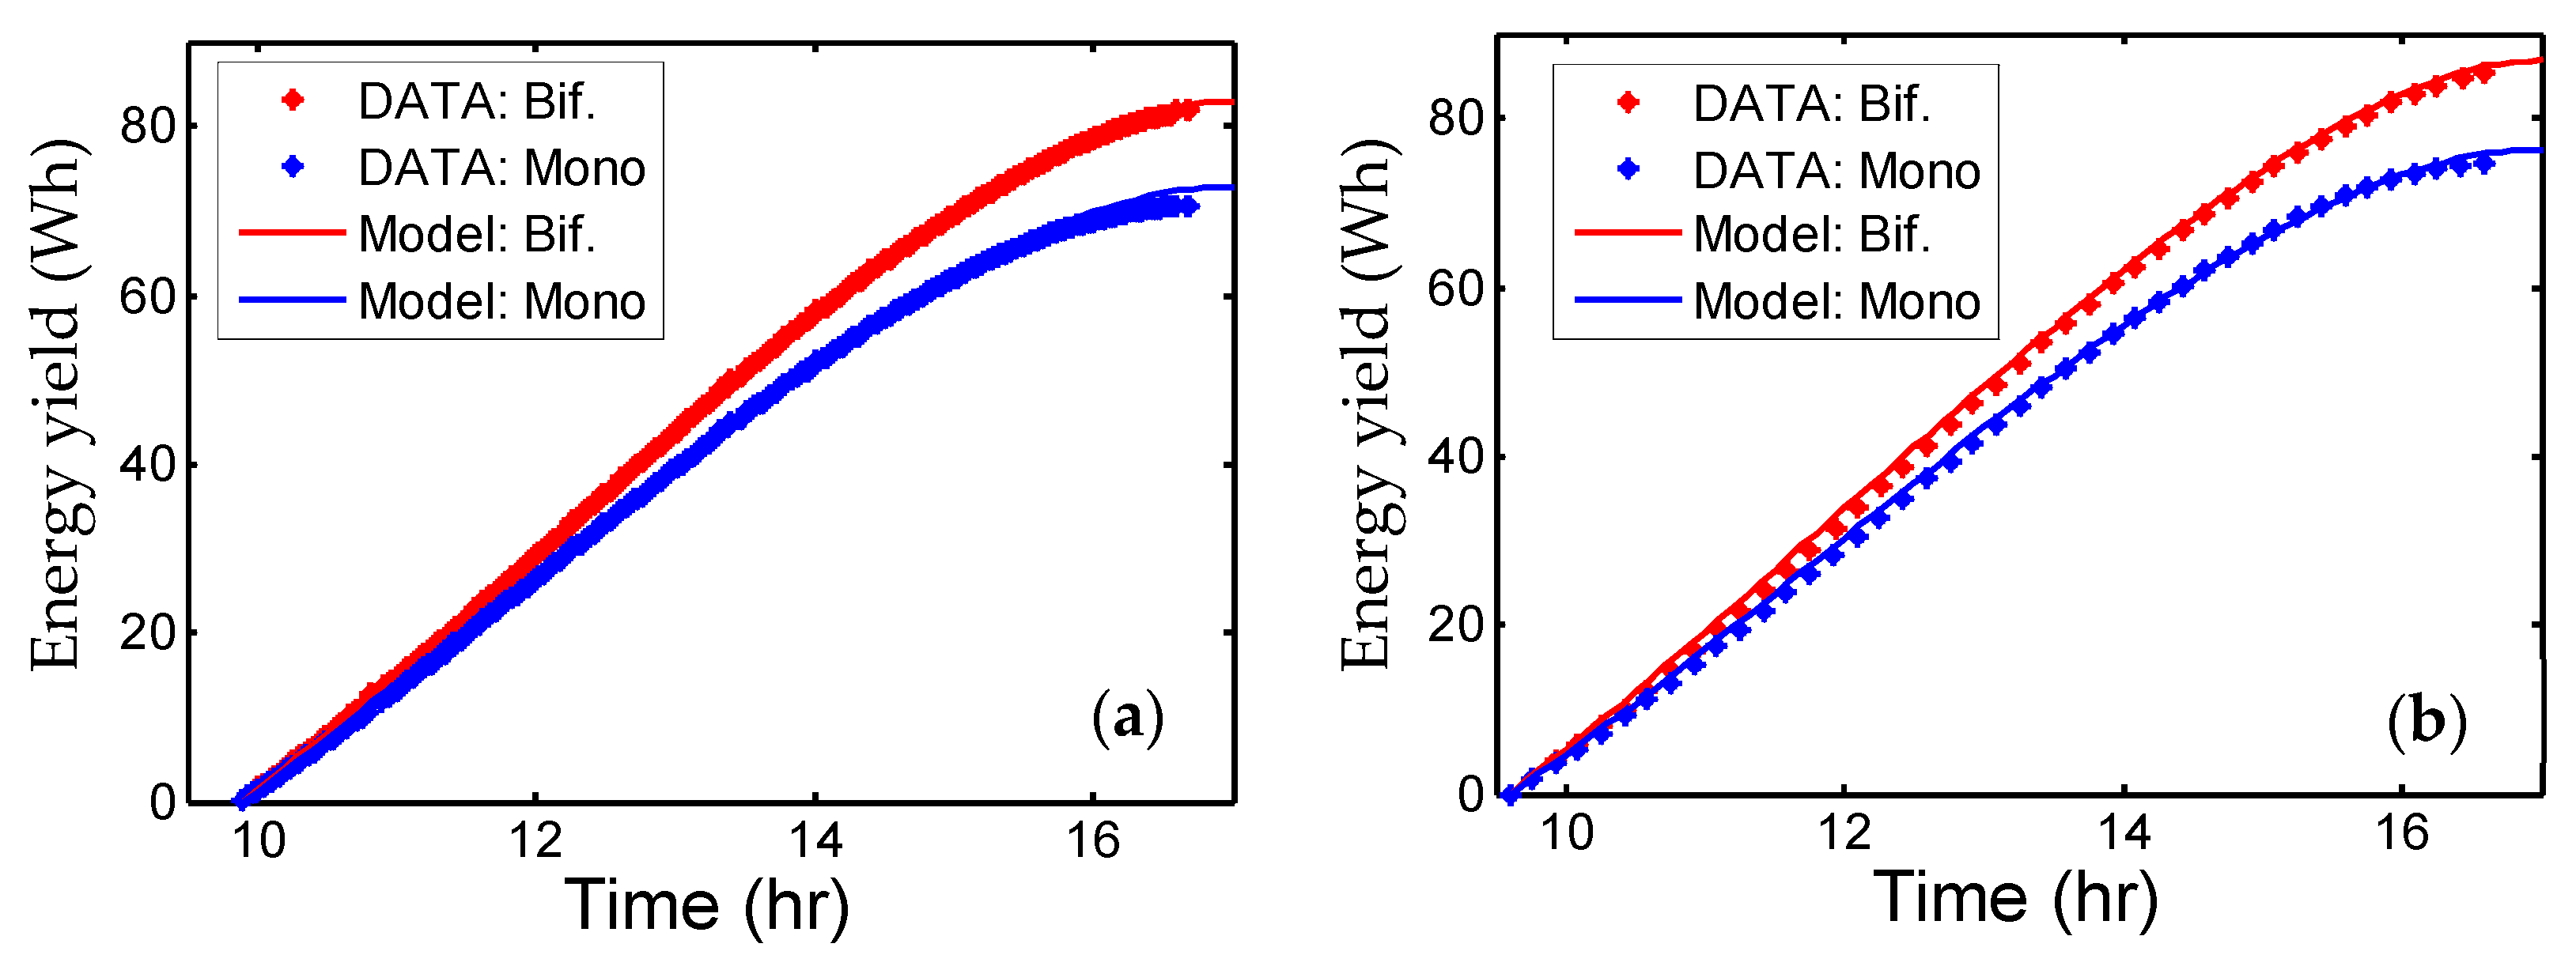
3.2. Module Electrical Parameters
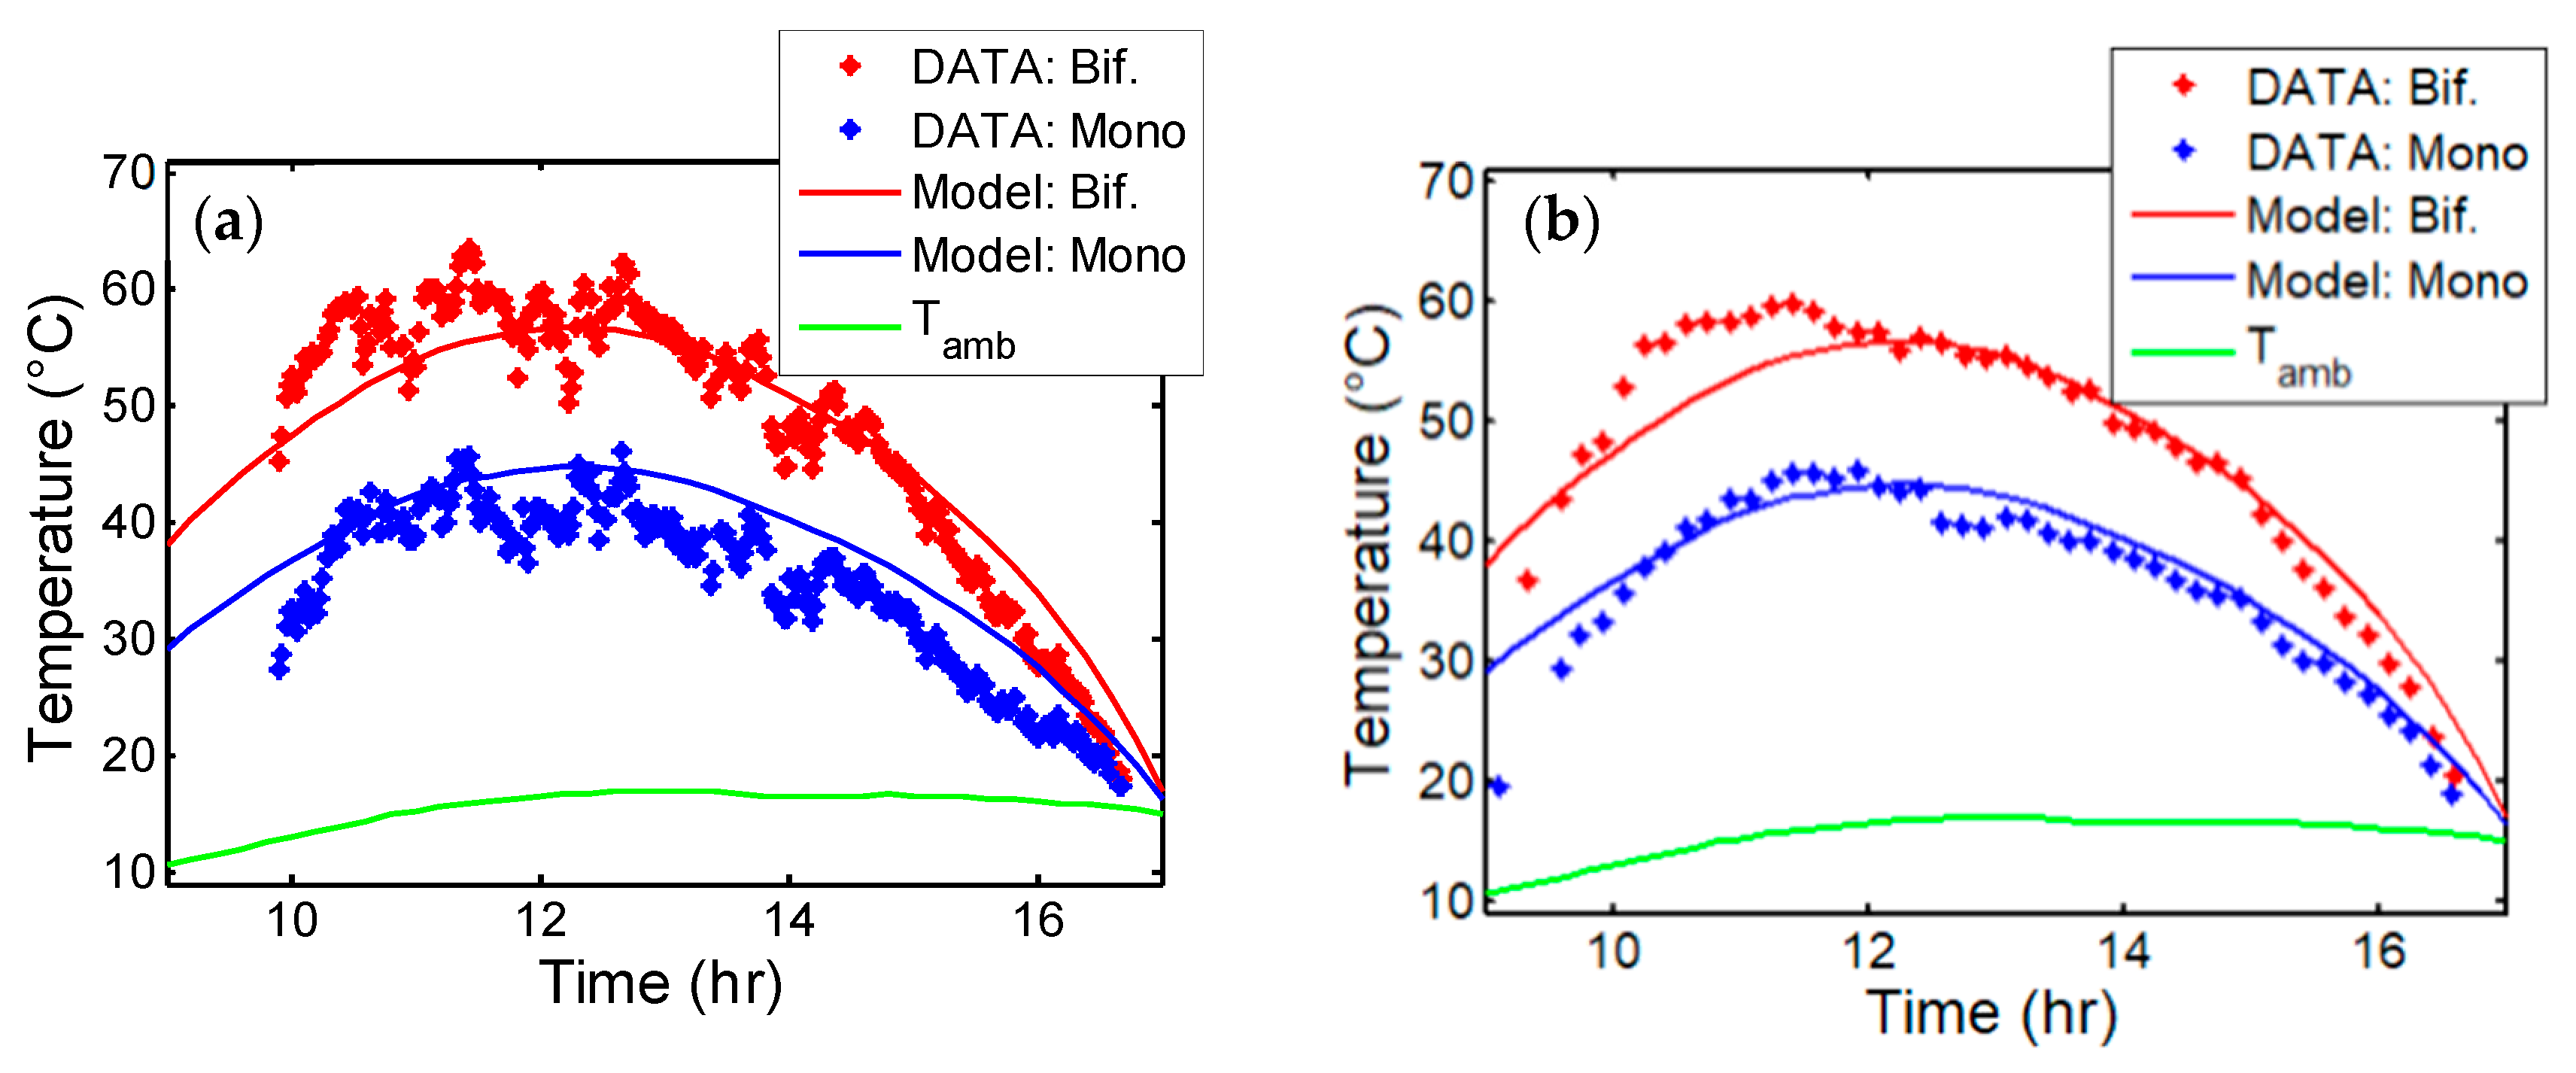
3.3. Model of Bifacial PV and Data Fitting
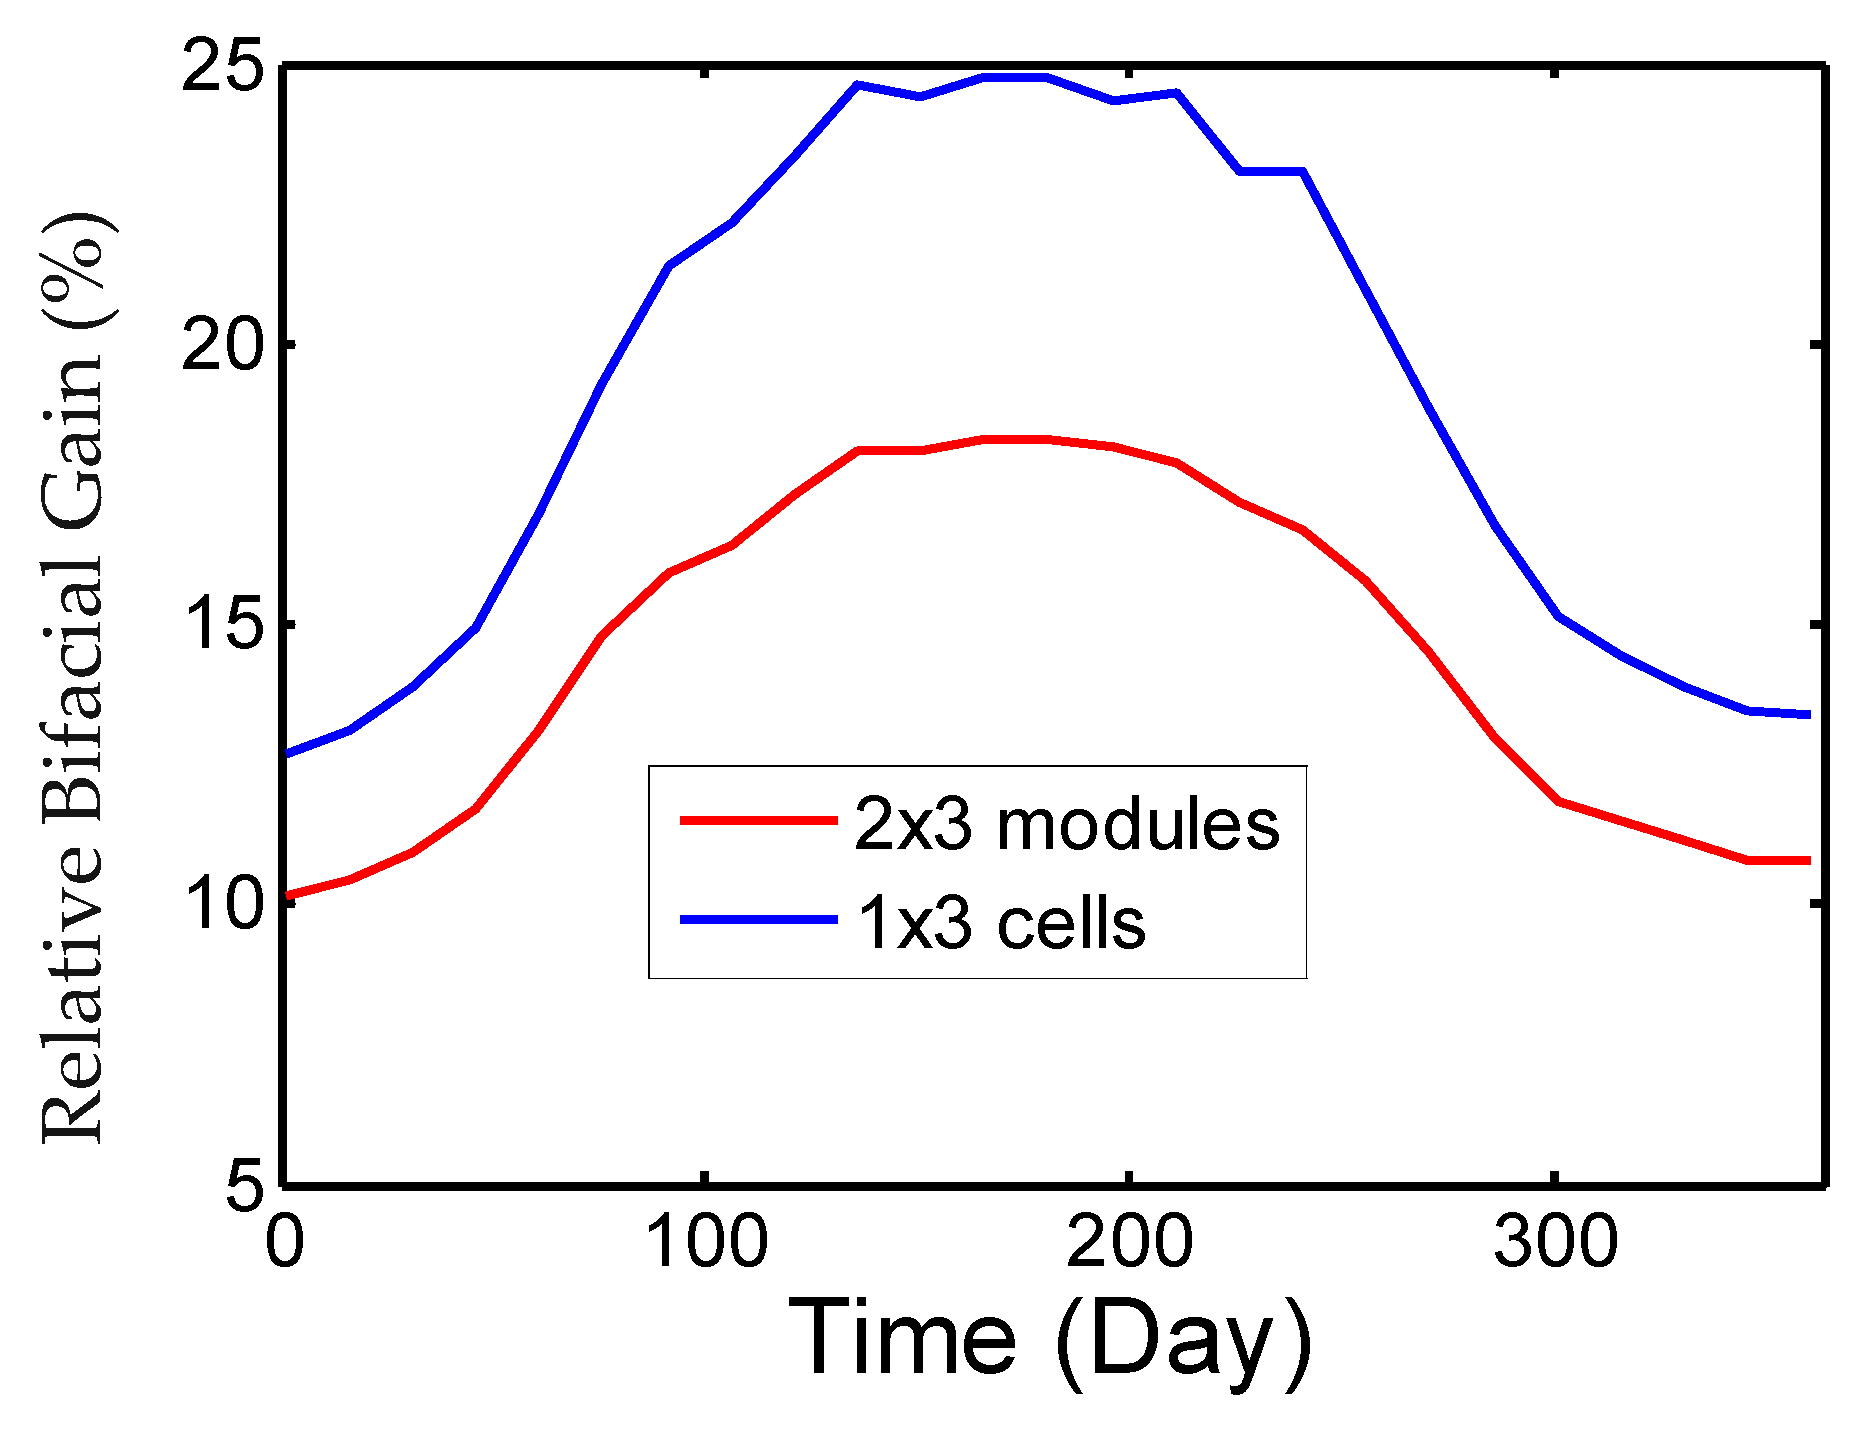
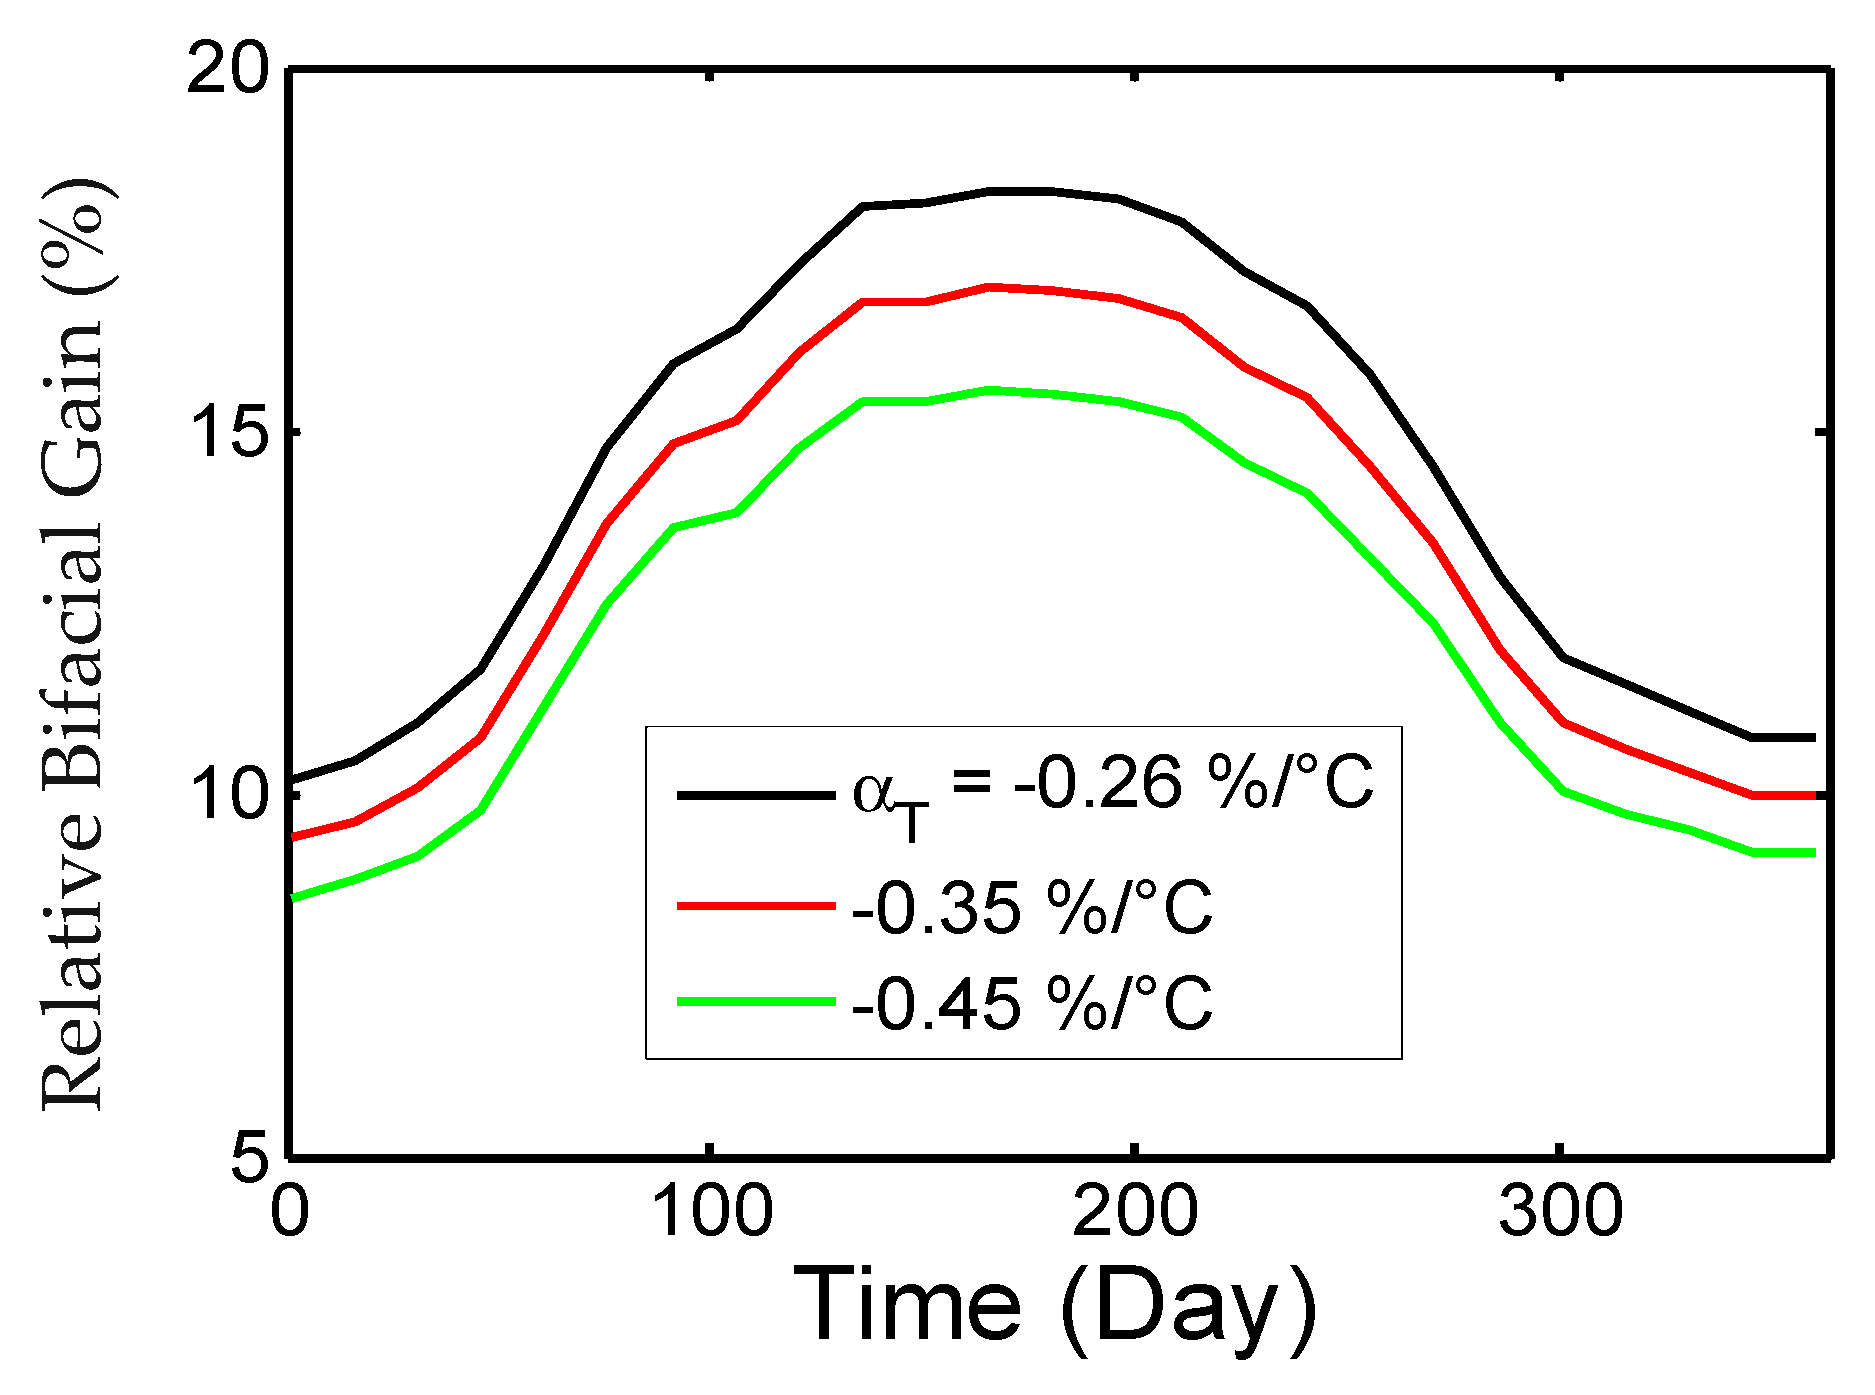
3.4. Model Extrapolations to Annual PV Energy Yield and Effect of αT
4. Conclusions
Author Contributions
Funding
Institutional Review Board Statement
Informed Consent Statement
Data Availability Statement
Conflicts of Interest
References
- International Technology Roadmap for Photovoltaics, 12th ed. 2021. Available online: https://itrpv.vdma.org/en/ (accessed on 20 February 2021).
- Liang, T.S.; Pravettoni, M.; Deline, C.; Stein, J.S.; Kopecek, R.; Singh, J.P.; Luo, W.; Wang, Y.; Aberle, A.G.; Khoo, Y.S. A review of crystalline silicon bifacial photovoltaic performance characterisation and simulation. Energy Environ. Sci. 2019, 12, 116–148. [Google Scholar] [CrossRef]
- Gu, W.; Ma, T.; Ahmed, S.; Zhang, Y.; Peng, J. A comprehensive review and outlook of bifacial photovoltaic (bPV) technology. Energy Convers. Manag. 2020, 223, 113283. [Google Scholar] [CrossRef]
- Patel, M.T.; Vijayan, R.A.; Asadpour, R.; Varadharajaperumal, M.; Khan, M.R.; Alam, M.A. Temperature-dependent energy gain of bifacial PV farms: A global perspective. Appl. Energy 2020, 276, 115405. [Google Scholar] [CrossRef]
- Yu, B.; Song, D.; Sun, Z.; Liu, K.; Zhang, Y.; Rong, D.; Liu, L. A study on electrical performance of N-type bifacial PV modules. Sol. Energy 2016, 137, 129–133. [Google Scholar] [CrossRef]
- Yusufoglu, U.A.; Lee, T.H.; Pletzer, T.M.; Halm, A.; Koduvelikulathu, L.J.; Comparotto, C.; Kopecek, R.; Kurz, H. Simulation of Energy Production by Bifacial Modules with Revision of Ground Reflection. Energy Procedia 2014, 55, 389–395. [Google Scholar] [CrossRef] [Green Version]
- Yusufoglu, U.A.; Pletzer, T.M.; Koduvelikulathu, L.J.; Comparotto, C.; Kopecek, R.; Kurz, H. Analysis of the Annual Performance of Bifacial Modules and Optimization Methods. IEEE J. Photovolt. 2015, 5, 320–328. [Google Scholar] [CrossRef]
- Shoukry, I.; Libal, J.; Kopecek, R.; Wefringhaus, E.; Werner, J. Modelling of Bifacial Gain for Stand-alone and in-field Installed Bifacial PV Modules. Energy Procedia 2016, 92, 600–608. [Google Scholar] [CrossRef] [Green Version]
- Sun, X.; Khan, M.R.; Deline, C.; Alam, M.A. Optimization and performance of bifacial solar modules: A global perspective. Appl. Energy 2018, 212, 1601–1610. [Google Scholar] [CrossRef] [Green Version]
- Galluzzo, F.R.; Canino, A.; Gerardi, C.; Lombardo, S.A. A new model for predicting bifacial PV modules performance: First validation results. In Proceedings of the 2019 IEEE 46th Photovoltaic Specialists Conference (PVSC), Chicago, IL, USA, 16–21 June 2019; pp. 1293–1297. [Google Scholar] [CrossRef]
- Galluzzo, F.R.; Zani, P.E.; Foti, M.; Canino, A.; Gerardi, C.; Lombardo, S. Numerical Modeling of Bifacial PV String Performance: Perimeter Effect and Influence of Uniaxial Solar Trackers. Energies 2020, 13, 869. [Google Scholar] [CrossRef] [Green Version]
- Lamers, M.W.P.E.; Özkalay, E.; Gali, R.S.R.; Janssen, G.J.M.; Weeber, A.W.; Romijn, I.G.; Van Aken, B.B. Temperature effects of bifacial modules: Hotter or cooler? Sol. Energy Mater. Sol. Cells 2018, 185, 192–197. [Google Scholar] [CrossRef]
- Zhang, Z.; Wu, M.; Lu, Y.; Xu, C.; Wang, L.; Hu, Y.; Zhang, F. The mathematical and experimental analysis on the steady-state operating temperature of bifacial photovoltaic modules. Renew. Energy 2020, 155, 658–668. [Google Scholar] [CrossRef]
- Rodríguez-Gallegos, C.D.; Bieri, M.; Gandhi, O.; Singh, J.P.; Reindl, T.; Panda, S.K. Monofacial vs. bifacial Si-based PV modules: Which one is more cost-effective? Sol. Energy 2018, 176, 412–438. [Google Scholar] [CrossRef]
- McIntosh, K.R.; Jung, J.; Abbott, M.D.; Sudbury, B.A. Determination and evaluation of a backsheet’s intrinsic reflectance. AIP Conf. Proc. 2018, 1999, 020018. [Google Scholar] [CrossRef]
- Privitera, S.; Muller, M.; Zwaygardt, W.; Carmo, M.; Milazzo, R.; Zani, P.; Leonardi, M.; Maita, F.; Canino, A.; Foti, M.; et al. Highly efficient solar hydrogen production through the use of bifacial photovoltaics and membrane electrolysis. J. Power Sources 2020, 473, 228619. [Google Scholar] [CrossRef]
- Notton, G.; Cristofari, C.; Mattei, M.; Poggi, P. Modelling of a double-glass photovoltaic module using finite differences. Appl. Therm. Eng. 2005, 25, 2854–2877. [Google Scholar] [CrossRef]
- Marion, B.; MacAlpine, S.; Deline, C.; Asgharzadeh, A.; Toor, F.; Riley, D.; Stein, J.; Hansen, C. A Practical Irradiance Model for Bifacial PV Modules. In Proceedings of the 2017 IEEE 44th Photovoltaic Specialist Conference (PVSC), Washington, DC, USA, 25–30 June 2017; pp. 1537–1542. [Google Scholar] [CrossRef]
- American Society of Heating, Refrigerating and Air-Conditioning Engineers. ASHRAE Handbook, 1985 Fundamentals: An Instrument of Service Prepared for the Profession Containing Technical Information; The Society: Atlanta, GA, USA, 1985. [Google Scholar]
- Global Solar Atlas. Available online: https://globalsolaratlas.info/ (accessed on 20 February 2021).
- Liu, B.; Jordan, R. Daily insolation on surfaces tilted towards equator. ASHRAE J. 1961, 10, 53–59. [Google Scholar]
- Ross, R.G., Jr. Interface design considerations for terrestrial solar cell modules. In Proceedings of the 12th Photovoltaic Specialists Conference, Baton Rouge, LA, USA, 15–18 November 1976; pp. 801–806. [Google Scholar]
- Xiao, W.; Dunford, W.G.; Capel, A. A novel modeling method for photovoltaic cells. In Proceedings of the 2004 IEEE 35th Annual Power Electronics Specialists Conference (IEEE Cat. No.04CH37551), Aachen, Germany, 20–25 June 2004; pp. 1950–1956. [Google Scholar]
- Santiago, I.; Trillo-Montero, D.; Moreno-Garcia, I.; Pallarés-López, V.; Luna-Rodríguez, J. Modeling of photovoltaic cell temperature losses: A review and a practice case in South Spain. Renew. Sustain. Energy Rev. 2018, 90, 70–89. [Google Scholar] [CrossRef]
- Weather Underground. 2020. Available online: https://www.wunderground.com/ (accessed on 20 February 2021).
- Zouine, M.; Akhsassi, M.; Erraissi, N.; Aarich, N.; Bennouna, A.; Raoufi, M.; Outzourhit, A. Mathematical Models Calculating PV Module Temperature Using Weather Data: Experimental Study BT. In Proceedings of the 1st International Conference on Electronic Engineering and Renewable Energy, Saidia, Morocco, 15–17 April 2018; pp. 630–639. [Google Scholar]
- Foti, M.; Galiazzo, M.; Cerasti, L.; Sovernigo, E.; Gerardi, C.; Guglielmino, A.; Litrico, G.; Sciuto, M.; Spampinato, A.; Ragonesi, A.; et al. Silicon Heterojunction Solar Module using Shingle interconnection. In Proceedings of the 2021 IEEE 48th Photovoltaic Specialists Conference (PVSC), Fort Lauderdale, FL, USA, 20–25 June 2021; pp. 1092–1095. [Google Scholar] [CrossRef]
- Green, M.A.; Dunlop, E.D.; Hohl-Ebinger, J.; Yoshita, M.; Kopidakis, N.; Hao, X. Solar cell efficiency tables (Version 58). Prog. Photovolt. Res. Appl. 2021, 29, 657–667. [Google Scholar] [CrossRef]
- Park, H.; Chang, S.; Park, S.; Kim, W.K. Outdoor Performance Test of Bifacial n-Type Silicon Photovoltaic Modules. Sustainability 2019, 11, 6234. [Google Scholar] [CrossRef] [Green Version]
- Molin, E.; Stridh, B.; Molin, A.; Wackelgard, E. Experimental Yield Study of Bifacial PV Modules in Nordic Conditions. IEEE J. Photovolt. 2018, 8, 1457–1463. [Google Scholar] [CrossRef]
- Jang, J.; Lee, K. Practical Performance Analysis of a Bifacial PV Module and System. Energies 2020, 13, 4389. [Google Scholar] [CrossRef]
- Gu, W.; Li, S.; Liu, X.; Chen, Z.; Zhang, X.; Ma, T. Experimental investigation of the bifacial photovoltaic module under real conditions. Renew. Energy 2020, 173, 1111–1122. [Google Scholar] [CrossRef]
- Abotaleb, A.; Abdallah, A. Performance of bifacial-silicon heterojunction modules under desert environment. Renew. Energy 2018, 127, 94–101. [Google Scholar] [CrossRef]


| Parameter | Best-Fit Value | Measured STC Value |
|---|---|---|
| PV cell Isc | 9.15 A | 9.30 A |
| PV cell Voc | 720 mV | 730 mV |
| PV cell Rs | 6 mΩ | 3 mΩ |
| PCCE at maximum power point | 21.1% | 22.7% |
| αT | −0.26%/°C | −0.26%/°C |
| Mini-module NOCTmono | 42 °C | - |
| Mini-module NOCTbif | 47 °C | - |
Publisher’s Note: MDPI stays neutral with regard to jurisdictional claims in published maps and institutional affiliations. |
© 2021 by the authors. Licensee MDPI, Basel, Switzerland. This article is an open access article distributed under the terms and conditions of the Creative Commons Attribution (CC BY) license (https://creativecommons.org/licenses/by/4.0/).
Share and Cite
Leonardi, M.; Corso, R.; Milazzo, R.G.; Connelli, C.; Foti, M.; Gerardi, C.; Bizzarri, F.; Privitera, S.M.S.; Lombardo, S.A. The Effects of Module Temperature on the Energy Yield of Bifacial Photovoltaics: Data and Model. Energies 2022, 15, 22. https://doi.org/10.3390/en15010022
Leonardi M, Corso R, Milazzo RG, Connelli C, Foti M, Gerardi C, Bizzarri F, Privitera SMS, Lombardo SA. The Effects of Module Temperature on the Energy Yield of Bifacial Photovoltaics: Data and Model. Energies. 2022; 15(1):22. https://doi.org/10.3390/en15010022
Chicago/Turabian StyleLeonardi, Marco, Roberto Corso, Rachela G. Milazzo, Carmelo Connelli, Marina Foti, Cosimo Gerardi, Fabrizio Bizzarri, Stefania M. S. Privitera, and Salvatore A. Lombardo. 2022. "The Effects of Module Temperature on the Energy Yield of Bifacial Photovoltaics: Data and Model" Energies 15, no. 1: 22. https://doi.org/10.3390/en15010022