
Dynamic Simulation-Based Surrogate Model for the Dimensioning of Building Energy Systems


1
Department of Mechanical Engineering, Faculty of Engineering, University of Western Macedonia, 50100 Kozani, Greece
2
Department of Electrical & Computer Engineering, Faculty of Engineering, University of Western Macedonia, 50100 Kozani, Greece
*
Author to whom correspondence should be addressed.
Energies 2021, 14(21), 7141; https://doi.org/10.3390/en14217141
Submission received: 29 September 2021
/
Revised: 16 October 2021
/
Accepted: 26 October 2021
/
Published: 1 November 2021
(This article belongs to the Section G: Energy and Buildings)
Abstract
:In recent decades, building design and operation have been an important field of study, due to the significant share of buildings in global primary energy consumption and the time that most people spend indoors. As such, multiple studies focus on aspects of building energy consumption and occupant comfort optimization. The scientific community has discerned the importance of operation optimization through retrofitting actions for on-site building energy systems, achieved by the use of simulation techniques, surrogate modeling, as well as the guidance of existing building performance and indoor occupancy standards. However, more knowledge should be attained on the matter of whether this methodology can be extended towards the early stages of thermal system and/or building design. To this end, the present study provides a building thermal system design optimization methodology. A data set of minimum thermal system power, for a typical range of building characteristics, is generated, according to the criterion of occupant discomfort in degree hours. Respectively, a surrogate model, providing a configurable correlation of the above set of thermal system dimensioning solutions is developed, using regression model fitting techniques. Computational results indicate that such a model could provide both desirable calculative simplification and accuracy on par with existing respective thermal load calculation standards and simplified system dimensioning methods.
1. Introduction
Buildings account for a significant amount of total global energy consumption. More specifically, in 2018, consumption in the European Union reached approximately 40% of total primary energy [1]. In the past few decades, the engineering community has developed several ways to design and dimension building envelopes and Heating, Ventilation and Air Conditioning (HVAC) systems, so as to achieve a comfortable inner environment for occupants. International standards, such as ANSI/ASHRAE/IES Standard 90 [2,3] and EPBD [4] aid engineers with generalized calculation methodologies for energy efficient buildings and thermal system dimensioning. These standards provide calculating methodologies regarding the monthly/annual thermal and cooling building loads, as well as the energy consumed by HVAC systems. The ISO EN 13790 standard [5] provides a monthly calculation procedure of the required thermal loads. It also contains a methodology for modeling the thermal behavior of the building on an hourly basis, thus capturing more dynamic thermal states, namely the 5R1C (5 Resistance, 1 Capacitance) model.
Besides energy consumption, occupant comfort in indoor environments has become a growing concern, as it is evident that people tend to spend most of their time indoors [6]. Occupant comfort aspects can be divided into thermal, acoustic, and visual, as well as comfort related to air quality; the term Indoor Environmental Quality (IEQ) aims at including all the above parameters [7], while aspects like space adequacy can also be important [8].
According to the review by Al Horr et al. [9], the most prevalent comfort aspects are thermal and air quality comfort, as they directly affect human health when staying indoors. Occupant thermal comfort [10] is defined as “the condition of mind that expresses satisfaction with the thermal environment”. It is stated by Frontczak and Wargocki [11] that occupant comfort and satisfaction are linked to the occupant’s ability to possibly control the indoor environment. The same study also indicates that occupants tend to favor thermal comfort more than the rest of the comfort aspects.
Regarding air quality, ANSI/ASHRAE 62 [12] defines acceptable air quality as “air in which there are no known contaminants at harmful concentrations as determined by cognizant authorities and with which a substantial majority (80% or more) of the people exposed do not express dissatisfaction”. Schieweck et al. [13] point out that “Unlike temperature, which people sense and can tell whether it is appropriate or not, presence of air pollutants is not always sensed by people, and in fact people cannot smell one of the most common indoor pollutant generated by themselves, carbon dioxide (CO2)”. It is noted that CO2 is not a harmful gas by itself, but in high concentrations, it implies that oxygen (O2) concentration is reduced and causes occupant discomfort. Moreover, Fisk et al. [14] states that a reduced rate of indoor air renewal in the workplace contributes to the onset of Sick-Building Syndrome (SBS), namely a set of health problems caused by a person staying in closed working environments and residences.
The optimal IEQ becomes a significant issue to be looked into. According to the literature review of Ortiz et al. [15], “There are indications that energy-retrofitted buildings can create risks for indoor environmental quality (IEQ) and therefore for health and comfort of occupants”, as optimizing building energy consumption does not take occupant comfort and health directly into account, a characteristic also noticed in existing standards, such as EPBD [4] and ISO EN 13790 [5]. That also means occupant comfort consideration during the initial design phase is of great significance.
For all those challenges to be overcome, there is the need for gaining a better insight into the dynamic mechanics that determine inner environmental conditions, as well as calculative simplification. Building modeling has been proven a suitable tool for simulating building thermal behavior and provides ample information regarding thermal loads on a seasonal or monthly basis. It also allows computation of the respective energy consumption on the basis of diverse energy system set-ups.
Michalak [16] used ISO EN13790 methodology to calculate the heating and cooling demands using both the monthly and the hourly model of the standard. The simulation was performed for ten different locations of Poland, across five climate zones. Results were similar to the ones of EnergyPlus for heating periods, while cooling period simulation results were followed by value divergence. Magni et al. [17] performed a detailed cross comparison of various building simulation tools (EnergyPlus, TRNSYS, CarnotUIBK, ALMAbuild, IDE ICE, DALEC, Modelica, and PHPP) for a simulated office building, situated in three different European cities. In their work, it becomes apparent that most tools are able to adequately quantify heating and energy demands. According to the authors, all tools manage to provide similar results. It is also stated that, while some tools (PHPP, DALEC) require a comparatively lower computational cost, they also come with a strenuous parameterization phase, in order to adequately describe the building model.
The methods used above can extract a substantial amount of information regarding complete building thermal behavior and HVAC system operation at the same time. Despite that, analytical simulations require high level system and environment detail, that translates into computational cost and required simulation time. The solution to the problem of calculative simplification is given by surrogate modeling. Surrogate models are simplified, approximate versions of simulated models [18]. They are connected with the implementation of machine learning techniques for correlation function approximation [19,20,21]. Most models can be categorized into three main types [22,23]:
- white-box models, in which the physical equations of the model are fully known
- black box models, which use optimization techniques to approximate physical equations and discover patterns
- grey box models, which are an in-between type of white and black-box models (physical model is partially known)
Surrogate modeling can use simulated or real-time data from buildings to find correlations between environmental conditions and energy consumed. Furthermore, smart building technologies can contribute greatly to the on-site system dimensioning. Namely, smart controllers, with the help of machine learning structures, can use surrogate model methodology as a retrofitting tool for existing buildings [24]. This could enable them to further optimize HVAC systems’ operation and design.
Many studies are concentrated on optimizing real time operation of existing building cases, in terms of cost and/or comfort [25,26,27,28]. Jiang et al. [29] used a reinforcement learning algorithm to optimize HVAC energy cost in the presence of variable electricity cost profiles. Other studies develop methodologies for predicting building thermal loads [30,31,32,33,34]. Guelpa et al. [35] developed a model suitable for simulating the thermal behavior of buildings and substations that are connected to district heating networks. Westermann et al. [36] developed a convolutional neural network as a surrogate model that was trained using annual weather data and simulated buildings with various characteristics across multiple locations in Canada. This model is able to estimate required heating and cooling loads of buildings in locations with different climate zones.
On the other hand, there seem to be opportunities to optimize not only existing HVAC operation, but effectively dimension heating systems from the design stages of HVAC systems, or even buildings. Caldas and Norford [37] presented an optimization algorithm for both the building envelope and the HVAC system design and operation. Carlos and Nepomuceno [38] proposed a simplified calculation methodology for heating loads to be used as a reliable estimation during the early stages of building design. Thrampoulidis et al. [39] developed a surrogate model using machine learning that offers optimized retrofit solutions for thermal systems of single and multi-family residences in the city of Zurich. In the work of Asadi et al. [40] a Multi-Objective Optimization (MOO) model is proposed for providing retrofitting solutions in school buildings, using a Genetic Algorithm (GA) and an Artificial Neural Network (ANN). However, it is noted that deciding the single optimal solution among a set of multiple optimal ones requires understanding of each building case. All in all, the literature seems to be concentrated on developing surrogate models to effectively predict building thermal behavior and using that to optimize HVAC operation, mostly in terms of energy consumption and occupant comfort. A minor part of the studies focuses on using surrogate modeling to simplify building and energy system dimensioning methodologies that could possibly outperform existing standard methodologies.
The aim of this work is to develop an optimization methodology to gain information on the nominal required thermal power of an indoor space for a specific thermal comfort level. More specifically, a surrogate model is implemented using a surrogate model-based optimization software. The proposed surrogate model is an equation that correlates the building characteristics and thermal discomfort with the thermal system nominal power and can be used in the early stages of HVAC design. Its feature is that the model not only takes building characteristics into account, but it also allows consideration of the degree of achieved occupant thermal comfort. Another trait of this methodology is that parameters and their value ranges are configurable, making the methodology flexible in its use. It may assist engineers or machine learning models in the process of calculating the required thermal power, as it offers a much lower computational load requirement than a standard dynamic method. An existing surrogate model also means that the user does not need to implement machine learning layouts for the search of the optimal solution. Those two advantages make it able to be integrated in an engineer’s daily work as a helpful tool. In the following sections, the methodology is presented, describing the assumptions and procedure for formulating the surrogate model. In the computational study section, the results of this procedure are presented, as well as a comparison with existing building standards. The discussion and conclusions aim at summarizing the main findings of this work, providing an insight into the hypotheses and generalization potential, while future work is also discussed.
2. Materials and Methods
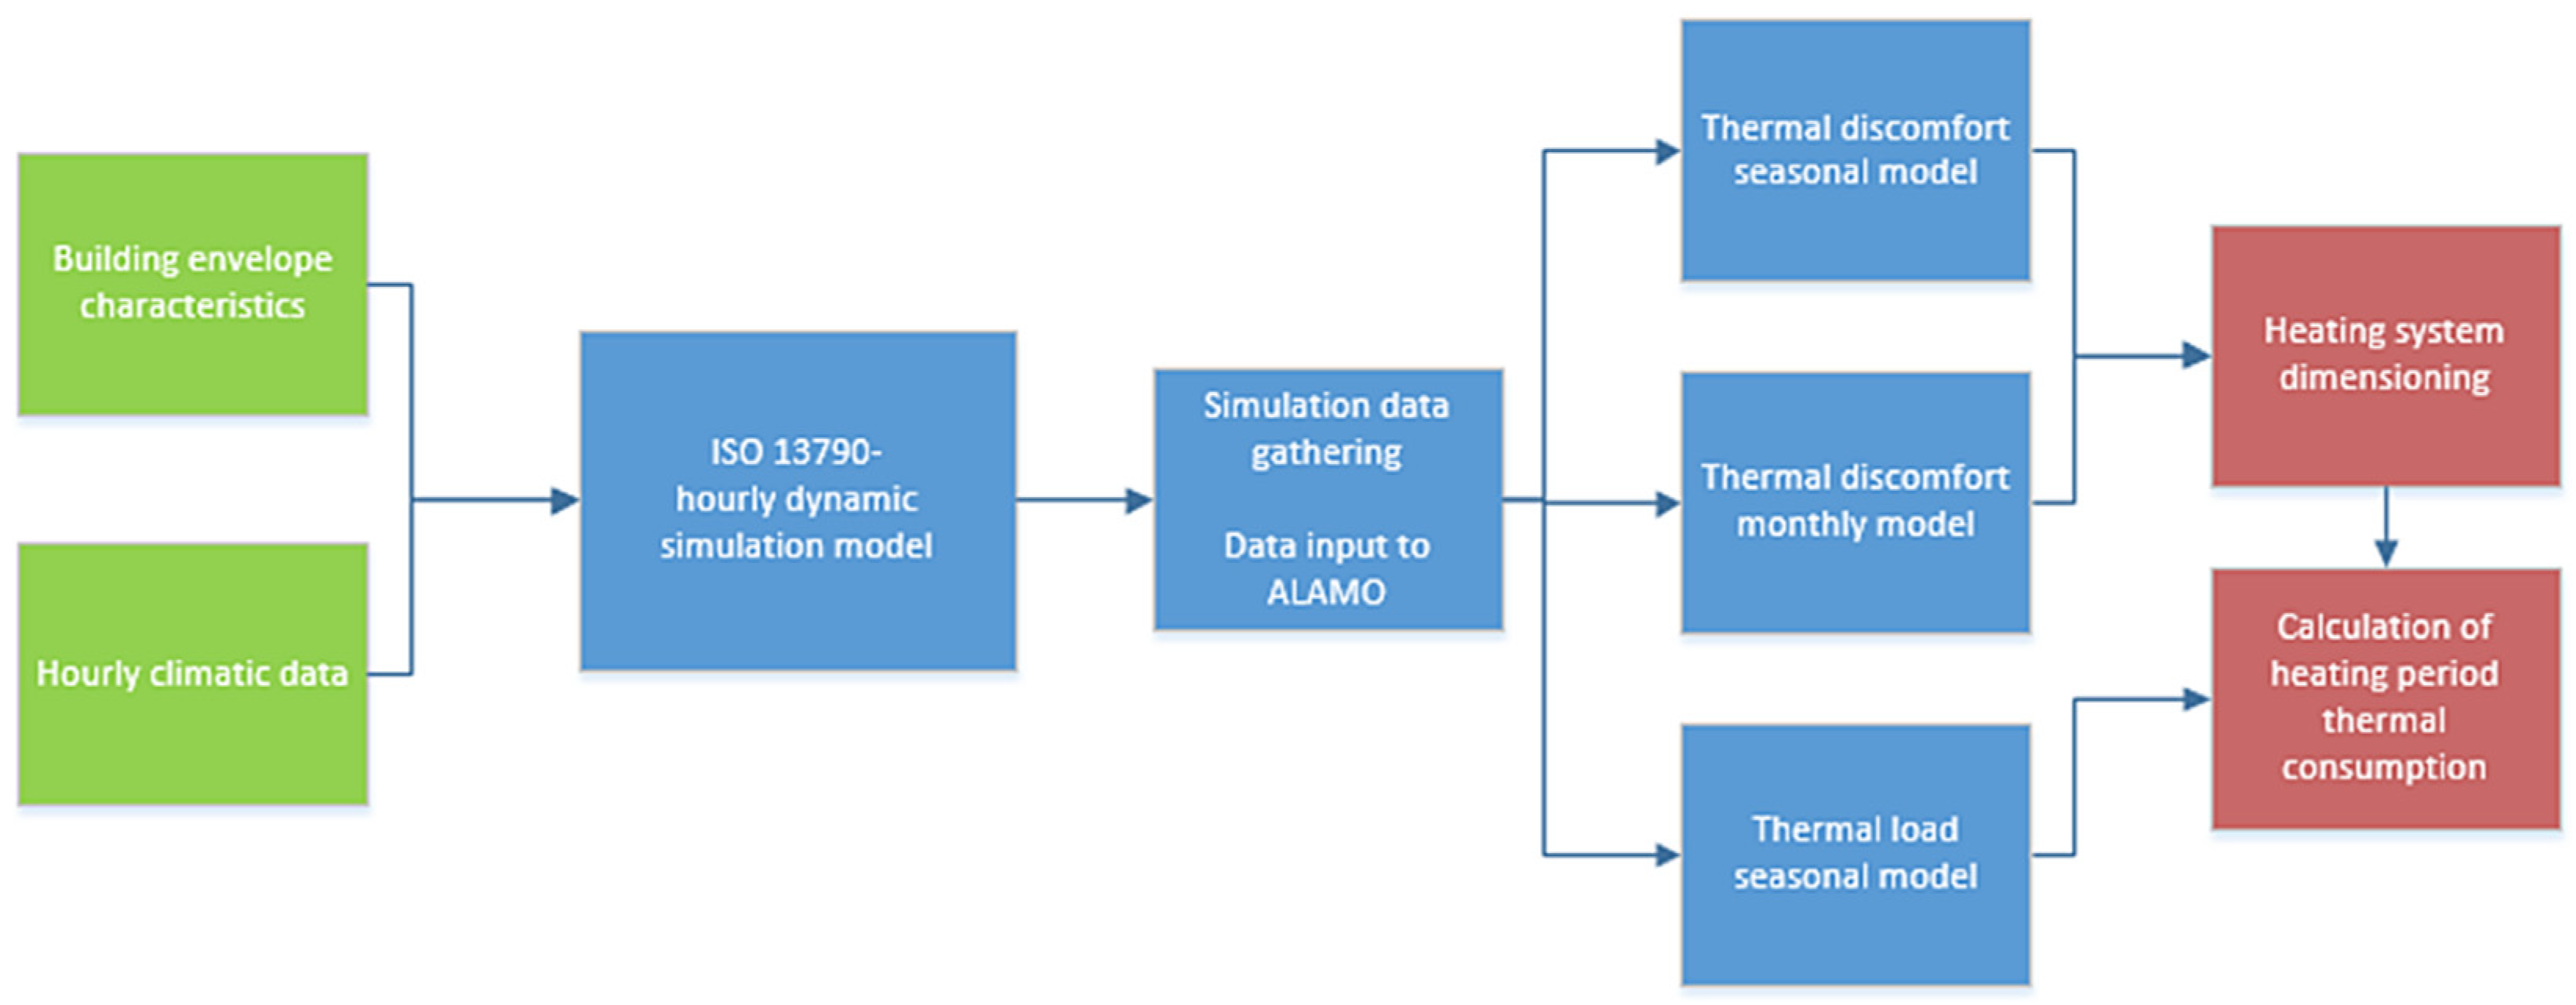
The developed methodology uses a simulation model, that is the ISO 13790-hourly model [5], in order to provide the necessary data for the analysis. As a final result, it provides both a non-linear and a more simplified, multilinear equation that allows the calculation of the required thermal power of the indoor spaces of a building, for a certain comfort level. A graph depicting the steps of the methodology is illustrated in Figure 1.
The simulation model was implemented in MATLAB and functions according to the ISO-13790 hourly dynamic model. To begin with, random values of the building characteristics were generated, as well as the nominal power of the heating systems. More specifically, each building data batch case derived from multiple combination of building characteristics (see Table 1), nominal power of heating systems and discomfort settings. Simulations of the respective building set-ups were conducted, creating data batches for (Nbatch = 16,000) from each run. The source code that was used for the generation of the data batches is provided in Supplementary Materials section. During each simulation, each building is exposed to environmental conditions, and heating systems operate during specified occupancy periods, in an attempt to achieve occupant thermal comfort. Both outdoor conditions and occupancy periods will be further elaborated in later parts of this section.
The simulation was conducted two times for each random building. In the first simulation, the time period was the month during which the lowest outdoor temperatures were observed. The second simulation took place during the whole heating period, for the climatic zone in which the case building is situated in, according to the Greek implementation of EPBD [41]. In this way, we are able to determine which time period is more suitable for this simulation methodology. Data batches contain information regarding the occupied space temperature, over the course of each simulated time period, as well as the hourly heating energy demanded, to maintain indoor thermal comfort.
ALAMO (Automated Learning of Algebraic Models for Optimization) is a software used for exporting high accuracy surrogate models based on simulation data or experiments and was developed by Cozad et al. [42]. In this study, this software was used in order to find the most accurate correlation possible between the building characteristics and the required heating power during occupancy periods.
In this work, the term ‘thermal discomfort’ was used. It is noted that two discomfort calculation methods were used (binary and degree-hour) [43,44] and a comparison was made between the fitting results of each method, when using ALAMO (see Section 3).
Binary-type hourly discomfort (BD) can be described as:
where:
- Tin: Indoor air temperature
- Tset: Set point indoor air temperature.
Whereas the binary-type discomfort percentage (BDP) is calculated as:
Nhours: total hours that elapsed over a simulation.
The discomfort in degree-hours (DDH) can be defined as:
The normalized discomfort in degree hours (DDHN), can be described as:
As indicated in the experimental study of Favero et al. [45], discomfort could be put in a broader context and conceived as a tolerance. As such, Tmin could indicate the limit at which the environment conditions are considered as totally unacceptable by the occupant. Therefore, the occupant is expected to have a temperature that is conceived of as neutral and a minimum temperature, lower than which the thermal discomfort is maximized (100% discomfort); within this context, Tmin value is arbitrary. It should be noted that the degree-hour discomfort method is not only able to gain information on how many hours systems did not manage to provide comfort, but the temperature difference needed to achieve it each hour, as well.
Using the surrogate regression models created by ALAMO, we have obtained a correlation between nominal thermal power and building characteristics. Moreover, data regarding thermal system power over a certain time period can also be extracted for every combination of building characteristics and thermal system power. In Table 1, the combination of building characteristics to be used as parameters in the surrogate model are presented. It is noted that for each building, the values are picked in a random manner from the specified ranges. The data ranges from Table 1 were obtained from the Greek adaptation of EPBD (Um and Vinf values) [41] and the ISO EN 13790 standard (Cm values) [5].
Finally, the proposed surrogate model will be compared with the existing simplified calculation procedure, as instructed by the Greek implementation of the EPBD, called REPB (Regulation on the Energy Performance of Buildings) [41]. More specifically, the thermal power that is required is calculated using the following simplified equation.
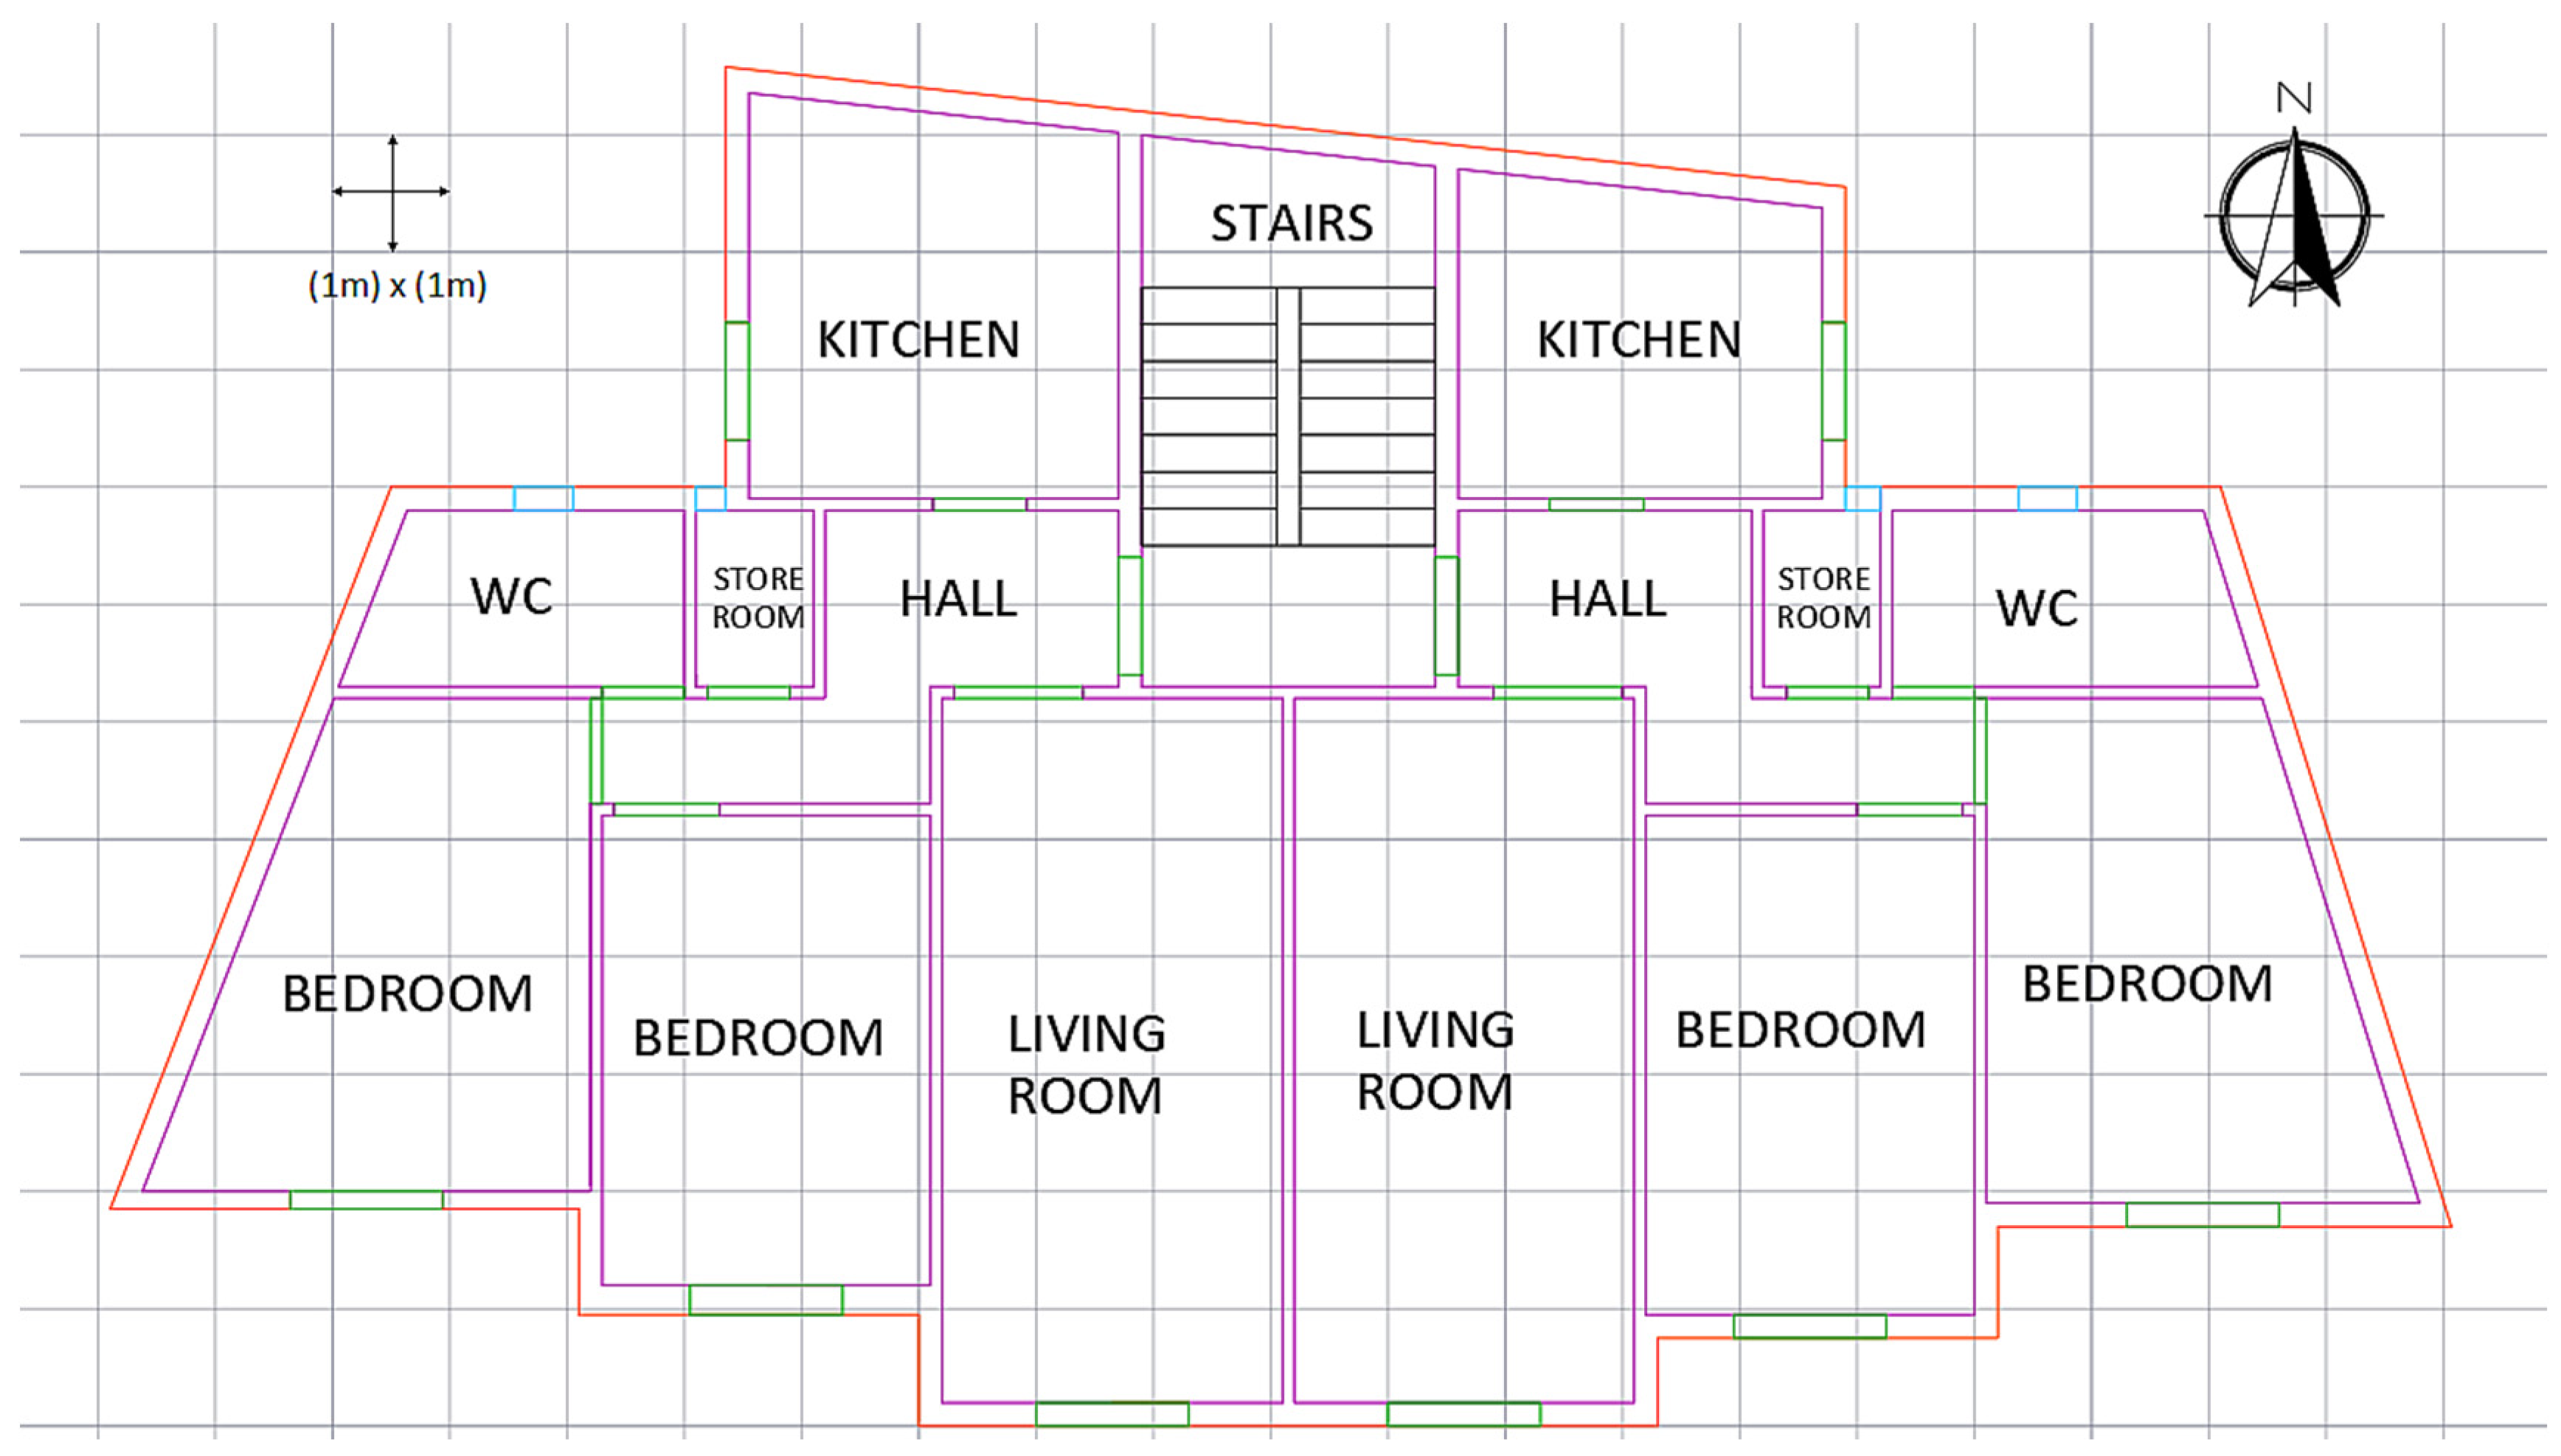
In this study, a case building model is used for the testing of the proposed methodology (see Figure 2). It is a three-story building and has a pilotis underneath, as well as a conventional rooftop. Its building blocks are made of a mixture of brickwork (70%) and armed concrete (30%), and the window frames consist of double glazing. It is considered to be constructed prior to 1979, noting that by this year thermal insulation regulation was initially implemented for the Greek setting; therefore, the building does not adhere to regulations regarding insulation sufficiency. More information on case building characteristics is provided in Table 2. The data used in Table 2 were obtained from on-site inspection, according to the Greek adaptation of EPBD [41].
Since the data set is based on the existing hourly method of the ISO EN 13790 standard, the assumptions under which the model was developed and validated are presented below:
- Indoor air relative humidity is assumed to be at 50%.
- Clothing of occupants is 1.0 clo.
- According to the psychrometric chart of ASHRAE 55 [10], with the aforementioned humidity and clothing levels, expected occupants’ thermal comfort ranges from 18 °C to 20 °C. That means Tset = 18—20 °C and Tmin = Tset − 2 Κ (see Equation (3)).
- Every floor is considered to be a single thermal zone. As such, every room belongs to the conditioned zone.
- Thermal systems operate during occupancy periods only.
- There are no objects around the building that provide shade.
- Occupancy timings exclude 08:00–16:00 for weekdays, with 24-h occupancy at weekends.
- Outdoor conditions: Outdoor temperature and solar radiation data refer to the TRY (Test Reference Years) generated by the National Observatory of Athens [46].
3. Computational Study
In this section, the results of the surrogate model creation procedure will be shown, and a comparison between the extracted models and existing standards will be made. As has been described before, a data set has been generated, including the optimal thermal system power solution for each combination of building characteristics. The criterion for choosing the optimal power for each data set refers to the minimum thermal power value that satisfies the desired discomfort level (see Equation (4)).
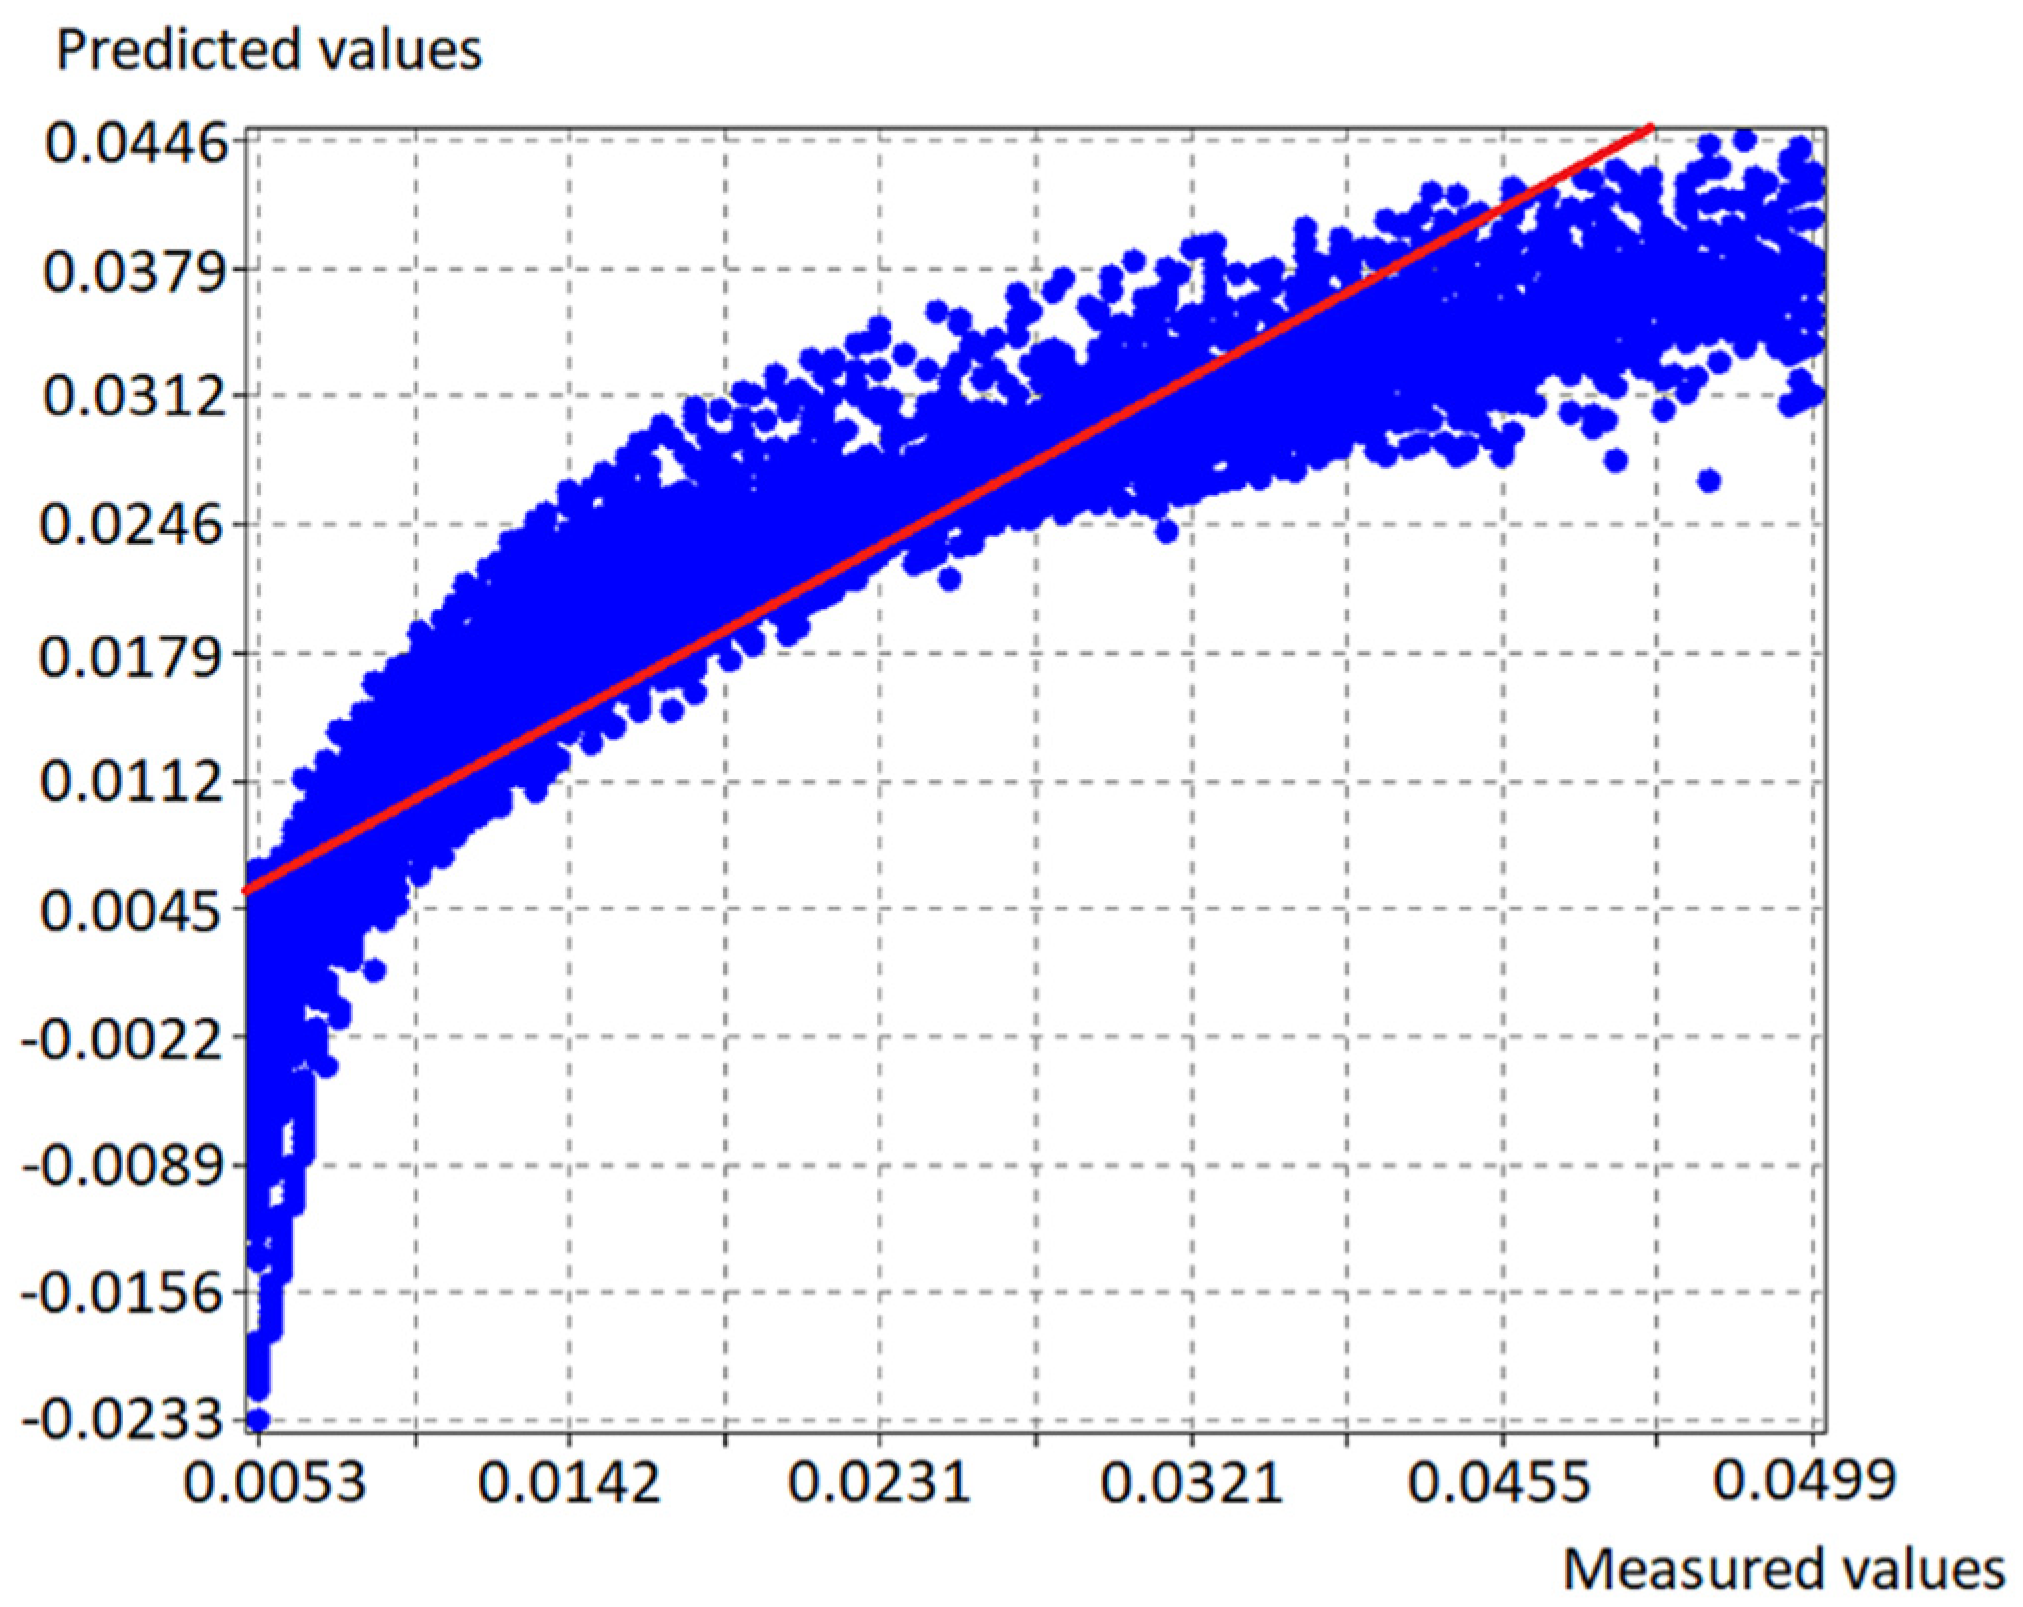
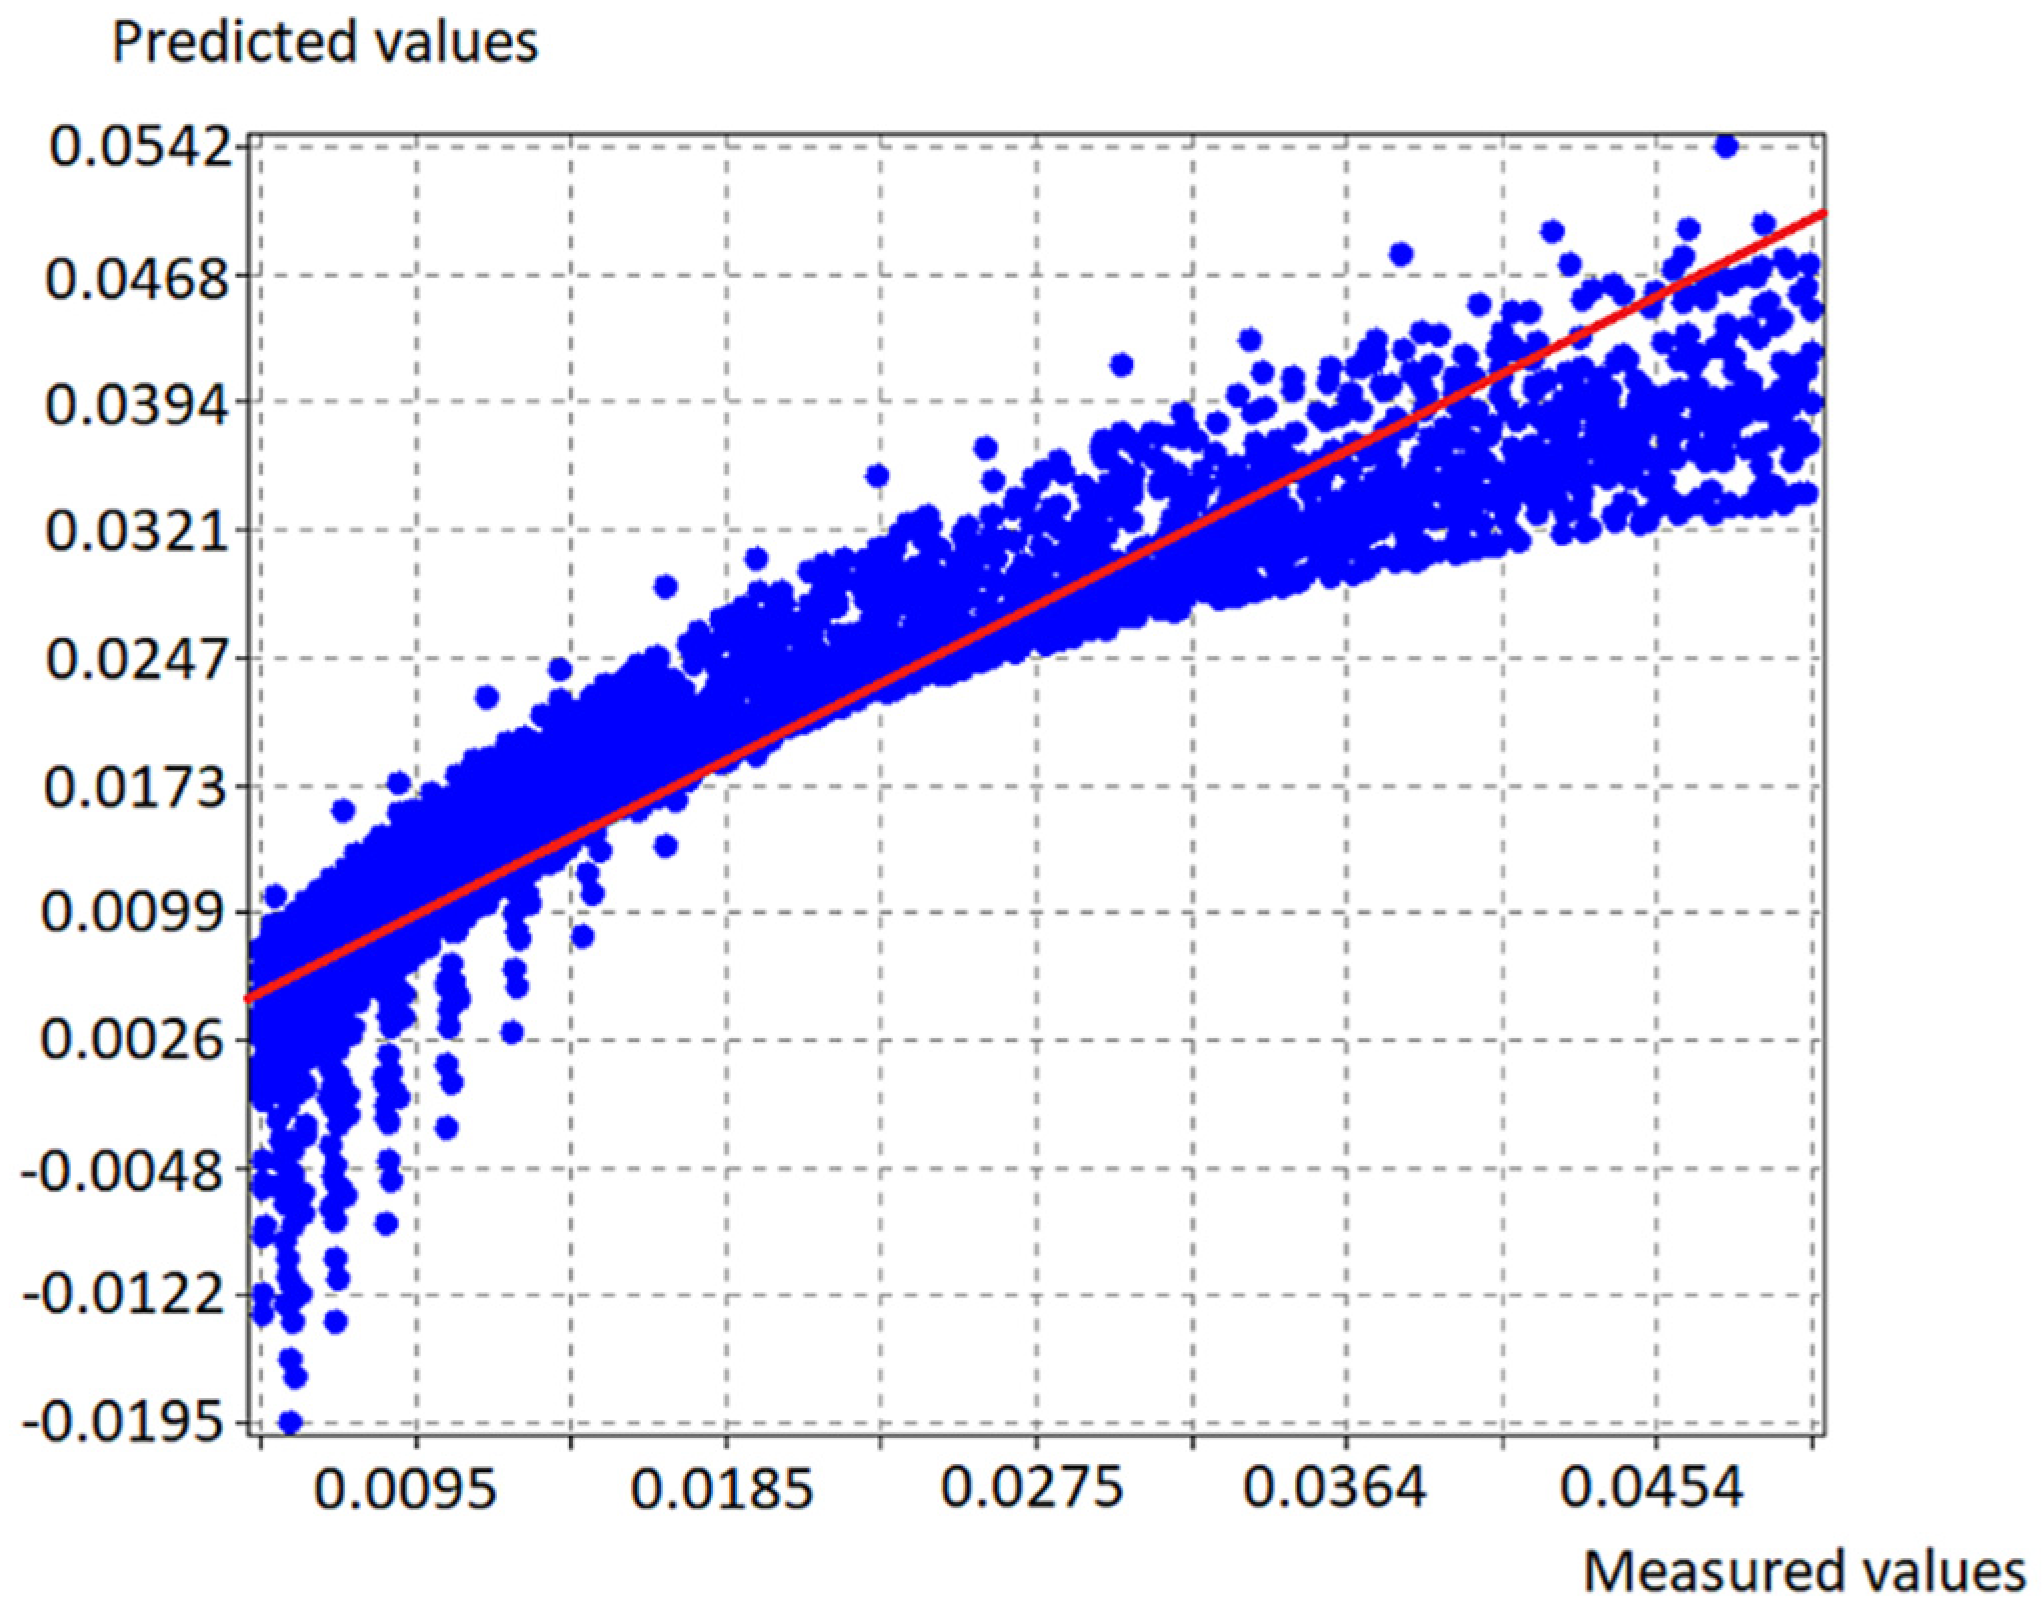
First, a comparison between binary and degree-hour thermal discomfort will be performed. Figure 3 and Figure 4 indicate the fitting results of the data (depicted as “measured values in the figures), while the “predicted values” come from the ALAMO regression value estimation. The data are derived from the simulation of the building case, having the heat loss coefficient as a varying parameter; the respective data batches are not the same in order for cross validation to be performed. As shown in Figure 4, the degree-hour normalized discomfort method increases fitting accuracy, when compared to the simple binary discomfort percentage, presented in Figure 3. The above is verified through the fitting performance comparison, which is presented in Table 3. In addition, when comparing monthly to seasonal simulations, there is not much of a difference in results. Despite this, having an accurate model for calculating nominal thermal power for the whole heating season is more generalized and, therefore, more impartial.
At this point, the complete surrogate model will be presented and discussed. The model is generated using the building characteristics shown in Table 1.
Equations (6) and (7) describe the correlation of the best seasonal surrogate model that was exported from ALAMO, in terms of thermal discomfort and energy demand, respectively. Moreover, a complete view of the accuracy of these surrogate models, when examining cross validation results, is provided in Table 4.
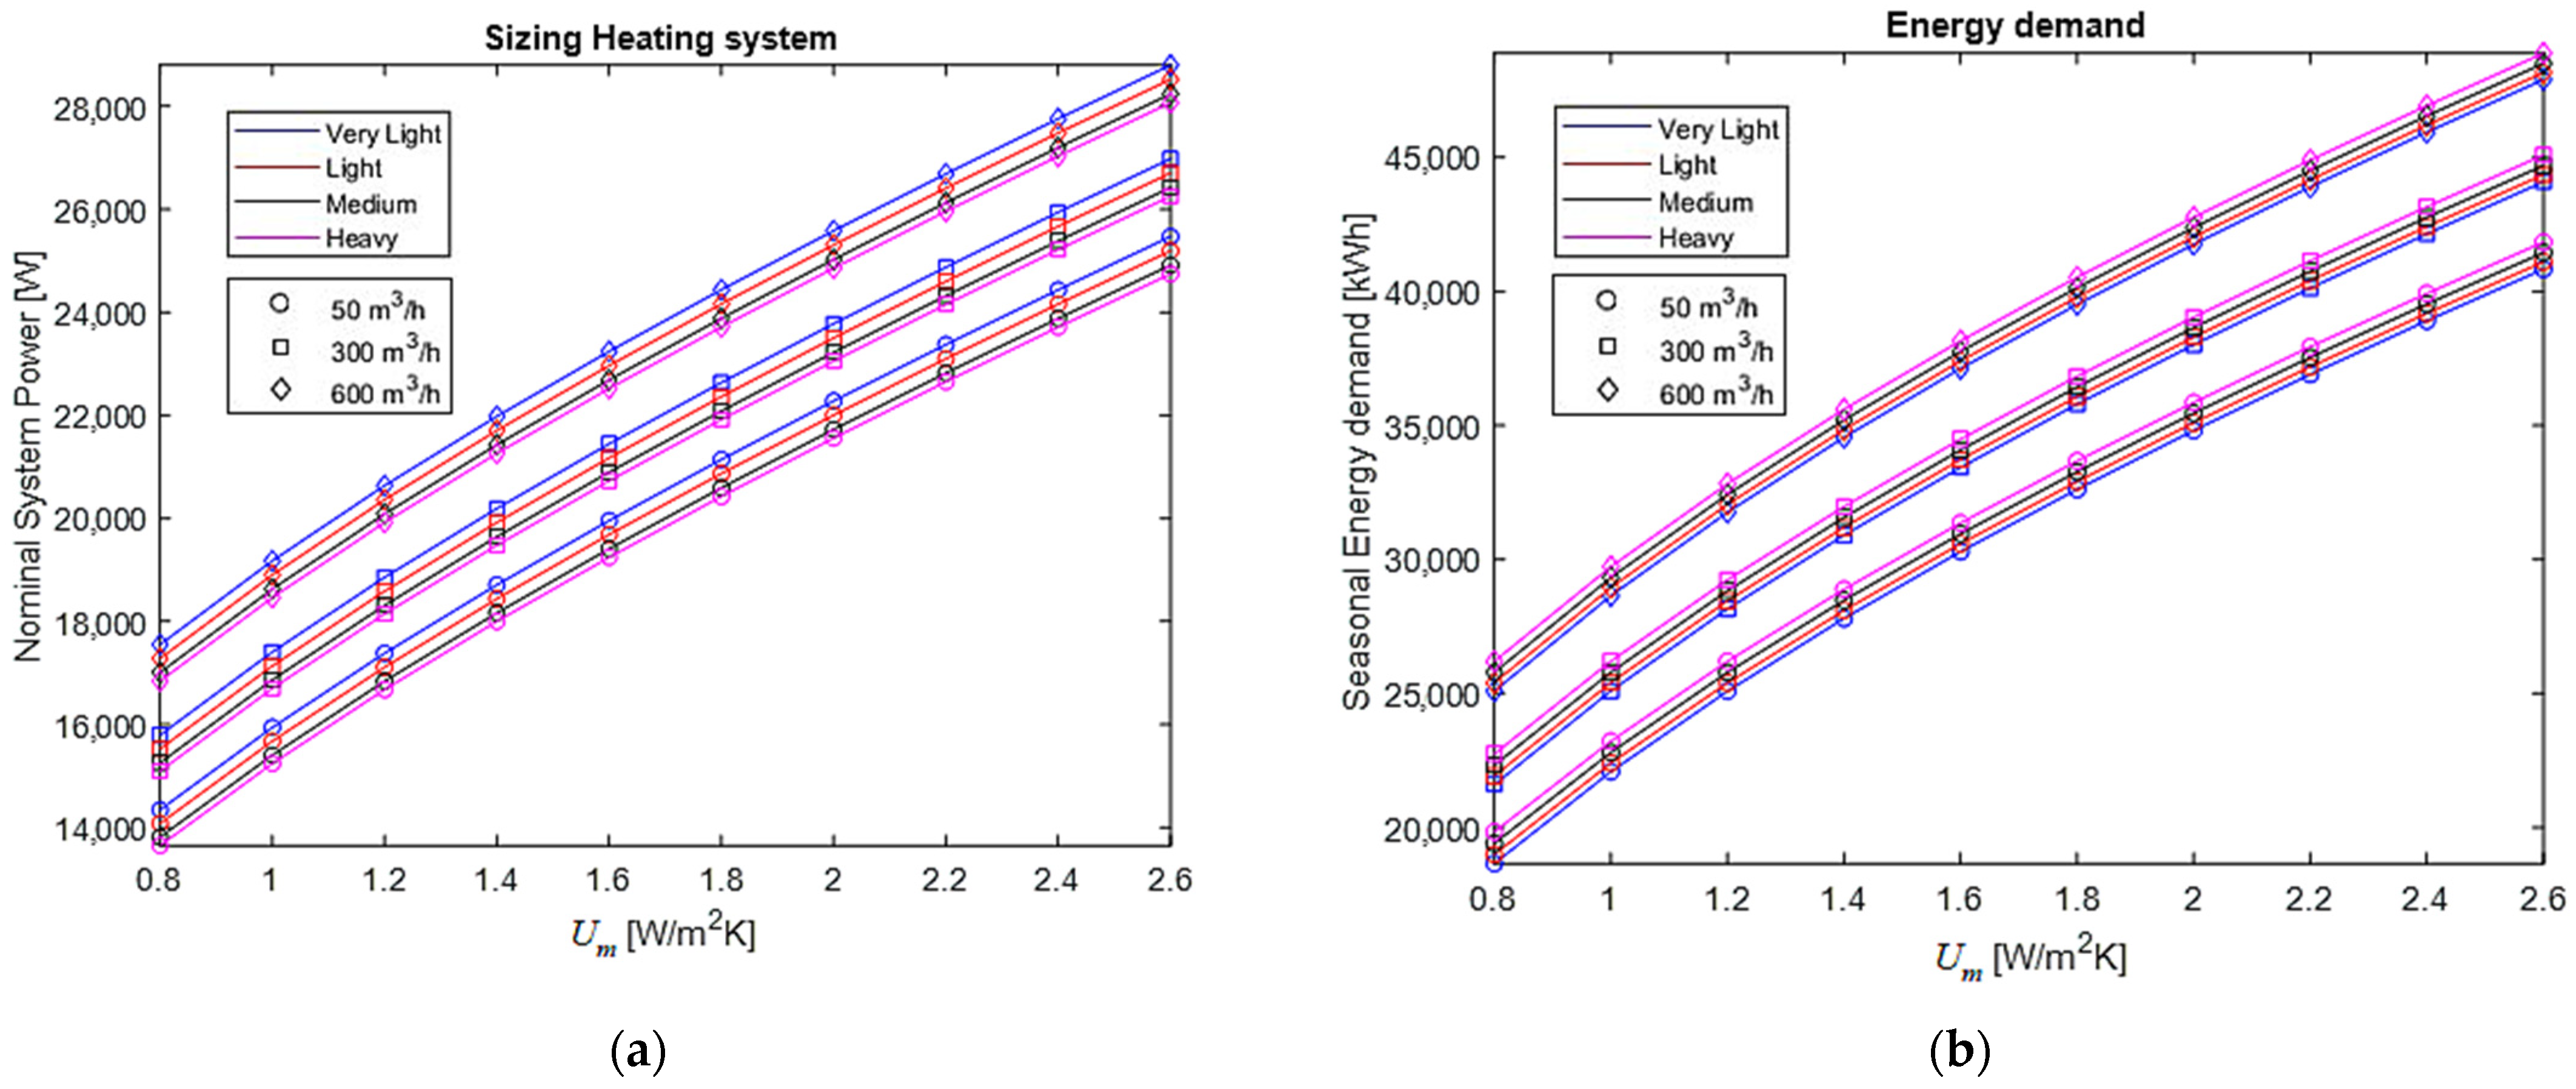
For the case of 100% comfort level (DDHN values very near to 0, due to logarithmic correlation), and set point temperature (Tset) equal to 20 °C, implementation of Equation (6) leads to the results presented in Figure 5a, while the respective results for Equation (7) are presented in Figure 5b.
As can be seen from Figure 5a,b, it is possible for the nominal system heating power to be calculated, provided the specific building characteristics, such as average heat transmission coefficient, average thermal capacity and air infiltration rate are known. It must be remembered that results are subject to the daily occupancy schedule that is set during the simulation phase, as well as the value of discomfort level that is selected.
In the dimensioning procedure, building characteristics and thermal discomfort are the independent variables. Due to that fact, Equation (6) is transformed into the following multilinear equation (Equation (8)). Linearity was chosen in order to further simplify the equation. Fitting results of the multilinear equation are presented in Table 4. As can be observed through Table 5, no significant accuracy penalties emerge when using the multilinear equation as a surrogate model, instead of the non-linear seasonal model (Equation (6)).
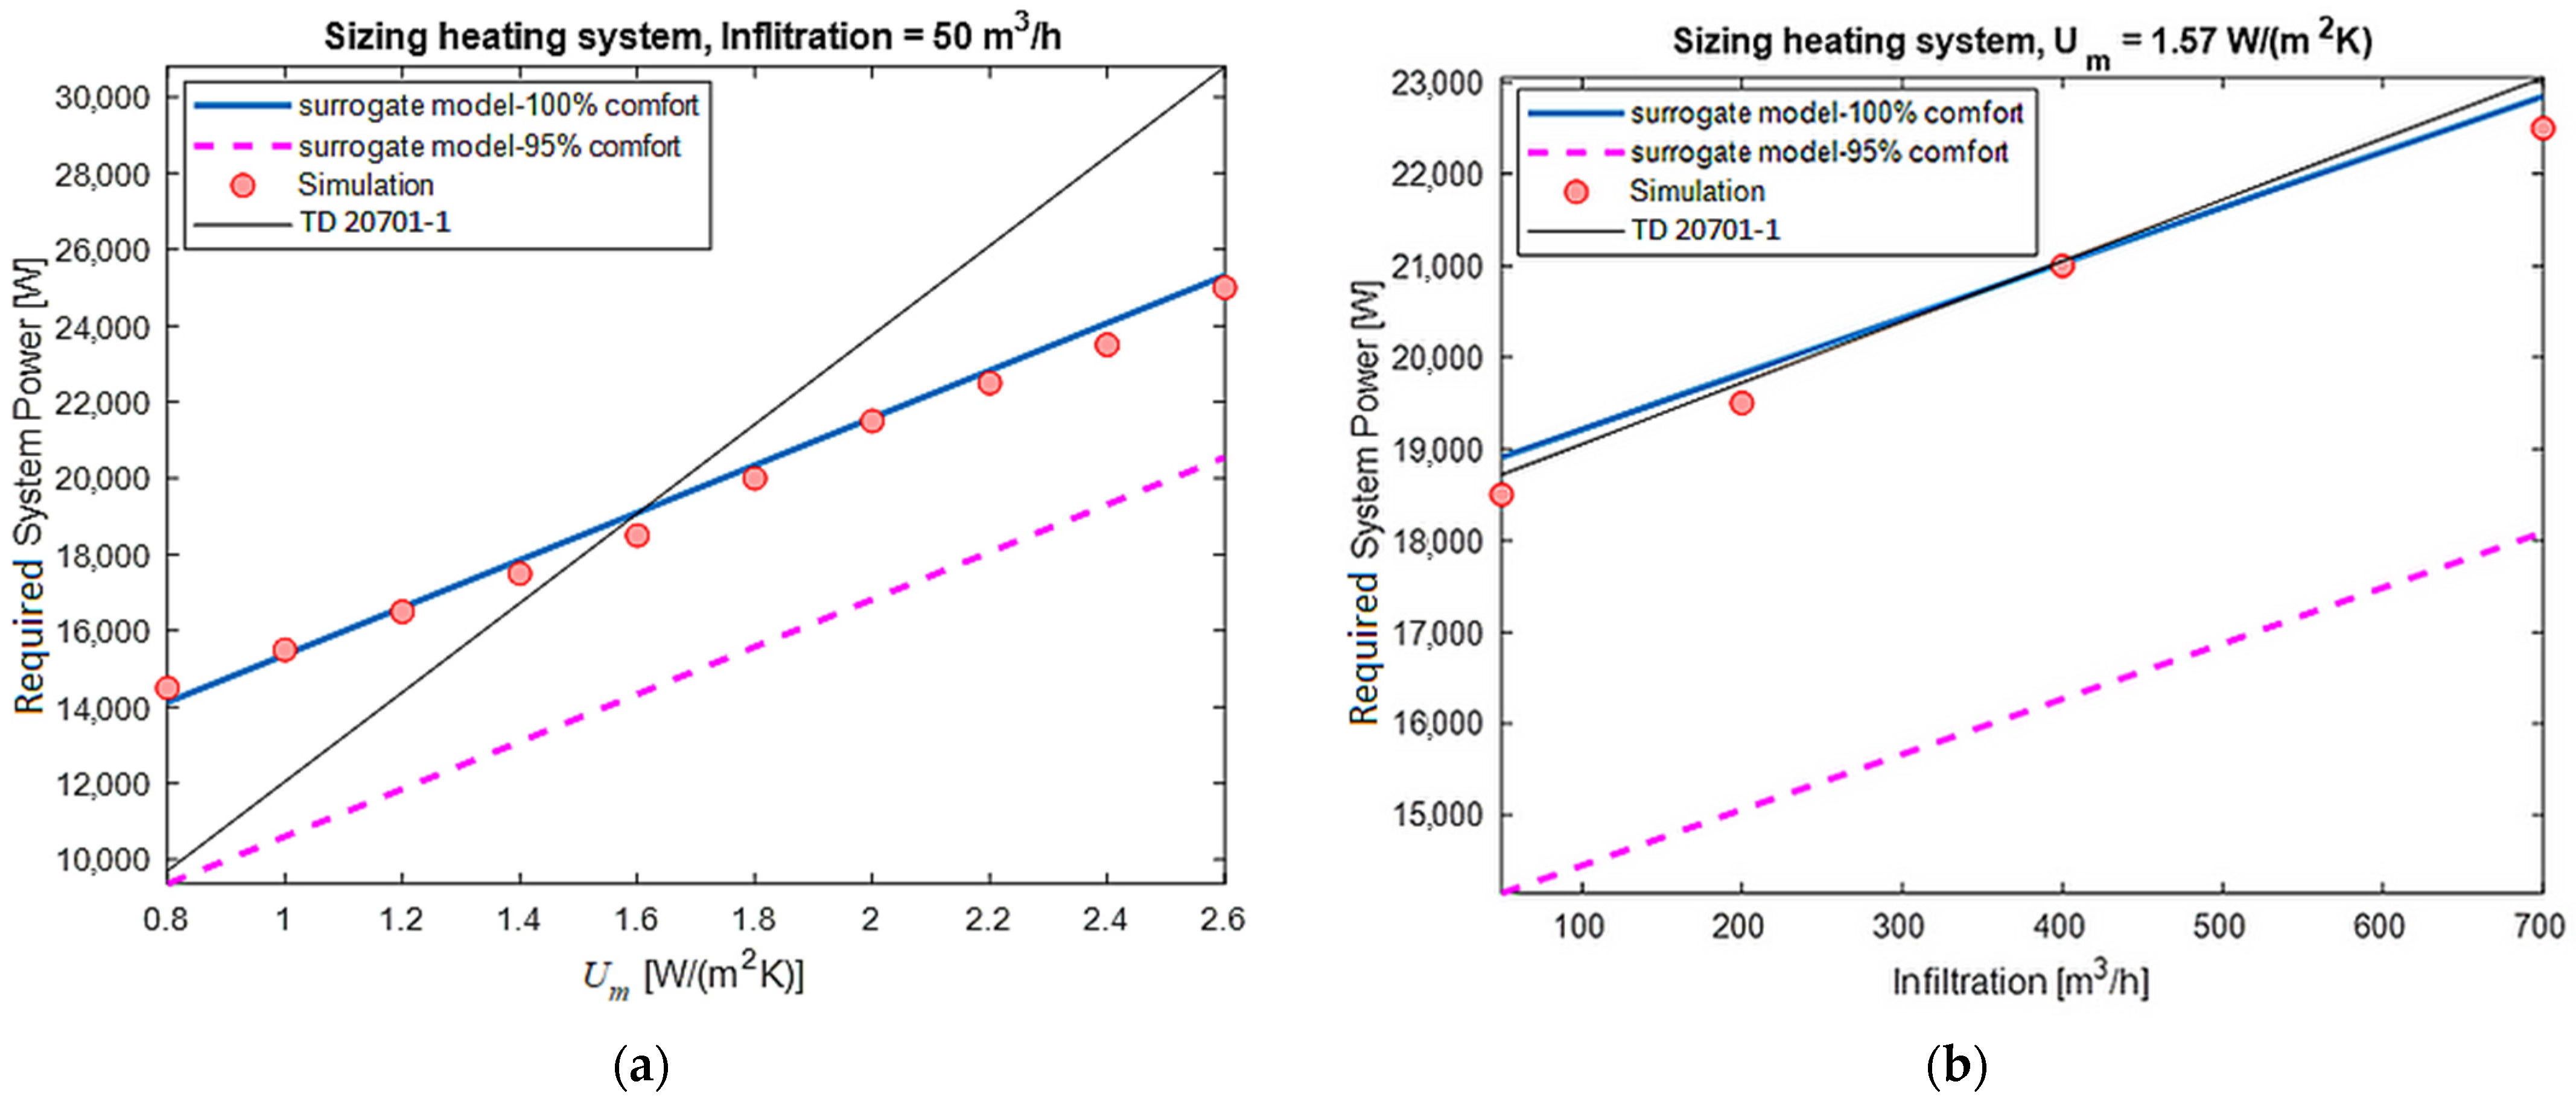
At this point, the proposed surrogate model will be compared against both the ISO-13790 hourly method and the REPB. The results of the model at total comfort are almost identical to the simulation data. In order to compare the REPB line with the final surrogate model, a dimension reduction to a two-dimension scale is needed. It is noticed that, when comparing Equations (5) and (8), both share two common coefficients: average building heat transmission coefficient Um and air infiltration rate Vinf. Therefore, in Figure 6a,b, two graphs are presented, each of them having one of the two coefficients set as a random value, while the other is set on the horizontal axis range.
The results show that the heat transmission coefficient, and as a result insulation, are perceived differently from each method, when calculating required system power. As observed from Figure 6a, REPB tends to underdimension required power when using sufficient insulation and overdimension when using insufficient insulation, compared to the hourly method and the surrogate model. Infiltration effect is perceived similarly from both methods (Figure 6b).
One other observation is that by reducing comfort by 5% (from 100% to 95%), the required system power is reduced considerably. It is reminded that the EPBD and ISO EN13790 standards do not take occupant comfort into account, which is vital to attaining an optimal thermal system, regarding both user satisfaction, as well as reduction in initial installation and operation cost.
4. Discussion
The above results indicate that there is much to be considered, when discussing optimal thermal system dimensioning. This study indicated that a surrogate model stemming from a dynamic hourly method of existing thermal load calculation standards could not only offer calculation simplification, a virtue that would be valuable among engineers, but could also be as accurate as existing simplified system dimensioning methods, if not more so. Moreover, user thermal comfort should be taken into account, not only during the daily operation of the thermal systems, but also from the early stages of the thermal system dimensioning. Furthermore, the use of degree hour thermal comfort provides useful information that the simple hour thermal comfort fails to provide, which is in agreement with other studies that implement it [43,44]. The proposed work managed to reduce required thermal load by implementing thermal comfort as a configurable parameter (in the form of thermal discomfort, as presented in Equations (6) and (8)) and changing it at will.
5. Conclusions
In this study, a surrogate model, that is able to effectively dimension the required thermal power of a building, is developed. According to the results, a non-linear seasonal model can provide the dimensioning of the systems for the heating period. Involved parameters include average heat loss coefficient, heat capacity, and air infiltration; the desired degree of discomfort, involving a degree-hour approach, instead of a binary one, is imposed. The effect of the respective parameters on system dimensioning is evident. Especially regarding thermal comfort, reducing the comfort level by a rate of 5% results in a considerable reduction of required system power. A multilinear regression approach has also been proven to be reliable.
The developed model features both simplicity and satisfying accuracy, when compared to the existing ISO EN13790—simple hourly method. The simplified calculation procedure that derives from the Greek adaptation of the EPBD tends to provide different estimations of required thermal power in extreme cases of building thermal insulations, when compared to the EN13790 and the proposed model. Not only that, but both standards are unable to take occupant preferences into account in their current state, as far as thermal comfort is concerned.
Future work includes implementing this methodology across several climatic zones of Greece, and the testing and addition of several more building characteristics to the methodology, leading to better generalization. In addition, various occupancy schedules and thermal comfort settings could also be considered in the improvement of the method. Lastly, the examination and implementation of more standards, simulation procedures, as well as real-time measurements, could be of use for further development of this methodology.
Supplementary Materials
The MATLAB code used for the generation of data batches is available online at this URL: https://github.com/gpanaras/-Dynamic-simulation-based-surrogate-model-for-the-dimensioning-of-building-energy-systems.
Author Contributions
Conceptualization, L.Z. and G.P.; methodology, L.Z., G.S., N.P. and G.P.; software, L.Z., G.S. and N.P.; validation, G.S.; formal analysis, L.Z., G.S. and G.P.; investigation, L.Z., G.S., N.P. and G.P.; resources, L.Z. and G.P.; data curation, L.Z., G.S., N.P. and G.P.; writing—original draft preparation, L.Z. and G.P.; writing—review and editing, L.Z., N.P. and G.P.; visualization, G.P.; supervision, G.P.; project administration, G.P.; funding acquisition, G.P. All authors have read and agreed to the published version of the manuscript.
Funding
We acknowledge support of this work by the project “Development of New Innovative Low Carbon Footprint Energy Technologies to Enhance Excellence in the Region of Western Macedonia” (MIS 5047197) which is implemented under the Action “Reinforcement of the Research and Innovation Infrastructure”, funded by the Operational Programme “Competitiveness, Entrepreneurship and Innovation” (NSRF 2014-2020), and co-financed by Greece and the European Union (European Regional Development Fund).
Institutional Review Board Statement
Not applicable.
Informed Consent Statement
Not applicable.
Data Availability Statement
The data presented in this study are available on request from the corresponding author.
Conflicts of Interest
The authors declare no conflict of interest.
References
- Eurostat Energy Statistics—An Overview. Available online: https://ec.europa.eu/eurostat/statistics-explained/index.php/Energy_statistics_-_an_overview#Primary_energy_production (accessed on 22 September 2021).
- ANSI/ASHRAE/IES. ANSI/ASHRAE/IES Standard 90.1-2019, Energy Standard for Buildings Except Low-Rise Residential Buildings; American Society of Heating, Refrigerating and Air Conditioning Engineers: Atlanta, GA, USA, 2019. [Google Scholar]
- ANSI/ASHRAE/IES. ANSI/ASHRAE/IES Standard 90.2-2018, Energy Efficient Design of Low-Rise Residential Buildings; American Society of Heating, Refrigerating and Air Conditioning Engineers: Atlanta, GA, USA, 2018. [Google Scholar]
- European Parliament and Council of the European Union. Directive (EU) 2018/844 of the European Parliament and of the Council of 30 May 2018 Amending Directive 2010/31/EU on the Energy Performance of Buildings and Directive 2012/27/EU on Energy Efficiency (Text with EEA Relevance). Available online: https://eur-lex.europa.eu/eli/dir/2018/844/oj (accessed on 22 September 2021).
- International Standard Organization. ISO 13790-2008, Energy Performance of Buildings, Calculation of Energy Use for Space Heating and Cooling; ISO: Geneva, Switzerland, 2008. [Google Scholar]
- Jantunen, M.; Oliveira Fernandes, E.; Carrer, P.; Kephalopoulos, S. European Commission, Directorate General for Health & Consumers, Promoting Actions for Healthy Indoor Air (IAIAQ); European Commission: Luxembourg, 2011. [Google Scholar]
- Geng, Y.; Ji, W.; Wang, Z.; Lin, B.; Zhu, Y. A review of operating performance in green buildings: Energy use, indoor environmental quality and occupant satisfaction. Energy Build. 2019, 183, 500–514. [Google Scholar] [CrossRef]
- Alavi, H.; Forcada, N.; Bortolini, R.; Edwards, D.J. Enhancing occupants’ comfort through BIM-based probabilistic approach. Autom. Constr. 2021, 123. [Google Scholar] [CrossRef]
- Arif, M.; Katafygiotou, M.; Mazroei, A.; Kaushik, A.; Elsarrag, E. Impact of indoor environmental quality on occupant well-being and comfort: A review of the literature. Int. J. Sustain. Built Environ. 2016, 5, 1–11. [Google Scholar] [CrossRef]
- ANSI/ASHRAE. ANSI/ASHRAE Standard 55-2020, Thermal Environmental Conditions for Human Occupancy; American Society of Heating, Refrigerating and Air Conditioning Engineers: Atlanta, GA, USA, 2020. [Google Scholar]
- Frontczak, M.; Wargocki, P. Literature survey on how different factors influence human comfort in indoor environments. Build. Environ. 2011, 46, 922–937. [Google Scholar] [CrossRef]
- ANSI/ASHRAE. ANSI/ASHRAE Standard 62.1-2019, Ventilation for Acceptable Indoor Air Quality; American Society of Heating, Refrigerating and Air Conditioning Engineers: Atlanta, GA, USA, 2019. [Google Scholar]
- Schieweck, A.; Uhdea, E.; Salthammer, T.; Salthammer, L.C.; Morawska, L.; Mazaheri, M.; Prashant, K. Smart homes and the control of indoor air quality. Renew. Sustain. Energy Rev. 2017, 94, 705–718. [Google Scholar] [CrossRef]
- Fisk, W.J.; Mirer, A.G.; Mendell, M.J. Quantitative relationship of sick building syndrome symptoms with ventilation rates. Indoor Air 2009, 19, 159–165. [Google Scholar] [CrossRef] [Green Version]
- Ortiz, M.; Itard, L.; Bluyessen, P.M. Indoor environmental quality related risk factors with energy-efficient retrofitting of housing: A literature review. Energy Build. 2020, 221, 110102. [Google Scholar] [CrossRef]
- Michalak, P. The simple hourly method of EN ISO 13790 standard in Matlab/Simulink: A comparative study for the climatic conditions of Poland. Energy 2014, 75, 568–578. [Google Scholar] [CrossRef]
- Magni, M.; Ochs, F.; de Vries, S.; Maccarini, A.; Sigg, F. Detailed cross comparison of building energy simulation tools results using a reference office building as a case study. Energy Build. 2021, 250, 111260. [Google Scholar] [CrossRef]
- Queipo, N.V.; Haftka, R.T.; Shyy, W.; Goel, T.; Vaidyanatha, R.; Tucker, P.K. Surrogate-based analysis and optimization. Prog. Aerosp. Sci. 2005, 41, 1–28. [Google Scholar] [CrossRef] [Green Version]
- Yuksel, S.E.; Wilson, J.N.; Gader, P.D. Twenty years of mixture of experts. IEEE Trans. Neural Netw. Learn. Syst. 2012, 23, 1177–1193. [Google Scholar] [CrossRef]
- Burnaev, E.V.; Belyaev, M.G.; Prihodko, P.V. Algorithm for tuning parameters of approximation based on linear expansions in parametric dictionaries. In Proceedings of the 8th International Conference on Intellectualization of Information Processing, Paphos, Cyprus, 17–23 October 2010; pp. 204–207. [Google Scholar]
- Hastie, T.; Tibshirani, R.; Friedman, J. The Elements of Statistical Learning: Data Mining, Inference, and Prediction; Springer: Berlin/Heidelberg, Germany, 2008. [Google Scholar]
- Khan, M.E.; Khan, F. A comparative study of white box, black box and grey box testing techniques. Int. J. Adv. Comput. Sci. Appl. 2012, 3. [Google Scholar] [CrossRef]
- Amara, F.; Agbossou, K.; Cardenas, A.; Dubé, Y.; Kelouwani, S. Comparison and simulation of building thermal models for effective energy management. Smart Grid Renew. Energy 2015, 6, 95–112. [Google Scholar] [CrossRef] [Green Version]
- Gonçalves, D.; Sheikhnejad, Y.; Oliveira, M.; Martins, N. One step forward toward smart city Utopia: Smart building energy management based on adaptive surrogate modelling. Energy Build. 2020, 223, 110146. [Google Scholar] [CrossRef]
- Hamdy, M.; Hasan, A.; Siren, K. Optimum design of a house and its HVAC systems using simulation-based optimization. Int. J. Low-Carbon Technol. 2010, 5, 120–124. [Google Scholar] [CrossRef] [Green Version]
- Nassif, F.; Kajl, S.; Sabourin, R. Evolutionary algorithms for multi-objective optimization in HVAC system control strategy. In Proceedings of the IEEE Annual Meeting of the Fuzzy Information, Banff, AB, Canada, 27–30 June 2004; Volume 1, pp. 51–56. [Google Scholar] [CrossRef]
- He, X.; Chen, S.; Lv, X.; Kim, E. Simplified model of HVAC load prediction for urban building districts. Procedia Eng. 2015, 121, 167–174. [Google Scholar] [CrossRef]
- Magnier, L.; Haghighat, F. Multiobjective optimization of building design using TRNSYS simulations, genetic algorithm, and artificial neural network. Build. Environ. 2010, 45, 739–746. [Google Scholar] [CrossRef]
- Jiang, Z.; Risbeck, M.J.; Ramamurti, V.; Murugesan, S.; Amores, J.; Zhang, C.; Lee, Y.M.; Drees, K.H. Building HVAC control with reinforcement learning for reduction of energy cost and demand charge. Energy Build. 2021, 239, 110833. [Google Scholar] [CrossRef]
- Lawrence, C.R.; Richman, R.; Kordjamshidi, M.; Skapura, C. Application of surrogate modelling to improve the thermal performance of single-family homes through archetype development. Energy Build. 2020, 237, 110812. [Google Scholar] [CrossRef]
- Sha, H.; Xu, P.; Hu, C.; Li, Z.; Chen, Y.; Chen, Z. A simplified HVAC energy prediction method based on degree-day. Sustain. Cities Soc. 2019, 51, 101698. [Google Scholar] [CrossRef]
- Tardioli, G.; Narayan, A.; Kerrigan, R.; Oates, M.; O’Donnell, J.; Finn, D.P. A methodology for calibration of building energy models at district scale using clustering and surrogate techniques. Energy Build. 2020, 226, 110309. [Google Scholar] [CrossRef]
- Sangireddy SA, R.; Bhatia, A.; Garg, V. Development of a surrogate model by extracting top characteristic feature vectors for building energy prediction. J. Build. Eng. 2019, 23, 38–52. [Google Scholar] [CrossRef]
- Melo, A.P.; Versage, R.S.; Sawaya, G.; Lamberts, R. A novel surrogate model to support building energy labelling system: A new approach to assess cooling energy demand in commercial buildings. Energy Build. 2016, 131, 233–247. [Google Scholar] [CrossRef]
- Guelpa, E.; Deputato, S.; Verda, V. Thermal request optimization in district heating networks using a clustering approach. Appl. Energy 2018, 228, 608–617. [Google Scholar] [CrossRef]
- Westermann, P.; Welzel, M.; Evins, R. Using a deep temporal convolutional network as a building energy surrogate model that spans multiple climate zones. Appl. Energy 2020, 278, 115563. [Google Scholar] [CrossRef]
- Caldas, L.G.; Norford, L.K. Genetic algorithms for optimization of building envelopes and the design and control of HVAC systems. J. Sol. Energy Eng. 2003, 125, 343–351. [Google Scholar] [CrossRef]
- Carlos, J.S.; Nepomuceno, M.C.S. A simple methodology to predict heating load at an early design stage of dwellings. Energy Build. 2012, 55, 198–207. [Google Scholar] [CrossRef]
- Thrampoulidis, E.; Mavromatidis, G.; Lucchi, A.; Orehounig, K.A. machine learning-based surrogate model to approximate optimal building retrofit solutions. Appl. Energy 2021, 281, 116024. [Google Scholar] [CrossRef]
- Asadi, E.; da Silva, M.G.; Antunes, C.H.; Dias, L.; Glicksman, L. Multi-objective optimization for building retrofit: A model using genetic algorithm and artificial neural network and an application. Energy Build. 2014, 81, 444–456. [Google Scholar] [CrossRef]
- TEE. Technical Directive of the Technical Chamber of Greece (TEE) 20701-1: Analytical Technical Specifications of Parameters for the Calculation of Buildings’ Energy Performance and The Issuing of Energy Performance Certificate; TEE: Athens, Greece, 2017. [Google Scholar]
- Cozad, A.; Sahinidis, N.V.; Miller, D.C. A combined first-principles and data-driven approach to model building. Comput. Chem. Eng. 2014, 73, 116–127. [Google Scholar] [CrossRef]
- Wang, C.; Zhu, Y.; Guo, X. Thermally responsive coating on building heating and cooling energy efficiency and indoor comfort improvement. Appl. Energy 2019, 253, 113506. [Google Scholar] [CrossRef]
- Lin, Y.; Zhou, S.; Yang, W.; Li, C.Q. Design optimization considering variable thermal mass, insulation, absorptance of solar radiation, and glazing ratio using a prediction model and genetic algorithm. Sustainability 2018, 10, 336. [Google Scholar] [CrossRef] [Green Version]
- Favero, M.; Sartori, I.; Carlucci, S. Human thermal comfort under dynamic conditions: An experimental study. Build. Environ. 2021, 204, 108144. [Google Scholar] [CrossRef]
- Argiriou, A.; Lykoudis, S.; Kontoyiannidis, S.; Balaras, C.A.; Asimakopoulos, D.; Petrakis, M.; Kassomenos, P. Comparison of methodologies for TRY generation using 20 years data for Athens, Greece. Sol. Energy 1999, 66, 33–45. [Google Scholar] [CrossRef]
Figure 1.
General methodology graph.

Figure 2.
Case building, first/second floor top view.

Figure 3.
Fitting accuracy when using binary discomfort data.

Figure 4.
Fitting accuracy when using degree hour discomfort data.

Figure 5.
Surrogate model case building results, correlated with simulated building parameters (see Table 1). (a) Heating system dimensioning; (b) seasonal energy demand of the building.
Figure 5.
Surrogate model case building results, correlated with simulated building parameters (see Table 1). (a) Heating system dimensioning; (b) seasonal energy demand of the building.

Figure 6.
Comparison between the ISO EN13790 simple hourly method, the proposed surrogate model equation (Equation (8)), and the REPB simplified thermal system dimensioning equation (Equation (5)): (a) for variable average thermal conductivity, constant air infiltration rate; (b) for variable air infiltration rate, constant thermal conductivity.


Table 1.
Building parameters to be used in surrogate modeling.
| Parameters | Description | Units | Value Range |
|---|---|---|---|
| Um | Average building envelope thermal heat transmission coefficient | W·m−2·K−1 | 0.2–2.6 |
| Cm | Average thermal capacity | J·K−1 | 80,000–370,000 |
| Vinf | Average air infiltration rate | m3·h−1 | 50–700 |
Table 2.
Case building characteristics.
| Term | Description | Units | Value |
|---|---|---|---|
| Conditioned space area | m2 | 238.80 | |
| Unconditioned space area | m2 | 74.90 | |
| Total wall area | m2 | 346.80 | |
| Total window area | m2 | 45.60 | |
| Useful mass area | m2 | 716.40 | |
| Floor thermal transmittance | W·m−2·K−1 | 2.75 | |
| Roof thermal transmittance | W·m−2·K−1 | 3.05 | |
| Wall thermal transmittance | W·m−2·K−1 | 2.56 | |
| Window thermal transmittance | W·m−2·K−1 | 4.10 | |
| Building envelope average thermal transmittance | W·m−2·K−1 | 2.75 | |
| Air infiltration rate | m3·h−1 | 393.50 | |
| Building envelope thermal capacity | J·K−1 | 62.09 | |
| Building block solar absorptance factor | - | 0.60 | |
| Glazing solar gain factor | - | 0.68 | |
| Floor heat resistance | m2·K·W−1 | 0.17 | |
| Roof heat resistance | m2·K·W−1 | 0.04 | |
| Wall heat resistance | m2·K·W−1 | 0.04 |
Table 3.
Thermal discomfort fitting performance comparison, using cross-validation.
| Regression Models | Values | Monthly Model | Seasonal Model | ||
|---|---|---|---|---|---|
| Training | Testing | Training | Testing | ||
| Thermal discomfort (DDHΝ) | R2 | 0.850 | 0.856 | 0.866 | 0.851 |
| SSE | 0.073 | 0.07 | 0.059 | 0.064 | |
| RMSE | 0.005 | 0.005 | 0.005 | 0.005 | |
| Thermal discomfort (binary) | R2 | 0.769 | 0.76 | 0.857 | 0.853 |
| SSE | 0.321 | 0.79 | 0.156 | 0.148 | |
| RMSE | 0.007 | 0.007 | 0.006 | 0.006 | |
Table 4.
Surrogate model fitting accuracy after cross-validation.
| Regression Models | Values | Monthly Model | Seasonal Model | ||
|---|---|---|---|---|---|
| Training | Testing | Training | Testing | ||
| Energy loads | R2 | 0.996 | 0.996 | 0.995 | 0.995 |
| SSE | 1.52 × 10⁸ | 1.33 × 10⁸ | 3.23 × 10⁹ | 3.81 × 10⁹ | |
| RMSE [kWh] | 91.3 | 85.3 | 446 | 486 | |
| Thermal discomfort (DDHN) | R2 | 0.757 | 0.768 | 0.833 | 0.815 |
| SSE | 0.716 | 0.688 | 0.441 | 0.481 | |
| RMSE [-] | 0.006 | 0.006 | 0.005 | 0.005 | |
Table 5.
Heating dimensioning surrogate model fitting results.
| Values | Heating Dimensioning Model | |
|---|---|---|
| Training | Testing | |
| R2 | 0.998 | 0.998 |
| SSE | 1.1 × 10⁷ | 1.49 × 10⁷ |
| RMSE [kWh] | 61.7 | 71.1 |
Publisher’s Note: MDPI stays neutral with regard to jurisdictional claims in published maps and institutional affiliations. |
© 2021 by the authors. Licensee MDPI, Basel, Switzerland. This article is an open access article distributed under the terms and conditions of the Creative Commons Attribution (CC BY) license (https://creativecommons.org/licenses/by/4.0/).
Share and Cite
MDPI and ACS Style
Zouloumis, L.; Stergianakos, G.; Ploskas, N.; Panaras, G. Dynamic Simulation-Based Surrogate Model for the Dimensioning of Building Energy Systems. Energies 2021, 14, 7141. https://doi.org/10.3390/en14217141
AMA Style
Zouloumis L, Stergianakos G, Ploskas N, Panaras G. Dynamic Simulation-Based Surrogate Model for the Dimensioning of Building Energy Systems. Energies. 2021; 14(21):7141. https://doi.org/10.3390/en14217141
Chicago/Turabian StyleZouloumis, Leonidas, Georgios Stergianakos, Nikolaos Ploskas, and Giorgos Panaras. 2021. "Dynamic Simulation-Based Surrogate Model for the Dimensioning of Building Energy Systems" Energies 14, no. 21: 7141. https://doi.org/10.3390/en14217141
Note that from the first issue of 2016, this journal uses article numbers instead of page numbers. See further details here.