
An Improved Fuzzy PID Control Method Considering Hydrogen Fuel Cell Voltage-Output Characteristics for a Hydrogen Vehicle Power System


State Key Laboratory of Fluid Power and Mechatronic Systems, Zhejiang University, Hangzhou 310027, China
*
Author to whom correspondence should be addressed.
Energies 2021, 14(19), 6140; https://doi.org/10.3390/en14196140
Submission received: 3 September 2021
/
Revised: 16 September 2021
/
Accepted: 24 September 2021
/
Published: 27 September 2021
Abstract
:The hydrogen fuel cell (HFC) vehicle is an important clean energy vehicle which has prospects for development. The behavior of the hydrogen fuel cell (HFC) vehicle power system, and in particular, the proton-exchange membrane fuel cell, has been extensively studied as of recent. The development of the dynamic system modeling technology is of paramount importance for HFC vehicle studies; however, it is hampered by the separation of the electrochemical properties and dynamic properties. In addition, the established model matching the follow-up control method lacks applicability. In attempts to counter these obstructions, we proposed an improved fuzzy (Proportional Integral Derivative) PID control method considering HFC voltage-output characteristics. By developing both the electrochemical and dynamic model for HFC vehicle, we can realize the coordinated control of HFC and power cell. The simulation results are in good agreement with the experimental results in the two models. The proposed control algorithm has a good control effect in all stages of HFC vehicle operation.
1. Introduction
Hydrogen energy has the advantages of being clean, highly efficiency, and plentiful. The development and utilization of hydrogen energy is a major strategic direction of global energy transformation [1,2]. The fuel cell vehicle has the advantages of zero emission, long endurance, high energy density of hydrogen storage, and fast hydrogenation time, which is a promising field of hydrogen energy application [3,4]. The hydrogen fuel cell (HFC) vehicle will become a widely used clean energy vehicle.
The HFC vehicle power system, which mainly relies on fuel cells for energy, is the core of the HFC vehicle. To date, the fuel cells that use pure hydrogen or hydrogen-rich reformed gas as fuel include alkaline fuel cells, phosphoric acid fuel cells, and proton-exchange membrane fuel cells [5,6,7]. Alkaline fuel cells are mainly limited by the toxic characteristics of carbon dioxide and the leakage of electrolytes [8,9]. Phosphoric acid fuel cells are not suitable for fuel cell vehicles because of their long cold start time [10,11]. Proton-exchange membrane fuel cells have the advantages of high specific power, high specific energy, good stability, no electrolyte loss, and fast start-up at room temperature [12,13,14], so they have broad development prospects.
The HFC vehicle power system is a comprehensive system involving many subjects. The modeling method aimed at the HFC vehicle power system is consequently complicated. Plenty of research has been carried out on the HFC modeling method [15], establishing a new fuel cell system model. The advanced control strategy used to manage the power distribution between the two energy sources was explained to minimize the conversion of the fuel cell power demand. Calvin et al. [16] established a new numerical model for fuel cells, and they studied the temperature distribution in the cell by simulating the cooling airflow in the cell pack. Thereby, the influence of temperature on fuel cell performance and electrochemical efficiency can be studied more accurately. Ritzberger et al. [17] proposed a real-time model of a fuel cell system that considers multiple control strategies. They used the real-time model driven by the set value of the control strategy to study the evolution of the cell’s internal state. Aiming to solve the problem of fuel cell performance degradation, Lin et al. [18] established a corresponding model. Using this model to study the charge and discharge range of fuel cell degradation, they proposed a method to control the expected energy consumption of the fuel cell by adjusting the equivalent factor corresponding to the cell charge state.
Due to its stability and efficiency, the proton-exchange membrane fuel cell is widely used [19,20,21]. To date, plenty of research has been carried out on the proton-exchange membrane fuel cell modeling method. Chen et al. [22] proposed a hybrid degradation model for proton-exchange membrane fuel cells. The model was based on the wavelet analysis, an extreme learning machine and the genetic algorithm that took into account the effects of the load current, the relative humidity, the temperature, and the hydrogen pressure. Using a multi-component mixing model to simulate the two-phase flow and migration in the cathode gas diffusion layer of a proton-exchange membrane fuel cell, Abdollahzadeh et al. [23] established a model with a small number of nonlinear equations. By studying the fuel cell output performance and water delivery performance under the condition of low external humidity, Fan et al. [24] established a three-dimensional multiphase numerical model of a proton-exchange membrane fuel cell. The above models improved the model simulation accuracy.
Based on the model establishment, the corresponding control algorithm is designed for a certain output characteristic of the power system, and the model is driven for simulation verification. By simulating the fuel cell vehicle models driven by different control strategies, Hames et al. [25] analyzed the relationship between the fuel cell rated output power and the actual power demand simulation results, to compare the effect of the control strategy. Aiming at the HFC characteristics, Hwang et al. [26] studied the control problems in the vehicle power system. They proposed a decentralized fuel cell fuzzy charging strategy to improve the cell charge state during the operation of the fuel cell vehicle. According to the difference in the energy output characteristics of the power system of HFC vehicles under different working conditions, Song et al. [27] proposed a fuel cell vehicle multi-mode energy management strategy based on driving state recognition technology. Under dynamic conditions, this control strategy is more cost-effective.
The PID control method is a common method for the control system. Deng et al. [28] proposed a fuzzy PID control method to adjust the controlling rule of the PID controller in the semi-closed loop servo system, which improved the dynamic response characteristics of the servo system and reached a high degree of position precision. Zhang et al. [29] utilized the fuzzy PID method to realize active force control. Compared with the traditional control method, the proposed fuzzy PID can ensure a better performance in terms of the stability of the contact force. In general, the fuzzy PID control method can overcome the shortcoming that traditional PID parameters cannot be adjusted in real time, so it is widely used in modeling of HFC vehicle power system.
The hydrogen vehicle power system includes control devices such as a fuel cell controller, a motor controller, and a power cell controller. The HFC, the power cell, and the motor need to be coordinated and controlled spontaneously so that the power system as a whole can play a role in the operation of the HFC vehicle. Most of the current modeling methods only focus on the electrochemical properties of the HFC power system, ignoring the multidisciplinary characteristics of the power system. Meanwhile, most of the existing vehicle software simulation modules focused on the realization of control strategies, which made it difficult to express the output characteristics of the power system accurately. To this end, we proposed a control method considering HFC voltage-output characteristics. The coordinated control of HFC and power cell can be achieved after we develop and analyze both the electrochemical and dynamic model for the HFC vehicle. The simulation results are in good agreement with the experimental results in the two models. The proposed control algorithm has a good control effect in all stages of the HFC vehicle operation.
2. HFC Electrochemical Mechanism Model
To establish an HFC electrochemical mechanism model, it is necessary to first combine the relevant theories of polarization phenomena to develop a voltage output model that can accurately calculate the output characteristics of the HFC. The actual output voltage of the HFC can be calculated as:
where Vout denotes the actual output voltage, ENernst denotes the electrochemical Nernst electromotive force, Vact denotes the activation polarization overvoltage, Vconc denotes the concentration polarization overvoltage, Vohm denotes the ohmic polarization overvoltage.
ENernst represents the maximum electromotive force that can theoretically be provided during the operation of the HFC. According to the principle of electrochemical reaction, substitute parameters such as the effective partial pressure of the reaction gas into the Nernst equation [30]:
where Tref denotes the reference temperature.
Vact is closely related to the electrochemical reaction rate, which is a voltage loss that is mainly caused by the destruction and recombination of the chemical bonds of the reactants during the electrochemical reaction, and the energy consumption of electrons moving between the electrodes. Substituting the reactant concentration and other parameters in the Butler–Volmer equation, we get the following [30]:
Since the value of the anode current density is generally about five orders of magnitude higher than the value of the cathode current density, only the positive electrode potential difference needs to be calculated. When , the reaction temperature and gas molar concentration can be substituted into the Tafel equation [30] to calculate Vact:
where the parameters are all electrochemical correlation coefficients.
In the interval of high current density, since the reactants cannot contact the catalyst in time to react, there will be a concentration gradient inside the fuel cell. When the reactant diffuses from the high-concentration area to the low-concentration area, due to the limitation of the diffusion rate, the reactant cannot reach the electrode surface in time, especially when the current suddenly increases or continues to be maintained at a high level; thus, a larger Vconc will be produced, which can be calculated as [31]:
Vohm, caused by the electrode material and electrolyte impedance that needs to be overcome when electrons and protons are conducted in the internal and external circuits of the cell, can be calculated as:
where S denotes the effective activation area of the proton exchange membrane. Rc denotes the equivalent impedance of the external circuit of the fuel cell. l denotes the thickness of proton exchange membrane. denotes the correlation coefficient of the proton exchange membrane resistivity. denotes the stoichiometric ratio of cathode reactants. K denotes the correlation coefficient of the water content of proton exchange membrane. According to the related theory of HFC electrochemistry [30,31], the effective partial pressure of the positive and negative reaction gases can be calculated as:
where the parameters are all electrochemical correlation coefficients [10].
3. Vehicle Power System Dynamic Load Model
The vehicle power system dynamic load model mainly consists of three parts, namely, the road resistance, the air resistance, and the acceleration resistance. The road resistance, Fr, mainly includes the rolling resistance and the slope resistance, which can be expressed as:
The air resistance for a running vehicle, Fw, is mainly caused by the pressure and friction of the air on the vehicle. It is generally related to the relative airflow velocity.
Since the HFC vehicles do not have internal combustion engines, according to the difference in mass and moment of inertia between HFC vehicles and traditional vehicles, the acceleration resistance of HFC vehicles, Fa, can be obtained as:
The equivalent driving force of the HFC vehicle motor, , is the equivalent force acting on the vehicle after the torque generated by the motor is decelerated by the main reducer. Then, Fa can be also derived with Fr, Fw, and Ft, as follows:
4. Improved Fuzzy PID Control Method
4.1. Improved Fuzzy Adaptive PID Control Mechanism
According to the mutual feedback information of the space, working condition, energy, control, and other information between the HFC vehicle electrochemical model and the power system model, the eccentric fuzzy rule module, the acceleration braking module, and the power distribution module are designed separately. Among them, the input parameters of the eccentric fuzzy rule module are the velocity deviation and the velocity deviation change rate, the input parameters of the power distribution module are the power deviation and the current output power of the power cell, and the input parameters of the acceleration braking module are the speed deviation and the reference acceleration limit value.
- Eccentric fuzzy rule module
According to the analysis of the speed requirements of HFC vehicles under complex working conditions, the asymmetric input and output variable universe is designed. Combined with the fuzzy subset design of the subsequent output variables, the final eccentric fuzzy rule table is eccentric; regardless of whether it is vertical or horizontal, the conventional deviation in the fuzzy rule table is 0 and the deviation change rate is 0. In addition, the intersection control rules are not at the center of the fuzzy rule table. According to the analysis of the HFC vehicle power system model control problems, the fuzzy control rules of the designed power system model eccentric fuzzy PID control strategy should meet the following conditions:
- (a)
- According to the velocity requirements of the HFC vehicle, the power distribution module is adjusted first. By controlling the input HFC parameters, the output power of the HFC is adjusted to satisfy most of the overall output power of the power system.
- (b)
- According to the difference between the HFC vehicle velocity target and the current velocity, as well as the rate of change of the velocity difference, the changing trend of the velocity difference can be predicted. Taking the output power of HFCs and power cells in the current power system as a reference, through reasonable cell variable load distribution, a rapid response to the variable power demand of HFC vehicles in complex road conditions can be achieved.
- Acceleration braking module
According to the characteristics of the hydrogen fuel cell vehicles and the inherent properties of the power system itself, with reference to the actual range of acceleration for more precise acceleration and braking control, the acceleration braking module is designed. The velocity deviation and reference acceleration limit value are taken as the input. The acceleration brake controller ensures that the acceleration has the maximum limit value in the actual working condition. The difference between the desired velocity and the actual velocity is used to determine whether the brake is required.
- Power distribution module
The power deviation and the current output power of the power cell are taken as the input. The power distribution controller realizes the coordinated control of the HFC power output and the power cell to give full play to the auxiliary role of the power cell. The HFC minimum output power is set in the HFC output characteristic controller. When the demand of the vehicle power is low, it is completely powered by the HFC. When the load change range of the power is large, the HFC and the power cell are used to change the load jointly. When the velocity demand fluctuates in a small range, the power cell is given priority to meet the power, so as to reduce the number of frequent load changes and the degree of sudden load changes of the HFC, and to extend the service life of the HFC.
4.2. Control Rules Design
- Input and output asymmetric fuzzification design
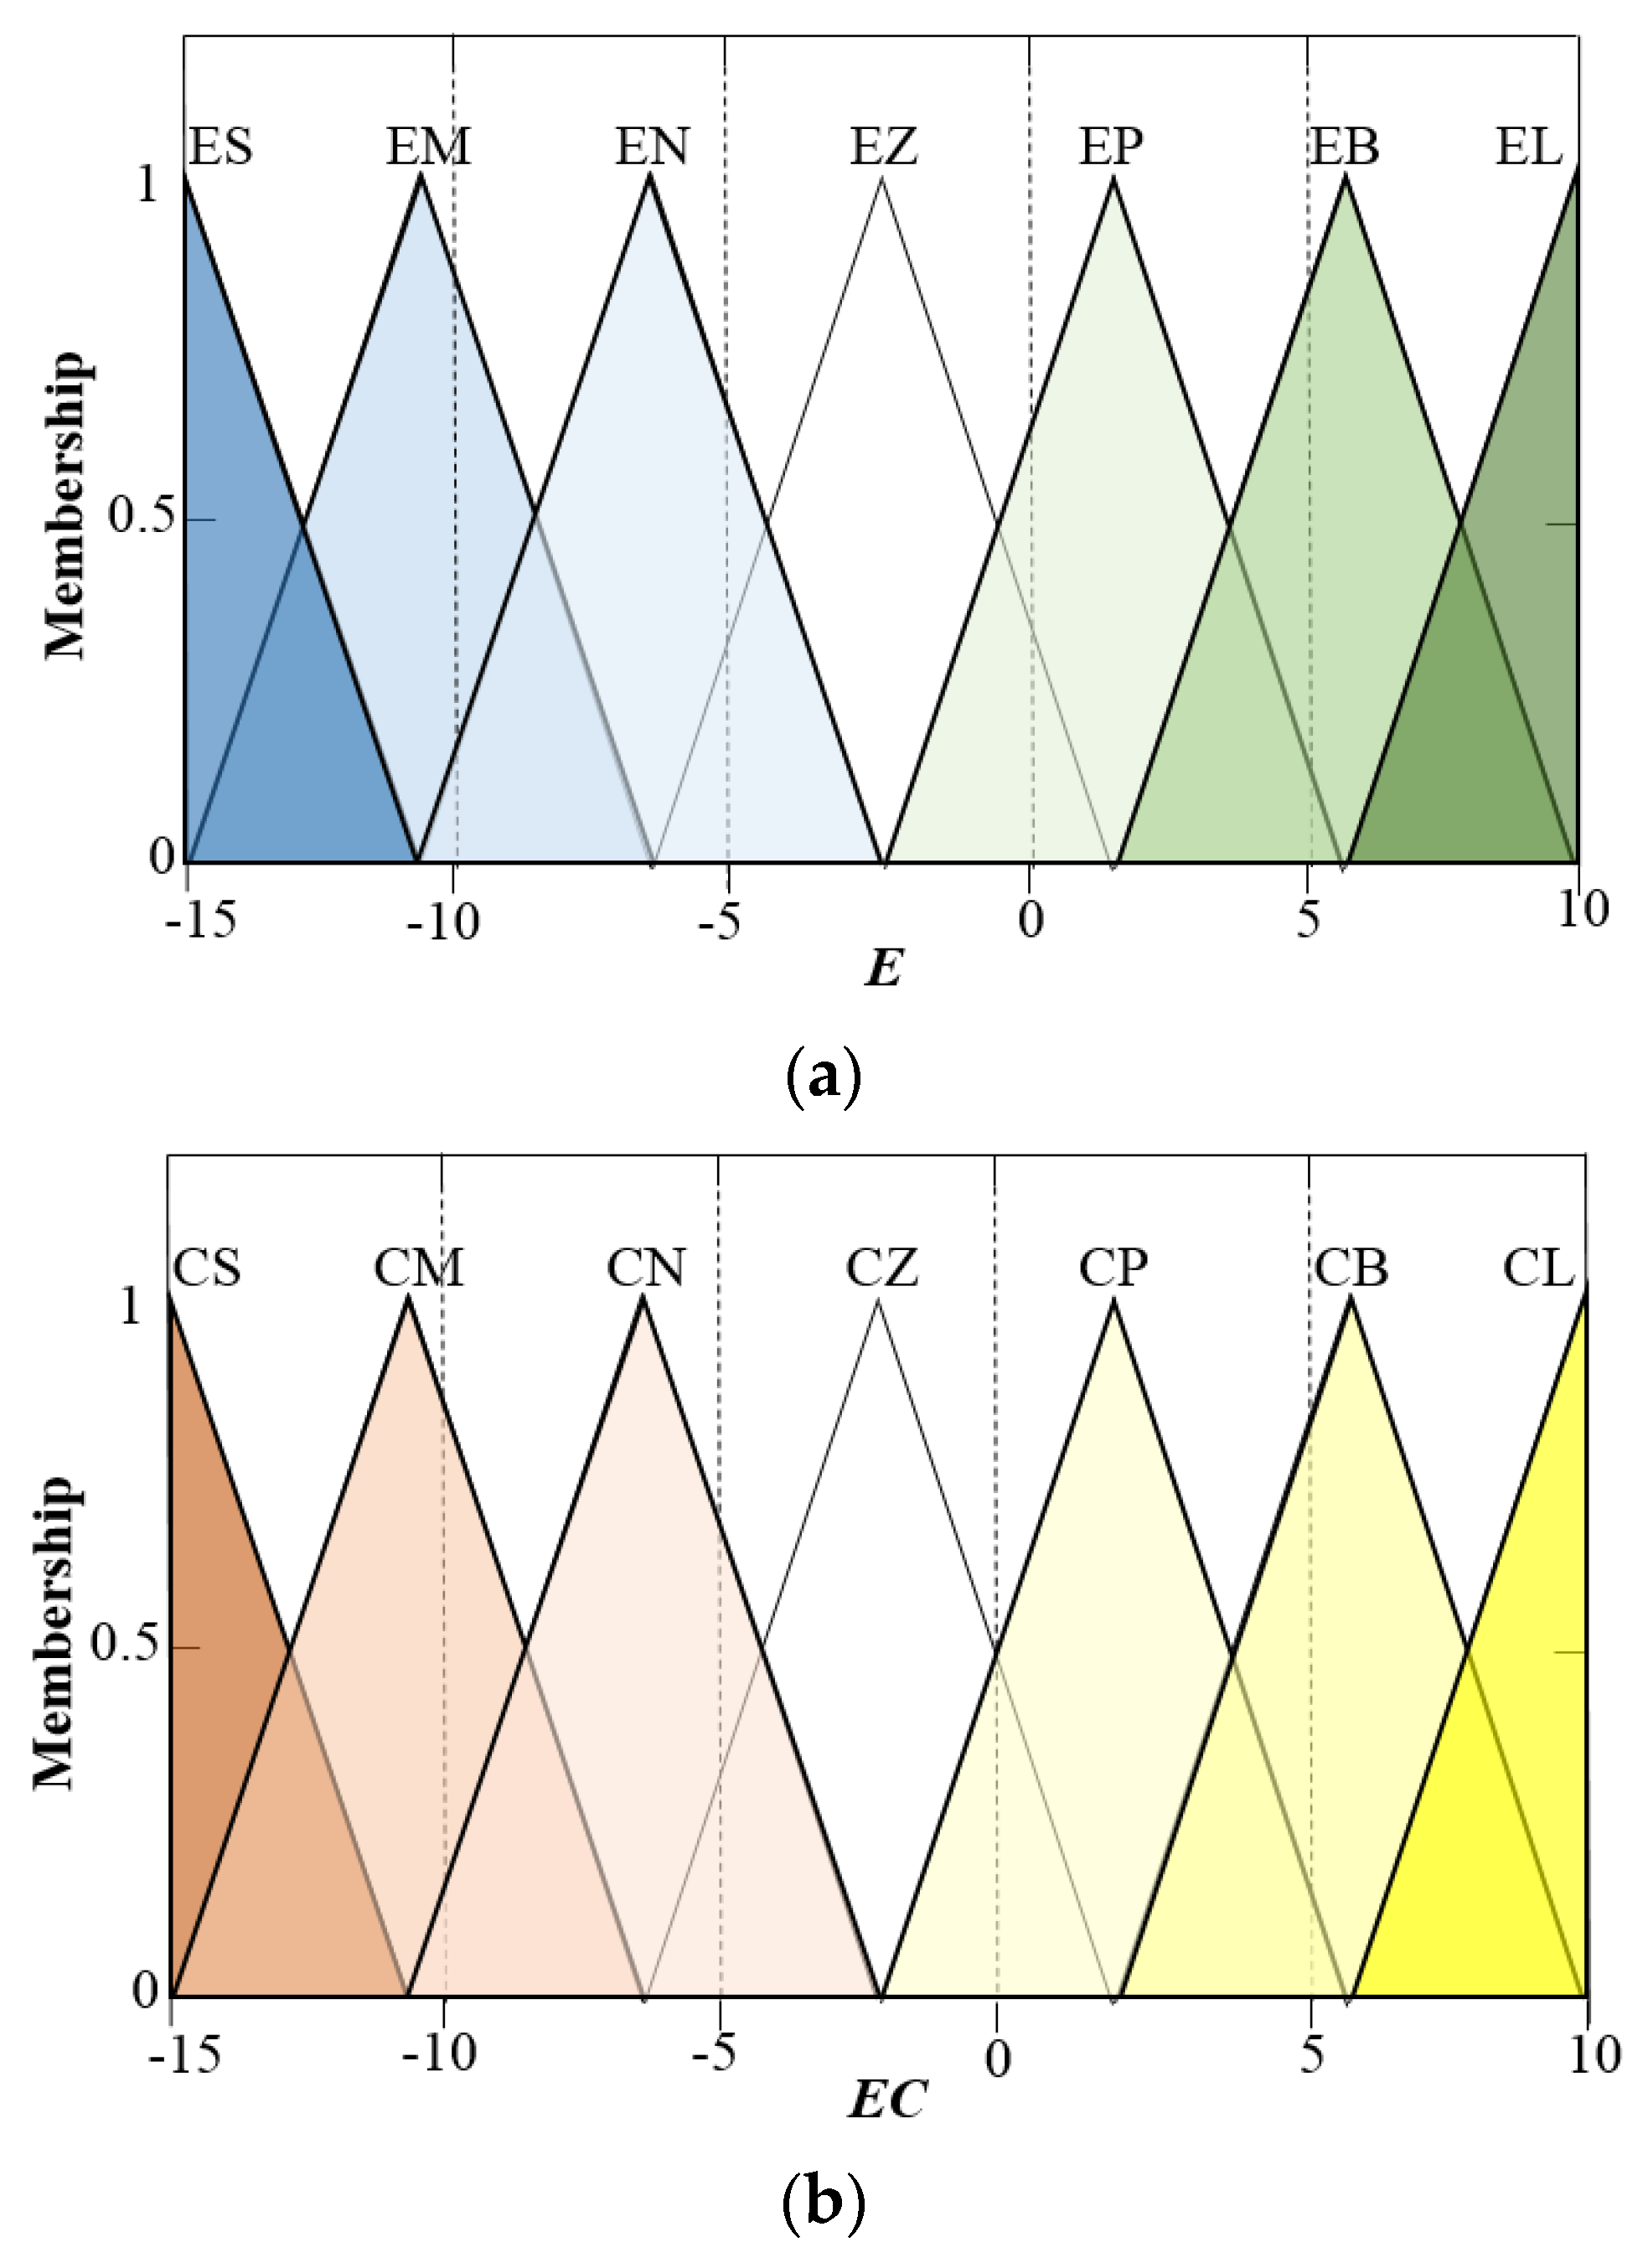
The deviation E between the expected velocity of the HFC vehicle and the velocity is used as the input variables as well as the deviation change rate EC. Due to factors such as signal lights, pedestrians, and higher vehicle density, the running conditions of the vehicles in urban are more complicated than the ones outside urban. Therefore, we analyze the actual test data under typical working conditions, such as the Urban Dynamometer Driving Schedule. According to the fuzzy control system design method, the domain of E is defined as [−15, 10], the corresponding fuzzy subset is [ES, EM, EN, EZ, EP, EB, EL]. The domain of EC is defined as [−14, 31], the corresponding fuzzy subset is [CS, CM, CN, CZ, CP, CB, CL]. The trim function is utilized to set the membership function for fuzzy processing. The fuzzy value distributions of E and EC are shown in Figure 1.
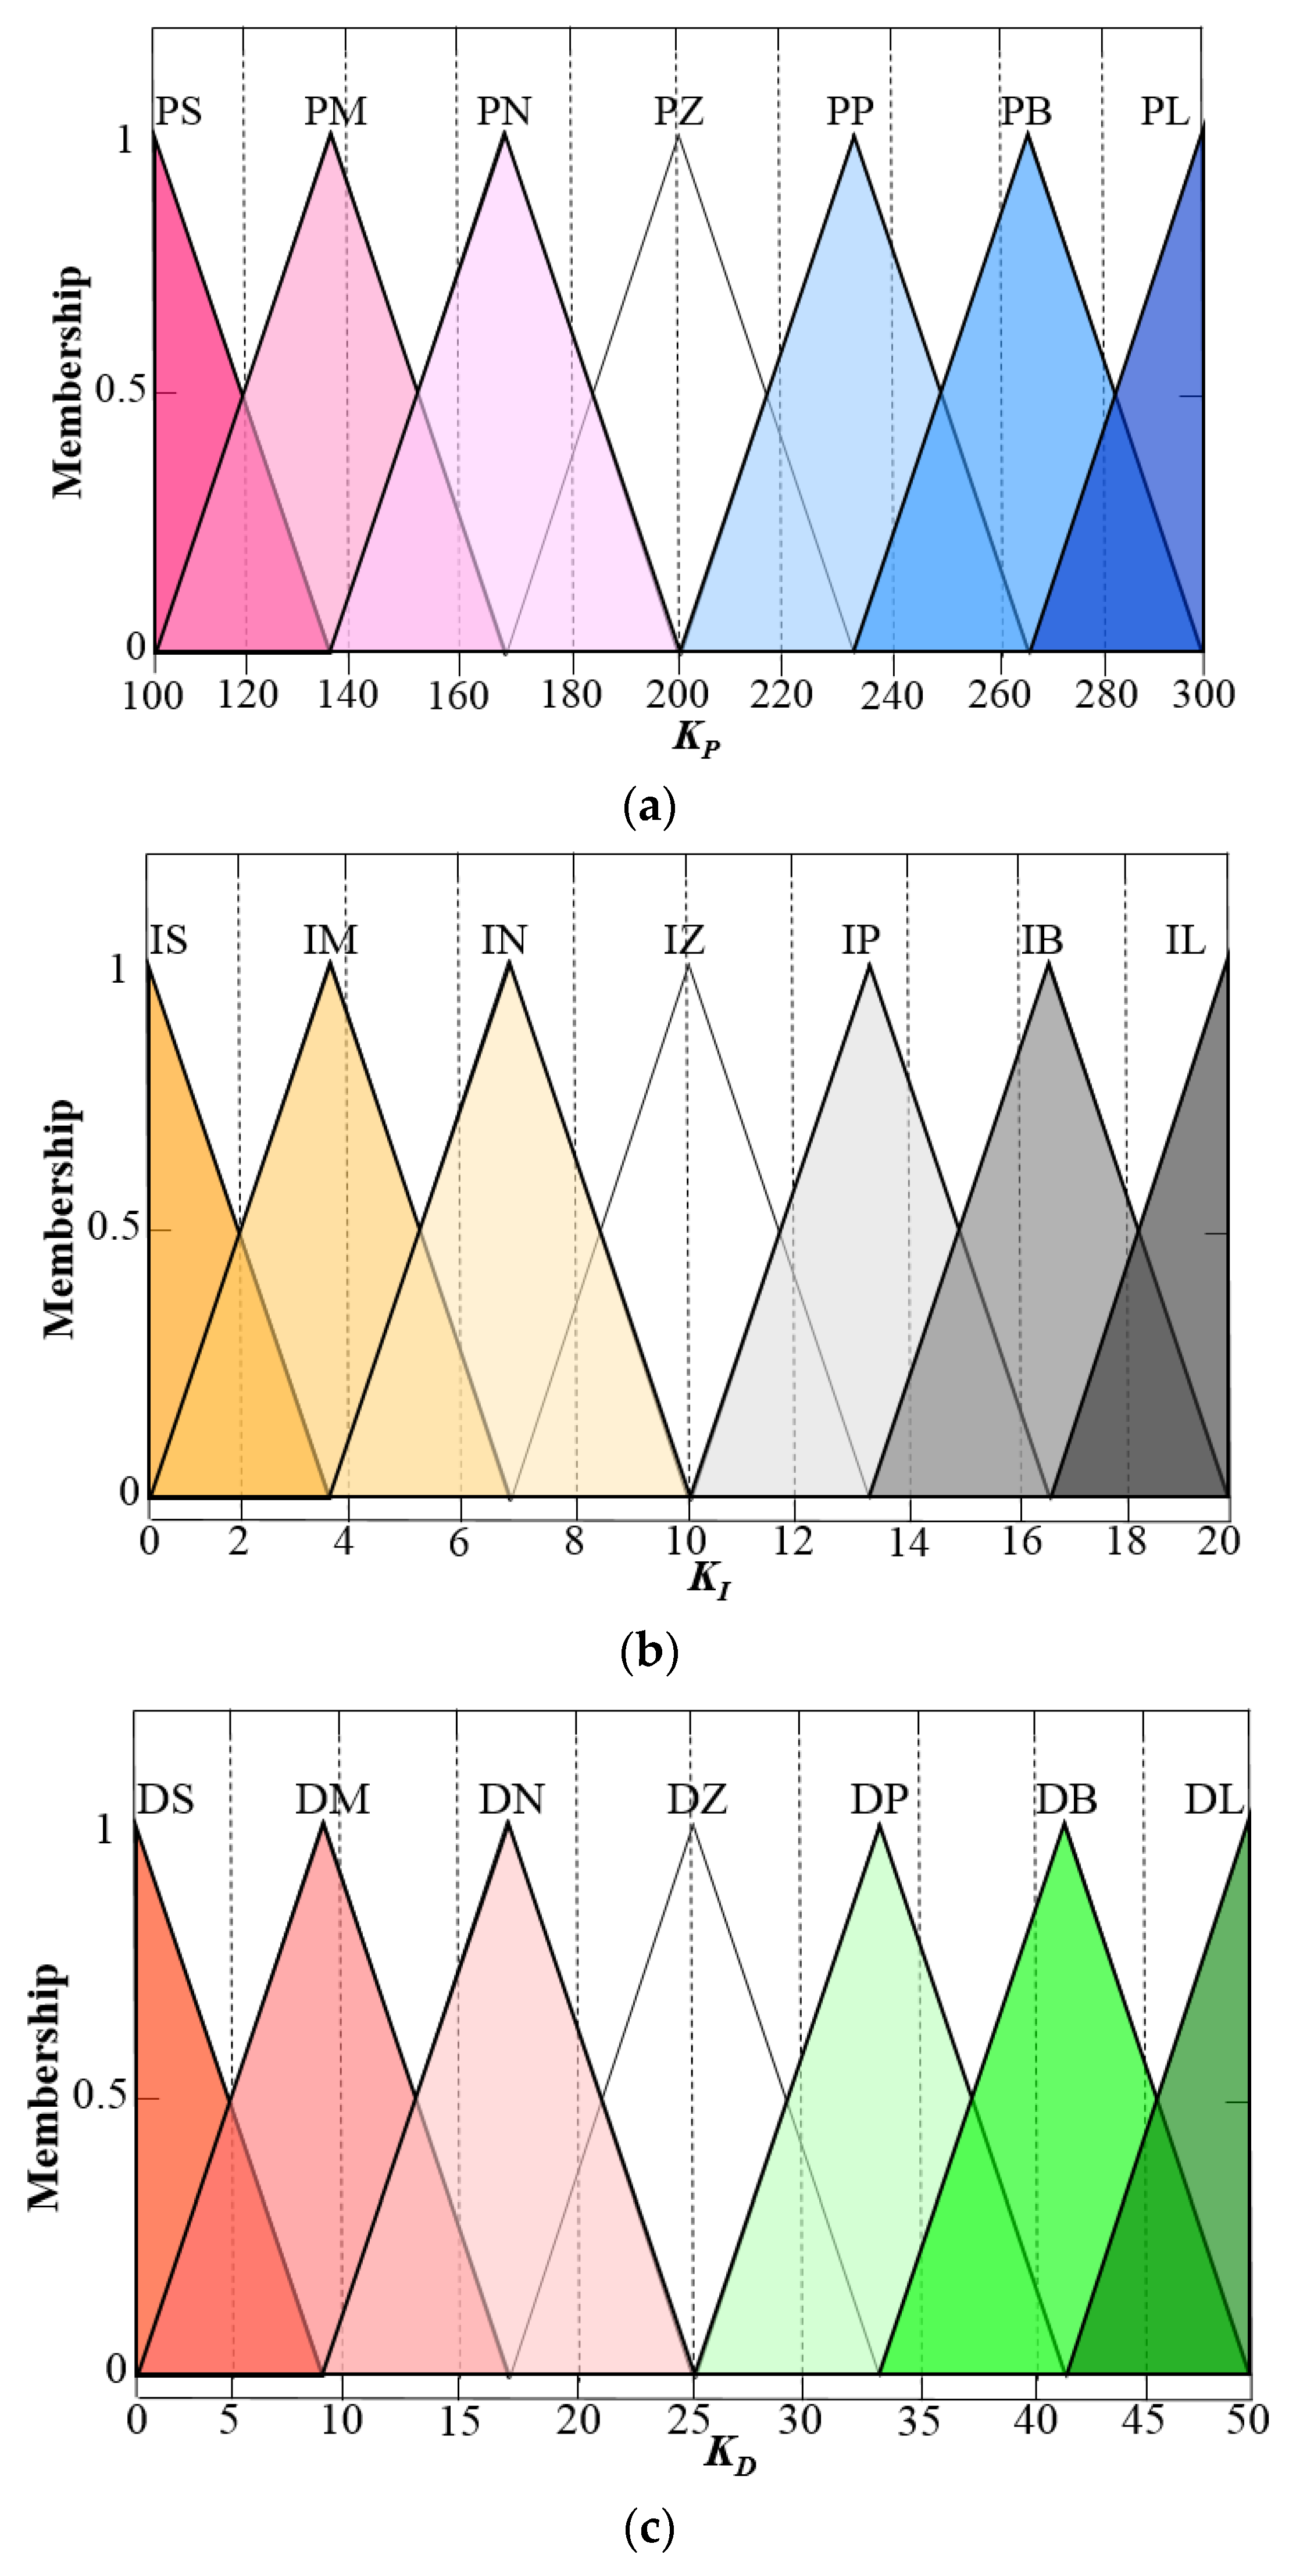
Take Kp, KI, KD as the output variables of the fuzzy controller and adjust the parameters by several trials. Then the domain of Kp is defined as [100, 300], and the corresponding fuzzy subset is [PS, PM, PN, PZ, PP, PB, PL]. The domain of KI is defined as [0, 20], and the corresponding fuzzy subset is [IS, IM, IN, IZ, IP, IB, IL]. The domain of KD is defined as [0, 50], and the corresponding fuzzy subset is [DS, DM, DN, DZ, DP, DB, DL]. Similarly, the trim function is utilized to set the membership function for fuzzy processing. The fuzzy value distributions of Kp, KI, KD are shown in Figure 2.
- Eccentric fuzzy rules design
(a) When the absolute values of E and EC are both small, the variable load pressure of the vehicle power system is small, and the power output is relatively stable. Therefore, the fuzzy control rule with a moderate adjustment effect of the fuzzy subset of output variables is selected. (b) Meanwhile, when the absolute values of E and EC are both large, E⋅EC > 0, the vehicle has a greater demand for velocity changes, and because this demand is expanding, the fuzzy control rule with the strongest regulating effect should be selected. (c) When the absolute value of E is small and the absolute value of EC is large, E⋅EC > 0, the current velocity change demand of the vehicle is small, but this demand tends to gradually expand. Under these circumstances, a fuzzy control rule with a strong regulating effect should be selected. (d) When the absolute values of E and EC are both large and E⋅EC < 0, or when the absolute value of E is small, but the absolute value of EC is large and also E⋅EC < 0, the fuzzy control rules that are slightly weaker than (b) and (c) should be selected, respectively, to avoid large overshoots while making adjustments, which will cause additional burdens for subsequent continuous velocity adjustments. (e) When the absolute value of E is large, while the absolute value of EC is small, the current velocity change demand of the vehicle is large, but the trend of this demand to continue to expand is small. Therefore, a fuzzy control rule with a strong regulating effect should be selected. According to the above rules, the fuzzy rule design tables about Kp, KI, KD are shown in Table 1, Table 2 and Table 3, respectively.
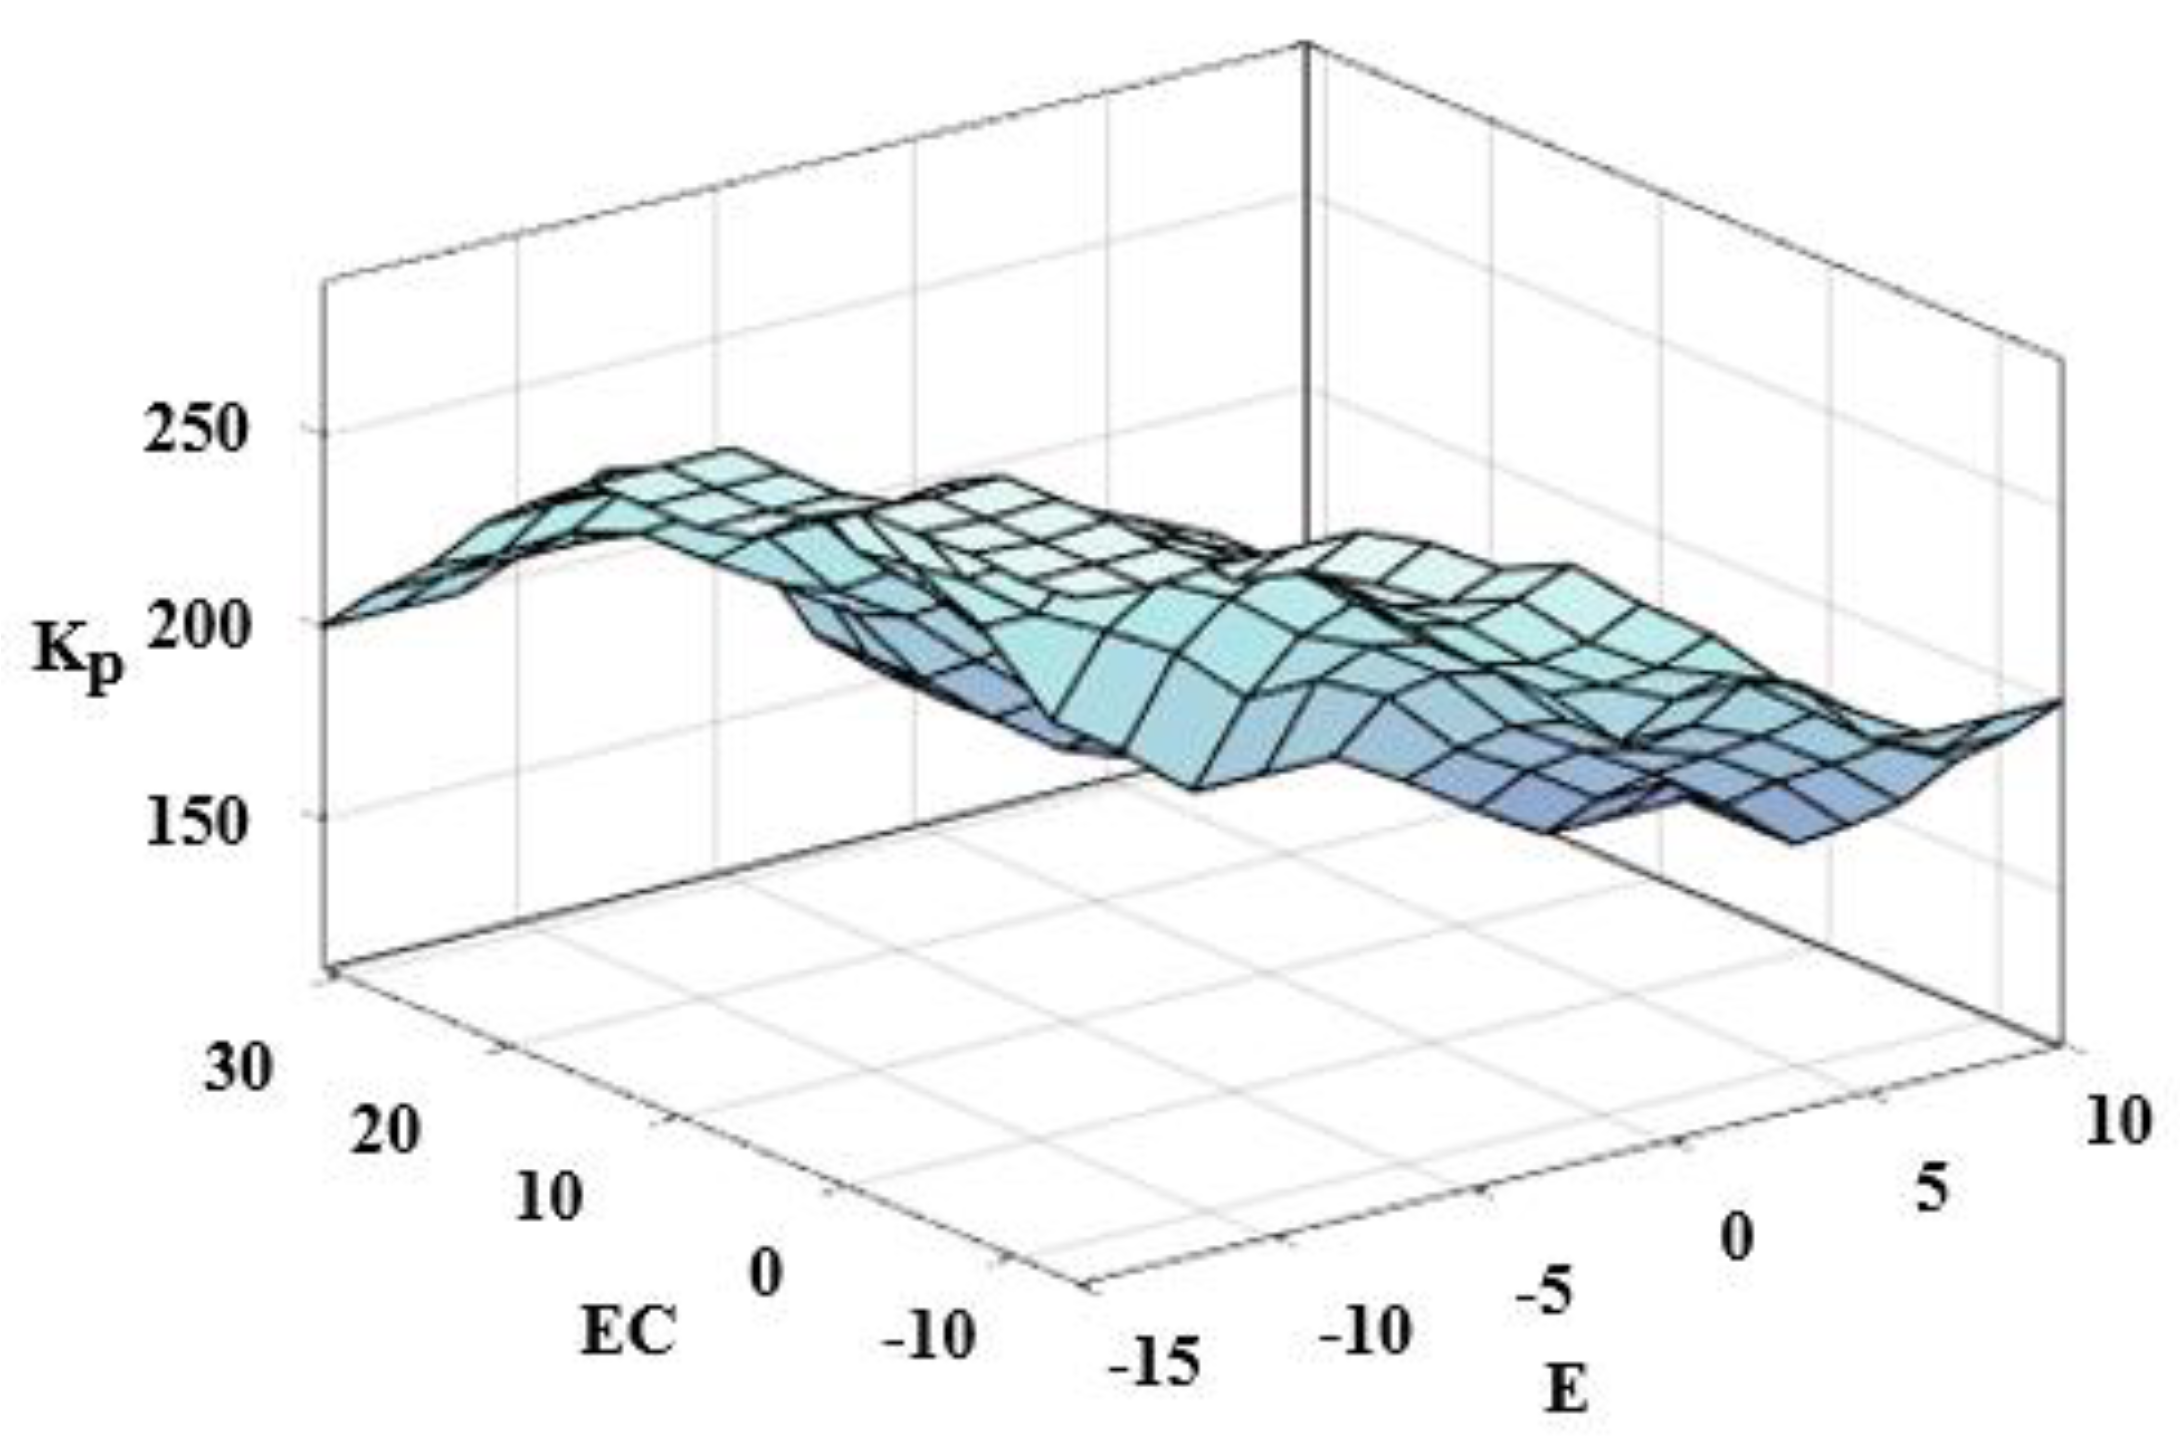
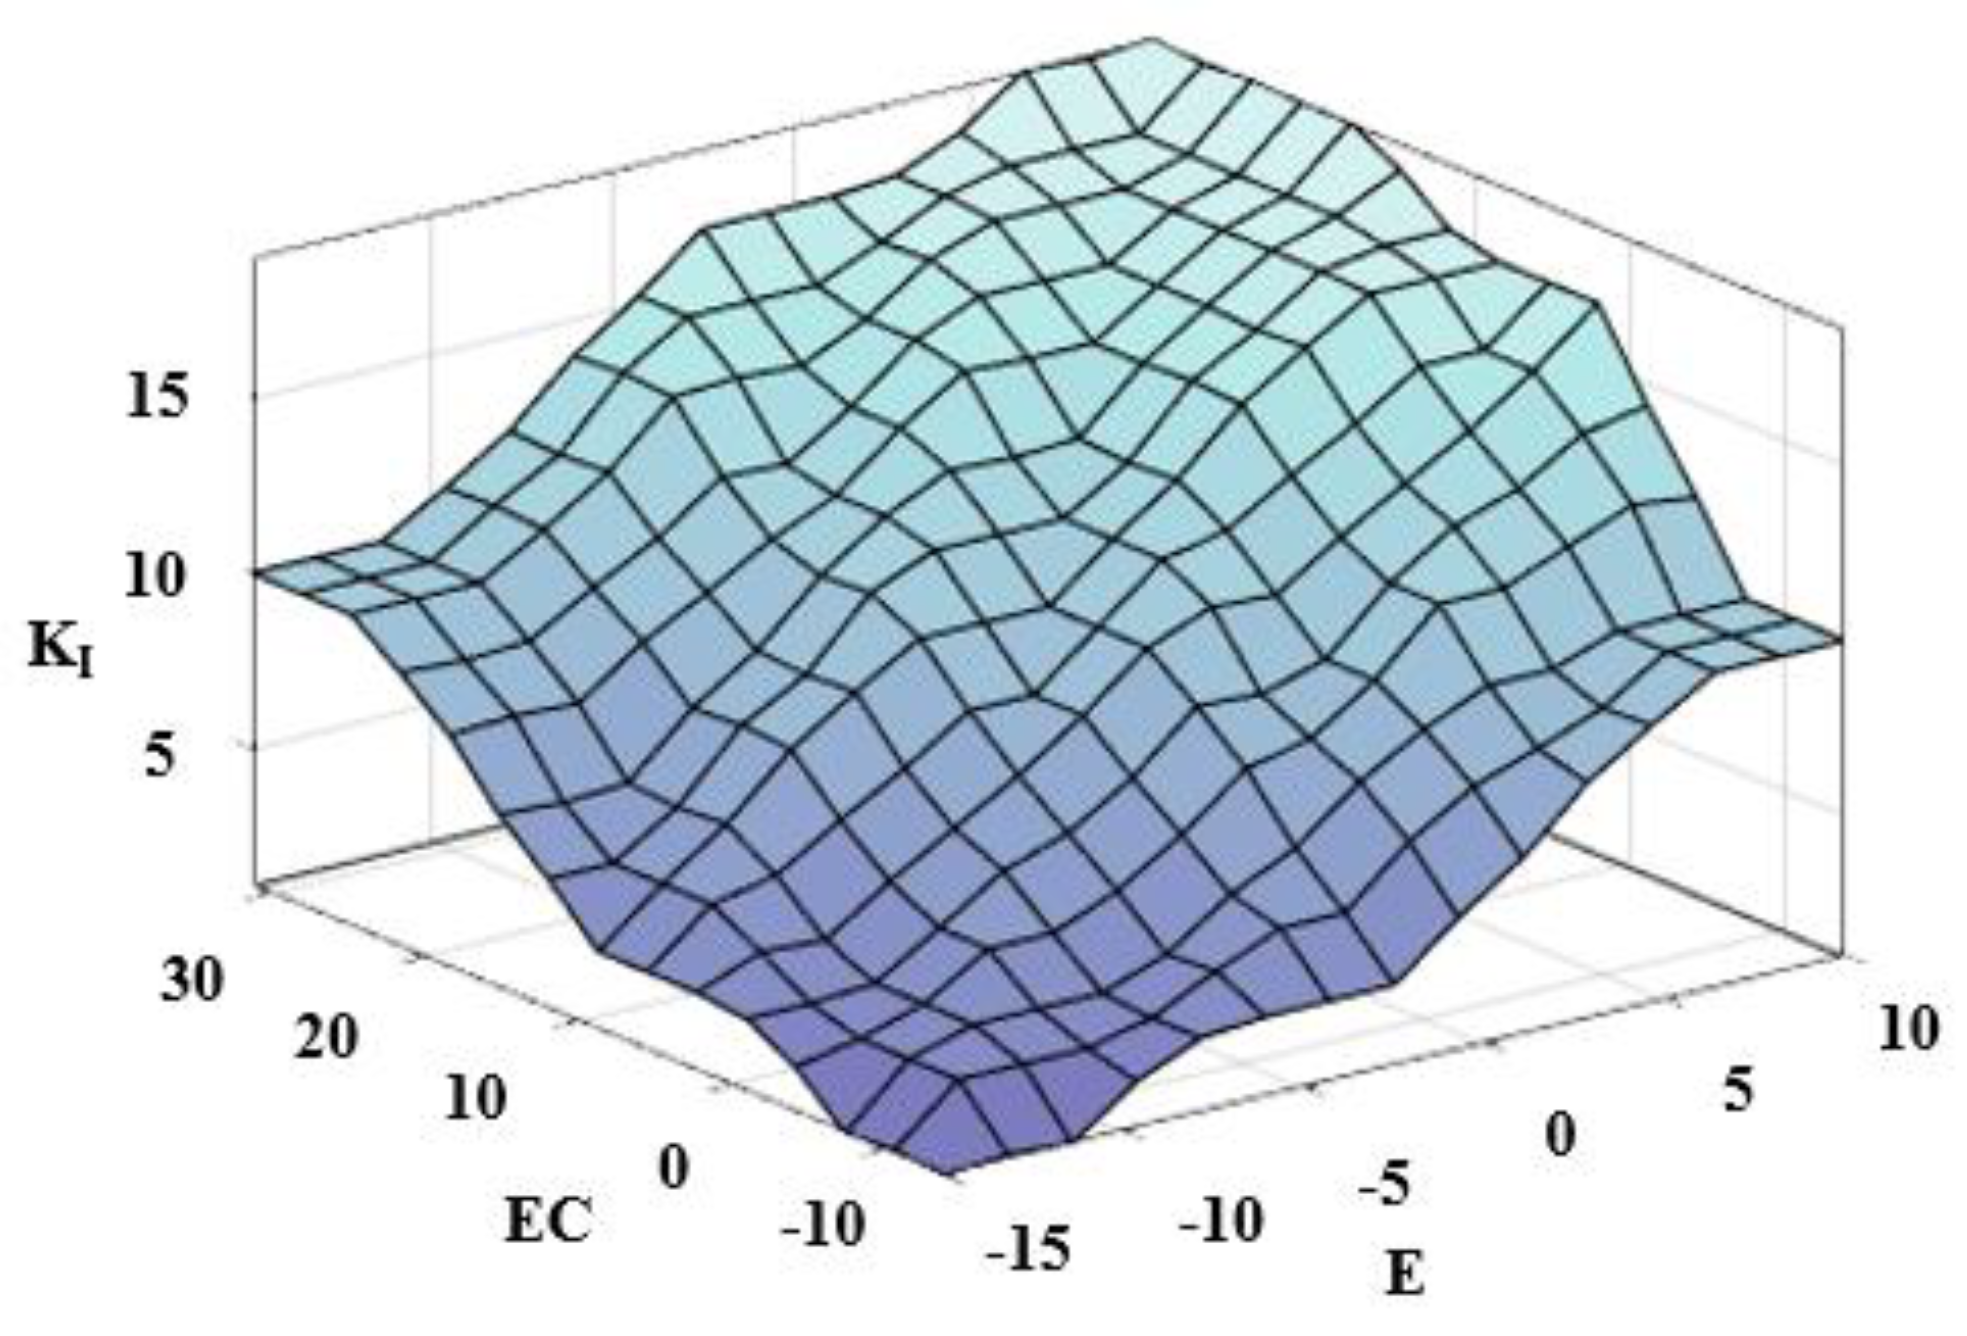
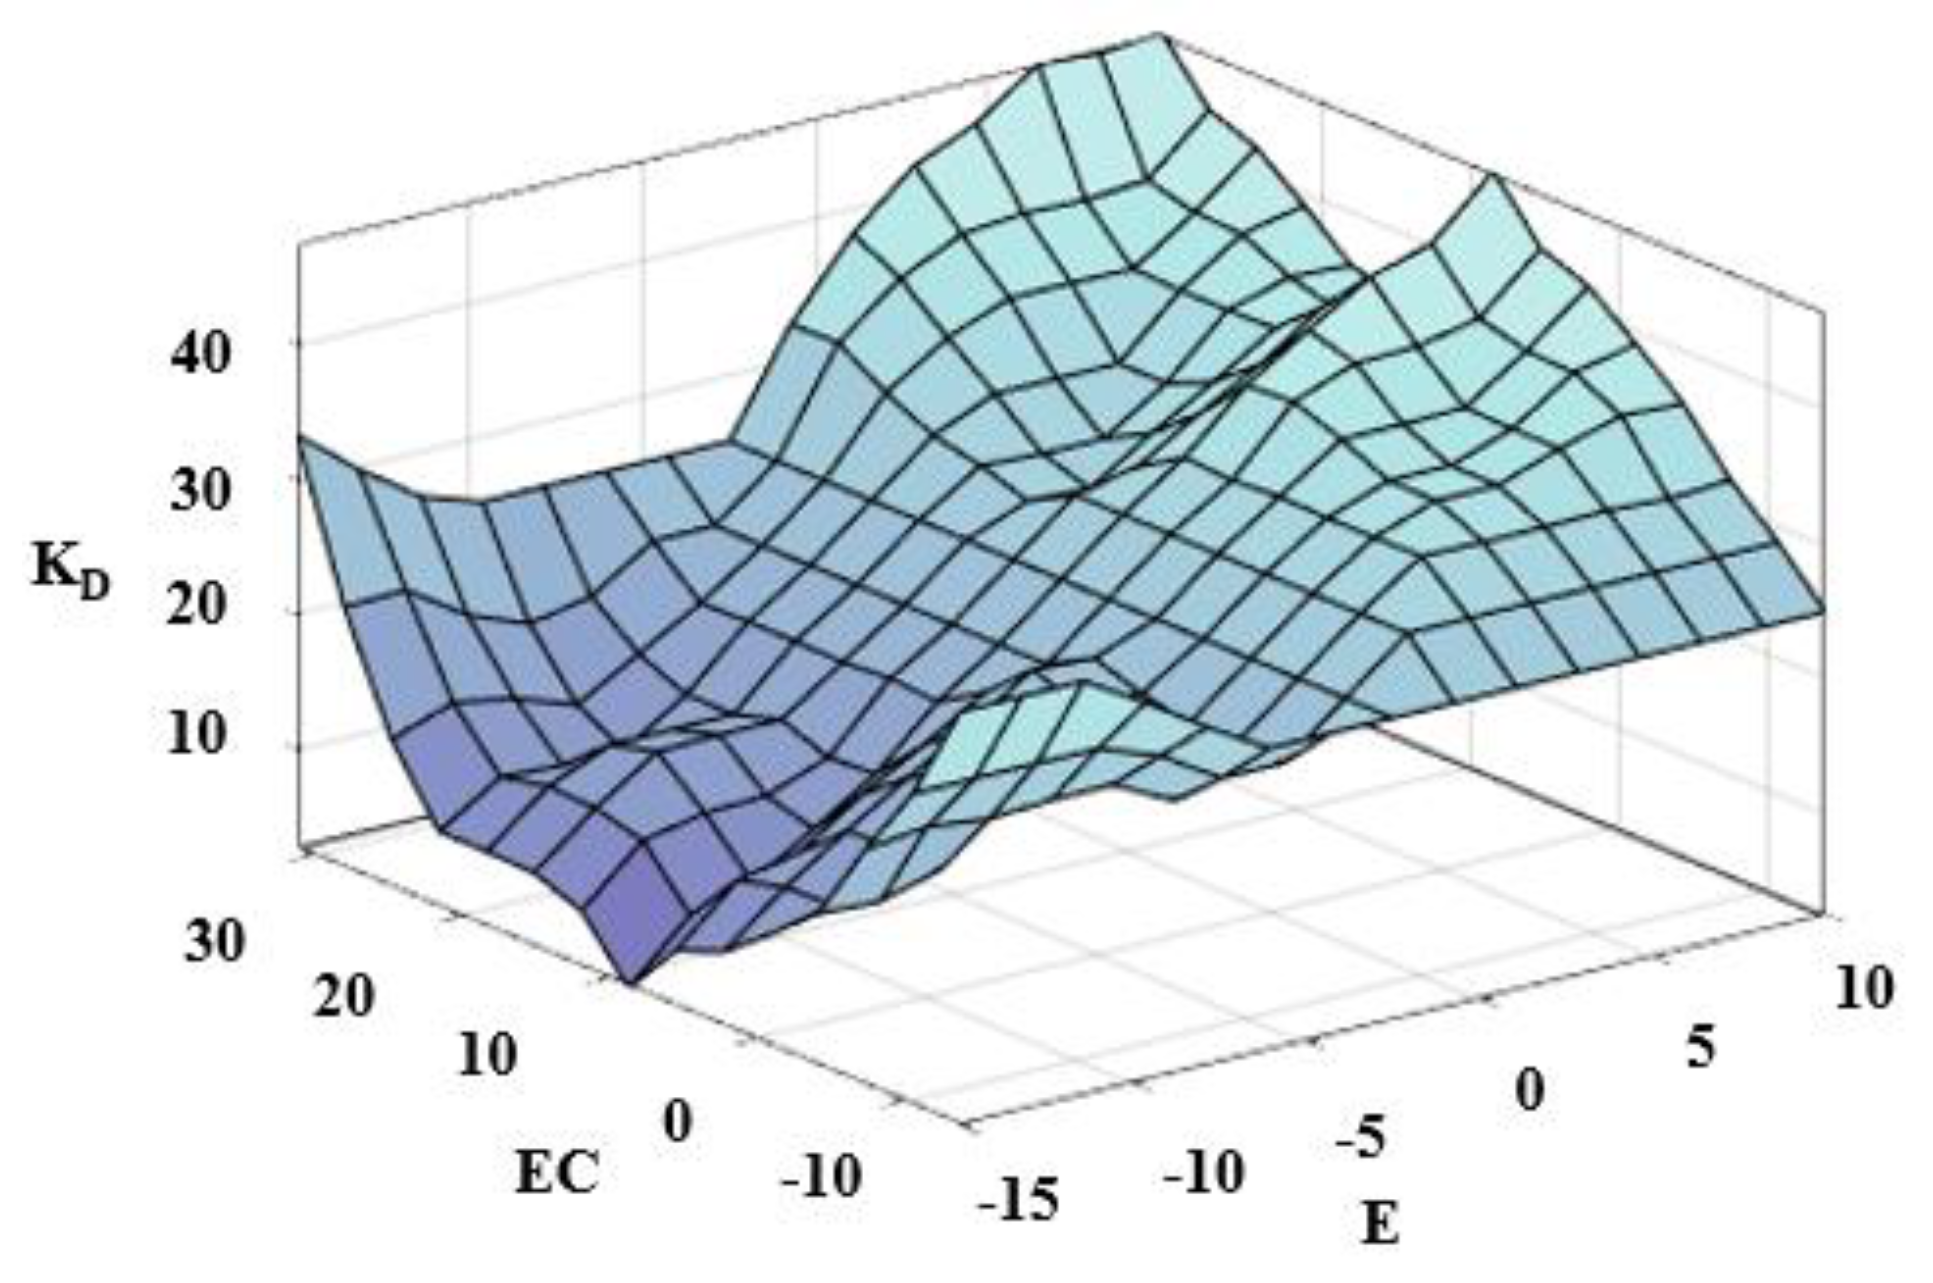
There are 49 control rules in the fuzzy rule tables of , , , respectively. Therefore, the fuzzy rule library designed in this paper contains a total of 147 control rules. The corresponding three-dimensional relationship diagram between fuzzy rules is shown in Figure 3, Figure 4 and Figure 5.
- Defuzzification.
Use the center of gravity method for defuzzification:
where is the precise value of the control variable after the fuzzy control algorithm is defuzzified. is the value in the universe of fuzzy control variable set. is the membership value corresponding to . After defuzzification, the precise values of the output variables , and of the fuzzy control can be obtained, and the PID control algorithm can be combined based on this, according to the complexity of the vehicle. The variable control requirements under working conditions control the output performance of the power system.
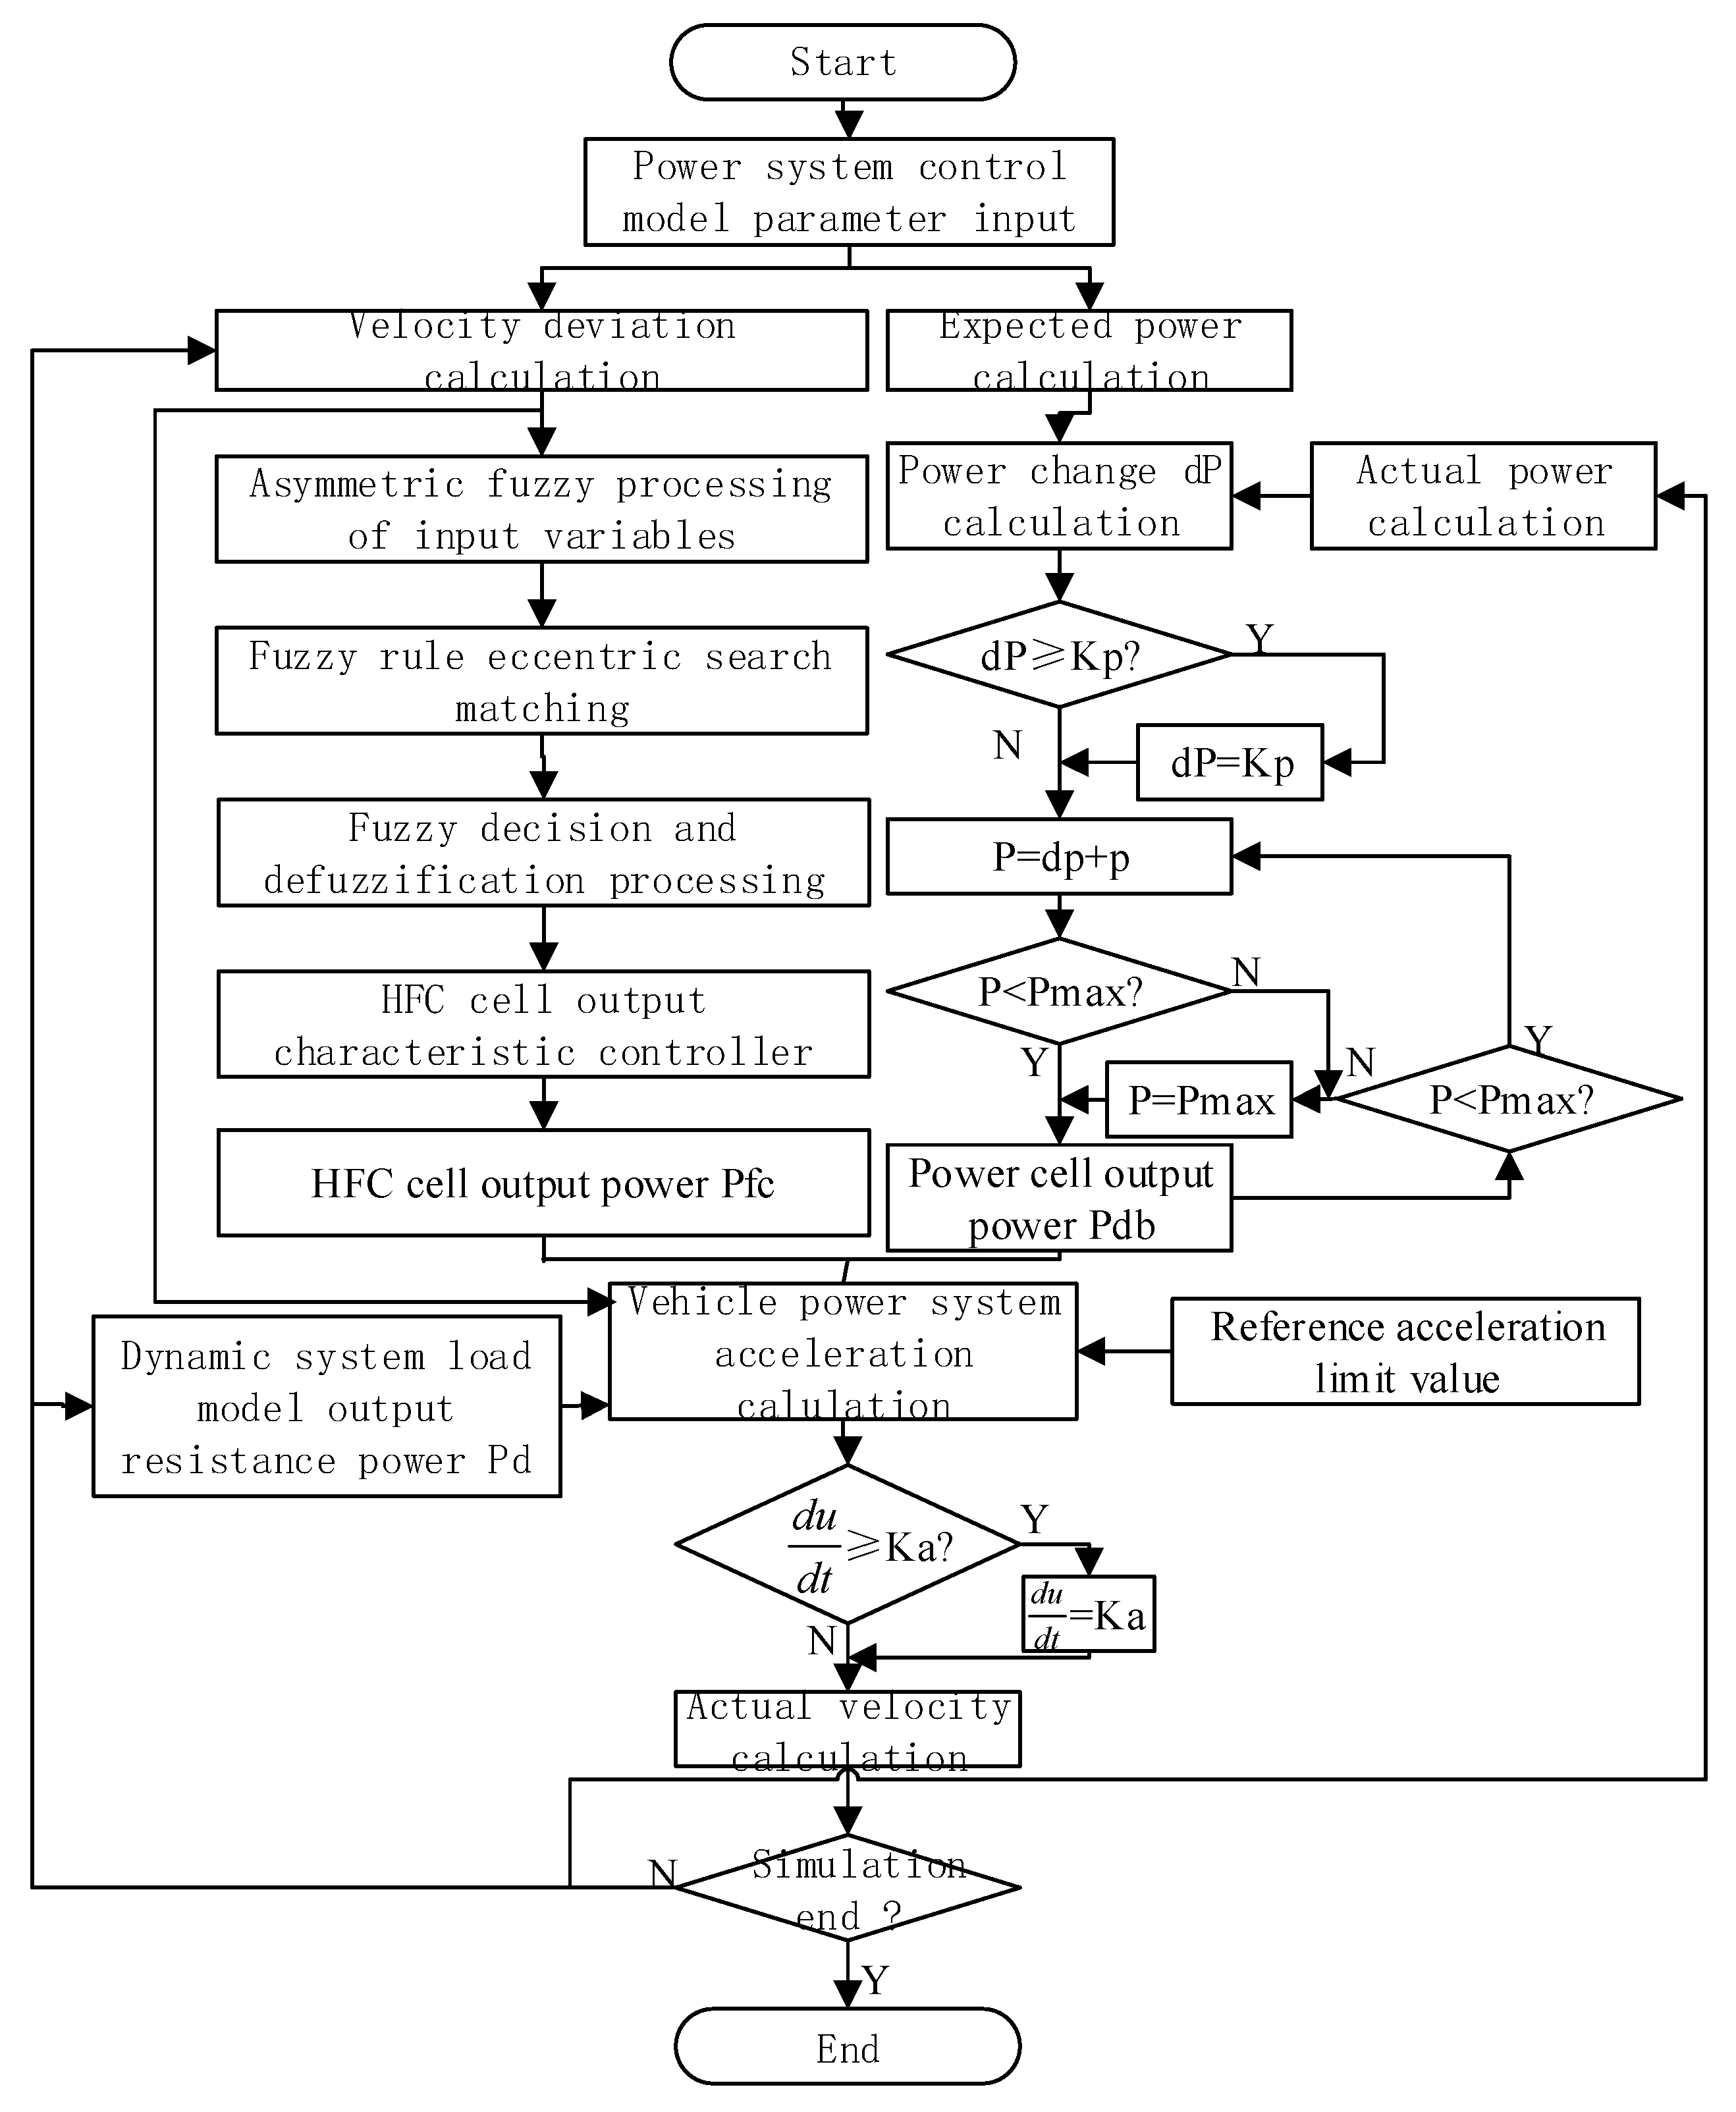
4.3. Improved Fuzzy PID Control Process
According to the proposed improved fuzzy PID control algorithm, the control process can be expressed as it is shown in Figure 6. The established power system control model is a concrete realization of the improved fuzzy PID system control method that adapts to the HFC power system proposed in this paper. It can be seen from the establishment process of the power system control model that the control algorithm proposed in this paper not only designs the acceleration brake module and the power distribution module, but also compares the fuzzy control variable universe based on the characteristics of the model built in this paper and the actual driving conditions of the vehicle. The design method has been improved asymmetrically. In addition, the design of fuzzy control rules has been eccentrically improved to achieve a better control effect.
5. Simulation Case Study and Analysis
To verify the feasibility of the proposed method, we carry out the simulation and experiment separately. Both the simulation results and experiment results are compared and analyzed. According to the HFC operating conditions, we set the parameters of the voltage output model and the back pressure adjustment model in the electrochemical mechanism model of the HFC. The HFC voltage-output characteristics test condition parameters are set as Table 4. The test data related to the HFC output voltage characteristics are compared with the model simulation results to verify the effectiveness of the HFC electrochemical mechanism model.
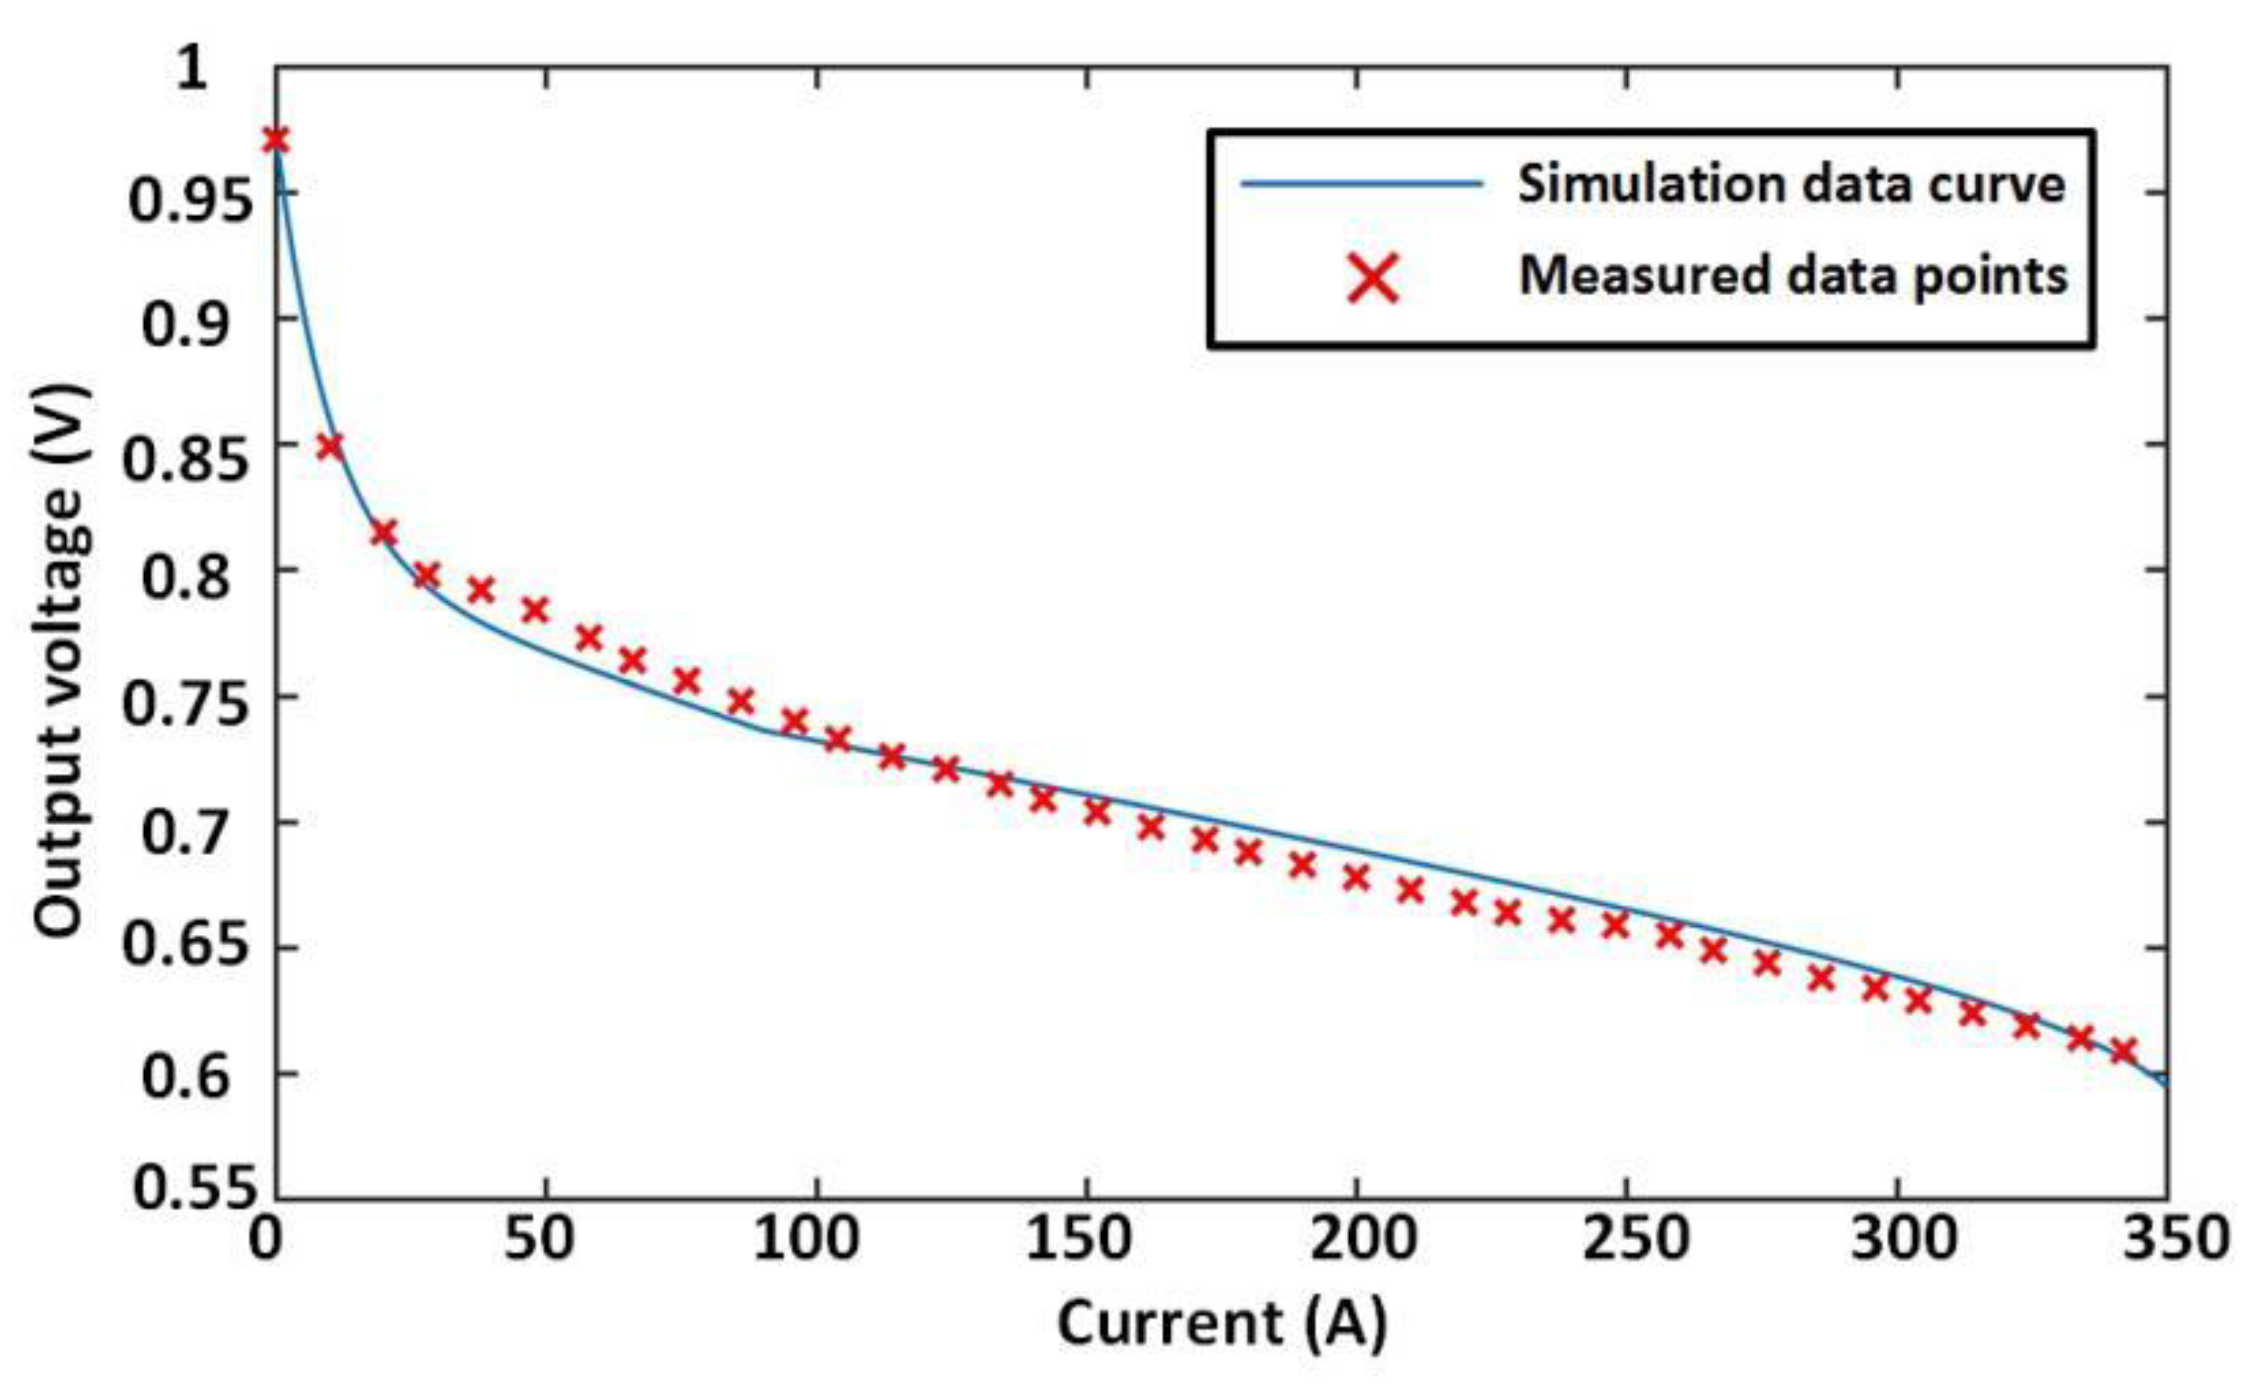
The test method of fuel cell output voltage is: The HFC starts from 0 A and loads incrementally until it reaches about 350 A. After running for 2 min at each current operating point, the voltage data at that current is recorded, and the average value within 2 min is taken as the voltage under the current operating condition. We take the anode back pressure as 1.2 bar, and the cathode back pressure = anode back pressure + 0.1 bar for the test. The test data are shown in Table 5.
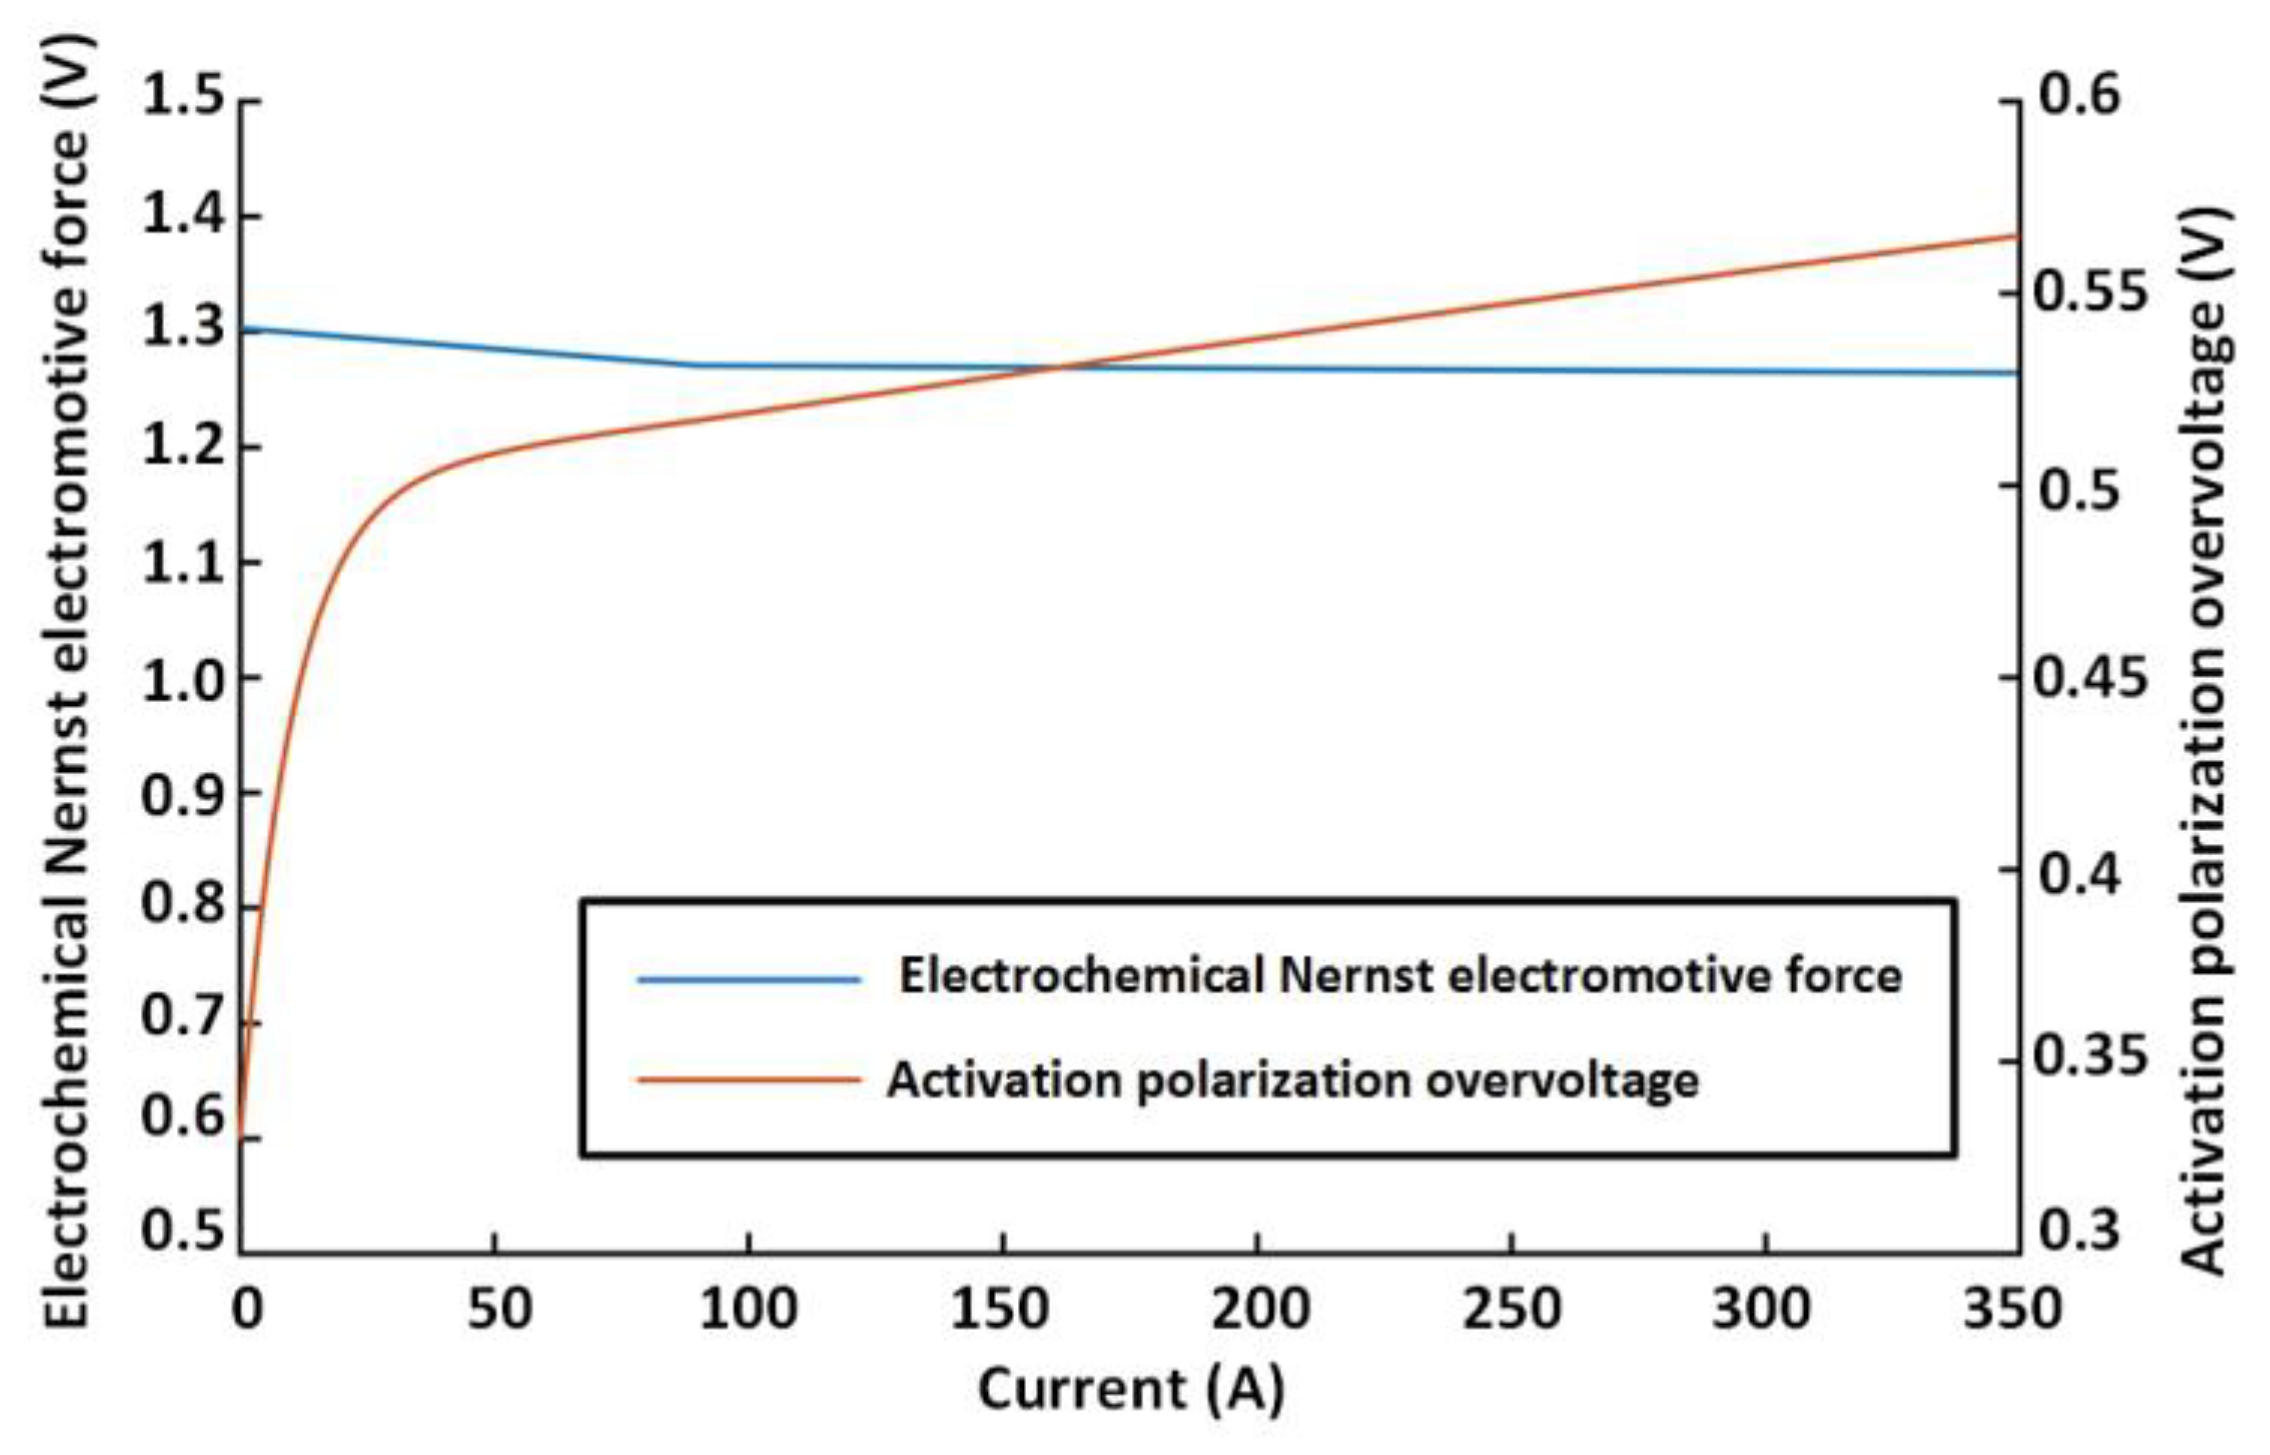
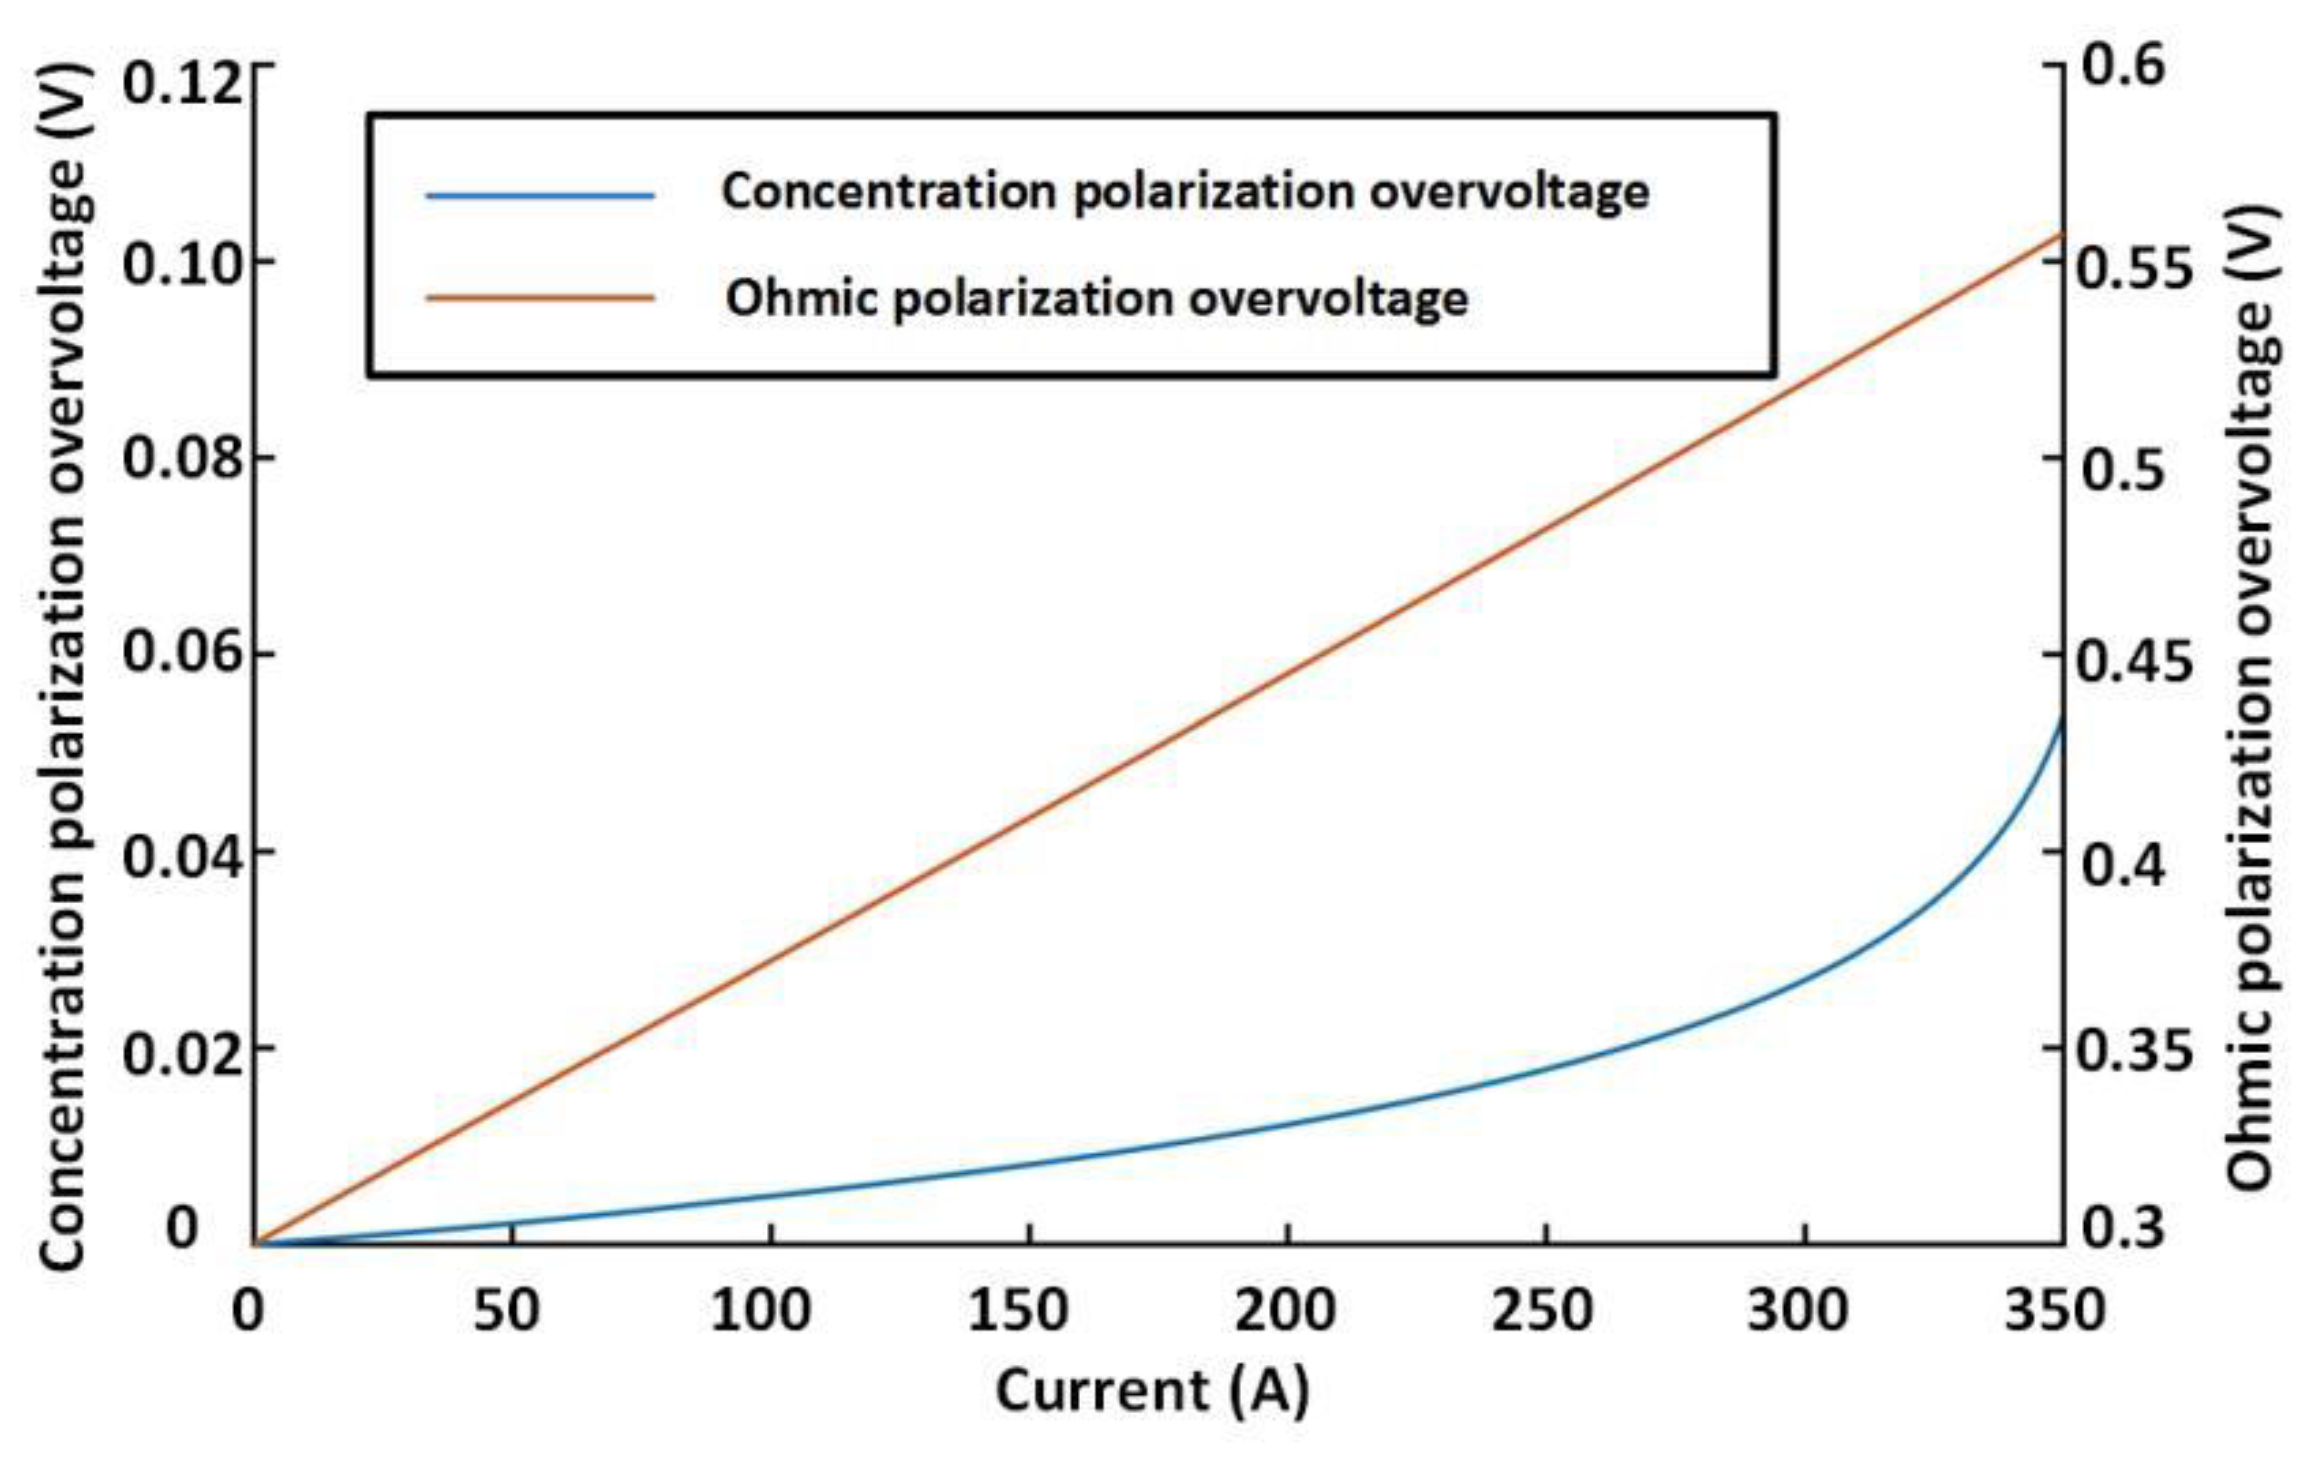
In the HFC electrochemical mechanism model, the load current of the fuel cell is controlled to linearly change from 0 A to 350 A gradually, and the change in the output voltage of the fuel cell is recorded. Through the simulation of the HFC electrochemical mechanism model, the change curves of its electrochemical Nernst electromotive force, activation polarization overvoltage, concentration polarization overvoltage, and ohmic polarization overvoltage are shown in Figure 7 and Figure 8.
The above simulation curve illustrates that as the loading current increases, the electrochemical Nernst electromotive force gradually stabilizes after a slight decrease due to changes in the cell operating temperature and the effective partial pressure of the reactant gas at a low load. The activation polarization overvoltage increases rapidly when the current load is small. The value of the concentration polarization overvoltage increases rapidly when the current load is at a higher level. The ohmic polarization overvoltage has a close linear positive correlation with the load current. The test data and the simulation data are compared, and the results are shown in Figure 9. The error between the simulated data and the actual data is shown in Table 6.
The absolute value of the error between the simulation data and the actual data is calculated; the average error is 0.0072 V, and the maximum error is 0.0149 V.
The parameters of the HFC vehicle and its power system in the dynamic system load model are set as shown in Table 7. According to the actual output characteristics of the electric vehicle motor after the fitting process, the driving force input power of the HFC vehicle power system is designed. The resistance power at the current speed through the dynamic load model of the power system is calculated as well as the actual velocity and acceleration of the vehicle. The changing trend of the driving force, resistance, speed, and acceleration in the simulation results are compared.
The driving force input power of the power system is designed as Equation (14) [32]. Under the set working conditions, the simulation verification of the dynamic load model of the power system is carried out:
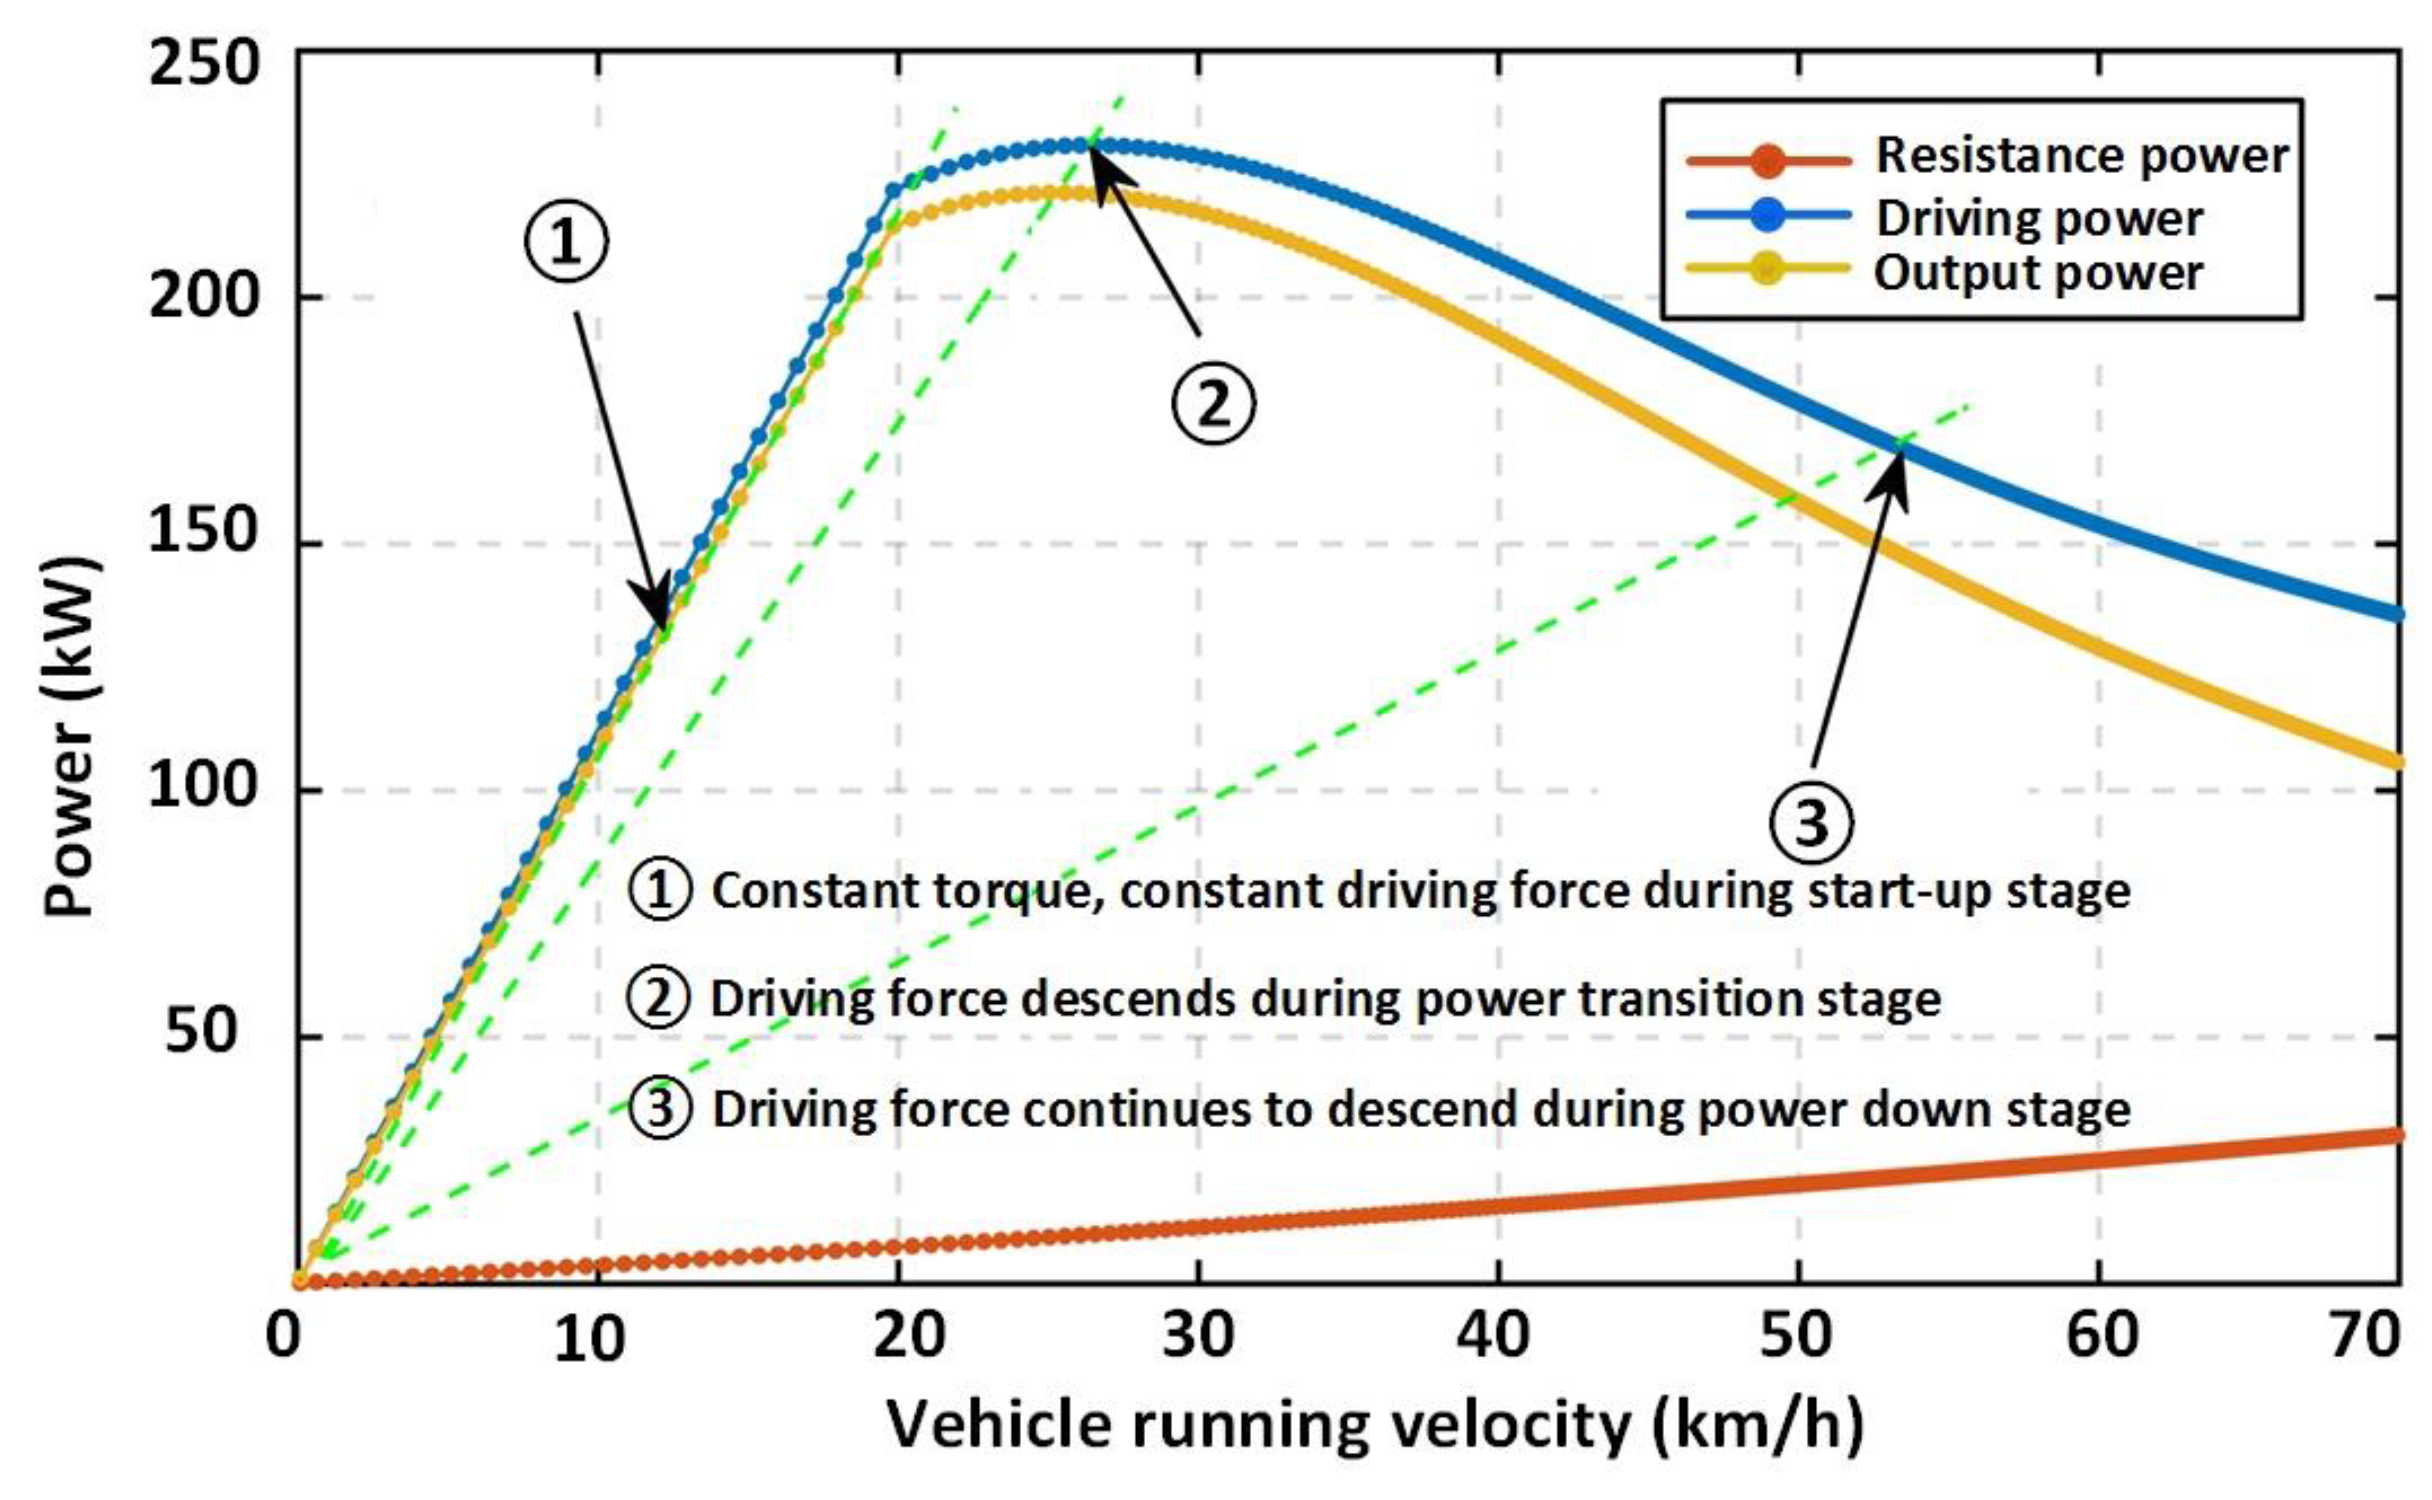
The simulation curve of the relationship between the driving power and resistance power of the power system and the speed of the vehicle can be obtained as shown in Figure 10.
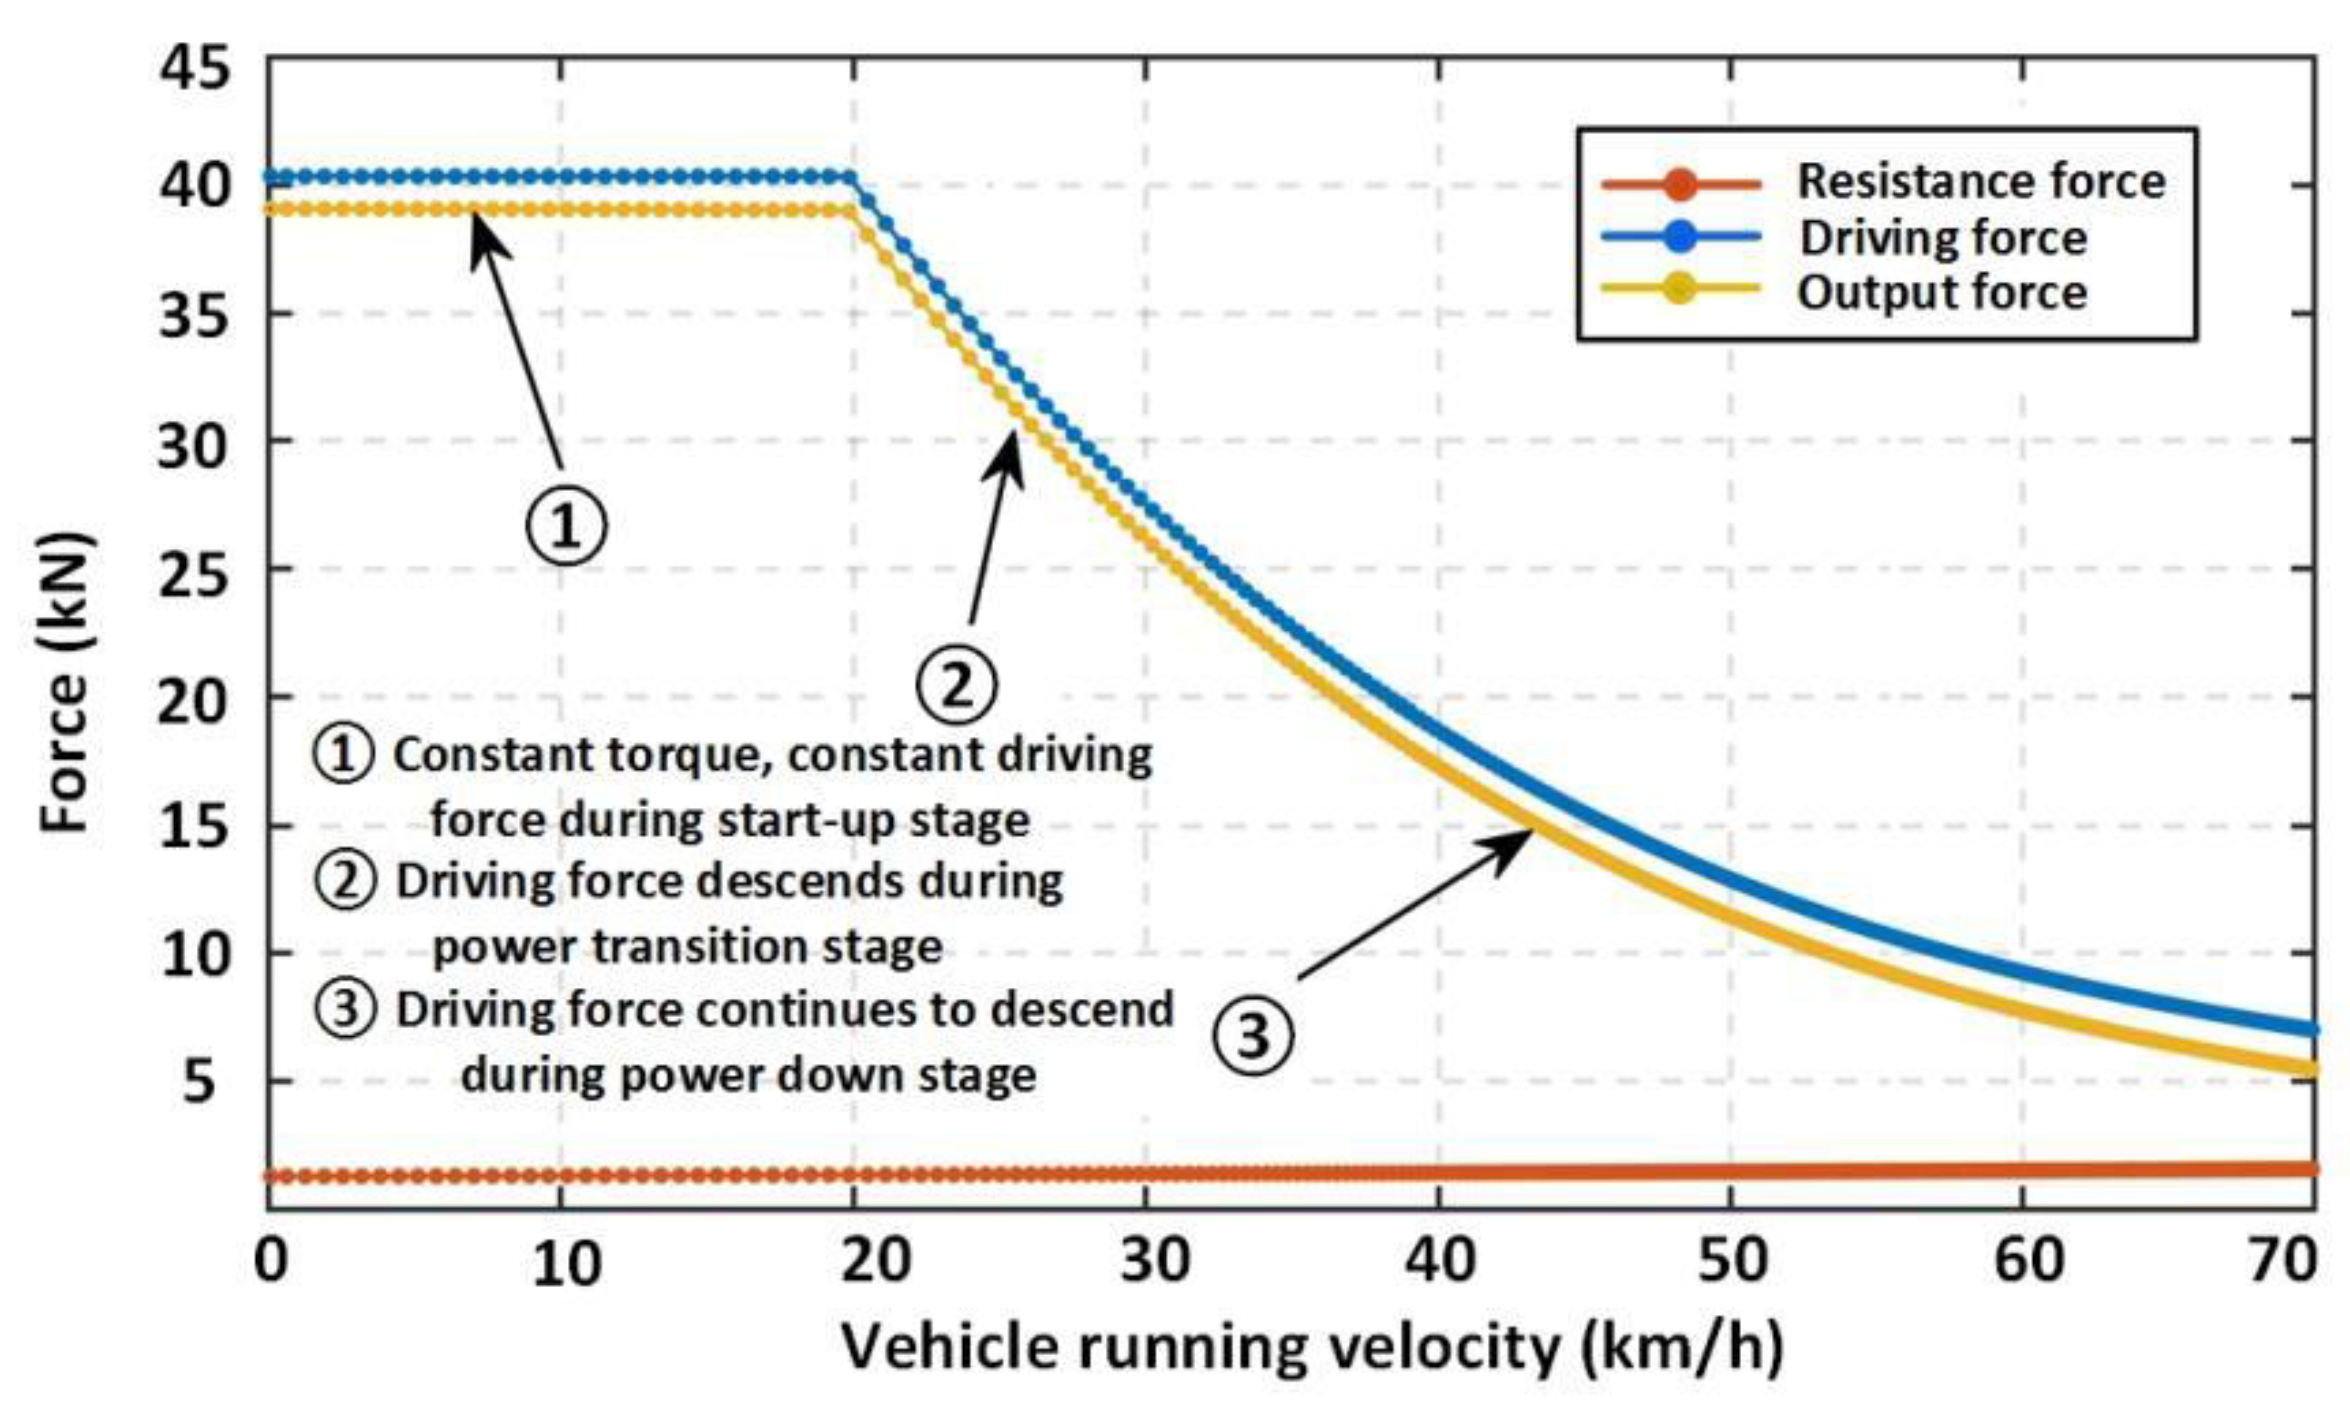
Through the slope of the line between each power curve and the origin (green dotted line) in Figure 10, the changing trend of each part of the force can be obtained. In the constant torque starting stage (0~19.72 km/h), the driving power of the power system has a linear relationship with the velocity, and the driving force should be a fixed value. In the power transition stage (19.72~27.06 km/h), the driving power is still increasing, but the slope of the connecting line between the driving power and the origin begins to decrease, so the driving force gradually decreases. In the power drop stage (above 27.06 km/h), the driving power gradually decreases, and the driving force continues to decrease. The driving resistance refers to the sum of all resistances except acceleration resistance. In this process, the driving resistance always increases slowly with the increase of velocity. The above results are verified by combining the driving force-resistance balance diagram obtained from the simulation of the dynamic load model of the dynamic system, as shown in Figure 11.
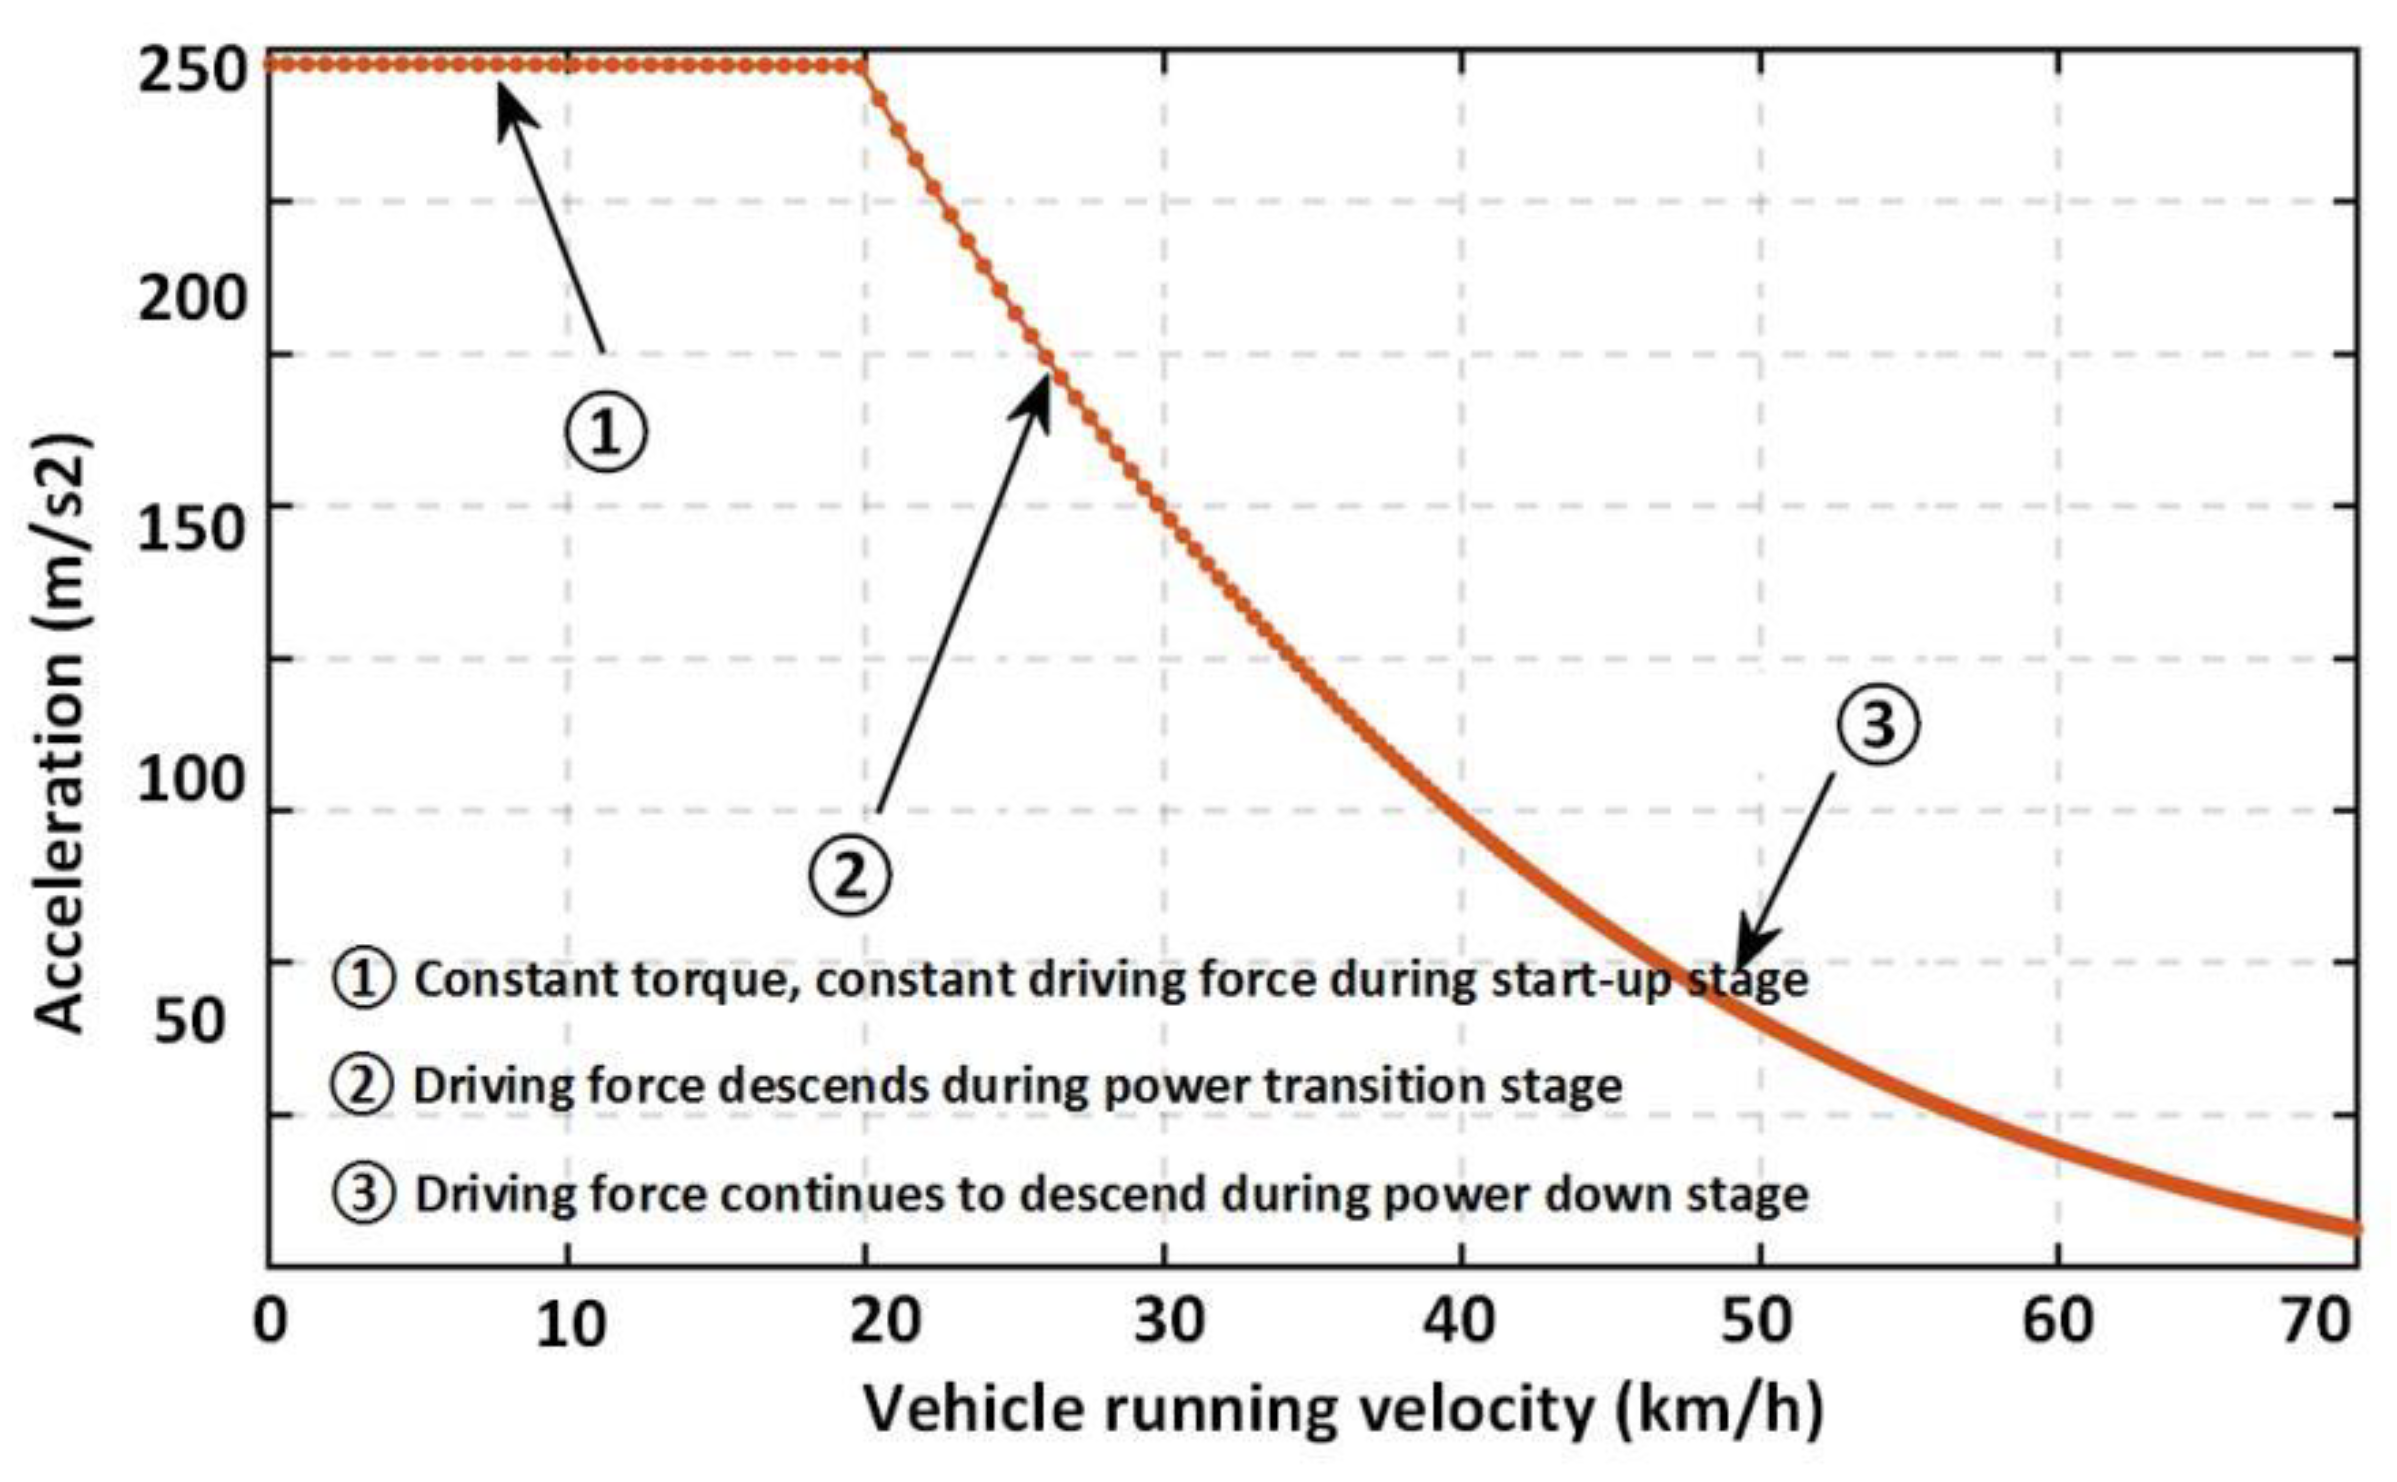
As shown in the simulation results in Figure 11, the driving force is at a constant value during the constant torque starting phase, and it decreases from the power transition phase. The driving resistance always increases. The acceleration resistance decreases slowly during the constant torque starting phase and appears from the power transition phase. The apparent decline is in line with expectations. The acceleration simulation result verification is shown in Figure 12.
It can be seen from Figure 12 that the acceleration decreases slowly during the constant torque starting phase. It decreases significantly during the power transition phase and the power drop phase, which is consistent with the simulation analysis results of the acceleration resistance.
The power system model has not been integrated yet. The simulation of the power system control model needs to take the input and output parameters of the power system dynamic load model and the electrochemical mechanism model of the hydrogen fuel cell as the control object. According to the simulation results of these two models, the relationship between their respective input and output parameters is fitted through the Fourier fitting method. The fitting result of the dynamic load model of the power system (Formula (15)) and the fitting result of the HFC electrochemical mechanism model (Formula (16)) are obtained:
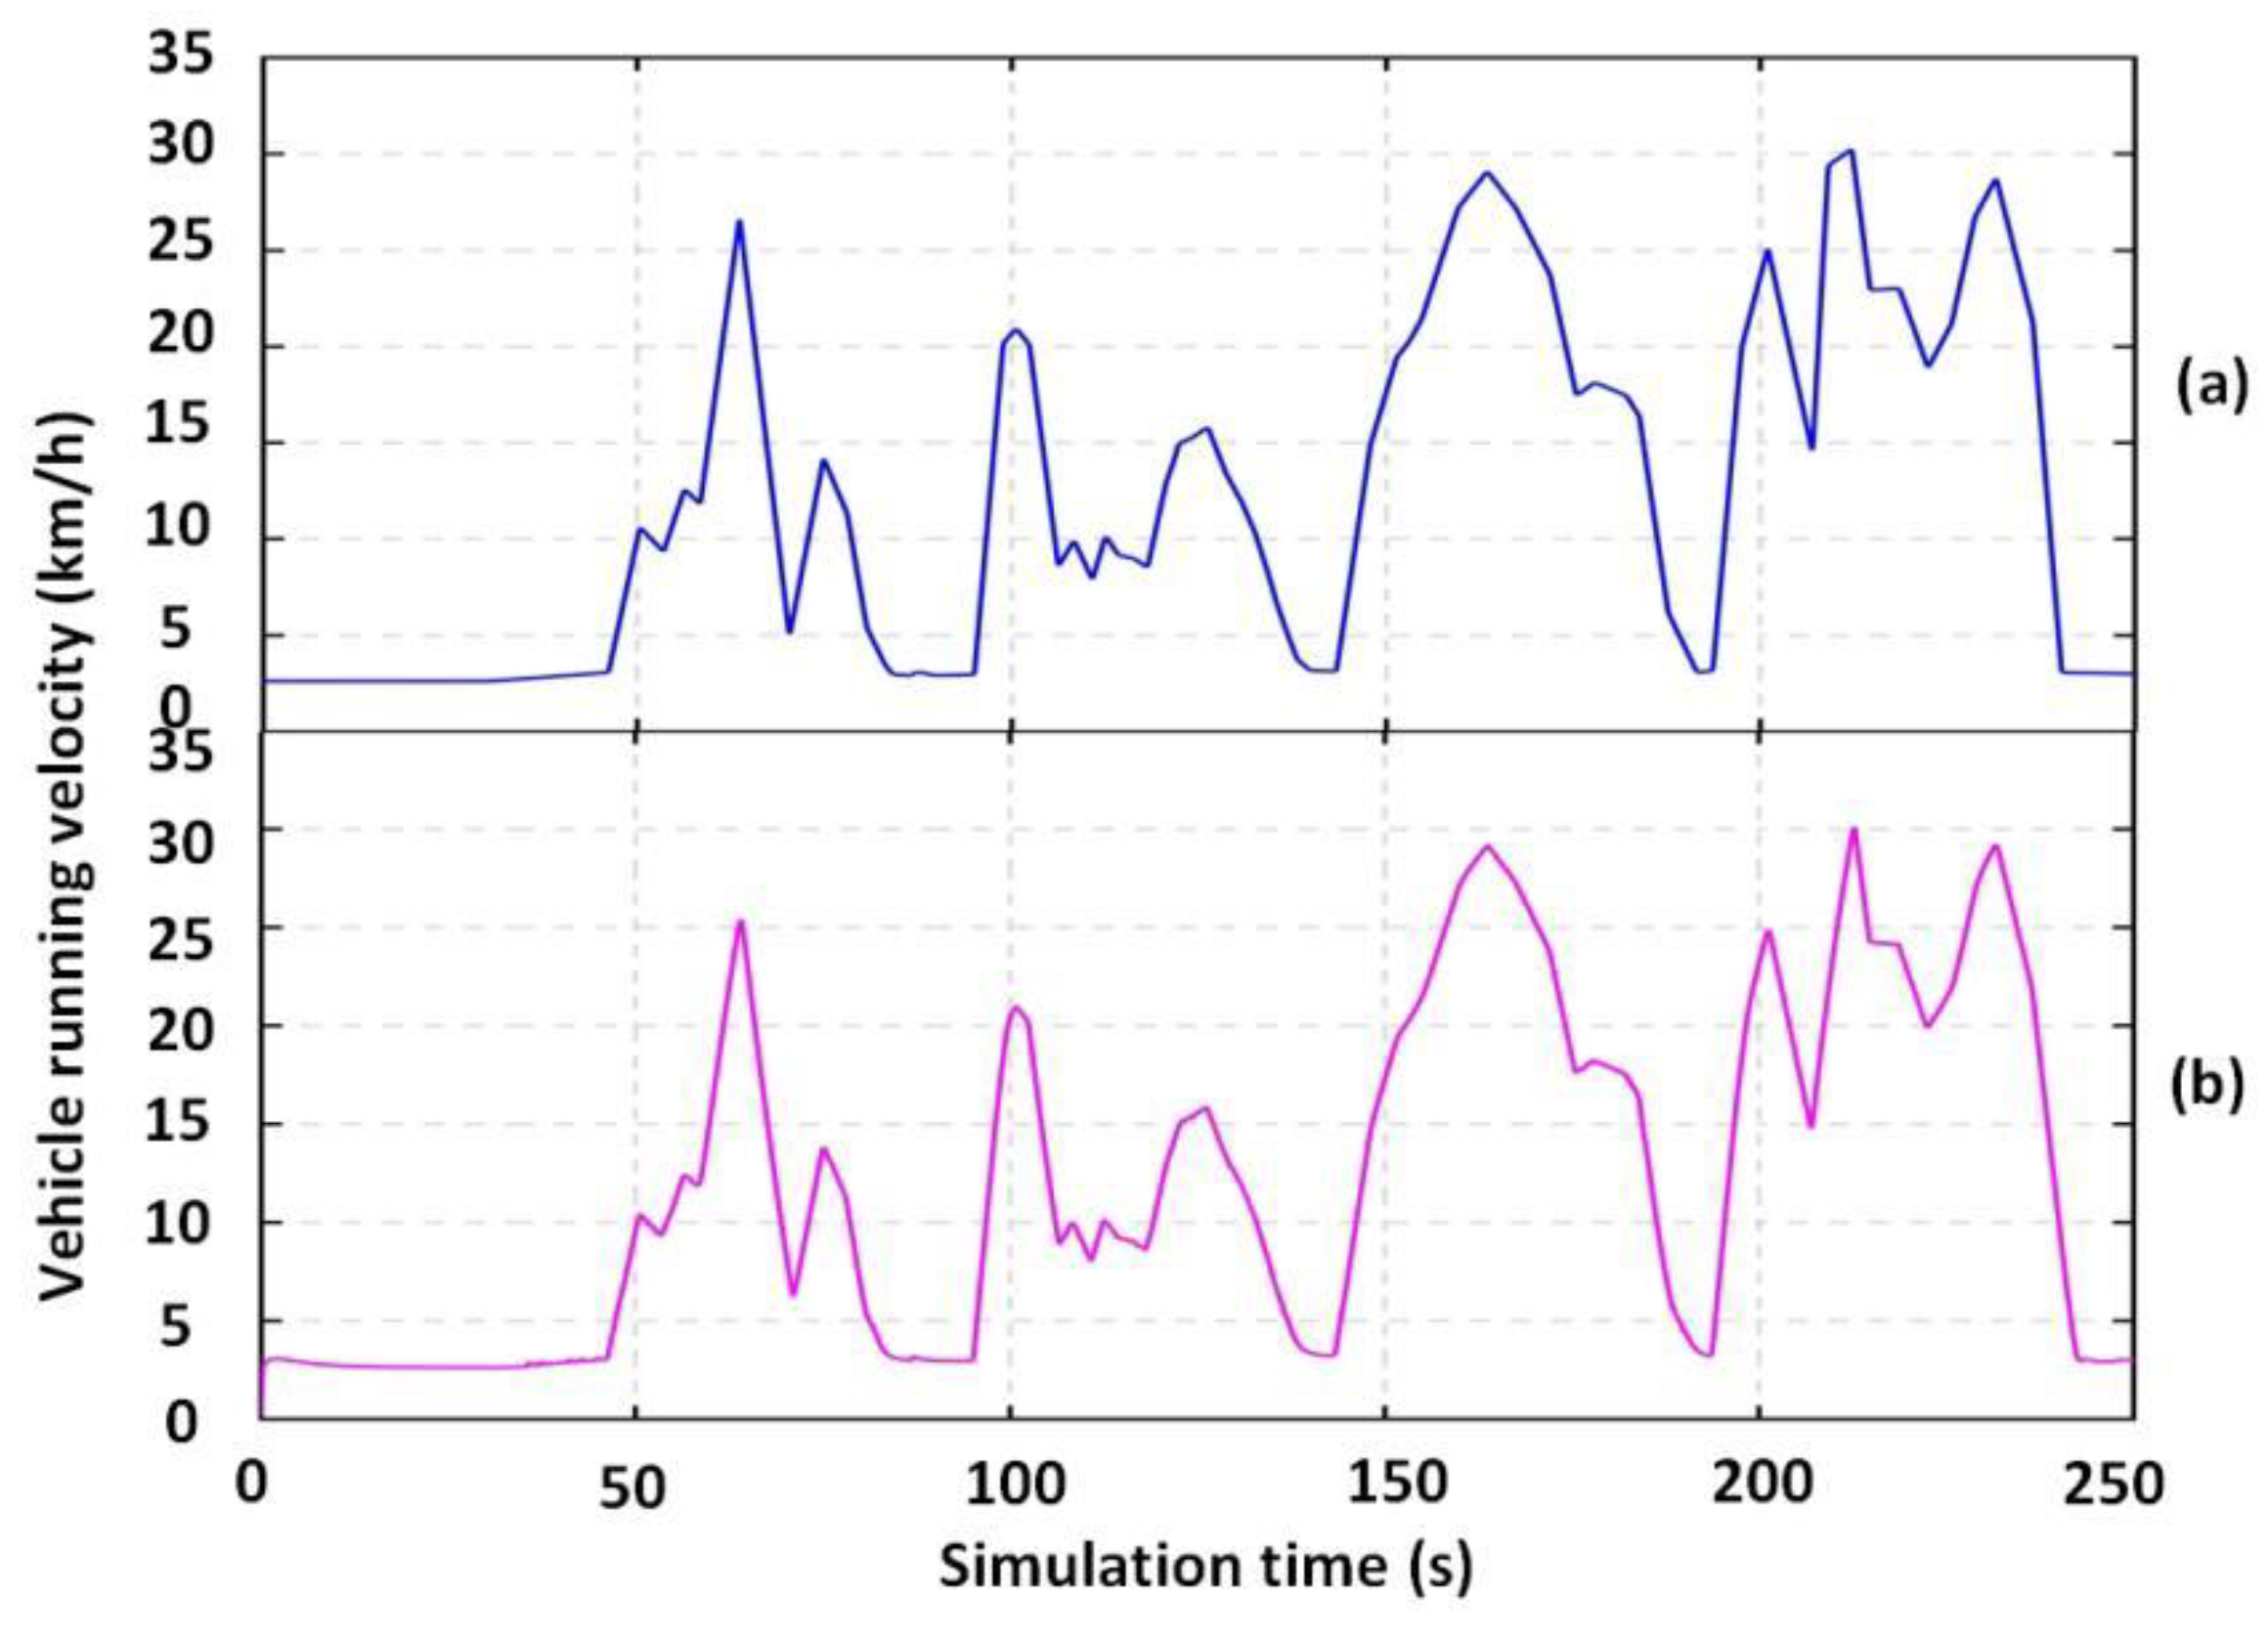
According to the function of the improved fuzzy adaptive PID control algorithm, the simulation conditions of the power system control model is designed to fit the functions and They represent the dynamic load model of the power system and the HFC electrochemical mechanism model, respectively. The control simulation is carried out with the power system control model. The velocity change curves of both actual working conditions and the algorithm proposed in this paper are shown in Figure 13.
The comparison of the velocity curves in Figure 13 illustrates that the vehicle’s running velocity in the simulation results is in good agreement with the expected velocity, which proves that the improved fuzzy adaptive PID control algorithm proposed in this paper can meet the velocity control requirements of HFC vehicles under complex working conditions. Furthermore, the simulation results of the HFC vehicle acceleration, the HFC vehicle output power, and the power cell output power are shown in Figure 14.
It can be seen from Figure 14a that the acceleration of HFC vehicles varies from -1 m/s2 to 1.2 m/s2 except for the start-up phase. When the velocity demand drops sharply, braking measures can be taken in time. In addition, the results in Figure 14b,c shown that when there is a large variable load condition in the vicinity of 60 s, 100 s, 160 s, and 210 s, the output power of the power cell increases rapidly if it accelerates, and the power battery first reduces the output power or changes to the state of charge to reduce the HFC output variable load burden. When there is a small range of fluctuations in the vicinity of 110 s, the power cell is given priority to adjust to avoid unnecessary output power fluctuations of the HFC, and the coordinated power supply between the power cell and the HFC is realized.
6. Conclusions and Future Work
As a clean energy vehicle, the related technologies of HFC vehicle need to be further studied. In this paper, we focus on the study of the HFC vehicle dynamic system control method, and the following achievements are made.
According to the electrochemical logic relationship between the voltage output model and back pressure regulation model of the HFC, the electrochemical mechanism model is integrated. Meanwhile, by integrating the road resistance model, the air resistance model, and the acceleration resistance model, the vehicle power system dynamic load model is established. Based on the power system modeling of the HFC vehicle, the improved fuzzy adaptive PID control algorithm is proposed, including three parts: the eccentric fuzzy rule module, the accelerating braking module, and the power distribution module. Both the electrochemical model and the dynamic load model are verified by comparing the simulation results using the models and the experiment results. In addition, through the simulation of the power system model, the control effect of the proposed control algorithm is verified in the aspects of speed control, acceleration, and braking control of the HFC vehicle. The results show that it has a good control effect in all stages of the HFC vehicle’s operation.
The HFC vehicle dynamic system is an extremely complex system, not only containing the aforementioned modeling modular, but also other auxiliary devices. The modeling of these auxiliary devices can help to reflect the complete functional characteristics of the HFC vehicle dynamic system, which should be further studied in the future.
Author Contributions
Conceptualization, Z.W., G.Y. and S.Z.; methodology, Z.W. and G.Y.; software, S.Z.; validation, G.Y. and Z.W.; investigation, S.Z.; resources, G.Y.; data curation, Z.W.; writing—original draft preparation, Z.W.; writing—review and editing, G.Y.; visualization, Z.W. and S.Z.; supervision, G.Y.; project administration, Z.W. and G.Y.; funding acquisition, Z.W. and G.Y. All authors have read and agreed to the published version of the manuscript.
Funding
This work was supported by the National Natural Science Foundation of China (51905476), the Key Research and Development Program of Zhejiang Province (2020C0409).
Institutional Review Board Statement
Not applicable.
Informed Consent Statement
Not applicable.
Data Availability Statement
The data used to support the findings of this study are available from the corresponding author upon request.
Conflicts of Interest
The authors declare no conflict of interest.
References
- Pietra, A.; Gianni, M.; Zuliani, N.; Malabotti, S.; Taccani, R. Experimental Characterization of an Alkaline Electrolyser and a Compression System for Hydrogen Production and Storage. Energies 2021, 14, 5347. [Google Scholar] [CrossRef]
- Zhou, J.; Wu, Y.; Dong, H.; Tao, Y.; Xu, C. Proposal and Comprehensive Analysis of Gas-wind-photovoltaic-hydrogen Integrated Energy System Considering Multi-participant Interest Preference. J. Clean. Prod. 2020, 265, 121679. [Google Scholar] [CrossRef]
- Szałek, A.; Pielecha, I.; Cieslik, W. Fuel Cell Electric Vehicle (FCEV) Energy Flow Analysis in Real Driving Conditions (RDC). Energies 2021, 14, 5018. [Google Scholar] [CrossRef]
- Liu, Y.; Liu, J.; Qin, D.; Li, G.; Zhang, Y. Online Energy Management Strategy of Fuel Cell Hybrid Electric Vehicles Based on Rule Learning. J. Clean. Prod. 2020, 260, 121017. [Google Scholar] [CrossRef]
- Jouin, M.; Gouriveau, R.; Hissel, D.; Péra, M.C.; Zerhouni, N. Prognostics and Health Management of PEMFC—State of the Art and Remaining Challenges. Int. J. Hydrogen Energy 2013, 38, 15307–15317. [Google Scholar] [CrossRef] [Green Version]
- Benitez, A.; Wulf, C.; Palmenaer, A.; Lengersdorf, M.; Röding, T.; Grube, T.; Robinius, M.; Stolten, D.; Kuckshinrichs, W. EcoLogical Assessment of Fuel Cell Electric Vehicles with Special Focus on Type IV Carbon Fiber Hydrogen Tank. J. Clean. Prod. 2021, 278, 123277. [Google Scholar] [CrossRef]
- Wu, W.; Pai, C.T.; Viswanathan, K.; Chang, J.S. Comparative Life Cycle Assessment and Economic Analysis of Methanol/hydrogen Production Processes for Fuel Cell Vehicles. J. Clean. Prod. 2021, 300, 126959. [Google Scholar] [CrossRef]
- Li, Y.X.; Wei, Z.D.; Zhao, Q.L.; Ding, W.; Zhang, Q.; Chen, S.G. Preparation of Pt/Graphene Catalyst and Its Catalytic Performance for Oxygen Reduction. ACTA Phys.-Chim. Sin. 2011, 27, 858–862. [Google Scholar]
- Song, B.Y.; Li, M.J.; Yang, Y.W.; He, Y.L. Achievement of a Novel Porous Non-noble-metal Catalyst with Excellent Oxygen Reduction Reaction Activity: Promoting the Commercialization of Alkaline Fuel Cells. J. Clean. Prod. 2019, 249, 119314. [Google Scholar] [CrossRef]
- Sutharssan, T.; Montalvao, D.; Chen, Y.K.; Wang, W.C.; Pisac, C.; Elemara, H. A Review on Prognostics and Health Monitoring of Proton Exchange Membrane Fuel Cell. Renew. Sustain. Energy Rev. 2017, 75, 440–450. [Google Scholar] [CrossRef] [Green Version]
- Acikkalp, E.; Ahmadi, M.H. Parametric Investigation of Phosphoric Acid Fuel Cell-Thermally Regenerative Electro Chemical Hybrid System. J. Clean. Prod. 2018, 203, 585–600. [Google Scholar] [CrossRef]
- Sharma, S.; Pollet, B.G. Support Materials for PEMFC and DMFC Electrocatalysts—A review. J. Power Sources 2012, 208, 96–119. [Google Scholar] [CrossRef]
- Sohani, A.; Naderi, S.; Torabi, F.; Sayyaadi, H.; Akhlaghi, Y.G.; Zhao, X.D.; Talukdar, K.; Said, Z. Application Based Multi-objective Performance Optimization of a Proton Exchange Membrane Fuel Cell. J. Clean. Prod. 2020, 252, 119567. [Google Scholar] [CrossRef]
- Lu, X.; Kanghong, D.; Guo, L.; Wang, P.; Yildizbasi, A. Optimal Estimation of the Proton Exchange Membrane Fuel Cell Model Parameters based on Extended Version of Crow Search Algorithm. J. Clean. Prod. 2020, 272, 122640. [Google Scholar] [CrossRef]
- Aouzellag, H.; Ghedamsi, K.; Aouzellag, D. Energy Management and Fault Tolerant Control Strategies for Fuel Cell/Ultra-capacitor Hybrid Electric Vehicles to Enhance Autonomy, Efficiency and Life Time of the Fuel Cell System. Int. J. Hydrogen Energy 2015, 40, 7204–7213. [Google Scholar] [CrossRef]
- Calvin, D.S.; Michael, A.; Ahmad, E.; Emmanuel, S. Thermal Characteristics of an Air-cooled Open-cathode Proton Exchange Membrane Fuel Cell Stack via Numerical Investigation. Int. J. Hydrogen Energy 2020, 44, 11597–11613. [Google Scholar]
- Ritzberger, D.; Hametner, C.; Jakubek, S. A Real-Time Dynamic Fuel Cell System Simulation for Model-Based Diagnostics and Control: Validation on Real Driving Data. Energies 2020, 13, 3148. [Google Scholar] [CrossRef]
- Lin, X.; Li, X.A.; Shen, Y.A.; Li, H.C. Charge Depleting Range Dynamic Strategy with Power Feedback Considering Fuel-cell Degradation. Appl. Math. Model. 2020, 80, 345–365. [Google Scholar] [CrossRef]
- Chen, K.; Laghrouche, S.; Djerdir, A. Performance Analysis of PEM Fuel Cell in Mobile Application Under Real Traffic and Environmental Conditions. Energy Convers. Manag. 2021, 227, 113602. [Google Scholar] [CrossRef]
- Mokrani, Z.; Rekioua, D.; Rekioua, T. Modeling, Control and Power Management of Hybrid Photovoltaic Fuel Cells with Battery Bank Supplying Electric Vehicle. Int. J. Hydrogen Energy 2014, 39, 15178–15187. [Google Scholar] [CrossRef]
- Abdin, Z.; Webb, C.J.; Gray, E.M. PEM Fuel Cell Model and Simulation in Matlab-Simulink Based on Physical Parameters. Energy. 2016, 116, 1131–1144. [Google Scholar] [CrossRef]
- Chen, K.; Laghrouche, S.; Djerdir, A. Degradation Model of Proton Exchange Membrane Fuel Cell Based on a Novel Hybrid Method. Appl. Energy 2019, 252, 113439. [Google Scholar] [CrossRef]
- Abdollahzadeh, A.M.; Pascoa, J.; Ranjbar, A.A.; Esmaili, C.Q. Analysis of PEM (Polymer Electrolyte Membrane) Fuel Cell Cathode Two-dimensional Modeling. Energy 2014, 68, 478–494. [Google Scholar] [CrossRef]
- Fan, L.; Zhang, G.; Jiao, K. Characteristics of PEMFC Operating at High Current Density with Low External Humidification. Energy Convers. Manag. 2017, 150, 763–774. [Google Scholar] [CrossRef]
- Hames, Y.; Kaya, K.; Baltacioglu, E.; Turksoy, A. Analysis of the Control Strategies for Fuel Saving in the Hydrogen Fuel Cell Vehicles. Int. J. Hydrogen Energy 2018, 43, 10810–10821. [Google Scholar] [CrossRef]
- Hwang, J.J.; Hu, J.S.; Lin, C.H. Design of a Range Extension Strategy for Power Decentralized Fuel Cell/Battery Electric Vehicles. Int. J. Hydrogen Energy 2015, 40, 11704–11712. [Google Scholar] [CrossRef]
- Song, K.; Li, F.; Hu, X.; He, L.; Niu, W.; Lu, S.; Zhang, T. Multi-mode Energy Management Strategy for Fuel Cell Electric Vehicles Based on Driving Pattern Identification Using Learning Vector Quantization Neural Network Algorithm. J. Power Sources 2018, 389, 230–239. [Google Scholar] [CrossRef]
- Deng, C.; Xie, S.Q.; Wu, J.; Shao, X.Y. Position Error Compensation of Semi-closed Loop Servo System Using Support Vector Regression and Fuzzy PID Control. Int. J. Adv. Manuf. Technol. 2014, 71, 887–898. [Google Scholar] [CrossRef]
- Zhang, H.Y.; Li, L.; Zhao, J.B.; Zhao, J.C.; Liu, S.J.; Wu, J.J. Design and Implementation of Hybrid Force/position Control for Robot Automation Grinding Aviation Blade Based on Fuzzy PID. Int. J. Adv. Manuf. Technol. 2020, 107, 1741–1754. [Google Scholar] [CrossRef]
- Llano, J.; Eriksson, L.A. First Principles Electrochemistry: Electrons and Protons Reacting as Independent Ions. J. Chem. Phys. 2002, 117, 10193–10206. [Google Scholar] [CrossRef]
- Chavan, S.L.; Talange, D.B. Modeling and Performance Evaluation of PEM Fuel Cell by Controlling Its Input Parameters. Energy 2017, 138, 437–445. [Google Scholar] [CrossRef]
- Sandu, C. Vehicle Dynamics: Theory and Applications. J. Guid. Control. Dynam. 2010, 33, 287–288. [Google Scholar] [CrossRef]
Figure 1.
Fuzzy value distribution of E (a) and EC (b).

Figure 2.
Fuzzy value distribution of Kp (a), KI (b), KD (c).

Figure 3.
Three-dimensional relationship diagram of the control parameter Kp.

Figure 4.
Three-dimensional relationship diagram of the control parameter KI.

Figure 5.
Three-dimensional relationship diagram of the control parameter KD.

Figure 6.
Improved fuzzy adaptive PID control algorithm control flow.

Figure 7.
Electrochemical Nernst electromotive force and activation polarization overvoltage change with current.
Figure 7.
Electrochemical Nernst electromotive force and activation polarization overvoltage change with current.

Figure 8.
Concentration polarization overvoltage and ohmic polarization overvoltage change with current.
Figure 8.
Concentration polarization overvoltage and ohmic polarization overvoltage change with current.

Figure 9.
Comparison of simulation data and measured data of HFC electrochemical mechanism model.

Figure 10.
HFC vehicle power system driving power-resistance power balance diagram.

Figure 11.
HFC vehicle power system driving force-resistance balance diagram.

Figure 12.
HFC vehicle acceleration varies with velocity curve.

Figure 13.
The velocity change curves of both actual working conditions (a) and the algorithm proposed in this paper (b).
Figure 13.
The velocity change curves of both actual working conditions (a) and the algorithm proposed in this paper (b).

Figure 14.
The simulation results of the HFC vehicle acceleration (a), the HFC vehicle output power (b), and the power cell output power (c).
Figure 14.
The simulation results of the HFC vehicle acceleration (a), the HFC vehicle output power (b), and the power cell output power (c).


Table 1.
Fuzzy rule table of control parameter .
| EC | ||||||||
|---|---|---|---|---|---|---|---|---|
| CS | CM | CN | CZ | CP | CB | CL | ||
| E | ES | PL | PL | PL | PB | PB | PP | PN |
| EM | PL | PL | PL | PB | PB | PP | PM | |
| EN | PL | PB | PB | PZ | PP | PZ | PS | |
| EZ | PB | PP | PP | PN | PZ | PN | PN | |
| EP | PP | PZ | PZ | PN | PN | PZ | PP | |
| EB | PZ | PZ | PN | PZ | PP | PB | PB | |
| EL | PZ | PN | PN | PP | PB | PL | PL | |
Table 2.
Fuzzy rule table of control parameter .
| KI | EC | |||||||
|---|---|---|---|---|---|---|---|---|
| CS | CM | CN | CZ | CP | CB | CL | ||
| E | ES | IL | IB | IP | IN | IN | IM | IS |
| EM | IP | IZ | IZ | IN | IN | IZ | IZ | |
| EN | IZ | IN | IN | IZ | IZ | IP | IP | |
| EZ | IN | IN | IZ | IZ | IP | IP | IB | |
| EP | IN | IZ | IZ | IP | IP | IB | IB | |
| EB | IZ | IZ | IP | IB | IB | IB | IL | |
| EL | IZ | IZ | IB | IB | IL | IL | IL | |
Table 3.
Fuzzy rule table of control parameter .
| KD | EC | |||||||
|---|---|---|---|---|---|---|---|---|
| CS | CM | CN | CZ | CP | CB | CL | ||
| E | ES | DL | DB | DZ | DN | DM | DM | DM |
| EM | DB | DP | DN | DM | DN | DM | DS | |
| EN | DP | DZ | DZ | DN | DN | DN | DM | |
| EZ | DZ | DZ | DZ | DZ | DZ | DZ | DZ | |
| EP | DZ | DP | DP | DP | DZ | DP | DB | |
| EB | DZ | DP | DP | DB | DP | DP | DL | |
| EL | DZ | DP | DB | DL | DP | DB | DL | |
Table 4.
HFC voltage-output characteristics test condition parameters.
| Parameters | Values |
|---|---|
| 1.2 bar | |
| 1.3 bar | |
| 323.15 K | |
| 333.15 K | |
| 348.15 K | |
| 0% | |
| 65% | |
| 1.5 | |
| 2.5 |
Table 5.
HFC output voltage test data.
| Load Current (A) | Output Voltage (V) | Load Current (A) | Output Voltage (V) |
|---|---|---|---|
| 0 | 0.971 | 180 | 0.688 |
| 10 | 0.849 | 190 | 0.683 |
| 20 | 0.815 | 200 | 0.678 |
| 28 | 0.798 | 210 | 0.673 |
| 38 | 0.792 | 220 | 0.668 |
| 48 | 0.784 | 228 | 0.664 |
| 58 | 0.773 | 238 | 0.661 |
| 66 | 0.764 | 248 | 0.659 |
| 76 | 0.756 | 258 | 0.655 |
| 86 | 0.748 | 266 | 0.649 |
| 96 | 0.740 | 276 | 0.644 |
| 104 | 0.733 | 286 | 0.638 |
| 114 | 0.726 | 296 | 0.634 |
| 124 | 0.721 | 304 | 0.629 |
| 134 | 0.715 | 314 | 0.624 |
| 142 | 0.709 | 324 | 0.619 |
| 152 | 0.704 | 334 | 0.614 |
| 162 | 0.698 | 342 | 0.609 |
| 172 | 0.693 |
Table 6.
The error between the simulated data and the actual data.
| Loading Current (A) | Error (V) | Loading Current (A) | Error (V) |
|---|---|---|---|
| 0 | 0.0021 | 180 | 0.0097 |
| 10 | 0.0103 | 190 | 0.0102 |
| 20 | −0.0029 | 200 | 0.0107 |
| 28 | −0.0048 | 210 | 0.0112 |
| 38 | −0.0130 | 220 | 0.0115 |
| 48 | −0.0149 | 228 | 0.0118 |
| 58 | −0.0123 | 238 | 0.0100 |
| 66 | −0.0095 | 248 | 0.0072 |
| 76 | −0.0091 | 258 | 0.0063 |
| 86 | −0.0086 | 266 | 0.0082 |
| 96 | −0.0061 | 276 | 0.0080 |
| 104 | −0.0025 | 286 | 0.0086 |
| 114 | 0.0003 | 296 | 0.0069 |
| 124 | 0.0010 | 304 | 0.0071 |
| 134 | 0.0027 | 314 | 0.0057 |
| 142 | 0.0053 | 324 | 0.0036 |
| 152 | 0.0060 | 334 | 0.0003 |
| 162 | 0.0076 | 342 | −0.0029 |
| 172 | 0.0082 |
Table 7.
Parameters of the HFC vehicle and its power system in the dynamic system load model.
| Parameter Name | Symbol | Value |
|---|---|---|
| Total vehicle mass | m | 17,200 kg |
| Wheel rolling radius | rs | 0.495 m |
| Windward area | A | 6.48 m2 |
| Air resistance coefficient | CD | 0.7 |
| Final drive ratio | i0 | 5.8 |
| Transmission efficiency | ηT | 0.93 |
Publisher’s Note: MDPI stays neutral with regard to jurisdictional claims in published maps and institutional affiliations. |
© 2021 by the authors. Licensee MDPI, Basel, Switzerland. This article is an open access article distributed under the terms and conditions of the Creative Commons Attribution (CC BY) license (https://creativecommons.org/licenses/by/4.0/).
Share and Cite
MDPI and ACS Style
Wang, Z.; Yi, G.; Zhang, S. An Improved Fuzzy PID Control Method Considering Hydrogen Fuel Cell Voltage-Output Characteristics for a Hydrogen Vehicle Power System. Energies 2021, 14, 6140. https://doi.org/10.3390/en14196140
AMA Style
Wang Z, Yi G, Zhang S. An Improved Fuzzy PID Control Method Considering Hydrogen Fuel Cell Voltage-Output Characteristics for a Hydrogen Vehicle Power System. Energies. 2021; 14(19):6140. https://doi.org/10.3390/en14196140
Chicago/Turabian StyleWang, Zili, Guodong Yi, and Shaoju Zhang. 2021. "An Improved Fuzzy PID Control Method Considering Hydrogen Fuel Cell Voltage-Output Characteristics for a Hydrogen Vehicle Power System" Energies 14, no. 19: 6140. https://doi.org/10.3390/en14196140
Note that from the first issue of 2016, this journal uses article numbers instead of page numbers. See further details here.