
The Ukrainian Economy Transformation into the Circular Based on Fuzzy-Logic Cluster Analysis


1
Management and International Business Department, Lviv Polytechnic National University, S. Bandera Street 12, 79013 Lviv, Ukraine
2
Faculty of Organization and Management, Silesian University of Technology, 26 Roosevelta Street, 41-800 Zabrze, Poland
3
Information Systems and Networks Department, Lviv Polytechnic National University, S. Bandera Street 12, 79013 Lviv, Ukraine
*
Author to whom correspondence should be addressed.
Energies 2021, 14(18), 5951; https://doi.org/10.3390/en14185951
Submission received: 15 July 2021
/
Revised: 30 August 2021
/
Accepted: 10 September 2021
/
Published: 18 September 2021
(This article belongs to the Special Issue Integrated Approaches for Enterprise Sustainability)
Abstract
:In the era of limited resources and progressive environmental degradation, the circular economy is a practical application of sustainable development. It is an alternative, but also competitive way to achieve economic growth in accordance with the principles of sustainable development. This issue was considered in this paper in the context of the Ukrainian economy. The Ukrainian economy’s transformation into a circular one needs to find ways to choose practical tools for such a transition, considering the destructive impact of economic activities on the environment, population, and economy. The goal was to develop a method of choosing tools for the circular transformations of economic activities for each cluster and to reduce man-made damage to the environment. Cluster analysis, fuzzy C-means method, and grouping of economic activities were used. Two analyzed sectors turned out to be the most interesting: mining and quarrying, and electricity, gas, steam, and air conditioning supply, which were finally assigned to the cluster with a high level of destructive impact, defined as ‘environmentally unfriendly’. The proposed method allows the choice of circular transformation tools for economic activities depending on the destructive impact of these economic activities within each cluster.
1. Introduction
The problem of effective management of the national economy requires a solution to issues of logically managing nature use, a search for effective nature protection measures, and methods to determine their economic efficiency at the level of economic activity. The solution to these problems involves forming a favorable environment for transforming production under a “green” economy to a circular type. A critical aspect in this context is the search for new systems of state regulation of economic activity (EA) at the national level. Today, the economy of Ukraine does not have an integrated financial mechanism that would allow the development of a new high-tech EA with low-waste and nonwaste production. The lack of a methodology for transforming the national economy of Ukraine into a circular economy is also visible. However, under the influence of European integration, the development of the Ukrainian economy began to shift to the principles of the new natural economy.
The benefits of European integration were discussed in [1] at the investment and institutional levels. Attention is also paid to the changing priorities of Ukraine’s economic development due to European integration processes [2]. Many works are devoted to the general principles of sustainable development and environmental policy [3,4,5], but the trends and realities of Ukraine in building sustainable development are also analyzed [6]. Effective management decisions are indicated as a condition for achieving sustainable development [7,8,9,10].
An alternative but competitive way to achieve economic growth according to sustainable development principles in the era of limited resources and progressive environmental degradation is the circular economy [11]. An example can be an intelligent waste management system in Indonesia, where sustainable development goals are based on Industry 4.0. [12] or projects implemented in Chinese cities, where resource efficiency was recorded while reducing pollution [10].
On the part of enterprises, the problem is the efficient use of productive assets, the logical supply of resources, and the profit from business activities. On the part of the state and society, the need to form a circular economy determines the need for economic assessment of man-made (technogenic) damage, losses, and costs in quantitative and monetary values, which enterprises cause due to their business activities. The original system of economic assessment of losses in the economic sectors and a modern state regulation mechanism built based on the study of man-made damage caused by the production of goods and services in the environment can be found in [13,14,15]. In particular, models of the economic assessment of the technogenic damage caused to the Ukrainian national economy are presented [13]. Morally obsolete production technologies cause a high level of environmental pollution. In addition, emergency damage or destruction of fixed assets leads to a decline in the profitability of the workforce and natural resources. It leads to negative trends in the growth of manufactured influence on the environment, society, and economy, as evidenced by man-made damage, losses, and costs, constituting the national economy’s technogenic damage concept. The Ukrainian critical information infrastructure is also investigated [16], as are ore mining and its consequences for national economies [17].
Many works are devoted to overcoming the destructive consequences of man-made load. For example, the impact of innovation in high-tech sectors of the economy on reducing social and economic challenges, among which high consumption of natural resources plays a significant role, was proved [18,19,20,21,22,23]. The long-term link between the ecological footprint, natural resources, technological innovation, and economic growth is highlighted [24,25]. The impact of innovation on structural changes in the economy was also studied [26]. As shown by foreign and Ukrainian experiences, the integration of economic entities is becoming an indispensable tool for stimulating the engagement of enterprises with innovations, and the creation of industrial clusters is one of the current trends of economic transformation [27]. Eco-innovations and their contribution to the development of the environmental economy are also investigated, where attention is paid to the specific role of regulatory instruments [28]. In the case of Ukraine, the problem of creating a financial mechanism for the implementation of ecological innovations of the fourth industrial revolution is being solved, both at the level of the general economic system [29] and the level of development of agricultural enterprises [30].
Attention is also paid to the ecological and socioeconomic aspects of management that arise in the course of human life and activity [31,32]. Unfortunately, many of the actions prove the ineffectiveness of the adopted policy. An example is the Chinese fight against air pollution [33] or the ecological and economic greening management system in Ukraine, where negative trends are also observed [34]. On the other hand, energy innovations are indicated as one of the critical determinants of economic and environmental development. Examples of successful innovations are biomass energy in Asia [35], clean energy production in the United States [36], and proposals for solutions to energy infrastructure problems in Ukraine [37].
One of the barriers to the implementation of sustainable developmental standards is the lack of awareness and understanding of the concept of sustainable development [38]. Moreover, to facilitate and accelerate this process, investment support for environmental changes [39] and sound green transition principles from ordinary business to genuinely sustainable business development are essential. Firms should solve sustainability problems, even if more economically attractive but unsustainable alternatives are available [40]. The implementation of the concept of sustainable development requires social, ecological, and economic cooperation, as well as the introduction of strategic action programs and mechanisms of their performance [41]. Environmental integration is necessary, and integrative nature management can accelerate economic transformation while ensuring optimal resource use to ensure a better quality of the environment [42].
The development of green energy may contribute to this process, which is visible in many studies on the development of a green economy [43,44,45]. Effective green investment is indicated as a priority factor shaping the direction of sustainable development [46]. Moreover, in a broader context, the ecological modernization of regions is considered a critical factor in changing socioeconomic standards [47]. This statement is confirmed by studies of the socioeconomic potential of Polish cities [48] and Spanish cities [49], as well as studies in terms of the so-called geosocial network [50]. The literature also emphasizes the importance of considering natural hazards in the assessment of socioeconomic potential [51]. Ways of impacting investment support on industrial sectors and their entities are also investigated, taking into account environmental financing [52,53].
A comprehensive analysis of economic activity (EA) aimed at transforming state economies into a circular economy is, therefore, a very complex problem and requires modern economic and mathematical methods [54]. Some authors analyze economic development based on the technique of taxonomy [55]. Considering the specifics of the dataset on natural resources and waste allowed, for example, the use of economic simulation methods to predict the development of agriculture in Ukraine [56]. In recent decades, cluster analysis was widely used in the public administration system [57,58,59] and it reached peak popularity in state regulation with the advent of fuzzy sets and fuzzy clustering methods [60,61,62].
In this article, we focus on making circular economy management decisions. Such decisions and their scientific justification require the analysis of large amounts of information and the construction of complex (dynamic) economic and mathematical models, and the study of quantitative and qualitative quantities. Although it is generally accepted that more reliable and effective results are obtained when working with homogeneous data groups, it is not easy to achieve this at the national economy level. Each EA has its differences from others, so in [63,64,65], it was proposed to use the method of fuzzy cluster analysis to build a mechanism for state regulation of man-made losses. It made it possible to obtain the same type of EA groups, which have the same problems by their nature. Moreover, the improvement of the quality of implementation of regulatory measures to prevent technogenic damage, the analysis of which was carried out by fuzzy-logical clustering, was demonstrated [63].
Economic clusters are identified in an attractive, promising form of self-organization of the financial system [66], where solving environmental problems is an essential task at the macro-level of the state and at the meso-level of cities [67,68]. To solve the complex issues of the circular economy in waste disposal management, modern methods of mathematical statistics are used [65,69]. The need to implement the anthropocentric concept of ecology applied by various means to solve environmental problems is indicated [70,71,72,73]. Many researchers [74,75,76,77,78] link the rise and fall of the development economy with the institutional development of environmental economies, the ecological security of critical infrastructure [79,80,81,82], and their institutional transmission [83] to the circular type.
Our goal is to develop a method of choosing tools to transform the EA to a circular type and reduce man-made damage to the environment. Since we deal with a significant set of significant features in the national economy, we use cluster analysis, which allows the selection of tools for the circular transformation of EA depending on the destructive impact of these activities within each cluster. Firstly, to construct clusters, we use the methods of fuzzy cluster analysis logic. Then, in each cluster, we propose a method of a choice of circular transformation tools of EA depending on their destructive influence.
2. Methods
2.1. Cluster Analysis
In shaping a circular economy, there are many input indicators which complicate the effectiveness of the results. Determining homogeneous aggregates gives better results when analyzing one indicator (sometimes integral or complex). In the national economy, we deal with a significant set of essential characteristics, so multidimensional ranking or clustering methods should be used.
Methods of multidimensional ranking are divided into hierarchical and iterative, which allows them to be used in various research fields. Among the examples of successful application of cluster analysis in the study of the national economy to justify management decisions are the works of the following scientists: J. Grabmeyer [84], A. Jane [85], A. Sylvester [86]. The possibilities of cluster analysis were not yet sufficiently used to analyze technogenic losses in the national economy due to EA in Ukraine.
In essence, cluster analysis is a set of mathematical methods aimed at finding similarities in their different elements by characteristics (distance, information, etc.), relationships, properties, etc., to form certain groups (clusters) [84]. The best-known and -used methods of cluster analysis are the following [85,87]:
- K-means;
- Fuzzy clustering (C-means method);
- Graph clustering algorithms;
- Statistical clustering algorithms;
- Algorithms of the FOREL family;
- Hierarchical clustering or taxonomy;
- Kohonen neural network;
- Ensemble of congestion clusters;
- Algorithms of the KRAB family;
- EM-algorithm (expectation-maximization);
- Data dredging (or data fishing, data snooping, data butchery), also known as significance chasing, significance questing, selective inference, and p-hacking.
The main task of cluster analysis is the division of elements into groups. In mathematical terms, cluster analysis is splitting the original sample of objects into subsets called clusters. The cluster consists of similar things, and objects from different clusters must differ significantly. Cluster analysis methods are used primarily when there is uncertainty during the research regarding the number of classes, their composition or structure, etc.
According to A.S. Taraskina in [87], the choice of clustering method should be conducted first between groups of one-dimensional or multidimensional ranking. For example, in complex arrays of input data—between types of algorithms: hierarchical or iterative. Thus, a feature of hierarchical algorithms integrates individual objects, which are considered separate clusters, into larger clusters. Firstly, a pair of the most interconnected clusters are searched for and merged into a new cluster. Then, this procedure is repeated until all the objects merge into one cluster, resulting in a dendrogram. The disadvantage of this hierarchical cluster analysis is the peculiarity of the agglomeration algorithm, which allows processing small data sets due to its high complexity and the complexity of working with large dendrograms, the construction of which at a certain stage of integration should be stopped. Using iterative algorithms, the data set is first divided into several clusters, the number of which is determined by some (initial) conditions. Then, the objects are arranged in clusters so that a specific criterion is (optimized) met (mainly it consists in minimizing the variability in the center of the clusters [85]).
Cluster analysis methods are used primarily when in the research process there is some uncertainty about the number of classes, their composition or structure, etc. This method is successfully used to manage the national economy for research on the spatial concentration of economic activity (EA). There is a whole layer of scientific research in which the results of cluster analysis concerning the spatial concentration of EA allowed to make effective financial decisions in the regional economy [57,58,59]. Practical economic conclusions in the sphere of state regulation regarding the development of nature exploring EA were also formulated using the clustering method [59]. The use of clustering to assess and predict the impact of territories is becoming more and more frequent [61,88]. In a situation where the uncertainty of information borders on its vagueness, fuzzy cluster analysis, called the C-means method, works best [60,85,88]. This method was used to analyze statistical data [61,88], and it allows to obtain the most effective and possible solutions in the face of the uncertainty of information, which borders on its vagueness. As a result of clustering, carried out in [62,63], sets of clusters were obtained, in the middle of which the objects were as similar as possible. However, each cluster differed significantly from the other as a result of the optimization task.
The need to create mechanisms of state regulation of losses caused by human activity, in this article, resulted in an analysis of the development of the economic activity (EA) of the national economy and their impact on the environment, as well as the population of Ukraine based on their clustering by fuzzy C-means. A more thorough analysis of the theoretical foundations and practical application of the method of fuzzy clustering of large arrays of these data is presented in works from various scientific fields [59,61,85,87,88,89]. An essential advantage of the fuzzy C-shells clustering method is the ability to combine elements on the principle of “weaker-stronger”, “worse-medium-better”, and so on [87]. Moreover, for analyzing the national economy’s EA, clustering is a practically necessary procedure.
2.2. Investigation of Membership Measures by the Fuzzy C-Means Method
Based on the justifications given in [59,61,85,87,88,89], fuzzy C-mean clustering was used. It is hypothesized that each object can be to some extent in several groups, and the number of possible groups C is considered in advance.
The database for fuzzy clustering formed a matrix of characteristics of size l × n, the form of which is given in Formula (1):
where l = is the number of researched object, n = is the number of features (characteristics) for each researched object.
The result of such fuzzy clustering is determined by the membership matrix M with dimension c × l (2) [87]:
where mij is a measure of the j-th object membership to the i-th cluster.
The membership matrix M must satisfy the following three conditions [87]:
- (1)
- Each of its elements mij must be in the range from 0 to 1 (mij ϵ [0,1] for i = , j = );
- (2)
- Each object must be distributed among all clusters , j = );
- (3)
- None of the clusters can be empty or contain all elements 0 < < l, i = ).
The quality of a division of objects into clusters is determined by the scatter criterion J according to the Formula (3) [87]:
where d(vi,xj) is the Euclidean distance between the j-th object xj = (xj1, xj2, …, xjn) and the i-th center of the cluster vi = (vi1, vi2, …, vin); w ϵ (1,∞) is an exponential weight, which determines the fuzziness of clusters.
In Refs [59,61,85,87,88,89], the choice of weight w = 2 is justified because for large (w → ∞), the membership matrix will be so blurred that all objects will be equally distributed among all clusters in a wrong solution.
Based on the need to study the man-made losses caused by the development of EA, fuzzy clustering of objects was obtained by finding the membership matrix M = {mij}, the elements of which determine the degree of membership of the j-th EA to the i-th cluster. The matrix of membership measures M, which satisfies the three above conditions and minimizes the scatter criterion J, was found by the fuzzy C-means method as a result of iterative recalculation of both its elements and the coordinates of cluster centers based on Lagrange multipliers (4) and (5) [87]:
where dij = d(vi,xj) for i = , j = . This method allows to find only the local optimum, i.e., for a different number of iterations, there may be different results, so the calculations are continued until the changes in the matrix M are less than the predetermined stop parameter ε (6):
where M* is the matrix obtained in the previous iteration.
||M − M*||2 < ε,
3. Experiments and Results
The source of man-made losses in the national economy of Ukraine is manufacturing, transportation, and provision of certain types of services related to waste collection and storage, electricity, gas, steam and air conditioning supply, etc. The consequences of human economic activity are the loss of nonrenewable natural resources, a significant deterioration in the state of renewable resources, the accumulation of hazardous waste, and, as a consequence, a decrease in the quality of labor resources, including their loss. The problem of optimizing the flow of material, financial, and time resources differs significantly between EA, so it requires the formation of appropriate mechanisms of state regulation. The study on the objective reduction of the man-made impact on the environment and society until its complete elimination is associated with the peculiarities of economic management by the existing structure of the economic activity (EA).
To analyze man-made damage, we used data from statistical studies on the impact of human economic activity on the environment, collected from relevant sources of statistical information [90,91,92]. The composition of the system of indicators listed in Table 1 includes indicators characterizing the EA results (block “economic activity”), indicators of environmental pollution (block “man-made damage”), and paid environmental taxes and fines (block “environmental payments”), as well as capital investment and environmental costs activity (block “environmental protection activities”). Table 1 shows the key indicators of production activity and its impact on the environment in 2020 for only 15 EA, including EA such as “J—Information and communication”, “M—Professional, scientific and technical activities”, “N—Administrative and support service activities”, and “S—Other service activities” are deleted due to zero values of the listed characteristics. In total, the following ten indicators for each research subject were distinguished (Table 1):
- Production of goods and services at actual prices, UAH million.
- Volumes of pollutants emissions, thousands of tons.
- Volumes of carbon dioxide emissions, thousands of tons.
- Volumes of discharges of polluted return waters, million cubic meters.
- Volumes of waste generation, thousand tons.
- Environmental tax, thousand UAH.
- Fines, thousand UAH.
- Capital investments, UAH million.
- Overhaul costs, thousand UAH.
- Current costs of environmental protection activities, thousand UAH.
The objects of research were EA according to the latest National Classifications of Ukraine EA (KVED-2010) [93], which is standardized to NACE rev.2 classification [94] and ISIC Rev. 4 [95]. Based on this, the period for research was one year because, since 2020, all indicators were final and in line with the international classification of economic activity.
Table 1 shows the key indicators of production activity and its impact on the environment in 2020 for only 15 EA, such as: “J—Information and communication”, “M—professional, scientific and technical activities”, “N—Administrative and support service activities”, and “S—Other service activities”, which is excluded because of the zero values of these characteristics. It is a priori means that these EA are included in the cluster with the lowest rates. Thus, the database for fuzzy clustering formed a matrix of characteristics of size l × n, where l = is the number of EA that has a man-made impact on the environment, n = is the number of features (characteristics) for each object of observation.
Based on the need to study the man-made losses caused by the development of EA, fuzzy clustering of objects was obtained by finding the membership matrix M = {mij}, the elements of which determine the degree of membership of the j-th EA to the i-th cluster. Matrices of membership of each EA to a particular cluster were obtained for the stop parameter ε < 0.01, where the number of clusters is set with c = 3 (Table 2). Thus, the membership of each EA is distributed among all clusters, there are no empty clusters, and there are no clusters that contain all EA.
Even though for the first iteration, the matrix of affiliation measures was formed randomly, the result was obtained with high reliability. The stop parameter ε was 0.003, which satisfies the given condition ε < 0.01. EA are distributed among clusters according to the size of the membership grade: the higher the membership grade, the clearer the relationship of a given EA with the respective cluster. In Table 2, when divided into three clusters, high membership measures (mij → 1) have 12 EA. The EA distribution between three clusters by indicators of man-made damage is shown in Table 3.
In the division into three clusters, EA “E—water supply; sewerage, waste management” had the vaguest membership value (respectively 0.36; 0.35; 0.2). On the other hand, sector “E—water supply; sewerage, waste management” can be almost equally included in the two clusters 1 and 2, as the degree of membership differs by 0.01. The next two sectors have blurred measures of membership when they are clustered into three groups. Sector “B—Mining and quarrying” has similar measures of membership to each of the three clusters (0.29; 0.32; 0.39). A similar situation is observed in the sector “D—Electricity, gas, steam, and air conditioning supply”, where the measure of membership in the three clusters is, respectively, 0.28, 0.29, and 0.44.
In addition, we obtained very similar measures of membership in each of the three clusters for “B—Mining and quarrying”, but the transition to another cluster did not occur. It indicates that the structure of economic activity clusters is more stable in the case of division into 3.
4. Discussion
Analyzing the indicators of man-made damage, economic activity, environmental taxes, and costs of environmental protection (Table 1), we can conclude that the largest cluster No.1 is 7 EA, of which 5 EA (F—Construction, I—Accommodation and food service activities, K—Financial and insurance activities, P—Education, Q—Human health and social work activities) with low values of these indicators and 2 EA with zero values of the studied characteristics. The largest cluster No.1 is named ‘environmentally friendly’ as a cluster with a low level of destructive influence and a low-level of man-made loss.
Economic activity “E—water supply; sewerage, waste management” (Table 3) has the lowest measures of membership to cluster 1 (0.36), as some of its indicators as volumes of carbon dioxide emissions, volumes of waste generation, paid the environmental tax, and capital investment in environmental protection activities are average or close to average values (Figure 1).
Clusters 2 and 3 are formed by 4 EA (G—Wholesale and retail trade; repair of motor vehicles and motorcycles, H—Transportation and storage, L—Real estate transactions, O—Public administration and defence; compulsory social insurance) and 3 EA (B—Mining and quarrying, C—Manufacturing, D—Electricity, gas, steam, and air conditioning supply, respectively) with high and medium measures of membership. The rates of technogenic damage for these EA are the highest or higher. The cluster No.2 is named ‘potentially environment-unfriendly’ as a cluster with medium-level destructive influence and high-level man-made loss. The most complex is cluster No.3, which is formed by 3 EA (B, C, D) with fuzzy measures of membership, respectively 0.39, 0.91, and 0.44. This cluster as a cluster with the highest level of destructive impact and a higher level of human-caused losses is called “environmentally unfriendly”.
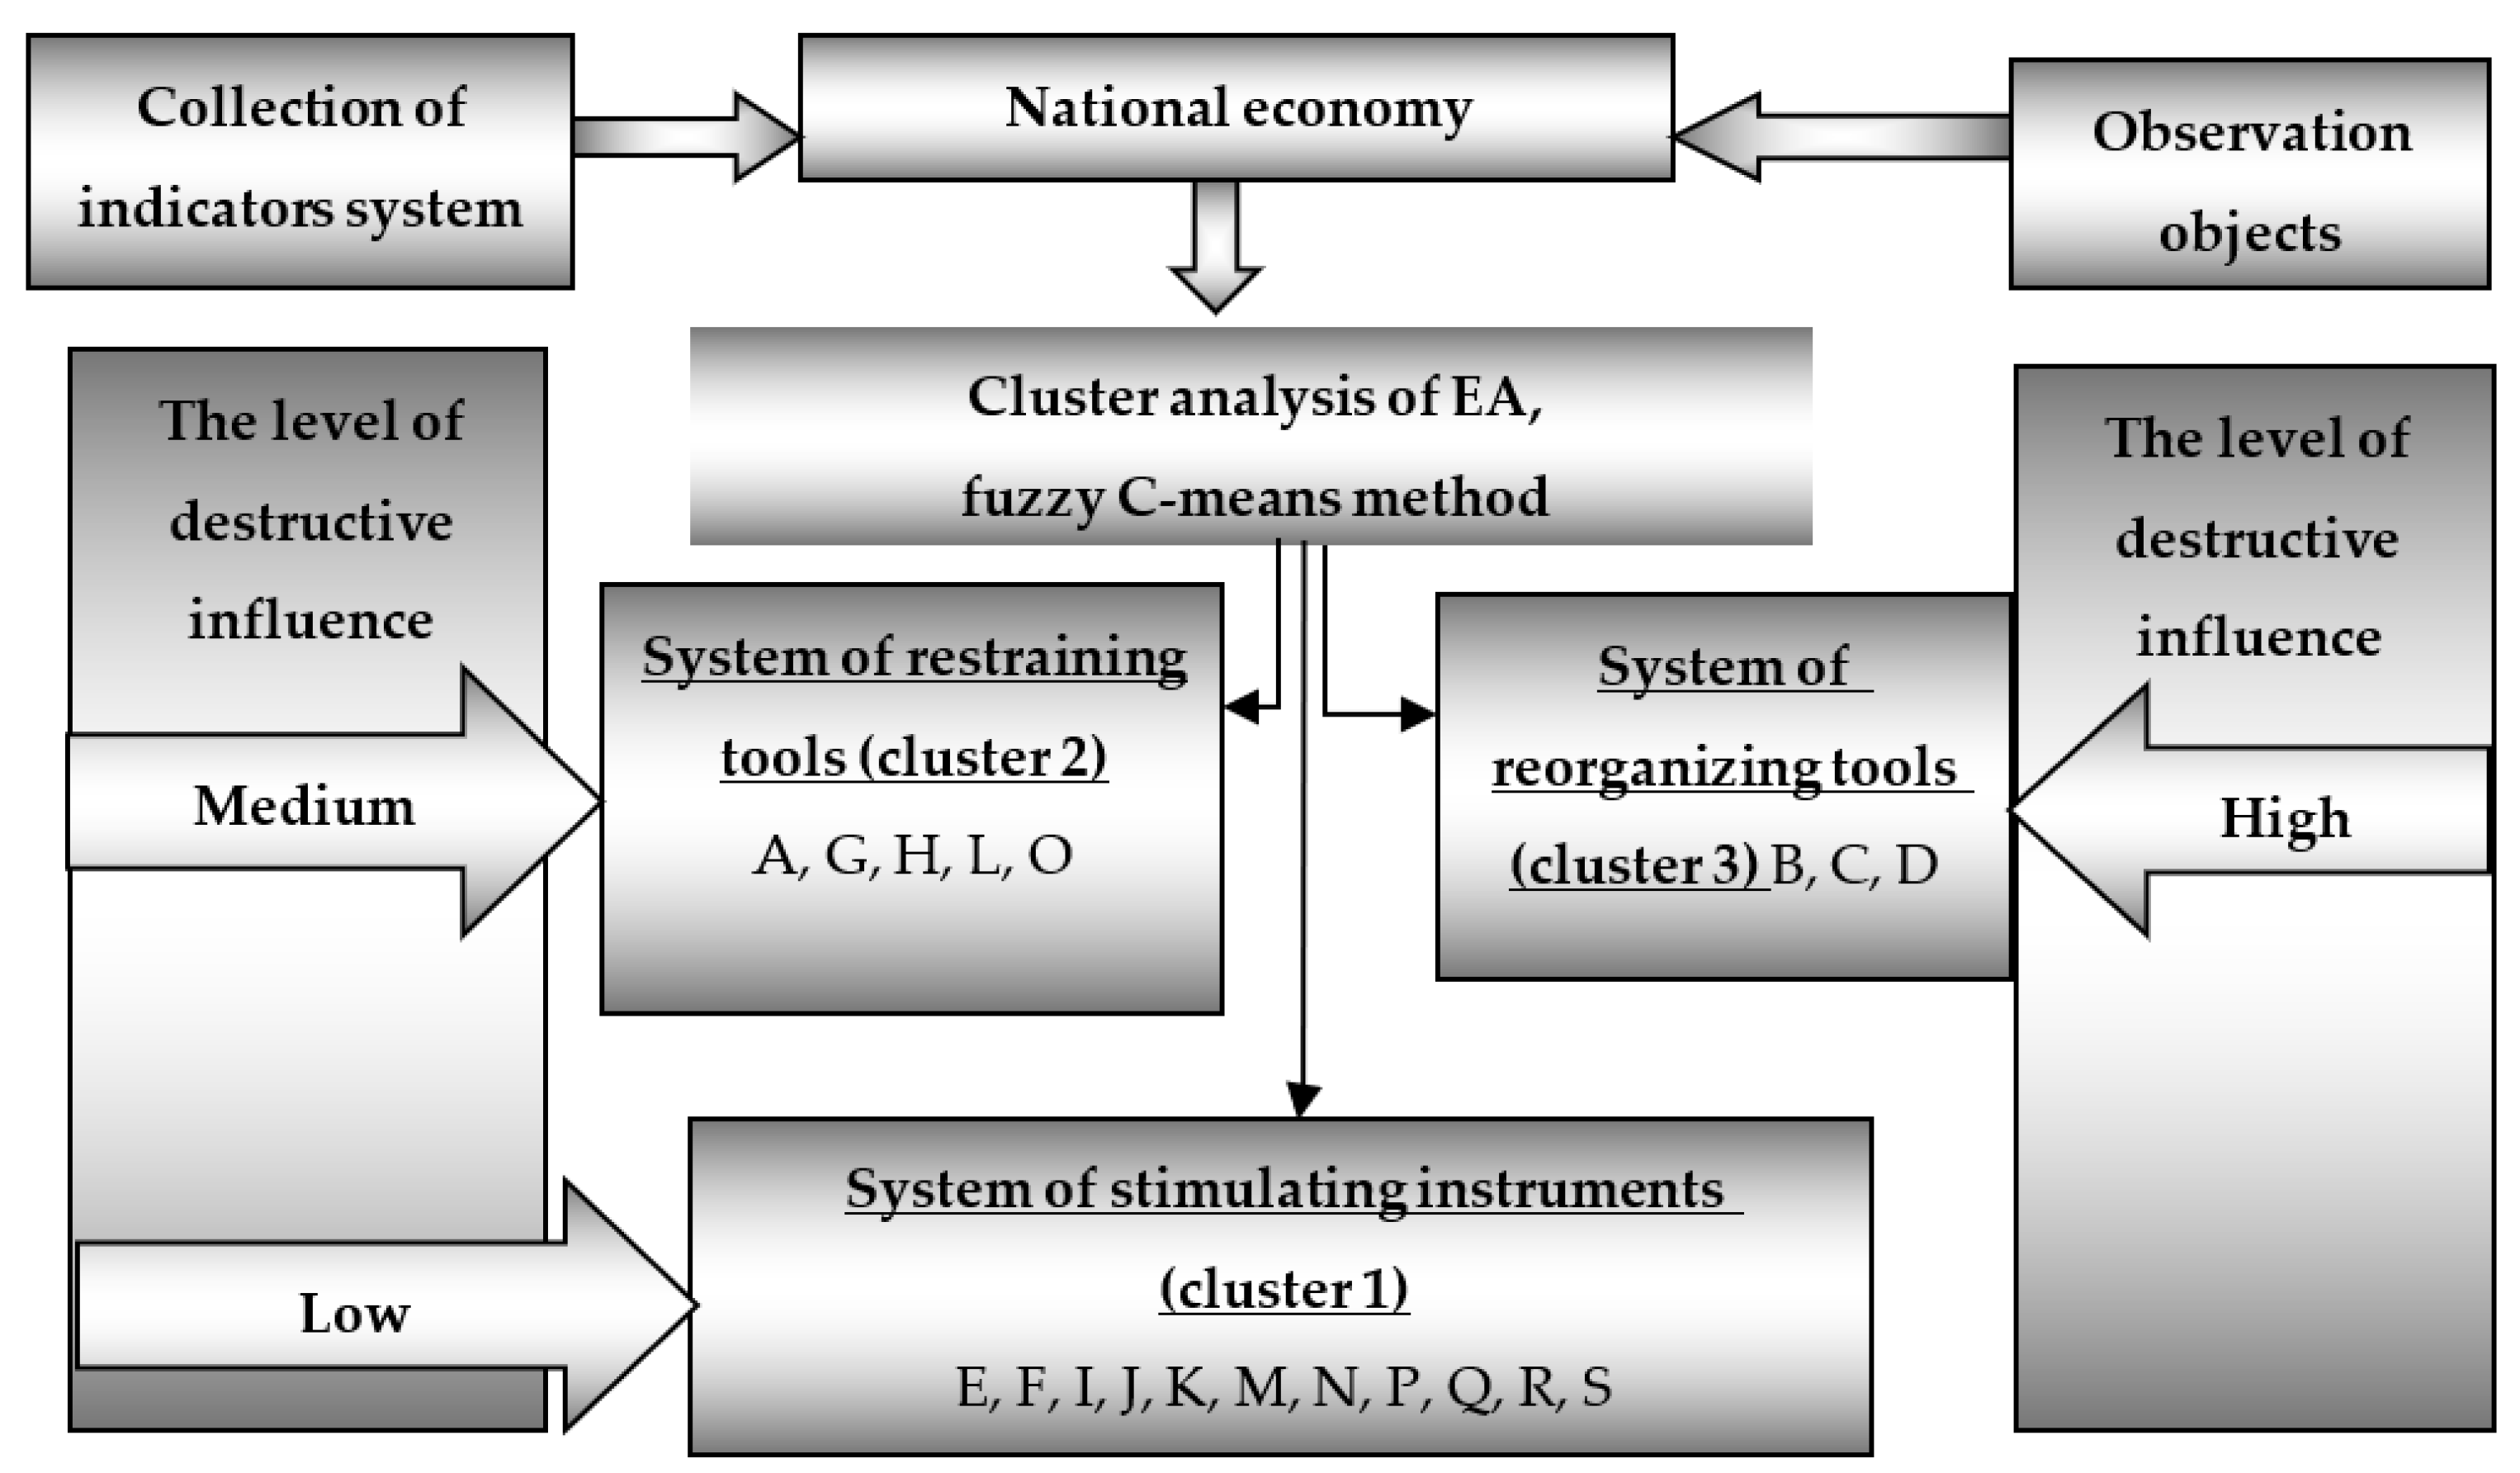
The results of a fuzzy cluster analysis of the economic activity of the national economy on the similarity indicators of economic, environmental, and social development allow us to unambiguously divide the studied objects into three groups with low, medium, and high indicators of man-made losses. The obtained clusters substantiate the formation of three types of regulation systems of economic activity (stimulating, restraining, and reorganizing). The three types of regulation systems are aimed at its transformation into a circular economy (Figure 1). Each cluster has its level of destructive influence (low, medium, high). It allowed us to recommend choosing each cluster the type of economic regulation system aimed at its transformation into a circular economy. The proposed method of choosing the system for regulating economic activity of the cluster with a low level of destructive influence corresponds to the stimulating system of transformation of the national economy into a circular one. For a cluster with a medium level of destructive influence, a restraining system of transformation is used. For a cluster with a high level of destructive influence, a reorganizing system of transformation into a circular economy should be used (Figure 1). The proposed method of choosing the system of transformation into a circular economy is based on the obtained results of fuzzy clustering of EA according to their level of destructive influence. The developed method takes into account the features of each of the obtained clusters (Figure 1). We recommend the use of incentive tools for 11 EA (E, F, I, K, M, N, P, Q, R, S), which belong to a cluster with a low level of destructive influence and a low-level of man-made loss (cluster No.1). The next cluster contains 5 EA (A—Agriculture, forestry and fishing, G—Wholesale and retail trade; repair of motor vehicles and motorcycles, H—Transportation and storage, L—Real estate transactions, O—Public administration and defense; compulsory social insurance) and forms a cluster with average destructive effects (cluster No.2). We recommend using a restraining type of system of transformation into a circular economy. For sectors “B—Mining and quarrying”, “C—Manufacturing”, and for EA “D—Electricity, gas, steam, and air conditioning supply”, which make up a cluster with a high level of man-made losses (cluster No.3), we recommend reorganizing tools to transform the structure into a circular economy. Reorganizing tools should be used for economic activity, which forms a cluster with a high level of man-made losses requiring a significant reorganization of economic activity.
The obtained results of a fuzzy cluster analysis of the EA of the national economy on the similarity indicators of economic, environmental, and social development allow us to unambiguously divide the studied objects into three groups with low, medium, and high indicators of man-made losses. The obtained clusters substantiate the formation of 3 types of system of regulation of economic activity, aimed at its transformation into a circular economy: stimulating, restraining, and reorganizing (Figure 1). Each cluster has its own level of destructive influence (low, medium, high). It allowed us to recommend for each cluster the type of economic regulation system aimed at its transformation into a circular economy. In the proposed method of choosing the system of regulation of economic activity of the cluster with a low level of destructive influence corresponds to the stimulating system of transformation of the national economy into a circular one. For a cluster with a medium level of destructive influence, a restraining system of transformation is used. For a cluster with a high level of destructive influence, a reorganizing system of transformation into a circular economy should be used (Figure 1. The proposed method of choosing the system of transformation into a circular economy is based on the obtained results of fuzzy clustering of economic activity according to their level of destructive influence. The developed method takes into account the features of each of the obtained clusters (Figure 1). We recommend the use of incentive tools for 11 EA (E, F, I, J, K, M, N, P, Q, R, S), which belong to a cluster with a low level of destructive influence and a low level of man-made losses (cluster No.1). The next cluster contains 5 EA (A, G, H, L, O) and forms a cluster with average destructive effects (cluster No.2). We recommend using a restraining type of system of transformation into a circular economy. For sectors “B—Mining and quarrying”, “C—Manufacturing” and for EA “D—Electricity, gas, steam and air conditioning supply”, which make up a cluster with a high level of man-made losses (cluster No.3), we recommend reorganizing tools to transform the structure into a circular economy.
Each cluster should be assigned a different type of transformation system with an appropriate set of measures, accompanied by changes in the state’s tax, environmental and innovation policies. It is the division into types of transformation systems of state regulation that will form the basis for building effective market models for each EA, particularly the national economy as a whole in a circular one.
In our opinion, introducing the transformation of mechanisms for state regulation of man-made damage, taking into account clusters’ characteristics, will allow effective management decisions to manage resource and information flow in planning the national economy, modernization of its EA, and reconstruction of industrial facilities. Industrial facilities pose a potential technogenic threat to the environment and society. Therefore, when modernizing the EA structure to the circular type, it is necessary to carry out reconstructions of industrial facilities that pose a potential man-made threat to the environment and society. The proposed idea of applying fuzzy cluster analysis to group EA by simulated losses will facilitate the use and implementation of various low-waste, nonwaste, and environmentally friendly production technologies, and assess their man-made harmfulness. Consequently, the protection of people and the environment against destructive activities will be increased, which is a key task of the circular economy.
The proposed method of fuzzy cluster analysis by EA enriches economic losses and national economy management in studying the factors of man-made losses to form an effective mechanism for their state regulation and provide reasonable costs for their elimination and compensation.
There are high environmental fees of “R—art, entertainment, and recreation” due to the fee for natural resources. The destruction of ecosystems is also a significant loss compared to the impact of mining, quarrying, water supply, sewerage, and waste management.
The first cluster includes the following EA: “J—Information and communication”, “M—professional, scientific and technical activities”, “N—Administrative and support service activities”, and “S—Other service activities”. These EAs do not create a significant man-made impact on the environment and society, and have low emissions, discharges, and waste. However, this is not entirely true, as these EA, linked to other service activities, cannot exist without the manufacturing and electricity, gas, steam, and air conditioning supplies, the mining and quarrying, etc. Thus, we see that we are dealing with a complex structure of man-made losses, which the state must regulate based on the latest achievements in managing the national economy. Therefore, taking into account research on state regulation of man-made losses on the choice of system types for transforming the national economy into a circular one, we recommend defining the general type of the Ukrainian economy transformation system as a superposition of the transforming system types, defined for each EA cluster.
Europe, as well as the Far and the Middle East, were successful with the targeted management of man-made losses. Thus, in Japan, a system of control across the whole society completely recycles waste into secondary raw materials. Such a system is called the Junkan–Gata Society, which means “environmentally viable society”, as described by S. Hashimoto in [96]. A characteristic feature of an Environmentally Sustainable Society is the management of material flow and information. The concept of an Environmentally Sustainable Society does not include ordinary material cycles in the national economy. The best translation of Junkan–Gata Society from Japanese is Sound Material Cycle Society [96]. Still, material cycles are in the socioeconomic system to protect the processes in nature and society [97]. Japan also established a system for monitoring the effectiveness of government policy and environmental measures to maintain and improve the material efficiency of the use of secondary resources, which received new properties and names-by-products interaction.
An example of the successful clustering of EA is the industrial project in the Danish industrial city Kalundborg [98]. It was important for the participants of this industrial project to reduce costs and receive income from the unwanted byproducts interaction. Byproduct interaction means that waste for one enterprise becomes a raw material for another. However, the heads of industrial enterprises and residents also gained significant environmental benefits along with economic incomes. This project allowed its participants to achieve substantial cost savings by improving resource efficiency. Gyproc also achieved tremendous success. This was 90–95% savings in oil consumption after the transition to gas consumption, which was obtained using byproduct interactions from neighboring refineries. The volume of the byproduct interactions cannot satisfy large-scale companies, but they are enough for medium and small enterprises. Due to the use of excess heat for domestic heating from the Asnaes company in the city, the city refused to burn oil in about 3500 domestic heating systems. Similar examples can be found in the United States [99,100]. The high byproduct interaction potential is used in industrialized areas of North Carolina, where potential byproduct interaction opportunities were identified for 49 of the 343 businesses available [100]. To find potential partners who exchanged 49 different byproducts, pollution prevention programs were developed using a geographic information system. More than half of the established relationships were successfully implemented and profitable for businesses. This indicates that using economic methods of clustering in state regulation of technogenic losses provides significant advantages over the conventional approach, which focuses on the physical management of material flow. The use of different clustering methods and their application to a wide range of materials, sectors of the economy and countries, can be a driving force in the study and analysis of man-made damage in the national economy of each country. Therefore, it is advisable to recommend to the leadership of the appropriate level when making management decisions of socioeconomic nature to implement such methodological changes in the state’s socioeconomic policy.
5. Conclusions
Based on the research and our results, we recommend that the proposed method of choosing a system for transforming the national economy into a circular economy be included in the mechanism of transforming the national economy into a circular one. This method will improve the efficiency of state regulation along with the methods of managing all resource and information flow at the national level. This allows reducing the man-caused load due to efficient nature management and adequate environmental protection activities based on the fuzzy-clustered method of selecting circular transformation tools for effective management of resource and information flow. It would also help to reduce the man-made load on the environment and society in several ways.
In our opinion, considering the specificity of economic activity clusters in transforming the national economy into a circular economy is a modern and relatively precise and simple method. This tool allows for the development of effective management decisions on indicative planning of national economy development, the modernization of the structure of its economic activity, and the reconstruction of industrial facilities that pose a potential man-made threat to the environment and society. The proposed idea of using fuzzy cluster analysis for the grouping of economic activity also contributes to the introduction of various low-waste, waste-free, and environmentally neutral production technologies. The assessment of their technogenic harmfulness and man-made damage substantiates the need to increase the protection of the population and the environment from the destructive impact of economic activity.
The stimulating system for transforming the national economy into a circular one is used with a low level of destructive impact caused by economic activity and should be motivating. Here, the set of policies aims to form a set of measures for the development of high-tech and knowledge-intensive economic activity, and the introduction of low-waste, waste-free, and environmentally neutral technologies. Here, preference is given to market instruments of regulation. The influence of the state is exerted through indirect (indicative) methods of influence: financial, material, and tax incentives (preferential loan rates, tax exemptions, tax credits, tax refunds for environmental measures, etc.) to encourage almost “zero” man-made losses. This type of system of transformation of the national economy into a circular one is aimed at forming an effective investment and innovation policy of “green” economy, public-private partnership, a set of measures to reduce resource intensity, differentiation of taxes according to cluster characteristics, formation of environmental funds, development of environmental insurance—tariffs for alternative energy, surcharges to the current tariffs for electricity and heat, etc. Here, a balance is achieved between market and imperative methods and instruments of regulation.
The restraining system of transforming the national economy into a circular one is applied at the EA cluster, where the average level of its destructive influence is observed. It consists of a set of policies that limit specific development within the cluster through licensing, quotas, contingencies, setting standards, and regulations (limiting pollutant emissions to the environment, an increase of rates of ecological taxes, the introduction of new ecological taxes, the introduction of obligatory technogenic insurance of ecologically dangerous production of goods, etc.).
The reorganizing type of transformation of the national economy into a circular one is used at a high level of destructive influence, and it includes such sectors as: mining and quarrying, electricity, gas, steam, and air conditioning supply, and manufacturing. This type of transformation is aimed at radical changes in a specific cluster, and the objects need special attention from public authorities and local governments due to the need for targeted investments. This situation is due to the need for targeted investment in the re-equipment of production through modern energy-saving and low-waste technologies, creating favorable conditions for forming techno-solitons, a “green” national logistic system. It is also advisable that the state impose charges (taxes) on imported products that may have unsafe characteristics or those that are produced in violation of international ecological standards.
Author Contributions
Conceptualization, M.B. and A.K.-S.; methodology, M.B. and A.K.-S.; software, M.B., V.L. and V.V.; validation, M.B., A.K.-S., V.L. and V.V.; formal analysis, M.B., A.K.-S., V.L. and V.V.; investigation, M.B. and V.V.; resources, M.B., A.K.-S. and V.V.; data curation, M.B. and V.V.; writing—original draft preparation, M.B., A.K.-S., V.L. and V.V.; writing—review and editing, M.B. and A.K.-S.; visualization, V.L. and V.V.; funding acquisition, A.K.-S. All authors have read and agreed to the published version of the manuscript.
Funding
This research was funded by Silesian University of Technology, grant number 13/010/BK_21/0057.
Institutional Review Board Statement
Not applicable.
Informed Consent Statement
Not applicable.
Data Availability Statement
Data sharing is not applicable to this article.
Acknowledgments
This paper was published as part of the statutory research ROZ 1: 13/010/BK_21/0057 at the Silesian University of Technology, Faculty of Organization and Management.
Conflicts of Interest
The authors declare no conflict of interest.
References
- Kostiukevych, R.; Mishchuk, H.; Zhidebekkyzy, A.; Nakonieczny, J.; Akimov, O. The impact of European integration processes on the investment potential and institutional maturity of rural communities. Econ. Sociol. 2020, 13, 46–63. [Google Scholar] [CrossRef]
- Yunin, O.; Sevruk, V.; Pavlenko, S. Priorities of economic development of Ukraine in the context of European integration. Balt. J. Econ. Stud. 2018, 4, 358–365. [Google Scholar] [CrossRef]
- Mirovitskaya, N.; Ascher, W.L. Guide to Sustainable Development and Environmental Policy; Duke University Press: Durham, UK; London, UK, 2001. [Google Scholar]
- Zhang, X.; Chen, N.; Sheng, H.; Ip, C.; Yang, L.; Chen, Y.; Sang, Z.; Tadesse, T.; Lim, T.P.Y.; Rajabifard, A.; et al. Urban drought challenge to 2030 sustainable development goals. Sci. Total Environ. 2019, 693, 133536. [Google Scholar] [CrossRef] [PubMed]
- Rajasekhar, M.; Gadhiraju, S.R.; Kadam, A.; Bhagat, V. Identification of groundwater recharge-based potential rainwater harvesting sites for sustainable development of a semiarid region of southern India using geospatial, AHP, and SCS-CN approach. Arab. J. Geosci. 2020, 13, 1–19. [Google Scholar] [CrossRef]
- Kuzmak, O.; Kuzmak, O.; Pohrishchuk, B. Sustainable development: Trends and realities of Ukraine. In E3S Web of Conferences, International Conference on Sustainable, Circular Management and Environmental Engineering (ISCMEE 2021), Odesa, Ukraine, 16 April 2021; Generowicz, A., Burkinskyi, B., Koval, V., Eds.; EDP Sciences: Les Ulis, France, 2021; Volume 255, p. 01035. [Google Scholar]
- Lim, M.M.; Jørgensen, P.S.; Wyborn, C.A. Reframing the sustainable development goals to achieve sustainable development in the anthropocene—A systems approach. Ecol. Soc. 2018, 23, 22. [Google Scholar] [CrossRef] [Green Version]
- Rafaj, P.; Kiesewetter, G.; Gül, T.; Schöpp, W.; Cofala, J.; Klimont, Z.; Purohit, P.; Heyes, C.; Amann, M.; Borken-Kleefeld, J.; et al. Outlook for clean air in the context of sustainable development goals. Glob. Environ. Chang. 2018, 53, 1–11. [Google Scholar] [CrossRef]
- Hunchenko, O.; Voloshkina, O.; Korduba, I.; Kravchenko, M.; Stefanovych, P. The conceptual framework of sustainable development and the role of environmental and technogenic safety in achieving it. In IOP Conference Series, Materials Science and Engineering, Kharkiv, Ukraine, 21–22 May 2020; IOP Publishing: Bristol, UK, 2020; Volume 907, p. 012080. [Google Scholar]
- Lévy, J.-C.; Aurez, V.; Wang, X. Economie Circulaire: Cent Villes Chinoises Pilotes Pour L’economie Circulaire, La Commission du Développement et de la Réforme. Commentaire et Traduction de la Circulaire n°1720 (2013) Relative à la Création et de la Construction de Villes (Districts) Pilotes Pour L’économie Circulaire en Chine. Available online: https://www.diplomatie.gouv.fr/IMG/pdf/conomie_circulaire_Chine_Circulaire1720_CNCD_cle814122.pdf (accessed on 25 May 2021).
- Ghisellini, P.; Cialani, C.; Ulgiati, S. A review on circular economy: The expected transition to a balanced interplay of environmental and economic systems. J. Clean. Prod. 2016, 114, 11–32. [Google Scholar] [CrossRef]
- Fatimah, Y.A.; Govindan, K.; Murniningsih, R.; Setiawan, A. Industry 4.0 based sustainable circular economy approach for smart waste management system to achieve sustainable development goals: A case study of Indonesia. J. Clean. Prod. 2020, 269, 122263. [Google Scholar] [CrossRef]
- Bublyk, M.I. Technogenic Damages in the National Economy: Economic Evaluation and Principles of State Regulation; Publishing House of Lviv Polytechnic: Lviv, Ukraine, 2015. [Google Scholar]
- Bublyk, M.; Rybytska, O. The model of fuzzy expert system for establishing the pollution impact on the mortality rate in Ukraine. In Proceedings of the IEEE 12th International Scientific and Technical Conference on Computer Sciences and Information Technologies (CSIT), Lviv, Ukraine, 5–8 September 2017; Volume 1, pp. 253–256. [Google Scholar]
- Bublyk, M.; Vysotska, V.; Matseliukh, Y.; Mayik, V.; Nashkerska, M. Assessing Losses of Human Capital Due to Man-Made Pollution Caused by Emergencies. In Proceedings of the 1st International Workshop on Computational & Information Technologies for Risk-Informed Systems (CITRisk 2020), Kherson, Ukraine, 15–16 October 2020; CEUR-WS Team: Aachen, Germany, 2020; pp. 37–39. [Google Scholar]
- Korchenko, O.; Dreis, Y.; Romanenko, O. Ukrainian critical information infrastructure: Terms, sectors and consequences. Zakhyst Inf. 2017, 19, 303–309. [Google Scholar]
- Kalybekov, T.; Rysbekov, K.; Nauryzbayeva, D.; Toktarov, A.; Zhakypbek, Y. Substantiation of averaging the content of mined ores with account of their readiness for mining. In E3S Web of Conferences 2020, Ukrainian School of Mining Engineering, Berdiansk, Ukraine, 7–11 September 2020; Bondarenko, V., Kovalevska, I., Cawood, F., Hardygora, M., Malova, O., Lysenko, R., Eds.; EDP Sciences: Les Ulis, France, 2020; Volume 201, p. 01039. [Google Scholar]
- Liulov, O.V.; Pimonenko, T.V. Innovation, Social and Economic Challenges: Proceedings of the International Scientific Online Conference, Sumy, Ukraine, 1–3 December 2020; Sumy State University Press: Sumy, Ukraine, 2020. [Google Scholar]
- Gokhberg, L.; Roud, V. Structural changes in the national innovation system: Longitudinal study of innovation modes in the Russian industry. Econ. Chang. Restruct. 2016, 49, 269–288. [Google Scholar] [CrossRef]
- Shkarupa, O.; Kalchenko, Y.; Shkarupa, I. Developing the system of instruments for business sector in order to transfer the environmental innovations effectively: Case of Ukraine. Environ. Econ. 2020, 10, 113. [Google Scholar] [CrossRef] [Green Version]
- Ponomarenko, T.; Nevskaya, M.; Jonek-Kowalska, I. Mineral Resource Depletion Assessment: Alternatives, Problems, Results. Sustainability 2021, 13, 862. [Google Scholar] [CrossRef]
- Jonek-Kowalska, I. Long-Term Analysis of the Effects of Production Management in Coal Mining in Poland. Energies 2019, 12, 3146. [Google Scholar] [CrossRef] [Green Version]
- Jonek-Kowalska, I.; Turek, M. Dependence of Total Production Costs on Production and Infrastructure Parameters in the Polish Hard Coal Mining Industry. Energies 2017, 10, 1480. [Google Scholar] [CrossRef] [Green Version]
- Ahmad, M.; Jiang, P.; Majeed, A.; Umar, M.; Khan, Z.; Muhammad, S. The dynamic impact of natural resources, technological innovations and economic growth on ecological footprint: An advanced panel data estimation. Resour. Policy 2020, 69, 101817. [Google Scholar] [CrossRef]
- Telenga-Kopyczyńska, J.; Jonek-Kowalska, I. Algorithm for Selecting Best Available Techniques in Polish Coking Plants Supporting Multi-Criteria Investment Decisions in European Environmental Conditions. Energies 2021, 14, 2631. [Google Scholar] [CrossRef]
- Antonelli, C. The Economics of Innovation, New Technologies and Structural Change; Routledge: London, UK, 2014. [Google Scholar]
- Babkin, A.V.; Zdolnikova, S.V.; Kozlov, A.V.; Babkin, I.A. Organizational and economic mechanism of management by innovative potential of industrial cluster. St. Petersburg State Polytech. Univ. J. Econ. 2019, 12, 71–83. [Google Scholar]
- Rennings, K. Redefining innovation—Eco-innovation research and the contribution from ecological economics. Ecol. Econ. 2000, 32, 319–332. [Google Scholar] [CrossRef]
- Borisova, V.; Samoshkina, I.; Rybina, L.; Shumkova, O. Financial Mechanism for Managing the Environmental Innovation Development of the Economy in Ukraine. J. Environ. Manag. Tour. 2020, 11, 1617–1633. [Google Scholar] [CrossRef]
- Kyrylov, Y.; Hranovska, V.; Zhosan, H.; Dotsenko, I. Innovative Development of Agrarian Enterprises of Ukraine in the Context of the Fourth Industrial Revolution. Solid State Technol. 2020, 63, 1430–1448. [Google Scholar]
- Filatova, A.; Vartanian, A. Ecological and social-economic aspects of shw management in the Kherson region. In Economics for Ecology ISCS’2016, Proceedings of the XXII International Scientific Conference, Symy, Ukraine, 11–12 May 2016; Smolennikov, D.O., Iskakov, A.A., Eds.; SumDU Press: Sumy, Ukraine, 2016; pp. 27–30. [Google Scholar]
- Fan, Y.; Fang, C.; Zhang, Q. Coupling coordinated development between social economy and ecological environment in Chinese provincial capital cities-assessment and policy implications. J. Clean. Prod. 2019, 229, 289–298. [Google Scholar] [CrossRef]
- Li, X.; Wang, Y.; Zhou, H.; Shi, L. Has China’s war on pollution reduced employment? Quasi-experimental evidence from the Clean Air Action. J. Environ. Manag. 2020, 260, 109851. [Google Scholar] [CrossRef] [PubMed]
- Bahorka, M. Formation of the ecological-economical management of ecologization of agrarian production. Agric. Resour. Econ. Int. Sci. e-J. 2019, 5, 5–18. [Google Scholar]
- Shah, S.A.R.; Naqvi, S.A.A.; Riaz, S.; Anwar, S.; Abbas, N. Nexus of biomass energy, key determinants of economic development and environment: A fresh evidence from Asia. Renew. Sustain. Energy Rev. 2020, 133, 110244. [Google Scholar] [CrossRef]
- Newell, R.G.; Pizer, W.A.; Raimi, D. US federal government subsidies for clean energy: Design choices and implications. Energy Econ. 2019, 80, 831–841. [Google Scholar] [CrossRef]
- Batyrgareieva, V.S.; Kalinina, A.V.; Babenko, A.M. Energy infrastructure objects of Ukraine as a public health threat: Criminological analysis. Wiadomości Lek. 2019, LXXII, 2434–2440. [Google Scholar]
- Raszkowski, A.; Bartniczak, B. Towards sustainable regional development: Economy, society, environment, good governance based on the example of Polish regions. Transform. Bus. Econ. 2018, 17, 225–245. [Google Scholar]
- Golikova, G.; Romanova, O.; Chudakova, E.; Mraev, M.; Manukovsky, D. Monitoring of the investment support allocated to the territories at the current stage of the economic development. In International Scientific-Practical Conference “Business Cooperation as a Resource of Sustainable Economic Development and Investment Attraction” (ISPCBC 2019), Pskov, Russia, 21–23 May 2019; Atlantis Press: Paris, France, 2019; pp. 14–18. [Google Scholar]
- Dyllick, T.; Muff, K. Clarifying the meaning of sustainable business: Introducing a typology from business-as-usual to true business sustainability. Organ. Environ. 2016, 29, 156–174. [Google Scholar] [CrossRef] [Green Version]
- Dubovich, I. Sustainable forest management: Current problems in cross-border cooperation between Ukraine and the neighboring European Union countries. Bull. Transilv. Univ. Brasov. For. Wood Ind. Agric. Food Eng. 2018, II, 31–38. [Google Scholar]
- Kostetska, K.; Khumarova, N.; Umanska, Y.; Shmygol, N.; Koval, V. Institutional qualities of inclusive environmental management in sustainable economic development. Manag. Syst. Prod. Eng. 2020, 28, 15–22. [Google Scholar] [CrossRef] [Green Version]
- De Negri, J.F.; Pezzutto, S.; Gantioler, S.; Moser, D.; Sparber, W. A Comprehensive Analysis of Public and Private Funding for Photovoltaics Research and Development in the European Union, Norway, and Turkey. Energies 2020, 13, 2743. [Google Scholar] [CrossRef]
- Karpenko, O.; Turenko, L.; Karpenko, H. Modern Tools for the Ensuring of the National Model of the «Green» Economy Eco Development. Econ. Innov. 2018, 20, 78–90. [Google Scholar] [CrossRef] [Green Version]
- Burlakova, I.; Kovalov, B.; Šauer, P.; Dvořák, A. Transformation Mechanisms of Transition to the Model of “Green” Economy in Ukraine. J. Environ. Manag. Tour. 2017, 8, 1029–1040. [Google Scholar]
- Kozlovska, H.; Kirilieva, A. Formation of an effective policy of “green” investment as a priority direction of sustainable development of national economy. Pryazovsʹkyy ekonomichnyy visnyk: Elektronnyy naukovyy zhurnal 2020, 2, 177–183. [Google Scholar] [CrossRef]
- Shkarupa, O. Socio-economic transformations of standards as a key factor to environmental modernisation of the regional level. Ekonomika i Rehion 2017, 2, 5–10. [Google Scholar]
- Wierzbicka, W. Socio-economic potential of cities belonging to the Polish National Cittaslow Network. Oeconomia Copernicana 2020, 11, 203–224. [Google Scholar] [CrossRef]
- Martínez-Gomariz, E.; Locatelli, L.; Guerrero, M.; Russo, B.; Martínez, M. Socio-economic potential impacts due to urban pluvial floods in Badalona (Spain) in a context of climate change. Water 2019, 11, 2658. [Google Scholar] [CrossRef] [Green Version]
- Zhou, X.; Hristova, D.; Noulas, A.; Mascolo, C.; Sklar, M. Cultural investment and urban socio-economic development: A geosocial network approach. R. Soc. Open Sci. 2017, 4, 170413. [Google Scholar] [CrossRef] [PubMed] [Green Version]
- Badina, S.V. Socio-economic potential of municipalities in the context of natural risk (case study–Southern Siberian regions). In IOP Conference Series, Earth and Environmental Science, Irkutsk, Russia, 20–26 August 2018; IOP Publishing: Bristol, UK, 2018; Volume 190, p. 012001. [Google Scholar]
- Alesinskaya, T.V.; Arutyunova, D.V.; Orlova, V.G.; Ilin, I.V.; Shirokova, S.V. Conception BSC for investment support of port and industrial complexes. Acad. Strateg. Manag. J. 2017, 16, 9A. [Google Scholar]
- Makhmudov, S. Ways of the Investment Environment Effect in Financing Investment Activities Development. Arch. Sci. Res. 2020, 34, 2045–2053. [Google Scholar]
- Zaytseva, I.V.; Popova, M.V.; Bogdanova, S.V.; Ermakova, A.N. Economic and mathematical methods of labor potential management of the region. Bull. Stavropol Agro-Ind. Complex 2016, S2, 149–153. [Google Scholar]
- Andrusiv, U.; Simkiv, L.; Dovgal, O.; Demchuk, N.; Potryvaieva, N.; Cherchata, A.; Popadynets, I.; Tkachenko, G.; Serhieieva, O.; Sydor, H. Analysis of economic development of Ukraine regions based on taxonomy method. Manag. Sci. Lett. 2020, 10, 515–522. [Google Scholar] [CrossRef]
- Shubalyi, O.M.; Kosinskyi, P.; Golyan, V. Economic simulation of the development of agriculture in Ukraine due to integrated use of natural resources and waste. Bulg. J. Agric. Sci. 2020, 26, 323–331. [Google Scholar]
- Melnyk, M.I. Formation of the Business Environment of Ukraine in Terms of Institutional Transformations; IRD NAS of Ukraine: Lviv, Ukraine, 2012.
- Mikula, N.A.; Tolkovanov, V.V. Intermunicipal cooperation as an innovative tool for the implementation of state regional policy and cross-border cooperation. Socio-Econ. Probl. Mod. Period Ukraine. Reg. Dev. Cross-Bord. Coop. 2010, 6, 52–75. [Google Scholar]
- Kravtsiv, V.S.; Zhuk, P.V.; Hulych, O.I.; Kolodiychuk, I.A.; Polyuha, V.O. Development of Nature-Exploiting Branches of the Economy of Lviv Region: State, Problems, Prospects; Institute for Regional Studies of the National Academy of Sciences of Ukrain: Lviv, Ukraine, 2011.
- Seliverstov, R.H. Elements of fuzzy set theory as a means of professionalisation of expert activity in public administration. Effic. Public Adm. 2008, 16/17, 372–376. [Google Scholar]
- Seliverstov, R.H. Fuzzy cluster analysis of some indicators of social development of Lviv region districts. Democr. Gov. 2013, 11, 191–196. [Google Scholar]
- Seliverstov, R.H. Implementation of the model of forming expert commissions according to fuzzy criteria in the Microsoft Excel software environment. Democr. Gov. Context Glob. Chall. Cris. 2009, 2, 452–455. [Google Scholar]
- Bublyk, M.I. Formation of the mechanism of state regulation of technogenic damages on the basis of fuzzy cluster analysis of branch development. Form. Mech. Sustain. Econ. Dev.: Theory Pract. 2014, 2.2, 144–152. [Google Scholar]
- Bublyk, M.I. The vague cluster analysis of regions of Ukraine by terms of technogenic damages. Socio-Econ. Probl. Mod. Period Ukraine. Mech. Regul. Reg. Dev. Ukr. 2014, 5, 45–57. [Google Scholar]
- Kuzmin, O.; Bublyk, M. Economic evaluation and government regulation of technogenic (man-made) damage in the national economy. In Proceedings of the IEEE XIth International Scientific and Technical Conference Computer Sciences and Information Technologies (CSIT), Lviv, Ukraine, 6–10 September 2016; pp. 37–39. [Google Scholar]
- Shiryaev, D.V.; Litvinenko, I.L.; Rubtsova, N.V.; Kolpak, E.P.; Blaginin, V.A.; Zakharova, E.N. Economic clusters as a form of self-organisation of the economic system. Int. J. Econ. Financ. Issues 2016, 6 (Suppl. S1), 284–288. [Google Scholar]
- Portugali, J. Self-Organisation and the City; Series: Springer Series in Synergetics; Springer Nature: Heidelberg, Germany, 2000. [Google Scholar]
- Koshtura, D.; Bublyk, M.; Matseliukh, Y.; Dosyn, D.; Chyrun, L.; Lozynska, O.; Karpov, I.; Peleshchak, I.; Maslak, M.; Sachenko, O. Analysis of the demand for bicycle use in a smart city based on machine learning. In Proceedings of the 2nd International Workshop on Modern Machine Learning Technologies and Data Science (MoMLeT+DS 2020), Lviv-Shatsk, Ukraine, 2–3 June 2020; Volume 2631, pp. 172–183. [Google Scholar]
- Bublyk, M.; Matseliukh, Y. Small-batteries utilisation analysis based on mathematical statistics methods in challenges of circular economy. In Proceedings of the 5th International Conference on Computational Linguistics and Intelligent Systems, (COLINS-2021), Kharkiv, Ukraine, 22–23 April 2021; Volume 2870, pp. 1594–1603. [Google Scholar]
- Klimkina, I.; Kharytonov, M.; Zhukov, O. Trend analysis of water-soluble salts vertical migration in technogenic edaphotops of reclaimed mine dumps in Western Donbass (Ukraine). J. Environ. Res. Eng. Manag. 2018, 2, 82–93. [Google Scholar]
- Schmalensee, R.; Stavins, R.N. Policy evolution under the clean air act. J. Econ. Perspect. 2019, 33, 27–50. [Google Scholar] [CrossRef]
- Cadotte, M.W.; Barlow, J.; Nuñez, M.A.; Pettorelli, N.; Stephens, P.A. Solving environmental problems in the Anthropocene: The need to bring novel theoretical advances into the applied ecology fold. J. Appl. Ecol. 2017, 54, 1–6. [Google Scholar] [CrossRef]
- Harring, N.; Torbjörnsson, T.; Lundholm, C. Solving environmental problems together? The roles of value orientations and trust in the state in environmental policy support among Swedish undergraduate students. Educ. Sci. 2018, 8, 124. [Google Scholar] [CrossRef] [Green Version]
- Hirschman, A.O.H. The rise and decline of development economics. In The Essential Hirschman; Princeton University Press: Princeton, NJ, USA, 2013; pp. 49–73. [Google Scholar]
- Bodnar, I.; Bublyk, M.; Veres, O.; Lozynska, O.; Karpov, I.; Burov, Y.; Kravets, P.; Peleshchak, I.; Vovk, O.; Maslak, O. Forecasting the risk of cervical cancer in women in the human capital development context using machine learning. In Proceedings of the 2nd International Workshop on Modern Machine Learning Technologies and Data Science (MoMLeT+DS 2020), Lviv-Shatsk, Ukraine, 2–3 June 2020; Volume 2631, pp. 491–501. [Google Scholar]
- Boettke, P.J.; Coyne, C.J.; Leeson, P.T. Institutional stickiness and the new development economics. Amer. J. Econ. Soc. 2008, 67. Available online: https://www.ccoyne.com/Inst._Stickiness_-_FINAL_Pages.pdf (accessed on 15 May 2021). [CrossRef] [Green Version]
- Lybbert, T.J.; Taylor, J.E. Essentials of Development Economics; University of California Press: Los Angele, CA, USA, 2020. [Google Scholar]
- Cao, L. AI in Finance: A Review. SSRN 2020, 9, 39. Available online: https://datasciences.org/publication/AIF_A_Review.pdf (accessed on 15 May 2021). [CrossRef]
- Ivanenko, O. Implementation of risk assessment for critical infrastructure protection with the use of risk matrix. ScienceRise 2020, 2, 26–38. [Google Scholar] [CrossRef]
- Ivaniuta, S. Risk assessment for critical infrastructure in the conditions of Ukraine. Sci. Mil. J. 2018, 13, 31. [Google Scholar]
- Vasyutinska, K.; Barbashev, S.; Smyk, S. Analysis of urbanisation impact on the dynamics of emergencies and risks for population in Ukraine. Proc. Odessa Polytech. Univ. 2018, 2, 88–96. [Google Scholar]
- Zatserkovnyy, V.; Bogoslovskyi, M. Evaluation of risks emergencies by modelling the functional status of the objects. Bull. Taras Shevchenko Natl. Univ. Kyiv. Geol. 2018, 4, 91–97. [Google Scholar] [CrossRef]
- Schultz, S.L.; Melnyk, M.I. Modeling of regularities of spatial concentration of economic activity in the context of prospects of regional development. Socio-Econ. Probl. Mod. Period Ukraine. Reg. Dev. Cross-Bord. Coop. 2010, 6, 250–257. [Google Scholar]
- Grabmeier, J.; Rudolph, A. Techniques of cluster algorithms in data mining. Data Min. Knowl. Discov. 2002, 6, 303–360. [Google Scholar] [CrossRef]
- Jain, A.K.; Murty, M.N.; Flynn, P.J. Data clustering: A review. ACM Comput. Surv. 1999, 31, 264–323. [Google Scholar] [CrossRef]
- Silʹvestry, A. The experience of the United Kingdom in the development of high-tech clusters. Probl. Innov. Dev. Territ. 2004, 1, 106–118. [Google Scholar]
- Taraskina, A.S. Fuzzy clustering by the modified C-means method and its application for processing microchip data. Probl. Intellect. Qual. Autom. Syst. 2013, 13, 217–228. [Google Scholar]
- Romashko, S.M.; Savras, I.Z.; Seliverstov, R.H. Use of Statistical Information for Estimation and Forecasting of Development of Territories; NADU: Kyiv, Ukraine, 2012. [Google Scholar]
- Dembele, D.; Kastner, P. C-means method for clustering microarray data. Bioinformatics 2003, 19, 973–980. [Google Scholar] [CrossRef] [Green Version]
- The Statistical Base of the State Statistics Service of Ukraine Is Open. Available online: http://www.ukrstat.gov.ua (accessed on 15 May 2021).
- Prokopenko, O. Environment of Ukraine; State Statistics Service of Ukraine: Kyiv, Ukraine, 2020.
- Environment of Ukraine in 2019: Report of the State Statistics Service of Ukraine. Available online: http://ukrstat.gov.ua/druk/publicat/kat_u/2020/zb/11/Dovk_19.pdf (accessed on 15 May 2021).
- Classification of Economic Activities (KVED-2010). Available online: http://kved.ukrstat.gov.ua/KVED2010/kv10_i.html (accessed on 15 May 2021).
- NACE Rev. 2.—Statistical Classification of Economic Activities. Eurostat Overview of National Classifications. Available online: https://ec.europa.eu/eurostat/web/nace-rev2.html (accessed on 15 May 2021).
- International Standard Industrial Classification of All Economic Activities (ISIC). ISIC Rev. 4. Available online: https://ilostat.ilo.org/resources/concepts-and-definitions/classification-economic-activities/index.html (accessed on 15 May 2021).
- Hashimoto, S. A Junkan-Gata Society: Concept and Progress in Material Flow Analysis in Japan. J. Ind. Ecol. 2009, 13, 655–657. [Google Scholar] [CrossRef]
- Hashimoto, S.; Tanikawa, H.; Moriguchi, Y. Framework for estimating potential wastes and secondary resources accumulated within an economy—A case study of construction minerals in Japan. Waste Manag. 2009, 29, 2859–2866. [Google Scholar] [CrossRef]
- Ehrenfeld, J.; Gertler, N. Industrial Ecology in Practice. The Evolution of Interdependence at Kalundborg. J. Ind. Ecol. 2007, 1, 67–79. [Google Scholar] [CrossRef]
- Developing Integrated Solid Waste Management Plan Training Manual. Volume 1. Waste Characterisation and Quantification with Projections for Future. United Nations Environmental Programme Division of Technology, Industry and Economics International Environmental Technology Centre. Osaka/Shiga, Japan. 2009. Available online: https://wedocs.unep.org/bitstream/handle/20.500.11822/7502/ISWMPlan_Vol1.pdf?sequence=3 (accessed on 15 May 2021).
- Reverse Logistics. Available online: http://www.greenlogistics.org/themesandoutputs/wm10/index.htm (accessed on 15 May 2021).
Figure 1.
Concept of transformation of national economy of Ukraine into a circular one and appropriate tools for EA clusters.
Figure 1.
Concept of transformation of national economy of Ukraine into a circular one and appropriate tools for EA clusters.


Table 1.
Database for fuzzy clustering of EA by indicators describing man-made damage.
| Code | Economic Activity | Man-Made Damage | Environmental Payments | Environmental Protection Activities | ||||||
|---|---|---|---|---|---|---|---|---|---|---|
| 1 | 2 | 3 | 4 | 5 | 6 | 7 | 8 | 9 | 10 | |
| A | 388,726 | 82.1 | 1162.2 | 34.57 | 6750.5 | 72,853.9 | 183.9 | 5912.2 | 1381.3 | 434,784.7 |
| B | 190,343 | 418.9 | 3105.0 | 143.65 | 390,563.8 | 790,659.9 | 1052.6 | 2,136,228.6 | 334,666.0 | 7,234,863.3 |
| C | 425,067 | 890.3 | 48,782.3 | 272.68 | 30,751.8 | 1,457,376.4 | 5894.0 | 4,184,494.0 | 683,211.2 | 7,493,216.4 |
| D | 122,752 | 960.7 | 63,274.0 | 10.23 | 5959.2 | 2,616,481.0 | 534.3 | 7,780,151.7 | 55,423.7 | 1,678,016.2 |
| E | 16,451 | 18.9 | 240.7 | 261.97 | 411.8 | 90,409.3 | 241.7 | 1,239,776.2 | 252,744.4 | 8,457,868.2 |
| F | 120,274 | 2.5 | 38.0 | 2.92 | 188.7 | 22,625.1 | 65.5 | 88.9 | 8.9 | 85,815.6 |
| G | 585,344 | 3.4 | 76.4 | 4.97 | 400.75 | 139,852.6 | 227.3 | 24,857.3 | 0.01 | 117,696.1 |
| H | 262,408 | 53.9 | 3703.9 | 1.46 | 227.26 | 79,306.0 | 509.9 | 64,000.3 | 1607.8 | 754,972.7 |
| I | 26,907 | 0.06 | 6.3 | 0.01 | 0.01 | 335.3 | 0.01 | 212.2 | 0.01 | 2972.6 |
| K | 132,683 | 0.16 | 9.1 | 0.02 | 1.73 | 604.1 | 0.01 | 0.01 | 0.01 | 25,377.0 |
| L | 267,661 | 3.78 | 222.7 | 0.52 | 42.17 | 14,715.9 | 65.5 | 218,669.9 | 29,535.5 | 116,618.8 |
| O | 303,059 | 13.1 | 148.6 | 0.33 | 26.21 | 9147.9 | 35.9 | 339,222.4 | 83,660.1 | 178,217.6 |
| P | 180,980 | 5.1 | 330.4 | 0.16 | 12.43 | 4339.2 | 12.6 | 429.0 | 415.0 | 13,438.2 |
| Q | 113,280 | 0.49 | 13.8 | 0.26 | 21.38 | 7462.1 | 1.5 | 7020.0 | 6709.3 | 14,629.4 |
| R | 22,803 | 6.11 | 169.5 | 3.25 | 262.06 | 91,450.4 | 247.3 | 172,579.3 | 5021.5 | 324,256.3 |
A—agriculture, forestry and fishing; B—mining and quarrying; C—manufacturing; D—electricity, gas, steam, and air conditioning supply; E—water supply; sewerage, waste management; F—construction; G—wholesale and retail trade; repair of motor vehicles and motorcycles; H—transportation and storage; I—accommodation and food service activities; K—financial and insurance activities; L—real estate transactions; O—public administration and defense; compulsory social insurance; P—education; Q—human health and social work activities; R—arts, entertainment, and recreation.
Table 2.
Matrix of membership of each EA to three clusters.
| Code | EA | Cluster Number | ||
|---|---|---|---|---|
| 1 | 2 | 3 | ||
| A | Agriculture, forestry, and fishing | 0.071 | 0.92 | 0.01 |
| B | Mining and quarrying | 0.29 | 0.32 | 0.39 |
| C | Manufacturing | 0.04 | 0.05 | 0.91 |
| D | Electricity, gas, steam, and air conditioning supply | 0.28 | 0.29 | 0.44 |
| E | Water supply; sewerage, waste management | 0.36 | 0.35 | 0.28 |
| F | Construction | 0.98 | 0.02 | 0.00 |
| G | Wholesale and retail trade; repair of motor vehicles and motorcycles | 0.22 | 0.74 | 0.04 |
| H | Transportation and storage | 0.32 | 0.67 | 0.01 |
| I | Accommodation and food service activities | 0.92 | 0.07 | 0.01 |
| K | Financial and insurance activities | 0.96 | 0.04 | 0.00 |
| L | Real estate transactions | 0.37 | 0.62 | 0.01 |
| O | Public administration and defense; compulsory social insurance | 0.22 | 0.77 | 0.01 |
| P | Education | 0.85 | 0.15 | 0.00 |
| Q | Human health and social work activities | 0.97 | 0.03 | 0.00 |
| R | Arts, entertainment, and recreation | 0.92 | 0.07 | 0.01 |
Table 3.
EA distribution by indicators of man-made damage between three clusters.
| Code | EA | Cluster Number | ||
|---|---|---|---|---|
| 1 | 2 | 3 | ||
| A | Agriculture, forestry, and fishing | + | ||
| B | Mining and quarrying | + | ||
| C | Manufacturing | + | ||
| D | Electricity, gas, steam, and air conditioning supply | + | ||
| E | Water supply; sewerage, waste management | + | ||
| F | Construction | + | ||
| G | Wholesale and retail trade; repair of motor vehicles and motorcycles | + | ||
| H | Transportation and storage | + | ||
| I | Accommodation and food service activities | + | ||
| K | Financial and insurance activities | + | ||
| L | Real estate transactions | + | ||
| O | Public administration and defense; compulsory social insurance | + | ||
| P | Education | + | ||
| Q | Human health and social work activities | + | ||
| R | Arts, entertainment, and recreation | + | ||
Publisher’s Note: MDPI stays neutral with regard to jurisdictional claims in published maps and institutional affiliations. |
© 2021 by the authors. Licensee MDPI, Basel, Switzerland. This article is an open access article distributed under the terms and conditions of the Creative Commons Attribution (CC BY) license (https://creativecommons.org/licenses/by/4.0/).
Share and Cite
MDPI and ACS Style
Bublyk, M.; Kowalska-Styczeń, A.; Lytvyn, V.; Vysotska, V. The Ukrainian Economy Transformation into the Circular Based on Fuzzy-Logic Cluster Analysis. Energies 2021, 14, 5951. https://doi.org/10.3390/en14185951
AMA Style
Bublyk M, Kowalska-Styczeń A, Lytvyn V, Vysotska V. The Ukrainian Economy Transformation into the Circular Based on Fuzzy-Logic Cluster Analysis. Energies. 2021; 14(18):5951. https://doi.org/10.3390/en14185951
Chicago/Turabian StyleBublyk, Myroslava, Agnieszka Kowalska-Styczeń, Vasyl Lytvyn, and Victoria Vysotska. 2021. "The Ukrainian Economy Transformation into the Circular Based on Fuzzy-Logic Cluster Analysis" Energies 14, no. 18: 5951. https://doi.org/10.3390/en14185951
Note that from the first issue of 2016, this journal uses article numbers instead of page numbers. See further details here.