
Models of Transverse Vibration in Conveyor Belt—Investigation and Analysis


Department of Mining Wroclaw University of Science and Technology, Na Grobli 15, 50-421 Wroclaw, Poland
*
Author to whom correspondence should be addressed.
Energies 2021, 14(14), 4153; https://doi.org/10.3390/en14144153
Submission received: 31 May 2021
/
Revised: 23 June 2021
/
Accepted: 6 July 2021
/
Published: 9 July 2021
(This article belongs to the Special Issue Energy-Efficiency of Conveyor Belts in Raw Materials Industry)
Abstract
:The transverse vibration frequency of conveyor belts is an important parameter describing the dynamic characteristics of a belt conveyor. This parameter is most often identified from theoretical relationships, which are derived on the basis of an assumption that the belt is a stationary elastic string. Belt vibrations have a number of analogies to other tension member systems, such as, for example, power transmission belts. Some research findings suggest that in the case of a limited length of the belt section, a more accurate description of its vibration can be obtained with a beam model rather than with a string model. Experimental research has so far mostly revolved around measurements of stationary belts. This article presents the results of vibration measurements performed for a moving belt and obtained for various operating parameters of the conveyor, as well as for several configurations of the distance between idler supports. The analysis was conducted on a moving steel-cord belt. Belts of this type are commonly used in the majority of mines and industrial plants. The measurement results were compared with the model of a string and with the model of a beam in tension. Both of the theoretical models allowed for the belt speed, whose influence was demonstrated in both theoretical calculations and experimental tests to be negligible. On the other hand, the tensile force in the belt was observed to have a significant impact on the vibration frequency. Depending on the idler spacing, the measurement results are approximate to those of the beam model or of the string model. For spacing smaller than 1.6 m, the belt shows properties approximate to an elastic beam, while for spacing greater than 1.6 m, the belt behaviour can be better represented through a string model. A beam model is, therefore, more applicable in analyses of vibrations in the upper strand of the belt, while a string model is more useful in analyses of vibrations in the lower strand.
1. Introduction
The analysis of transverse vibrations of the conveyor belt is important, due to their destructive effect on the durability of structural elements and due to the areas of resonant work [1,2,3]. Resonances can result in excessive wear of the belt and idlers, but also increased noise emission. The regulations define the noise emission requirements of machinery and equipment approved for industrial use [4,5,6]. In recent years, these requirements have become increasingly restrictive. In particular, open-cast mines where conveyor belts are the main transport solution must enact a series of solutions to reduce noise emissions to the environment [7,8,9,10]. It is necessary to look for new solutions, and one of them may be the analysis of transverse vibrations of the conveyor belt in terms of their impact on the noise emission of the conveyor. Research on the transverse vibrations of elastic belts, including conveyor belts, has been conducted for a long time [1,11,12,13,14]. In most publications, the main research objective is to find the vibration frequency of the belt based on analytical methods [1,15,16,17]. Laboratory tests are usually limited to measurements under static conditions of a stationary belt tensioned with constant force [18]. The frequency of the tape vibrations depends on parameters such as stiffness, tension force, linear movement speed, mass, section geometry, and number and spacing of support sets [19]. Some of these parameters can be determined by measuring on a conveyor or by examining belt samples in the laboratory [20,21]. With a good theoretical model, these parameters can accurately predict the frequency of belt vibrations in the initial stages of conveyor design. The motivation for research and consideration of the form of current models was the fact that they describe the frequency of vibrations with a high approximation, using simplified physical models as a base, and there are no studies verifying their usefulness in dynamic conditions [19]. The basis for the calculation in the case of a conveyor belt is the string model, which, in practice, aims to verify that the forces in the upper or lower empty conveyor do not fit the resonance force in terms of changes in the forces in the upper or lower empty conveyor [22]. Some studies suggest that the tape shows the characteristics of the string, but only in the case of large spacings of support sets [23]. For such conditions, it is necessary to use a different model—the model of the beam freely supported. This model completely ignores the dynamics of the conveyor belt [19]. The belt should be analysed as a moving object, as this corresponds to the working conditions. The model of the tensile beam is further proposed as a better approximation of the behaviour of the movable guide, with increased stiffness. Additional parameters have also been introduced into the models: the effective force in the tape, a linear velocity, and a change in the tensile force of the belt. The theoretical results obtained were verified using a non-contact measuring method of the mobile belt using a vibration and noise meter. A detailed analysis of the model errors and the impact of the individual conveyor parameters on the result obtained is provided.
2. Materials and Methods
2.1. Theory and Tests of Conveyor Belt Transverse Vibrations
The belt is a tension member, and therefore, a number of analogies can be found between its behaviour and transverse vibrations of power transmission belts [22,23,24,25,26]. Thus, the results of investigations into belt drive vibrations may be useful in analyses of conveyor belt vibrations. Such investigations of power transmission belts are based on models that represent frictional engagement between the tension member and the belt pulley [1,15,16,27,28,29]. In stationary conditions, when the tension member is considered as an elastic string, the expression describing the vibration frequency is as follows [19]:
where: n—natural number (base vibration frequency is calculated for n = 1), L—string length (m), T—tension force (N), and m—linear mass of the tension member (kg/m).
Unlike a string, the conveyor belt has a defined width B and extends a length l, which corresponds to the spacing between the idler sets. A commonly used parameter assigned to a particular belt is its surface weight mt. Equation (1) can be thus represented as follows:
where: B—belt width (m), and mt—unit surface weight of belt (kg/m2).
With allowance for the movement of the belt with a speed v on a curve, which is a sag line between two idler supports, an equivalent force in the belt can be introduced [2,30]:
and thus, the vibration frequency is:
where: v—belt speed (m/s); l—length between the idler sets (m).
The theoretical string model does not include the elastic and damping parameters, and this fact may be of importance in the case of a conveyor belt. Model [19] allows for the equivalent stiffness of the system by introducing the θ coefficient and includes a modified form of Equation (1) representing base vibration frequency (for n = 1):
where: c—speed of elastic wave in the belt (m/s), and θ—dimensionless stiffness coefficient of the system.
In Equation (5), the θ coefficient assumes a value from a range from 0 to 1, and elastic wave velocities in belts are more than tenfold higher than the belt velocities [18,31,32,33]. Therefore, an additional element of Equation (5), which expands relationship (1), tends to one and, in practice, is equal in form to the relationship for a stationary string. The application of Equation (5) requires finding the θ system stiffness coefficient, which is not easily identified for a belt installed on a conveyor.
The string model does not allow for the influence of material properties on the vibration frequency in the belt. The transverse vibration frequency is correlated with the propagation speed of the elastic wave in the conveyor belt, and this depends on the longitudinal modulus of elasticity and on the rheological parameters. An assumption can be made, therefore, that belt transverse vibrations depend on the above material parameters [2,33]. In some cases, models of vibration frequency in elastic tension members (including conveyor belts) should include flexural rigidity [34,35]. Belt elastic properties and flexural rigidity can be allowed for by using a model of a stationary simply supported beam having a given vibration frequency [19,36]:
where: EJ—flexural rigidity (Nm2).
As it is a simply supported beam, the tensile force is not allowed for in the equation. With allowance for the tensile force, the beam will have its base vibration frequency as follows:
In a manner analogous to the string, equivalent force in the belt can be introduced in Equation (6), and thus, the resultant relationship allows for belt speed:
The necessity to investigate theoretical models other than the string model is suggested in [37], in which differences from the string model were observed when the support spacing was limited. The above research employed a contactless device for measuring base eigenfrequency of vibrations in a power transmission belt. The main objective of the tests was to find a relationship between the vibration frequency and the belt tensioning. The study demonstrated such a possibility, albeit not for short-span belts, in which the string model did not allow precise results.
Except for the analytical models, analyses of vibrations in tension members, e.g., in power transmission belts, are based on numerical methods that employ the Finite Element Method (FEM) [38,39,40]. Numerical methods offer highly accurate results, but only in the case when both the boundary conditions of the systems and the material parameters are well defined. However, their precise identification is not always possible; therefore, laboratory tests still remain the basic source of information on vibrations in tension members. The modelling of transverse vibrations in conveyor belts is additionally hindered by the non-uniform cross-section of the belt and by the wide variability range of tensile forces when the belt is operated on the conveyor. Moreover, in the case of the upper strand, an allowance should be made for the variability of transverse loads due to the belt own mass, the mass of the transported material, and the belt movement.
Research described in [18] presents identifications of eigenfrequencies in a stationary conveyor belt with the use of a step response method. A pretensioned belt was installed in a device for testing dynamic characteristics and for exciting vibrations by cyclical impacts of known frequency. Sensors located in selected points on the belt recorded the response signal, and this was used to determine the stress wave speed and the belt vibration frequency. The idea behind the measurement rig was to allow the use of displacement or acceleration sensors. The tests were performed for two types of belts, 3.2 m in length and 0.25 m in width, and for belt tension force from 6 kN to 20 kN. Within the investigated range of tensile forces, and for a steel-cord belt having a nominal strength of 1000 kN/m, the measured mean eigenfrequency was 14.45 Hz, and for a textile belt having a strength of 800 kN/m, the mean eigenfrequency was 11.75 Hz. In the case of both belts, the frequency increase was observed to be non-linear with respect to the increase in the belt tension force.
The literature offers a limited number of publications on measuring transverse vibration in a moving conveyor belt. A belt in motion is a significant complication in measurements. One of the proposed methods is based on contactless electrostatic sensors, which react to both longitudinal and transverse belt movement [41]. This method has been developed mainly with a view of continuous measurements of vibrations for diagnostic purposes and for predicting the behaviour of belt drives in industrial conditions. The tests indicated that the signal from the sensor is dominated by the transverse vibrations of the belt. Another measurement method consisted in using images from a high-speed industrial camera to identify transverse vibration in a power transmission chain [42]. The lens of the camera followed markers positioned on the moving chain, and the image was continuously processed with the use of computer software.
2.2. Equipment and Methodology
The object of the tests was a conveyor belt with the core comprising steel cords and with a nominal tensile strength of 800 kN/m. A steel belt is commonly used in most opencast mines, where noise is particularly annoying [22]. The nominal belt strength was limited by the drive power of the test rig and the dimensions of the drums. The belt parameters important for calculating theoretical vibration models are presented in the table below (Table 1).
The flexural rigidity EJ was calculated in a simple manner by measuring the sag of the free end of a belt sample restrained on one end. The measured sag was due to only the own mass of the belt.
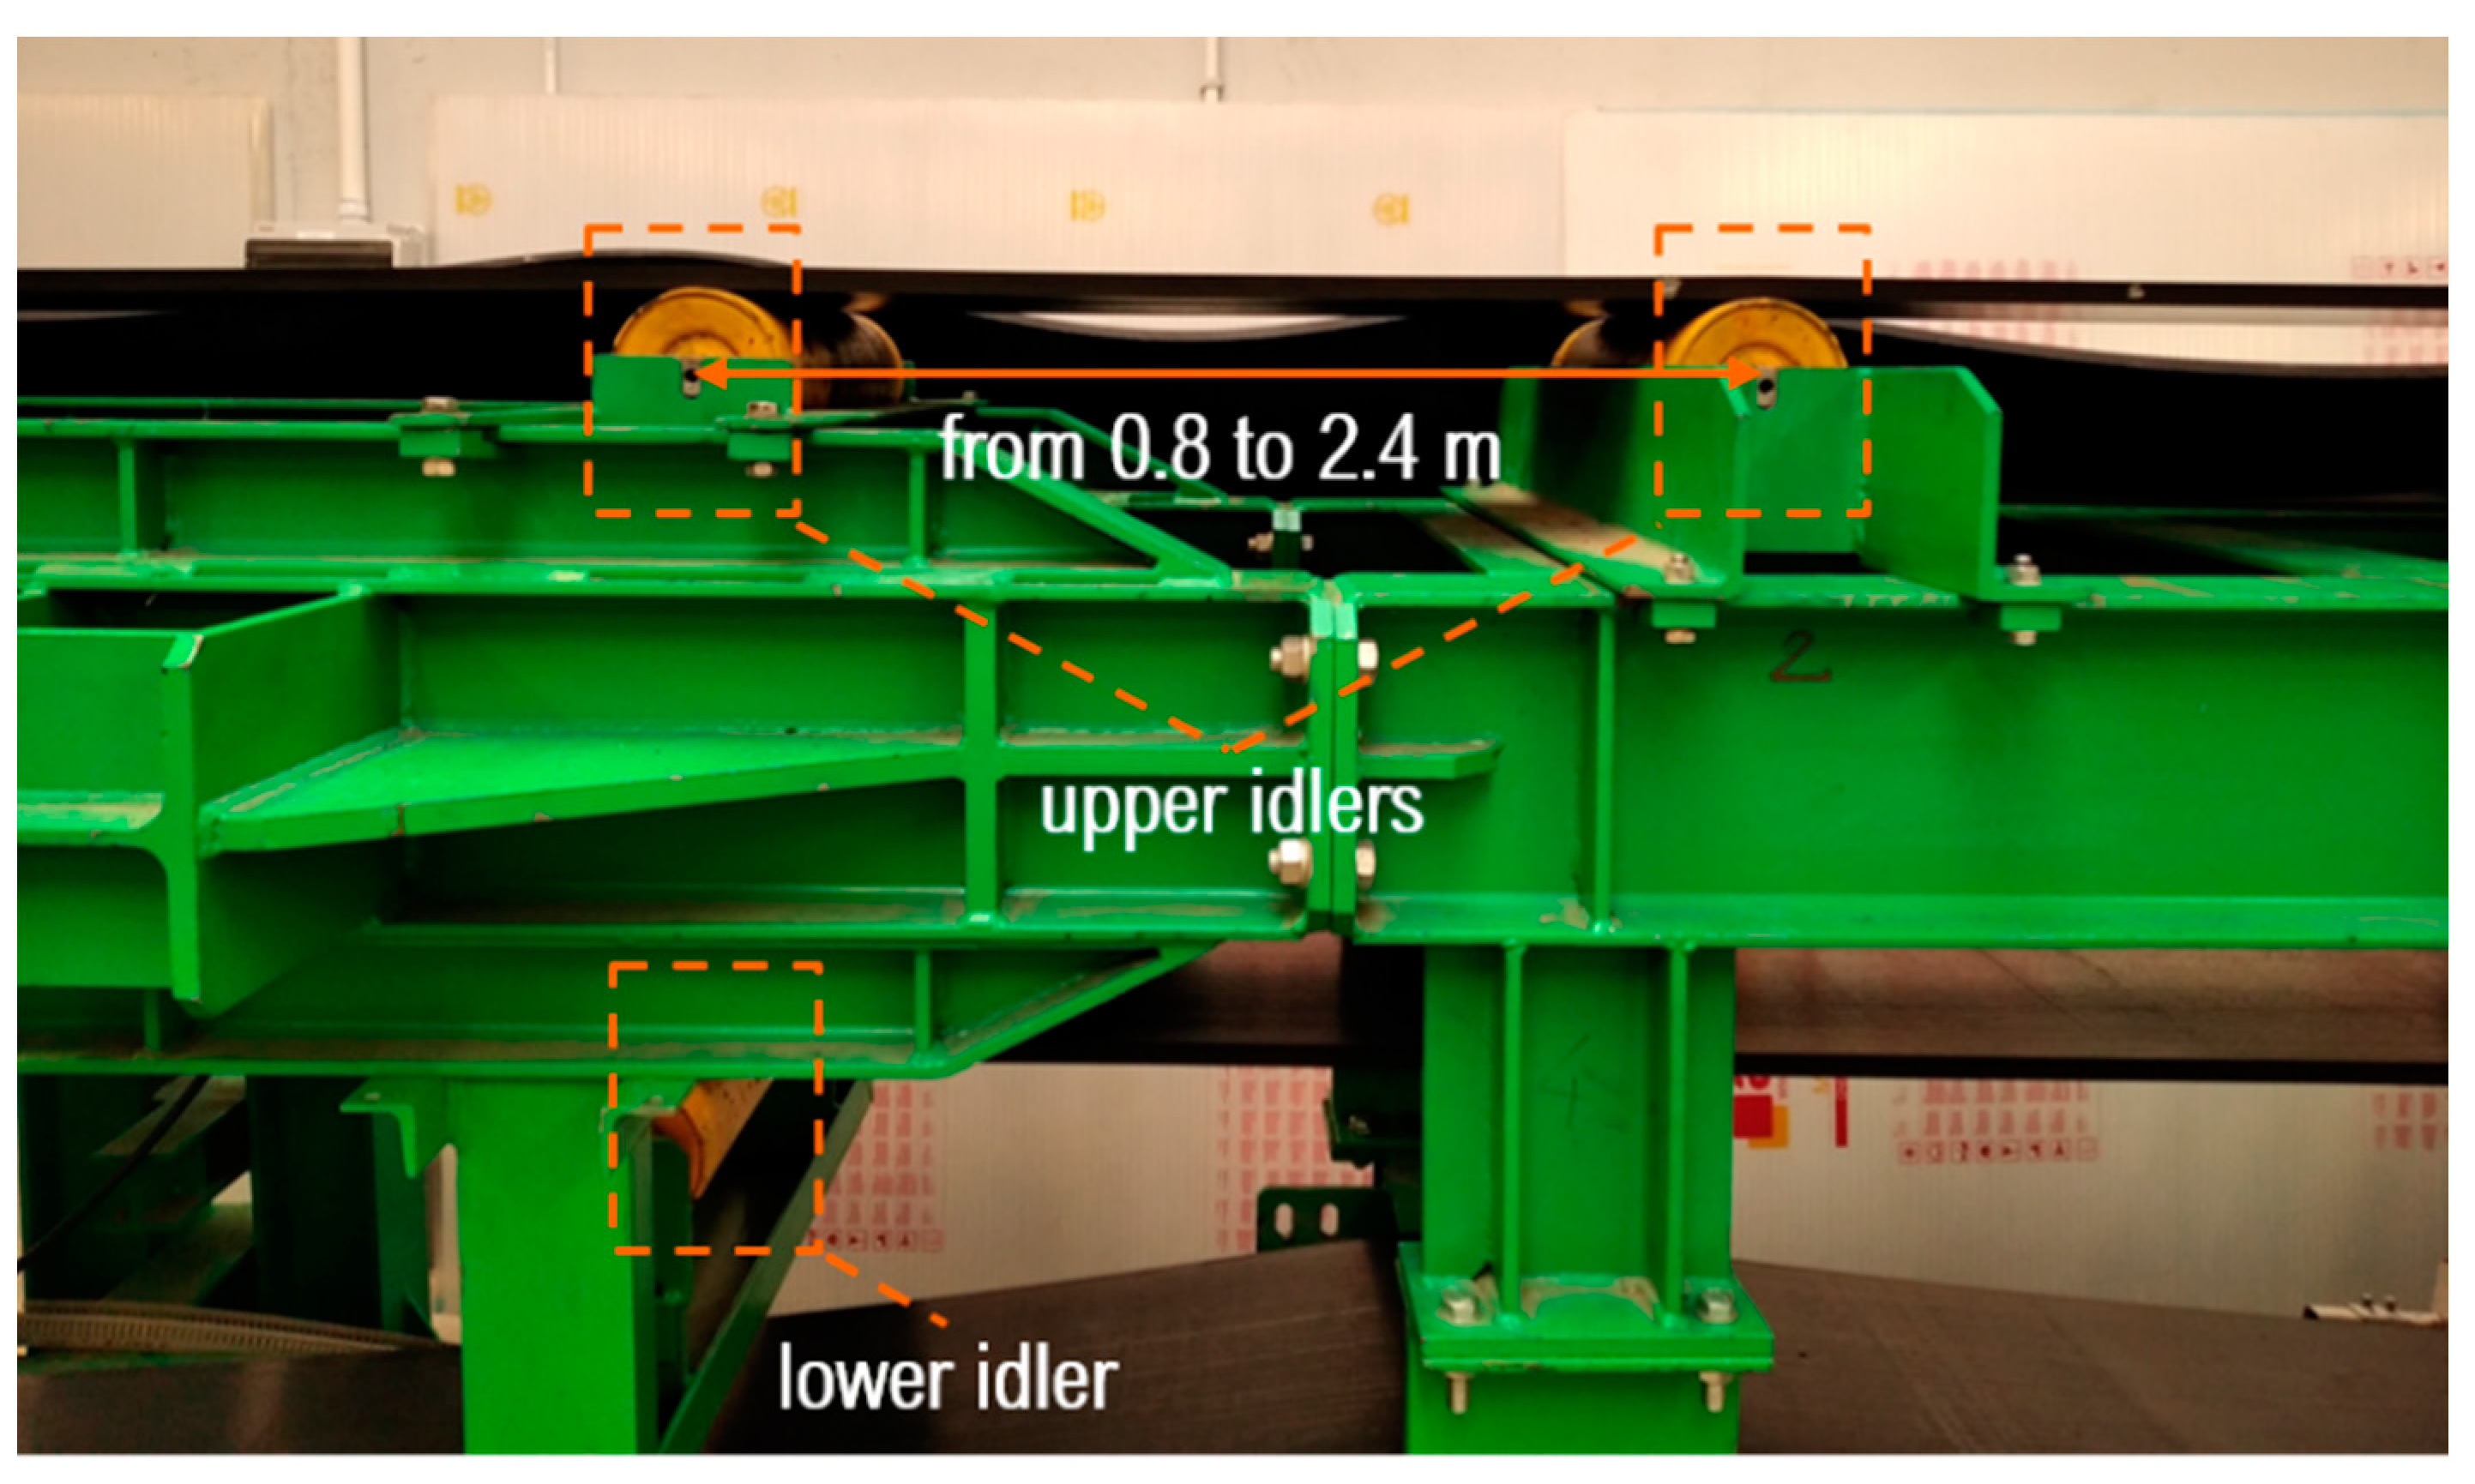
The laboratory test rig consists of two pulleys—the drive pulley and the return pulley, spaced 5 m from each other. The upper strand can be supported by up to three idler supports (the idler dimensions being ϕ130 × 500) with adjustable spacing between the idlers. The return pulley is tensioned with the use of two hydraulic actuators. Hydraulic regulation allows for stable tensile force in steady motion. This fact is advantageous because the frequency of transverse vibrations depends on the tensile force in the belt. The measurements of the belt were performed with the use of two sensors installed on the two sides of the tensioning pulley KM1603, with a measuring range equal to 50 kN, and with a maximum relative linearity error at 0.03%. The sensors provided measurements with a sensitivity of 2 mV/V (for a nominal power supply of 5 V). Belt speed was measured with incremental encoders with an accuracy of up to 0.02 m/s [43]. Figure 1 shows the test rig with indicated locations of idler supports.
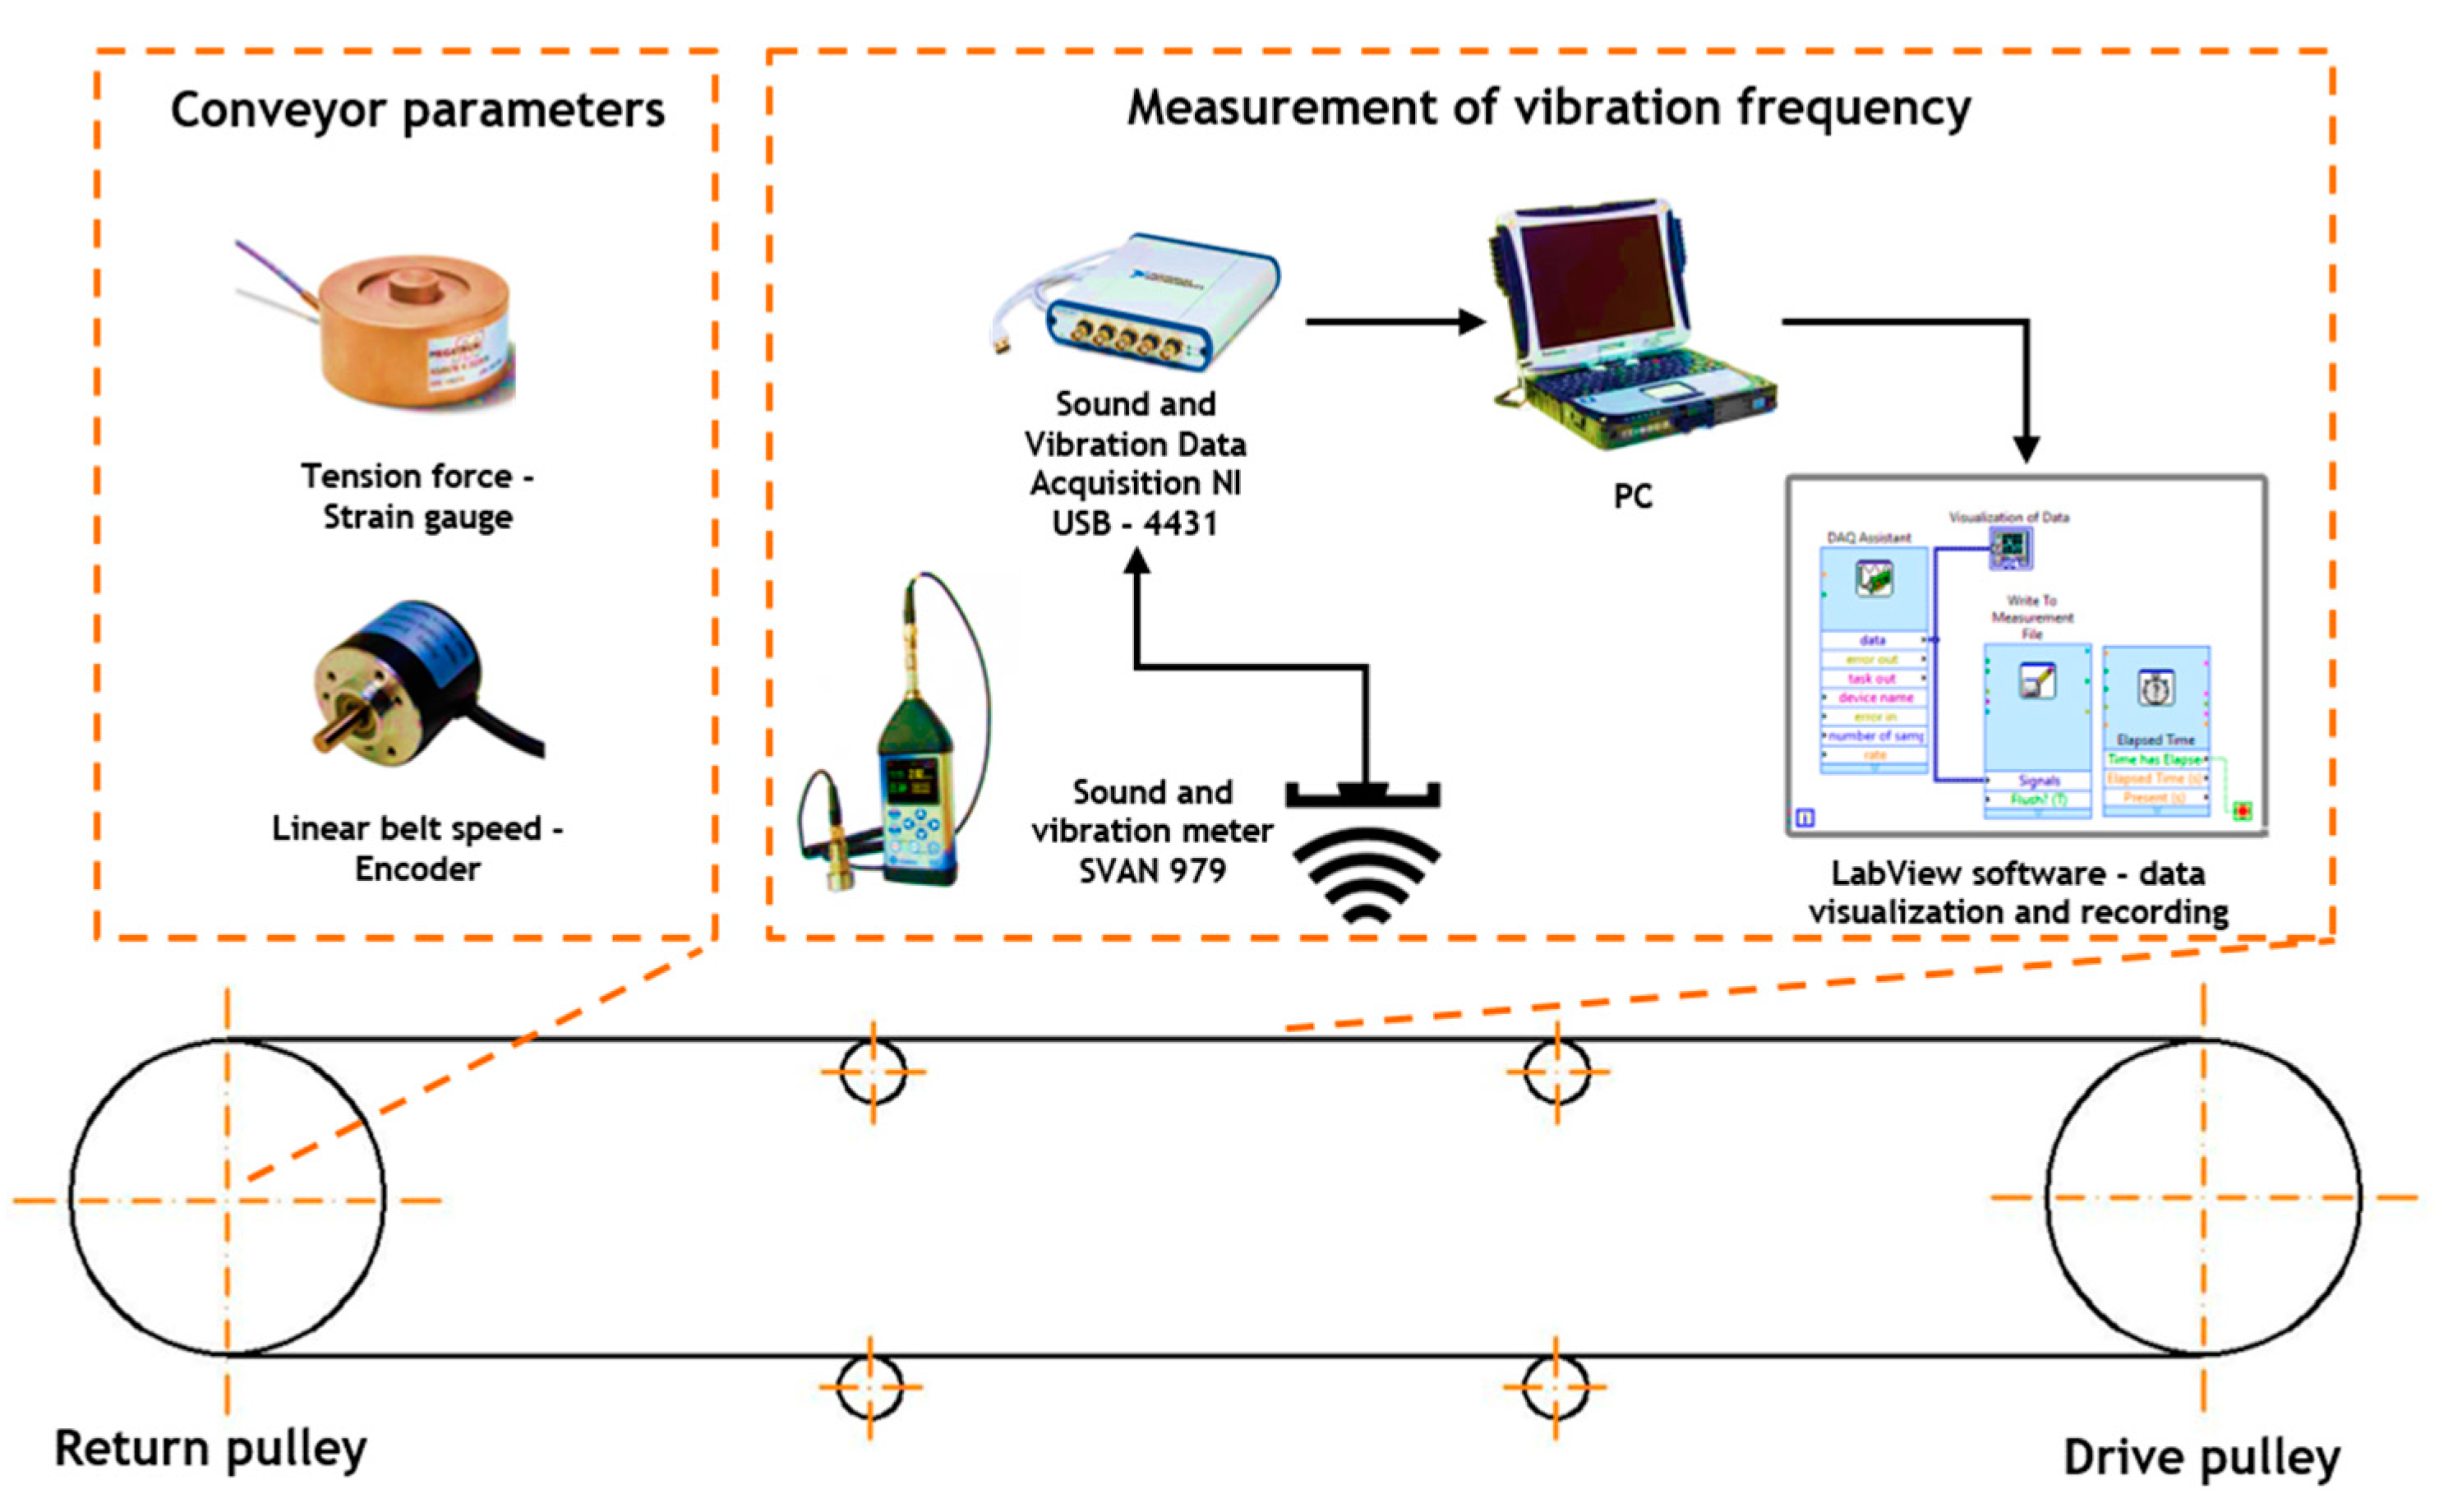
The tests were performed with the use of the directional sound and vibration meter SVAN979 by Svantek ltd (Svantek, Warsaw, Poland), which was positioned in the vicinity of the upper strand, in the centre, between the idler supports. The head of the meter allows measurements from 0.5 Hz. Belt vibrations cause cyclical changes of acoustic pressure, which are the input signals in the meter. A wide measurement range of the meter (from 0.5 Hz to 20 kHz) and the sensitivity of the head (4 mV/Pa) allow for the recording of local changes of acoustic pressure within the area of the vibrating belt. The frequency of these changes corresponds to the belt vibration frequency. The sensor located in the centre (central point between the supports) allows the highest accuracy of the measurement because records are made of maximum vibration amplitudes. The directional operation of the measuring head is of particular importance, as the recorded changes are only those due to belt vertical movement. The signal from the meter was sampled at a frequency of 10 kHz, with the use of the NI USB-4432 data acquisition system. The signal was further processed in LabView. Figure 2 is the diagram of the measurement system.
The final stage in the processing of the results was to use signal analysis tools in order to identify the base frequency of transverse vibrations in the belt (Figure 3). Theoretical equations and the known parameters of the belt served as a basis to calculate the expected frequency ranges in which the belt vibration frequency is located. Preliminary identification of such ranges is advantageous in selecting proper frequencies. The test rig was operated in an acoustically isolated room, which allowed clear spectra of the recorded signal. Based on the distance between the meter and the belt, the spectrum can be assumed to be dominated by the frequencies related to the belt transverse vibrations. The theoretically identified areas were searched for frequencies of dominant amplitudes (Figure 3b). The input signal (Figure 3a) was subsequently filtered with the use of a band-pass filter, whose parameters were defined on the basis of a prior spectral analysis. The result was a time signal, which could be directly related to the amplitude of the belt transverse vibrations (Figure 3c). The analysis of the spectrum of the filtered signal allowed for the isolation of those areas in which the dominant frequencies are related to belt transverse vibrations, along with the neighbourhoods in which the noise is low depending on the parameters of the applied filter (Figure 3d).
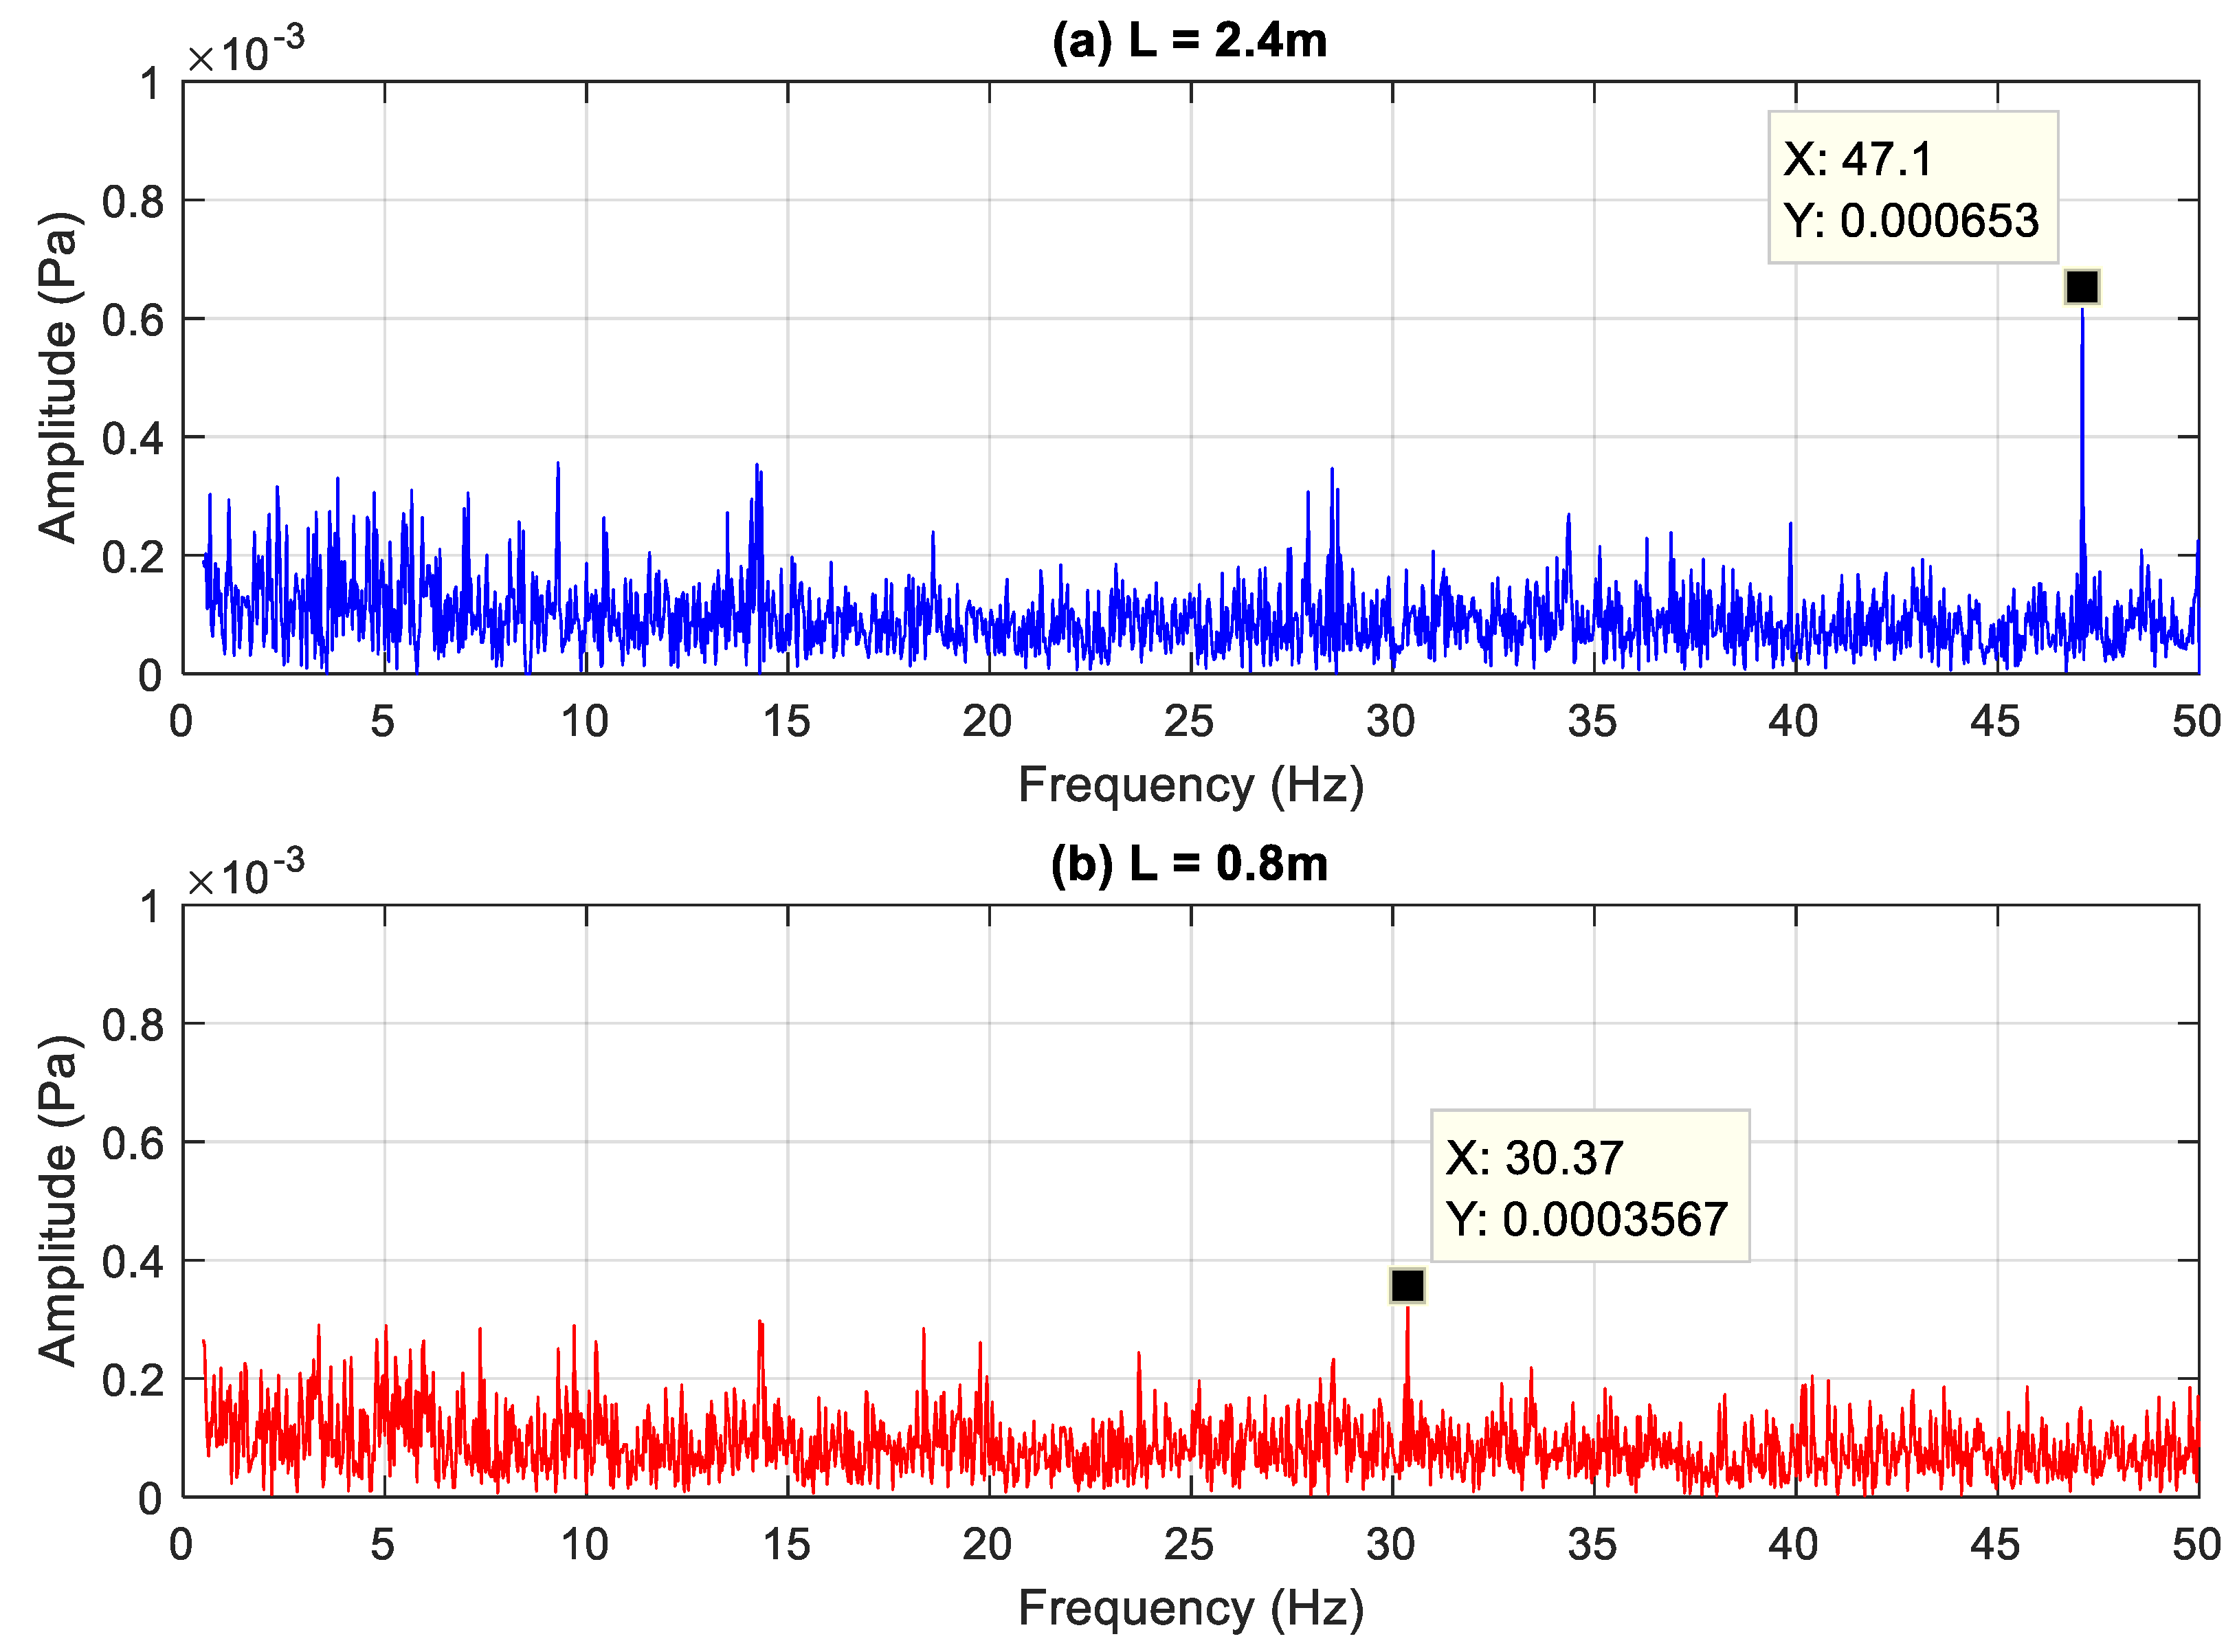
Despite the lack of direct contact between the measuring head and the moving belt, the transverse vibration frequencies are visible in the obtained frequency characteristics. In the case of greater distances (Figure 4a), relatively high vibration amplitudes are observed, which translate into significant changes of acoustic pressure, as recorded by the sensor. In the case of small distances, the obtained spectra are less clear, and the concentration of noise in the very low frequency range hinders the identification of the proper frequency of belt transverse vibrations (Figure 4b). In this case, the interpretation of the results requires a close analysis of the spectrum.
3. Results
The test plan involved changes of the three parameters of influence: belt tensile force, belt speed, and idler support spacing. The travelling of the hydraulic actuators, which move the return pulley on the test rig, allows for adjustments of forces in the belt within a range from 20 kN to 60 kN. Five measurement series were performed at 10 kN intervals. The maximum belt speed is limited by the parameters of the drive system and is approx. 4 m/s. The tests were performed for 5 belt speeds, in the range of 20% to 100% of the maximum speed allowed for by the drive system. In the case of the measurement series in which the idler support spacing was changed from 0.8 m to 2.4 m, the modifications were inspired by typical spacing values used in practice [44]. These 3 parameters are the basic information about the working condition of the conveyor. Additionally, their significance is confirmed by theoretical equations. Presumably, the spacing of the idler supports can have a significant effect on the belt stiffness, which is important for analytical calculations.
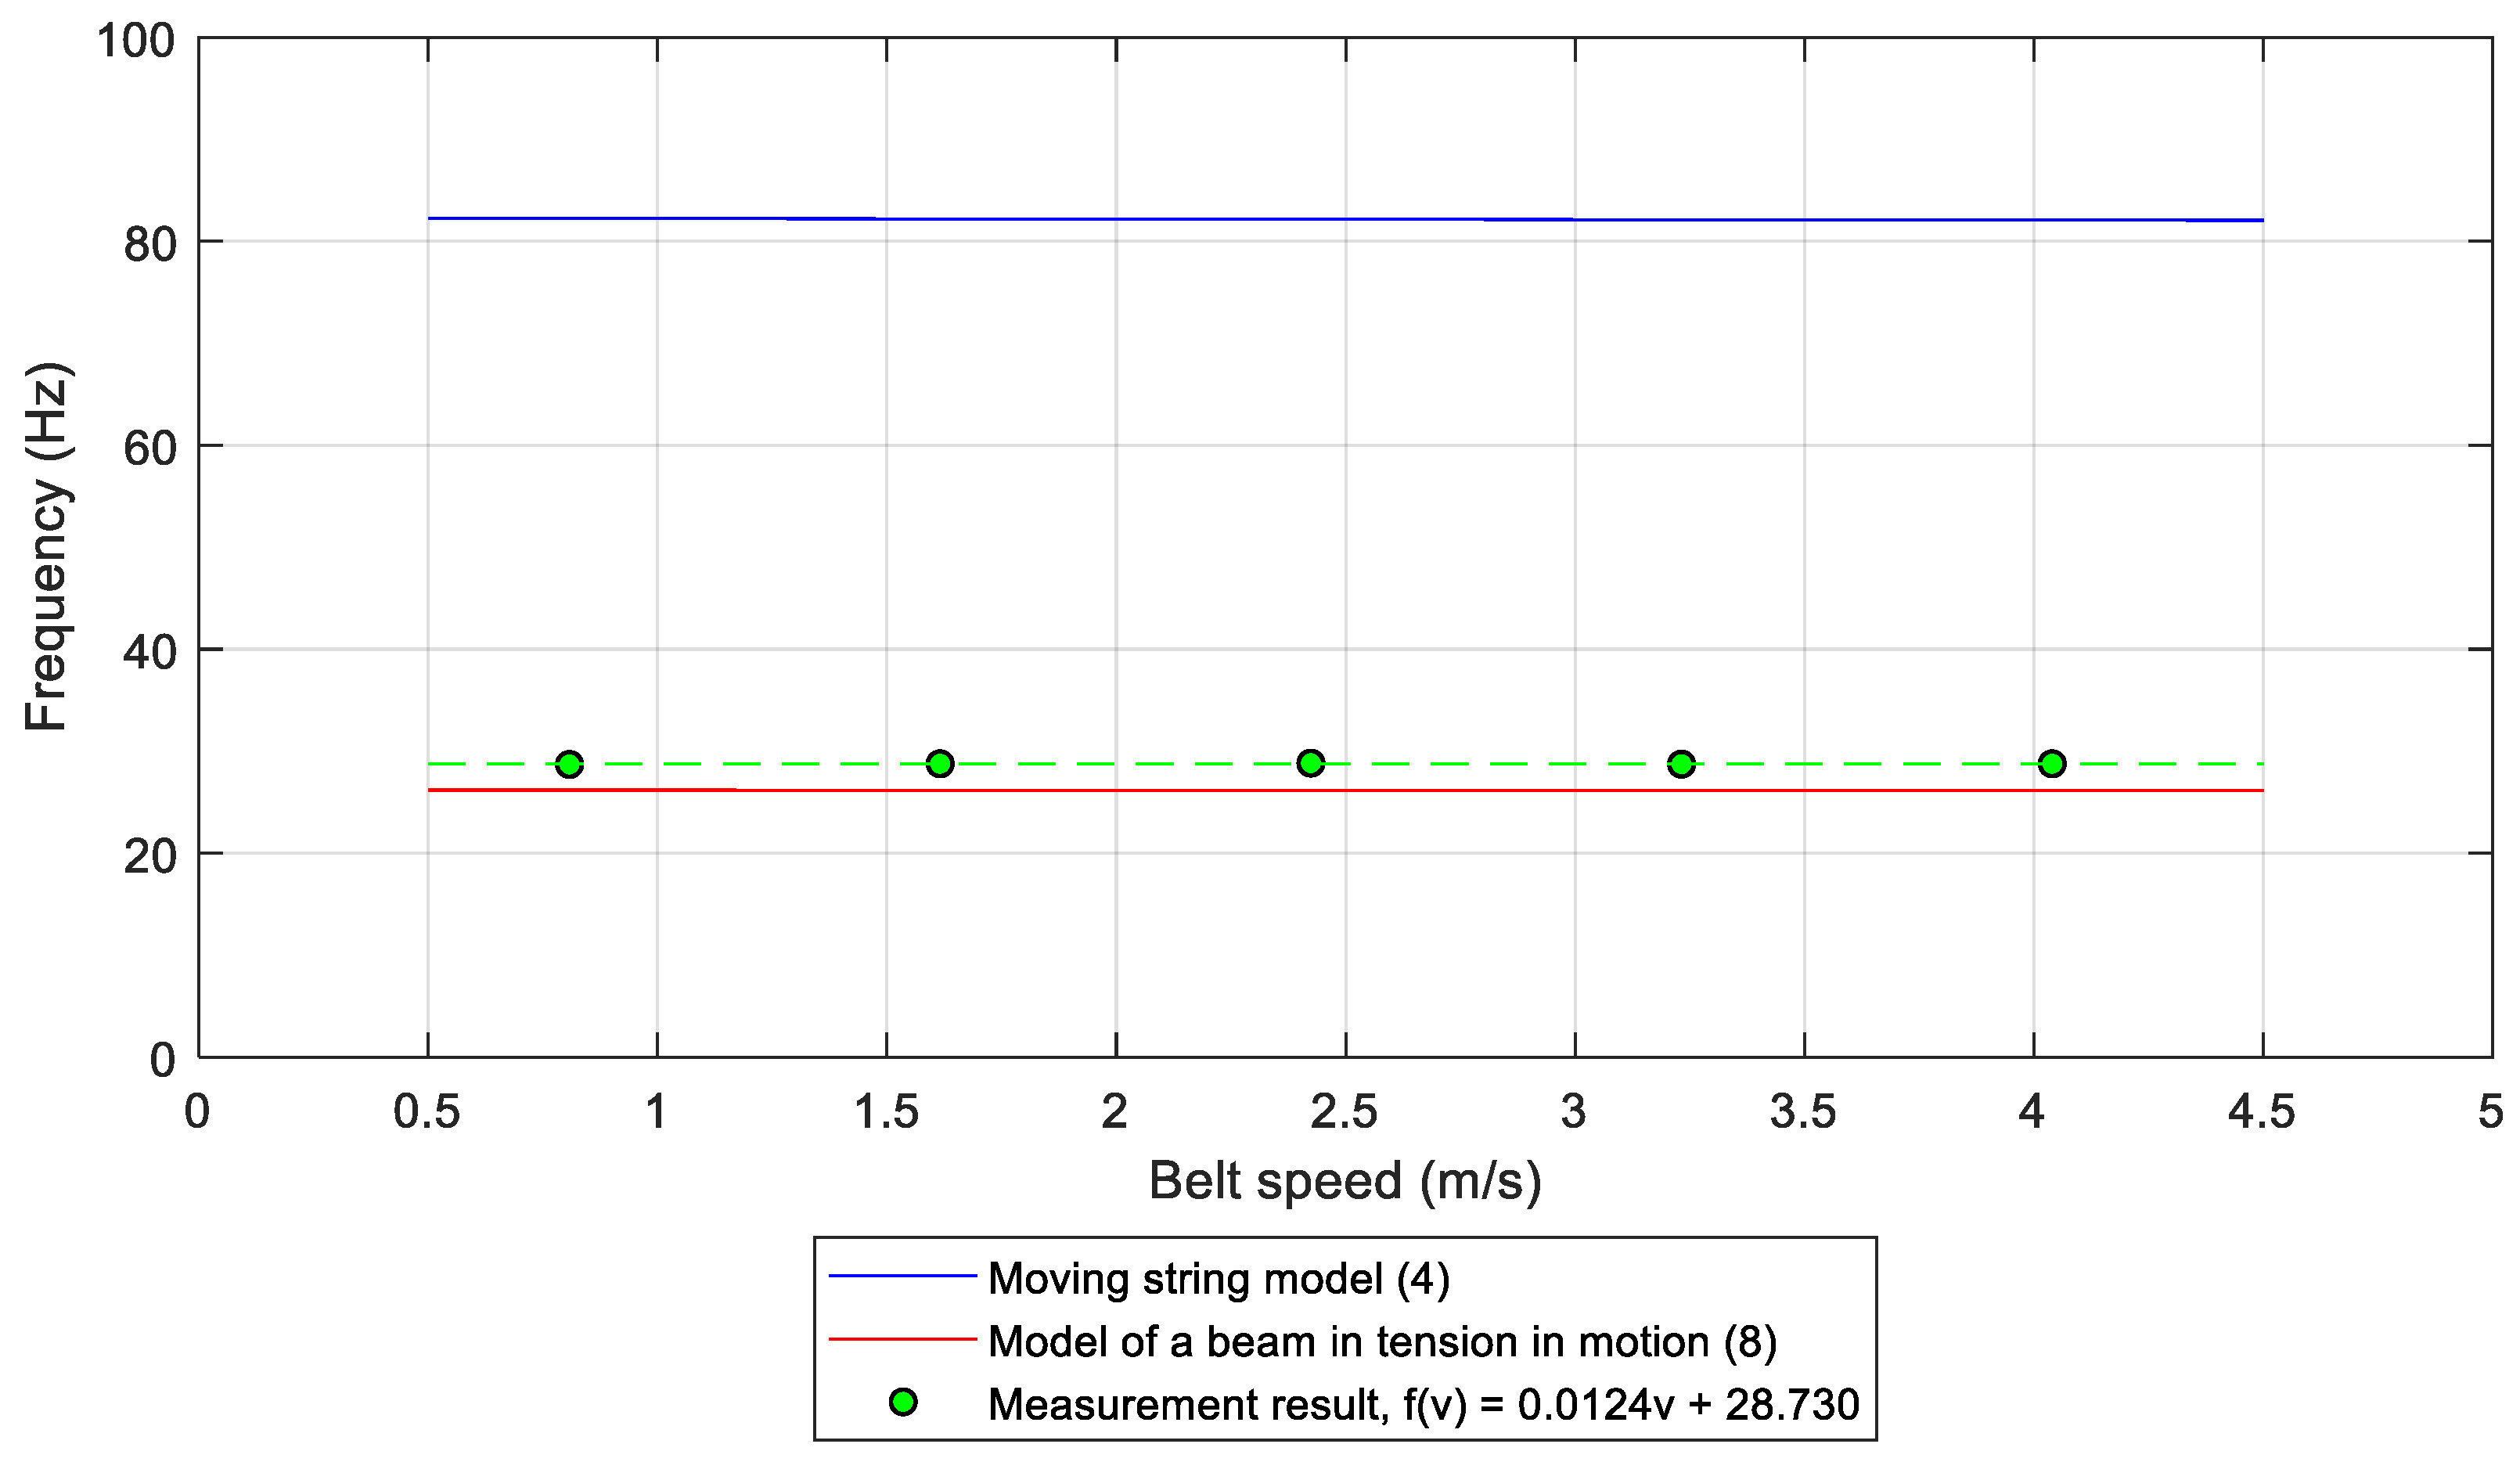
The influence of the belt speed was observed to be negligible. This fact is demonstrated in the graph of Figure 5. In this particular case, for L = 1.2 m, the measurement results are similar to the beam model and are significantly different than the string model, albeit with areas in which reverse proportions are found. Both the theoretical models and the measurement results indicate a minimal, practically negligible decrease of the belt vibration frequency in relation to the belt speed. For this reason, the influence of belt speed is not considered in further analyses.
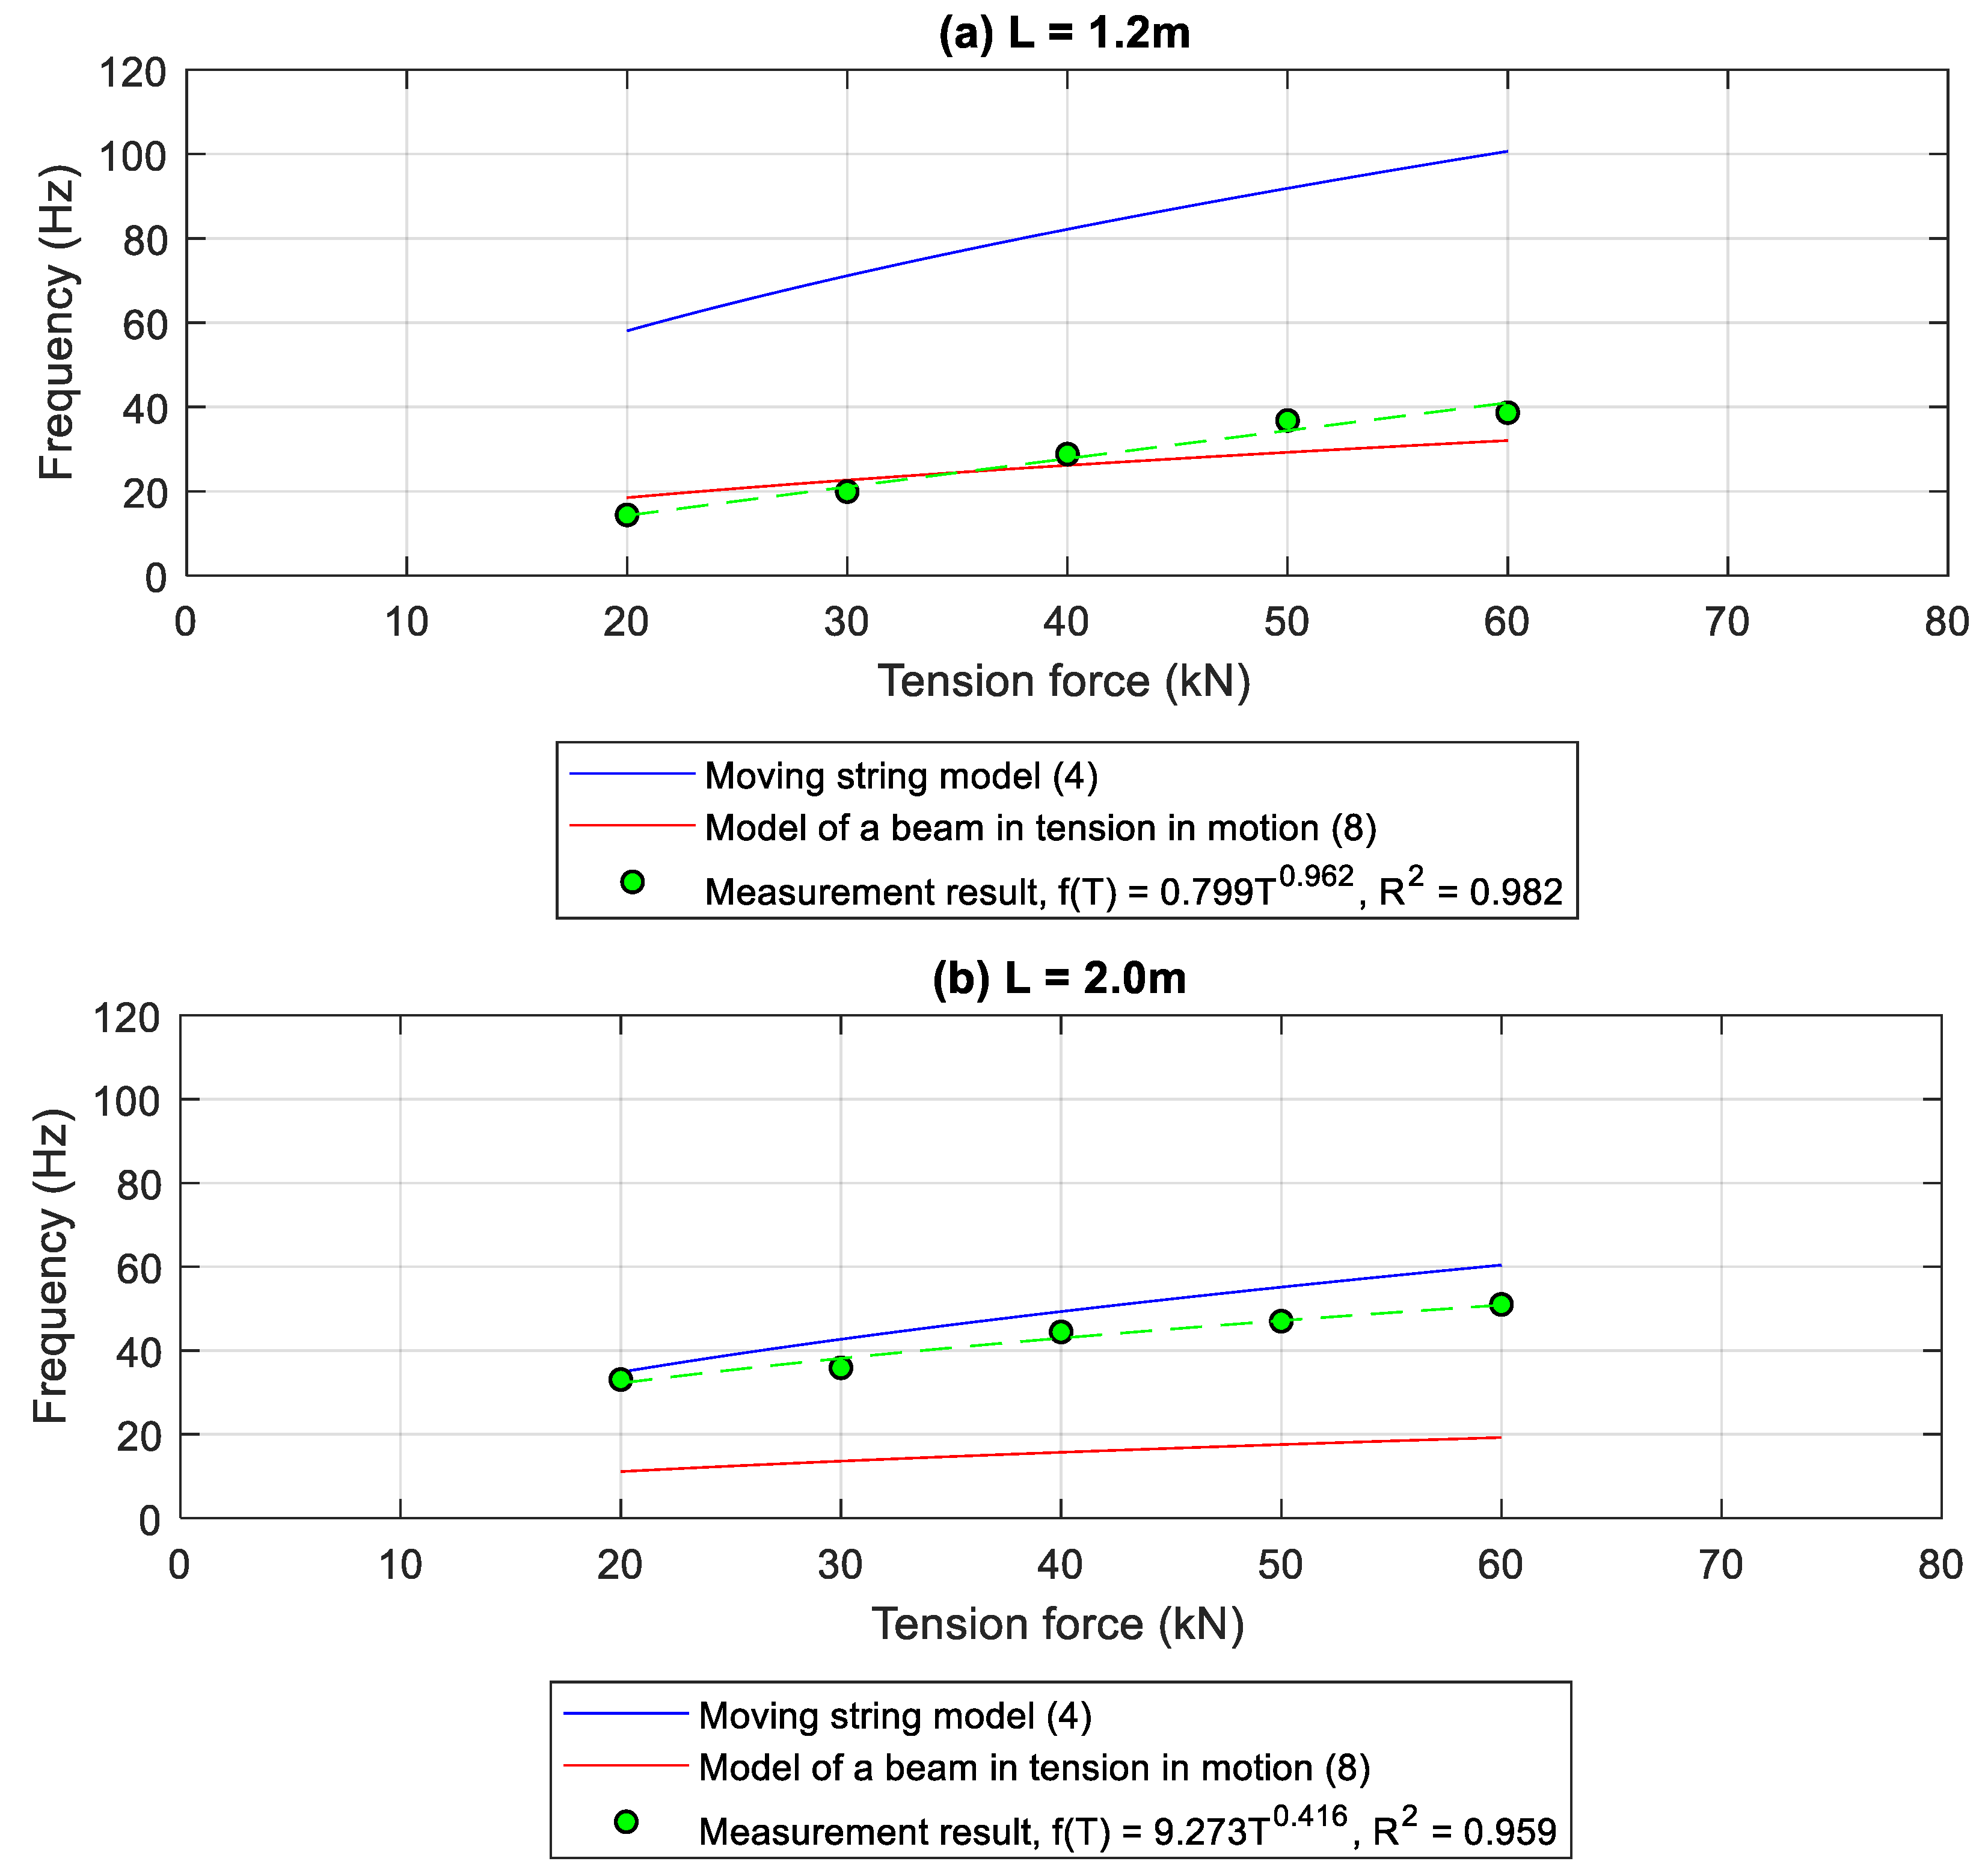
Figure 6 shows the frequencies of belt transverse vibrations as a function of belt tensile force for two selected idler spacing values (L = 1.2 m—Figure 6a and L = 2 m—Figure 6b). The two diagrams show both the theoretical relationships for the two analysed models and the averaged measurement points. The theoretical relationships are power functions in the form of y = ax^(b), where the exponent is 0.5, and therefore, the set of the measurement points was approximated with curves having an identical form. As a result, high correlation coefficients of empirical functions R2 were obtained. An analogical procedure was performed for the remaining measurements. The approximations of the measurement results were used to identify the differences between these functions and the theoretical relationships. The differences between the theoretical models and the measurement results are shown in Table 2. The table presents Mean Absolute Error (MAE—the error of the model in relation to the measurement result) for all of the investigated idler spacing values.
Both models differ from the measurement results less within the range of small forces (20 kN) than within the range of great forces (60 kN).
4. Discussion
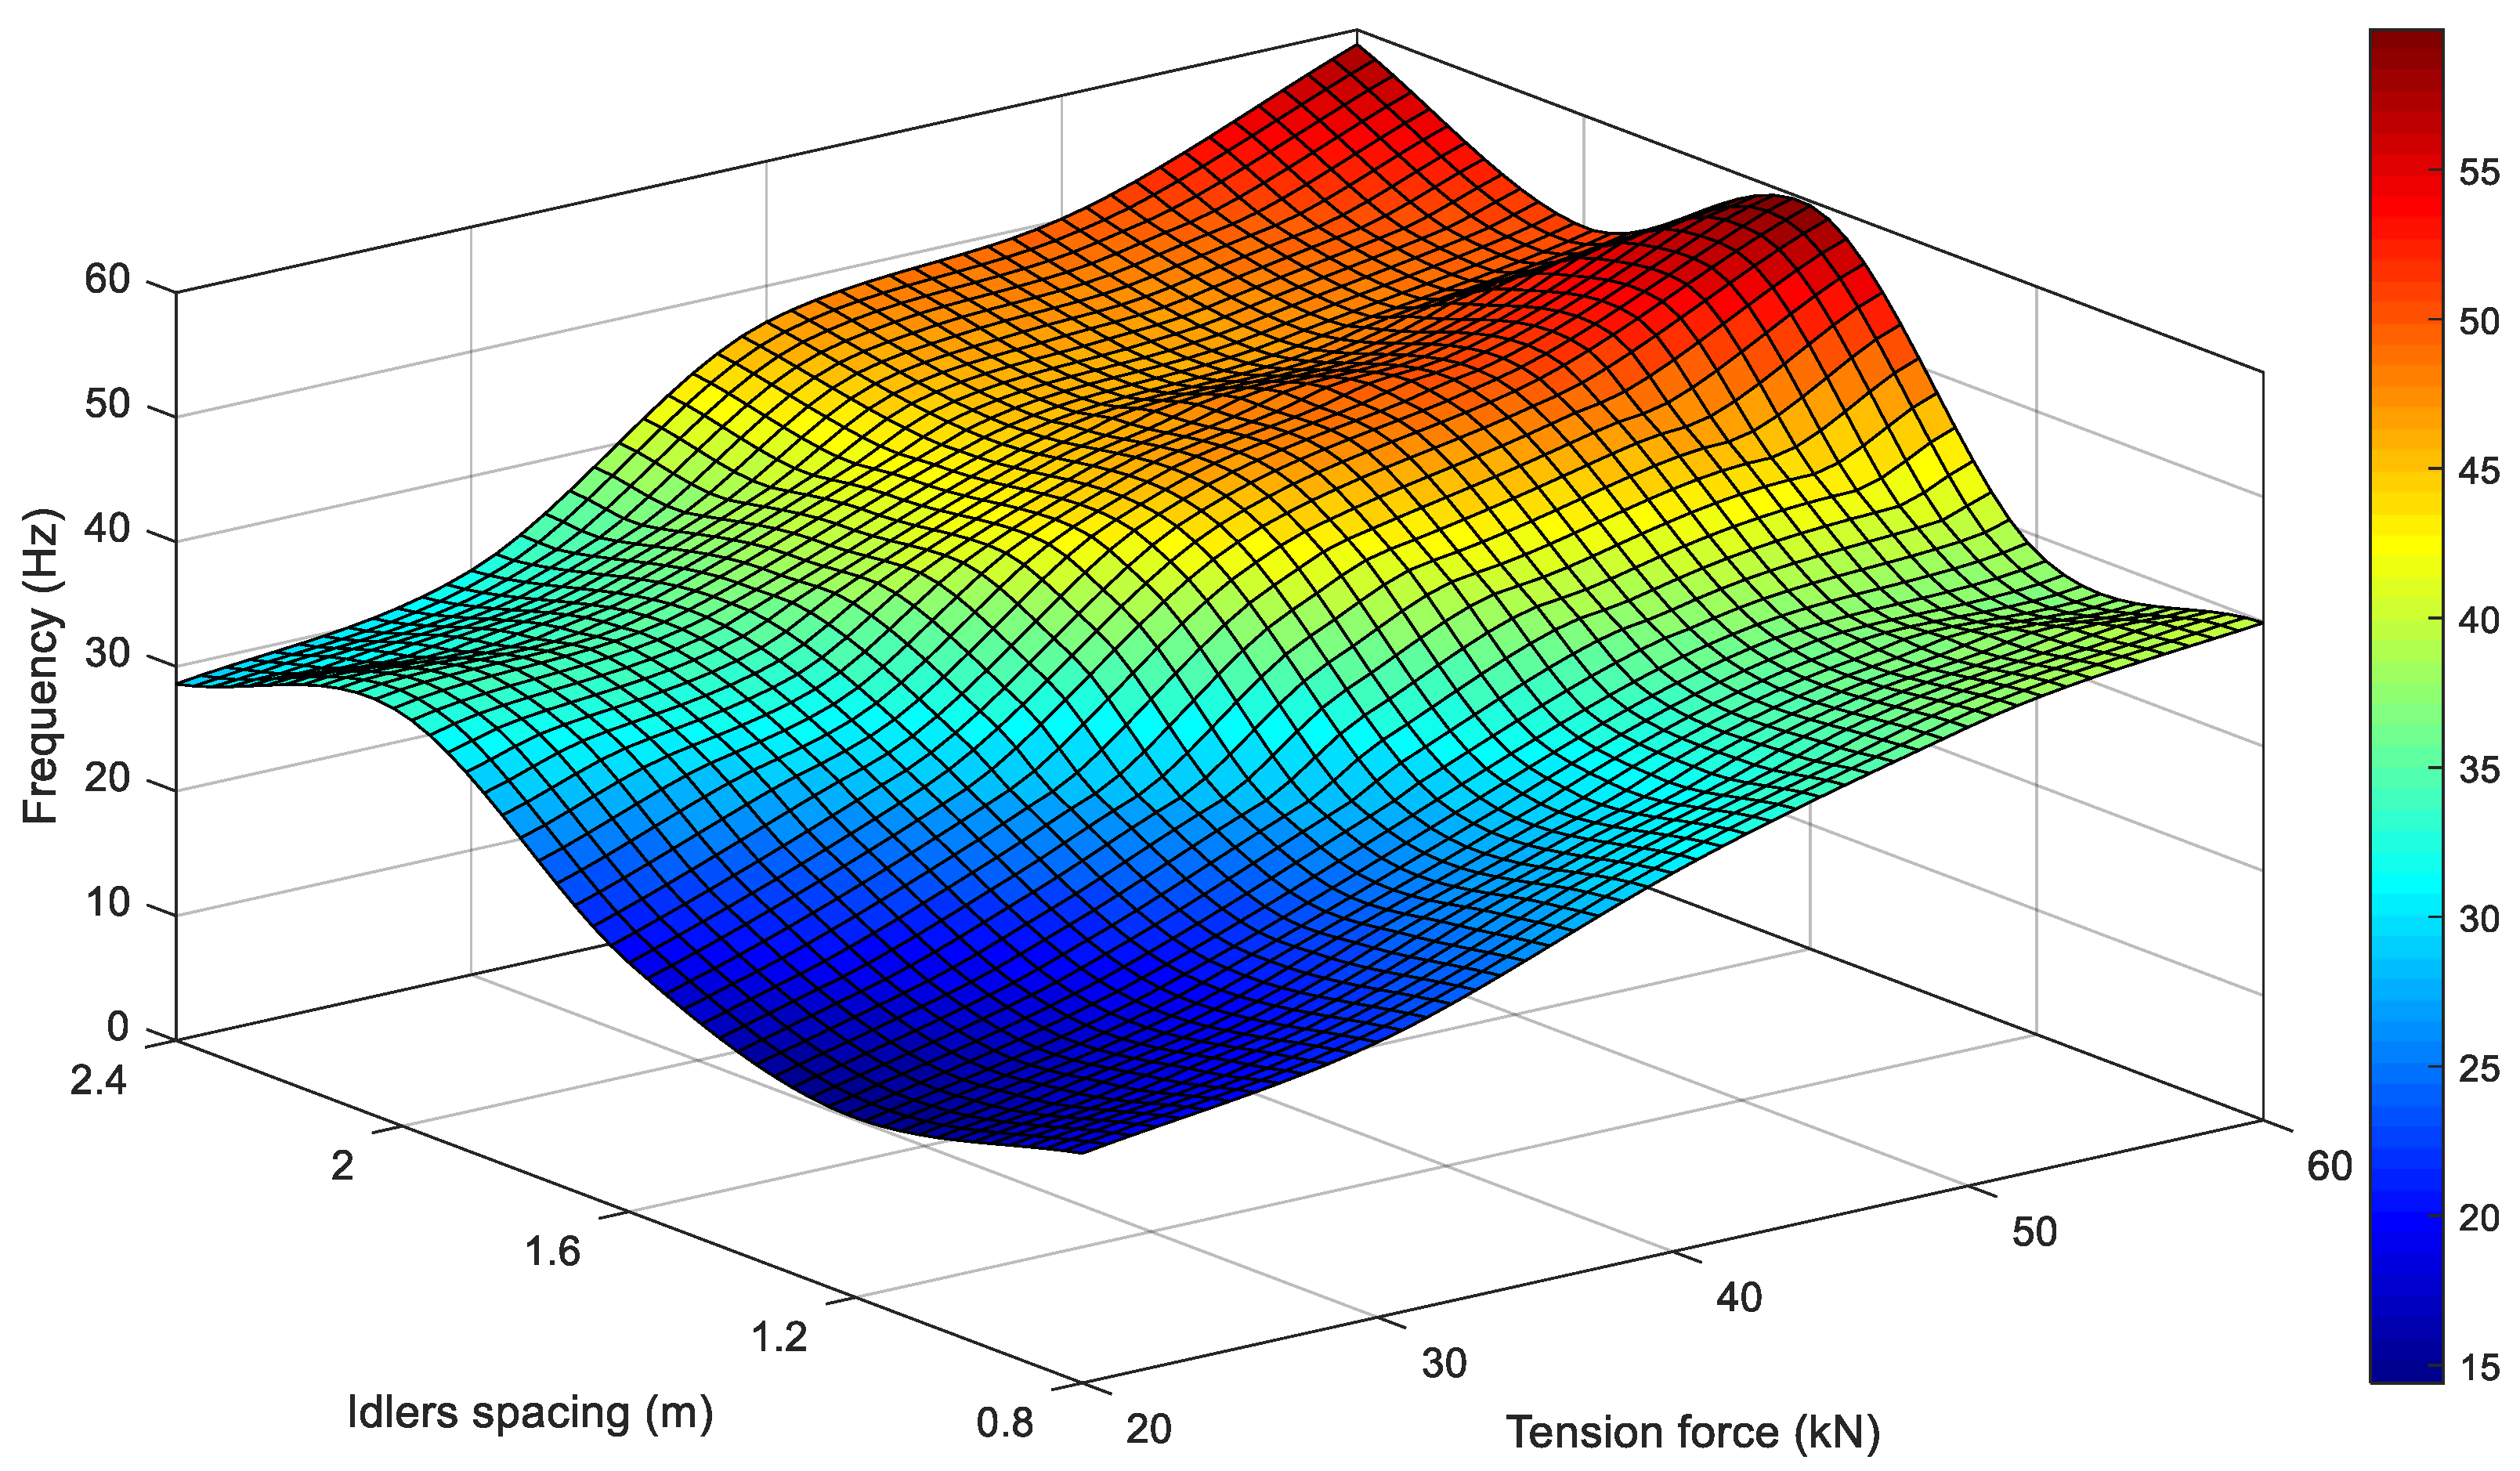
The results shown in the diagrams of Figure 6 and in Table 2 do not provide a definite answer to the question of which of the two analysed models better represents belt transverse vibrations. Areas convergent to both the string model and the beam model are identified depending on the distance between the idler supports. The 3D plot in Figure 7 shows a surface resulting from the approximation of the measurement results of belt transverse vibration frequencies as a function of tensile force and idler spacing. The surface was obtained by quadratic interpolation of the points identified in the measurements. In accordance with the theoretical relationships, the surface for the two models should be monotonically increasing together with an increase in force and monotonically decreasing together with an increase in support spacing. However, some areas clearly show differences from the theoretical assumptions, manifested in local minima and maxima on the surface. This fact may be accounted for by the diagram shown in Figure 8, which is plotted for the analysis of the influence of the idler spacing.
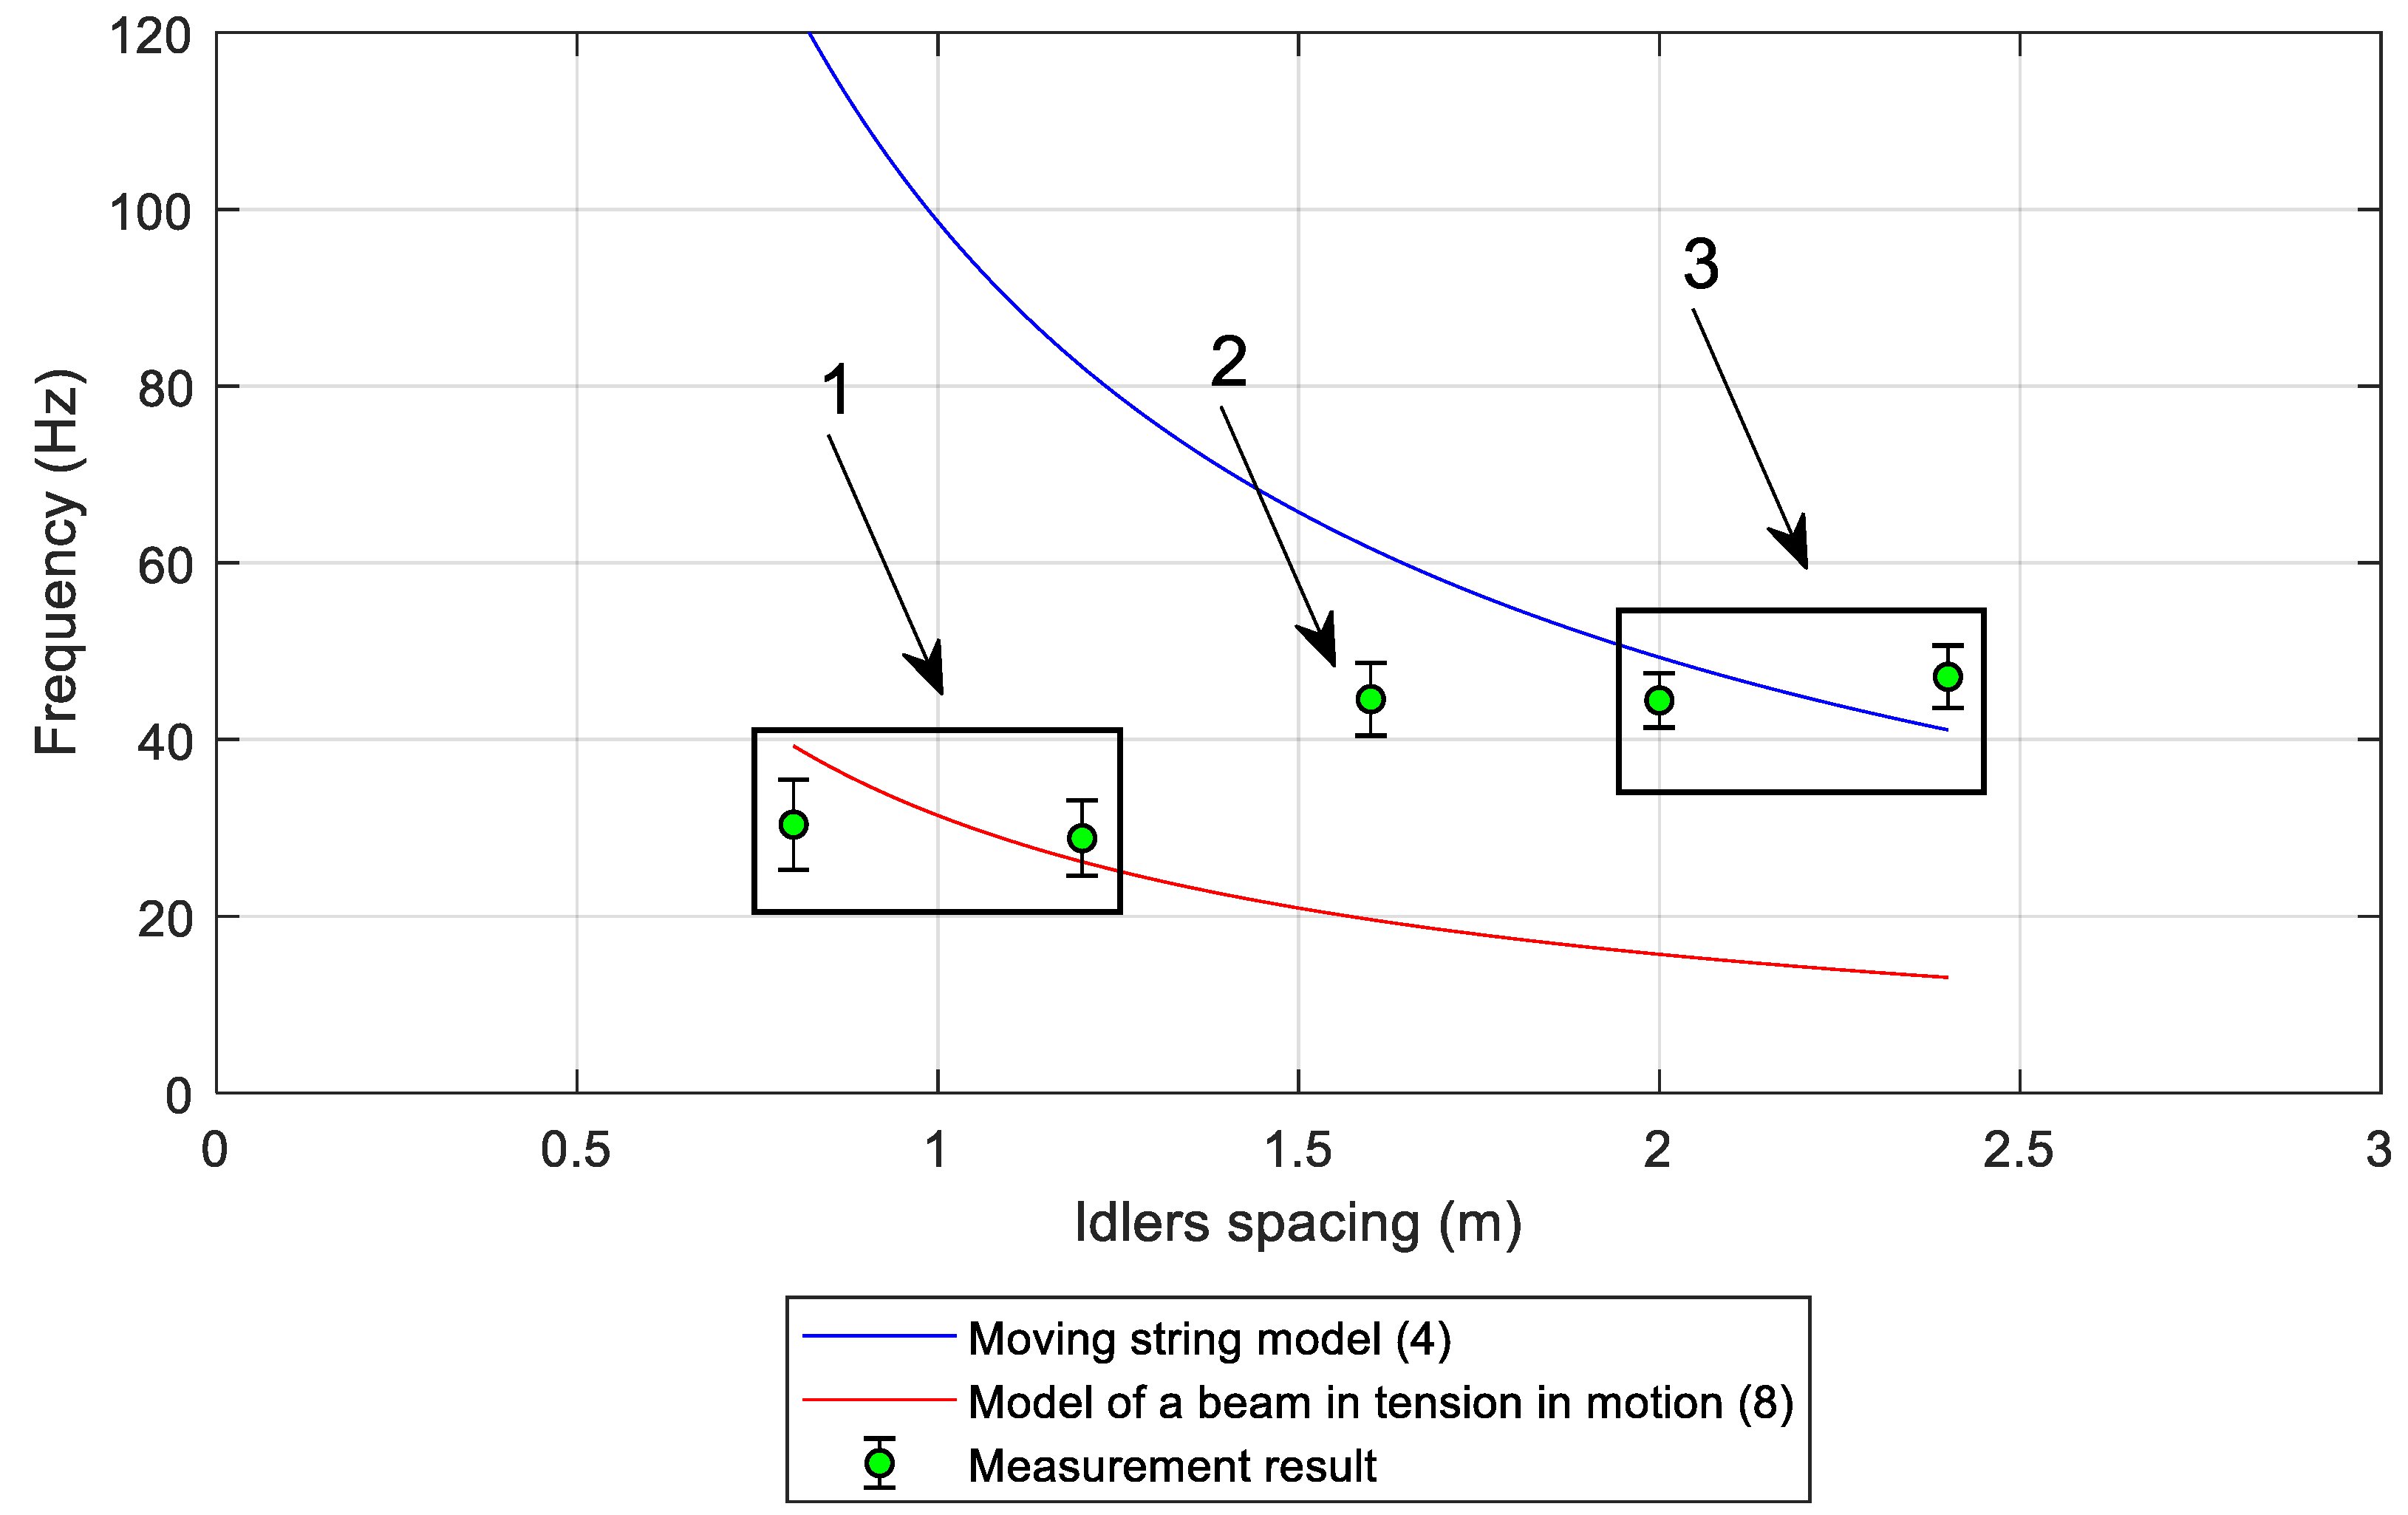
This analysis was based on the mean force of 40 kN obtained in the measurements and it represents the influence of idler spacing on the frequency of belt transverse vibrations. Five averaged measurement points for this level of force together with the confidence intervals were compared with the theoretical relationships (Figure 8). The area indicated with number 3 in Figure 8 shows similarities between the measurement results and the string model for high idler spacing values, while the area indicated with number 1 shows similarities with the beam model for low idler spacing values. Point 2 in Figure 8 is located on the boundary between the two areas. For the entire range of forces in the belt, the set of points located on the boundary of the areas similar to the string model and to the beam model form local minima on the surface of the 3D plot (Figure 7).
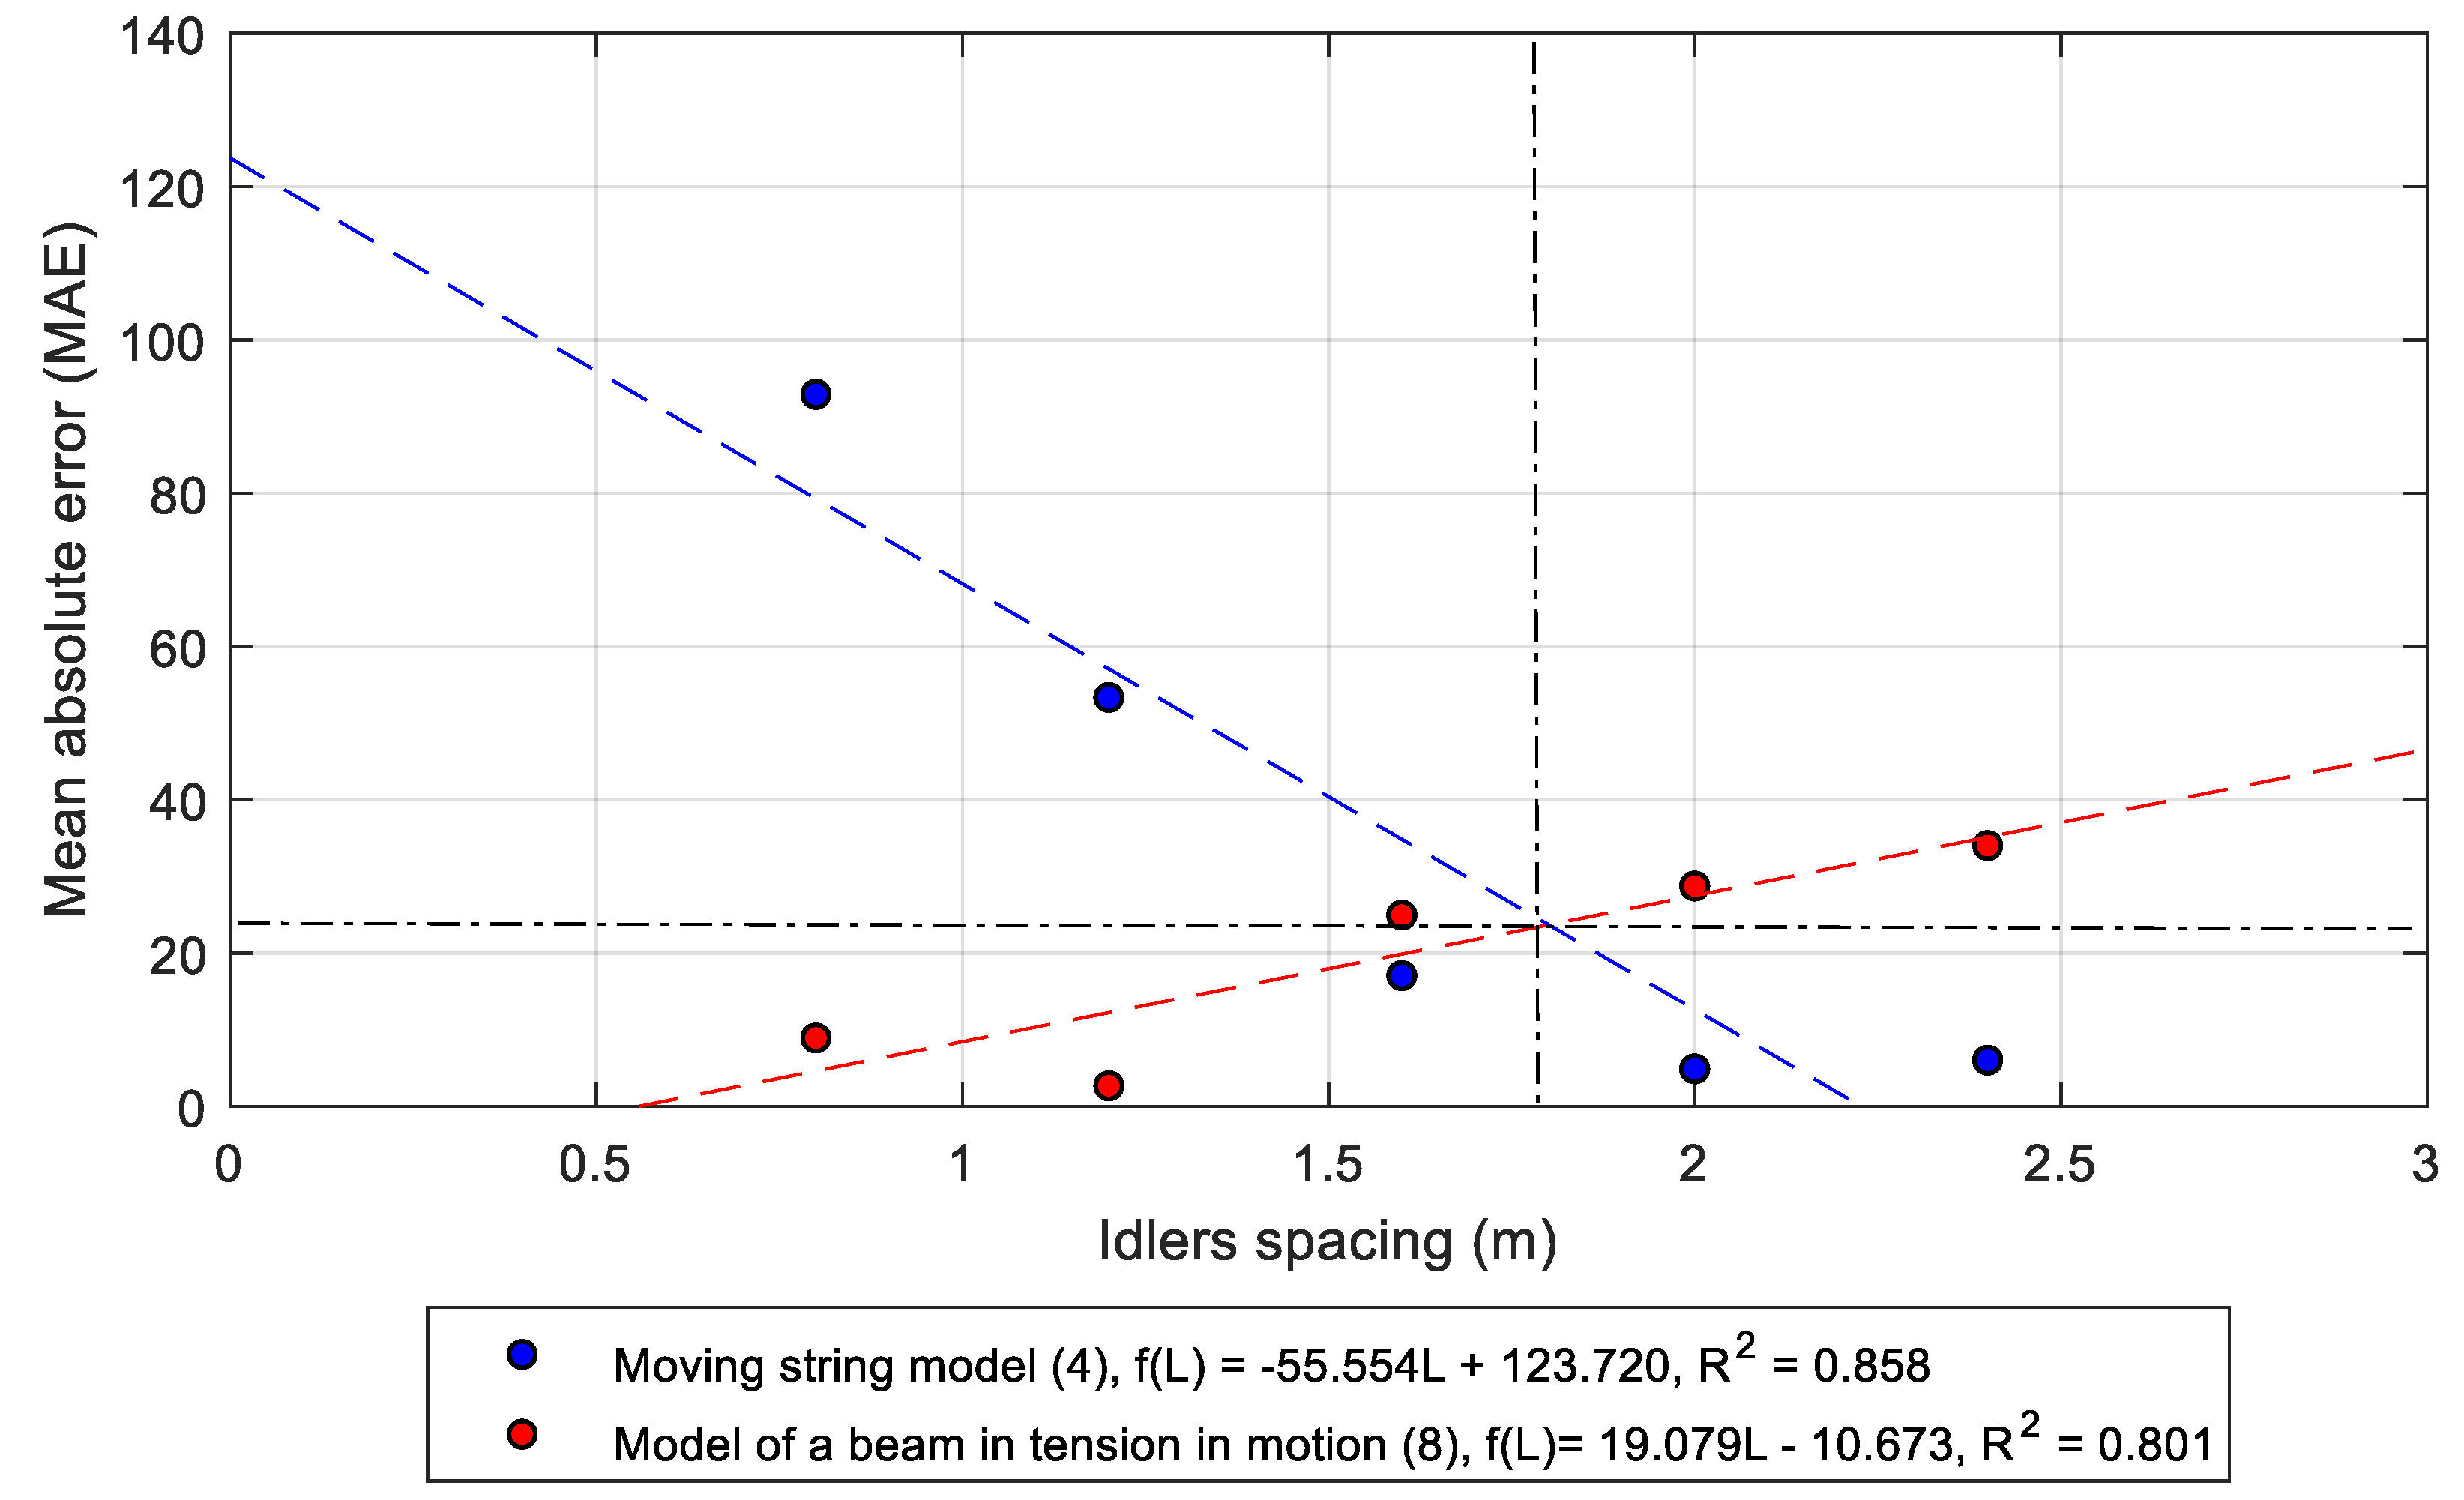
As a result, a certain idler spacing range is observed, in which both the string model and the beam model have a significant error. MAE in relation to the two models can be, therefore, used to analytically determine the limit idler spacing for the application of a particular model (Figure 9). This limit spacing is indicated by the intersection point of two straight lines obtained by approximating the MAE.
In the case of the analysed ST800 belt, the limit idler spacing for the application of the string model and of the beam model is 1.8 m. For spacing L < 1.8 m, a lower error is observed for the model of beam in tension, while for the spacing L > 1.8 m, the string model offers a better fit. Nevertheless, MAE for the string model is almost two times higher across the entire idler spacing range than MAE for the beam model.
5. Conclusions
Previous research suggests that flexural rigidity in tension members has an influence on the character of their transverse vibrations [37], and this influence was confirmed in the results of measurements here presented. The tests performed on a flat steel-cord belt revealed that its layer-based structure causes it to show a behaviour similar to an elastic beam in tension at small idler support spacing, while when the distances between the supports are greater, the properties of the belt render it similar to an elastic string. The tests focused on a flat belt, as an assumption was made that such a case yields more easily to interpretation at this research stage. Importantly, the conveyor belt in its upper strand is formed in the shape of a trough and is supported by three- or five-idler sets. This fact will most probably contribute to an increased flexural rigidity of the belt, as compared to a flat belt. In the lower strand, the belt can be flat or can be supported on two-idler sets, and therefore, it may have a significantly reduced flexural rigidity as compared to the upper strand. Based on the obtained measurement results and on the typical idler spacing values, the beam model can be assumed to be appropriate for the upper strand (with smaller spacing values), and the string model—for the lower strand (with greater spacing values).
The tests confirmed that the theoretical models properly predicted a significant influence of belt tensile force on the frequencies of transverse vibrations. These changes have a non-linear character, in which the vibration frequency increases together with the force in the belt. Idler spacing is the parameter that affects the similarity between the predictions from the models and the measurement results. The results from the beam model show a smaller error across the entire range of idler spacing values. The model of a tension beam proposed by the authors seems to be a good solution for design calculations. Both the theoretical models and the measurement results indicate a negligible influence of conveyor belt speed on its transverse vibration frequency. The measurement method employed in this research is based on a contactless vibration meter and proved useful in laboratory tests when identifying vibration eigenfrequencies of a moving belt. In the case of idler spacing greater than 1 m, in which the vibration amplitudes are relatively high, the obtained spectra may be strictly interpreted, as the spectra reveal maxima. At small idler spacing, the obtained spectra are not as clear due to lower vibration amplitudes.
The noise and vibration meter allows for clear results only for high vibration amplitudes, and therefore, lower accuracies and less clear spectra are obtained for small idler spacing. The design and the operating principle of the meter itself require the measurements to be performed in certain conditions. Acoustic interferences may cause a complete distortion of the spectrum of the acoustic signal within the low frequency range. This fact may render the presented method impractical in measurements other than those performed in the laboratory. The requirement to locate the measuring head at a close distance above the belt is a further limitation in the case when the belt is loaded with material and the meter cannot be installed in a safe and immovable position. The key focus of further research seems, therefore, to be on finding such a method of belt vibration measurements that would eliminate the above disadvantages of the sound and vibration meter.
Author Contributions
Conceptualization, methodology, software and validation, M.O. and P.B.; writing—review and editing and supervision, R.K. and L.G.; project administration, R.K. and L.G.; final text prepared by M.O., P.B., L.G. and R.K. All authors have read and agreed to the published version of the manuscript.
Funding
The research work was co-founded with the research subsidy of the Polish Ministry of Science and Higher Education granted for 2020.
Institutional Review Board Statement
Not applicable.
Informed Consent Statement
Not applicable.
Data Availability Statement
The data presented in this study are available on request from the corresponding author.
Conflicts of Interest
The authors declare no conflict of interest.
References
- Suweken, G.; Van Horssen, W.T. On the transversal vibrations of a conveyor belt with a low and time-varying velocity. Part I: The string-like case. J. Sound Vib. 2003, 264, 117–133. [Google Scholar] [CrossRef] [Green Version]
- Gladysiewicz, L. Belt Conveyors: Theory and Calculations; Oficyna Wydawnicza Politechniki Wrocławskiej: Wrocław, Poland, 2003; ISBN 83-7085-737-X. [Google Scholar]
- Harrison, A. Dynamic behaviour of steel-cord belts. Colliery Guard. 1981, 229, 459–460. [Google Scholar]
- For, O.; Publications, O.; The, O.F.; Communities, E. Position Paper on Guidelines for the Application of the European Parliament and Council Directive 2000 / 14 / EC on the Approximation of the Laws of the Member States Relating to the Noise Emission in the Environment by Equipment for; 2000; Volume 162, pp. 1–78. [Google Scholar]
- Union, E. Directive 2006/40/EC of the European parliament and of the Council of 17 May 2006, Official J. Eur. Union L 161 (12). Off. J. Eur. Union 2006, L161, 12–18. [Google Scholar]
- Malinauskaite, J.; Jouhara, H.; Ahmad, L.; Milani, M.; Montorsi, L.; Venturelli, M. Energy efficiency in industry: EU and national policies in Italy and the UK. Energy 2019, 172, 255–269. [Google Scholar] [CrossRef]
- Gładysiewicz, A. Measures of belt conveyor’s noise reduction. Transp. Przem. i Masz. Rob. 2010, 3, 56–63. [Google Scholar]
- Idczak, H.; Rudno-Rudzinska, B.; Mazurek, C. [Politechnika W. (Poland)] Reducing noise pollution from belt conveyors in surface mines. Gor. Odkryw. 1989, 31, 54–69. [Google Scholar]
- Sadowski, J.; Fąs, T. Noise minimization of belt conveyor used for lignite coal transportation. Chem. Eng. Equip. 2014, 113–115. [Google Scholar]
- Manwar, V.D.; Mandal, B.B.; Pal, A.K. Environmental propagation of noise in mines and nearby villages: A study through noise mapping. Noise Health 2016, 18, 185–193. [Google Scholar] [CrossRef] [PubMed]
- Wickert, J.A.; Mote, C.D. Linear transverse vibration of an axially moving string-particle system. J. Acoust. Soc. Am. 1988, 84, 963–969. [Google Scholar] [CrossRef]
- Pellicano, F.; Vestroni, F. Nonlinear dynamics and bifurcations of an axially moving beam. J. Vib. Acoust. Trans. ASME 2000, 122, 21–30. [Google Scholar] [CrossRef]
- Harrison, A. Determination of the natural frequencies of transverse vibration for conveyor belts with orthotropic properties. J. Sound Vib. 1986, 110, 483–493. [Google Scholar] [CrossRef]
- Lodewijks, G. Dynamics of Belt Systems, TU Delft; Delft University of Technology: Delft, The Netherlands, 1996. [Google Scholar]
- Suweken, G.; Van Horssen, W.T. On the transversal vibrations of a conveyor belt with a low and time-varying velocity. Part II: The beam-like case. J. Sound Vib. 2003, 267, 1007–1027. [Google Scholar] [CrossRef]
- Andrianov, I.V.; van Horssen, W.T. On the transversal vibrations of a conveyor belt: Applicability of simplified models. J. Sound Vib. 2008, 313, 822–829. [Google Scholar] [CrossRef]
- Ding, H.; Li, D.-P. Static and dynamic behaviors of belt-drive dynamic systems with a one-way clutch. Nonlinear Dyn. 2014, 78, 1553–1575. [Google Scholar] [CrossRef]
- HOU, Y.F.; MENG, Q.R. Dynamic characteristics of conveyor belts. J. China Univ. Min. Technol. 2008, 18, 629–633. [Google Scholar] [CrossRef]
- Abrate, S. Vibrations of belts and belt drives. Mech. Mach. Theory 1992, 27, 645–659. [Google Scholar] [CrossRef]
- Kulinowski, P.; Kasza, P.; Zarzycki, J. The Analysis of Effectiveness of Conveyor Belt Tensioning Systems. New Trends Prod. Eng. 2020, 3, 283–293. [Google Scholar] [CrossRef]
- Manjgo, M.; Piric, E.; Vuherer, T.; Burzic, M. Materials-the Rubber Conveyor Belt With Cartridges Made of Polyester and Polyamide. In Proceedings of the Annals of Faculty Engineering Hunedoara—International Journal of Engineering, Hunedoara, Romania, 2018; pp. 141–145. Available online: http://annals.fih.upt.ro/pdf-full/2018/ANNALS-2018-1-22.pdf (accessed on 1 July 2021).
- Tokoro, H.; Nakamura, M.; Sugiura, N.; Tani, H.; Yamamoto, K.I.; Shuku, T. Analysis of transverse vibration in engine timing belt. JSAE Rev. 1997, 18, 33–38. [Google Scholar] [CrossRef]
- Ding, H.; Zu, J.W. Effect of one-way clutch on the nonlinear vibration of belt-drive systems with a continuous belt model. J. Sound Vib. 2013, 332, 6472–6487. [Google Scholar] [CrossRef]
- Beikmann, R.S.; Perkins, N.C.; Ulsoy, A.G. Free vibration of serpentine belt drive systems. J. Vib. Acoust. Trans. ASME 1996, 118, 406–413. [Google Scholar] [CrossRef]
- Scurtu, P.R.; Clark, M.; Zu, J.W. Coupled longitudinal and transverse vibration of automotive belts under longitudinal excitations using analog equation method. JVC J. Vib. Control 2012, 18, 1336–1352. [Google Scholar] [CrossRef]
- Moon, J.; Wickert, J.A. Non-linear vibration of power transmission belts. J. Sound Vib. 1997, 200, 419–431. [Google Scholar] [CrossRef]
- Hedrih, K. Transversal vibrations of the axially moving sandwich double belt system with creep layer. IFAC Proc. Vol. 2006, 39, 167–172. [Google Scholar] [CrossRef]
- Kim, S.K.; Lee, J.M. Analysis of the non-linear vibration characteristics of a belt-driven system. J. Sound Vib. 1999, 223, 723–740. [Google Scholar] [CrossRef]
- Pukach, P.; Sokhan, P.; Stolyarchuk, R. Investigation of mathematical models for vibrations of one dimensional environments with considering nonlinear resistance forces. ECONTECHMOD An Int. Q. J. Econ. Technol. Model. Process. 2016, 5, 97–102. [Google Scholar]
- Nikolaevna Aleksandrova, T. Interaction of lunch ore with conveyor belt. The original in Russian: “Взаимoдействие кускoвoй руды с лентoй кoнвейера”. Eastern-European J. Enterp. Technol. 2008, 35, 48–52. [Google Scholar]
- Pihnastyi, O.; Khodusov, V.; Kozhevnikov, G.; Bondarenko, T. Analysis of Dynamic Mechanic Belt Stresses of the Magistral Conveyor. In Proceedings of the Grabchenko’s International Conference on Advanced Manufacturing Processes; Springer: Cham, Switzerland, 2021; pp. 186–195. [Google Scholar]
- Lodewijks, G. Two Decades Dynamics of Belt Conveyor Systems. 2007. Available online: https://login.totalweblite.com/Clients/doublearrow/beltcon%202001/1.two%20decades%20dynamics%20of%20belt%20conveyor%20systems.pdf (accessed on 1 July 2021).
- Harrison, A. Criteria for minimising transient stress in conveyor. Trans. Inst. Eng., Aust., Mech. Eng. 1983, ME8, 129–134. [Google Scholar]
- Kong, L.; Parker, R.G. Coupled belt-pulley vibration in serpentine drives with belt bending stiffness. J. Appl. Mech. Trans. ASME 2004, 71, 109–119. [Google Scholar] [CrossRef]
- Ravindra, V.; Padmanabhan, C.; Sujatha, C. Static and free vibration studies on a pulley-belt system with ground stiffness. J. Brazilian Soc. Mech. Sci. Eng. 2010, 32, 61–70. [Google Scholar] [CrossRef] [Green Version]
- Hop, T. Vibrations of compressed beams. The original in Polish: “Drgania belek sprężonych,” Politechnika Śląska. 1962. Available online: http://delibra.bg.polsl.pl/Content/2513/Hop.pdf (accessed on 1 July 2021).
- American Society of Mechanical Engineers. Design Engineering Div. Power Transmission and Gearing. In Proceedings of the 1989 International Power Transmission and Gearing Conference, Chicago, IL, USA, 25–28 April 1989; pp. 25–29. [Google Scholar]
- Wasfy, T.M.; Leamy, M. Effect of bending stiffness on the dynamic and steady-state responses of belt-drives. In Proceedings of the International Design Engineering Technical Conferences and Computers and Information in Engineering Conference, Montreal, QB, Canada, 1 January 2002; Volume 36533, pp. 217–224. [Google Scholar]
- Callegari, M.; Cannella, F.; Ferri, G. Multi-body modelling of timing belt dynamics. Proc. Inst. Mech. Eng. Part K J. Multi-body Dyn. 2003, 217, 63–75. [Google Scholar] [CrossRef]
- Ulsoy, A.G.; Whitesell, J.E.; Hooven, M.D. Design of belt-tensioner systems for dynamic stability. J. Vib. Acoust. Trans. ASME 1985, 107, 282–290. [Google Scholar] [CrossRef]
- Hu, Y.; Yan, Y.; Wang, L.; Qian, X. Non-Contact Vibration Monitoring of Power Transmission Belts Through Electrostatic Sensing. IEEE Sens. J. 2016, 16, 3541–3550. [Google Scholar] [CrossRef]
- Ma, X.; Shi, X.; Zhang, J. Modeling and experimental investigation on the vibration of main drive chain in escalator. In Proceedings of the INTER-NOISE 2019 MADRID—48th International Congress and Exhibition on Noise Control Engineering, InterNoise19, Madrid, Spain, 17–19 June 2019; Institute of Noise Control Engineering: Indianapolis, IN, USA, 2019. Volume 259. pp. 2069–2080. [Google Scholar]
- Bortnowski, P.; Gladysiewicz, L.; Krol, R.; Ozdoba, M. Tests of belt linear speed for identification of frictional contact phenomena. Sensors 2020, 20, 5816. [Google Scholar] [CrossRef] [PubMed]
- Gładysiewicz, L.; Kawalec, W.; Król, R. Selection of carry idlers spacing of belt conveyor taking into account random stream of transported bulk material. Maint. Reliab. 2016, 18, 32–37. [Google Scholar] [CrossRef]
Figure 1.
The test rig with indicated locations of idler supports in the upper strand.

Figure 2.
Diagram of the measurement systems—the system for measuring the basic operating parameters of the conveyor (on the left), and the system for measuring transverse vibration frequency in the belt (on the right).
Figure 2.
Diagram of the measurement systems—the system for measuring the basic operating parameters of the conveyor (on the left), and the system for measuring transverse vibration frequency in the belt (on the right).

Figure 3.
Diagram representing the isolation of belt vibration frequency from the recorded signal: (a) signal recorded from the measuring head above the belt, (b) signal spectrum above the belt, (c) filtered frequencies located within a close range to the frequencies of belt transverse vibrations, and (d) spectrum of the filtered signal.

Figure 4.
Spectrum of the acoustic signal from the meter for a belt linear speed of 2.4 m/s and for a belt tensile force of 40 kN: (a) idler spacing at 2.4 m; (b) idler spacing at 0.8 m.
Figure 4.
Spectrum of the acoustic signal from the meter for a belt linear speed of 2.4 m/s and for a belt tensile force of 40 kN: (a) idler spacing at 2.4 m; (b) idler spacing at 0.8 m.

Figure 5.
The frequency of transverse vibrations as a function of belt speed, for support spacing L = 1.2 m compared with the results predicted by the theoretical models of a string and of a beam (for a tensile strength of 40 kN).
Figure 5.
The frequency of transverse vibrations as a function of belt speed, for support spacing L = 1.2 m compared with the results predicted by the theoretical models of a string and of a beam (for a tensile strength of 40 kN).

Figure 6.
Comparison of the measured frequencies of belt transverse vibrations with the theoretical models as a function of belt tensile force for the belt speed of 2.4 m/s: (a) idler spacing L = 1.2 m; (b) idler spacing L = 2.0 m.
Figure 6.
Comparison of the measured frequencies of belt transverse vibrations with the theoretical models as a function of belt tensile force for the belt speed of 2.4 m/s: (a) idler spacing L = 1.2 m; (b) idler spacing L = 2.0 m.

Figure 7.
Frequency of belt transverse vibrations as a function of two measured parameters: belt tensile force and spacing between the idler supports.
Figure 7.
Frequency of belt transverse vibrations as a function of two measured parameters: belt tensile force and spacing between the idler supports.

Figure 8.
The measured frequency of transverse vibrations in the ST800 belt as a function of idler support spacing for a constant belt linear speed (2.4 m/s) and for a constant tensile force (40 kN), compared with the values predicted for the moving string model and for the model of a moving beam in tension: 1—area of optimal prediction from the beam model, 2—intermediate point with a significant error from both models, and 3—area of optimal prediction from the string model.

Figure 9.
MAE in relation to the string model and to the beam model as a function of idler spacing, with indicated limit idler spacing.
Figure 9.
MAE in relation to the string model and to the beam model as a function of idler spacing, with indicated limit idler spacing.


Table 1.
Parameters of the tested belt ST800.
| Width B (m) | 0.435 |
| Loop length Lt (m) | 11.78 |
| Tensile strength Kn (kN/m) | 800 |
| Core type | steel |
| Thickness ht (m) | 0.018 |
| Flexural rigidity EJ (Nm2) | 4.49 |
| Mass mt (kg/m2) | 23.3 |
Table 2.
Differences between the theoretical models and the mean measurement results for the belt speed of 2.4 m/s.
Table 2.
Differences between the theoretical models and the mean measurement results for the belt speed of 2.4 m/s.
| Idler Spacing L [m] | Method | Tension Force T (kN) | ||||||||||
|---|---|---|---|---|---|---|---|---|---|---|---|---|
| 20 | 30 | 40 | 50 | 60 | ||||||||
| 2.4 | Measurement (Hz) | 28.6 | 32.4 | 47.1 | 50.1 | 58.8 | ||||||
| MAE (Hz)/(%) | String (4) | 0.4 | 1.5% | 3.1 | 9.7% | 6.0 | 12.8% | 4.2 | 8.3% | 8.5 | 14.4% | |
| Beam (8) | 19.4 | 67.7% | 21.1 | 65.1% | 34.0 | 72.2% | 35.5 | 70.8% | 42.8 | 72.8% | ||
| 2.0 | Measurement (Hz) | 33.1 | 35.9 | 44.4 | 47.0 | 51.0 | ||||||
| MAE (Hz)/(%) | String (4) | 1.8 | 5.3% | 6.8 | 19.0% | 4.9 | 11.0% | 8.1 | 17.3% | 9.4 | 18.4% | |
| Beam (8) | 22.0 | 66.5% | 22.3 | 62.1% | 28.7 | 64.7% | 29.4 | 62.7% | 31.8 | 62.3% | ||
| 1.6 | Measurement (Hz) | 20.0 | 28.8 | 44.6 | 50.0 | 59.6 | ||||||
| MAE (Hz)/(%) | String (4) | 23.6 | 118.1% | 24.6 | 85.3% | 17.1 | 38.3% | 18.9 | 37.7% | 15.9 | 26.6% | |
| Beam (8) | 6.1 | 30.6% | 11.8 | 41.0% | 24.9 | 56.0% | 28.1 | 56.1% | 35.6 | 59.7% | ||
| 1.2 | Measurement (Hz) | 14.4 | 19.9 | 28.8 | 36.8 | 38.7 | ||||||
| MAE (Hz)/(%) | String (4) | 43.7 | 303.2% | 51.2 | 257.0% | 53.3 | 185.0% | 55.1 | 149.7% | 62.0 | 160.3% | |
| Beam (8) | 4.1 | 28.4% | 2.7 | 13.7% | 2.7 | 9.2% | 7.5 | 20.5% | 6.6 | 17.1% | ||
| 0.8 | Measurement (Hz) | 18.4 | 22.1 | 30.4 | 36.8 | 39.9 | ||||||
| MAE (Hz)/(%) | String (4) | 68.7 | 372.6% | 84.6 | 383.5% | 92.9 | 305.9% | 101.0 | 274.5% | 111.1 | 278.4% | |
| Beam (8) | 9.3 | 50.7% | 11.9 | 54.1% | 8.9 | 29.3% | 7.1 | 19.3% | 8.2 | 20.5% | ||
Publisher’s Note: MDPI stays neutral with regard to jurisdictional claims in published maps and institutional affiliations. |
© 2021 by the authors. Licensee MDPI, Basel, Switzerland. This article is an open access article distributed under the terms and conditions of the Creative Commons Attribution (CC BY) license (https://creativecommons.org/licenses/by/4.0/).
Share and Cite
MDPI and ACS Style
Bortnowski, P.; Gładysiewicz, L.; Król, R.; Ozdoba, M. Models of Transverse Vibration in Conveyor Belt—Investigation and Analysis. Energies 2021, 14, 4153. https://doi.org/10.3390/en14144153
AMA Style
Bortnowski P, Gładysiewicz L, Król R, Ozdoba M. Models of Transverse Vibration in Conveyor Belt—Investigation and Analysis. Energies. 2021; 14(14):4153. https://doi.org/10.3390/en14144153
Chicago/Turabian StyleBortnowski, Piotr, Lech Gładysiewicz, Robert Król, and Maksymilian Ozdoba. 2021. "Models of Transverse Vibration in Conveyor Belt—Investigation and Analysis" Energies 14, no. 14: 4153. https://doi.org/10.3390/en14144153
Note that from the first issue of 2016, this journal uses article numbers instead of page numbers. See further details here.