Article

Estimation of Methane Production and Electrical Energy Generation from Municipal Solid Waste Disposal Sites in Pakistan

1
Institute of Environmental Technology and Energy Economics, Hamburg University of Technology, Blohmstr. 15, 21073 Hamburg, Germany
2
Department of Energy and Environment Engineering, Dawood University of Engineering and Technology, New M.A Jinnah Road, Karachi 74800, Pakistan
3
Oil and Gas Development Company Limited, OGDCL House, Plot No. 3, Jinnah Avenue, F 6/1 Blue Area, Islamabad 44000, Pakistan
*
Author to whom correspondence should be addressed.
Energies 2021, 14(9), 2444; https://doi.org/10.3390/en14092444
Submission received: 18 March 2021 / Revised: 20 April 2021 / Accepted: 21 April 2021 / Published: 25 April 2021

Abstract

:
This work aimed to estimate the annual methane production from the municipal solid waste disposal sites in Pakistan. In this study, the Intergovernmental Panel on Climate Change (IPCC) default methodology was used to estimate theoretical methane formation potential of the waste disposal sites in major cities of Pakistan. The estimates of this study are based on the last population census conducted in the year 2017 and latest available data regarding the waste generation and management practices in the cities considered in the study. Results showed that 31.18 million tonnes of municipal solid waste (MSW) is generated annually. The top 10 major populated cities in Pakistan (with 20% share in country’s population) contributing 31% share in the total quantity of MSW generated in overall country. On average 50–60% of the MSW generated is collected and openly dumped at the designated waste disposal sites. After analyzing the data, we estimate that annually 12.8 MtCO2-eq of methane is emitted from the waste disposal sites in major cities considered in this study. The methane produced from the waste disposal sites can be sustainably utilized as a source of energy through transforming MSW disposal sites (open dumps) to sanitary landfills with methane capturing and utilization facilities. In the present scenario of waste management and methane formation potential, sanitary landfills would generate 62.35 MWh of electric power if 25% of the methane was recovered and utilized in power generation.

Graphical Abstract

1. Introduction

Sustainable management of municipal solid waste (MSW) is one of the major challenges municipal authorities are facing in developing countries [1,2,3]. Sustainable waste management practices can be defined as handling of waste generated by the means of collection, transfer/transport, reuse, recycling, disposing, and landfilling, concurrently considering the costs and effects on public health and ecosystems [4]. However proper handling of increasing amounts of MSW is rising serious concerns worldwide [
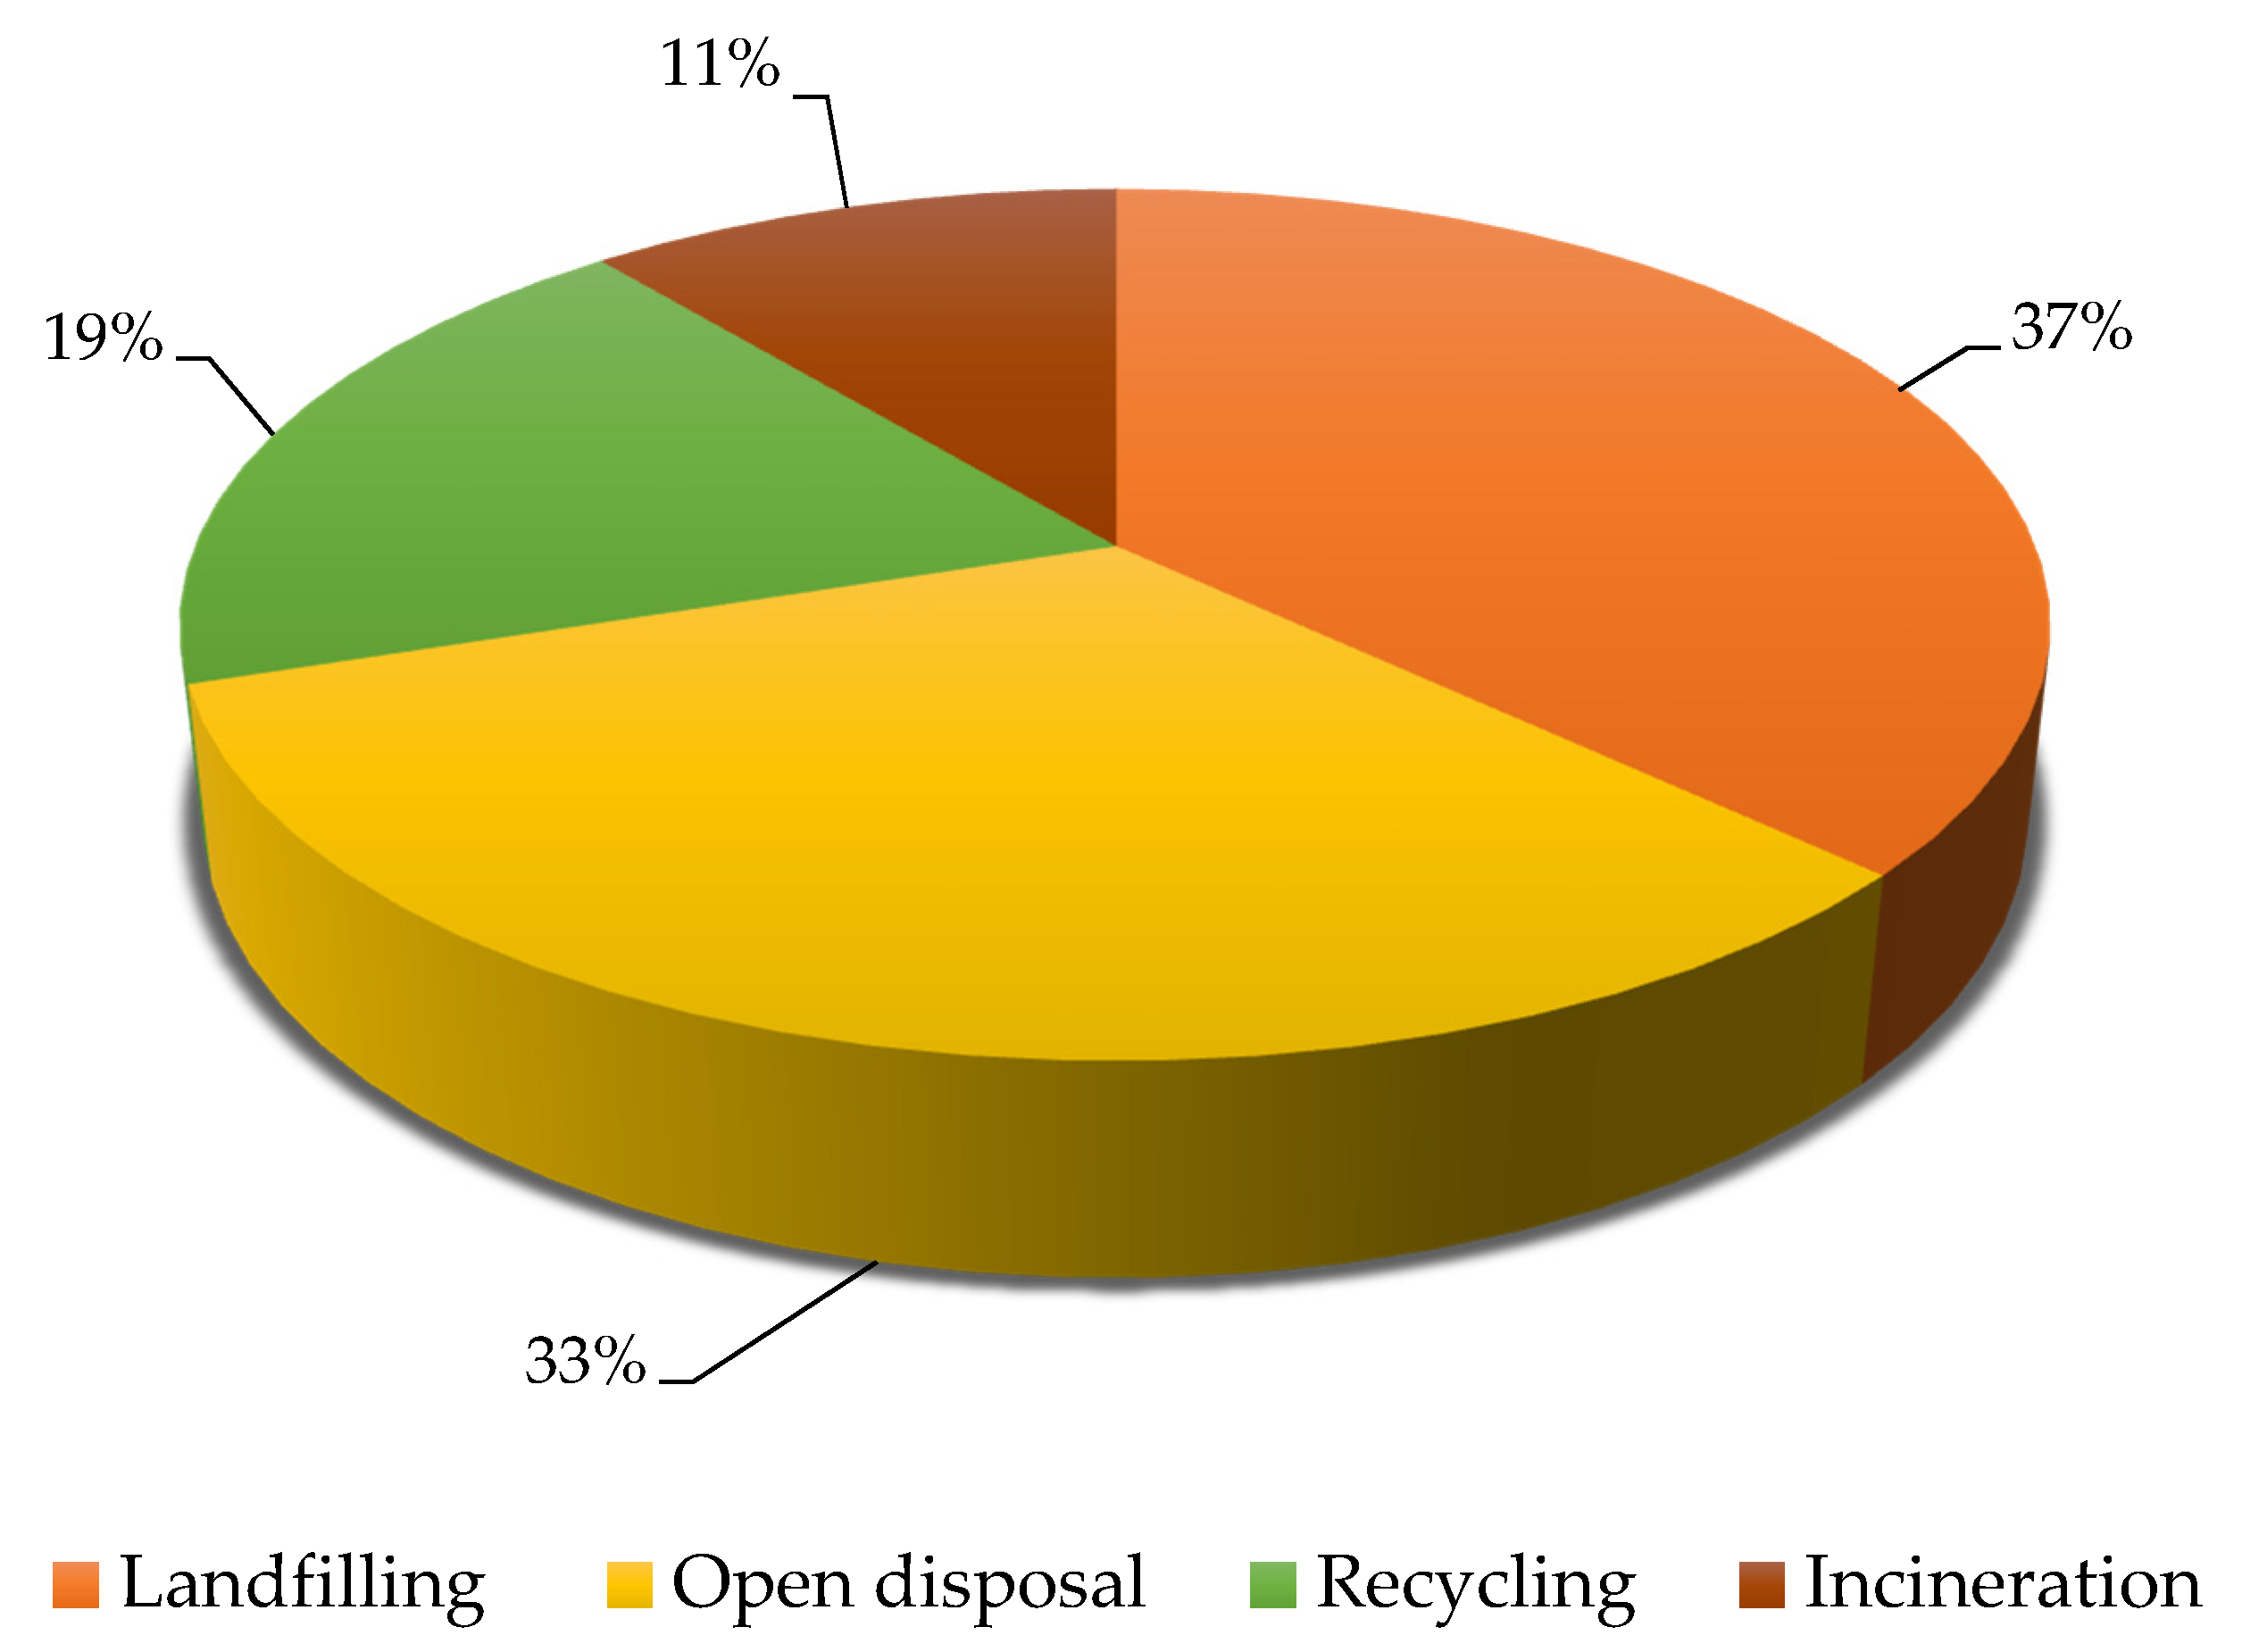
5]. Landfilling predominates in global waste management strategies, as 37% of MSW is disposed of in landfills and 33% of MSW is still ending up at open dumps [6]. According to the World Bank report, about 19% of waste material is recovered by recycling and composting and 11% of waste is treated by sophisticated incineration plants. The worldwide share of waste management strategies is illustrated in Figure 1.
Mismanagement of MSW has severe negative impacts on the environment and public health [8]. The adaptation of waste management and disposal strategies vary by the economic level of the countries [9]. Landfilling is a comparatively low cost waste treatment and disposal technology and is being used worldwide, particularly in developing countries [10]. The waste dumpsites/unmanaged landfills are impacting the environment at each level from local and regional to global [11]. The common environmental impacts of dumpsites/unmanaged landfill sites are formation of landfill gas (CH4 and CO2), leachate, dust and particulate matter, odors, and fire hazards [12]. Dumpsites have adverse impacts on soil, surface water bodies, and underground water [13]. In most cases in lower income and developing countries, solid waste is being dumped along or in the rivers or sea, causing serious impacts on aquatic and coastal life [14].
Methane has a significant contribution to the effects of global warming due to fact that CH4 is 25 times more effective at heat trapping than CO2 in over 100-year time frames [15,16]. In the latest estimations reported by [15], landfills, old dumpsites, and other waste disposal activates globally, share up to 19% in global CH4 emissions with a total 67–90 million tonnes of CH4 per year. Therefore, landfills are ranked as the second largest anthropogenic source after ruminant livestock (87–94 million tonnes of CH4 per year) [15]. Therefore, prevention of landfill emissions is a major goal in waste management strategies [17,18].
It is estimated that the methane emissions from MSW in developing countries are likely to increase in coming years owing to the rise in population of urban areas and rise in per capita waste generation rate as a result of improvements in economic conditions [19]. In contrast to this, methane emissions from MSW in the developed world are likely to decrease because of further improvement in MSW management conditions (recycling and reuse), enhanced waste legislation as well as recovery and extraction systems [4]. The latest reported amount of methane emissions associated with MSW sector in developed and developing countries including European Union (EU-27) and USA is presented in Table 1.
Environment-polluting waste disposal sites can be successfully transferred to energy generating projects by transforming them into sanitary landfills and equipped with landfill gas (LFG) capturing and power generating infrastructure [20,21]. According to the U.S. Department of Energy (DOE), the usage of waste material as a feedstock for energy and fuel production offers various advantages [22], such as waste material being available at low price, or even offering revenue such as a tipping fee. The waste material can be collected by using existing waste collection and separation infrastructure, which further reduces the cost of energy products derived from waste [23].
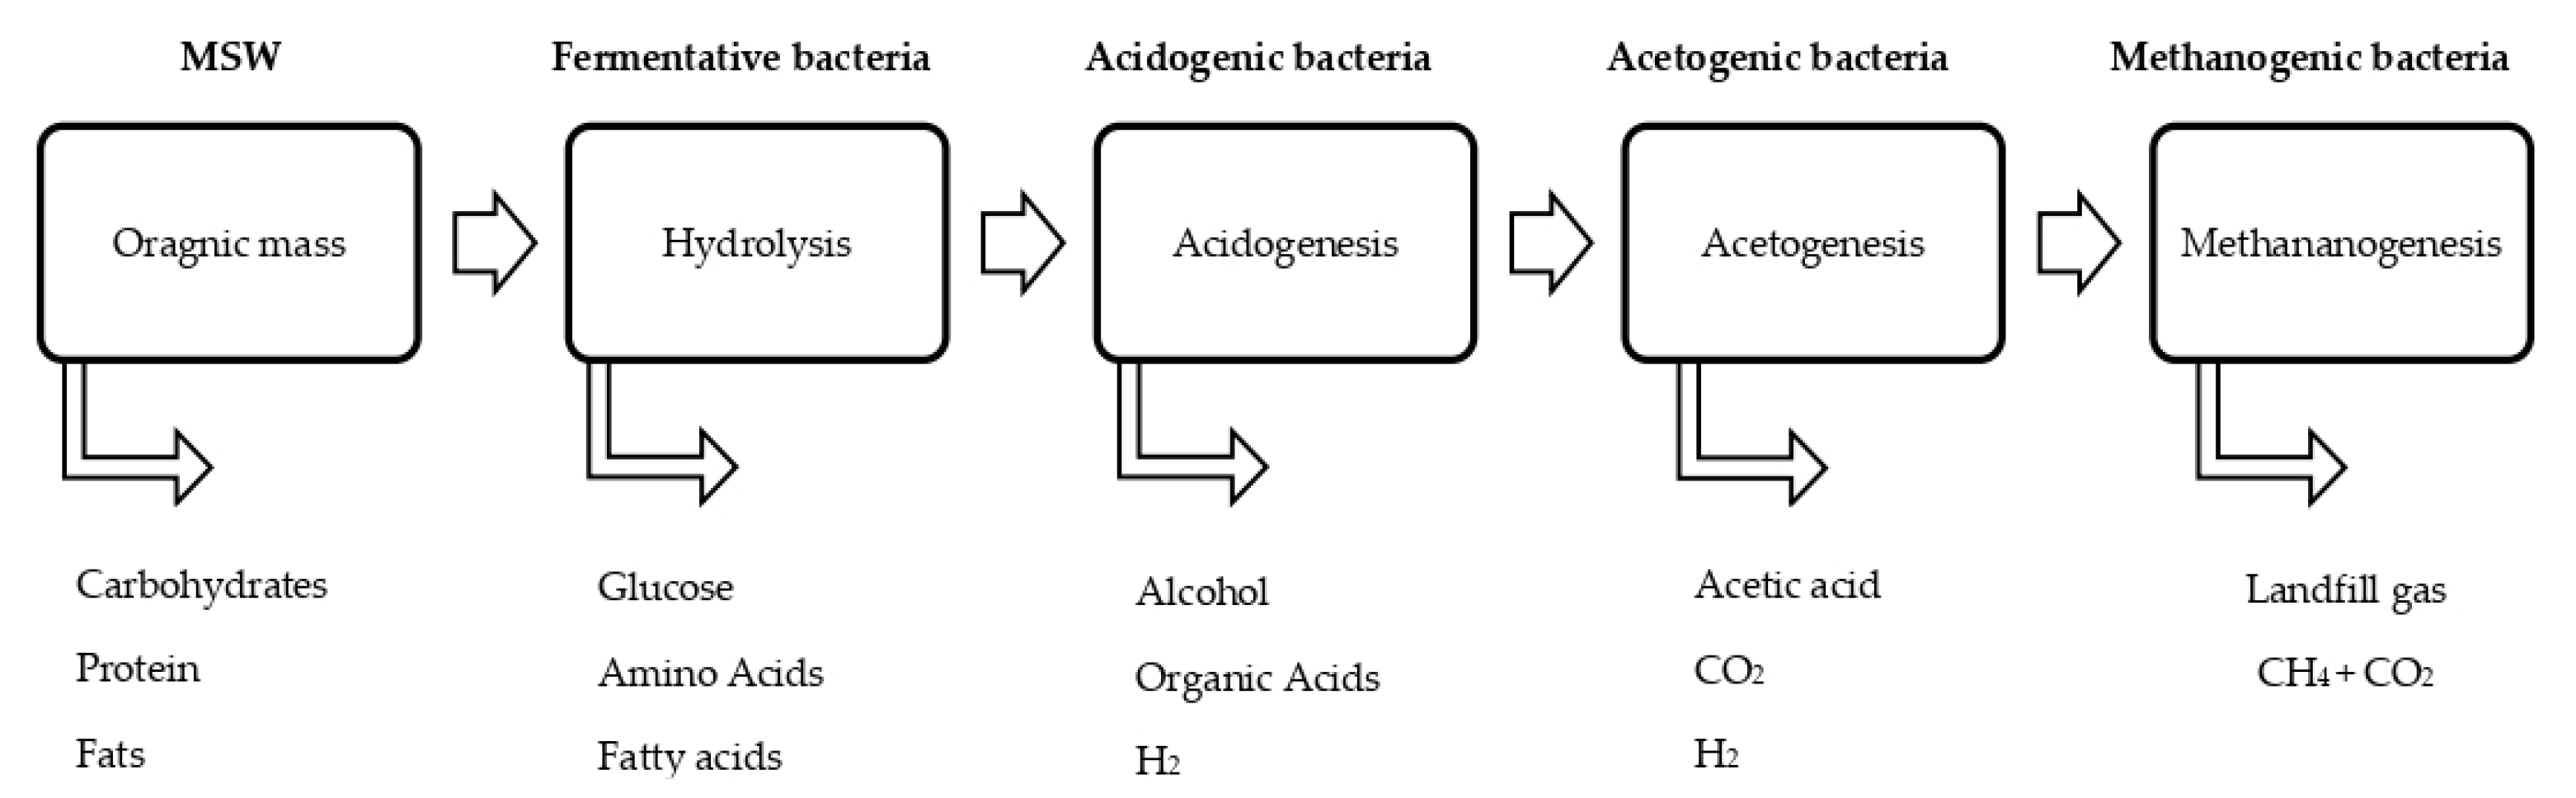
The organic waste disposed in landfills is mostly degrading under anaerobic conditions [44]. Soon after the waste is placed in the landfill, aerobic decomposition starts, as oxygen is consumed by the microbial biomass. The aerobic processes may continue until all oxygen present in pores and voids of the waste is consumed [44,45]. Degradation of organic mass by a group of anaerobic bacteria results in the production of CO2 and CH4 [46,47]. Methane gas is produced from decomposition of organic waste under anaerobic conditions mostly observed in landfills and large dumpsites [48]. A scheme of biochemical reactions during anaerobic digestion of organic fraction of MSW in landfill environment is illustrated in Figure 2.
To reduce the greenhouse gas (GHG) emissions for the MSW management sector, different waste treatment technologies have been developed, such as compositing, incineration, anaerobic digesters, an-aerobic landfills with gas capturing facilities and refused-derived fuels (RFD) [21,49,50]. An accurate estimation of landfill gas (LFG), mainly methane (CH4), is important for conduction life cycle assessment (LCA) of waste to energy (WtE) pathways of landfills [23]. Sustainable landfilling operation is described as controlled disposal of waste on land to minimize negative environmental repercussions through capturing landfill gas and managing leachate [4,51]. Figure 3 shows a scheme of sanitary landfill with landfill gas collection system and electrical energy (combined heat and power; CHP) generation facilities.
However, landfills intended to be used for energy generation should be sustainably planned considering the aftercare phase when energy generation from landfill gas is not economically possible/feasible [52,53,54].

2. Study Area—Pakistan

Pakistan is the 5th most populous country in the world, with population of 207.77 million recorded in the recent population and housing census in 2017 [55]. According to the latest statistics from the census of 2017, 75.586 million people are living in urban areas and the rural population was recorded as 132.184 million; so 36.38% of the population was living in urban areas, and the rural population accounted for 63.62% of country’s total population [55]. About 40.956 million people (54% of the total urban and 20% of overall Pakistani population) are living in the ten major cities of Pakistan [55]. In recent decades Pakistan has been going through an energy crisis which have has resulted in socio-economic turmoil in the country [20,56].

2.1. Municipal Solid Waste Management Situation in Pakistan

Solid waste management is a basic service provided by the city municipal authorities to their residents. Factors influencing the quality of that service are finance, technology, and trained staff available to the individual city municipal administration for waste management. In low-income countries, municipal authorities are lacking the required funds, technical facilities, and trained manpower for municipal waste management [57].
Moreover, due to the within-country migration of people from rural to urban areas, the burden on the municipal authorities in major cities has increased to sustainably handle the high amount of waste generated from different sectors. In Pakistan, there are deficiencies in the availability of funds, planning, technology, and trained workforce for proper and sustainable municipal solid waste management [58]. Even in major cities like Karachi, Lahore, Faisalabad, and Islamabad, municipal authorities are striving for the allocation of required funds and other resources for proper municipal waste management [59]. As a result, MSW is poorly managed in Pakistan and public health and environmental quality is highly compromised in the country [60].

2.1.1. MSW Generation

As like other developing countries, the rate of MSW generation in Pakistan is lower than developed nations [14]. A study by Pakistan Environmental Protection Agency [61] reported the growth rate of the selected cities was 3.67–7.42% and it was also estimated in the same report that the population of the major cities of Pakistan is expected to double in the coming decade, resulting in higher quantity of solid waste generation.
For all types of municipal administrated areas, the average waste generation rate was estimated to be from 0.283 kg/c/d (kg/capita/day) to 0.613 kg/c/d, depending on the location and socio-economic development of the city [61]. According to a World Bank report [62] about 50,438 tonnes of MSW was generated in the urban areas of Pakistan with the rate of 0.84 kg/c/d and in the same report, a rise in MSW generation is estimated in urban areas of the country up to 109,244 tonnes/day with the rate of 1.05 kg/c/d by the year 2025.
The present study is based on the population reported in statistical data in the Pakistan census of 2017 [55] and the waste generation rate is that reported in the literature [63,64]. In the present study, 32.711 million tonnes/year of MSW generation was estimated in Pakistan overall, with the average rate of 150 kg/c/y (kg/capita/year) (0.41 kg/c/d) and the waste generation rate in the top ten populated cities, overall urban areas, and rural areas in the country was estimated to be about 238 kg/c/y (0.65 kg/c/d), 232 kg/c/y (0.63 kg/c/d), and 103 kg/c/y (0.28 kg/capita/day) respectively. Detailed data regarding MSW generation in the ten most populous cities of Pakistan is provided in Table 2.
Through analysis of the latest population data and waste generation rate, it is described that urban areas in Pakistan are contributing 56% of total MSW generated in the county. The top 10 most populated cites in Pakistan are accountable for 31% of the total amount of waste generated in the country, and 55.8% of the waste is generated by urban areas in Pakistan. The summary of data analyzed for MSW generation in Pakistan is given in Table 3.

2.1.2. MSW Composition

The composition of MSW is very important to know for the selection of proper treatment and/or disposal methods and resource recovery from the waste [58,65]. The MSW composition influences the energy content (calorific value) for incineration and methane generation potential for landfilling [58,66]. The volatile solid (VS) content of MSW generated in Pakistan is reported as 50–60% of dry mass (DM)/total solid (TS) [58]. The composition of the MSW differs with geographical location and climatic conditions, living standards, economic status, and the culture of the society [14].
Generally, MSW in Pakistan generally contains paper and cardboard, plastic, textiles, food waste, glass, metals, stones, wood, animal waste, bones, green waste (leaves, grass, straws, and fodder), rubber, and inert waste including fines [61]. The average composition of MSW in Pakistan comprises 64% organic and 36% inorganic waste [14]. The physical composition of waste in major cities of Pakistan given in Table 4 is also used in other studies [60,67].

2.1.3. MSW Disposal

In Pakistan, local government departments of respective provinces are responsible for MSW management. According to Pakistan Environmental Protection Agency report [61], government provided services are collecting averagely only 50% of MSW generated in the cities of Pakistan. The summary of MSW generation and collection in major cities in Pakistan is given in Table 5.
In Pakistan, there is an absence of a proper waste management system for collection to disposal of MSW [14,20,60]. Due to the escalated increase in population, municipal authorities are unable to deal with a huge quantity of waste, resulting in inadequate collection and disposal services. Moreover, the authors of [60] reported that from the total MSW generated, only 50–96% of waste is collected and disposed in dumpsites and landfills outside of the cities. The collection efficiency of MSW depends on the income level of the society; collection rate varies from 90% to 0% in high to low-income areas respectively [61]. The remaining waste is left as heaps in the streets, on roadsides, in storm drains, vacant plots, and ditches in the city areas causing a threat to human health and environment. Sustainable waste disposal methods like composting, incineration, and sanitary landfills are very new in Pakistan [20]. Open dumping is a common way to dispose of the collected waste in dumpsites located at the entrance and exits of cities in the country [14]. In Pakistan, no legislation has been introduced regarding waste separation and recycling; due to this fact the waste is being collected and dumped in heterogeneous and improper way containing various types of wastes. A very low amount of the MSW, around 26.28%, is being used for material recovery by the informal sector [14,70].
Hospital and industrial waste are also being dumped with MSW in landfill sites in some cities of Pakistan, creating serious environmental and public health concerns. In Pakistan, all available waste disposal methods (composting and landfills) are inadequate [73]. Even in the major cities of Pakistan like Karachi, Lahore, Islamabad, Faisalabad, and Peshawar there are no engineered landfill facilities for waste disposal. All existing landfills are just open dumpsites without any gas and leachate collection and treatment facilities [21]. These dump sites are breeding places for mosquitos, flies, animals, and birds, and have become the source of spreading diseases, odors, vegetation damage, groundwater pollution, and GHG emissions [60]. The open waste disposal conditions can be observed from aerial views of MSW disposal sites in some major cities in Pakistan in Figure 4.

3. Greenhouse Gas Emissions Inventory of Pakistan

According to the Global Change Impact Study Center [74] report, the first GHG emission inventory of Pakistan was prepared for the year 1990 in which 212.9 MtCO2-eq emissions were estimated. In the second GHG emission inventory of the country, which was developed for the year 1994, the total emissions estimated were 181.7 MtCO2-eq, in which the share of the waste sector was 2.5%. Pakistan’s third GHG emission inventory was prepared for the year 2009 by using 2006 IPCC guidelines and estimated GHG emissions were 309.4 MtCO2-eq, and the share of emissions from the waste sector was 1.8%. The latest GHG emissions inventory available for Pakistan was made for the year 2015 by the Ministry of Climate Change, Pakistan. In this inventory report, total GHG emissions from all sectors is reported as 406.45 MtCO2-eq, where the waste sector is responsible for 15.65 MtCO2-eq of GHG emissions, with a 3.9% share. Table 6 depicts details of GHG emission inventories prepared in Pakistan.

4. Materials and Methods

The default methodology proposed by the IPCC [75] was used in this study to estimate methane (CH4) emissions from organic portion of the municipal solid waste (i.e., paper and cardboard, food, grass and leaves, textiles and wood) disposed at landfills in major cities in Pakistan. This methodology has been used in various reported studies [23,60,76,77,78] to estimate and evaluate the CH4 emissions from the organic fraction of MSW. The IPCC default method is based on the theoretical gas formation by the mass balance equation and the methodology presumes that all possible emissions of CH4 from the waste are released during the same year in which the waste is dumped [75]. According to IPCC good practices guidelines [79], through using this default method a reasonable annual estimations of methane emissions can be made, if the composition and amount of waste disposed remain constant or slowly changing over a period of several decades. However, in the case of waste amount and composition rapidly changes over this time; thus this default IPCC methodology will not give accurate trend of emissions [79]. In this method, CH4 emissions from waste disposal sites are estimated using the following equation:
CH4, tonnes = (MSWT × MSWF × MCF × DOC × DOCF × F × 16/12 − R) (1 − OX)
where MSWT is the total quantity of MSW generated (tonnes/year), MSWF is the fraction of MSW disposed of to the disposal sites, MCF is the methane correction factor, DOC is the fraction of degradable organic carbon in waste, DOCF is the fraction of DOC that actually decomposes, F is the fraction of methane in landfill gas, 16/12 used for the conversion of carbon to methane, R is the methane recovery rate, and OX is the oxidation factor (fraction). For the current study, MSWT and MSWF values are taken from Table 1 and Table 5 for waste generation and disposal in the major cities in Pakistan.
For MCF, IPCC default values ranges from 0.4 to 1.0 depending upon the type of disposal site conditions. Since at MSW disposal sites in Pakistan conditions are unspecified and unmanaged, so for this study an MCF value of 0.6 was taken, according to IPCC guidelines. DOC for each city was calculated by substituting waste composition data from Table 4 for respective city and default values of DOC content in wet waste given in Table 7 by using Equation (2), given in IPCC guidelines. No methane recovery is taking place at any waste disposal sites in Pakistan, so R was assumed as zero, as provided by IPCC 1996 for Southeast Asian countries [80] and similar value is considered by studies from India [81] and from Bangladesh [82] in the estimation of methane potential from landfills. OX was also considered to be zero according to IPCC default value [75].
DOC = 0.4 × A + 0.2 × B + 0.15 × C + 0.43 × D + 0.24 × E
where A, B, C, D and E represent the fraction of paper and cardboard, leaves, and grass, food waste, wood, and textiles present in MSW respectively. DOCF is the degradable portion of the total degradable organic carbon (DOC) can be determined through Equation (3) provided by IPCC guidelines, where temperature T is used the value given by IPCC is 0.77 [77].
DOCF = (0.014 × T) + 0.28
According to the IPCC guidelines, the temperature of the anaerobic zone of the landfill is supposed to persist constantly at about 35 °C [75]. According to climatic conditions and the geographical location of Pakistan, the temperature value in the anaerobic zones of the landfill seems reasonable to the temperature given in IPCC guidelines [60]. The IPCC default value for DOCF is 0.77, which was used in this study. IPCC provided the default value for F (0.5) was used. The molecular mass of methane and the atomic mass of carbon are 16 and 12 respectively [60]. The CO2 equivalent is estimated by multiplying yearly CH4 emissions by 25, as global warming potential (GWP) of CH4 is 25 times greater heat trapping effect the CO2 over a 100-year time frame [16].
For the estimation of power generation from the amount of methane produced in disposal sites, three scenarios of methane recovery are evaluated by methane recovery of 25% as minimum, 50% (assumed) as medium, and 75% (reported by United States Environmental Protection Agency [83]) as maximum. Mostly internal combustion engines are used for power generation in landfill projects due to their low cost and high electrical efficiency (ηe 30–40%), however other technologies like gas turbine and micro turbine are also used for power generation, subject to the size of the landfill [84]. Therefore, internal combustion engine technology was considered for power generation with the average electrical efficiency of (ηe) of 30%. The lower heating value of pure CH4 33,906 kJ/m3 [85] and density of methane 0.66 kg/m3 at room temperature [86] was considered for the determination of thermal power (Pt). For the determination of electrical power (Pe), the generation potential Equation (3) reported by [60] was used.
Pe = Pt × r × ηe

5. Results and Discussion

5.1. Estimation of Methane Emissions from Waste Disposal Sites

Following the IPCC guidelines [48], this study estimated that overall 12.7 Million tonnes CO2 equivalent (Mt CO2-eq) of CH4 is being released from waste disposal at dumpsites sites in the most populous cities of Pakistan. The methane emissions are higher from waste disposal sites in Lahore and Karachi causing an annual release of 8.52 Mt CO2-eq and 3.40 Mt CO2-eq of methane in atmosphere respectively. These higher CH4 emissions from waste disposal sites in Lahore and Karachi are due to higher organic fractions in MSW and waste collection rates in both cities. Detailed calculations for estimations of methane production from waste disposal sites are provided in Table 8.

5.2. Estimation of Electrical Energy Generation from Waste Disposal Sites

Sanitary landfills with energy generation facilities can significantly contribute in this energy thirsty condition of Pakistan. In the current MSW management situation (waste composition, generation, collection, and disposal) in major cities in Pakistan, it is estimated that the waste disposal sites have the potential to produce 0.51 million tonnes of CH4 annually. The methane produced in waste disposal sites can be used in electricity generation, as fuel for vehicles, and it can also be used directly as a fuel after processing through a treatment system.
If this amount of CH4 produced from waste disposal sites would be collected, treated and utilized for electrical energy generation, about 62.4 MWh electric power would be generated at a 25% methane recovery rate. In the case of increased methane recovery rate from waste disposal sites at 50% and 75%, the electric power generation capacity would be enhanced to 142.7 MWh and 187.1 MWh respectively. The power generation capacity can be enhanced by effective realization of the source separation of MSW and increasing the waste collection rate. The estimates of electrical power generation are presented in Table 9.
The unit price of electricity in Pakistan ranges from 13.85–20.94 Pakistani Rupees (PKRs)/kWh depending on the consumption of electricity; as the unit consumption of electricity increases the cost per unit also increases [87]. Considering an average price of an electricity unit as 17.54 PKRs/kWh (0.112 United States dollar (USD)/kWh) (i.e 1 USD = 156.69 PKRs.) revenue about 9.6 billion Rupees (61.1 million USD) per year can be earned from selling the electricity generated (62.4 MW) from waste disposal sites in the major cities in Pakistan at the present MSW collection and disposal rates. The detailed calculations for revenue generation for selling the electric power in the present situation of MSW disposal is provided in Table 10.
Furthermore, funds required to develop and run (capital and operation and maintenance (O&M) costs) the power generation facilities on waste disposal sites is also estimated. Table 11 describes the detail about the cost associated with electrical power generation by using combustion engines, gas turbines, and micro turbines, along with power generation potential in the present scenario.

5.3. Estimation of Financial Outcome from Waste Service Fee

Presently, there is no government fee for MSW management services in any Pakistani city. However, in Karachi, residents are paying fees in the name of “maintenance costs” which range between 500–2000 Pakistani Rupees (PKRs.) (3.2–12.8 USD) depending on socio-economic status of the society. This fee is collected by private bodies (in most of the cases political parties) named as a “union fee” in individual residence plazas for cleaning, sweeping, and household waste collection and disposal services. The waste management service fee should be collected by the city municipal authorities to finance MSW collection, transportation, and treatment costs. For the enhancement of financial stability of municipal authorities, a minimum amount of 1 PKR/person/day or 180 PKRs/household/month (average rate is 6 persons per household) as MSW management service fee is recommended. It is computed that approximately 1.22 billion Rupees per month (7.8 million USD) in revenue can be generated from the collection of the proposed MSW service fee. Table 12 provides the details of financial outcomes from collection of MSW service fees in ten most populated cities of Pakistan.

6. Conclusions and Recommendations

After analyzing the population statistics of the last census held in 2017 and MSW management data available in the latest literature and studies, this study estimated that about 31.18 million tonnes and 9.78 million tonnes of MSW were generated Pakistan overall and the top 10 most populated cities in the country respectively. It is also estimated that annually about 0.51 million tonnes (12.8 MtCO2-eq) of methane is released from MSW disposal sites in the most populated cities considered in this study. The waste disposal sites in Lahore and Karachi possess higher methane production potential due to the higher organic fraction in MSW and higher waste collection and disposal rates in both cities. As a result, MSW disposal sites in Lahore and Karachi share 66.8% and 26.6% of total methane emissions from waste disposal sites in the most populated cities in Pakistan respectively.
Furthermore, it is estimated that, overall 62.4 MWh of electric power can be generated if 25% of methane produced annually at waste disposal sites in the top major cities is be recovered and utilized for power generation. The estimated revenue generation through selling this power is 9.58 billion PKRs (61.1 Million USD) annually at the unit cost of electrical power considered in this study (17.54 PKRs/kWh). Moreover, it is also determined that, in the case of increased methane recovery rates from waste disposal sites at 50% and 75% the electric power generation capacity would be 142.7 MWh and 187.1 MWh respectively. The power generation capacity can be enhanced by increasing the MSW collection rate.
In the present MSW management situation in Pakistan it is challenging to generate energy from waste disposal sites. Additionally, on the one hand the waste management situation in Pakistan, especially in major urban areas, has deteriorated, on the other hand major cities and small towns in the country are facing an energy shortage. Through adopting integrated solid waste management systems and generating energy from waste disposal sites, an untapped resource from waste can be utilize to face both crises in the country.
Moreover, it is highly recommended that a comprehensive legal framework regarding integrated MSW management systems should be introduced and implemented in Pakistan, including that the waste collection fee should be collected by local municipal authorities not by so called “unions”.

Author Contributions

I.S.: Conceptualization, Methodology, Formal analysis, Investigation, Writing—Original Draft, Writing—Review & Editing, Validation, Visualization M.R.: Conceptualization, Methodology, Review & Editing, Validation, Supervision, Z.A.S.: Methodology, Validation, Visualization, Writing—review & editing S.Ö.C.: Formal analysis, Investigation, Visualization, Writing—review & editing Z.K.C.: Validation, Visualization, Writing—review & editing K.K.: Resources, Visualization, Supervision, Funding acquisition. All authors have read and agreed to the published version of the manuscript.

Funding

The PhD study of (I.S.) was funded by scholarship from Higher Education Commission—HEC of Pakistan incorporation with German Academic Exchange Service (DAAD).

Institutional Review Board Statement

Not applicable.

Informed Consent Statement

Not applicable.

Data Availability Statement

Not applicable.

Acknowledgments

Publishing fees supported by Funding Programme *Open Access Publishing* of Hamburg University of Technology (TUHH), Hamburg, Germany.

Conflicts of Interest

The authors declare no conflict of interest.

References

  1. Cetrulo, T.B.; Marques, R.C.; Cetrulo, N.M.; Pinto, F.S.; Moreira, R.M.; Mendizábal-Cortés, A.D.; Malheiros, T.F. Effectiveness of solid waste policies in developing countries: A case study in Brazil. J. Clean. Prod. 2018, 205, 179–187. [Google Scholar] [CrossRef]
  2. Aleluia, J.; Ferrão, P. Characterization of urban waste management practices in developing Asian countries: A new analytical framework based on waste characteristics and urban dimension. Waste Manag. 2016, 58, 415–429. [Google Scholar] [CrossRef]
  3. Ziraba, A.K.; Haregu, T.N.; Mberu, B. A review and framework for understanding the potential impact of poor solid waste management on health in developing countries. Arch. Public Health 2016, 74, 1–11. [Google Scholar] [CrossRef] [Green Version]
  4. Ayodele, T.R.; Alao, M.A.; Ogunjuyigbe, A.S.O. Effect of collection efficiency and oxidation factor on greenhouse gas emission and life cycle cost of landfill distributed energy generation. Sustain. Cities Soc. 2020, 52, 101821. [Google Scholar] [CrossRef]
  5. Gautam, M.; Agrawal, M. Greenhouse gas emissions from municipal solid waste management: A review of global scenario. In Carbon Footprint Case Studies; Muthu, S.S., Ed.; Springer: Singapore, 2021; pp. 123–160. [Google Scholar]
  6. Mir, I.S.; Cheema, P.P.S.; Singh, S.P. Implementation analysis of solid waste management in Ludhiana city of Punjab. Environ. Chall. 2021, 2, 100023. [Google Scholar] [CrossRef]
  7. The World Bank. What a Waste 2.0: A Global Snapshot of Solid Waste Management to 2050. Available online: https://openknowledge.worldbank.org/handle/10986/30317 (accessed on 6 April 2021).
  8. Scarlat, N.; Motola, V.; Dallemand, J.F.; Monforti-Ferrario, F.; Mofor, L. Evaluation of energy potential of Municipal Solid Waste from African urban areas. Renew. Sustain. Energy Rev. 2015, 50, 1269–1286. [Google Scholar] [CrossRef]
  9. Yan, M.; Agamuthu, P.; Waluyo, J. Challenges for Sustainable Development of Waste to Energy in Developing Countries. Waste Manag. Res. 2020, 38, 229–231. [Google Scholar] [CrossRef]
  10. Weng, Y.C.; Fujiwara, T.; Houng, H.J.; Sun, C.H.; Li, W.Y.; Kuo, Y.W. Management of landfill reclamation with regard to biodiversity preservation, global warming mitigation and landfill mining: Experiences from the Asia-Pacific region. J. Clean. Prod. 2015, 104, 364–373. [Google Scholar] [CrossRef]
  11. Sohoo, I.; Ritzkowski, M.; Kuchta, K. Evaluation of behavior of waste disposal sites in Karachi, Pakistan and effects of enhanced leaching on their emission potential. Detritus 2019, 7, 96–103. [Google Scholar] [CrossRef]
  12. Bin Yousuf, T.; Rahman, M.M. Transforming an open dump into a sanitary landfill: A development effort in waste management. J. Mater. Cycles Waste Manag. 2009, 11, 277–283. [Google Scholar] [CrossRef]
  13. Osra, F.A.; Ozcan, H.K.; Alzahrani, J.S.; Alsoufi, M.S. Municipal solid waste characterization and landfill gas generation in kakia landfill, makkah. Sustainability 2021, 13, 1462. [Google Scholar] [CrossRef]
  14. Korai, M.S.; Mahar, R.B.; Uqaili, M.A. The feasibility of municipal solid waste for energy generation and its existing management practices in Pakistan. Renew. Sustain. Energy Rev. 2017, 72, 338–353. [Google Scholar] [CrossRef]
  15. IPCC. Climate Change 2013: The Physical Science Basis: Working Group I Contribution to the Fifth Assessment Report of the Intergovernmental Panel on Climate Change; Cambridge University Press: Cambridge, UK; New York, NY, USA, 2013; ISBN 110705799X. [Google Scholar]
  16. Ritzkowski, M. Clean Development Mechanism (CDM) in Landfilling. In Solid Waste Landfilling; Elsevier: Amsterdam, The Netherlands, 2018; pp. 1141–1152. [Google Scholar] [CrossRef]
  17. Nanda, S.; Berruti, F. Municipal solid waste management and landfilling technologies: A review. Environ. Chem. Lett. 2020, 19, 1433–1456. [Google Scholar] [CrossRef]
  18. Omar, H.; Rohani, S. Treatment of landfill waste, leachate and landfill gas: A review. Front. Chem. Sci. Eng. 2015, 9, 15–32. [Google Scholar] [CrossRef]
  19. Kaza, S.; Yao, L.; Bhada-Tata, P.; Van Woerden, F. What a Waste 2.0: A Global Snapshot of Solid Waste Management to 2050; The World Bank: Washington, DC, USA, 2018. [Google Scholar]
  20. Sohoo, I.; Ritzkowski, M.; Heerenklage, J.; Kuchta, K. Biochemical methane potential assessment of municipal solid waste generated in Asian cities: A case study of Karachi, Pakistan. Renew. Sustain. Energy Rev. 2021, 135, 110175. [Google Scholar] [CrossRef]
  21. Sohoo, I.; Ritzkowski, M.; Kuchta, K.; Cinar, S.Ö. Environmental Sustainability Enhancement of Waste Disposal Sites in Developing Countries through Controlling Greenhouse Gas Emissions. Sustainability 2021, 13, 151. [Google Scholar] [CrossRef]
  22. U.S. Department of Energy. Biofuels and Bioproducts from Wet and Gaseous Waste Streams: Challenges and Opportunities. Ind. Biotechnol. 2017, 13, 15–17. [Google Scholar] [CrossRef]
  23. Lee, U.; Han, J.; Wang, M. Evaluation of landfill gas emissions from municipal solid waste landfills for the life-cycle analysis of waste-to-energy pathways. J. Clean. Prod. 2017, 166, 335–342. [Google Scholar] [CrossRef]
  24. United Nation, World Economic Situation and Prospects. J. Chem. Inf. Model. 2020, 53, 1689–1699.
  25. UNFCCC. The People’s Republic of China Second Biennial Update Report on Climate Change Unofficial Translation for Reference Use Only; UNFCC: Bonn, Germany, 2018. [Google Scholar]
  26. United States Environmental Protection Agency (EPA). Greenhouse Gas Reporting Program (GHGRP). Available online: https://www.epa.gov/ghgreporting/ghgrp-waste (accessed on 6 February 2021).
  27. Watch, C. Global Historical Emissions. Available online: https://www.climatewatchdata.org/ghg-emissions?end_year=2016&start_year=1990 (accessed on 12 November 2020).
  28. Ministry of Environment, Forest and Climate Change, Government of India. India: Second Biennial Update Report to the UNFCCC; Ministry of Environment, Forest and Climate Change, Government of India: New Delhi, India, 2018; ISBN 9788193853122.
  29. USAID. Greenhouse Gas Emissions in Brazil; USAID: Washington, DC, USA, 2019. [Google Scholar]
  30. United Nations Climate Change Secretariat. Summary of GHG Emissions for Russian Federation; United Nation Climate Change Secretariat: Bonn, Germany, 2012. [Google Scholar]
  31. Department of Environmental Affairs Republic of South Africa GHG. NATIONAL INVENTORY REPORT South Africa 2000–2015; Department of Environmental Affairs Republic of South Africa: Pretoria, South Africa, 2018; pp. 1–296.
  32. Ministry of Environment and Urbanization, Republic of Turkey. Fourth Biennial Report of Turkey; Ministry of Environment and Urban Planning: Ankara, Turkey, 2019.
  33. Ministry of Environment, Egyptian Environmental Affairs Agency. Egypt’s First Biennial Update Report to the United Nations Framework Convention on Climate Change; Egyptian Environmental Affairs Agency: Cairo, Egypt, 2018; ISBN 2022524616.
  34. USAID. Greenhouse Gas Emissions in Mexico; Fact Sheet; USAID: Washington, DC, USA, 2017; pp. 2015–2017. [Google Scholar]
  35. UNFCCC. Colombia’s INDC. UN. 2015, pp. 1–10. Available online: https://www4.unfccc.int/sites/ndcstaging/PublishedDocuments/Colombia%20First/Colombia%20iNDC%20Unofficial%20translation%20Eng.pdf (accessed on 24 December 2020).
  36. USAID. Greenhouse Gas (GHG) Emissions by Sector in Bangladesh; USAID: Washington, DC, USA, 2016; pp. 2015–2017. [Google Scholar]
  37. USAID. Greenhouse Gas (GHG) Emissions by Sector 1 Change in GHG Emissions in Mexico (1990–2013); USAID: Washington, DC, USA, 2015; pp. 8–9. [Google Scholar]
  38. USAID. Greenhouse Gas Emissions in the Philippines; USAID: Washington, DC, USA, 2014; pp. 2015–2016. [Google Scholar] [CrossRef]
  39. Ministry of Climate Change Government of Pakistan. Pakistan’s Second National Communication On Climate Change-To United Nations Framework Convention On Climate Change (UNFCCC); Ministry of Climate Change: Islamabad, Pakistan, 2018.
  40. Ministry of Natural Resources and Environment Malaysia. Malaysia Biennial Update Report to the United Nations Framework Convention on Climate Change (UNFCCC); Ministry of Natural Resources and Environment Malaysia: Putrajaya, Malaysia, 2015; ISBN 9789670250236.
  41. Ministry of Natural Resources and Environment, (Thailand). Thailand’s Third National Communication (TNC) to the United Nations Framework Convention on Climate Change; Ministry of Natural Resources and Environment: Bangkok, Thailand, 2013.
  42. USAID. Greenhouse Gas Emissions in Sri Lanka; USAID: Washington, DC, USA, 2015; pp. 2014–2015. [Google Scholar]
  43. USAID. Greenhouse Gas Emissions in Indonesia; USAID: Washington, DC, USA, 2017; pp. 2016–2017. [Google Scholar]
  44. Cossu, R.; Morello, L.; Stegmann, R. Biochemical Processes in Landfill. In Solid Waste Landfilling; Elsevier: Amsterdam, The Netherlands, 2019. [Google Scholar]
  45. Ritzkowski, M.; Stegmann, R. Landfill In Situ Aeration. In Solid Waste Landfilling; Elsevier: Amsterdam, The Netherlands, 2018. [Google Scholar]
  46. Christensen, T.H.; Kjeldsen, P. Basic Biochemical Processes in Landfills. In Sanitary Landfilling: Process, Technology and Environmental Impact; Academic Press: London, UK, 2012. [Google Scholar]
  47. Önen, S.; Nsair, A.; Kuchta, K. Innovative operational strategies for biogas plant including temperature and stirring management. Waste Manag. Res. 2019, 37, 237–246. [Google Scholar] [CrossRef]
  48. GMI Landfill Methane: Reducing Emissions, Advancing Recovery and Use Opportunities. Glob. Methane Initiat. 2011, 2030, 1–4. Available online: https://www.globalmethane.org/documents/landfill_fs_eng.pdf. (accessed on 1 January 2021).
  49. Kristanto, G.A.; Koven, W. Estimating greenhouse gas emissions from municipal solid waste management in Depok, Indonesia. City Environ. Interact. 2019, 4, 100027. [Google Scholar] [CrossRef]
  50. Pariatamby, A.; Tanaka, M.; Islam, A.; Rasul, G.; Manandhar, P.; Parveen, J.A.; Ahmed, N. Municipal Solid Waste Management in Asia and the Pacific Islands; Springer: Berlin/Heidelberg, Germany, 2015. [Google Scholar]
  51. Kumar, A.; Samadder, S.R. A review on technological options of waste to energy for effective management of municipal solid waste. Waste Manag. 2017, 69, 407–422. [Google Scholar] [CrossRef]
  52. Ritzkowski, M.; Heyer, K.U.; Stegmann, R. Fundamental processes and implications during in situ aeration of old landfills. Waste Manag. 2006, 26, 356–372. [Google Scholar] [CrossRef]
  53. Wu, C.; Shimaoka, T.; Nakayama, H.; Komiya, T.; Chai, X. Stimulation of waste decomposition in an old landfill by air injection. Bioresour. Technol. 2016, 222, 66–74. [Google Scholar] [CrossRef]
  54. Sohoo, I.; Ritzkowski, M.; Kuchta, K. Influence of moisture content and leachate recirculation on oxygen consumption and waste stabilization in post aeration phase of landfill operation. Sci. Total Environ. 2021, 773, 145584. [Google Scholar] [CrossRef]
  55. Pakistan Bureau of Statistics, Government of Pakistan. 6th Pakistan Population and Housing Census 2017; Pakistan Bureau of Statistics, Government of Pakistan: Islamabad, Pakistan, 2017.
  56. Qasim, M.; Kotani, K. An empirical analysis of energy demand in Pakistan. Econ. Bull. 2014, 34, 452–458. [Google Scholar]
  57. Safar, K.M.; Bux, M.R.; Faria, U.; Pervez, S. Integrated model of municipal solid waste management for energy recovery in Pakistan. Energy 2021, 219, 119632. [Google Scholar] [CrossRef]
  58. Korai, M.S.; Ali, M.; Lei, C.; Mahar, R.B.; Yue, D. Comparison of MSW management practices in Pakistan and China. J. Mater. Cycles Waste Manag. 2019, 22, 443–453. [Google Scholar] [CrossRef]
  59. Shahid, M.; Nergis, Y.; Siddiqui, S.A.; Choudhry, A.F. Environmental impact of municipal solid waste in Karachi city. World Appl. Sci. J. 2014, 29, 1516–1526. [Google Scholar] [CrossRef]
  60. Zuberi, M.J.S.; Ali, S.F. Greenhouse effect reduction by recovering energy from waste landfills in Pakistan. Renew. Sustain. Energy Rev. 2015, 44, 117–131. [Google Scholar] [CrossRef]
  61. Pakistan Environmental Protection Agency. (Draft) Guideline for Solid Waste Management; Pakistan Environmental Protection Agency: Islamabad, Pakistan, 2005; pp. 1–7.
  62. Hoornweg, D.; Perinaz, B.-T. What a Waste: A Global Review of Solid Waste Management; World Bank: Washington, DC, USA, 2012; p. 93. [Google Scholar] [CrossRef]
  63. Korai, M.S.; Mahar, R.B.; Uqaili, M.A.; Brohi, K.M. Assessment of municipal solid waste management practices and energy recovery potential in Pakistan. In Proceedings of the 14th International Conference on Environmental Science and Technology, Rhodes, Greece, 3–5 September 2015. [Google Scholar]
  64. Sarwar, S.G.; Naeem, M.A.; Abbas, Z.; Waheed, A. Assessing the Site Selection, Operation and Management of Waste Disposal Site in Islamabad. Tech. J. 2018, 23, 9–20. [Google Scholar]
  65. Abdel-Shafy, H.I.; Mansour, M.S.M. Solid waste issue: Sources, composition, disposal, recycling, and valorization. Egypt. J. Pet. 2018, 27, 1275–1290. [Google Scholar] [CrossRef]
  66. Assamoi, B.; Lawryshyn, Y. The environmental comparison of landfilling vs. incineration of MSW accounting for waste diversion. Waste Manag. 2012, 32, 1019–1030. [Google Scholar] [CrossRef]
  67. Mahar, A.; Malik, R.N.; Qadir, A.; Ahmed, T.; Khan, Z.; Khan, M.A. Review and analysis of current solid waste management situation in urban areas of Pakistan. In Proceedings of the International Conference on Sustainable Solid Waste Management, Tamil Nadu, India, 5–7 September 2007; Volume 8, p. 36. [Google Scholar]
  68. Masood, M.; Barlow, C.Y.; Wilson, D.C. An assessment of the current municipal solid waste management system in Lahore, Pakistan. Waste Manag. Res. 2014, 32, 834–847. [Google Scholar] [CrossRef]
  69. Safar, K.M.; Sahito, A.R. Characterization and Aerobic Biological Treatment of MSW: A Case Study of Hyderabad City. Mehran Univ. Res. J. Eng. Technol. 2014, 33, 322–329. [Google Scholar]
  70. Aslam, S.; Ali, F.; Naseer, A.; Sheikh, Z. Application of material flow analysis for the assessment of current municipal solid waste management in Karachi, Pakistan. Waste Manag. Res. 2021. [Google Scholar] [CrossRef]
  71. City District Government, Multan. Establishing Integrated Solid Waste Management in the Large Cities of Pakistan Comprehensive Scope Evaluation Report; World Bank: Washington, DC, USA, 2010; Volume 2010.
  72. Express Tribune, CDA, MCI Collect Almost 700 Tons of Solid Waste on Daily Basis. Published on 19 August 2018. Available online: https://tribune.com.pk/story/1784246/cda-mci-collect-almost-700-tons-solid-waste-daily-basis (accessed on 6 February 2021).
  73. Ashraf, U.; Hameed, I.; Chaudhary, M.N. Solid waste management practices under public and private sector in Lahore, Pakistan. Bull. Environ. Stud. 2016, 1, 98–105. [Google Scholar]
  74. Mir, K.A.; Ijaz, M. Greenhouse Gas Emission Inventory of Pakistan for the Year 2011–2012; Global Change Impact Studies Centre (GCISC), Ministry of Climate Change: Islamabad, Pakistan, 2016; GCISC-RR-19; ISBN 9789699395208. [Google Scholar]
  75. IPCC. 2006 IPCC—Guidelines for National Greenhouse Gas Inventories Programme; Eggleston, H.S., Buendia, L., Miwa, K., Ngara, T., Tanabe, K., Eds.; c/o Institute for Global Environmental Strategies 2108-11: Kanagawa, Japan, 2006; ISBN 4-88788-032-4. [Google Scholar]
  76. Machado, S.L.; Carvalho, M.F.; Gourc, J.P.; Vilar, O.M.; do Nascimento, J.C.F. Methane generation in tropical landfills: Simplified methods and field results. Waste Manag. 2009, 29, 153–161. [Google Scholar] [CrossRef] [PubMed]
  77. Johari, A.; Ahmed, S.I.; Hashim, H.; Alkali, H.; Ramli, M. Economic and environmental benefits of landfill gas from municipal solid waste in Malaysia. Renew. Sustain. Energy Rev. 2012, 16, 2907–2912. [Google Scholar] [CrossRef]
  78. Ogunjuyigbe, A.S.O.; Ayodele, T.R.; Alao, M.A. Electricity generation from municipal solid waste in some selected cities of Nigeria: An assessment of feasibility, potential and technologies. Renew. Sustain. Energy Rev. 2017, 80, 149–162. [Google Scholar] [CrossRef]
  79. IPCC, Intergovernmental Panel on Climate Change. Conceptual Basis for Uncertainty Analysis. In Good Practice Guidance and Uncertainty Management in National Greenhouse Gas Inventories; 2000. Available online: http://documentacion.ideam.gov.co/openbiblio/bvirtual/018673/gp/english/A1_Conceptual.pdf (accessed on 6 March 2021).
  80. Houhton, E. Climate Change 1995: The Science of Climate Change: Contribution of Working Group I to the Second Assessment Report of the Intergovernmental Panel on Climate Change; Cambridge University Press: Cambridge, UK, 1996; Volume 2, ISBN 0521564360. [Google Scholar]
  81. Singh, C.S.; Kumar, A.; Roy, S.S. Estimating Potential Methane Emission from Municipal Solid Waste and a Site Suitability Analysis of Existing Landfills in Delhi, India. Technologies 2017, 5, 62. [Google Scholar] [CrossRef] [Green Version]
  82. Islam, K.M.N. Municipal Solid Waste to Energy Generation in Bangladesh: Possible Scenarios to Generate Renewable Electricity in Dhaka and Chittagong City. J. Renew. Energy 2016, 2016, 1–16. [Google Scholar] [CrossRef] [Green Version]
  83. Thorneloe, S. Background Information Document for Updating AP42 Section 2.4 for Estimating Emissions from Municipal Solid Waste Landfills; Citeseer; Pennsylvania State University: State College, PA, USA, 2008. [Google Scholar]
  84. United States Environmental Protection Agency (EPA). LFG Energy Project Development Handbook; United States Environmental Protection Agency (EPA): Washington, DC, USA, 2017.
  85. Khartchenko, N.V.; Kharchenko, V.M. Advanced Energy Systems; CRC Press: Boca Raton, FL, USA, 2013; ISBN 143988658X. [Google Scholar]
  86. IPCC, Intergovernmental Panel on Climate Change; Houghton, J.T. Revised 1996 IPCC Guidelines for National Greenhouse Gas Inventories: Greenhouse Gas Inventory Workbook; OECD, 1996. Available online: https://www.ipcc-nggip.iges.or.jp/public/2006gl/vol5.html (accessed on 15 January 2021).
  87. Lahore Electric Supply Company Schedule of Electricity Tariff W.E.F 2019. Available online: https://lescobillonline.net/lesco-tariff/ (accessed on 1 February 2021).
Figure 1. Worldwide share of waste management strategies [7].
Energies 14 02444 g001
Figure 2. Scheme of biochemical reactions during anaerobic digestion in landfill [4].
Energies 14 02444 g002
Figure 3. Scheme of landfill gas (LFG) collection and power generation from landfill.
Energies 14 02444 g003
Figure 4. Aerial views of MSW disposal sites in major cities in Pakistan (Google maps).
Energies 14 02444 g004
Table 1. Greenhouse gas (GHG) emissions from the municipal solid waste (MSW) sector in developing countries.
CountryGHG Emissions from MSW Sector Million Tones CO2-Eq (Mt CO2-Eq)YearReference
China1042014[24,25]
USA91.032019[26]
European Union (EU-27)108.72018[27]
India14.862014[28]
Brazil45.522014[29]
Russia53.412012[24,30]
South Africa15.762015[31]
Turkey9.12017[32]
Egypt13.192015[33]
Mexico30.92013[34]
Colombia13.712010[35]
Bangladesh18.282012[36]
Cambodia0.392013[37]
The Philippines10.42012[38]
Pakistan12.452015[39]
Malaysia 34.322011[40]
Thailand11.822013[41]
Sri Lanka12.472011[42]
Indonesia64.72013[43]
Global15602016[27]
Table 2. Quantity of MSW generation in top ten populated cities of Pakistan.
No.CityPopulation
(Million) [55]
MSW Generation Rate (k/c/d) [63]MSW Quantity (t/day)MSW Quantity (Mt/year)
1.Karachi14.910.76111,3474.14
2.Lahore11.120.7583403.04
3.Faisalabad3.200.4815380.56
4.Rawalpindi2.090.4539500.35
5.Gujranwala2.070.5110340.38
6.Peshawar1.970.4899630.35
7.Multan1.870.325990.22
8.Hyderabad1.720.712130.44
9.Islamabad1.010.81 [63]8220.3
10.Quetta1.000.3783780.14
Remaining urban areas34.630.61221,1937.74
Rural areas132.1840.28337,40813.65
Total207.77 85,42531.18
Including 5% Hazardous waste 42711.56
Grand total 89,69632.74
Note: Kg/c/y; kg/capita/year, kg/c/d; kg/capita/day, t/d; tonnes/day, Mt; Million tonnes.
Table 3. Summary of MSW generation in Pakistan.
Administrative UnitPopulationShare in Pakistani PopulationShare in Urban PopulationMSW
Generation
Share in Pakistani Waste GenerationShare in the Urban Waste GenerationMSW GenerationMSW Generation
(million)(%)(%)(million tonnes/year)(%)(%)(kg/c/y)(kg/c/d)
Pakistan207.77100031.1810001500.41
Top ten populated cities40.9620549.7831562380.65
Remaining urban areas34.6317467.7425442230.61
Total Urban75.5936.3810017.51561002320.63
Rural areas132.18463.62013.654401030.28
Hazardous waste 1.565
Total waste quantity 32.74
Note: Kg/c/y; kg/capita/year, kg/c/d; kg/capita/day.
Table 4. Physical composition (% wet weight basis) of MSW major cities in Pakistan.
MSW
Components
KarachiLahoreFaisalabadGujranwalaPeshawarMultanHyderabadQuettaIslamabad
[%][59][68][61][61][61][59][69][61][63]
Plastics & Rubber812.64.853.74.39.858.23
Metals1.10.10.20.30.30.33.660.2
Paper82.42.12.52.12.45.892.210
Cardboard 1.61.81.9-6.701.3
Textile7.69.15.23.24.36.92.075.15
Hazardous waste 1.5
Glass5.60.81.31.51.30.86.081.53
Bones 2.93.21.71.3-2
Food waste26.1 17.214.713.832.430.8214.358
Organics 64.8
Animal waste 0.817.52.7-1.7
Combustibles 2.1
Green waste17 15.612.813.620.213.8510.2
Tetra Pack101
Wood3.1 0.70.80.61.31.841.520
Fine3.7 4347.542 18.1344
Stones 4.65.77.227.4-7.8
E-waste 0.3
Others9.85.3 1.11 1
Total100100100100100100100100100
Table 5. Estimated MSW collection rate in major cities of Pakistan.
CityMSW GenerationMSW Collection RateMSW CollectionMSW Collection
(tonns/day) *(%) †(tonnes/day)(tonnes/year)
Karachi11,34775 **85103,106,241
Lahore83456856752,071,229
Faisalabad153854830303,109
Gujranwala103452538196,210
Peshawar96361588214,490
Multan59956 ‡335122,434
Hyderabad121351619225,779
Quetta3785018969,068
Islamabad82285.2700**255,500
From Table 1 *, [61] †, [70] **, ‡ [71] and [72]
Table 6. Sector wise GHG emissions in Pakistan in 1994, 2008, 2012, and 2015 (MtCO2-eq) [39].
Sector1994200820122015
Energy85.816156.821171.44184.0
Industry13.29717.86619.59521.85
Agriculture71.632120.284162.86174.56
Land Use Change and Forestry (LUCF)6.5278.929.67110.39
Waste4.4575.50510.55415.65
Total181.7309.4374.1406.45
Table 7. IPCC default values and range for degradable organic carbon (DOC) content in wet waste [75].
Waste TypeDefault ValueRange
Food waste0.150.08–0.20
Garden0.20.18–0.22
Paper0.40.36–0.45
Wood and straw0.430.39–0.46
Textiles0.240.20–0.40
Disposable nappies0.240.18–0.32
Sewage sludge0.050.04–0.05
Rubber0.390.39
Bulk MSW waste0.180.12–0.28
Industrial waste0.150–0.54
Table 8. Estimated CH4 production from waste disposal sites in the most populous cities in Pakistan.
CityMSWt * (Mt/year)MSWf **MCFDOC †DOCfF(16/12)CH4 t/year ‡Mt CO2-eq/year
Karachi4.140.750.60.140.770.51.33135,9703.4
Lahore3.040.680.60.540.770.51.33340,9768.5
Faisalabad0.560.540.60.090.770.51.3381290.2
Gujranwala0.370.520.60.080.770.51.3345800.11
Peshawar0.350.610.60.080.770.51.3350610.13
Multan0.210.560.60.120.770.51.3345400.11
Hyderabad0.440.510.60.140.770.51.3395150.24
Quetta0.130.50.60.070.770.51.3315820.04
Islamabad0.30.850.60.230.770.51.3317,6290.44
Total9.27 507,32612.7
Note: * Taken from Table 1, ** Taken from Table 5, † Calculated from Equation (2) and ‡ Calculated from Equation (1).
Table 9. Power generation from potential from different methane recovery rates.
CityMethane PotentialPower Generation (MWh)
CH4 Recovery 25%CH4 Recovery 50%CH4 Recovery 75%
(Tonnes/Year)
Karachi13597016.6133.2249.84
Lahore34097641.6683.32124.98
Faisalabad81290.991.992.98
Gujranwala45800.561.121.68
Peshawar50610.621.241.85
Multan45400.551.111.66
Hyderabad95151.162.323.49
Quetta15820.190.390.58
Islamabad176922.154.316.46
Total51035262.4124.7187.1
Table 10. Detailed calculations for financial benefits from selling the electric power generated at 25% CH4 recovery rate.
CityElectric PowerRevenue Generation
UnitsUnitsUnit PriceDailyAnnual
MWhkWh(PKRs)(Million PKRs)(Million PKRs)(Million USD)
Karachi16.6166122913816.992552.516.3
Lahore41.74165973070217.546400.940.9
Faisalabad1.0993174200.42152.61.0
Gujranwala0.656098140.2486.00.5
Peshawar0.6618108450.2695.00.6
Multan0.655597290.2385.20.5
Hyderabad1.21162203900.49178.61.1
Quetta0.219333900.0829.70.2
Islamabad2.22154377790.91330.92.1
Total62.462353109367126.259580.661.1
Table 11. Evaluation of power generation cost in present situation by using different technologies * [84], [† Table 10].
TechnologyAv. Elec. Efficiency ηe
(%) *
Power Generation (MW) †Cost of Machine ($/kW) *Annual O & M cost ($/kW) *Overall Cost Power Gen. (Million $/year)
I.C Engine3062.41800250127.8
Gas Turbine2449.9150016082.8
Micro Turbine4287.33000280286.3
Table 12. Estimated financial outcome form proposed MSW services fee.
CityPopulationHouseholdsResidentsMSW FeeMSW Fee CollectionMSW Fee CollectionMSW Fee Collection
(Million) *(Million) [55]persons/house(PKRs./house/month)(Million PKRs/month)(Billion PKRs/year)(Million USD/year)
Karachi14.912.586180463.75.635.5
Lahore11.121.766180316.43.824.2
Faisalabad3.200.59515089.11.16.8
Rawalpindi2.090.47412056.50.74.3
Gujranwala2.070.45515066.90.85.1
Peshawar1.970.24824056.70.74.3
Multan1.870.33618059.60.74.6
Hyderabad1.720.36515054.50.74.2
Islamabad1.010.17618030.80.42.4
Quetta1.000.13824030.90.42.4
Total40.967.07 1224.914.793.8
* Taken from Table 2.
Publisher’s Note: MDPI stays neutral with regard to jurisdictional claims in published maps and institutional affiliations.

