
Design and Energy Consumption Analysis of Small Reverse Osmosis Seawater Desalination Equipment


1
College of Mechanical and Electrical Engineering, Harbin Engineering University, Harbin 150001, China
2
School of Mechanical Engineering, Hebei University of Technology, Tianjin 300401, China
*
Author to whom correspondence should be addressed.
Energies 2021, 14(8), 2275; https://doi.org/10.3390/en14082275
Submission received: 16 March 2021
/
Revised: 11 April 2021
/
Accepted: 14 April 2021
/
Published: 18 April 2021
Abstract
:The reverse osmosis method has developed extremely rapidly in recent years and has become the most competitive seawater desalination technology in the world, and it has been widely used in all aspects. Large-scale reverse osmosis desalination plants cannot provide fresh water resources in areas with insufficient water resources and limited space. Therefore, this paper proposes a research plan for a small seawater desalination device based on reverse osmosis, which is mainly suitable for handling emergencies, disaster relief, desert areas and outdoor activities and other needs for timely freshwater resources. It mainly includes pretreatment modules, a reaction infiltration module, a post-processing module and an energy supply module. Detailed design calculations are carried out for the small-scale reverse osmosis membrane system, including the selection and quantity and arrangement of membranes. Subsequently, the one-stage two-stage small-scale reverse osmosis membrane system was modeled, and its energy consumption was analyzed theoretically from the perspectives of specific energy consumption and energy utilization efficiency; the main influencing factors were clarified, and the optimal recovery rate for system operation was determined to be 20%–30%. Finally, an experimental prototype was built to conduct relevant experiments to determine the influence trend of pressure, temperature, concentration, and flow rate on the operating performance of the reverse osmosis system.
1. Introduction
Water is an indispensable substance for the maintenance of life on the earth and the source of continuous progress and development of human society. Although water is a natural renewable resource, the freshwater resources on the earth only account for a small part of the total water resources, and the proportion of easily developed freshwater resources is even smaller, so the freshwater resources on the earth are very scarce. Due to population growth, rapid urbanization and global climate change, traditional water sources closely related to human life such as lakes, rivers and groundwater resources are insufficient to meet the increasing demand for high-quality drinking water [1,2].
The reverse osmosis method has developed rapidly in recent years. The pretreatment technology can reduce the pollution degree of the reverse osmosis membrane system and increase the life of the membrane. The efficiency of the high-pressure pump is constantly improving, making the reverse osmosis system perform well according to safety considerations and in lowering energy consumption. Its advantages such as convenience, convenient water production and low energy consumption make it advantageous compared to other methods in small seawater desalination equipment and reverse osmosis technology that has been widely used [3,4].
In order to evaluate and improve the performance of the reverse osmosis system based on thermodynamics, in the past few decades many scholars have developed mathematical models for research and analysis. The main research method is to establish a mathematical model and cooperate with software simulation, and finally compare and analyze experimental data to verify the feasibility of the theory.
In 2007, Lu [5] of the Ocean University of China conducted a network design optimization study on the reverse osmosis desalination system. The author established a superstructure mathematical model using the state space method. This model can be derived from many methods such as equal pressure mixing constraints. The optimal scheme is solved in the design scheme. In 2011, Cui [6] of Texas Tech University in the United States defined ideal reverse osmosis as the most energy-efficient seawater desalination reverse osmosis process under the required permeate flux, and then analyzed the cross-flow reverse osmosis process. The energy source is the minimum energy of thermodynamics, the additional energy required and the remaining energy of the retentate. Finally, the energy efficiency of the cross-flow reverse osmosis process under different recovery rates is evaluated. In 2012, Clarke et al. [7] of Edith Cowan University, Australia, conducted a modeling analysis of a small solar photovoltaic power generation system, verifying and concluding that the use of media to store excess renewable energy has a greater impact on the performance of small systems. In 2013, Rathore et al. [8] of Nehru National Institute of Technology, India, established a reverse osmosis membrane material transport model, which was based on the concentration polarization coupling model of the unsteady state material balance. The concentration of concentration polarization layer on reverse osmosis membrane was studied from two aspects of concentration and solute concentration. In 2014, Dimitrioua [9] of the Agricultural University of Athens, Greece et al. conducted simulations and experimental research on seawater desalination equipment under full load and partial load conditions. The experimental results show that the high specific energy consumption occurs because of the low seawater temperature and the low power factor of the water supply motor. The operation of the seawater desalination unit under partial load can result in lower specific energy consumption than full load operation. In 2017, Karabelas [10] of the University of Thessaloniki, Greece et al. analyzed the effects of various factors in the reverse osmosis desalination process versus energy consumption, and identified the factors with the greatest potential for energy reduction. Specific energy consumption mainly comes from the osmotic pressure of the retentate, the resistance of the fluid through the membrane, the friction loss in the retentate of the reverse osmosis membrane element and the permeate channel, and the non-ideal operation of the high-pressure pump and the energy recovery device. In 2019, Zheng [11] of Hangzhou Dianzi University conducted an analysis and research on the robust optimization scheduling of reverse osmosis processes in uncertain environments. The author used a genetic-simulated annealing algorithm to numerically solve the model and found that a robust scheduling scheme can optimize the reverse osmosis system better than a static scheduling scheme. In 2019, Lacroix [12] introduced a new type of thermal power reverse osmosis desalination process. This new thermal hydraulic process used solar energy to pressurize sea water and made it exceed osmotic pressure, to desalinate it. This pressurization is due to the piston or film in the reservoir by following the working fluid movement of the thermodynamic cycle similar to the organic Rankine cycle. The device is designed for small-scale desalination of brackish water. The solar collector can produce 500 L of drinking water per square meter per day.
The operating parameters of the reverse osmosis system are also very important to their working conditions. Many scholars have conducted theoretical model research and experimental verification analysis to find the best operating parameters.
In 2012, Altaee [13] developed a calculation model for RO (Reverse Osmosis) system design and performance prediction. The purpose of this model is to estimate the performance parameters of RO in a multi membrane pressure vessel. This study may be the first to propose a systematic program to estimate the performance of multiple RO elements in pressure vessels. In 2015, Choi et al. [14] of the Korea Institute of Building Technology developed a design method based on simulation technology by analyzing the effects of maximizing permeation flux, minimizing energy consumption, and minimizing boron concentration in the permeate trend to optimize the dual-pass reverse osmosis seawater desalination system. In 2016, Wang [15] from the Zhejiang University of Technology optimized and compared the operating parameters of the marine desalination system through an orthogonal experiment method and a neural network model method. It showed that the neural network model method has a smaller optimization error for the relevant parameters of the reverse osmosis system, which provides a new way of thinking for the research on the performance of reverse osmosis. In 2020, Koutsou [16] of the University of Thessaloniki, Greece, studied the effect of feed water temperature on the performance of a typical reverse osmosis device and found different conclusions about the range of influence of seawater temperature with different salinity. For high salinity in seawater, the specific energy consumption reaches the minimum at a temperature of about 30 °C, and the significant increase in osmotic pressure will offset the positive effects of temperature rise.
In 2017, Zhang [17] of the School of Mechanical Engineering of the Zhejiang University of Technology designed a set of island energy-saving integrated desalination devices with a daily fresh water output of 25 m3/d, and reduced the water production energy consumption of the small desalination system. In 2019, Su et al. [18] from the Tianjin Desalination and Comprehensive Utilization Research Institute developed a cabinet type reverse osmosis desalination equipment based on the previous device. The space occupied by the equipment is about 20 m3, and the pretreatment process includes a multi-media filter and a precision filter. Compared with the previous device, the volume of the equipment is reduced by more than half, and the water yield can reach 55 m3/d.
In areas with insufficient water resources and small available space, seawater desalination plants do not have sufficient conditions for application due to the large-scale equipment, large water supply demand, and high energy consumption requirements. Therefore, considering the demand for mobile desalination devices in many cases, such as islands, yachts and offshore operating platforms, as well as the need for timely freshwater resources such as emergency handling, disaster relief, desert areas and outdoor entertainment, the research is applicable to the desalination technology of small-capacity and convenient equipment is of great significance [19,20].
The purpose of this paper is to put forward a convenient mobile design scheme based on the reverse osmosis method, based on existing small seawater desalination equipment, which aims to increase the versatility of small seawater desalination equipment based on ensuring fresh water production and fresh water quality, to meet the requirements of use in special environments. Compared with the devices designed by Zhang [17] and Su [18], this device has more advantages in portability and volume. The small-scale reverse osmosis membrane system is designed in detail, and its energy consumption is analyzed in detail. Finally, the influence trend of different operating parameters on the performance of the reverse osmosis system is established through the experimental prototype.
2. Overall Design
2.1. Design Specifications
The small-scale reverse osmosis desalination equipment proposed in this article has a smaller footprint, compact structure, and simple installation. It can be used for conventional desalination supplies, and is also suitable for emergency situations, outdoor entertainment, marine, island or desert use. It is both a desalinator and a water purifier, which can produce high-quality, good-tasting drinking water from various water sources including sea water, river water, lake water, brackish water or polluted water sources.
The small-scale reverse osmosis seawater desalination device can meet the water consumption of two people in one day. According to the national and industrial standards of reverse osmosis equipment [21,22], the specific design indicators are as follows:
- Volume: less than 0.3 m3;
- Weight: less than 50 kg;
- Target water production: 40 L/h, intermittent work;
- System energy consumption: below 5 kWh/m3;
- TDS (Total Dissolved Solids) of produced water quality: less than 500 mg/L;
- Recovery rate: more than 15%;
- Desalination rate: above 99%.
2.2. Process Flow
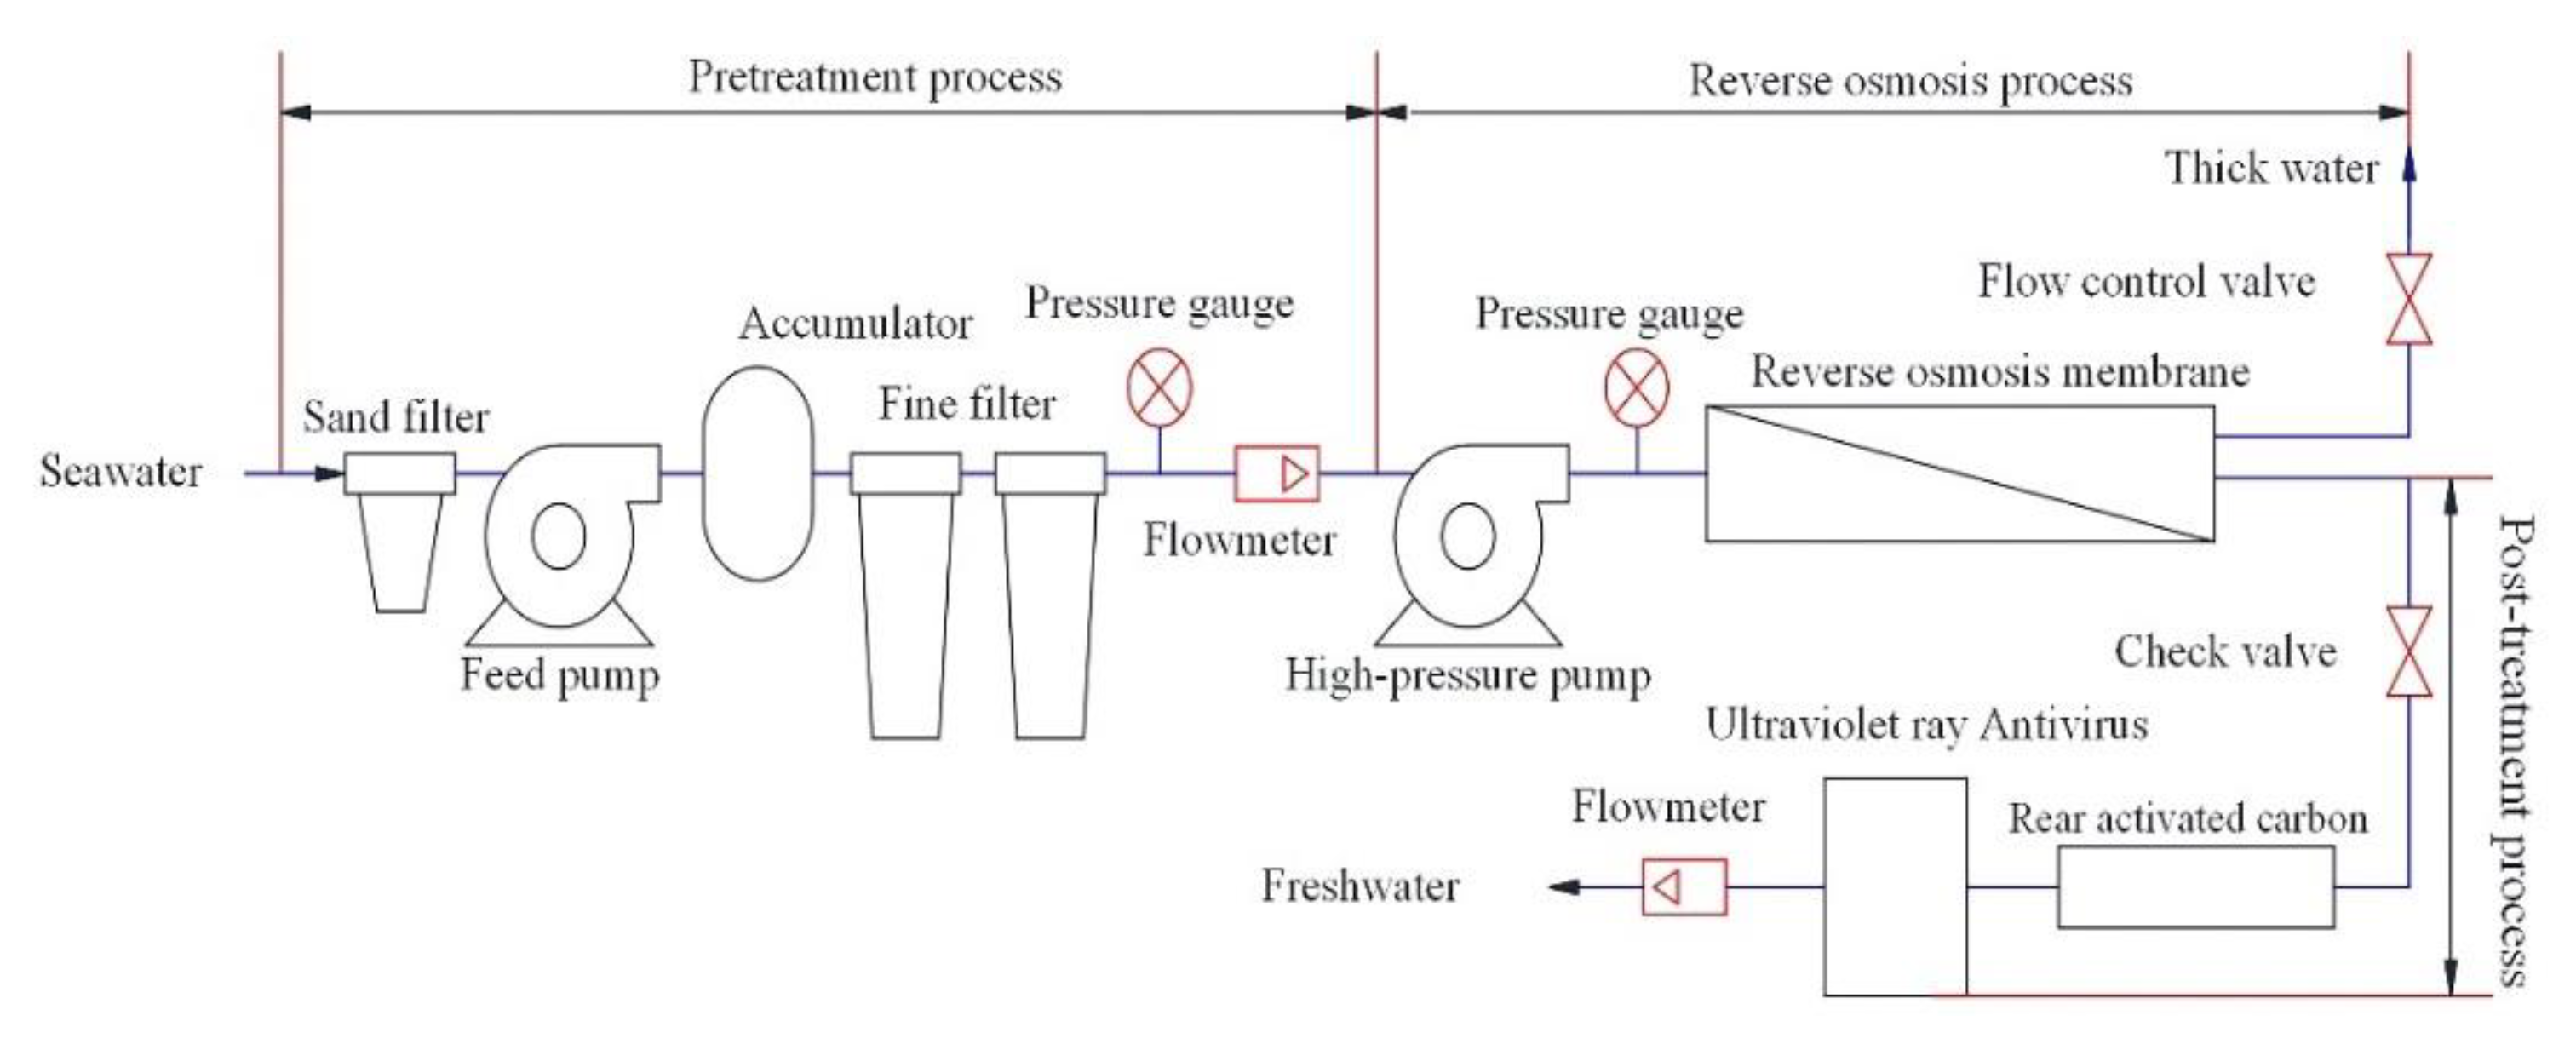
According to the design index of small reverse osmosis seawater desalination equipment, the following seawater desalination process flow is designed. The seawater is pressurized by the feed pump and enters the device through the first-stage sand filter pretreatment device, then through the accumulator, next it enters the second and third-stage fine filtration pretreatment devices in turn, and then increases the pressure by the high-pressure pump, and enters reverse osmosis membrane module. Part of the seawater passing through the reverse osmosis membrane passes through the post activated carbon filter, and then flows into the fresh water storage tank after being purified by the ultraviolet disinfection device. The other part of the concentrated water is discharged through the flow control valve. The overall process flow of the equipment is shown in Figure 1.
2.3. Overall Structure Integrated Design
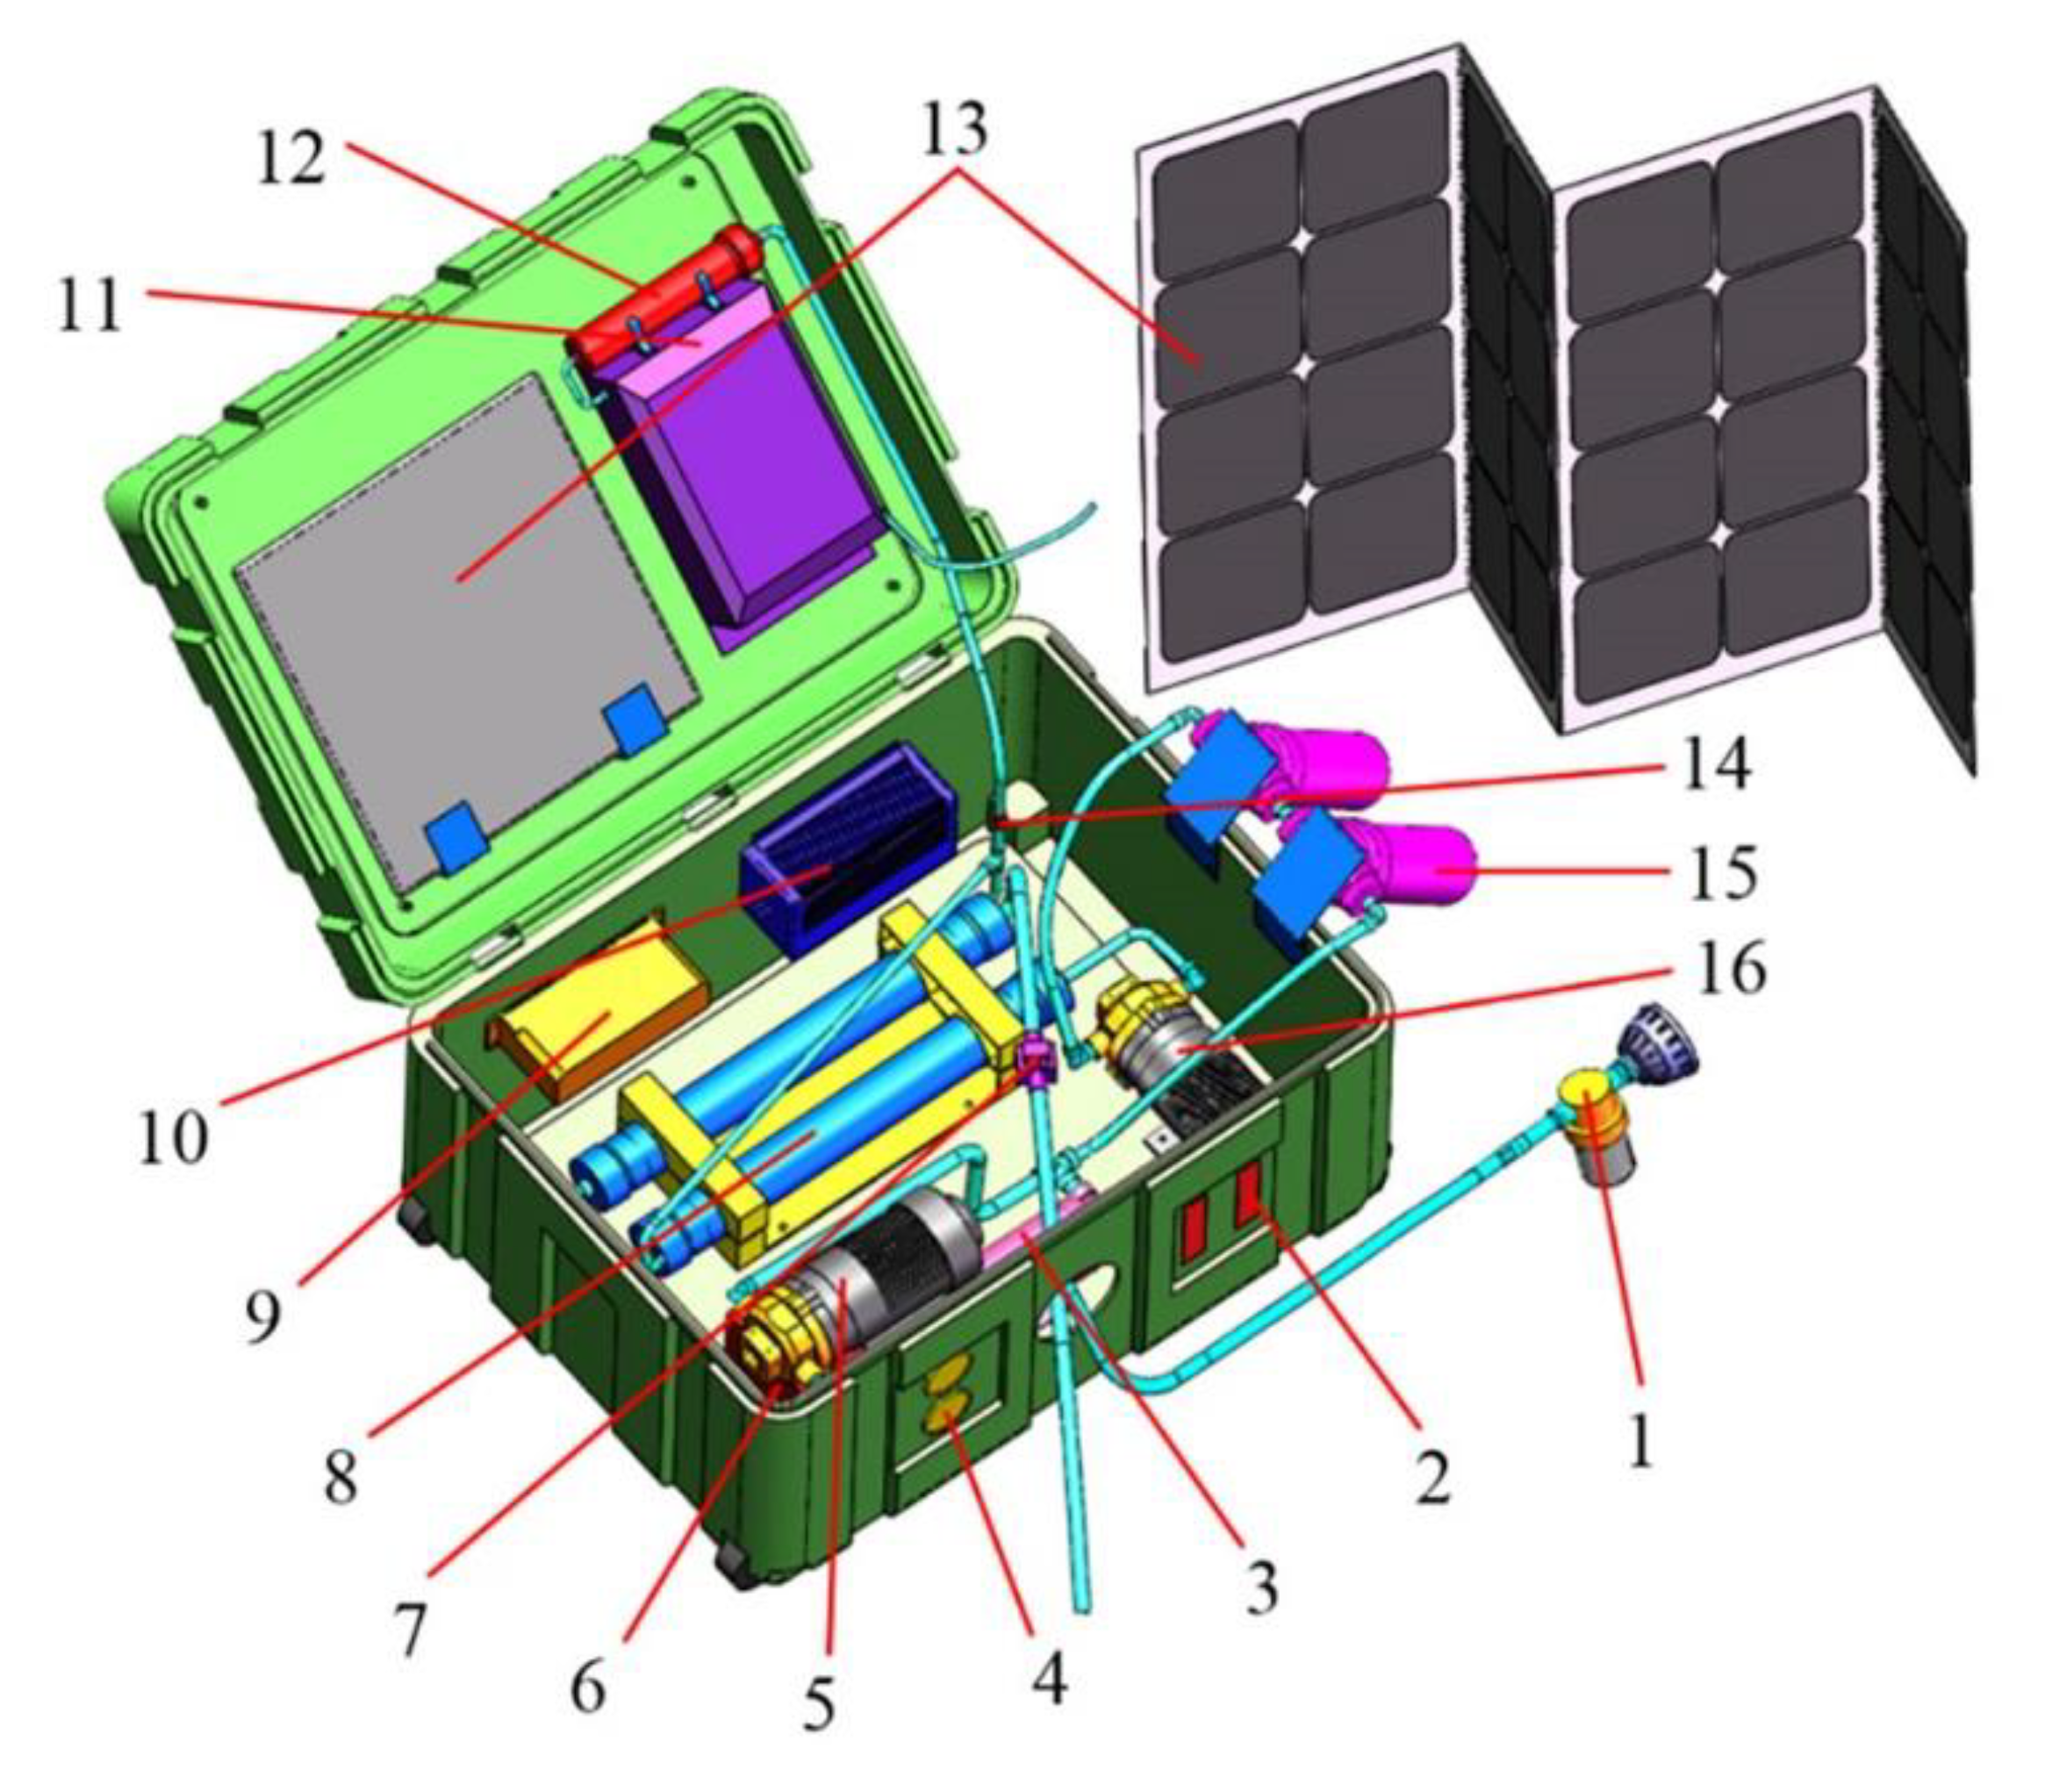
According to the process flow of the small-scale reverse osmosis system and the structural characteristics of the reverse osmosis device itself, adopting the progressive structure method of the blocking filter principle, the preliminary design of the overall structure scheme is shown in Figure 2. In order to ensure that the desalination equipment is easy to move and carry, the overall structure of the small reverse osmosis seawater desalination device is integrated and designed; the required components are arranged as small as possible and the structure is as compact as possible.
The equipment is built in a durable military-grade molded plastic shell, and it is transported in a pull-box type, and solar power is added to the traditional small reverse osmosis desalination device to improve its adaptability to different environments. The small-scale reverse osmosis seawater desalination device is mainly composed of a pretreatment module, a reverse osmosis module, a post-treatment module and an energy supply module. The components of each module are concentrated in the box in a folding arrangement method, and the space in the box is fully utilized by the dense arrangement, which can effectively reduce the volume and facilitate carrying. In order to facilitate the disassembly and assembly, most of the components are fixed by bolts, enabling easy replacement of the components. The size of the device is 800 × 600 × 460 mm, and the overall mass in working condition is about 50 kg.
All module components, pipe fittings and boxes of the seawater desalination device must be designed for corrosion protection, otherwise the corrosion products of the components will affect the normal operation of the reverse osmosis system and affect the quality of the water produced. Pumps, meters and other components should not only use anti-corrosion materials, but should also receive paint protection treatment. The military box is made of materials that can withstand high pressure, high and low temperature changes and seawater chloride ion corrosion. The high-pressure pipe fittings are made of SS316 stainless steel, which is widely used in the marine industry and has strong corrosion resistance and chloride resistance. Low-pressure pipe fittings use high-quality UPVC (Unplasticized Polyvinyl Chloride) pipe fittings, which have the advantages of corrosion resistance, heat resistance and impact resistance [23].
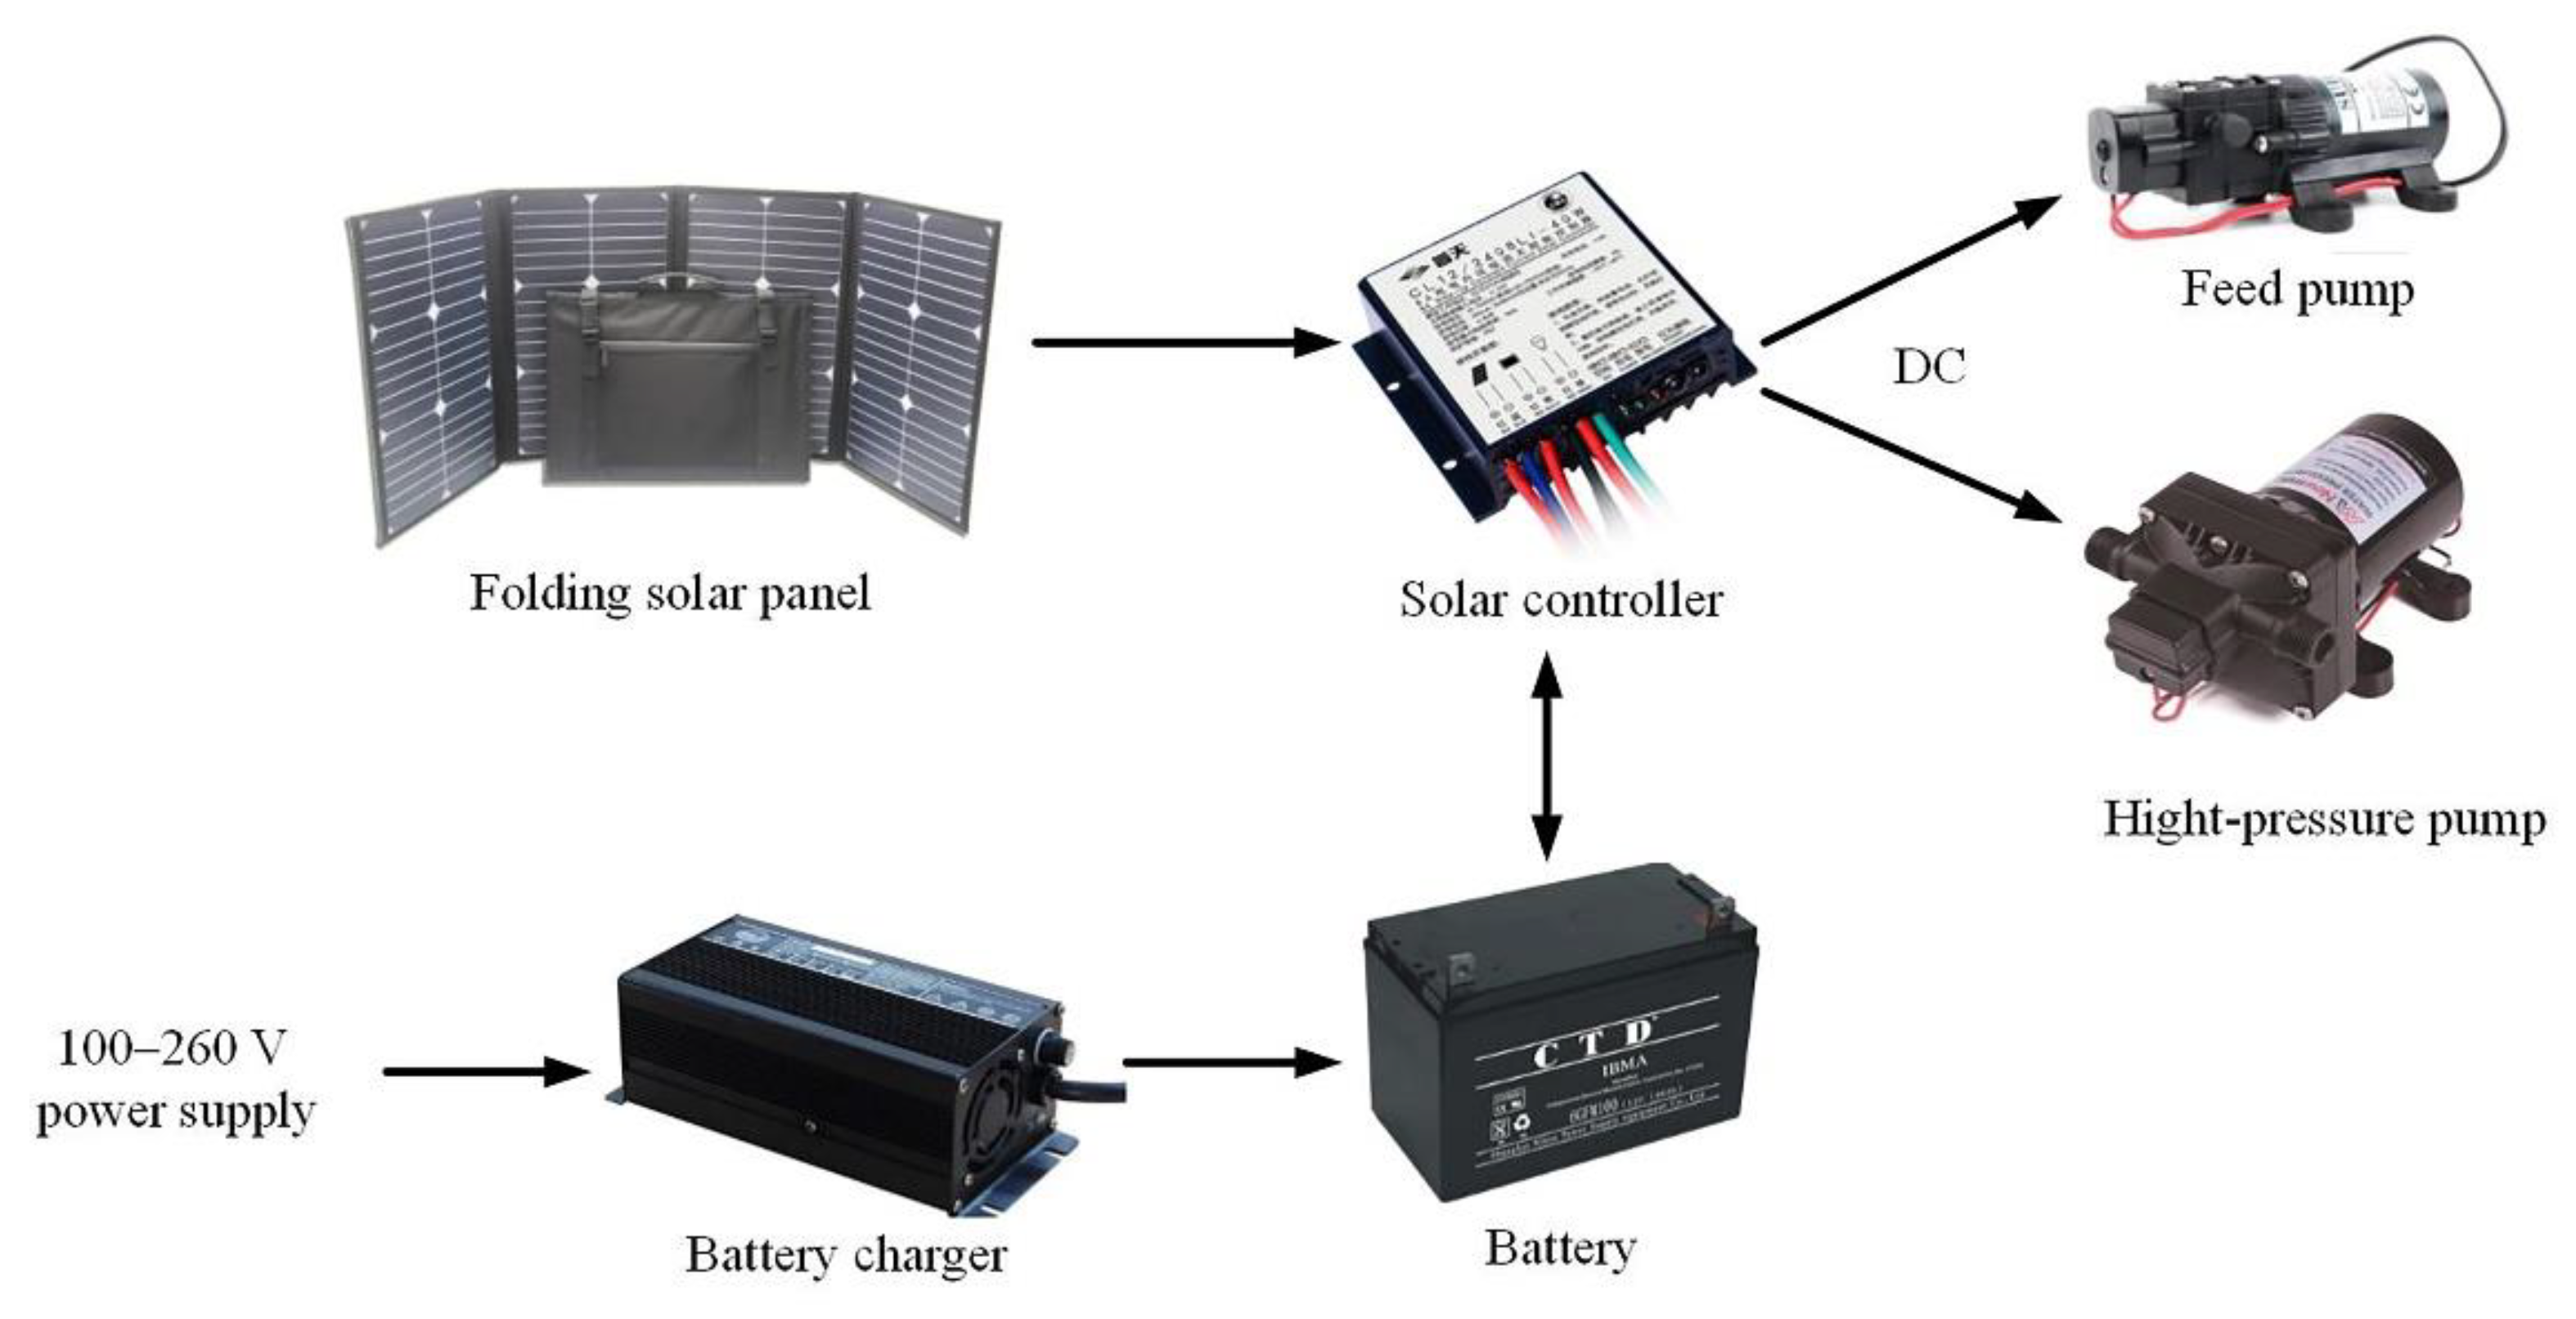
In addition to the conventional direct external DC power supply operation, the power supply module is also designed with a power storage system that can charge the battery through 220 V AC power or the photovoltaic system. The energy supply module includes a battery (6), a solar controller (9), a battery charger (10) and a solar photovoltaic panel (13). The photovoltaic system uses the photovoltaic effect of solar panels to convert light energy into electrical energy, and then can directly supply power to the system to drive the system to work; the remaining energy can be sent to the storage battery for storage. The solar controller is the control element of the photovoltaic system, which regulates and controls the charging and discharging conditions of the battery, and plays a protective role when the system reaches either the overcharge or the over discharge state. The component composition and principle of the energy supply module are shown in Figure 3.
2.4. Membrane System Design
Because it is a small system, the target water production is very small, only about 40 L/h, and a membrane element with a smaller membrane area should be selected. After comparative analysis, the reverse osmosis membrane element produced by Dow Company has good performance and meets the design requirements. The Dow reverse osmosis membrane is a polythiazide composite membrane, characterized by a high desalination rate, a theoretical desalination rate of more than 99%, and has large water flux, strong anti-biological pollution ability, low cost, large pH range and easy maintenance, etc. In addition to these advantages, the use of the latest precision processing technology for component sealing provides good reliability and stability. After selection, the effective length of SW30-2521 reverse osmosis membrane produced by the Dow company is less than 600 mm, which meets the requirements of small components. The product specifications are shown in Table 1.
The membrane flux that the reverse osmosis membrane system can generally bear is not less than 50 L/(m2·h), and the size of the membrane flux has a great influence on the performance of the reverse osmosis system. If the membrane flux is too small, the energy utilization efficiency of the membrane system will decrease, leading to an increase in the investment cost of the entire equipment. If the membrane flux is too high, it will increase the degree of pollution of the membrane elements, and the increase in replacement frequency of membrane elements will also increase the cost of seawater desalination.
For different types of raw water, the design guidelines for reverse osmosis systems are different. Table 2 shows the average flux of membrane elements, the highest flux, and the highest concentration polarization of the membrane system under standard conditions of 25 °C.
The small-scale reverse osmosis seawater desalination system designed in this paper is object-oriented to multiple water sources, so according to the design guidelines, the average membrane flux is 20 L/(m2·h). The calculation formula for the number of membrane elements is:
where: NE is theoretical number of membrane elements; QP is the designed water production, 40 L/h; J is the average flux of the membrane; SE is the effective membrane area of the membrane module, 1.2 m2.
According to Equation (1), the number of membrane elements can be calculated to be 1.67, so the number of membrane elements is 2. When using two SW30-2521 reverse osmosis membranes, the actual average membrane flux is 16.67 L/(m2·h). Because it is a compact system, the pressure vessel chooses 1 core, that is, two pressure vessels are used. The arrangement of membrane modules selects a one-stage two-stage system, and sends the concentrated water of the first membrane module to the membrane system again for desalination, which improves the recovery rate of the small system.
3. Energy Consumption Analysis
The reverse osmosis desalination system is the most energy-consuming pressure-driven membrane process, and energy consumption is one of its main costs. The reverse osmosis process requires a large amount of energy to drive the water to complete the desalination process. Therefore, minimizing energy consumption is one of the most effective ways to reduce the cost of seawater reverse osmosis desalination, which is a more economical and sustainable water supply method.
Small-scale reverse osmosis desalination equipment is used in outdoor environments. When there is no stable power supply and only photovoltaic power generation is available, there are higher requirements for the use of energy consumption. Reducing system energy consumption can extend the working time of small reverse osmosis desalination equipment. Therefore, how to achieve the maximum desalination rate with the least energy loss is the most important part of the desalination process.
It is generally believed that the process of reverse osmosis material transfer is affected by external resistance and internal resistance. The internal resistance is mainly the seawater osmotic pressure that must be overcome during the reverse osmosis process, and the external resistance is the thermodynamic limit pressure. As the manufacturing technology of reverse osmosis membrane elements has become increasingly mature in recent years, the thermodynamic limit resistance exceeding the transmembrane transmission resistance has become the dominant factor limiting the flux of the reverse osmosis membranes [24].
3.1. Minimum SEC
SEC (Specific Energy Consumption) is the most important parameter to characterize the performance of the reverse osmosis desalination process. The unit is kWh/m3, which represents the energy required to produce 1 m3 of product water. It is also the stable operation of reverse osmosis desalination equipment. We aim to optimize the key parameters of the design. The main influencing factors of specific energy consumption include the osmotic pressure of concentrated water, the resistance of the fluid through the membrane, the friction loss in the concentrated water and fresh water channels of the reverse osmosis membrane, and the motor efficiency of the high-pressure pump.
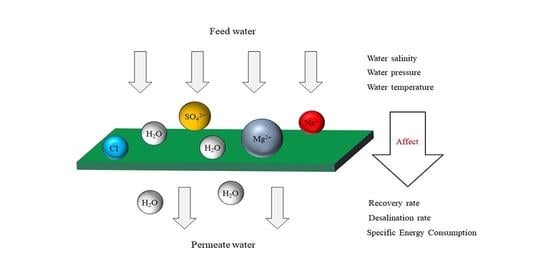
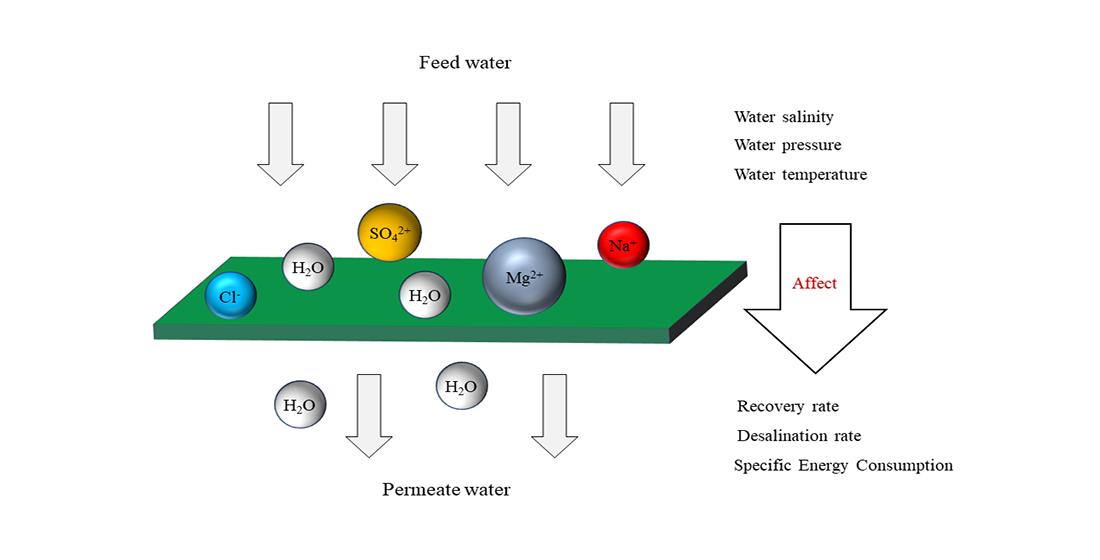
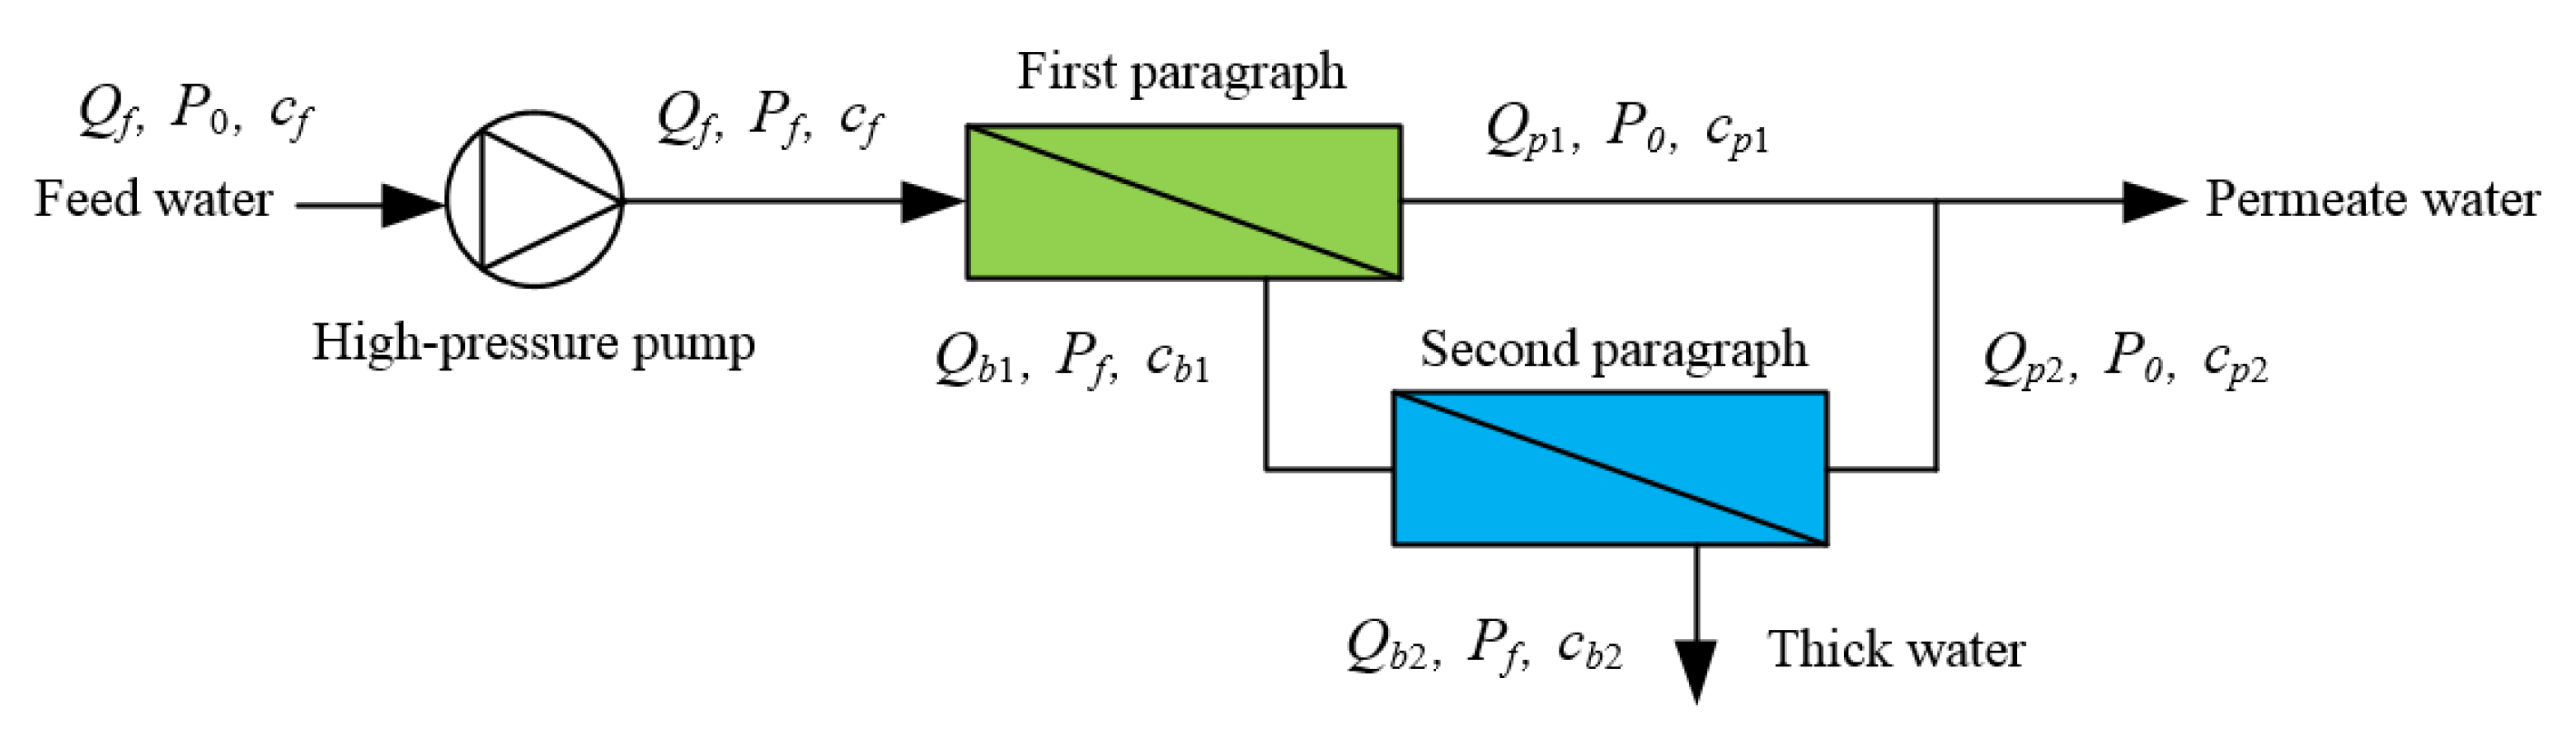
Figure 4 shows a schematic diagram of a one-stage two-stage reverse osmosis process. Its characteristic is that the concentrated water of the first stage membrane element is sent to the second stage membrane element for desalination, and two parts of fresh water are obtained, which improves the system recovery rate. As a result of the main analysis of the influence of the transmembrane transfer resistance and the thermodynamic limit resistance on the reverse osmosis flux, the mathematical model is simplified, and the effect of concentration polarization is ignored. The pressure drops of the concentrated water flowing out of the reverse osmosis membrane is ignored, the permeate water and the feed water pressures are considered equal.
The high-pressure pump raises the feed seawater pressure from P0 to Pf to overcome the seawater osmotic pressure. The efficiency of the high-pressure pump is expressed by ηHP, and the energy consumption WHP of the high-pressure pump can be expressed as:
Then, SEC can be defined as:
In addition, , SEC can be rewritten as:
In the entire desalination process, according to the law of conservation of materials, there is a mass balance equation for solution and solute, that is, the feed water flow is equal to the sum of the fresh water flow and the concentrated water flow:
where: Qf is feed water flow, m3/h; Qp1 + Qp2 is the permeate flow, m3/h; and Qb2 is the concentrate flow, m3/h.
Similarly, according to the conservation of salt quality, the salt content in the feed water is equal to the sum of the salt content of the permeate water and the salt content of the concentrated water, namely:
where: cf is average salt concentration of the feed water, mg/L; cp1 + cp2 is the average salt concentration of the osmotic water, mg/L; cb2 is the average concentration of salt in the concentrated water, mg/L.
Define the desalination rate Rs of the reverse osmosis system as:
Therefore, Equation (6) can be rewritten as:
The osmotic pressure of the solution can be calculated according to the Van’t Hoff equation [25]:
where: π is osmotic pressure of the solution, kPa; T is thermodynamic temperature, K; ci is the concentration of ion i in the solute, mol/L; and R is the gas constant, 8.314 kPa∙L/(mol·K).
According to Equation (9), it can be concluded that the osmotic pressure πexit at the concentrated water outlet of the membrane element has the following relationship with the original seawater osmotic pressure π0:
The osmotic pressure πp of the permeated water is ignored, that is, the osmotic pressure difference at the outlet of the membrane element is:
Assuming that the salt concentration is the highest at the concentrated water outlet of the membrane element, the transmembrane pressure entering the membrane element must be greater than the osmotic pressure difference at the membrane outlet to ensure that the membrane element has permeation flux over the entire length, and the flux is only in the membrane. The exit of the component is reduced to 0 [26], namely:
Equation (12) is the thermodynamic limit equation of the reverse osmosis process in cross-flow operation. By incorporating it into Equation (4), the minimum SEC for a given recovery rate under the thermodynamic limit conditions can be obtained. From then on, the permeate water production process can occur on the entire reverse osmosis membrane element until the exit of the membrane element tail where the effective driving force disappears:
Standardizing the SEC relative to the osmotic pressure (π0) of the feed seawater, we obtain:
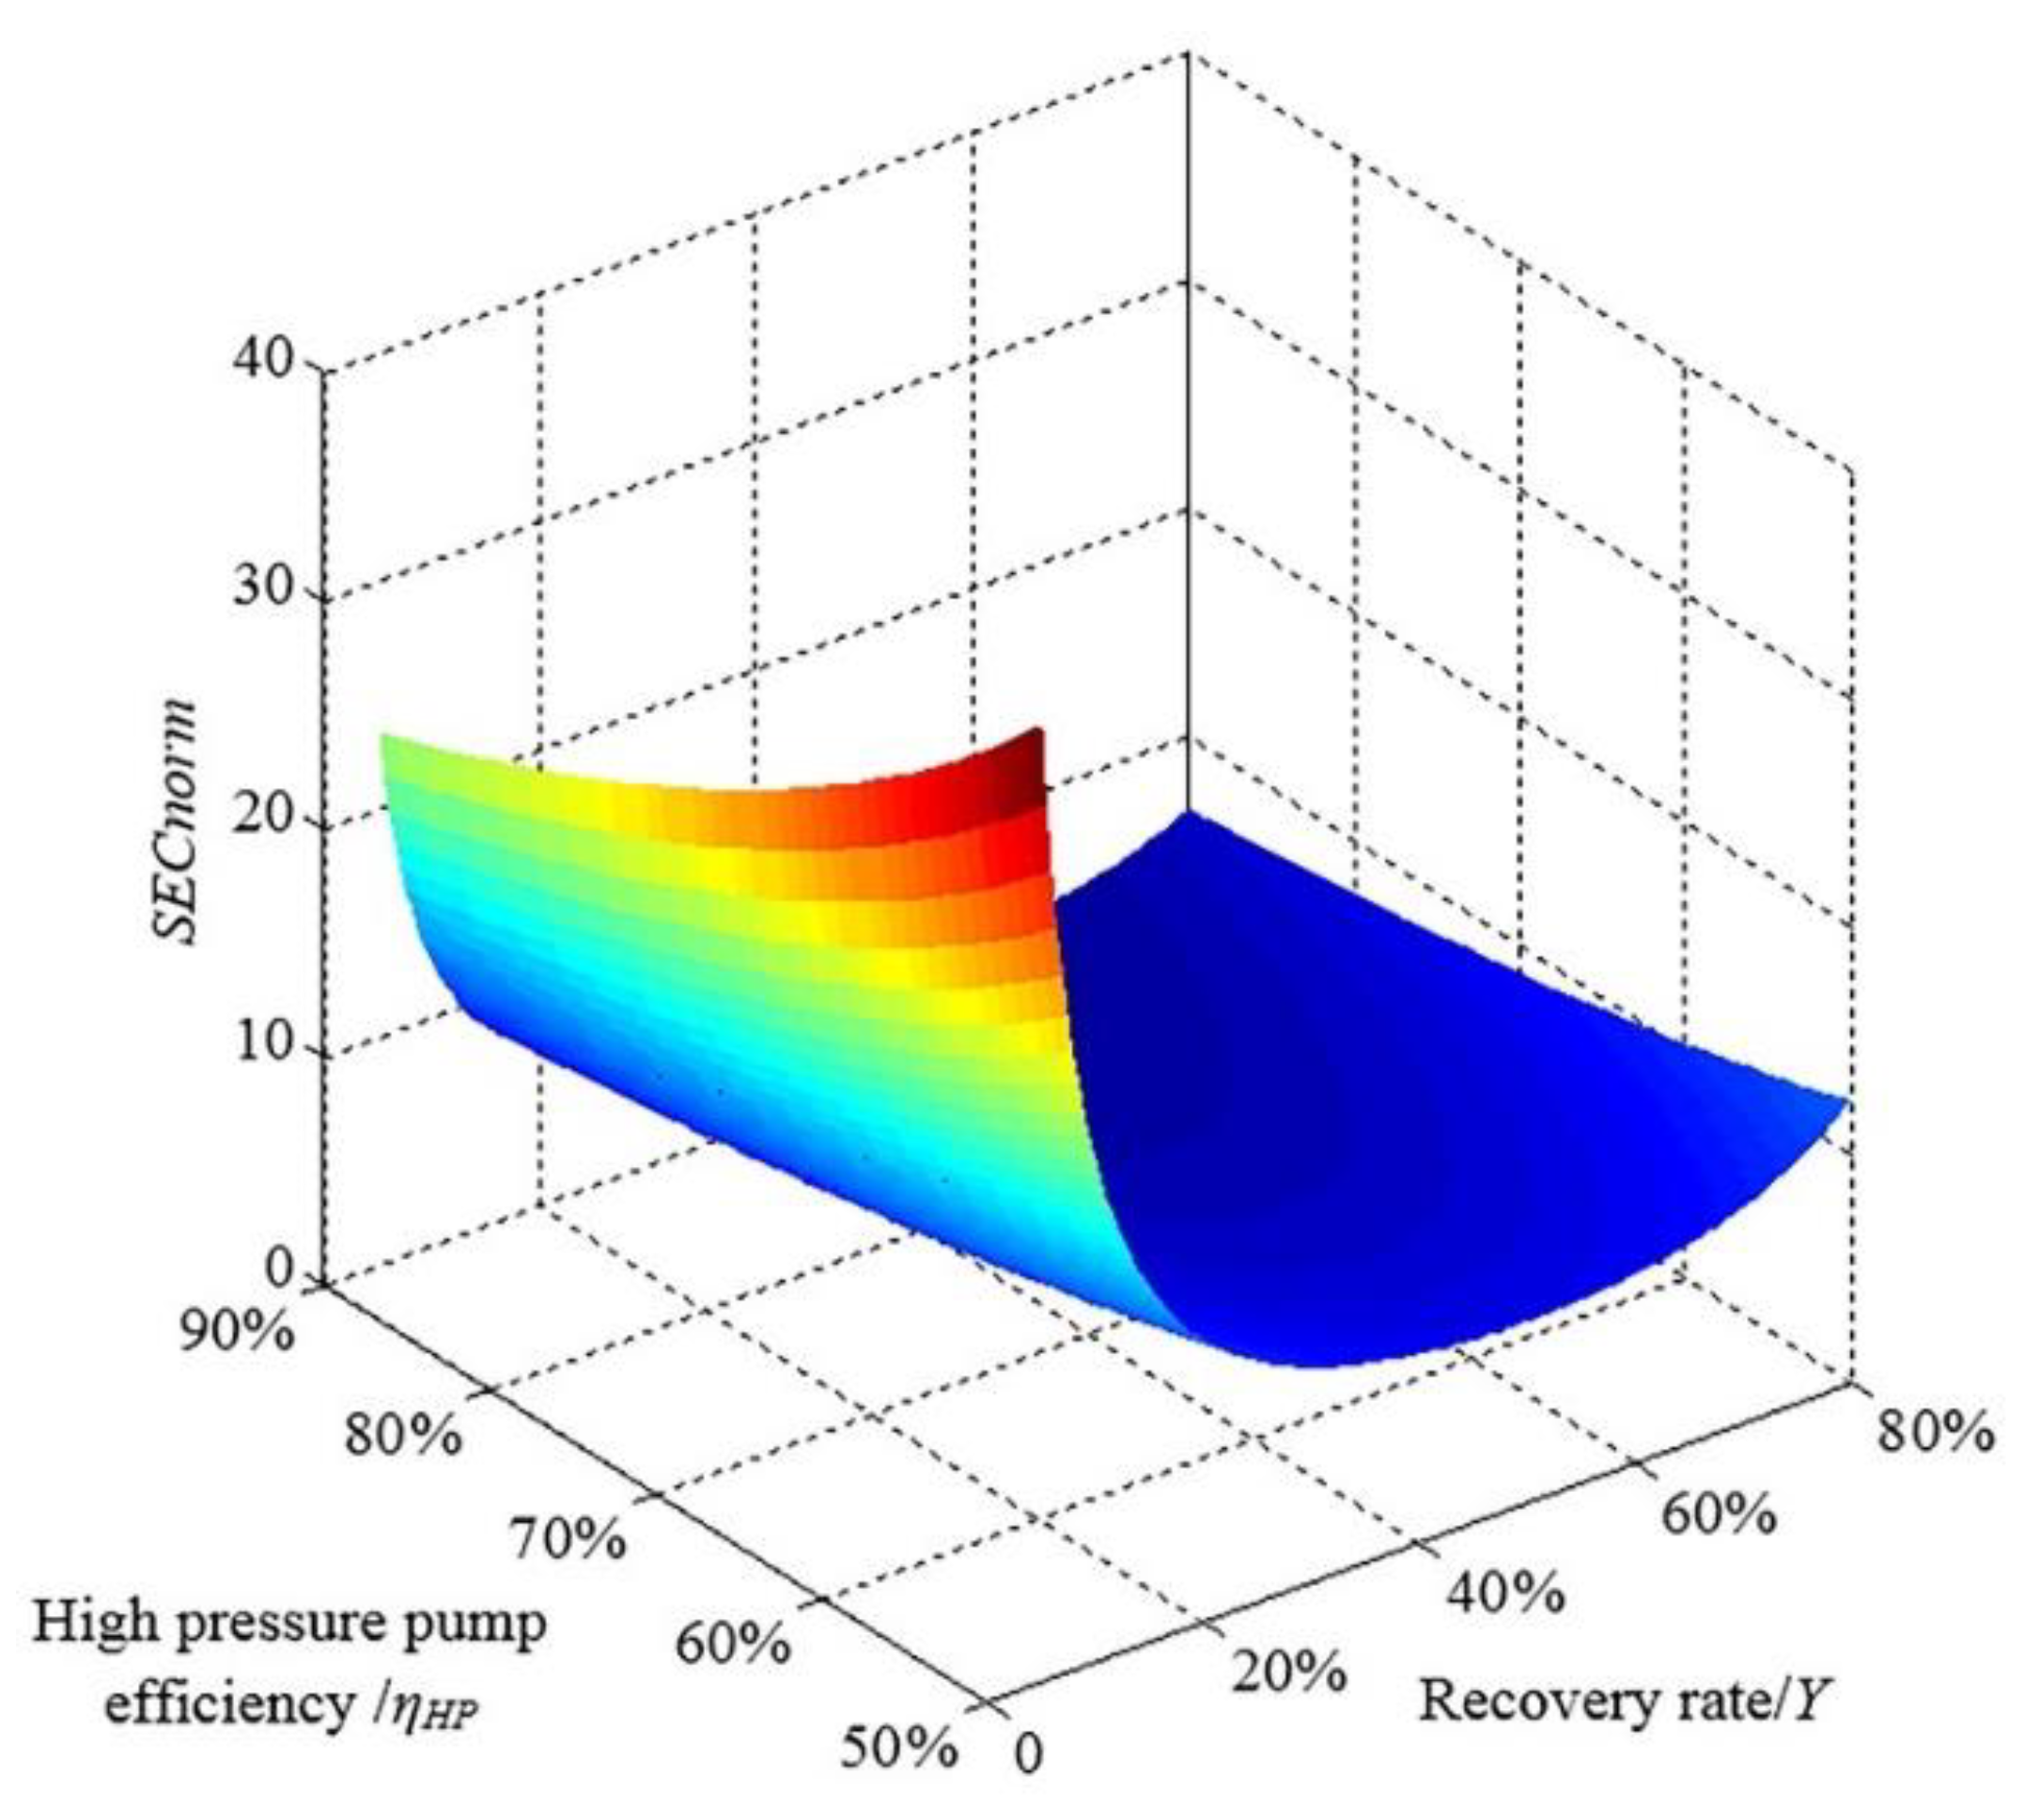
From Equation (14), the relationship between SECnorm and the recovery rate Y and the high-pressure pump efficiency ηHP can be obtained, so that the system desalination rate Rs is 99%, the system recovery rate is 5–80%, and the high-pressure pump efficiency is 50–90%. The trend of change is shown in Figure 5.
It can be seen from Figure 5 that the SECnorm of the reverse osmosis process decreases with the increase of the high-pressure pump efficiency, and a target recovery rate that is too high or too low will increase the SECnorm. Analysis of this process indicates that when the target recovery rate increases, the feedwater pressure provided by the high-pressure pump increases rapidly, resulting in an increase in specific energy consumption; when the target recovery rate decreases, part of the energy in the concentrated water discharge will be wasted, thereby increasing the large production water ratio energy consumption. Improving the efficiency of the high-pressure pump will correspondingly reduce the specific energy consumption of the system, thereby increasing the efficiency of the reverse osmosis system.
In general, choosing a high-pressure pump with high safety performance and high efficiency is critical to small desalination equipment. In addition, the selection of the recovery rate is also very important for the membrane system. The target recovery rate is within the range of 20% to 60%. The specific energy consumption of the system is relatively low. However, increasing the recovery rate of miniaturized equipment has other aspects besides increasing energy consumption. Due to restrictions, too high values cannot be selected; the target recovery rate is between 20% and 30%.
3.2. Energy Efficiency
In addition to reducing the specific energy consumption of the membrane process, improving the energy utilization efficiency of the reverse osmosis process can also extend the working time of the small reverse osmosis seawater desalination equipment. Therefore, a mathematical model is established in this section to calculate the membrane energy efficiency, permeate volume flow and desalination rate in a small system, which are mainly related to the feed water concentration and the high-pressure pump.
Due to the irreversible nature of the mixing process, the separation process of the membrane does not occur spontaneously. In order to carry out the process, the pressure difference applied by the pump must take the form:
where: Δπ is the osmotic pressure difference between the membrane inlet and outlet solution; Δplosses is friction loss in the membrane system.
When the membrane loss in the reverse osmosis system is not considered, that is Δplosses = Δπ, the system consumes the least energy to complete the membrane separation work in an ideal state. According to the second law of thermodynamics, considering the adiabatic mixing process, the minimum separation energy of the feed liquid salt and water can be obtained from the following equation [27]:
where: ys is the molar fraction of the solute in the membrane inlet solution, that is, the ratio of the amount of solute to the amount of the entire solution; and yw is the mole fraction of solvent, yw = 1 − ys.
Therefore, the minimum separation work Wmin of the membrane can be expressed as:
where: ρf is density of feed solution, kg/m−3.
Wpump represents the actual work provided by the pump to the system due to friction loss, which can be obtained by Equation (2).
The energy utilization efficiency of the membrane is defined as the ratio between the minimum separation work and the work done by the actual pump:
Combining Equations (2) and (17), Equation (19) can be written as:
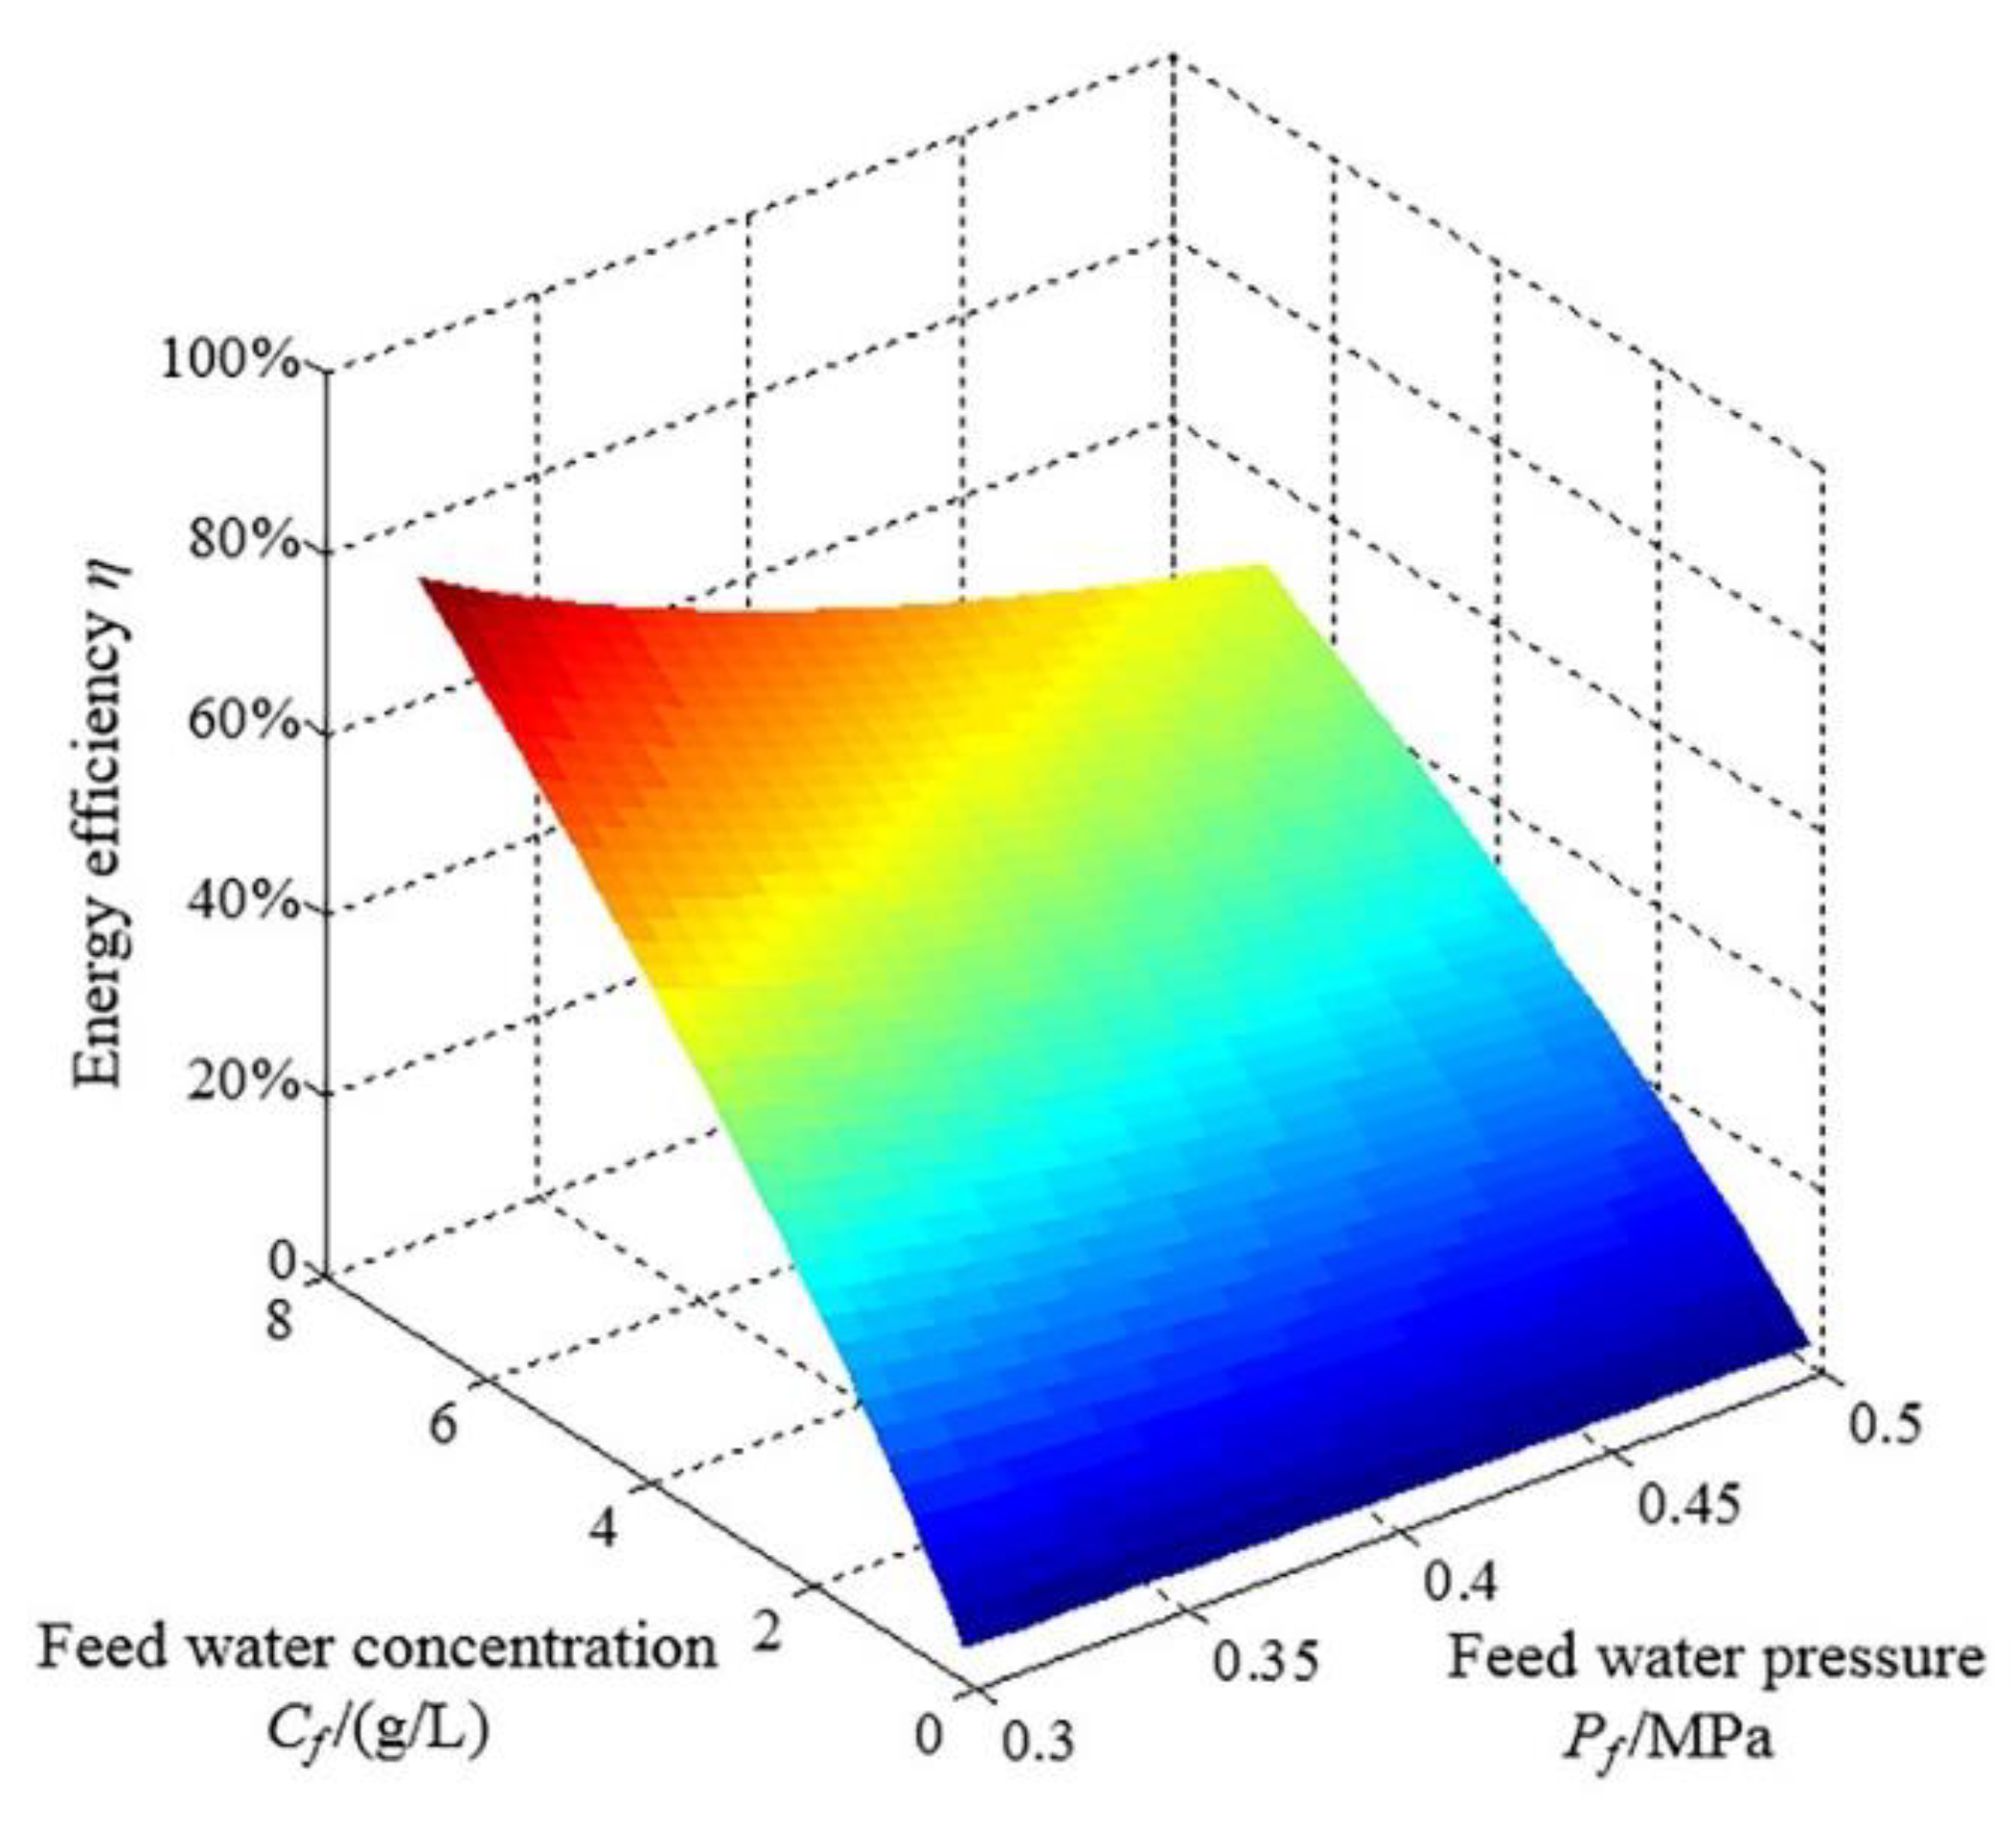
The concentration range of the membrane feed solution is 0–8 g/L, the feed water pressure is 30–50 bar, the other quantities in Equation (20) are regarded as constants, and the change trend of energy utilization efficiency η is analyzed, as shown in Figure 6.
It can be seen from Figure 6, when the feed concentration increases from 2 to 8 g/L, the energy utilization efficiency varies greatly between 25% and 75%, and when the feed water pressure increases from 30 to 50 bar, the rate of change of efficiency is slow, and the efficiency is reduced from 75% to 50%. Therefore, the feed concentration has a significant positive impact on the energy utilization efficiency of the system. The efficiency increases almost linearly with the feed concentration. This is because the minimum separation work Wmin increases, while the actual work done by the pump remains unchanged, while the feed water pressure is less affected. However, the increase in the feed concentration will also lead to a decrease in the salt rejection rate, so in order to achieve the best reverse osmosis performance, the feed concentration must be selected at an appropriate value.
4. Prototype Experiment of Miniaturized Reverse Osmosis Device
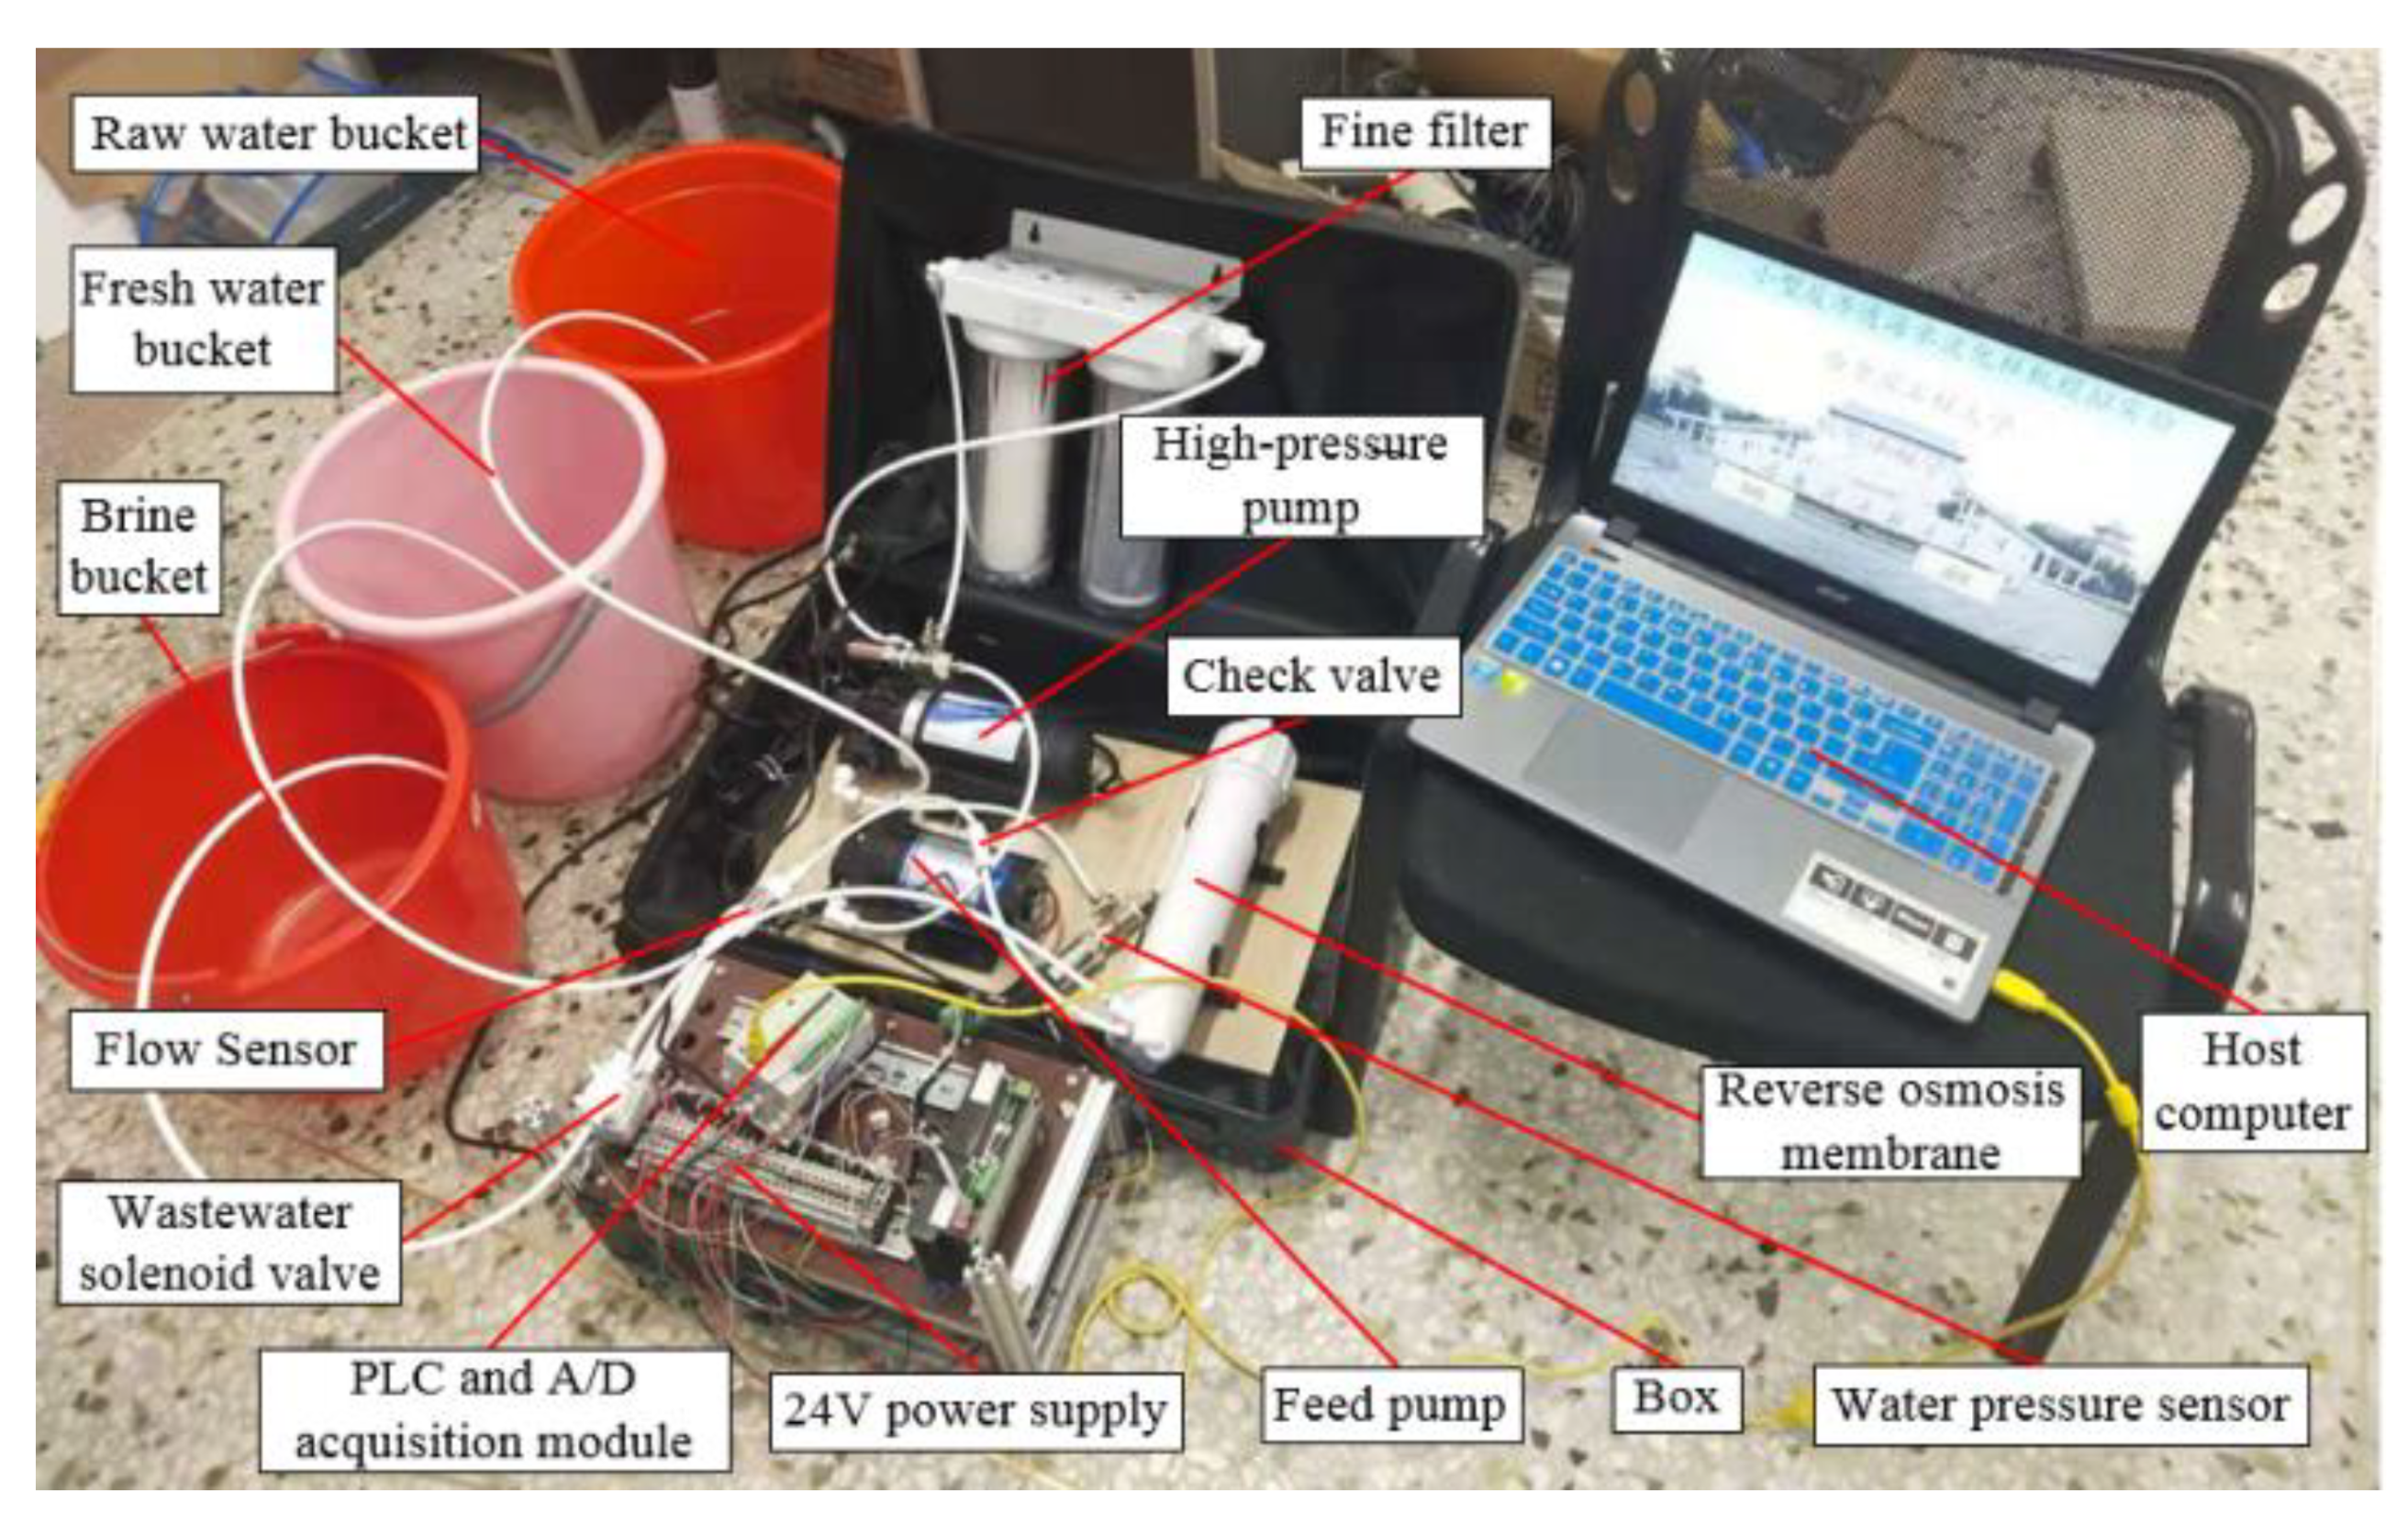
Taking into account the experimental environment and conditions, the traditional small desalination device was improved, the post-processing module and the energy supply module were omitted, and the data measurement device was added to build an experimental prototype. The prototype monitors and records the following process variables: flow of feed water, brine and product water, salt concentration of feed water and concentrated water, water temperature, and discharge pressure of the feed pump and the high-pressure pump. The device environment is shown in Figure 7.
The experimental prototype can complete the simulation of the entire reverse osmosis seawater desalination process. For data collection in the desalination process, a PLC (Programmable Logic Controller) is selected as the collection device. The PLC data collection system monitors the water pressure every 0.1 s to ensure the reliability and stability of data collection. Water pressure sensors are installed at the outlets of the two pumps, and both the inlet water flow and the product water flow are measured by flow sensors. The water pressure and flow sensor signals are sent to the PLC for collection, and the PLC communicates with the upper computer PC to display and record the measured values in real time. In addition, the salt concentration in feed water, product water and brine are measured by a conductivity meter, which can also provide the temperature of the solution. The system energy consumption is calculated by the stable current measured by the ammeter.
The laboratory simulation seawater uses sodium chloride solution prepared from dechlorinated tap water. The TDS of the solution is measured and adjusted by the conductivity meter. For the TDS level of the sodium chloride solution given in the experiment, the osmotic pressure can be calculated using the following simple equation:
where A = 7.8 × 10⁻⁵; Equation (21) is based on the results of the multi-electrolyte thermodynamic simulator of 20 °C NaCl solution [28]. That is, when the feed concentration is 10,000 mg/L, the osmotic pressure is approximately 0.78 MPa. Therefore, the maximum concentration of the experimental feed solution is 10,000 mg/L, so that the osmotic pressure difference does not exceed the maximum pressure that the reverse osmosis membrane can withstand or the maximum pressure that the high-pressure pump can provide. The conductivity of the feed solution, concentrated water and product water was measured every 2 min. The feed solution samples were taken from the top and bottom of the original water bucket to verify the uniformity of the solution. The concentrated water and product water samples were taken from the system outlet.
4.1. Steady State Condition
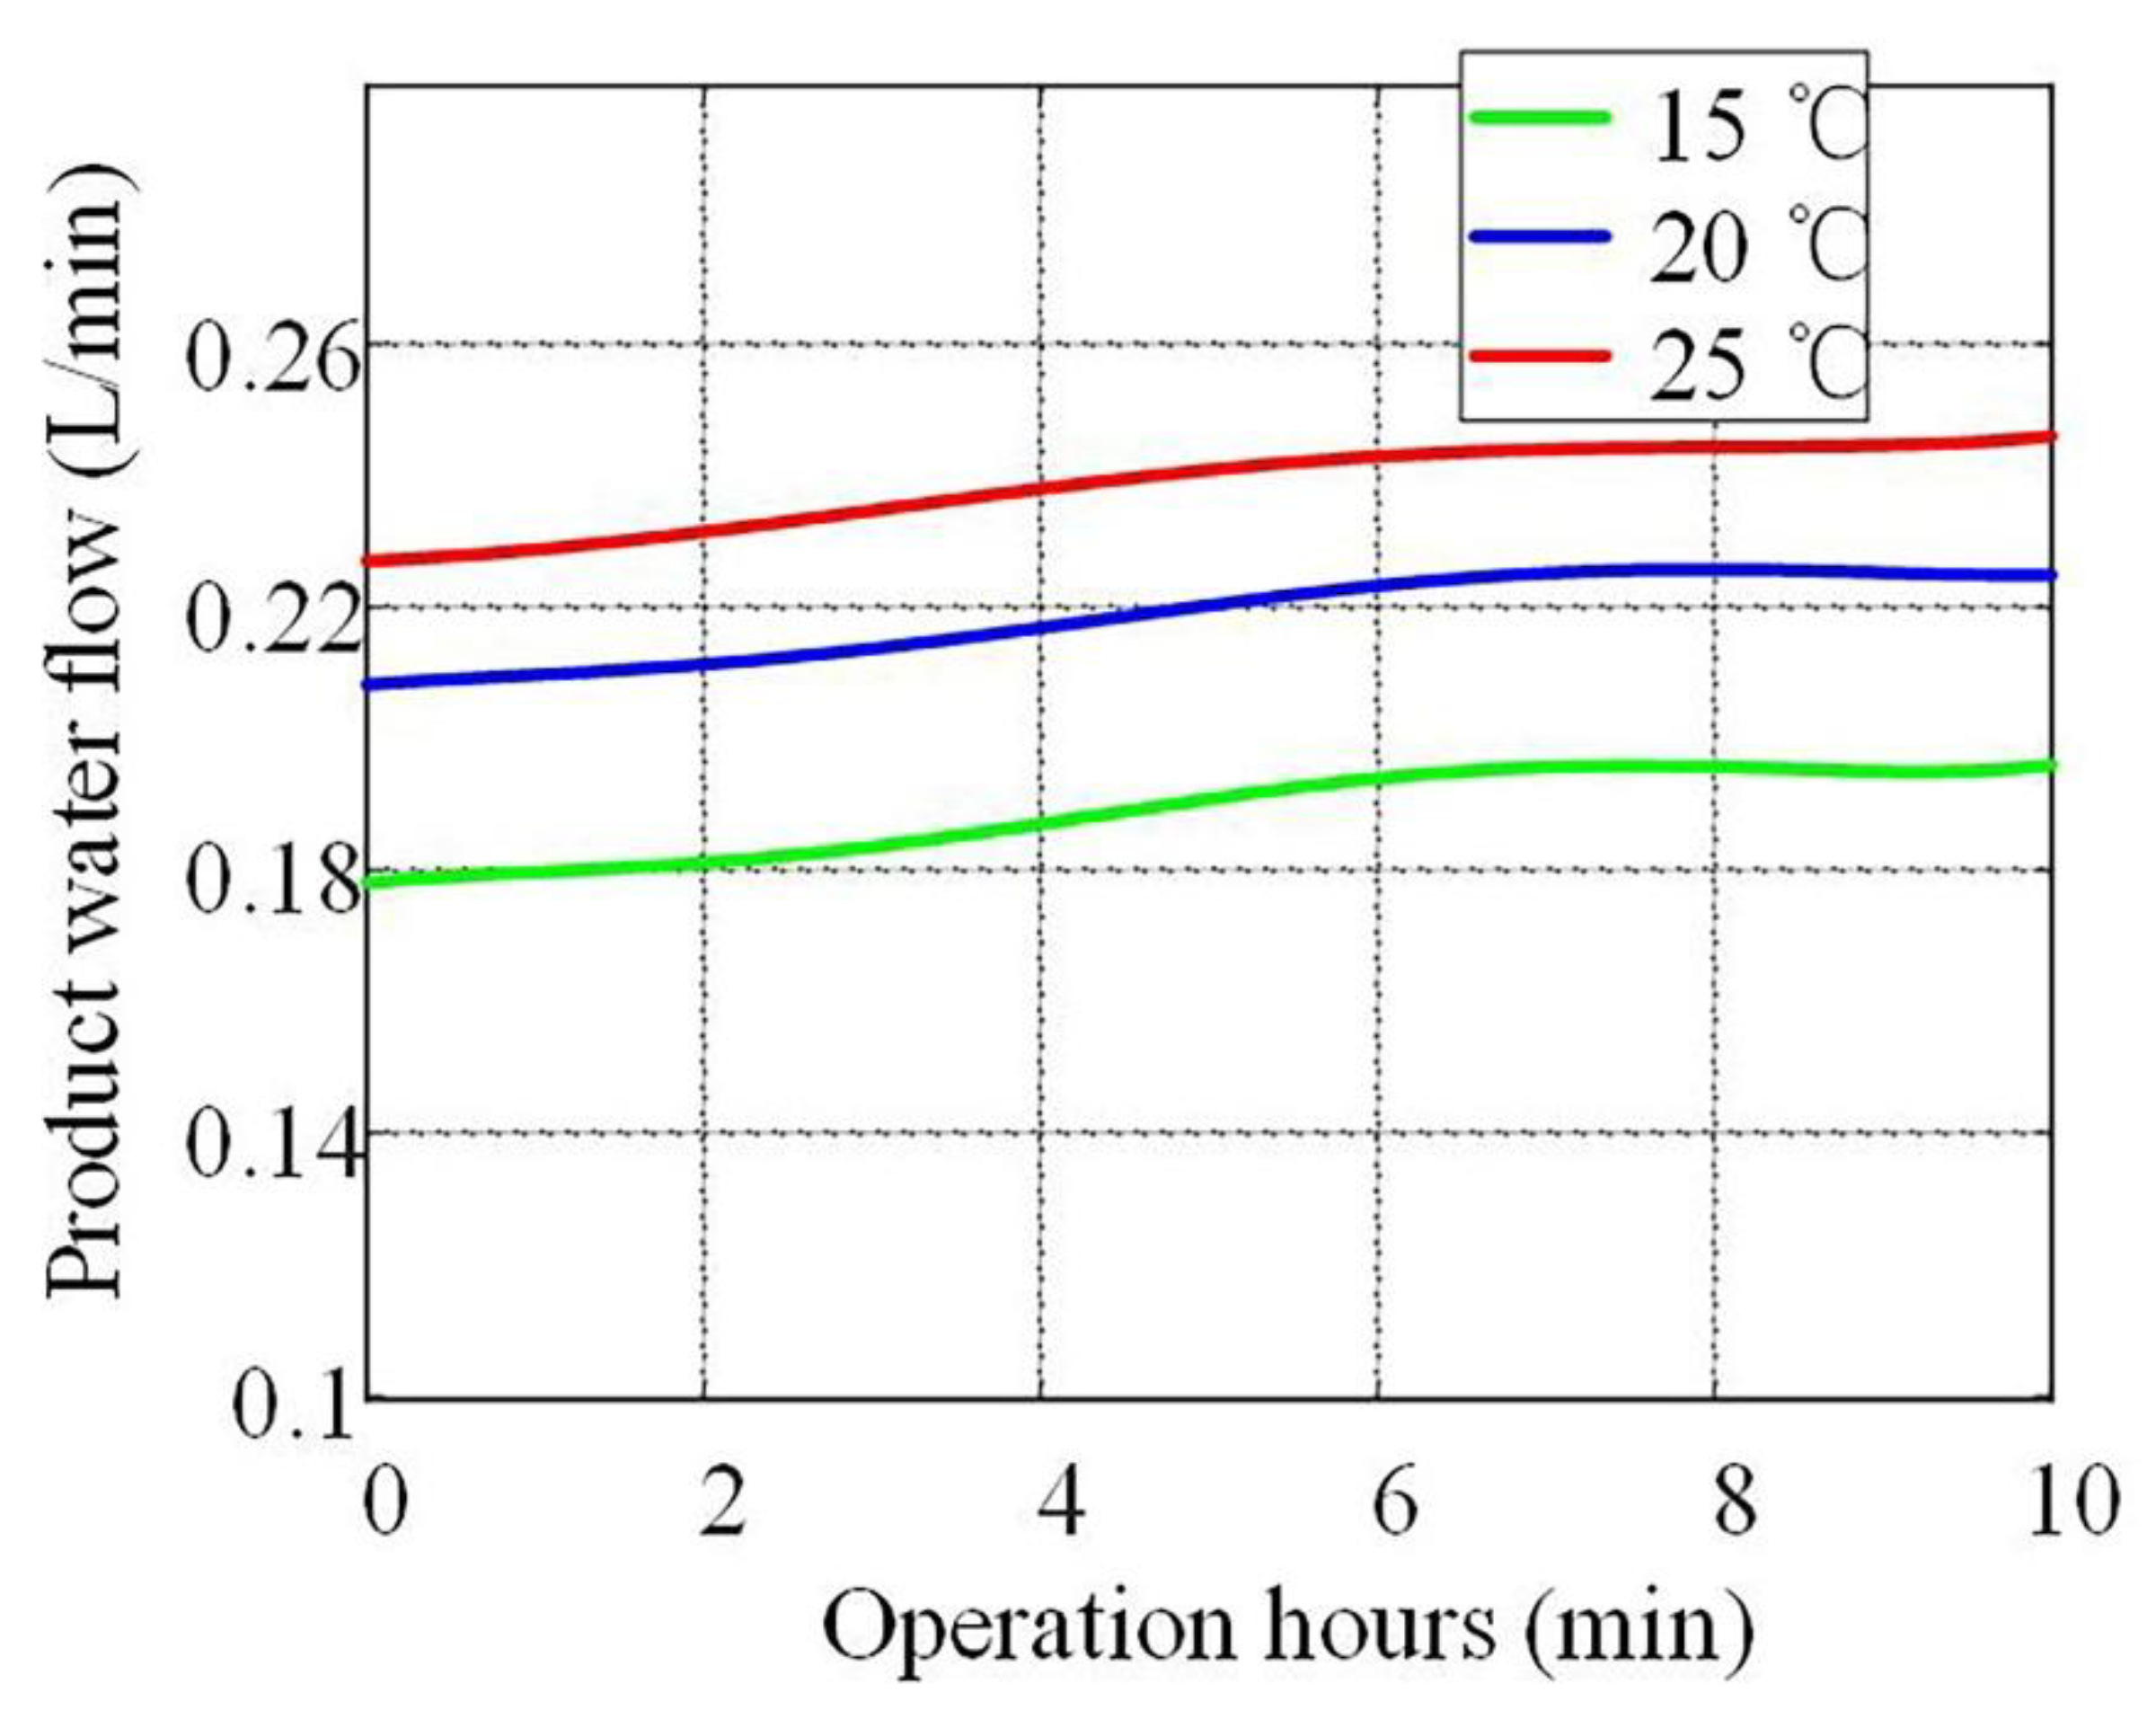
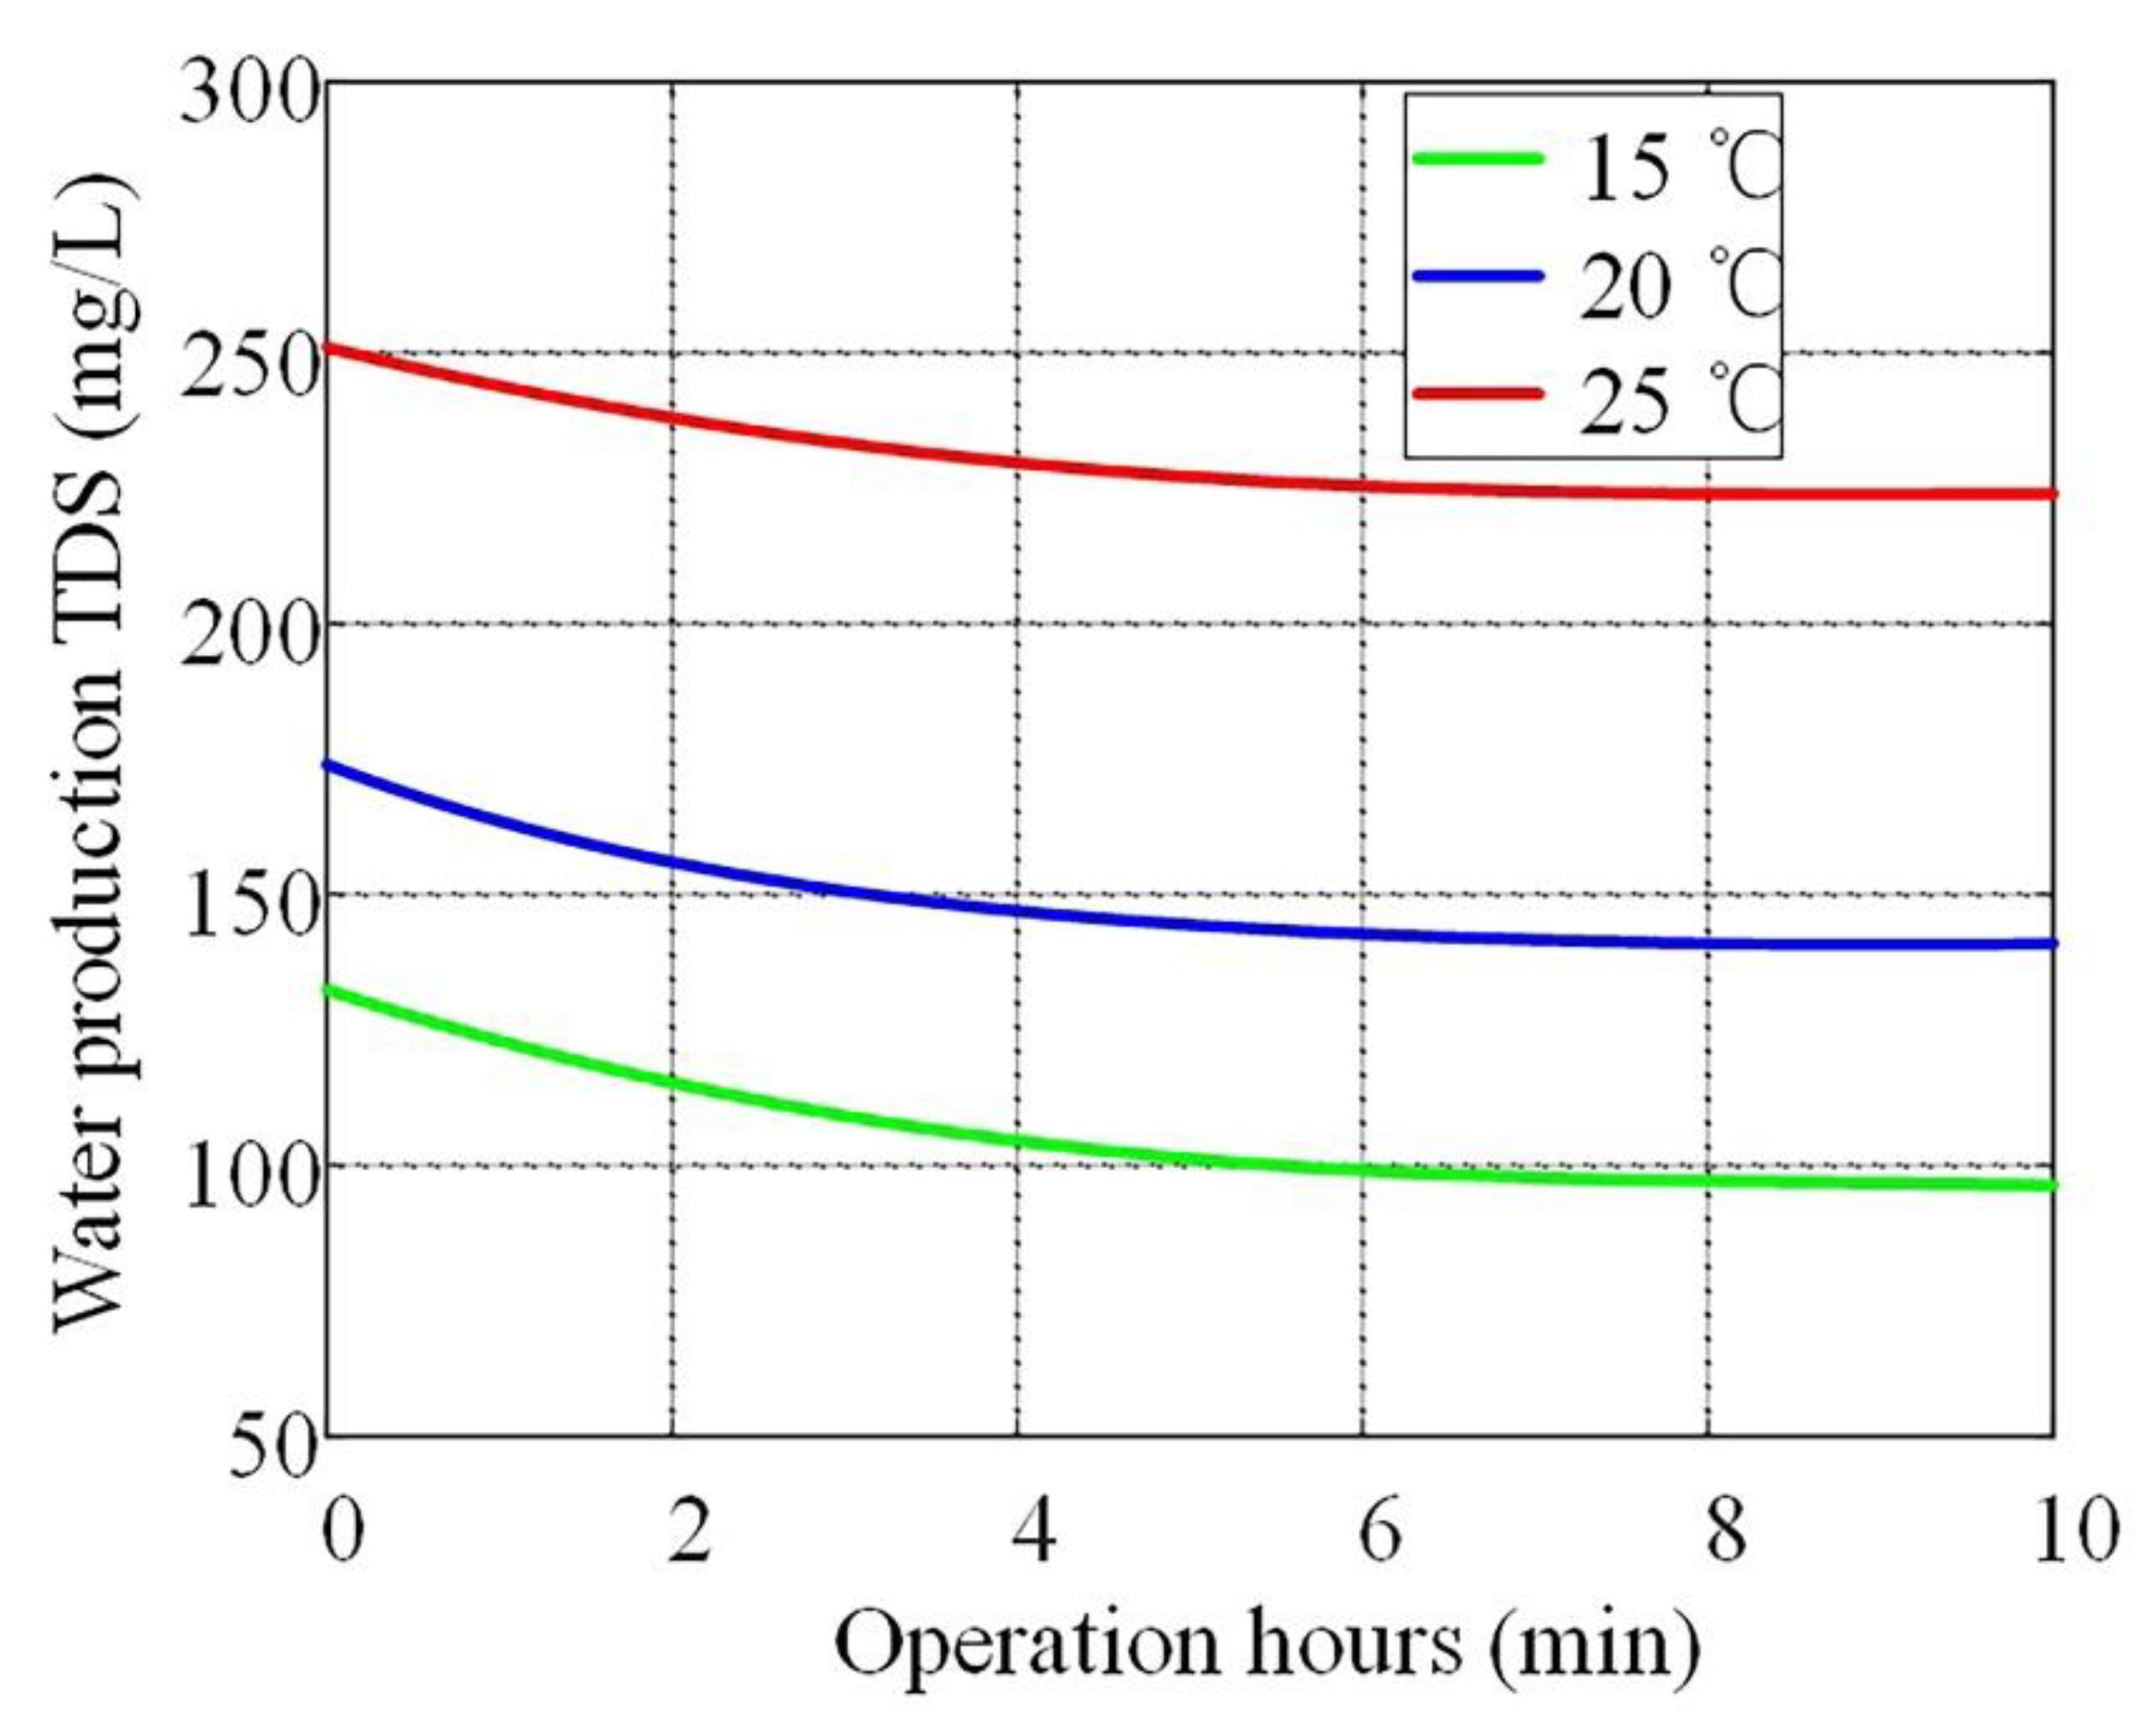
First, test the stable conditions of the experimental prototype small reverse osmosis system, and provide the steady state conditions of the running time collection data system for subsequent experiments. In order to rule out contingency, three sets of parallel experiments were carried out to monitor the relationship between the system’s water production flow and water quality over time. In the first group of experiments, the inlet water temperature was set to 15 °C, the feed concentration was 4000 mg/L, the feed flow rate was 2 L/min, and the operating pressure was 0.6 MPa. The second group of experiments set the inlet water temperature to 20 °C, and other conditions remained unchanged. In the three groups of experiments, the inlet water temperature was set at 25 °C, and other conditions remained unchanged. The product water flow rate is given by the host computer interface. The test process of feed water, concentrated water and product water TDS is shown in Figure 8 and Figure 9.
4.2. The Influence of Operating Parameters on System Performance
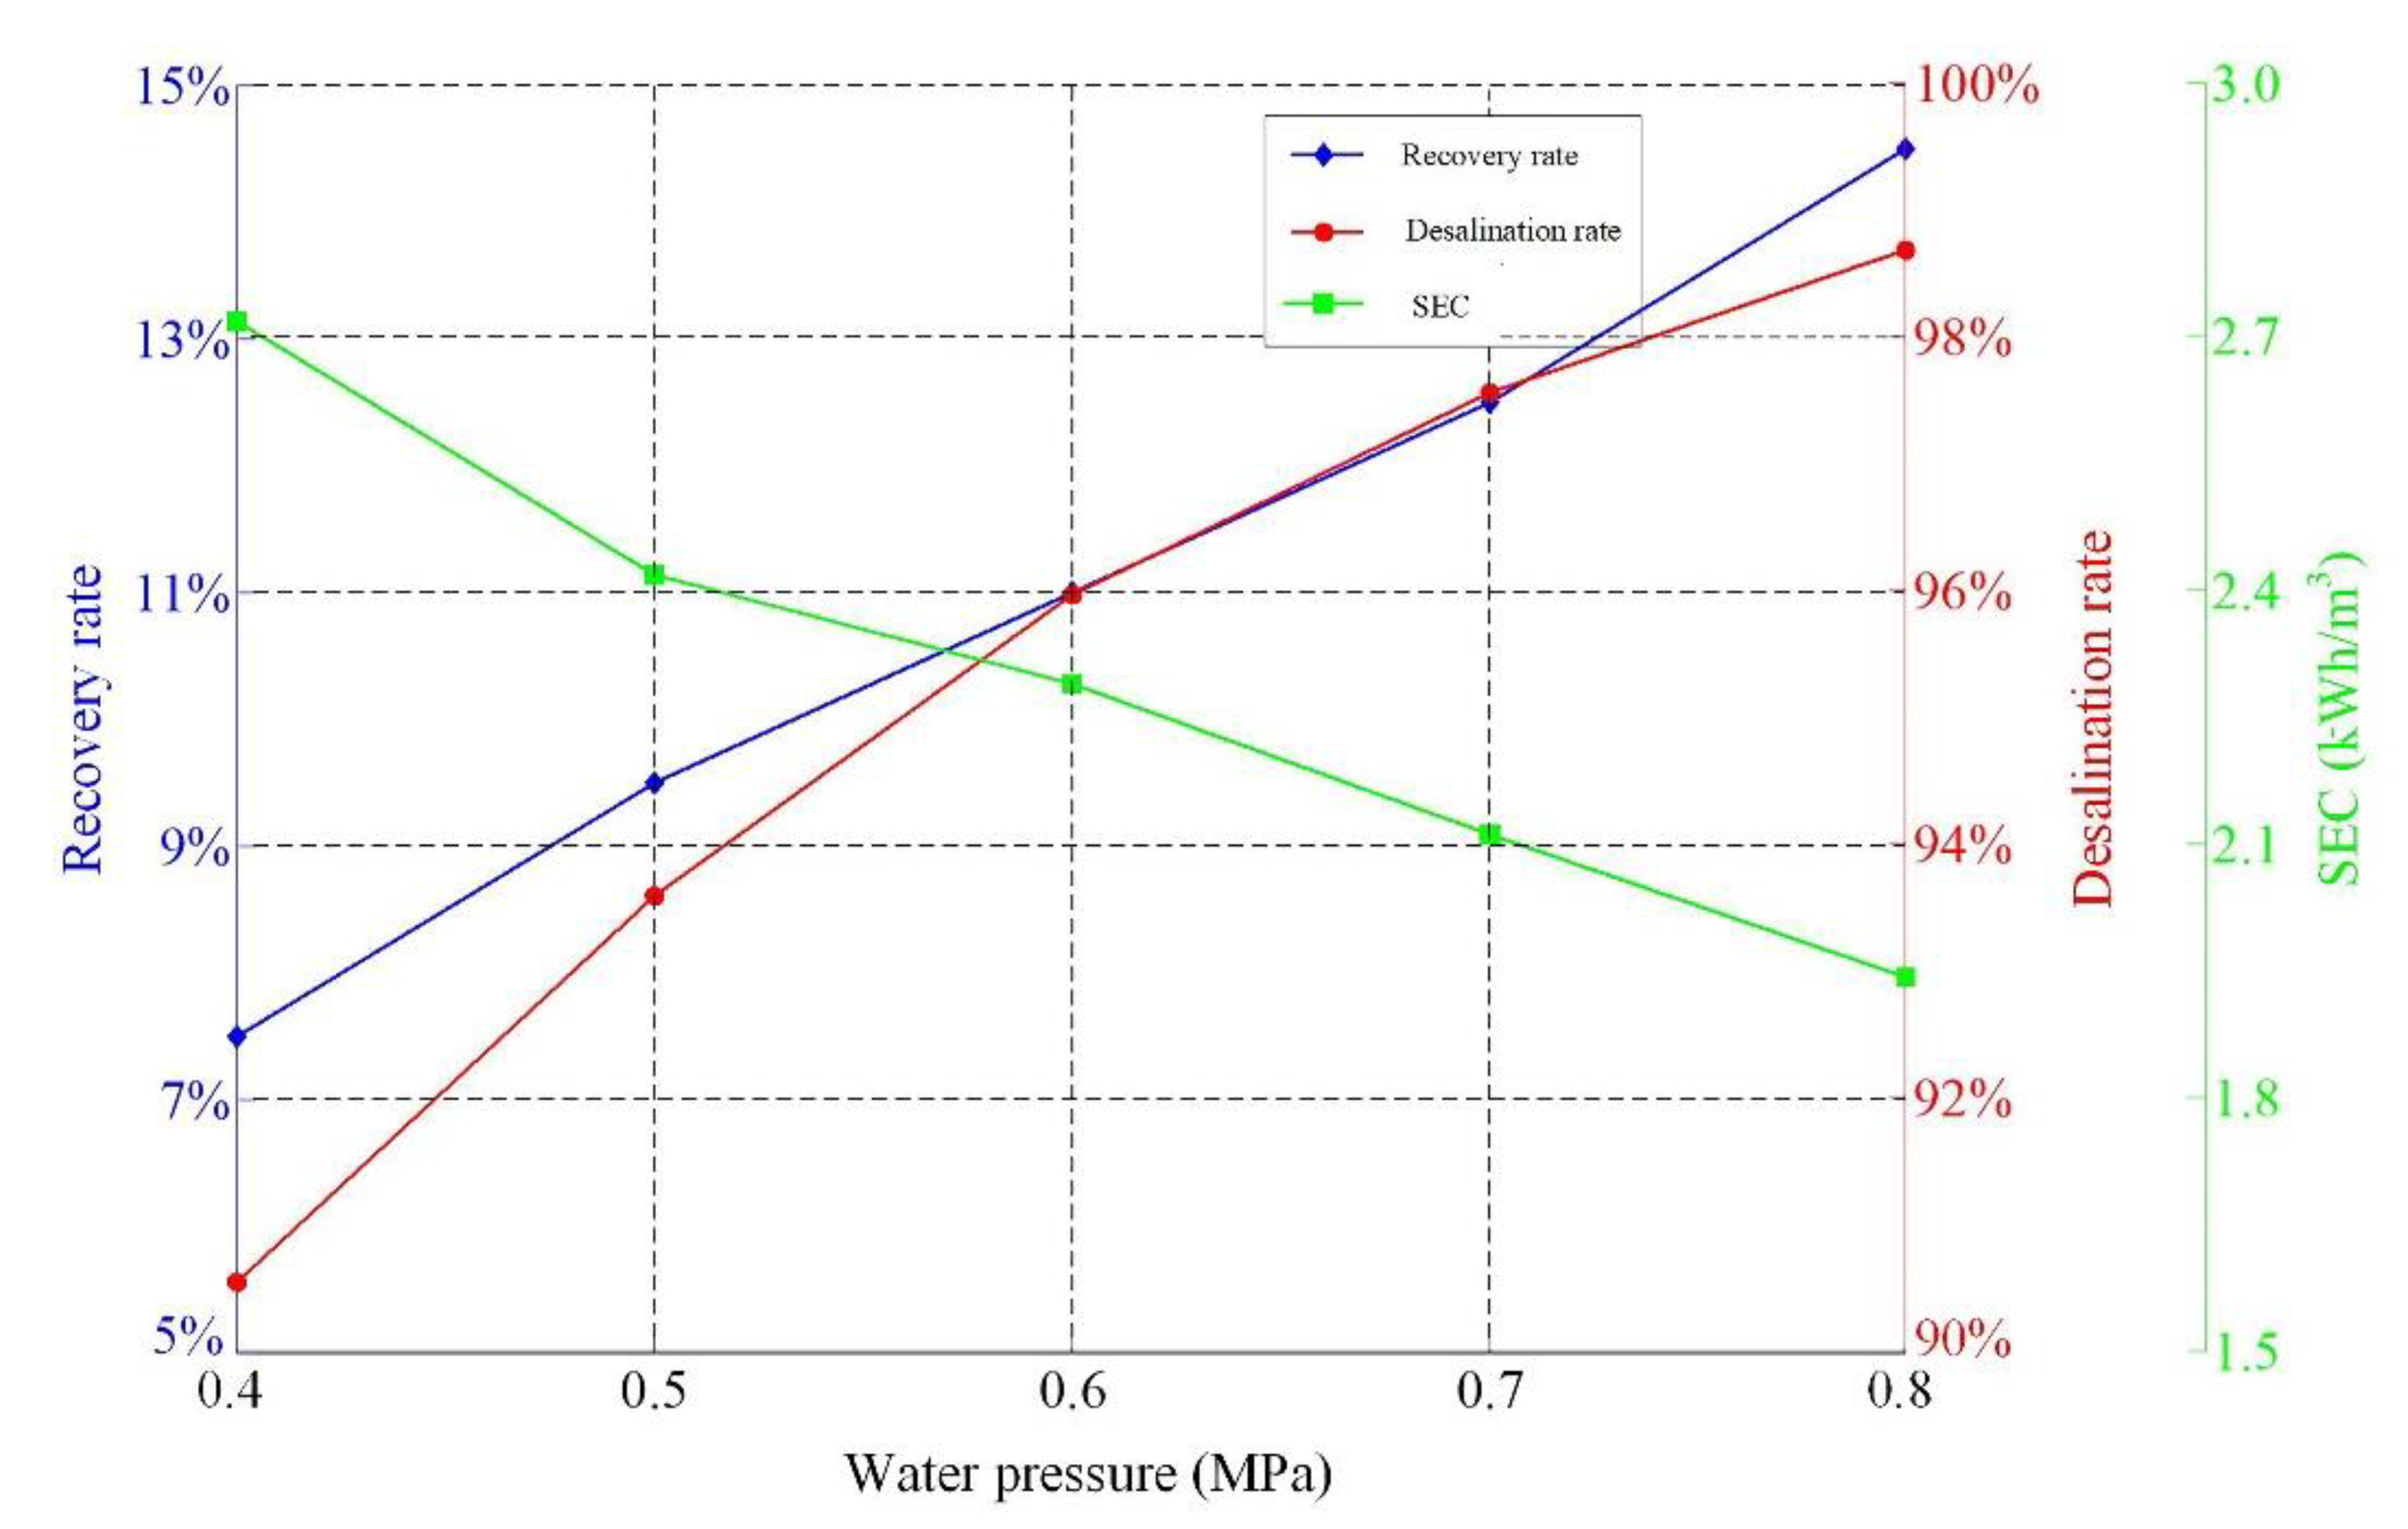
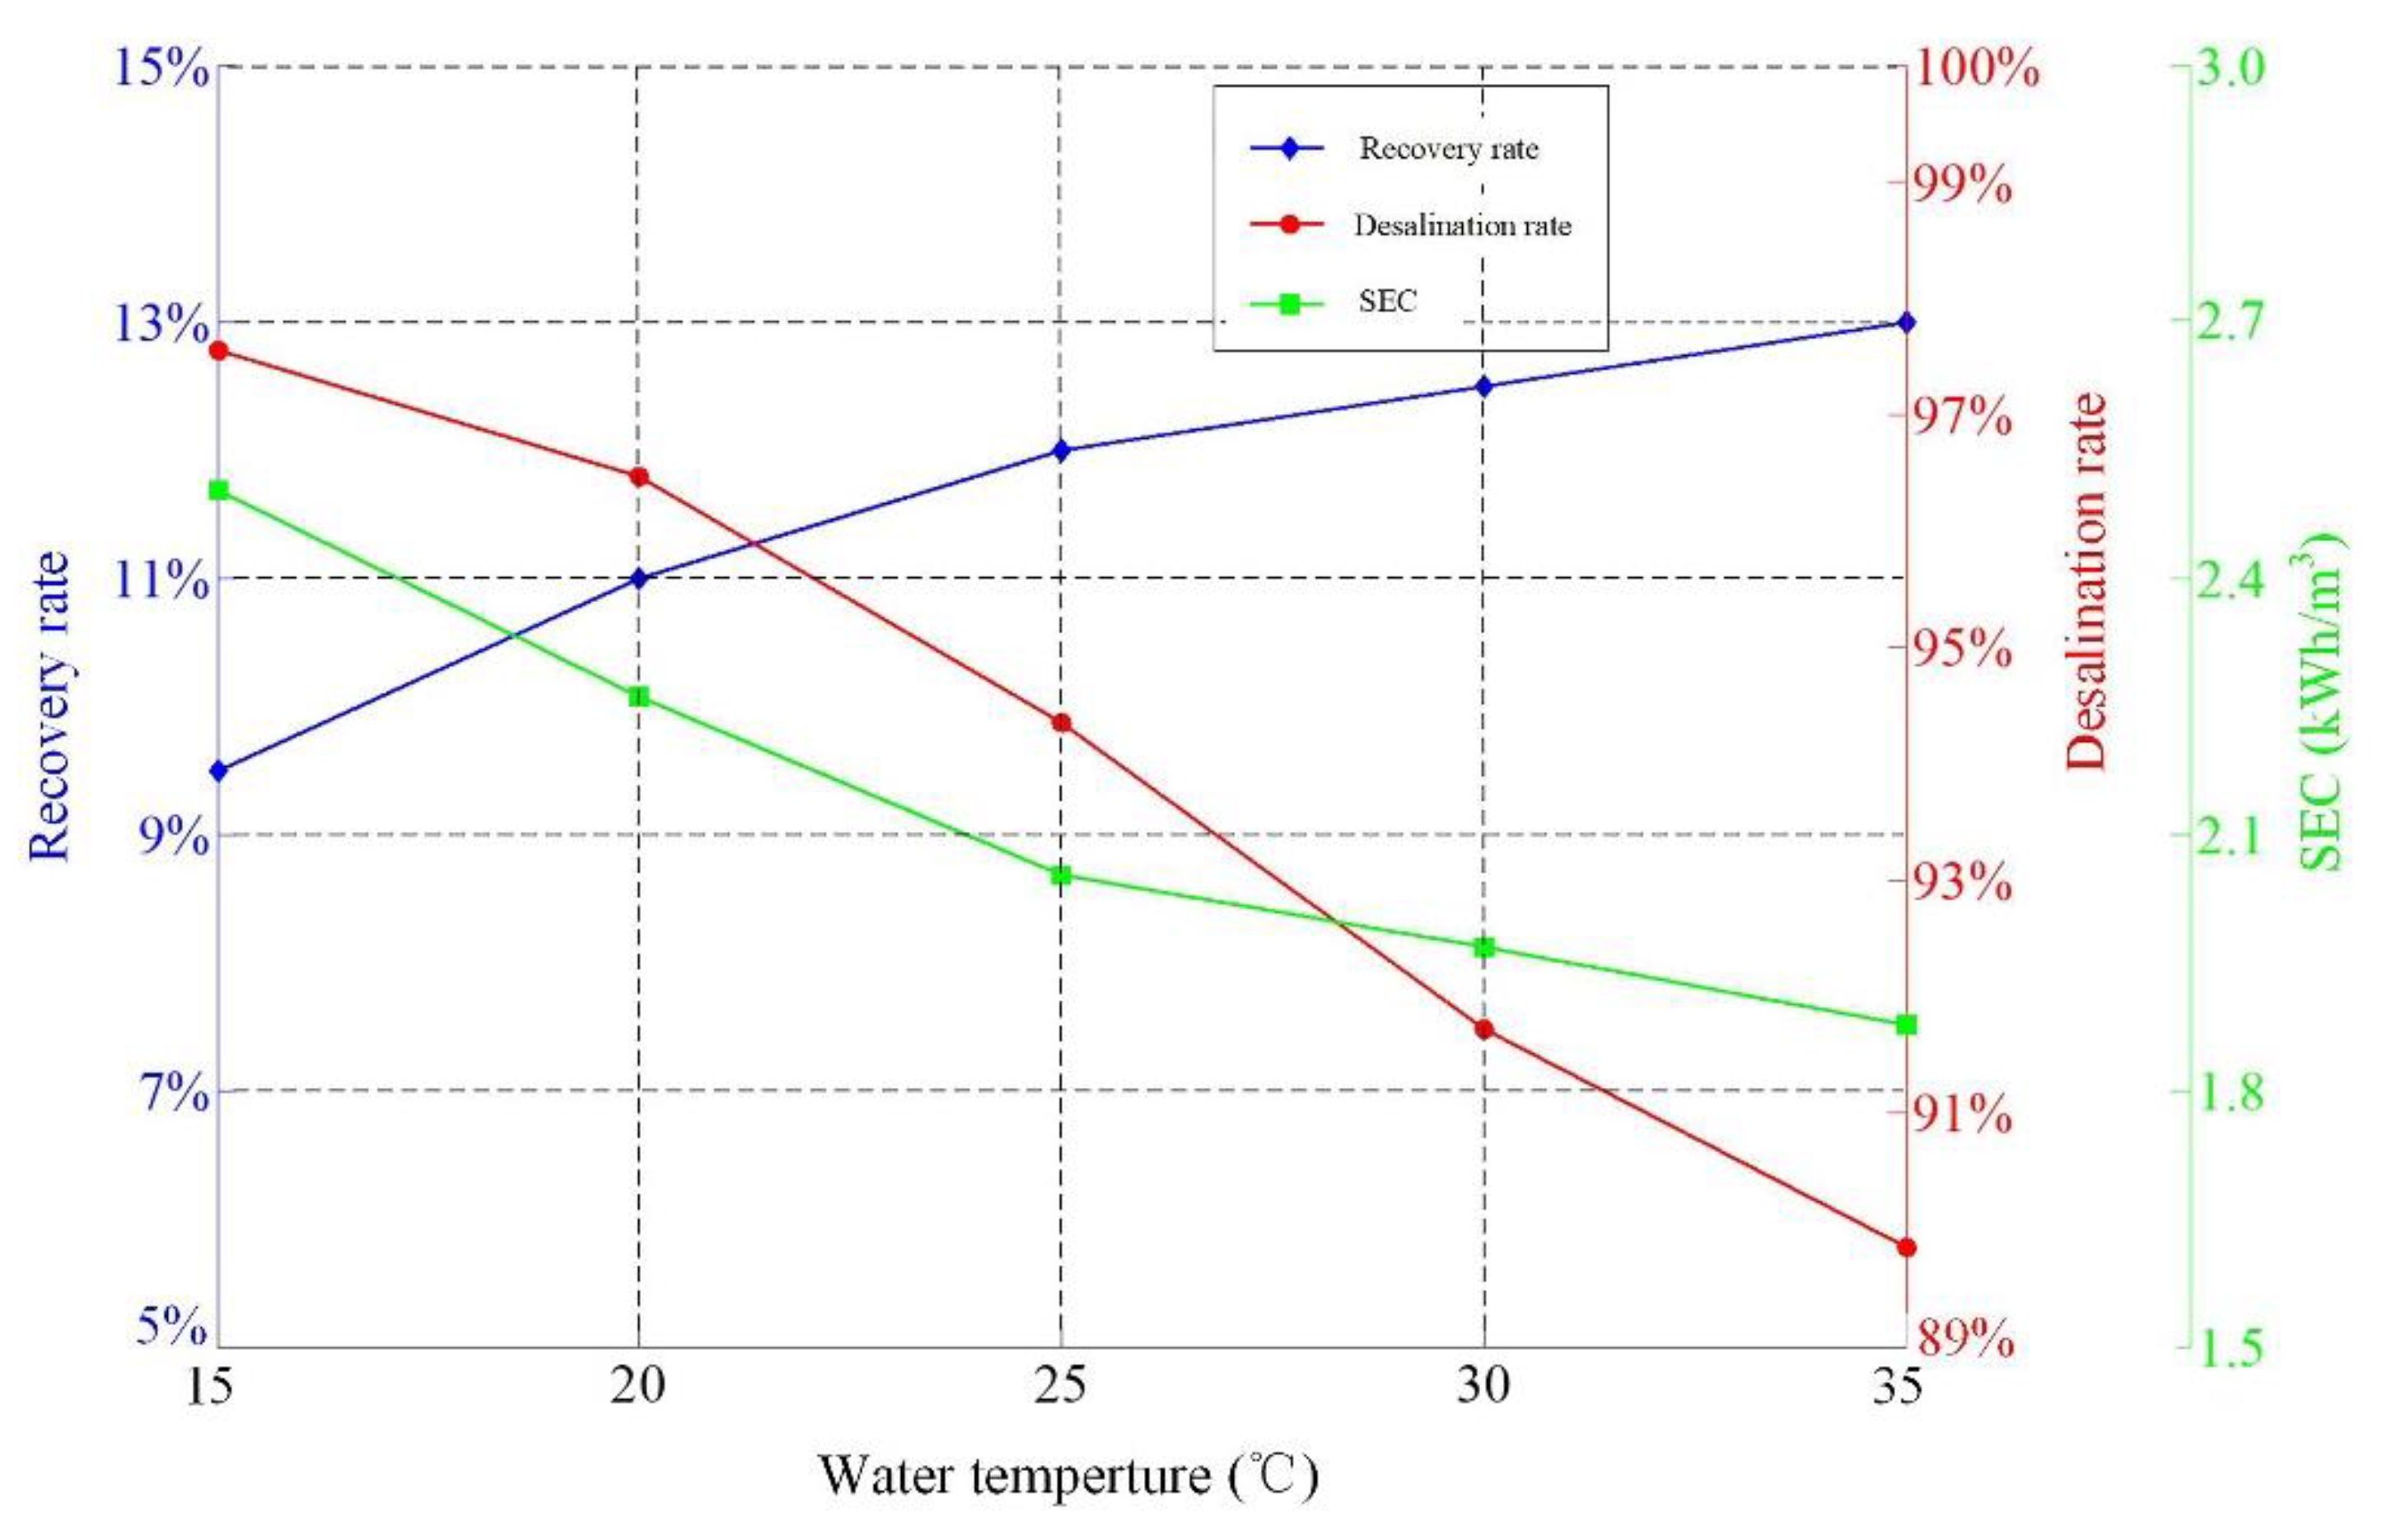
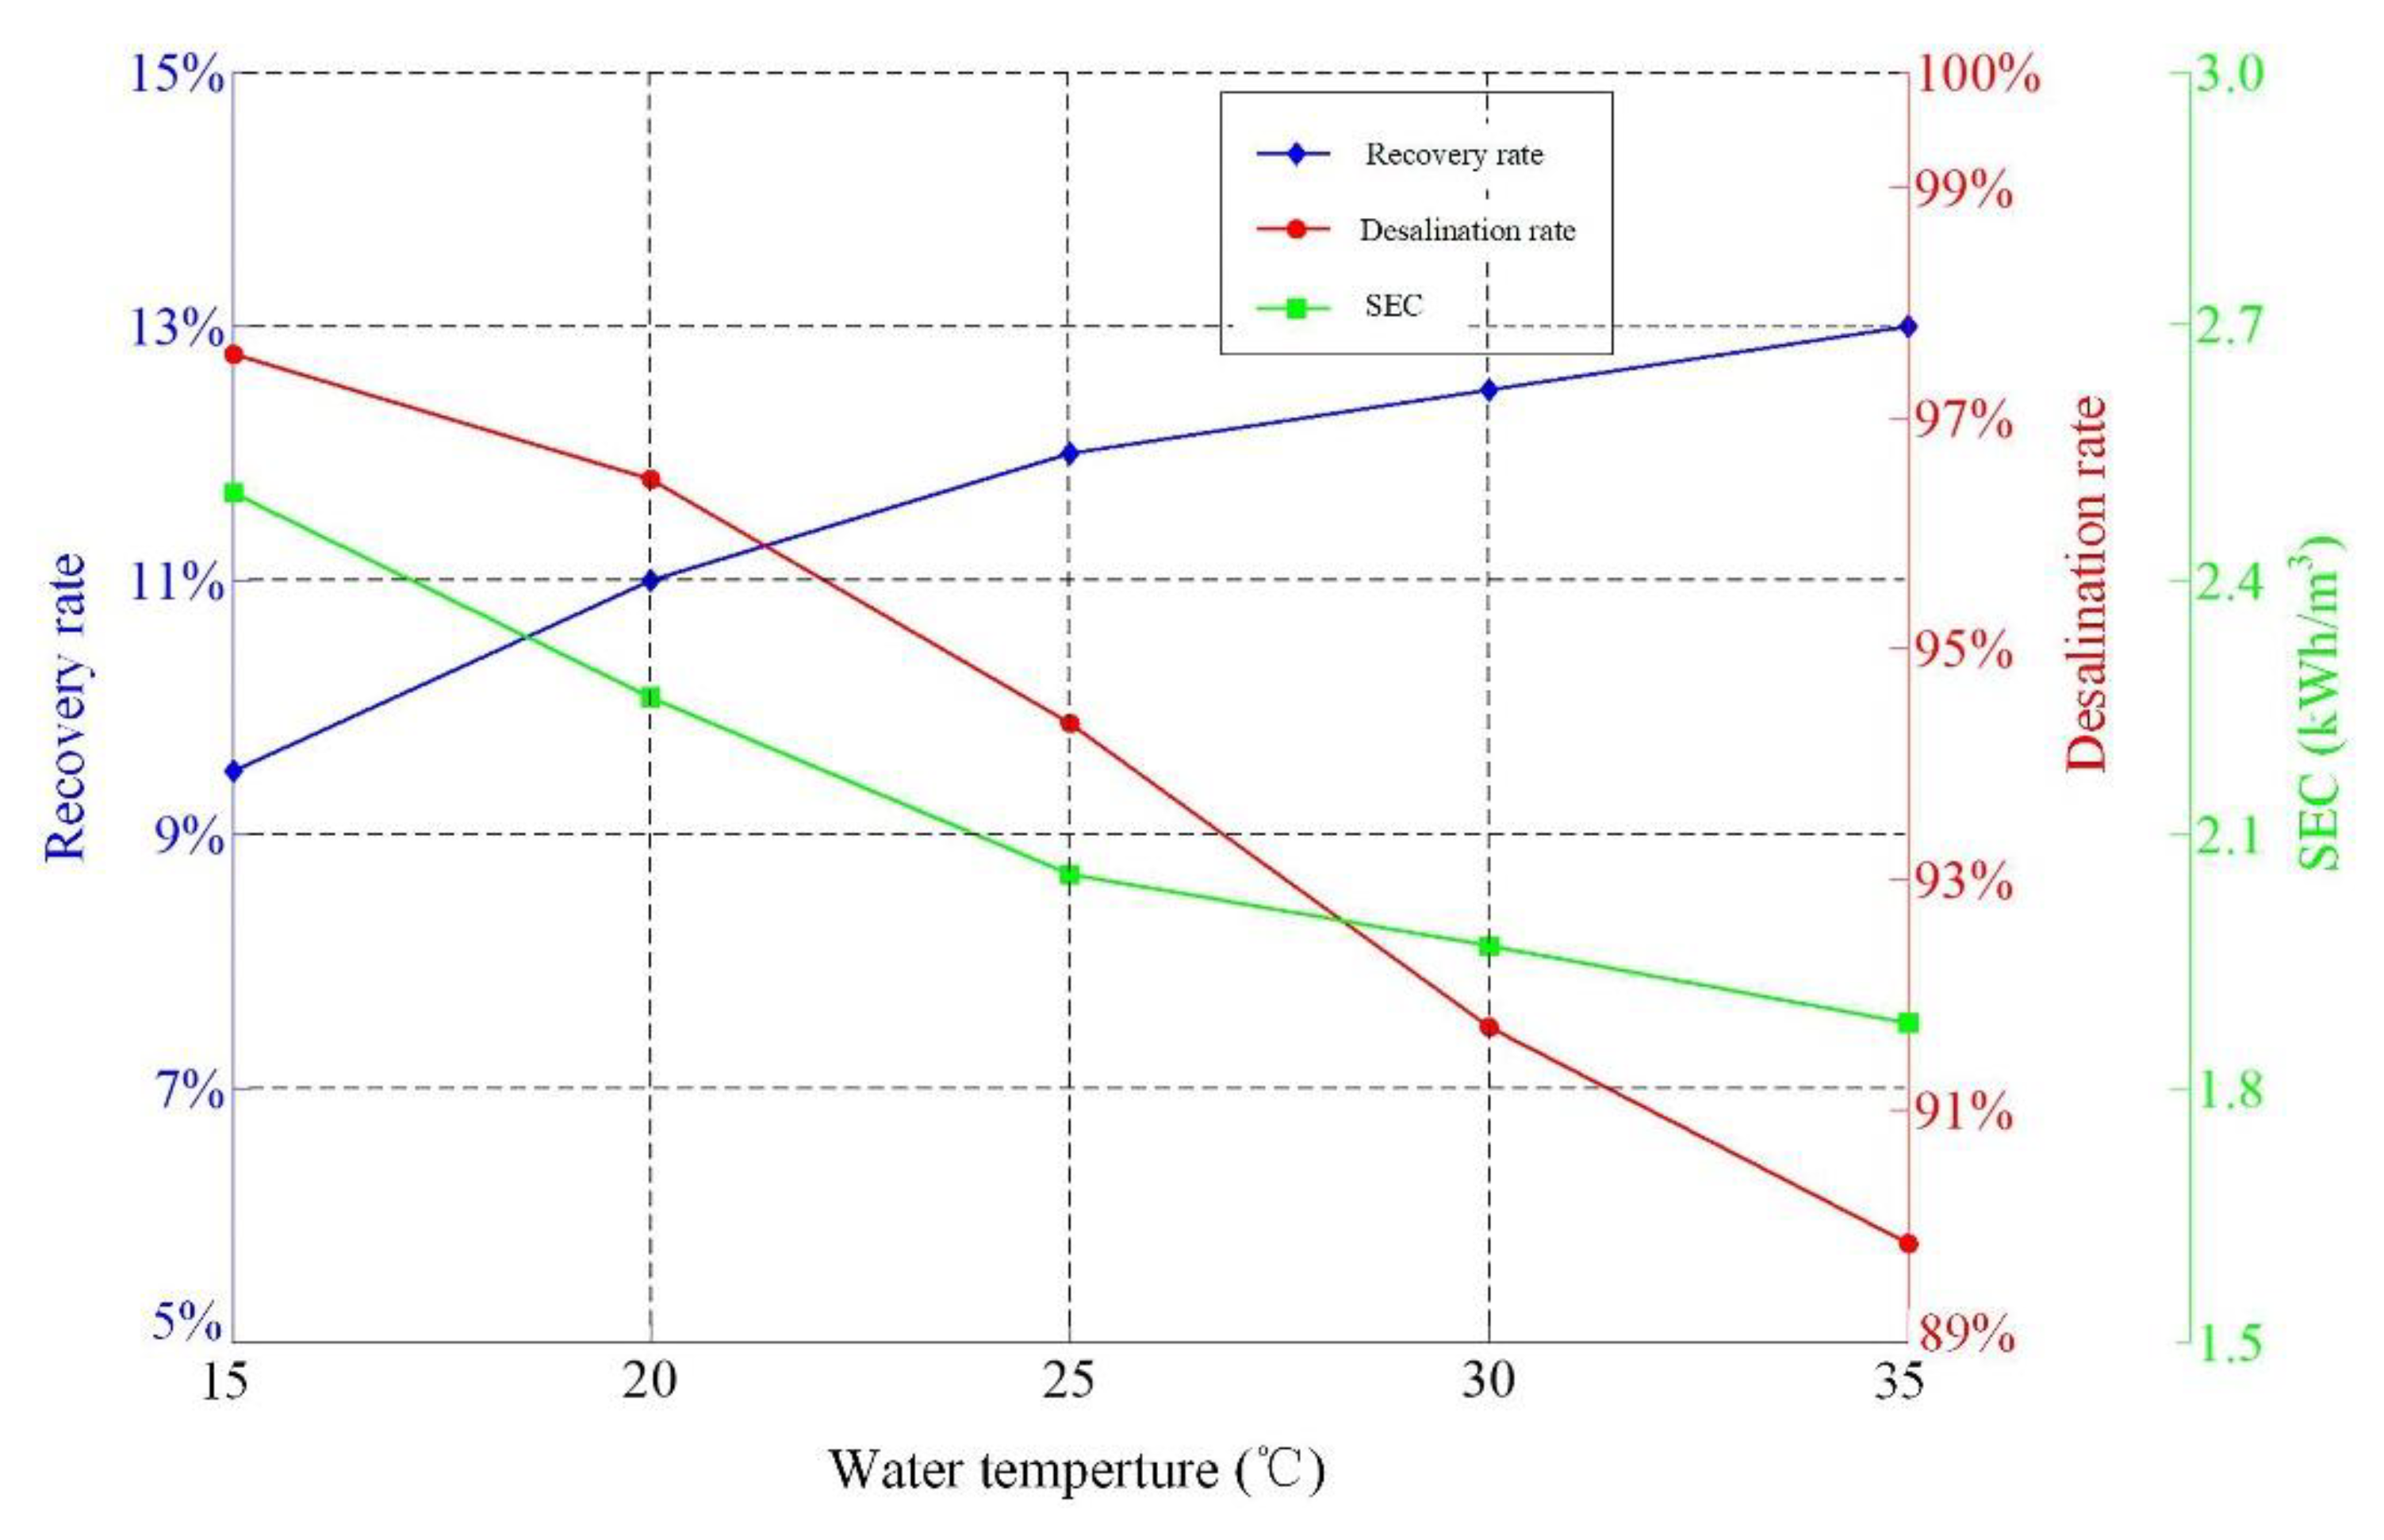
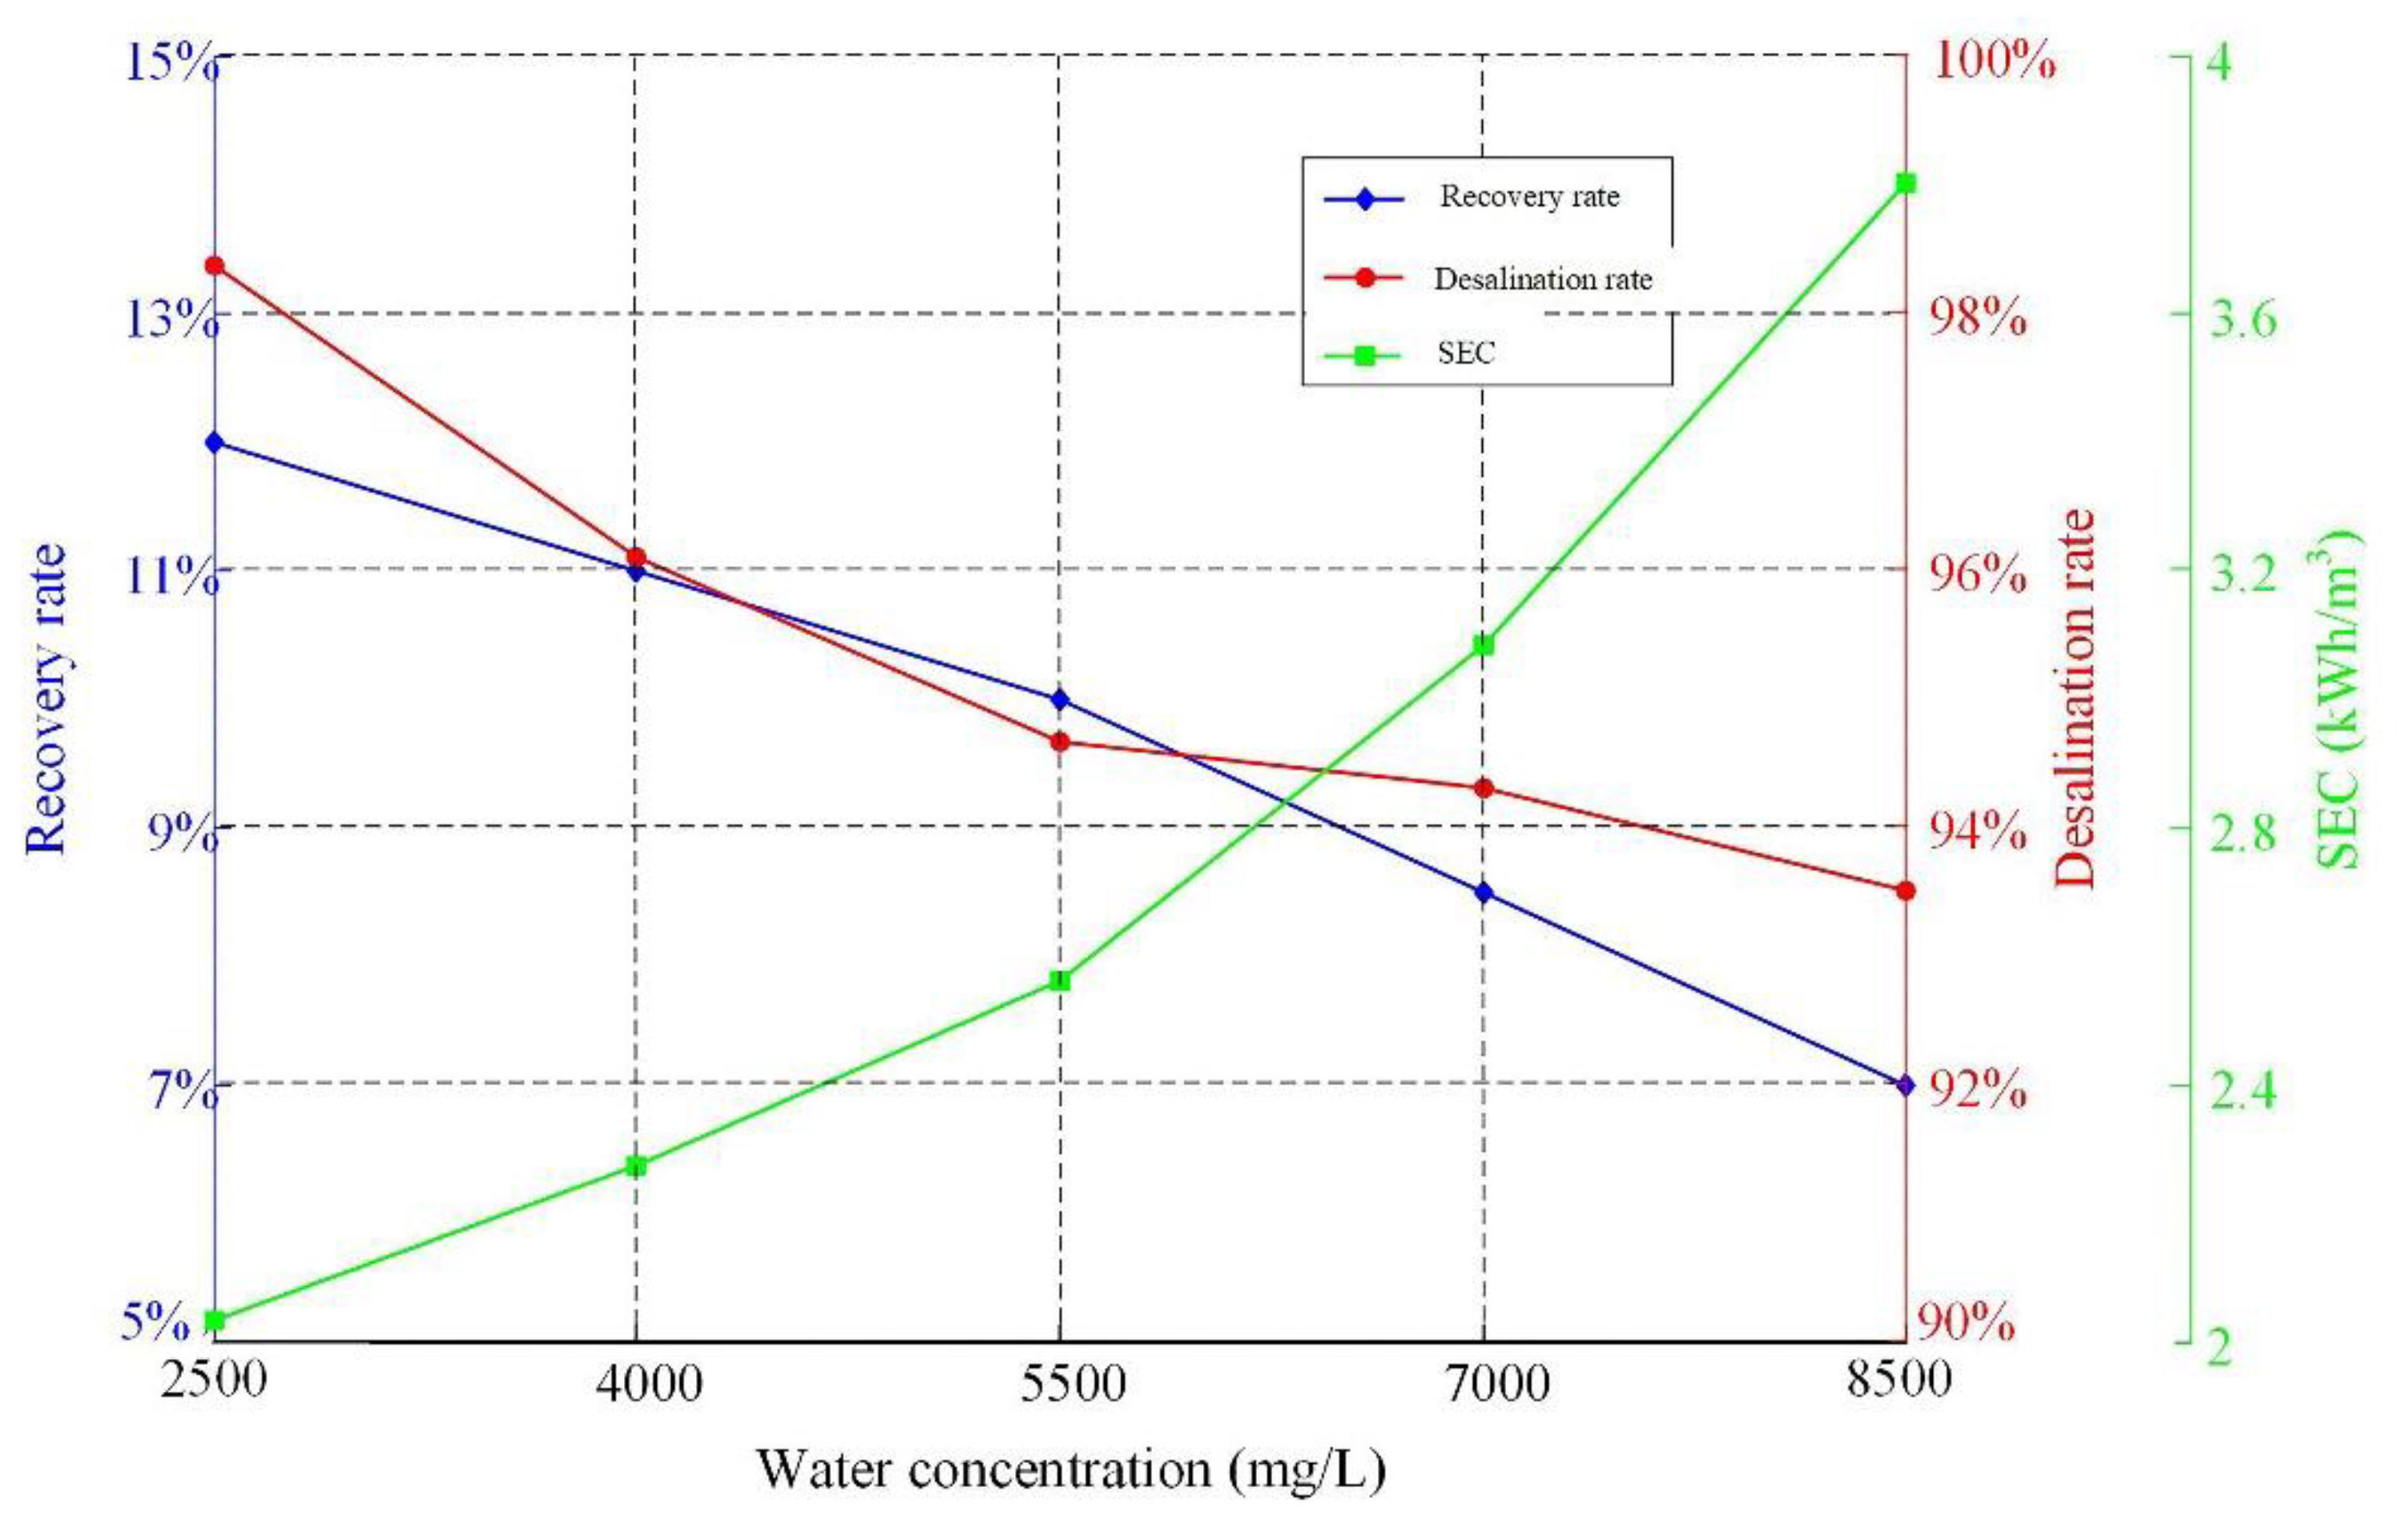
Figure 10, Figure 11, Figure 12 and Figure 13 show the change trend of the recovery rate, desalination rate and specific energy consumption of the prototype reverse osmosis system under different operating parameters. Make the prototype run in a stable state. The standard conditions are set for water supply pressure of 0.6 MPa, water temperature of 20 °C, water supply salinity of 4000 mg/L, and water supply flow rate of 2 L/min.
It can be seen from Figure 10 that the recovery rate increases with the increase of feed water pressure, and is basically linearly related. The desalination rate also increases with the increase of the feed water pressure, so the conductivity of the product water quality decreases, that is, the TDS of the product water decreases with the increase of the feed water pressure. The production water TDS drops the fastest in 0.4–0.6 MPa, and slows down in 0.6–0.8 MPa, and gradually stabilizes. The specific energy consumption of the system decreases with the increase of water supply pressure, and is basically linearly related. Therefore, when the pressure reaches 0.8 MPa, the specific energy consumption of the system is the smallest, the fresh water output is the highest, the water TDS is the lowest, and the system performance is the best.
According to Figure 11, the recovery rate increases as the temperature rises, while the desalination rate decreases as the temperature rises, and the specific energy consumption decreases as the temperature rises. In this experiment, although increasing the feed water temperature will reduce the desalination rate, that is, reduce the quality of fresh water, the actual TDS value of the produced water is below the standard limit value. Therefore, when the water quality meets the requirements, increasing the feed water temperature can increase the water flow rate, reduce system energy consumption, and reduce desalination costs.
It can be seen from Figure 12 that the increase in feed water salinity will lead to a substantial decrease in the recovery rate and desalination rate of the system, and a substantial increase in specific energy consumption. Among them, the production water TDS increases the most when it is 7000–8500 mg/L, and exceeds the drinking water standard, indicating that the water supply pressure is insufficient at this time and cannot produce sufficient effective driving force. At this time, increasing the water supply pressure can significantly improve the water quality.
It can be seen from Figure 13 that with the continuous increase of feed water flow, the recovery rate of the system is basically unchanged, the increase in desalination rate is small and not obvious, and the specific energy consumption increases with the increase of feed water flow. In the case of low feed water concentration, the positive benefit of increasing feed water flow is very small, which will only slightly increase the salt rejection rate, but will increase the energy consumption of the system.
5. Conclusions
This paper designs a small reverse osmosis seawater desalination plant and analyzes its energy consumption in detail. Then, related experiments were carried out according to the built test prototype, and the influence trend of different operating parameters on the performance of the reverse osmosis system was established.
Through the analysis of the specific energy consumption and energy utilization efficiency of the system, the formula for solving the minimum specific energy consumption of the reverse osmosis process and the relationship between the recovery rate and the efficiency of the high-pressure pump are found, as well as the formula for solving the energy utilization efficiency of the reverse osmosis process and water supply. The relationship is between pressure and concentration. The target recovery rate of the reverse osmosis system is 20–30%. The higher the efficiency of the high-pressure pump is, the lower the specific energy consumption of the system. If the feed solution concentration is too low, it will reduce the energy utilization efficiency of the system. Therefore, seawater with a certain concentration has the value of desalination. In addition, if the feed water pressure meets the requirements of the system, too high a feed solution concentration will reduce the energy utilization efficiency, but the reduction is small.
By building a test prototype, the influence of different operating parameters on the performance of a small reverse osmosis system was studied. First, we conducted the steady-state condition experiment of the reverse osmosis system to determine the time for the reverse osmosis system to reach the steady state, to facilitate subsequent experiments to collect valid data. Then we used the controlled variable method to analyze the influence of feed water pressure, temperature, concentration and flow rate on the production water flow, production water TDS and specific energy consumption of the system. Through the data processing and analysis of the experimental results, the influence trend of each dynamic parameter change on the operating performance of the reverse osmosis system is basically consistent with the theoretical calculation above.
Author Contributions
All the authors contributed to this paper. Conceptualization, Z.W.; methodology, B.Z.; software, T.W.; resources, H.M.; data curation, H.M.; writing—original draft preparation, Z.W.; writing—review and editing, Y.Z. All authors have read and agreed to the published version of the manuscript.
Funding
This paper was funded by NNSFC (National Natural Science Foundation of China), grant number 51879063.
Data Availability Statement
Not applicable.
Conflicts of Interest
The authors declare no conflict of interest.
Nomenclature
| NaCl | Sodium chloride |
| NTU | Nephelometric Turbidity Unit |
| SEC | Specific Energy Consumption |
| SDI | Silt Density Index |
| RO | Reverse Osmosis |
| TDS | Total Dissolved Solids |
References
- Gao, C.K. Simple Talking about Desalination of Seawater. Chem. Technol. Econ. 2003, 21, 24–26. [Google Scholar] [CrossRef]
- Zioui, D.; Aburideh, H.; Tigrine, Z.; Hout, S.; Abbas, M.; Merzouk, N.K. Experimental study on a reverse osmosis device coupled with solar energy for water desalination. In Proceedings of the 2017 International Renewable and Sustainable Energy Conference (IRSEC), Tangiers, Morocco, 4–7 December 2017; pp. 1–5. [Google Scholar]
- Gao, C.K.; Zhou, Y.; Liu, L.F. Recent Development and Prospect of Seawater Reverse Osmosis Desalination Technology. J. Ocean Technol. 2016, 35, 1–14. [Google Scholar] [CrossRef]
- Liu, L.; Cheng, Q. Mass transfer characteristic research on electrodialysis for desalination and regeneration of solution: A comprehensive review. Renew. Sustain. Energy Rev. 2020, 134, 115. [Google Scholar] [CrossRef]
- Lu, Y.Y. Research on Optimal Design of Seawater Desalination Process with Reverse Osmosis Membrane. Ph.D. Thesis, Ocean University of China, Beijing, China, 2007. [Google Scholar]
- Liu, C.; Rainwater, K.; Song, L. Energy analysis and efficiency assessment of reverse osmosis desalination process. Desalination 2011, 276, 352–358. [Google Scholar] [CrossRef]
- Clarke, D.; Al-Abdeli, Y.; Kothapalli, G. The effects of including intricacies in the modelling of a small-scale solar-PV reverse osmosis desalination system. Desalination 2013, 311, 127–136. [Google Scholar] [CrossRef]
- Rathore, N.S.; Kundariya, N.; Sadistap, S.; Narain, A. Mathematical modeling and simulation of concentration polarization layer in reverse osmosis process. In Proceedings of the 2013 Students Conference on Engineering and Systems (SCES), Allahabad, India, 12–14 April 2013; pp. 1–4. [Google Scholar]
- Elsayed, M.; Refaey, H.A.; Abdellatif, O.E.; Sakr, R.Y.; Afify, R.I. Experimental investigation on the performance of a small reverse osmosis unit. J. Braz. Soc. Mech. Sci. Eng. 2018, 40, 218. [Google Scholar] [CrossRef]
- Karabelas, A.; Koutsou, C.; Kostoglou, M.; Sioutopoulos, D. Analysis of specific energy consumption in reverse osmosis desalination processes. Desalination 2017, 431, 6. [Google Scholar] [CrossRef]
- Zheng, C. Research on Optimal Dispatching of Whole Process of Reverse Osmosis Desalination System. Ph.D. Thesis, Hangzhou University of Electronic Science and Technology, Hangzhou, China, 2019. [Google Scholar]
- Lacroix, C.; Perier-Muzet, M.; Stitou, D. Dynamic Modeling and Preliminary Performance Analysis of a New Solar Thermal Reverse Osmosis. Desalination Process. 2019, 12, 4015. [Google Scholar] [CrossRef] [Green Version]
- Altaee, A. Computational model for estimating reverse osmosis system design and performance: Part-one binary feed solution. J. Desalination 2012, 291, 48–50. [Google Scholar] [CrossRef]
- Choi, J.-S.; Kim, J.-T. Modeling of full-scale reverse osmosis desalination system: Influence of operational parameters. J. Ind. Eng. Chem. 2014, 21, 33. [Google Scholar] [CrossRef]
- Wang, W. Research and Realization of Automatic Control Technology for Marine Reverse Osmosis Seawater Desalination. Ph.D. Thesis, Zhejiang University of Technology, Hangzhou, China, 2016. [Google Scholar]
- Koutsou, C.; Kritikos, E.; Karabelas, A.; Kostoglou, M. Analysis of temperature effects on the specific energy consumption in reverse osmosis desalination processes. Desalination 2019, 476, 4213. [Google Scholar] [CrossRef]
- Zhang, J.Z. Research on Island Energy Saving Integrated Desalination Device. Master’s Thesis, Zhejiang University of Technology, Hangzhou, China, 2017. [Google Scholar]
- Su, H.C.; Wu, S.B.; Xu, J.M. Analysis on design points of box type reverse osmosis desalination unit. Water Treat. Technol. 2019, 45, 120–122. [Google Scholar]
- Pan, C.Y.; Li, L.; Zhou, Z.J.; Jin, S.P.; Wang, K.N.; Feng, T. Design points of small desalination equipment. Water Purif. Technol. 2018, 37, 149–151. [Google Scholar] [CrossRef]
- Song, J.; Li, T.; Wright-Contreras, L.; Law, A. A review of the current status of small-scale seawater reverse osmosis desalination. Water Int. 2017, 42, 1–14. [Google Scholar] [CrossRef]
- Blue Star Environmental Engineering Co. Ltd. Reverse Osmosis Water Treatment Equipment; General Administration of Quality Supervision, Inspection and Quarantine of the People’ Republic of China: Beijing, China, 2017; p. 12. [Google Scholar]
- Hangzhou Water Treatment Technology Research and Development Center Co., Ltd.; Tianjin Institute of Desalination and Comprehensive Utilization, State Oceanic Administration. Specification for Design of Reverse Osmosis Seawater Desalination Project; Ministry of Natural Resources of the People’s Republic of China: Beijing, China, 2018; p. 28.
- Wang, L.M.; Yang, F.; Zhou, S.Y.; Chen, T.Y.; Li, H.Q. Research on post-treatment of seawater desalination reverse osmosis membrane. Water Treat. Technol. 2013, 39, 83–84. [Google Scholar] [CrossRef]
- Jiang, Z.Y.; Li, D.; Peng, F.B. Mass transfer theory and model of pervaporation (I) Mass transfer model through membrane. Membr. Sci. Technol. 2003, 23, 37–41. [Google Scholar] [CrossRef]
- Bazhin, N.; Parmon, V. Hydro-Osmotic Pressure. DokPC 2019, 484, 1–3. [Google Scholar] [CrossRef]
- Xu, L.M.; Xia, G.; Bi, F.; van Loosdrecht, M.C.M.; Euverink, G.J.W. Influence of concentration polarization in reverse osmosis system. Ind. Water Treat. 2004, 24, 63–65. [Google Scholar] [CrossRef]
- Song, L.; Hu, J.; Ong, S.-L.; Ng, J.; Elimelech, M.; Wilf, M. Emergence of thermodynamic restriction and its implications for full-scale reverse osmosis processes. Desalination 2003, 155, 213–228. [Google Scholar] [CrossRef]
- Lyster, E.; Cohen, Y. Numerical study of concentration polarization in a rectangular reverse osmosis membrane channel: Permeate flux variation and hydrodynamic end effects. J. Membr. Sci. 2007, 303, 140–153. [Google Scholar] [CrossRef]
Figure 1.
Process flow of a small reverse osmosis seawater desalination unit.

Figure 2.
Overall structure of a small reverse osmosis seawater desalination unit: 1—sand filter; 2—flow meter; 3—accumulator; 4—pressure gauge; 5—feed pump; 6—battery; 7—flow control valve; 8—reverse osmosis membrane pressure vessel; 9—solar controller; 10—battery charger; 11—ultraviolet disinfector; 12—post-processing activated carbon; 13—solar photovoltaic panel; 14—check valve; 15—fine filter; 16—high pressure pump.

Figure 3.
Power supply module of the small reverse osmosis desalination unit.

Figure 4.
Schematic diagram of the one-stage two-stage reverse osmosis process.

Figure 5.
The relationship between the standard specific energy consumption and the recovery rate and the efficiency of the high-pressure pump.
Figure 5.
The relationship between the standard specific energy consumption and the recovery rate and the efficiency of the high-pressure pump.

Figure 6.
The relationship of membrane energy utilization efficiency η with the concentration of feed solution and feed water pressure.
Figure 6.
The relationship of membrane energy utilization efficiency η with the concentration of feed solution and feed water pressure.

Figure 7.
The specific environment of the experimental prototype.

Figure 8.
Steady-state conditions of product water flow at 15, 20, and 25 °C.

Figure 9.
Steady-state conditions of produced water quality at 15, 20, and 25 °C.

Figure 10.
Variation trend of produced water flow, produced water TDS and specific energy consumption under different feed water pressures.
Figure 10.
Variation trend of produced water flow, produced water TDS and specific energy consumption under different feed water pressures.

Figure 11.
Variation trends of produced water flow, produced water TDS and specific energy consumption under different feed water temperatures.
Figure 11.
Variation trends of produced water flow, produced water TDS and specific energy consumption under different feed water temperatures.

Figure 12.
Variation trend of produced water flow, produced water TDS and specific energy consumption under different feed water salinities.
Figure 12.
Variation trend of produced water flow, produced water TDS and specific energy consumption under different feed water salinities.

Figure 13.
Variation trends of produced water flow, produced water TDS and specific energy consumption under different feed water flows.
Figure 13.
Variation trends of produced water flow, produced water TDS and specific energy consumption under different feed water flows.


Table 1.
Product specifications of the SW30-2521 membrane module.
| Stable Desalination Rate | Effective Membrane Area | Work Pressure | Temperature | Water Production | pH Range | Molecular Cut Off |
|---|---|---|---|---|---|---|
| 99.4% | 1.2 m2 | 5.5 MPa | 5–45 °C | 1.1 m3/d | 2–11 | 1000 |
Table 2.
Design guidelines for membrane flux and other indicators under standard conditions of 25 °C.
Table 2.
Design guidelines for membrane flux and other indicators under standard conditions of 25 °C.
| Raw Water Type | Influent Pollution Index (SDI 2) | Influent Turbidity (NTU 1) | Average Membrane Flux (L/(m2·h)) | Maximum Membrane Flux (L/(m2·h)) | Concentration Polarization (β) |
|---|---|---|---|---|---|
| Deep well water | <2 | 0.2 | 30 | 46 | 1.2 |
| Surface water | <4 | 0.4 | 20 | 30 | 1.2 |
| Sea well water | <3 | 0.3 | 17 | 40 | 1.2 |
| Sea water | <4 | 0.4 | 15 | 34 | 1.2 |
1 NTU: Nephelometric Turbidity Unit. 2 SDI: Silt Density Index.
Publisher’s Note: MDPI stays neutral with regard to jurisdictional claims in published maps and institutional affiliations. |
© 2021 by the authors. Licensee MDPI, Basel, Switzerland. This article is an open access article distributed under the terms and conditions of the Creative Commons Attribution (CC BY) license (https://creativecommons.org/licenses/by/4.0/).
Share and Cite
MDPI and ACS Style
Wang, Z.; Zhang, Y.; Wang, T.; Zhang, B.; Ma, H. Design and Energy Consumption Analysis of Small Reverse Osmosis Seawater Desalination Equipment. Energies 2021, 14, 2275. https://doi.org/10.3390/en14082275
AMA Style
Wang Z, Zhang Y, Wang T, Zhang B, Ma H. Design and Energy Consumption Analysis of Small Reverse Osmosis Seawater Desalination Equipment. Energies. 2021; 14(8):2275. https://doi.org/10.3390/en14082275
Chicago/Turabian StyleWang, Zhuo, Yanjie Zhang, Tao Wang, Bo Zhang, and Hongwen Ma. 2021. "Design and Energy Consumption Analysis of Small Reverse Osmosis Seawater Desalination Equipment" Energies 14, no. 8: 2275. https://doi.org/10.3390/en14082275
Note that from the first issue of 2016, this journal uses article numbers instead of page numbers. See further details here.