
Diagnostics of PID Early Stage in PV Systems


Department of Electrotechnology, Faculty of Electrical Engineering, Czech Technical University in Prague, Technicka 2, 166 27 Prague, Czech Republic
*
Author to whom correspondence should be addressed.
Energies 2021, 14(8), 2155; https://doi.org/10.3390/en14082155
Submission received: 5 February 2021
/
Revised: 26 March 2021
/
Accepted: 8 April 2021
/
Published: 13 April 2021
(This article belongs to the Special Issue Fault Detection and Diagnosis of Photovoltaic Systems)
Abstract
:Potential induced degradation (PID) is a serious threat for the photovoltaic (PV) industry. The risk of PID may increase with increasing operating voltage of PV systems. Although PID tests are currently standard tests, the expansion of floating PV power plants and installation in humid climates show that PID-free modules are still sensitive to this type of degradation. Therefore, a method that can detect PID in the initial phase before standard tests reveal it, is necessary to increase the reliability of PV systems and maintain their lifetime. One possible tool for revealing early-stage PID manifestations is impedance spectroscopy and I-V dark curves measurements. Both IS and dark current measurement methods are sensitive to cell shunt resistance (RSH), which is strongly influenced by PID before significant power loss and can act as an early stage PID detection mechanism. The paper describes the differences of the common P-type PV module parameters both during the degradation process and also during the regeneration process when diagnosed by conventional and IS and dark current measurement methods.
1. Introduction
The potential induced degradation (PID) is one serious problem of present PV plants. The impact of the PID on the power plant can be very significant, because PV modules can lose up to 70% of their original performance in real conditions due to PID. The basic prerequisite for the progression of PID is a high potential difference between the module and the ground. PID depends on many different factors [1].
The existence of high voltage stress on modules was first raised in 1978 by Hoffman and Ross of the Jet Propulsion Laboratory in a study on real-life testing [2].
The performance of PV modules decreases rapidly during laboratory testing, due to the use of accelerated conditions such as higher voltage or humidity. On the other hand, if PV modules work in the field and are subject to PID, their performance may deteriorate slowly and over a long period (more than a year) and the degradation process may remain undetected for a long time. Conventional methods for detecting field energy losses have combined measurement uncertainties greater than 5%, which complicates PID detection [3].
Failure detection based on long-term analysis is possible, but not applicable for early detection of PID (without a significant decrease in performance) [3]. Some methods try to use leakage current, but detecting PID using leakage current has proven to be not entirely accurate because leakage current has been shown not to be directly related to PID progression [4].
The first solution to the PID problem is the modification of production technology and components that will eliminate the sensitivity of the module to high voltages. Production companies and research institutes have done many experiments that have lead to such modifications, e.g., by modifying the composition of the anti-reflective layer and the laminating material, a significant reduction in the rate of PID degradation was achieved in conventional P-type based PV modules, where the back of the module is covered with a Tedlar foil [5]. In the case of N-type based modules, namely Sunpower, where PID was first widely observed, research on the glass composition revealed that the PID sensitivity is connected with tin content (floated glass is made using molten tin) [6]. Another critical component is the lamination foil, usually EVA (ethyl-vinyl-acetate), whose ionic conductivity is essential for PID to affect development.
Currently, the possibility of installing floating PV modules on water surfaces, which represents an increased risk of PID degradation [7], is much discussed. Current tests of PID-free modules are in accordance with IEC 62804, where 85% humidity [8] during the tests may not be sufficient, and sensitivity to PID may not be fully detected. Materials that allow the production of PID-free modules may not be as effective in poor conditions. Regeneration of PID deteriorated modules using application voltages with opposite polarity is possible [9], but may not lead to perfect regeneration. Currently, there are many devices that attempt to regenerate a degraded module by reversing the polarity of the voltage and at least partially reversing the PID, but the problem is that very often, there is a need to install a relatively large number of these devices, usually one on several strings, or to regularly move around the power plant. Both of these methods are relatively expensive or require rapid diagnosis of the initial phase of degradation.
PID reduces the efficiency of PV modules, and therefore, in principle, electricity generation monitoring could be used to detect it. However, there are several other factors (irradiance, ambient temperature, wind speed, etc.) that affect energy production, so fluctuations in operating conditions may mask the incipient PID and the effect becomes apparent when a significant degree of degradation occurs. For diagnostics, it is possible to use the measurement of I-V characteristics using a solar simulator or detection of damage by electroluminescence, but this requires disassembly of modules and measurements in a specialized laboratory or special equipment for outdoor measurements. In the outdoor environment, the PID detection method mostly uses thermal imaging devices, but it can only be used with crystalline silicon modules only under specific conditions (clear sky, sufficient irradiance). PID diagnostics using a thermal imager is relatively insensitive and changes can only be seen when the module is already severely affected. However, for the diagnosis of large photovoltaic arrays, the only option is to use thermography in combination with a drone to at least briefly identify the defective modules. As follows from [10,11,12,13], in addition to the above methods, it is also possible to detect PID by changes in the dark I–V curves of the modulus, also called forward DC resistance (FDCR), or by impedance spectroscopy [14,15,16]. These methods require relatively less expensive equipment and can be used in situ.
This paper focuses on the comparison of the sensitivity of PID detection using several diagnostic methods (flash simulator, electroluminescence, impedance spectroscopy, and FDCR) during the process of parameter degradation and subsequent regeneration using the opposite polarization of the applied voltage. Finding the most PID-sensitive diagnostic method that can be easily applied may be very important for the detection of the early stage PID in PV plants.
2. PV Module PID
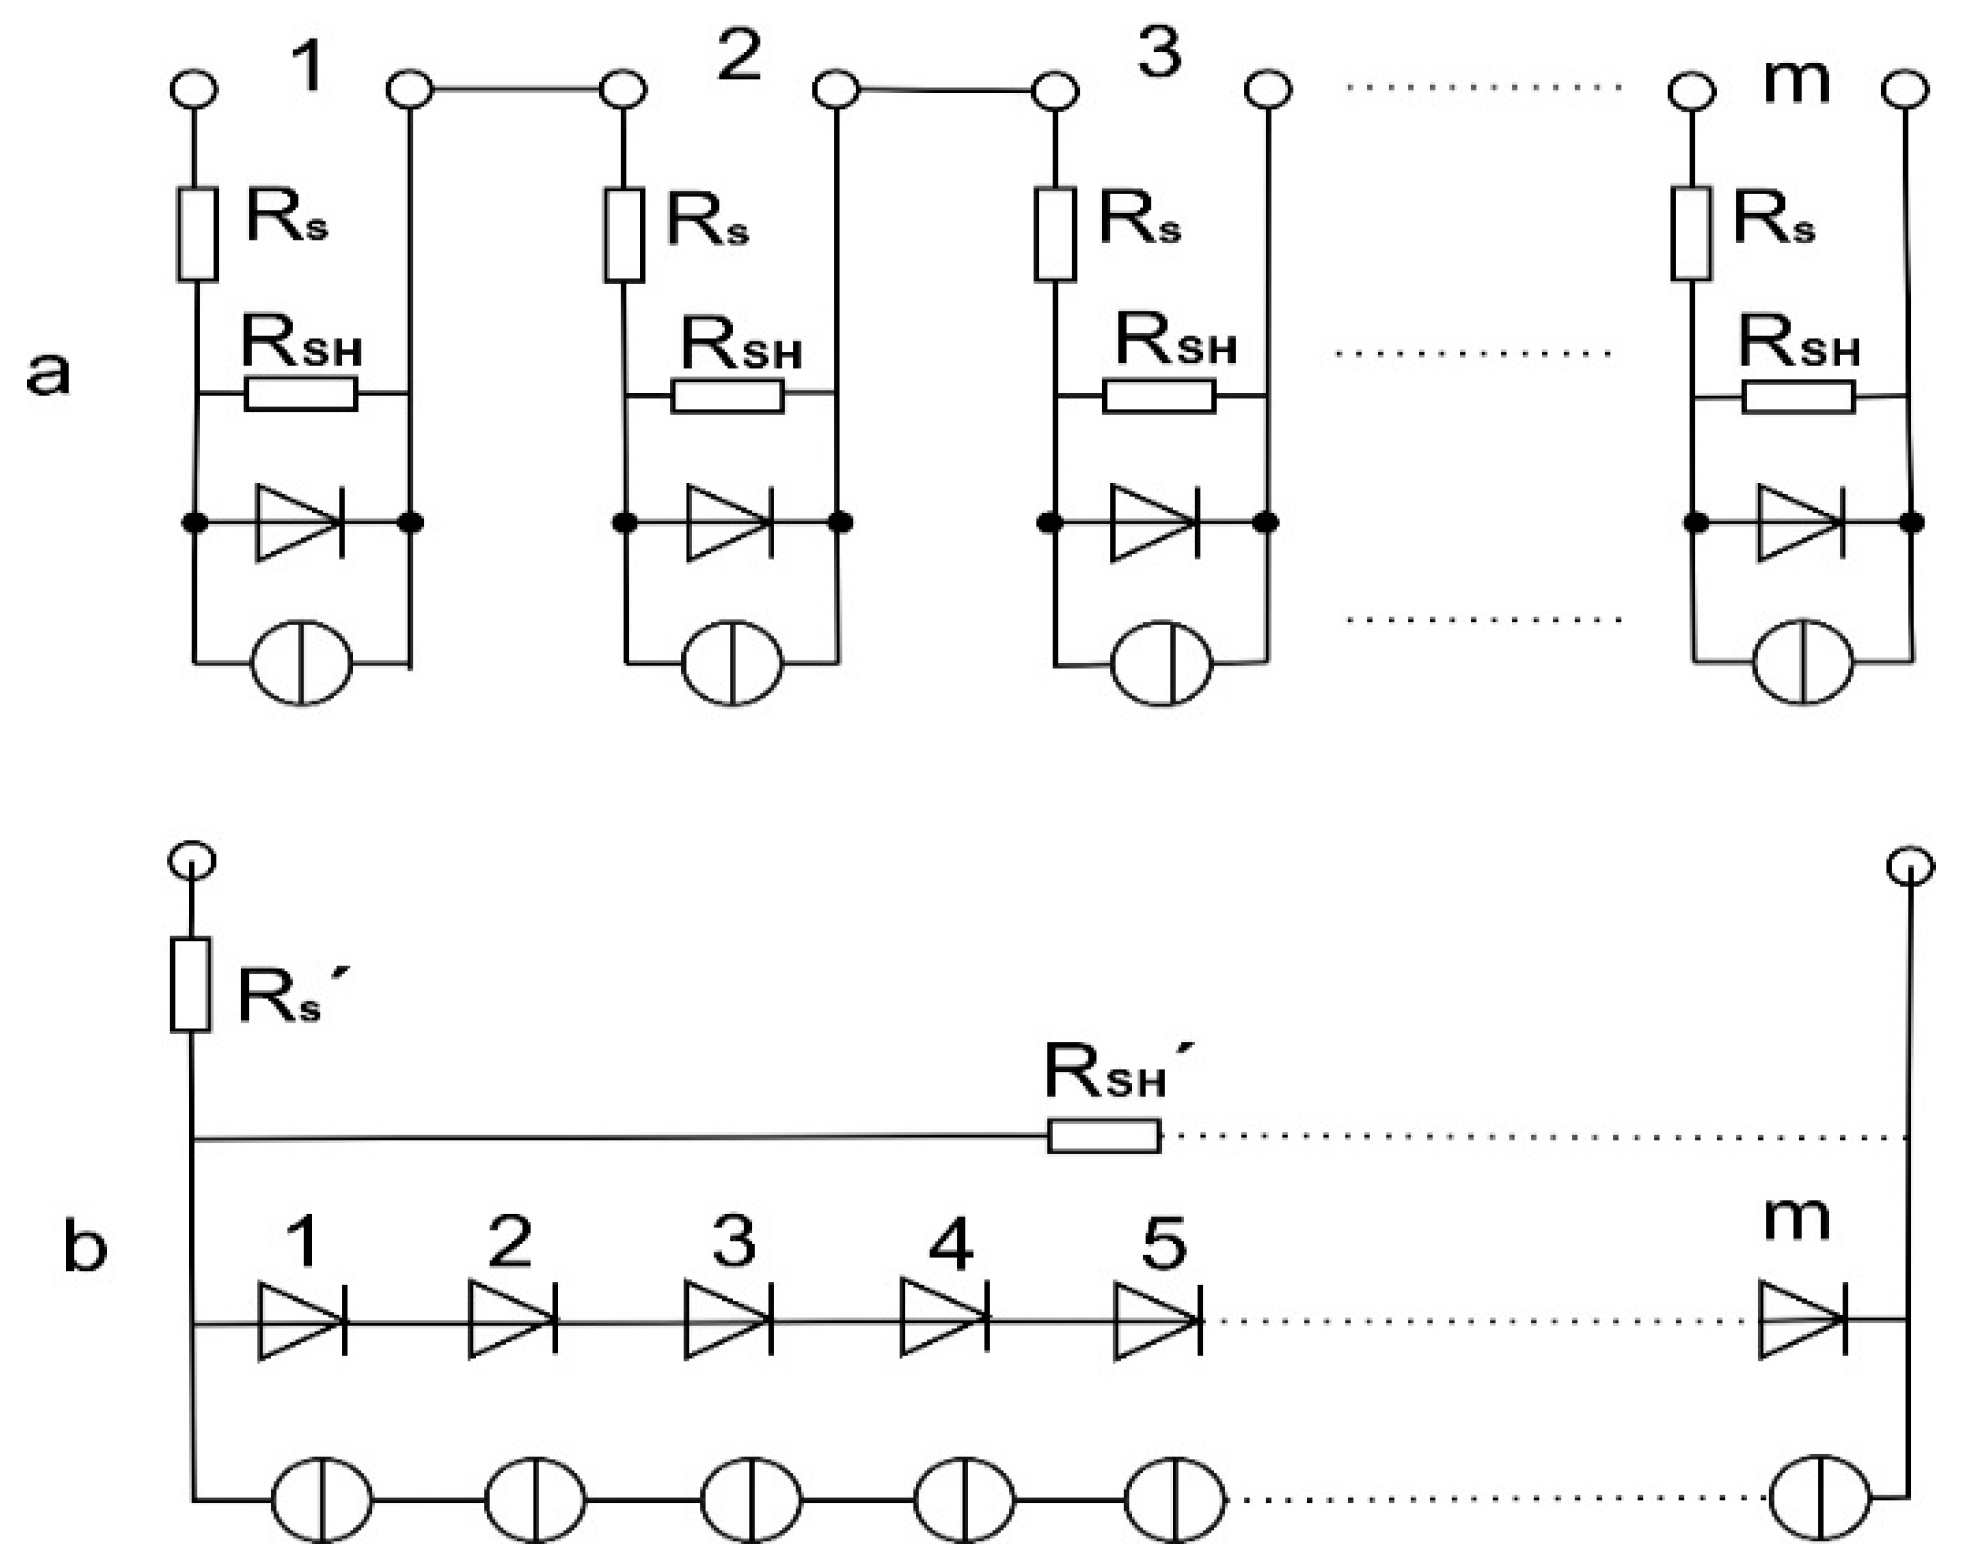
The basic blocks of PV installation are photovoltaic modules that are complete and environmentally protected assemblies of interconnected photovoltaic cells. PV modules usually consist of a number (m) in-series connected PV cells, as indicated in Figure 1a using the basic model of PV cells [17]. The current I through uniformly irradiated in-series connected cells will be limited by the minimum ISC of all cells connected in the string. For the serial connection, the cells should ideally have the same characteristics. In simplified approximation, marked in Figure 1b, the module can be represented by one value of series resistance RS’ and shunt resistance RSH’. I–V curve of the module (m serially connected cells) than have analogical to the basic PV cell I-V curve
where IPV is the photovoltaic generated current,
ID current flowing through the PN junction,
IRSH current flowing through the shunt resistance
RSH equivalent shunt resistance,
Rs series resistance
I useful current that the PV cell can deliver to the external circuit,
I01 diffusion component of the reverse current,
I02 generation-recombination component of the reverse current,
n1, n2 diode (ideality) factors,
k Boltzmann’s constant,
e electron elementary charge,
T thermodynamic temperature
V voltage at the PV cell terminal, module output voltage
m number of in-series connected cells
Changes in parameters of individual cells result in changes in the module parameters.
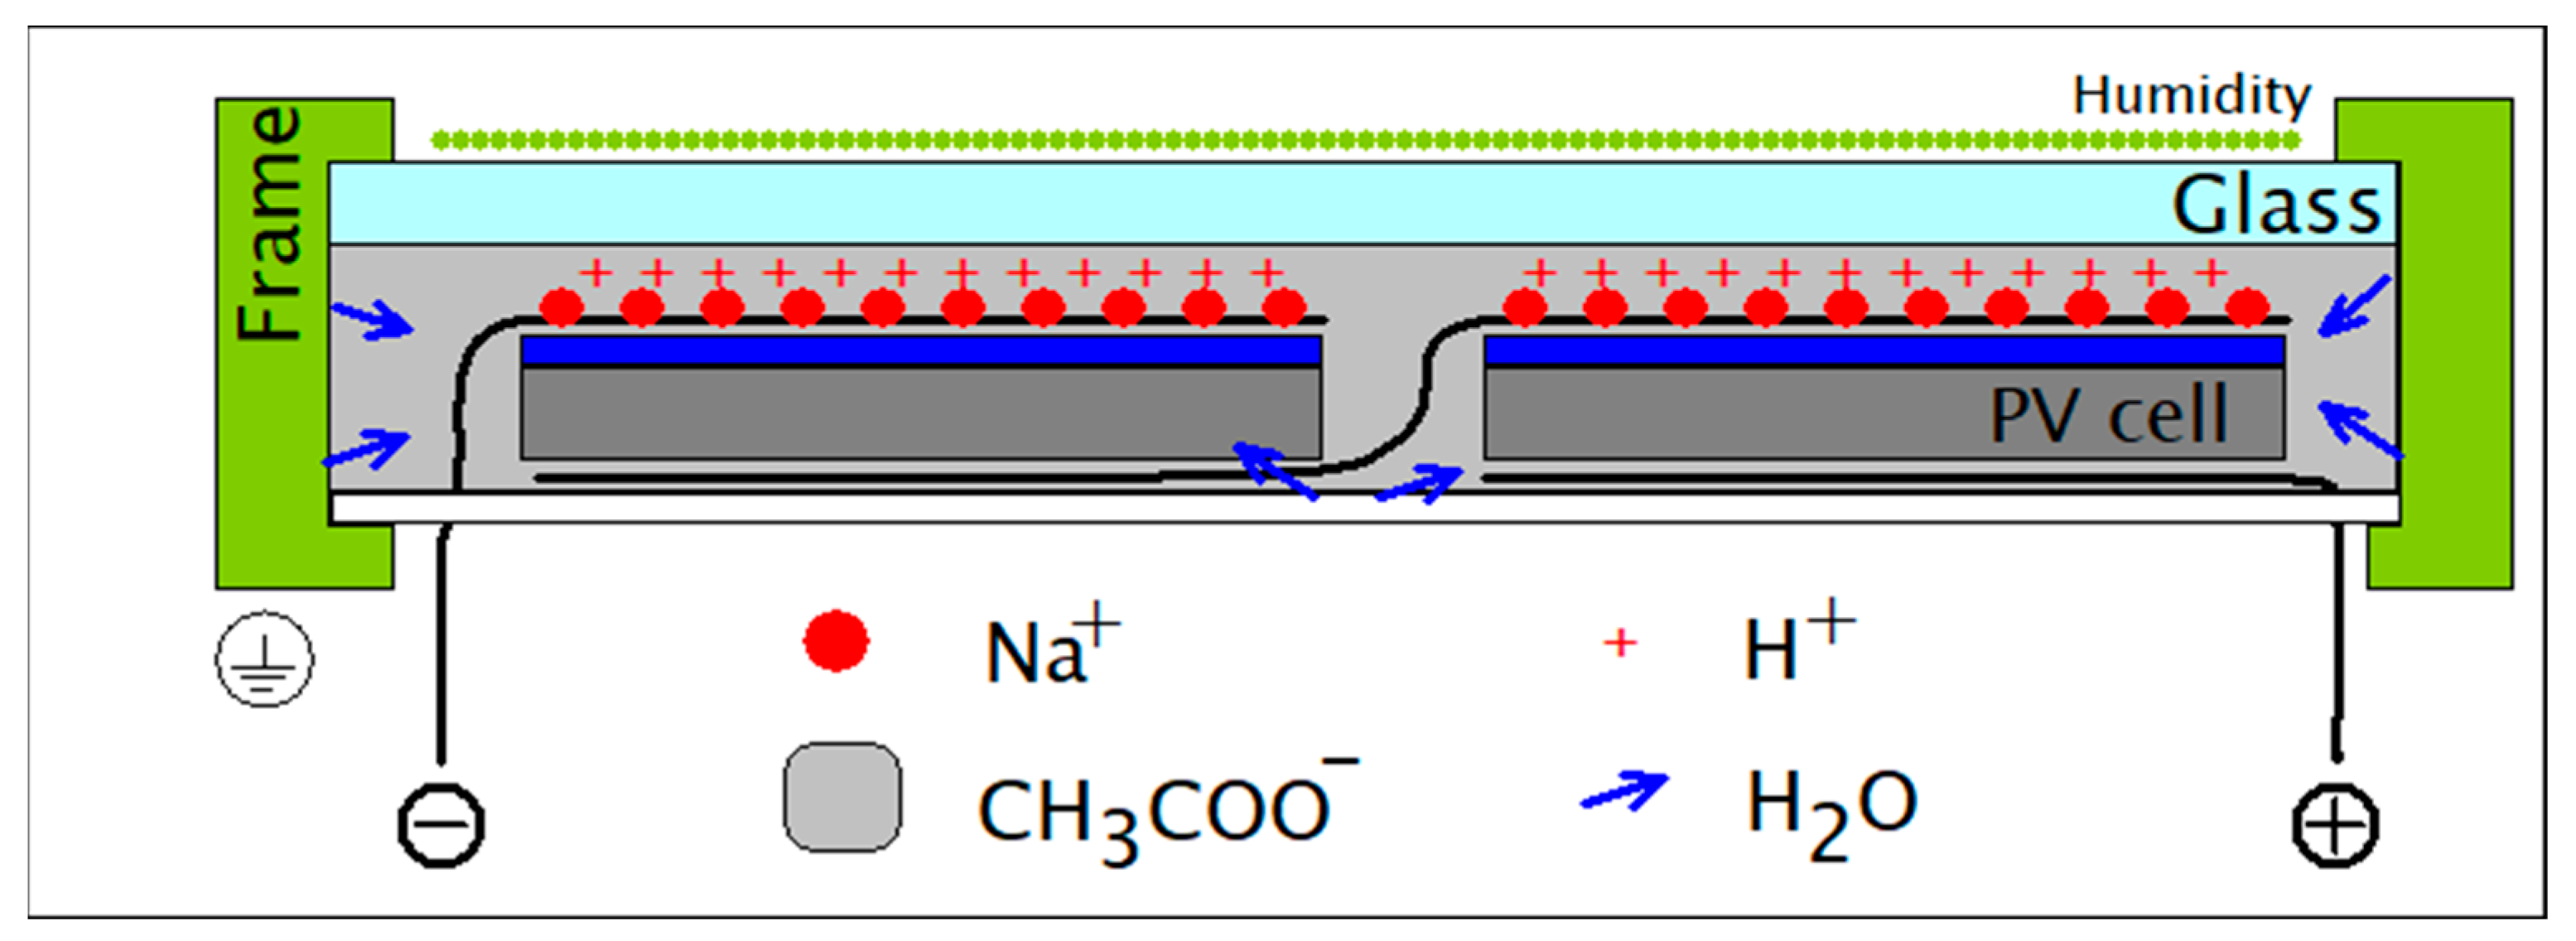
The covering soda-lime glass contains 13% to 14% Na2O. When the crystalline silicon P-type module is exposed to a high negative potential between cells and the module frame, positive sodium ions coming from the glass to the EVA migrate to the cell surface, contributing to the module leakage current [18]. Positively charged ions accumulate on the antireflection coating (ARC) surface. The light-generated electrons are attracted to the front surface of the cell by a positive charge in the AR coating, where they recombine, decreasing the generated current IPV. Soda-lime glass, involved in module-level PID-s development as the predominant charge carrier contributing to the leakage currents necessary for any PID-s development. The PID can be detected from changes in the parameters of the I-V curve.
The situation on the surface of the anti-reflective layer is shown in Figure 2. This results in a significant increase in surface recombination rate, resulting in a decrease of generated current IPV and, consequently, in a decrease of the open-circuit voltage Voc and the short-circuit current ISC [4].
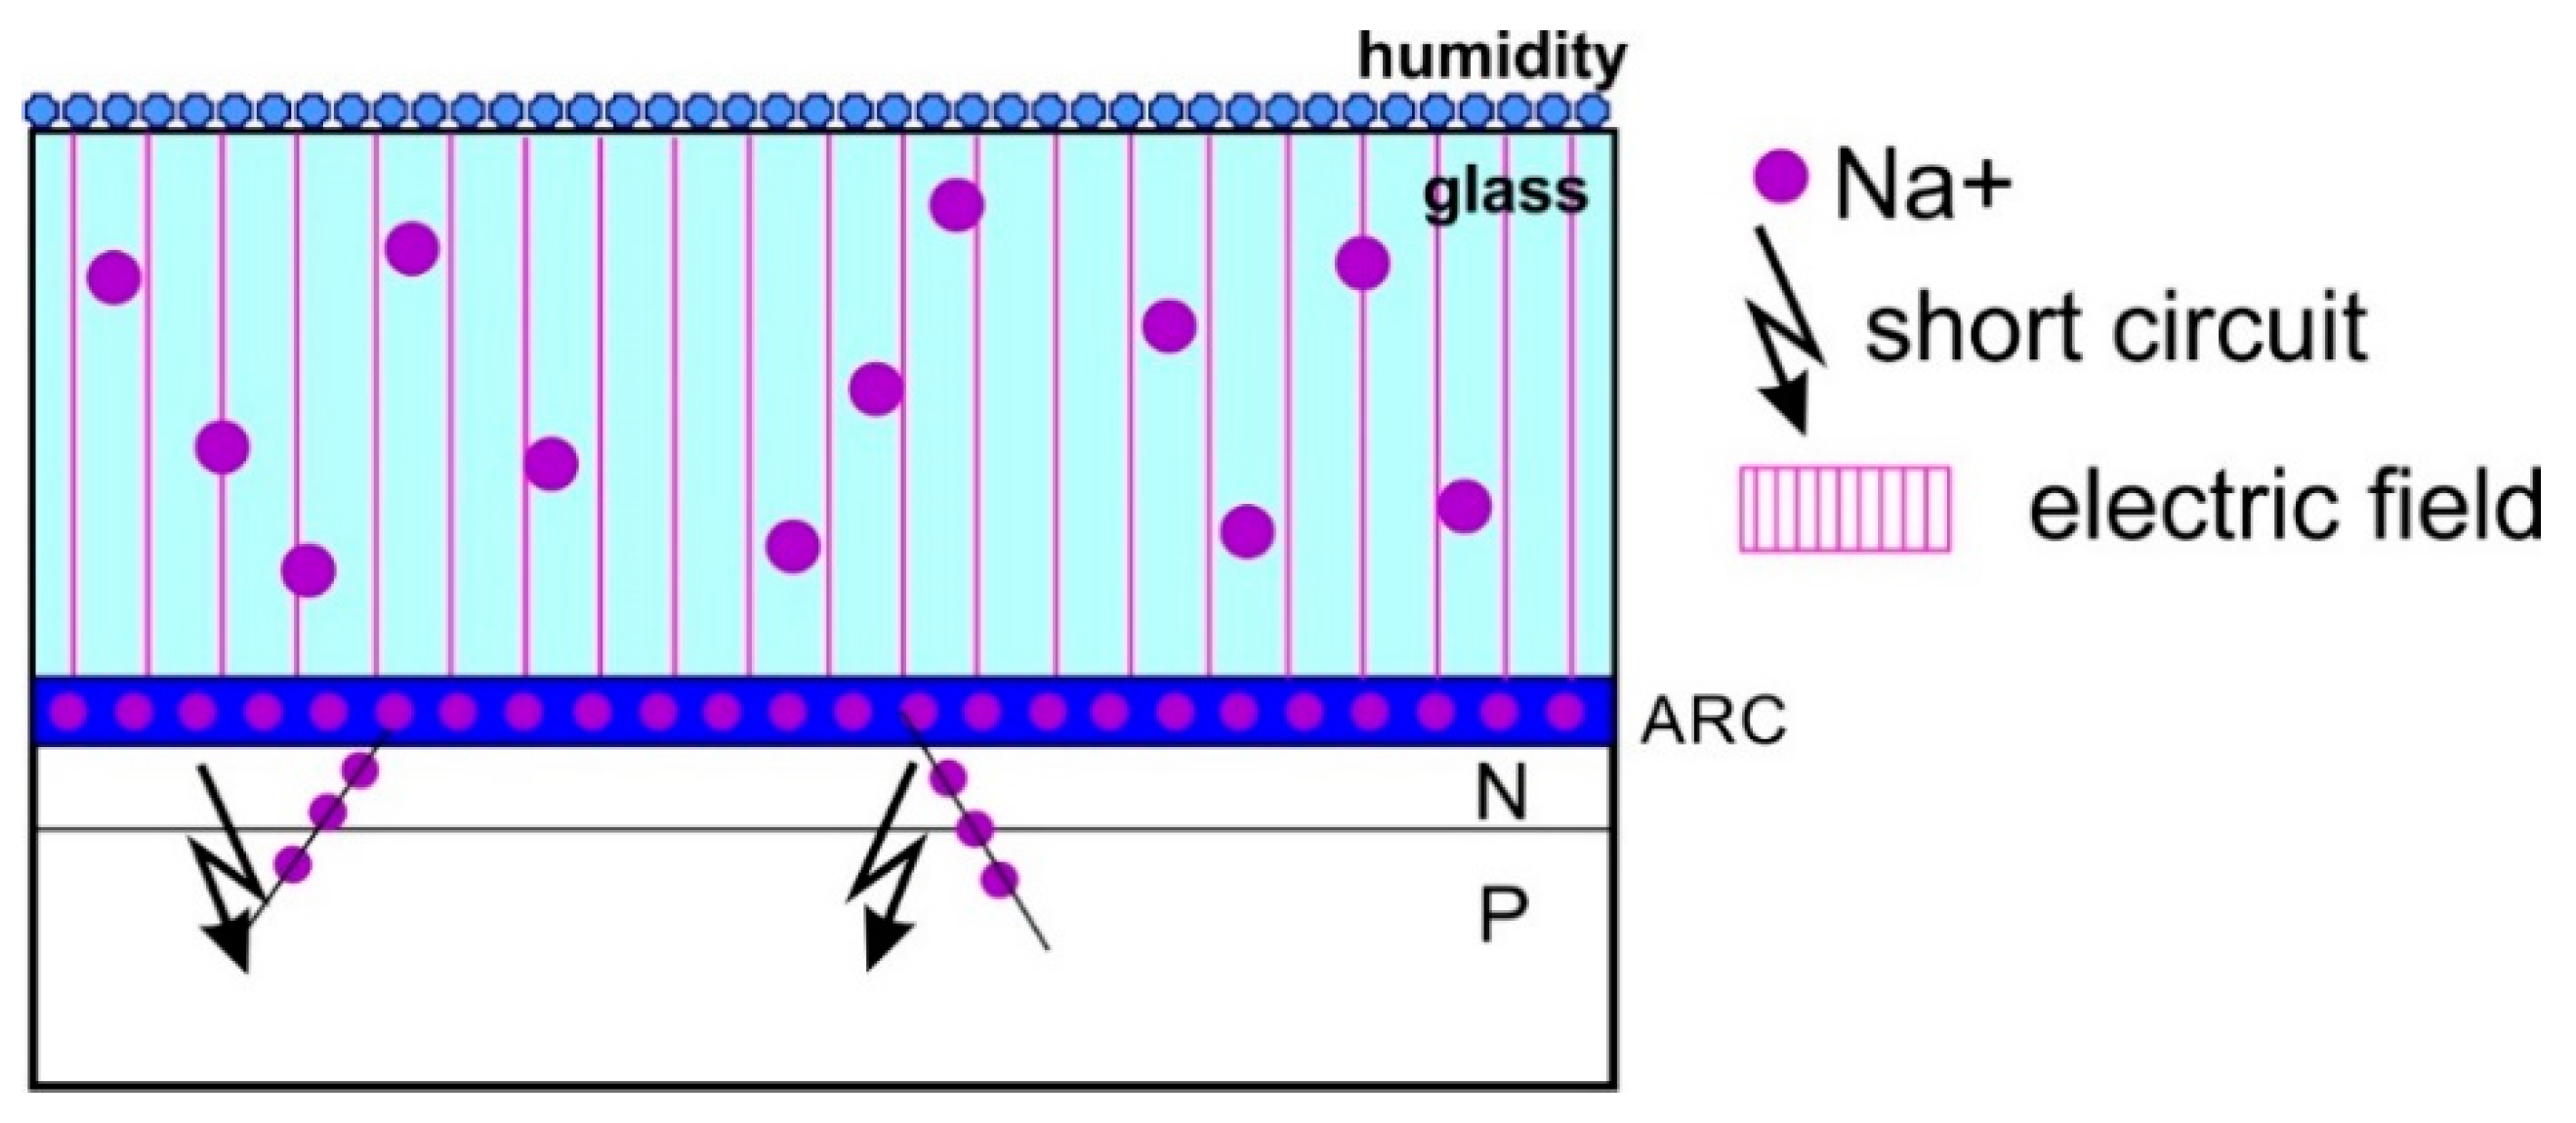
PID shunting (PID-s) is another mechanism of PID. This is a more advanced stage of PID-p. It arises after a long-term effect of potential on the module. This degradation creates a conductive connection across the cell structure. Conventional crystalline silicon PV modules of the P-type are most often affected by PID-shunting. PID-s has a significant effect on RSH and dark saturation current [4] (effect of PID on RSH). The occurrence of these micro-shunts across the PN junction results in significant ohmic changes in PV cells and reduces their efficiency. The loss of efficiency caused by PID is more pronounced at low irradiation levels compared to the loss at standard testing conditions (STC). The principle of this degradation is illustrated in Figure 3.
The last PID mechanism is electrochemical corrosion, which occurs due to leakage currents, especially in thin-film photovoltaic modules. In crystalline silicon modules, electrochemical corrosion is a minor problem, most often on soldered joints. Electrochemical corrosion in modules fabricated from P-type silicon wafers mainly affects the soldering points between the bus bar and the fingers, and can be easily detected due to increasing series resistance RS.
2.1. PID Diagnostic Methods
A total of four methods were used in our experiments to study measurement methods suitable for the diagnosis of PID, namely the measurement of I–V curves, electroluminescence, dark I–V curve measurement, and impedance spectroscopy. Only the first two are usually used in diagnostics.
2.2. I–V Curve Measurements
As mentioned above, determining the PV module parameters comes from the measurement of I–V curves. The most often used equipment is a flash tester [19], which is usually also a part of the production line. In our experiment, the PASAN Sun Simulator IIIc was used for I–V curve measurement.
The method using the derivation of the equation at the extreme points VA of the characteristic determines the series and parallel resistance RS and RSH as the direction of the tangents. By extreme points it is meant that on the current axis, it is the ISC point (V = 0), short-circuit current. On the voltage axis, it is the point V = VOC (I = 0), the voltage of the open circuit. This method is also used by the Pasan SunSim IIIc solar simulator, at low irradiance, the method is burdened with a systematic error and therefore the estimated value of resistance is referred to as RS* and RSH *.
and at I = ISC
The parameters RS*. and RSH* determined by Equations (2) and (3) generally depend on the irradiance, which is more evident at low irradiance levels, although RS and RSH are usually considered to be constant. A more detailed analysis of the issue can be found, for example, in [20].
2.3. Electroluminescence
Electroluminescence (EL) in PV cells is the result of radiative recombination of electron–hole pairs generated in a cell material, usually a semiconductor, by solar radiation or passage of current. The energy of photons emitted by inter-band radiative recombination is very close to the bandgap of the cell material. EL as a diagnostic tool for the analysis of defects on PV cells and modules is widely used. The c-Si cells emanate near-infrared light and the wavelength range is from 1000 to 1200 nm [21]. We can find out cracks and other damages because the intensity of emitted radiation is proportional to minority carriers’ concentration in the PV cell structure. For detection, a silicon charged-coupled device (CCD) camera or InGaAs camera is used. EL is a fast optical and electrical technique for detecting the defects which the human eye cannot see.
2.4. Forward DC Resistance (FDCR)
Dark curves are a way to estimate the RSH. The mathematical relation of the dark I–V curve for a module (consisting of m in-series connected cells) considering the series resistance and the shunt resistance is given by the equation
where e is the electronic charge, k is the Boltzmann constant and T is the absolute temperature.
I0 is the diode saturation current, n is the diode quality factor, is the series resistance and RSH is the shunt resistance. Over the years, several methods have been suggested for extracting these parameters from the dark I–V curve [22].
If we consider a voltage , we can simplify the relationship for calculating RSH from the dark I–V curve to:
Although this approximation is relatively inaccurate, it is sufficient for PID analysis.
2.5. Impedance Spectroscopy
Impedance spectroscopy (IS) has been widely applied over the last decades to study electrochemical systems and solid-state devices.
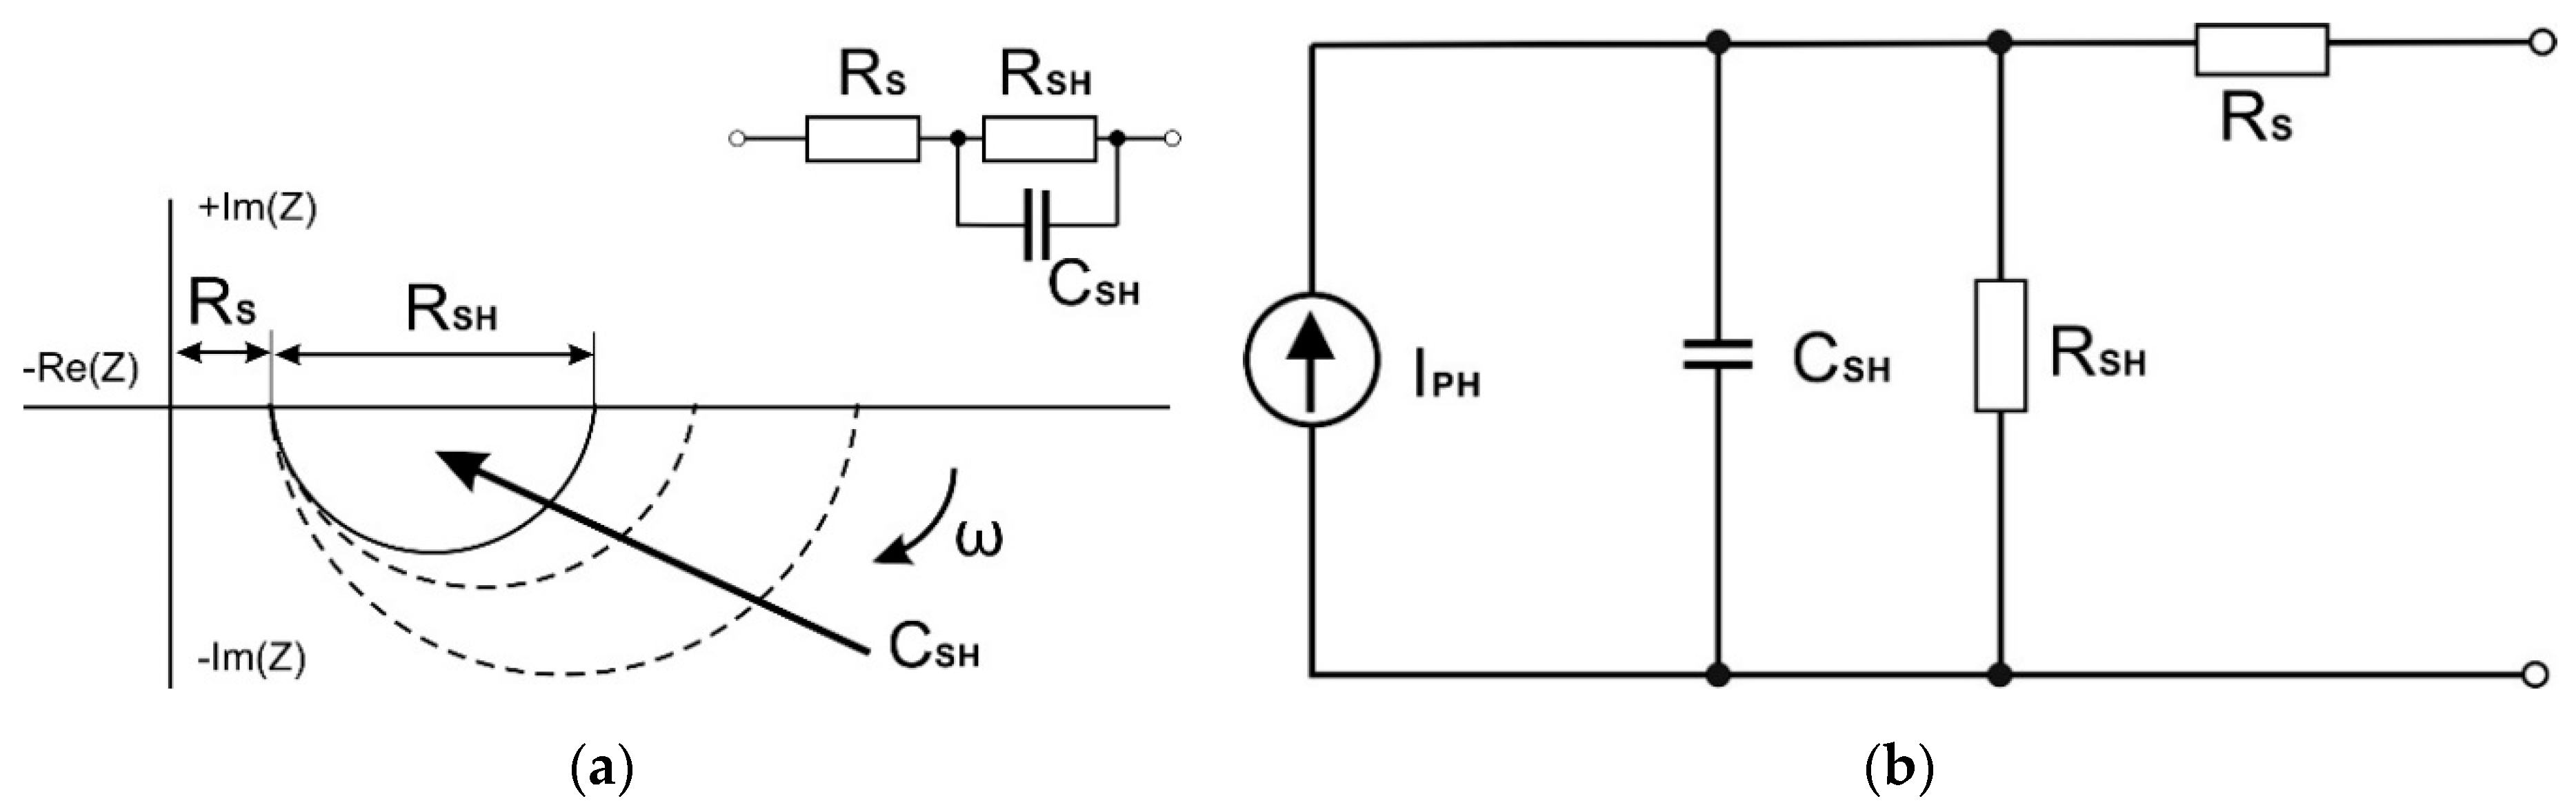
The impedance spectroscopy (IS) is characterized by the measurement and analysis of some or all impedance related functions of an electronic device. In IS, the complex impedance Z(ω) = R(ω) + jX(ω) of a device is measured directly within a large range of frequencies using an LCR meter. A purely sinusoidal voltage with varying frequency is applied to the terminals of the device under test and the phase shift and amplitude of the voltage and current signals are measured. The ratio between the applied voltage and the resultant current is calculated and this gives the impedance Z(ω) of the device under test. The plotting of R(ω) and X(ω) on a complex plane, in the function of the varying frequency, gives the impedance spectrum of the device. This graph is the special case of Nyquist diagram called Cole–Cole diagram. The construction of Cole–Cole diagram allows simple evaluation of parameters and also the quality of the tested device. Figure 4a shows a typical Cole-Cole diagram for a capacitor.
PN junction properties under low bias signal may be modeled as a capacitance of the depletion layer at the junction, using an equivalent circuit as indicated in Figure 4b. In a similar equivalent circuit a PV module consisting from a number of in-series connected PV cells can also be transformed.
The thickness of the space charge region at the PN junction (and therefore also the PN junction capacitance) depends strongly on the applied voltage. If you apply voltage in the reverse direction (positive potential to N), the space charge region expands; if it is polarized in the forward direction (negative potential to N), the space charge region narrows. Using an AC signal for the measurement, then at one half-period of the applied voltage the capacitance decreases; at the second half-period it increases. Therefore, AC power voltage value (measuring signal) should be very small (in a range of millivolts) to have no significant effect on the measured values.
The measured values can be significantly influenced by a DC bias that can change the operational point of the cell (or module) and thus influence the measured Cole-Cole diagram and parameters to be extracted [23,24,25,26]. Irradiation causes undesirable DC biasing and it is recommended to perform the AC measurement in dark conditions. Application of reverse cell polarization is limited in PV modules by the threshold voltage of Schottky bypass diodes.
In our measurements, PV modules were measured in the dark without DC bias using AC signal of about 100 mV that corresponds to the AC signal of the amplitude of a few millivolts over individual cells in-series connected in the measured module.
3. Experiment
To better understand the PID process, an experiment was prepared to monitor changes in individual parameters of cells and modules during high-voltage stress.
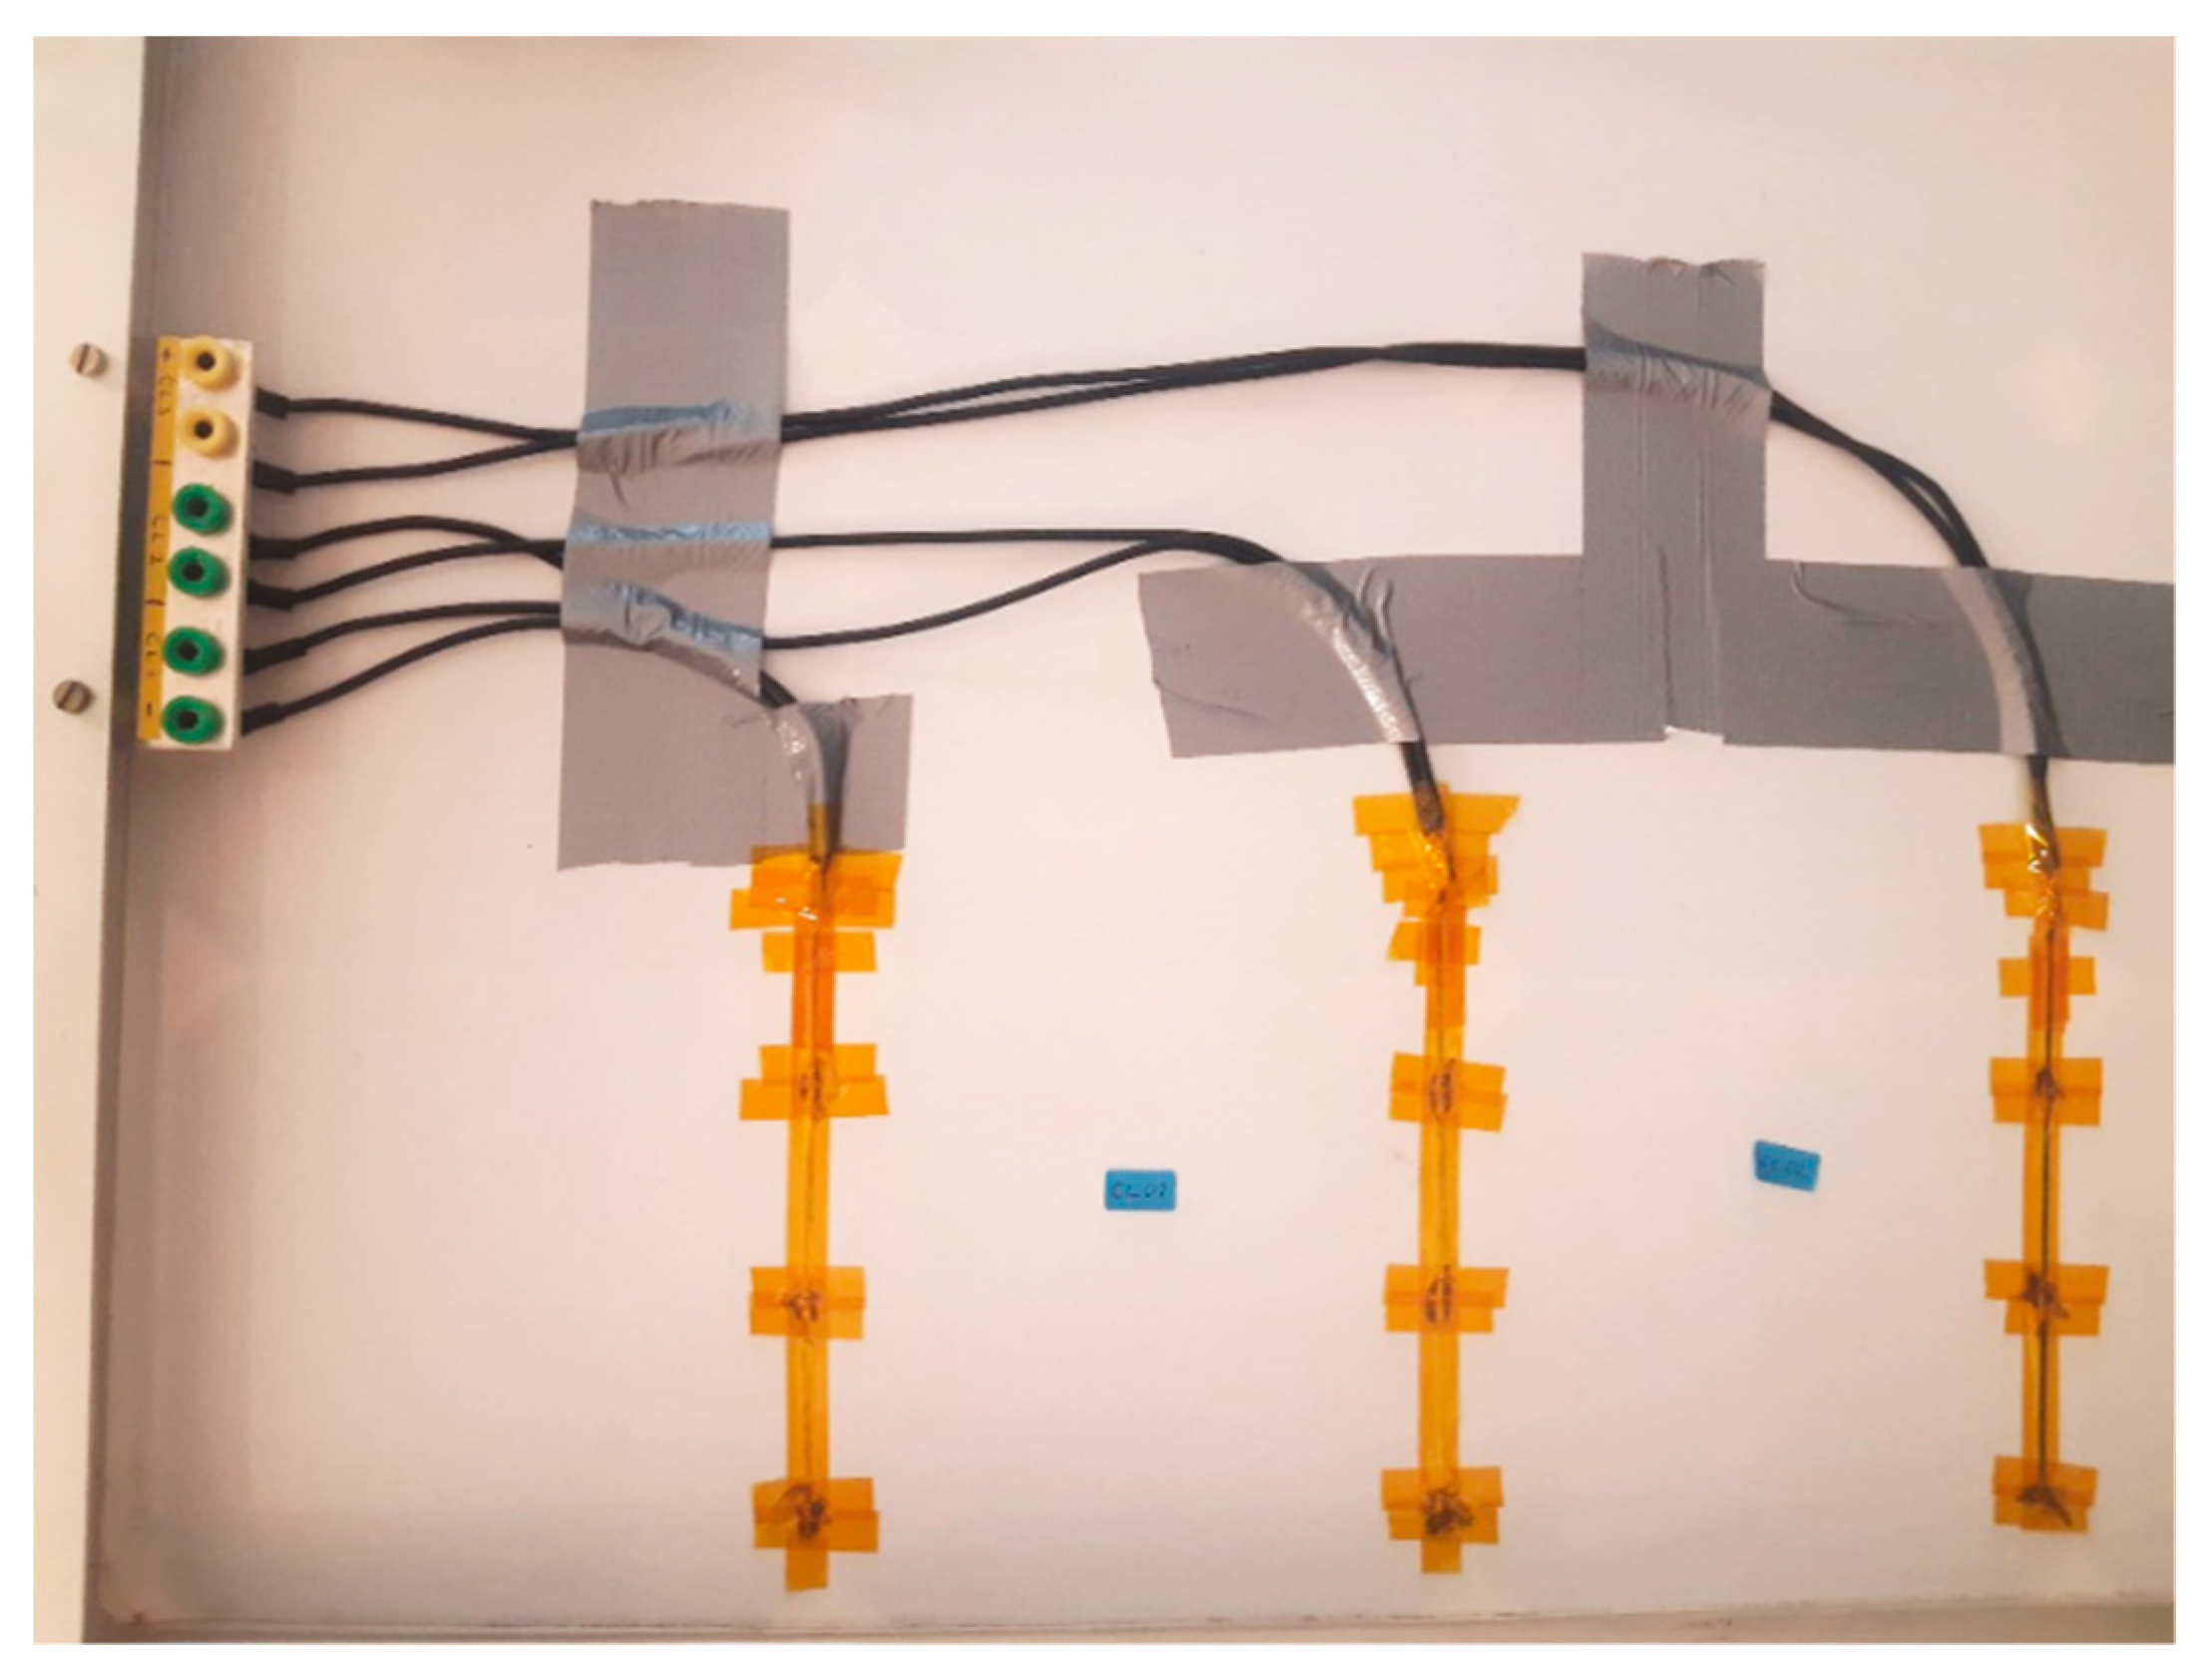
The measurements were performed on a standard photovoltaic module (type SST250-60M with a peak power of 250 W), which had previously been operated in a power plant (and exposed to weather conditions) for about 5 years. The module was modified so that it is also possible to measure changes in the parameters of one selected cell. The rear cover foil of the module was removed locally using a grinding wheel and the copper contact was soldered to the bus bars of the selected cell to allow a four-point measurement. A modification of the module is shown in Figure 5. Selected cells are near the frame so a higher electric field between the glass and cells in this area and a higher possibility of moisture penetration was the reason for choosing this location.
The experiment was performed in a laboratory at room temperature and humidity of about 30%. Degradation was performed using a high voltage source, voltage (715 V) was applied to the module so that the positive pole was connected to the frame and the negative pole to the contacts of the module. To accelerate degradation or regeneration, the glass of the front module was covered with aluminum foil, which was held on the module due to electrostatic force. After the selected time, the module was disconnected from the source, the aluminum foil was removed from the front, and after two hours of stabilization, electroluminescence measurements were performed. Then the characteristics of the module and the selected cells were measured using a Pasan III flash tester, and then the I–V dark characteristics were measured and the measurements were performed using impedance spectroscopy. These measurements were performed both on the whole module and on selected cells.
After the measurement, degeneration continued in the same experimental setup for another selected time. After a total time of 344 h of degeneration, regeneration was performed in the same experimental setup, with only the polarization of the module reversed. At certain intervals, the regeneration was interrupted and all the measurements were performed in the same way as during the degeneration process.
4. Results
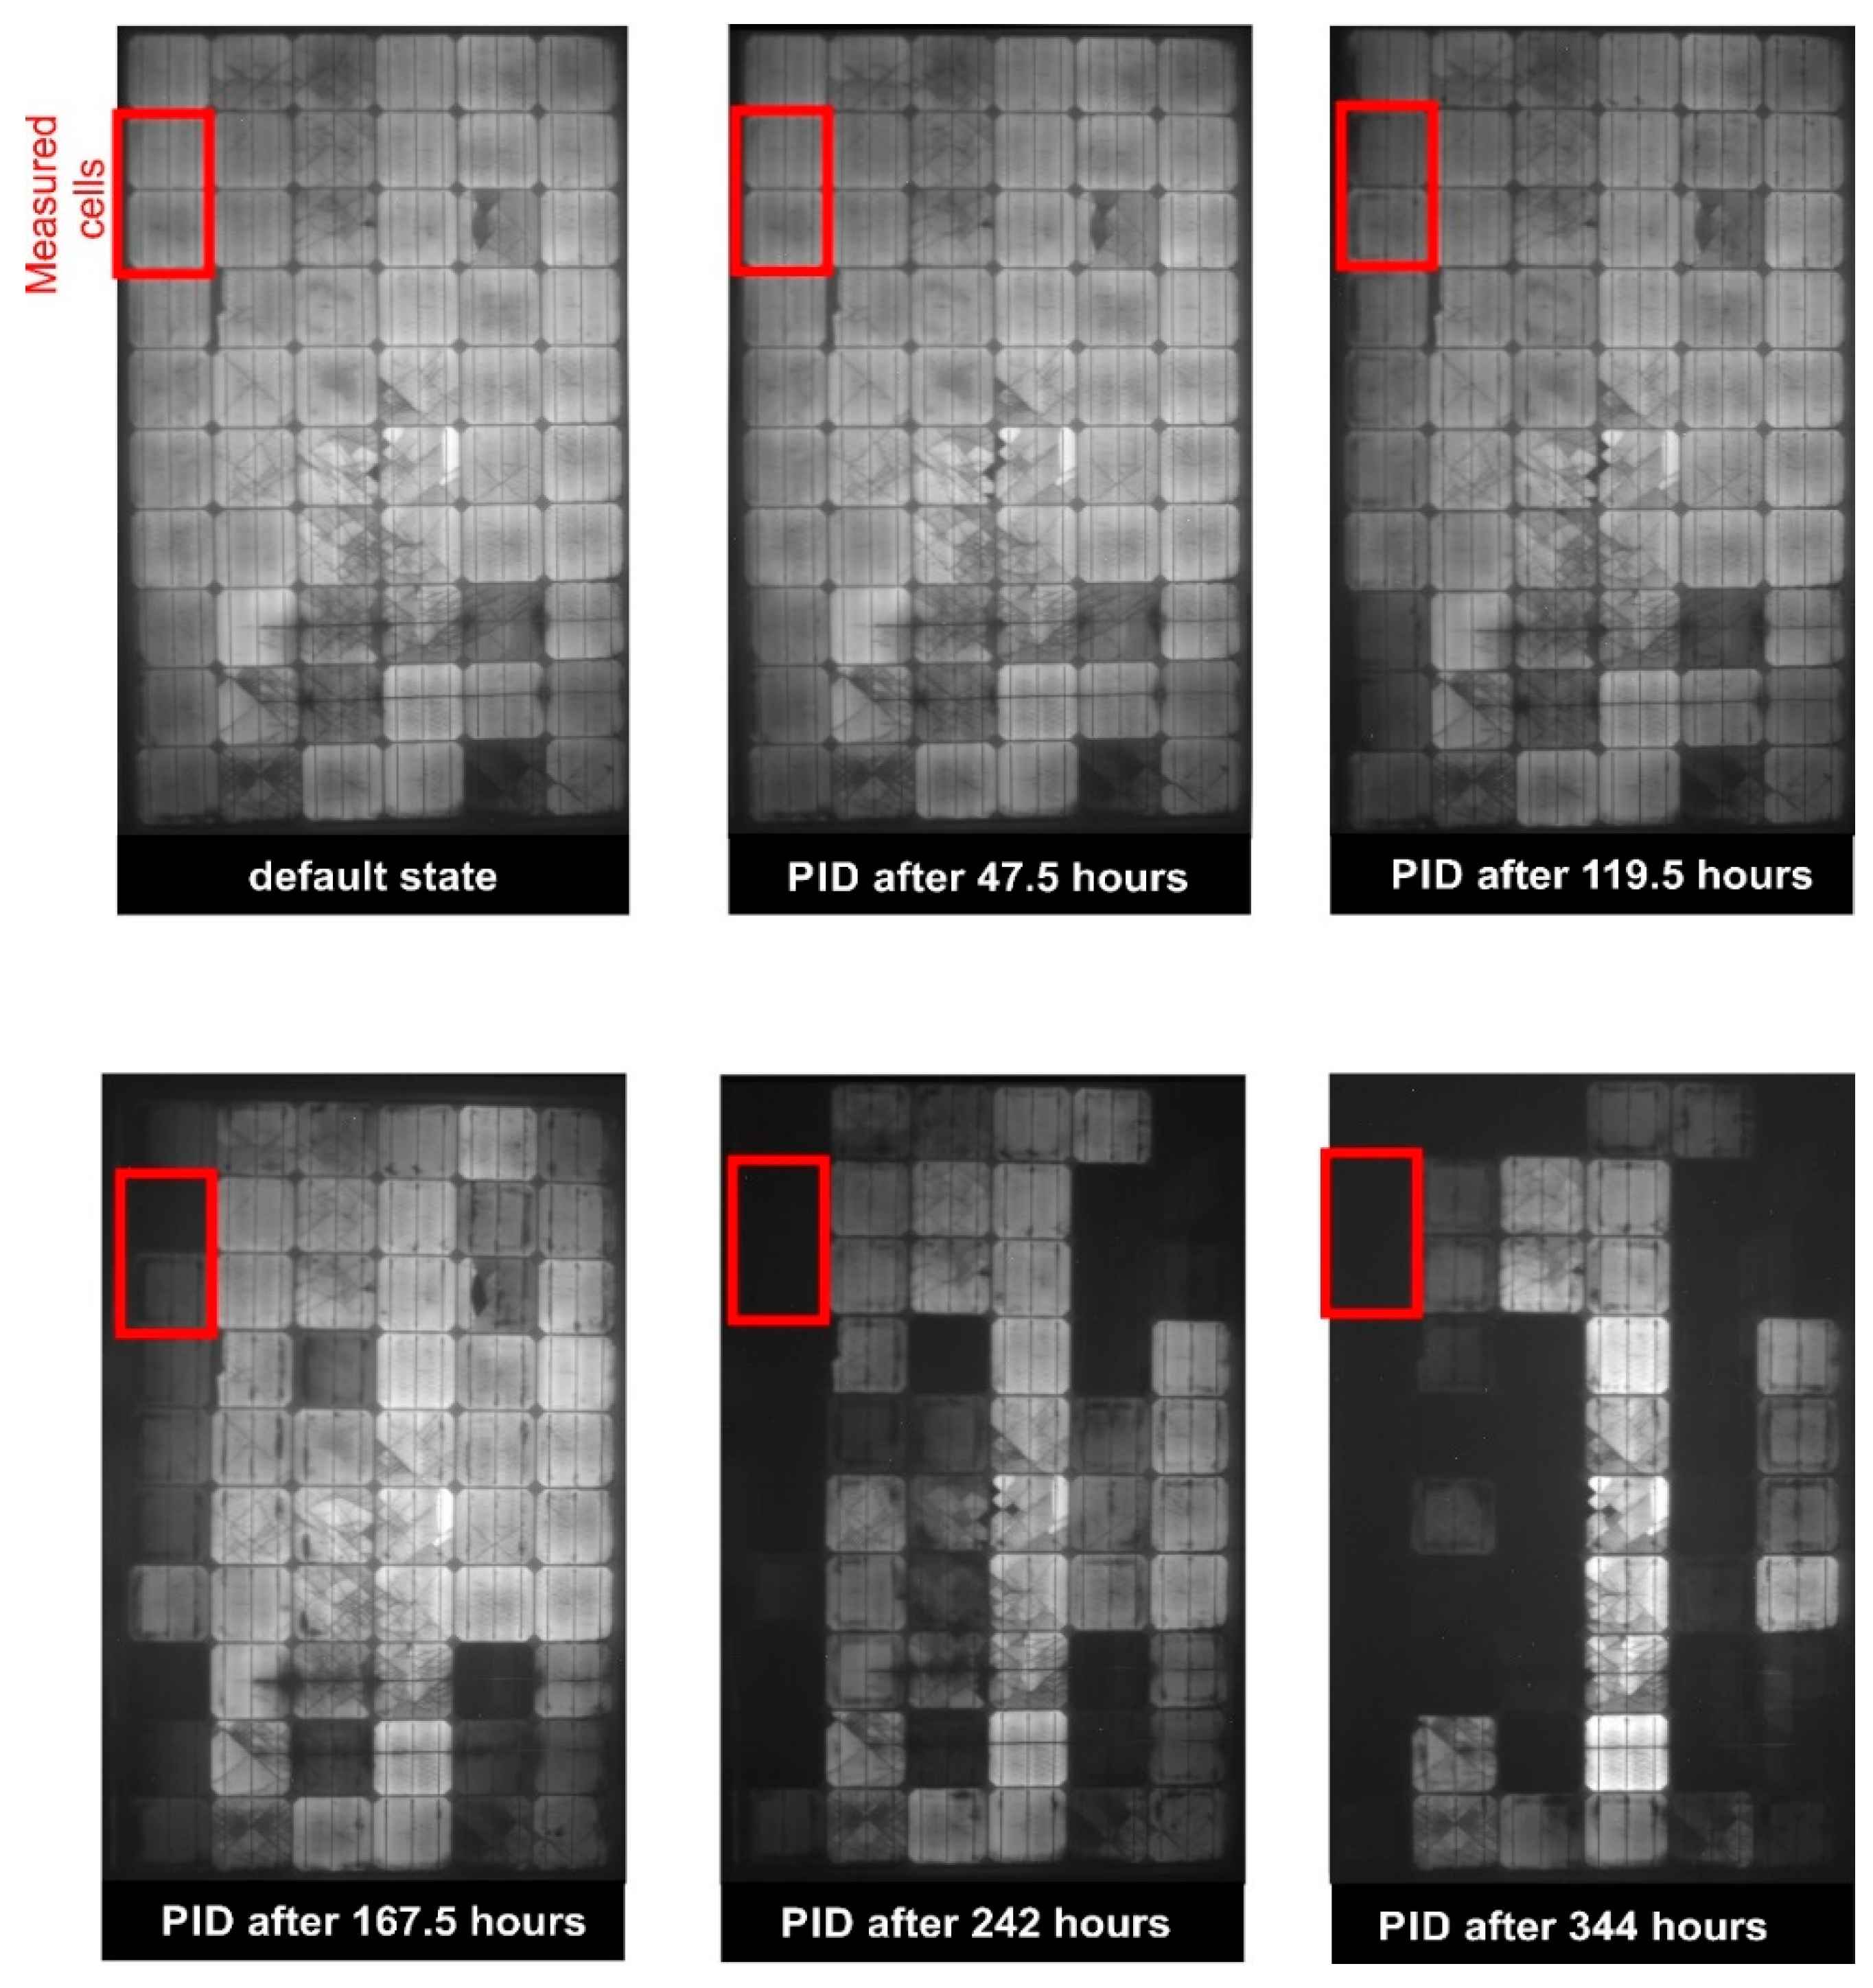
Electroluminescent images taken after the individual degradation steps are shown in Figure 6. In the images, cells with individually drawn contacts are marked in red. Due to the small distance from the frame, these links are quite significantly affected by PID. Changes in EL images will only take effect with stronger PID exposure. For these reasons (and also due to complications with the use of this method in the field), electroluminescence does not appear to be suitable for the early diagnosis of PID. Quantification of electroluminescent images is also complicated [27].
4.1. Process of Degradation
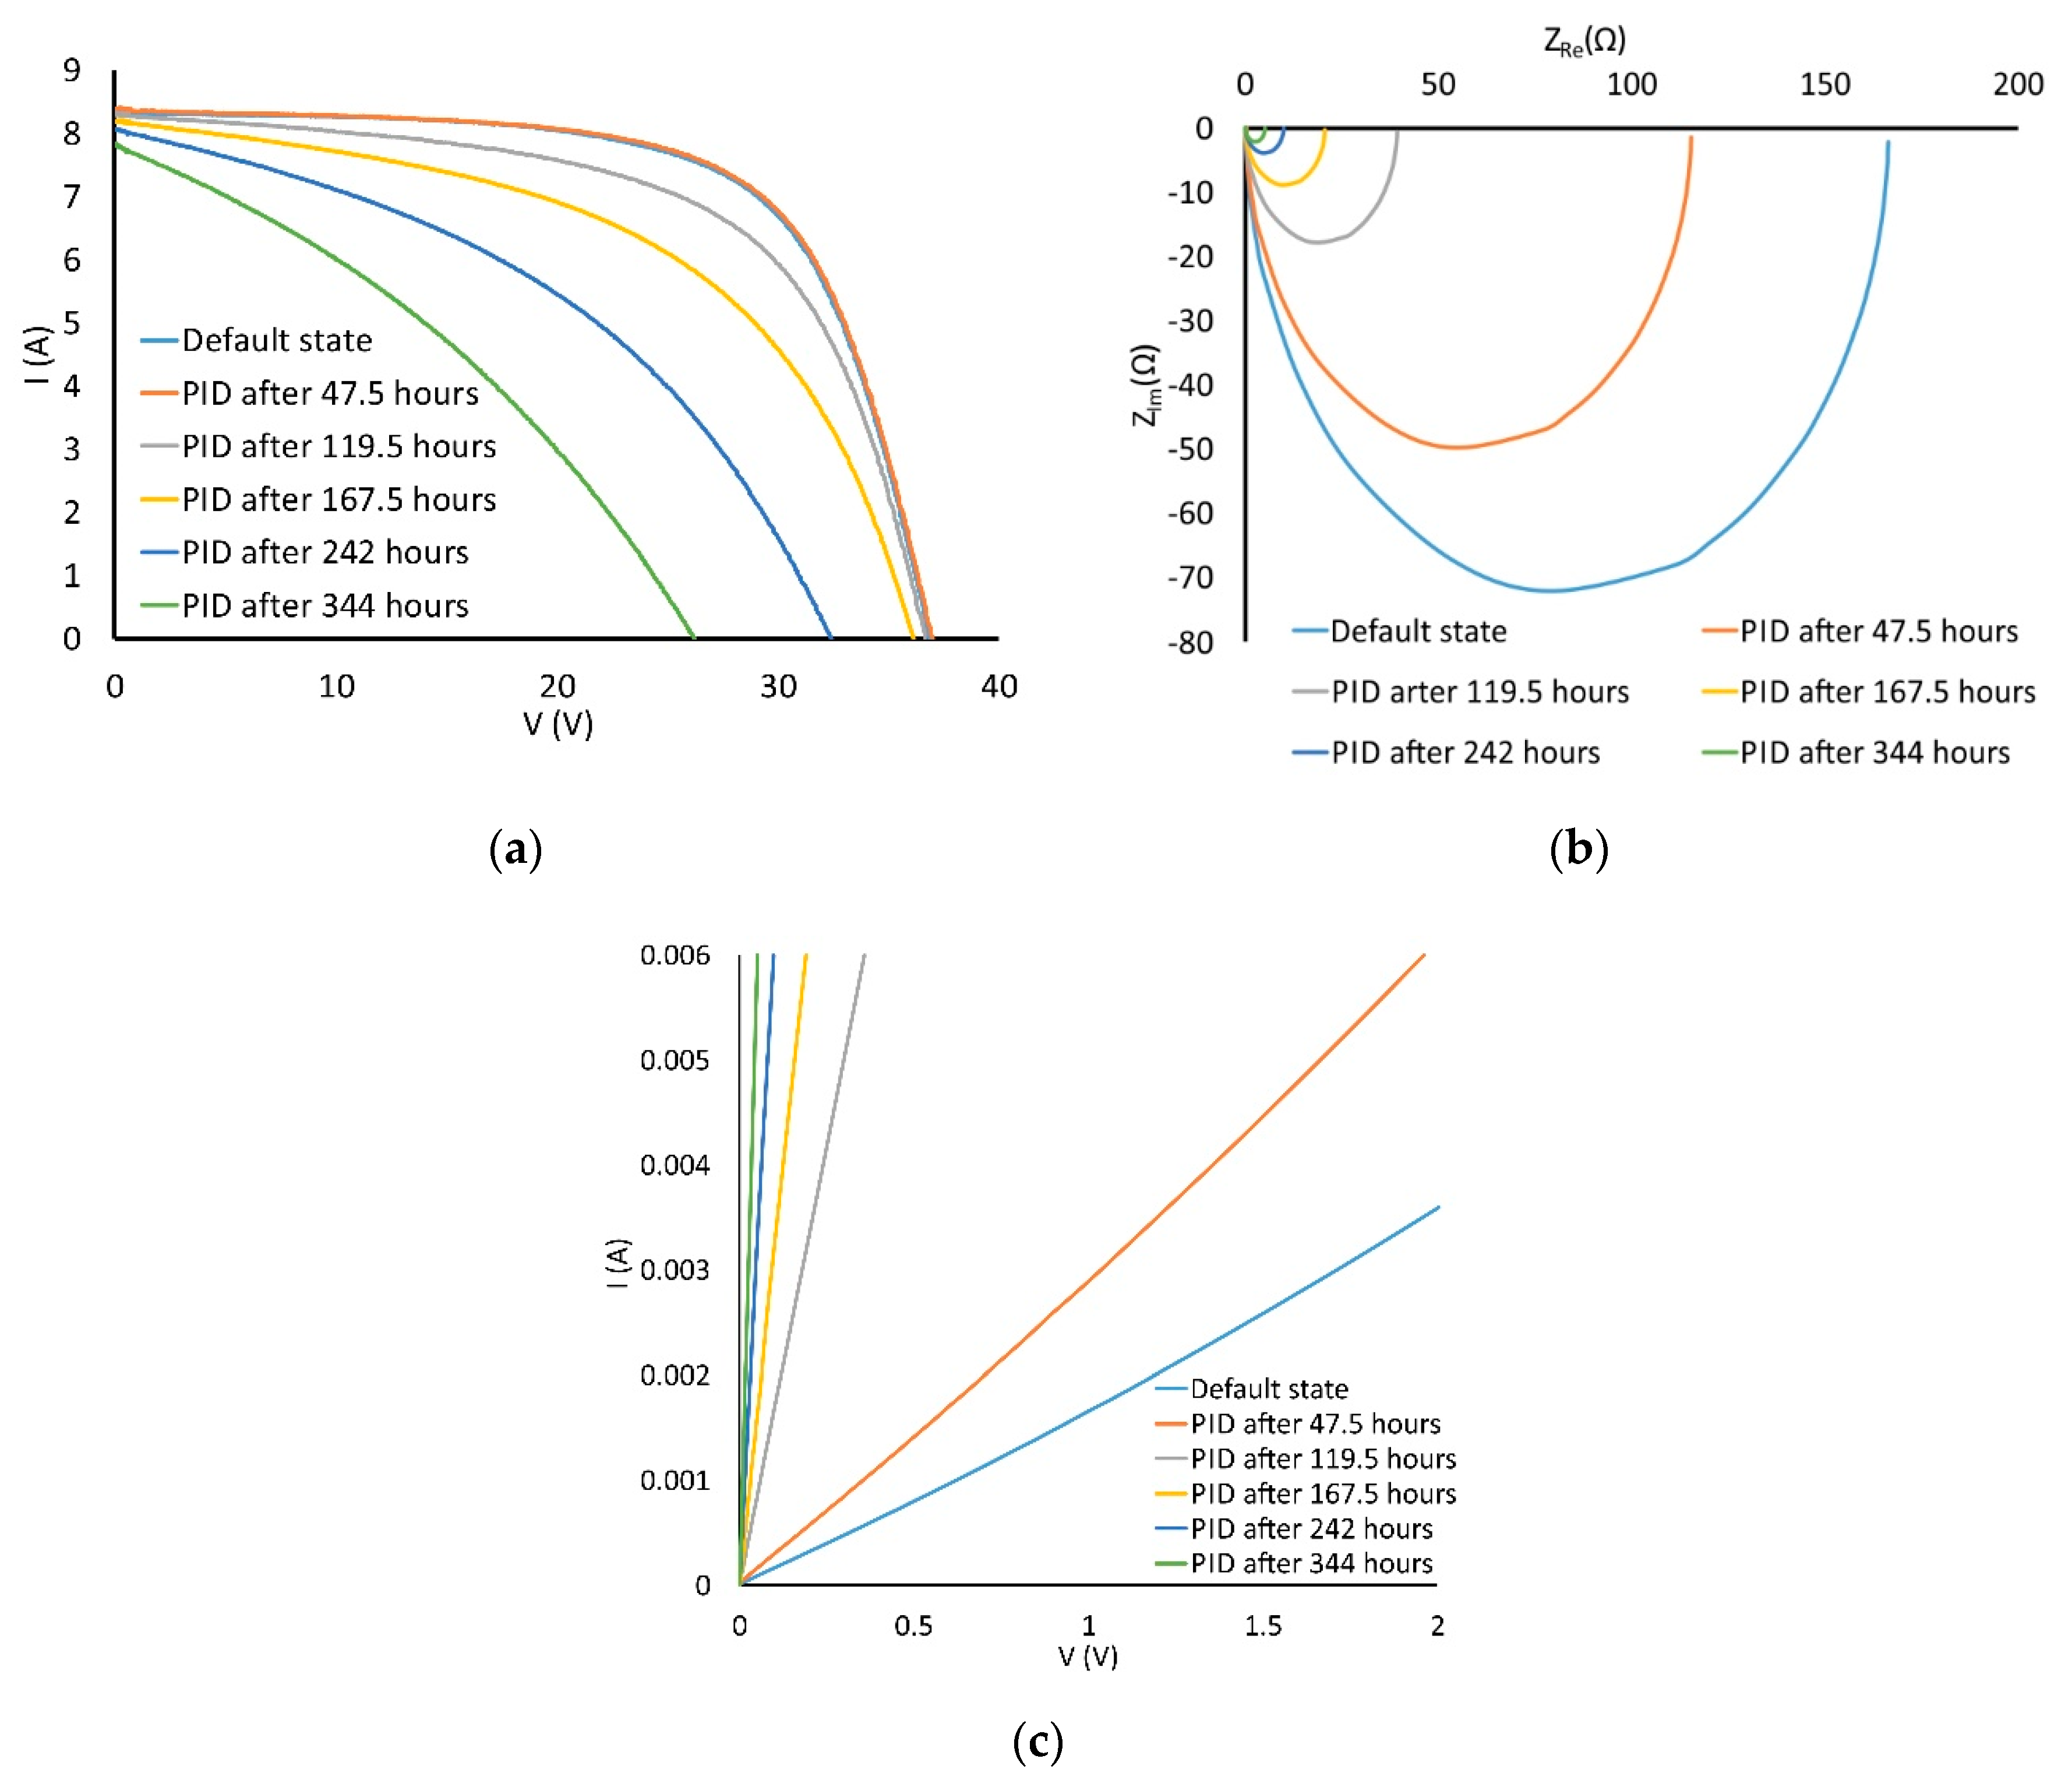
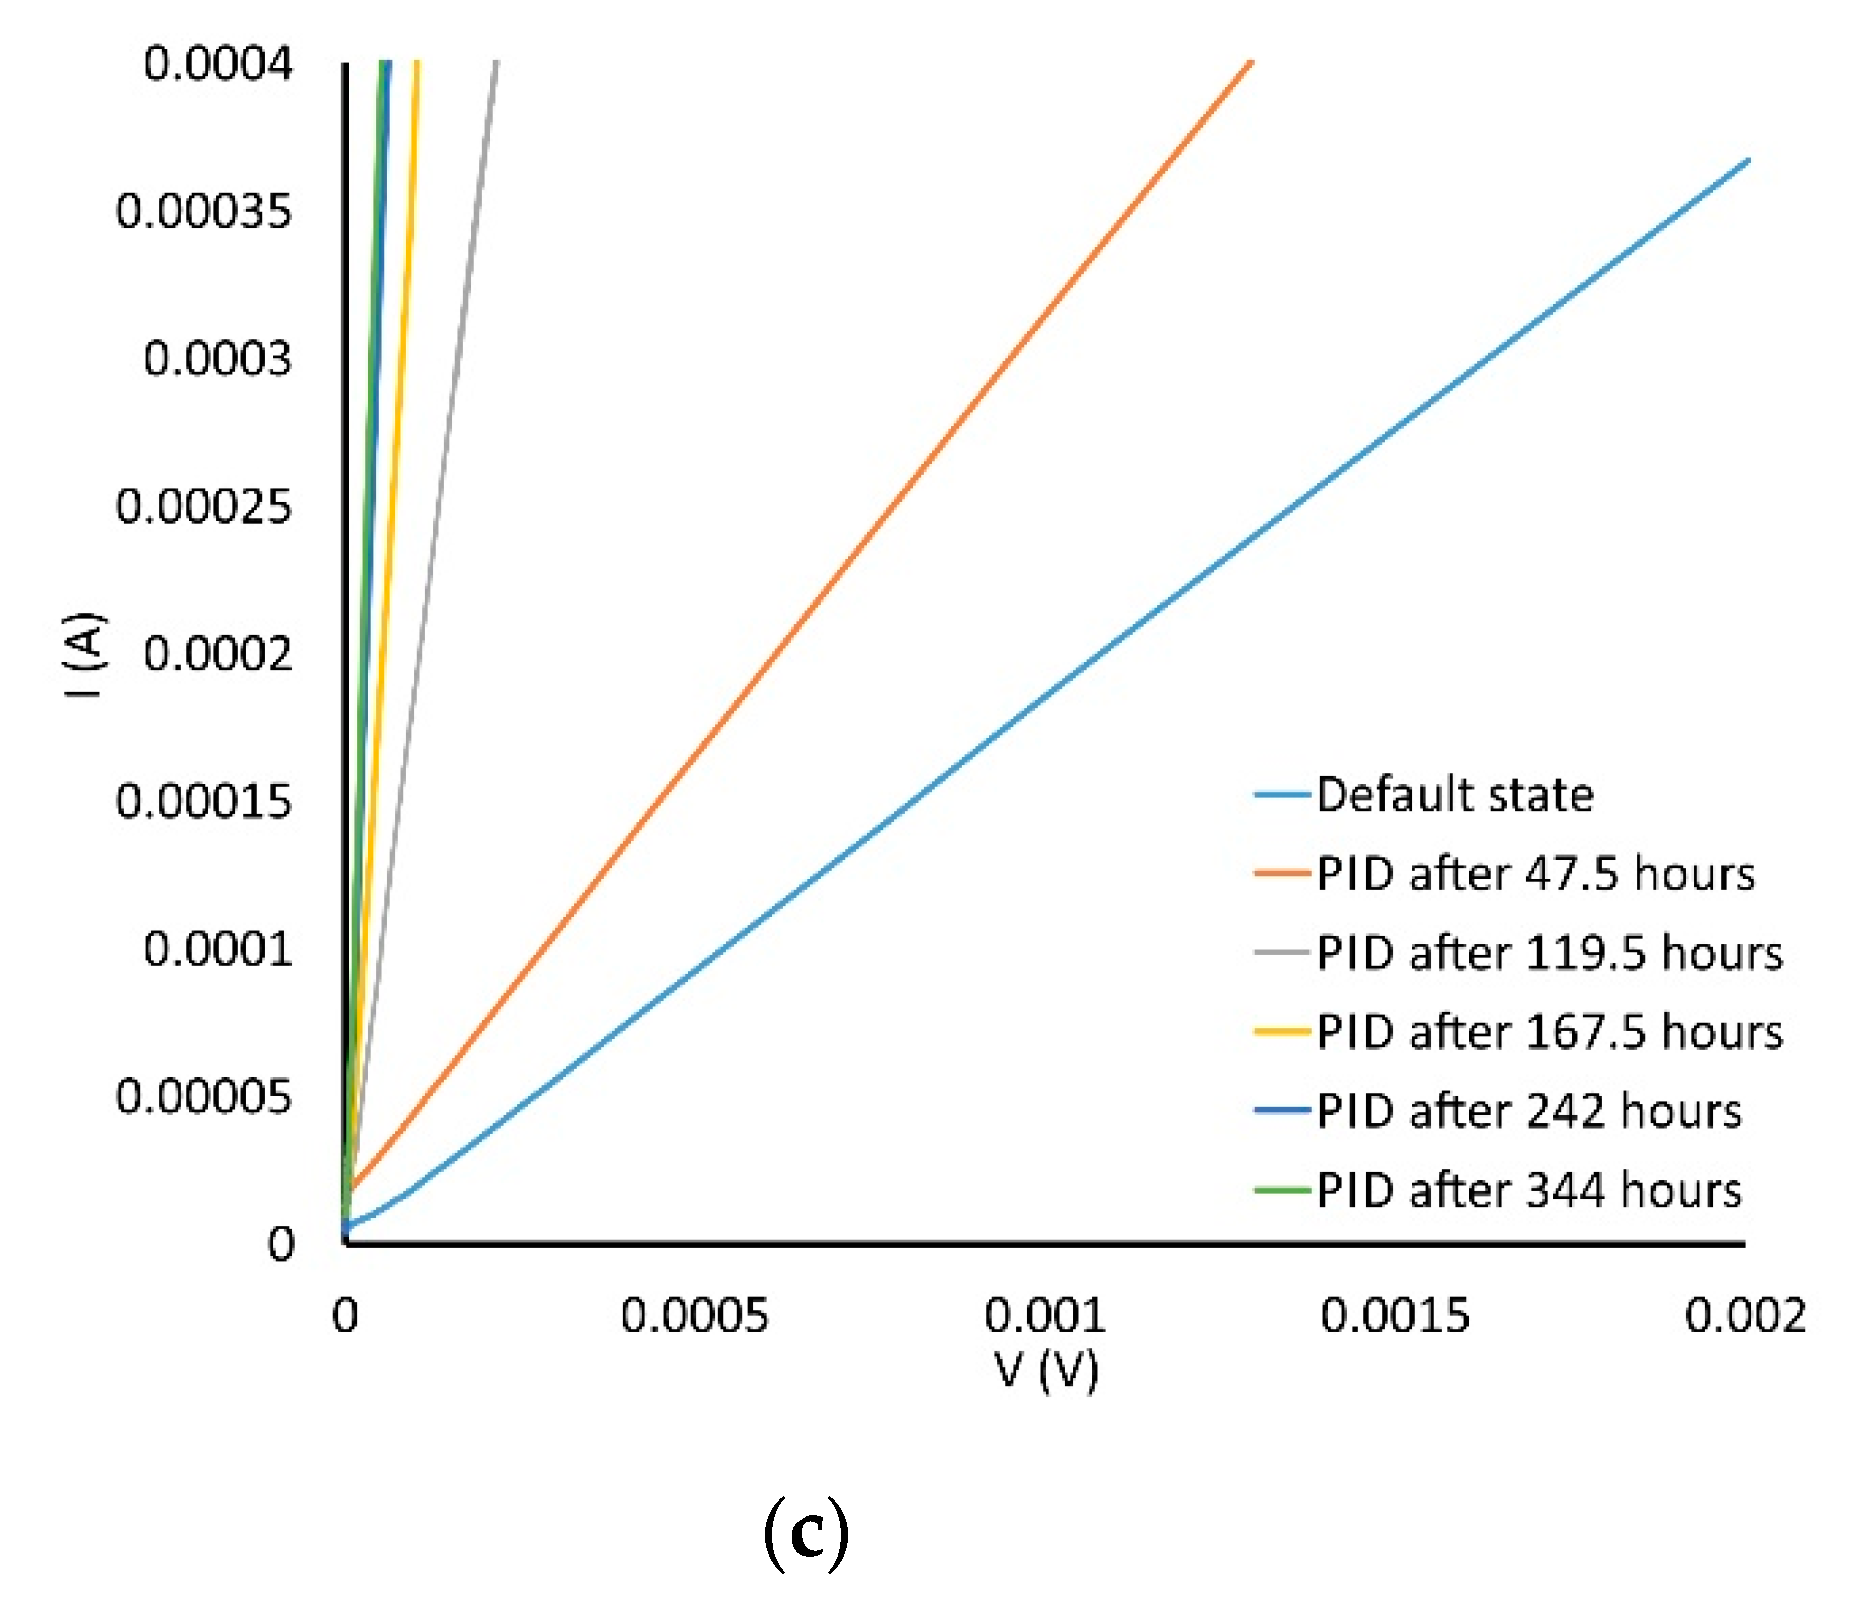
The characteristics obtained during the degradation of the module are shown in Figure 7. Figure 7a shows the changes of the I-V characteristics obtained by measurement with a flash tester. It can be seen that the whole module loses output power during degradation, which also reduces the voltage VOC and current ISC. Changes in Cole-Cole diagrams measured by impedance spectroscopy are shown in Figure 7b whilst Figure 7c shows changes in the dark I-V characteristics during degradation.
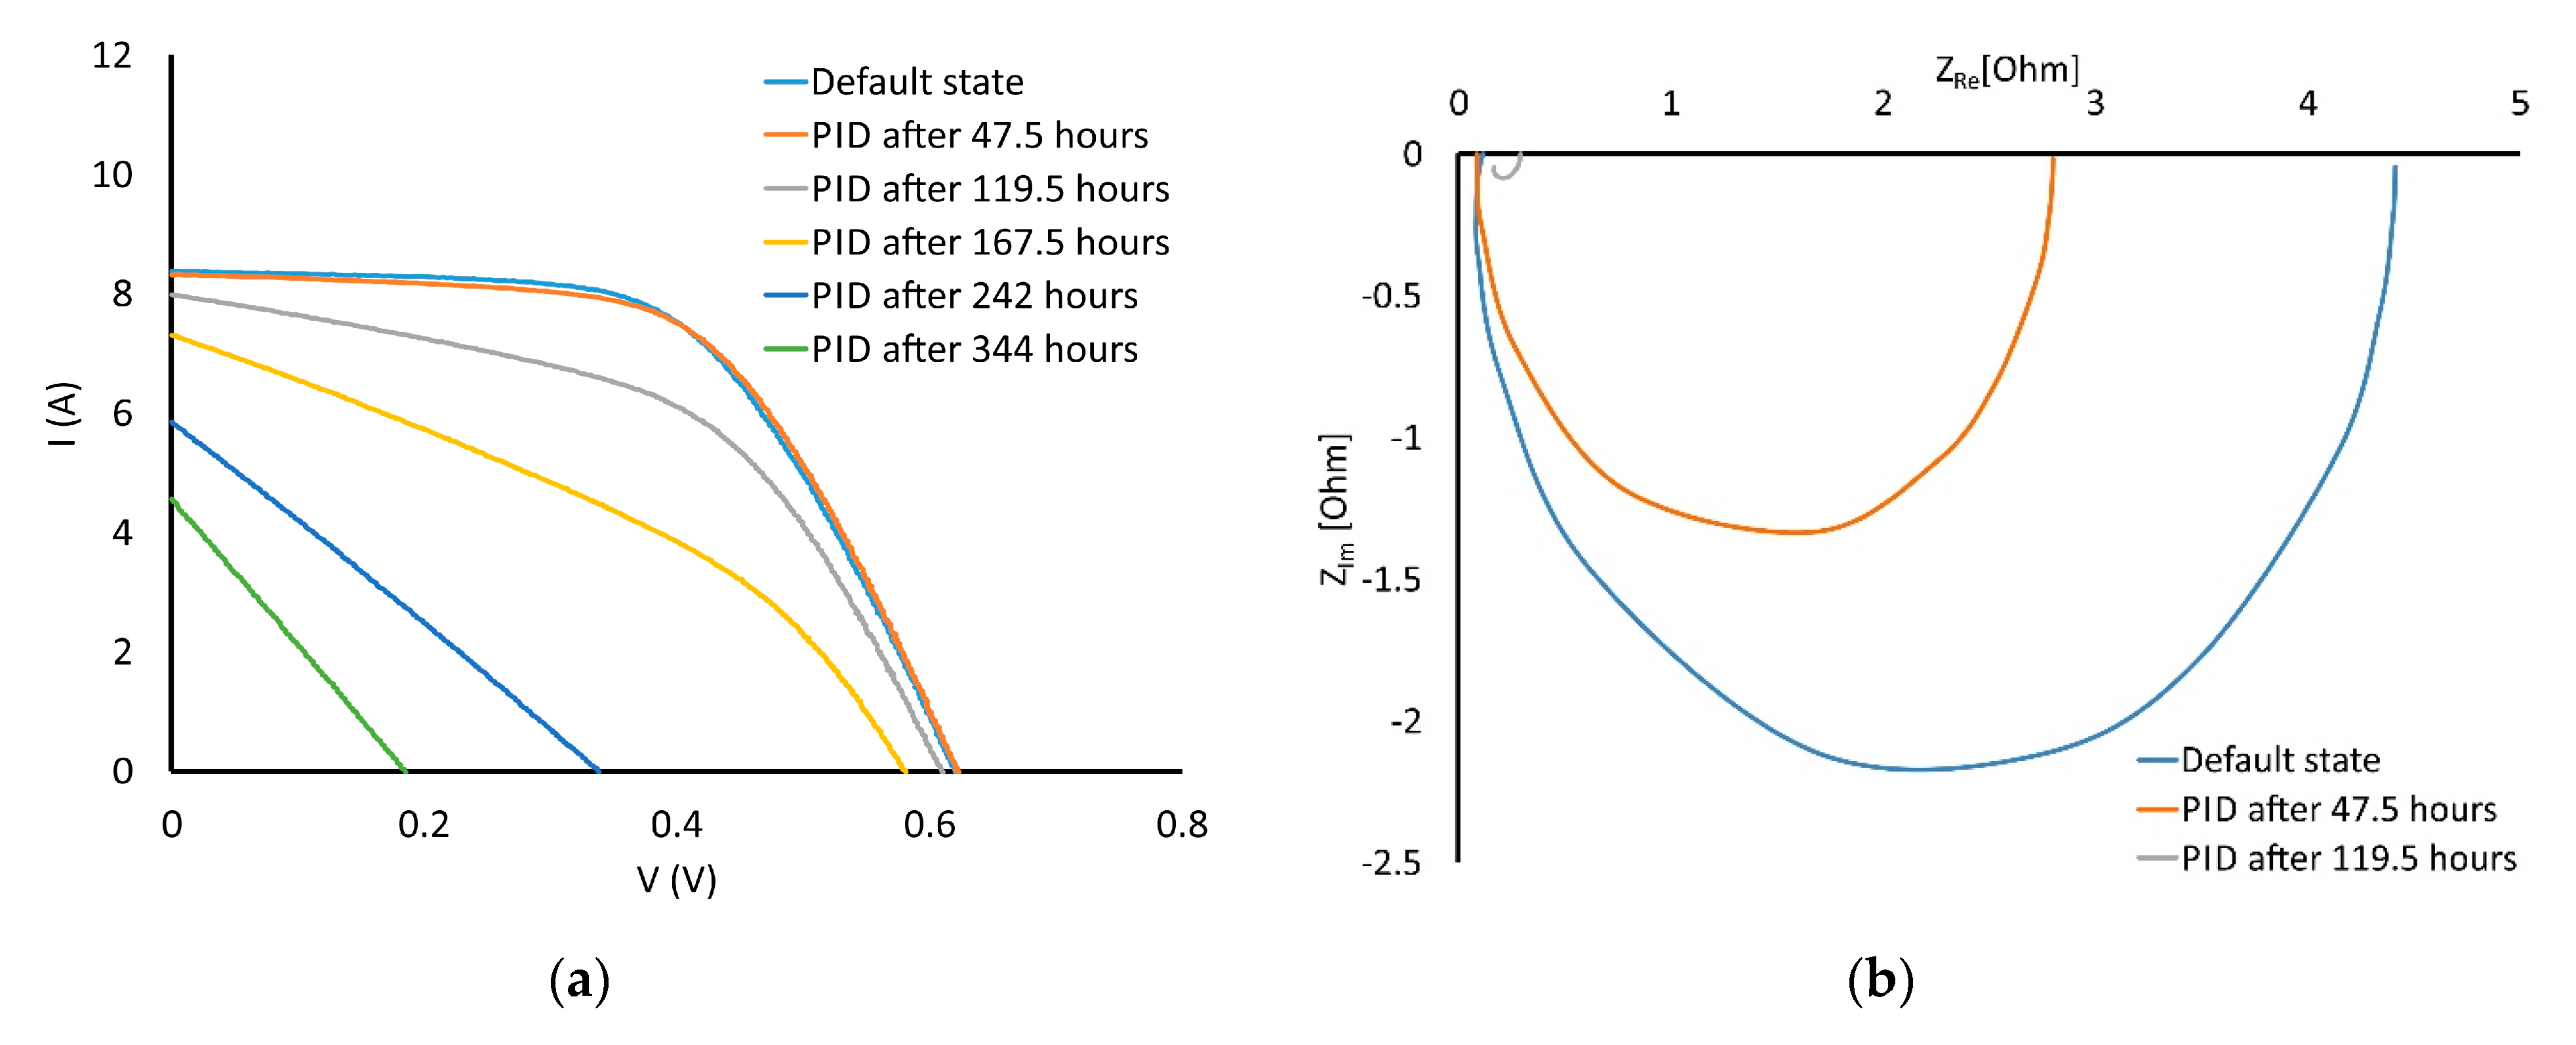
Results of the measurement performed on one selected cell of the examined module are shown in Figure 8. In the case of IS (Figure 8b), only three curves could be recorded from the measurements performed on the selected cell because, as the degradation continued, the cell completely lost its capacitive character. However, the photovoltaic cell continued to degrade for another nearly 200 h. It turned out that the IS is very sensitive and the degradation proceeded very quickly, which is also reflected in the electroluminescence results (Figure 6) and in I-V curve changes (Figure 8a). If the cells had been selected in the middle of the module, there would have been no loss of capacitive character and it would have been possible to observe a slower course represented by a larger number of Cole-Cole curves.
4.2. The Regeneration Process
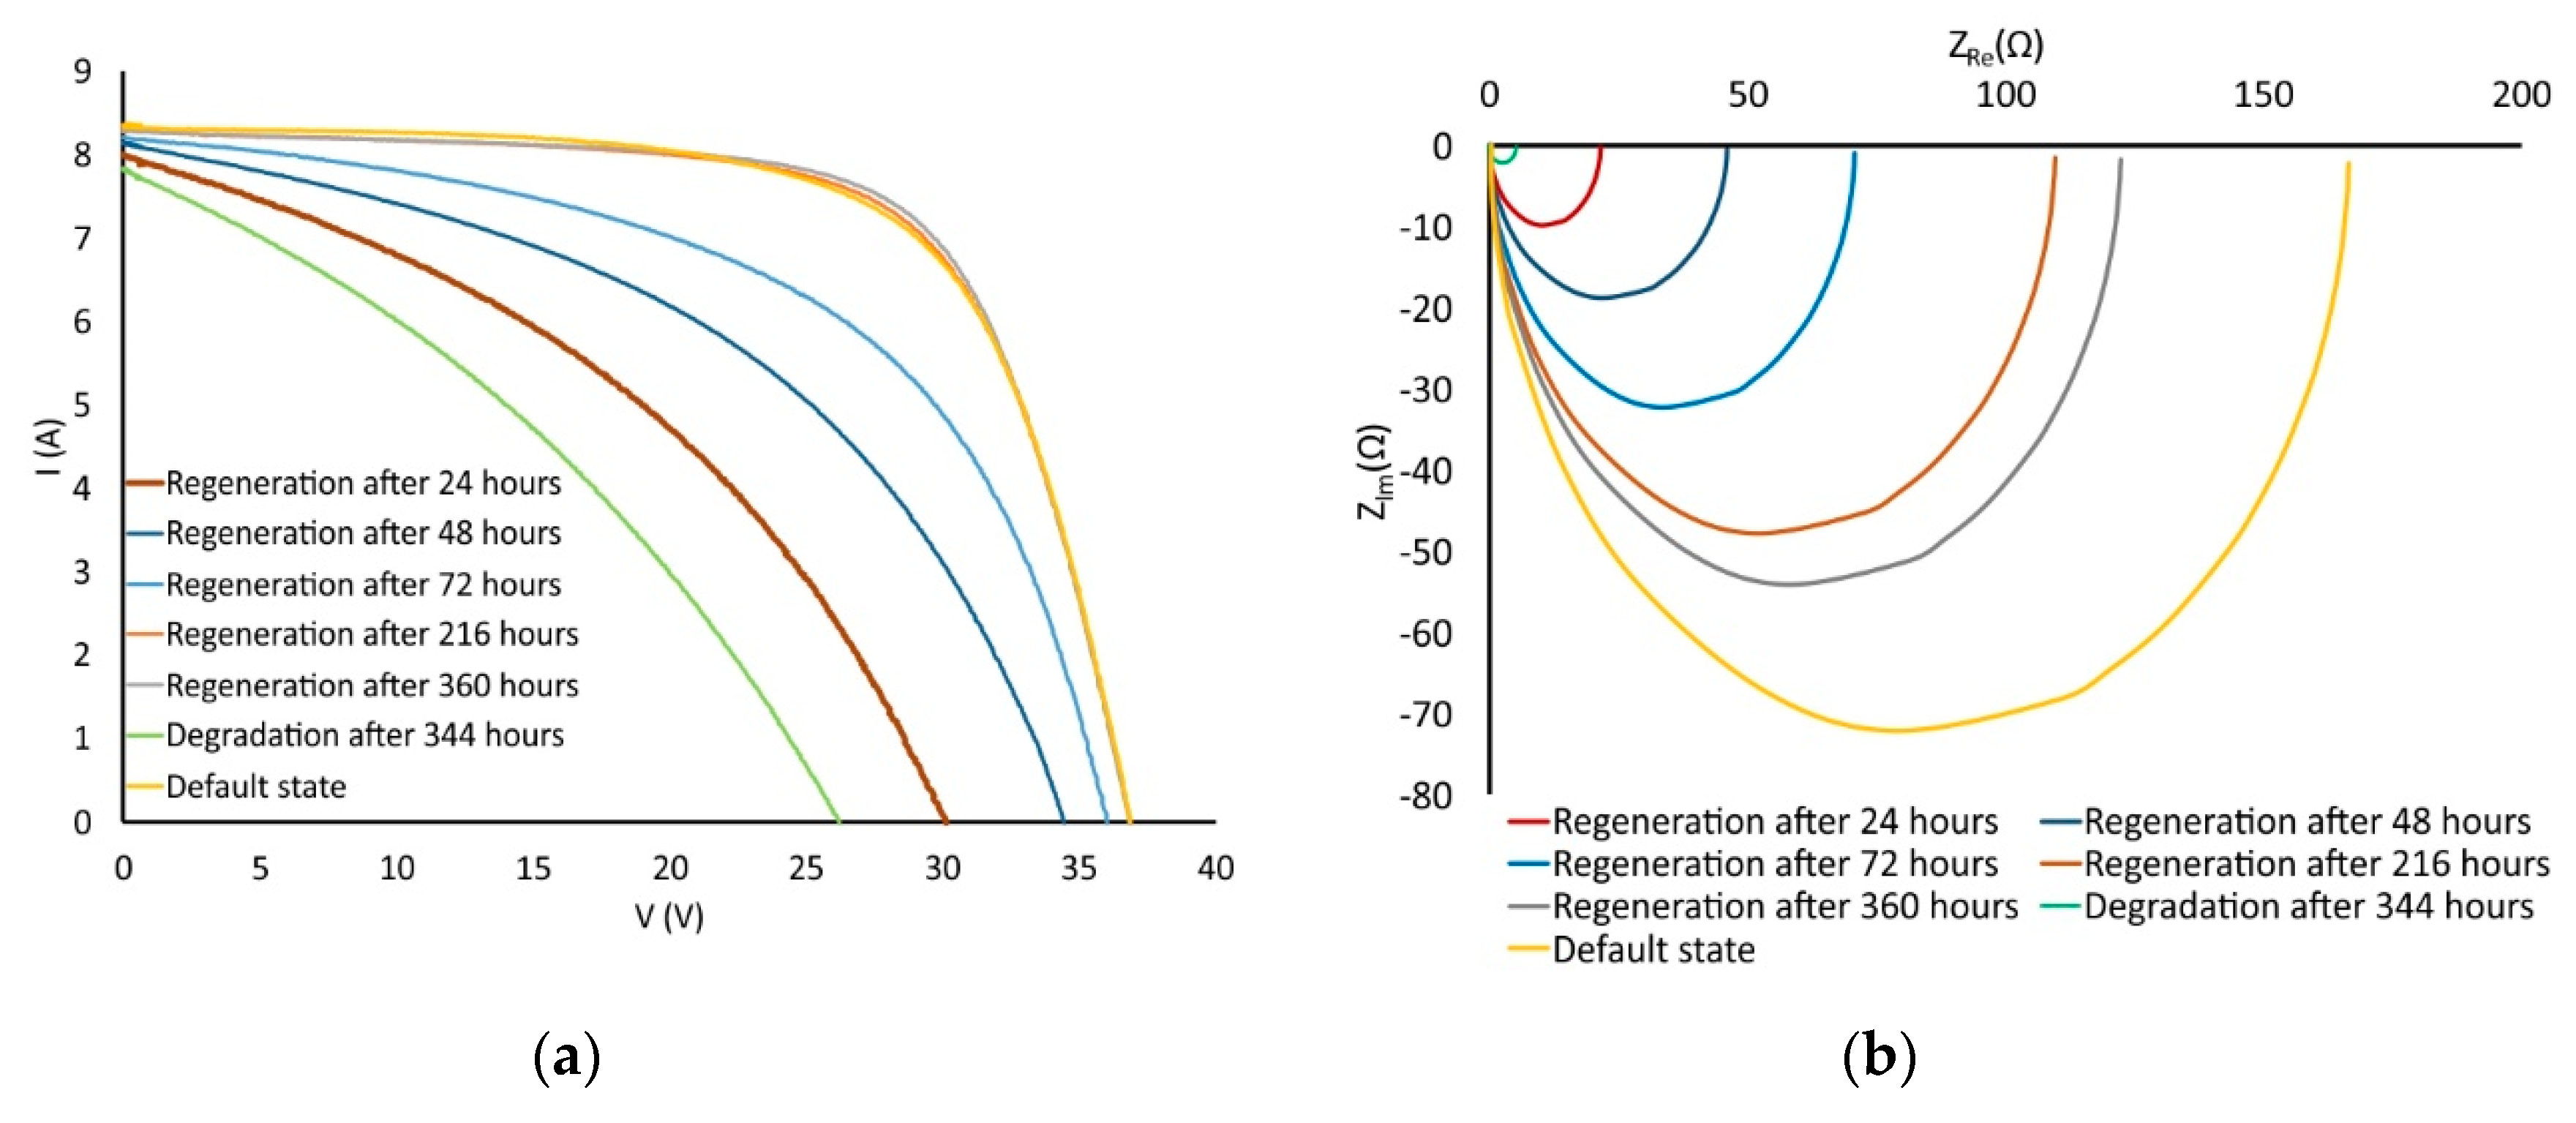
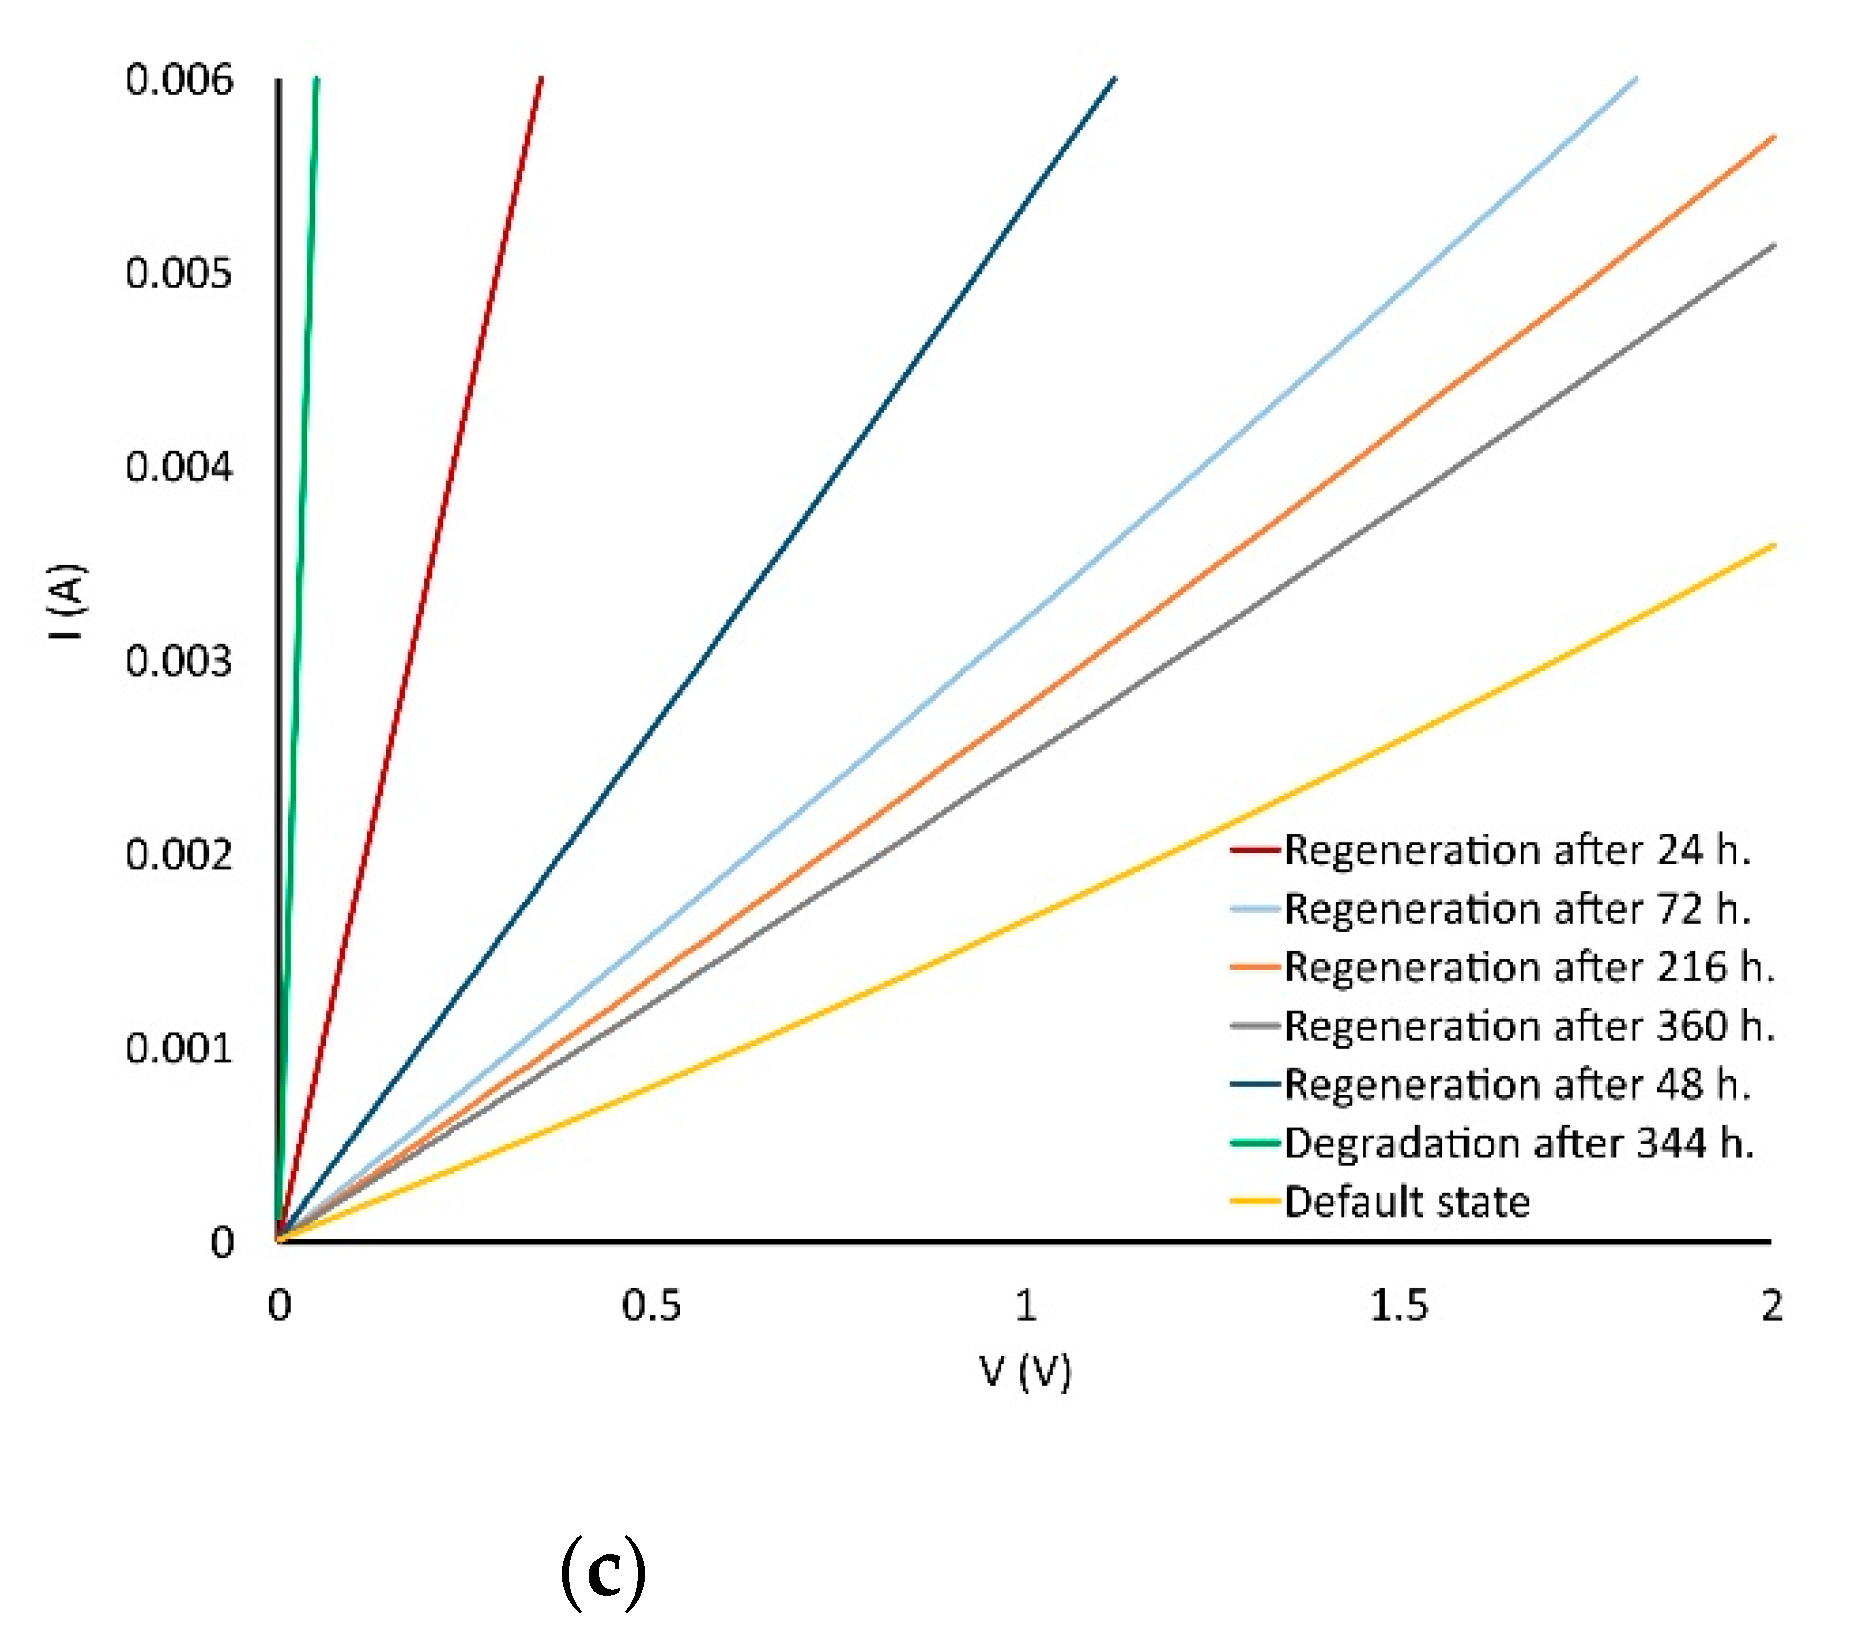
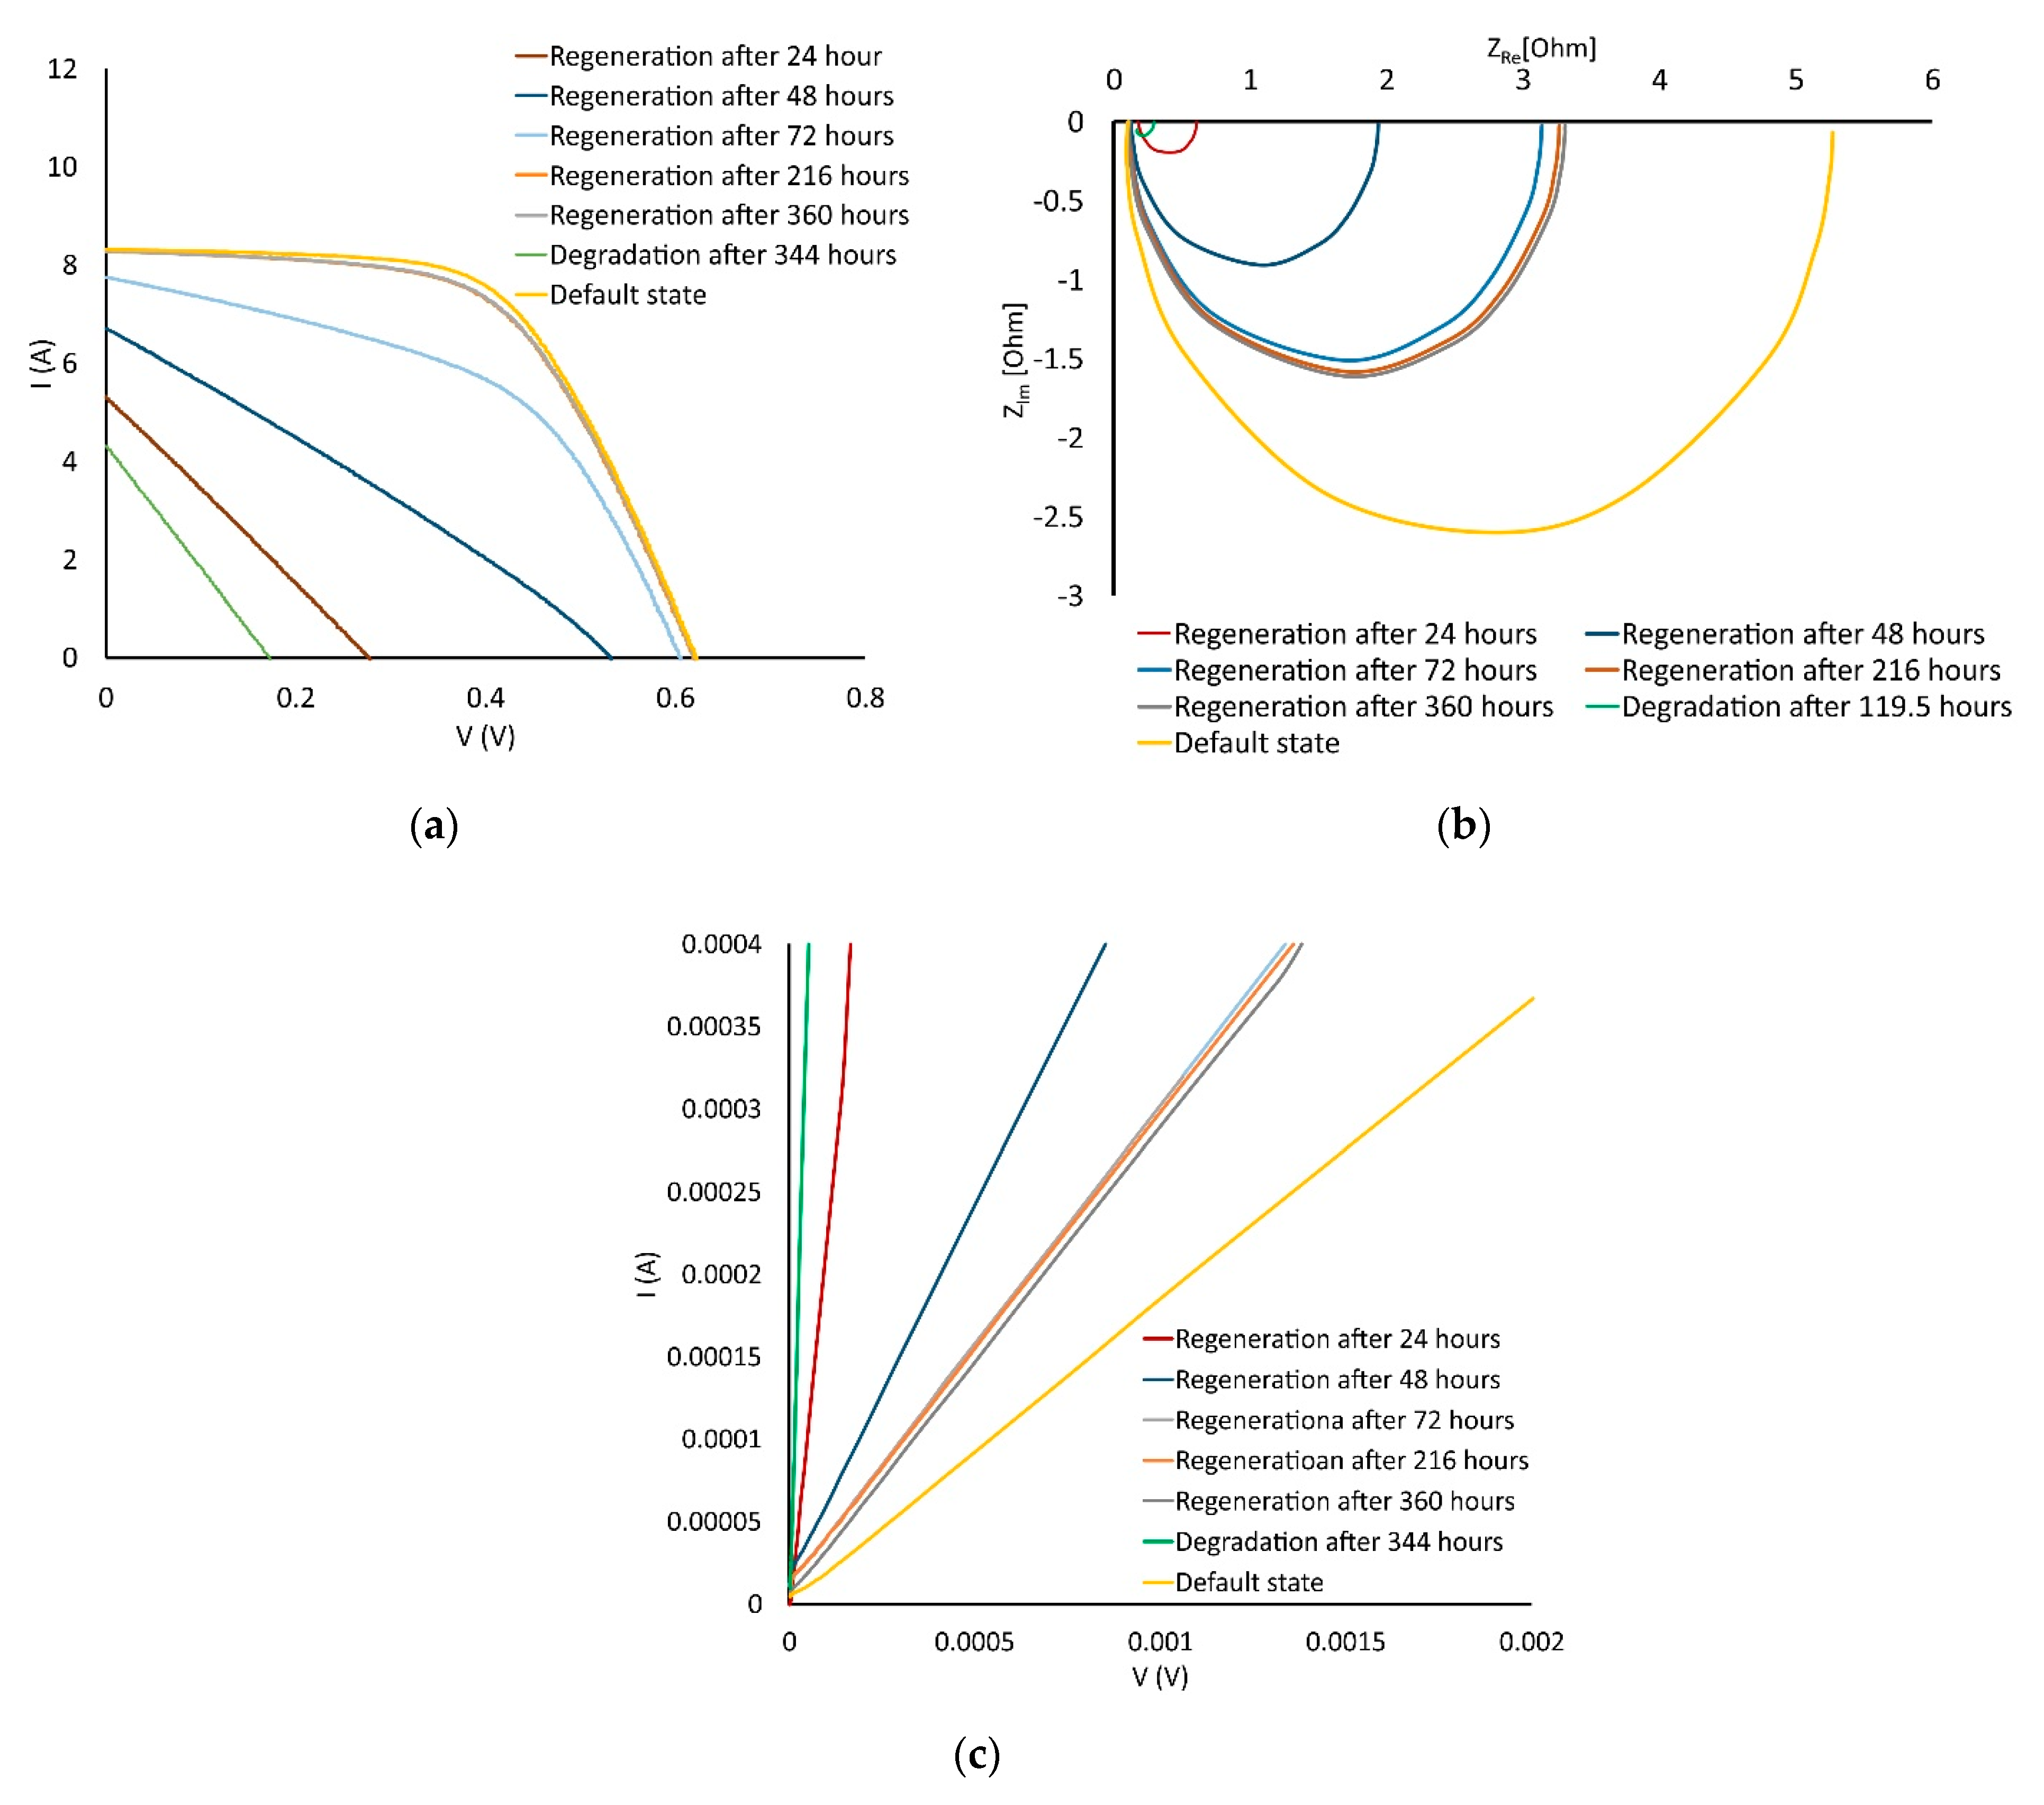
The method of PID regeneration was chosen according to [28,29]. The regeneration process was started by applying inverse voltage in the same experimental setup. The negative pole was attached to the frame. At selected time intervals, regeneration was interrupted and measurements were performed in the same way as during the degeneration process. Characteristics obtained during module regeneration are shown in Figure 9 and Figure 10. The reason for regeneration was the effort to move between different states of degradation and evaluate changes RSH.
It can be seen that the PID regeneration proceeded very quickly and the last two measured characteristics overlap with the baseline characteristics. In the case of the module, even higher performance was achieved than the module had in its original state before degradation. However, it is also important to note that some parameters did not return to their original value, especially the shunt RSH resistance. Similar results were also measured for individual cell (Figure 10), even though we were unable to achieve 100% of the original performance. The Cole-Cole curve of one cell (Figure 10b) shows that after the first 24 h of regeneration, the cell regained capacitive character.
5. Results and Discussion
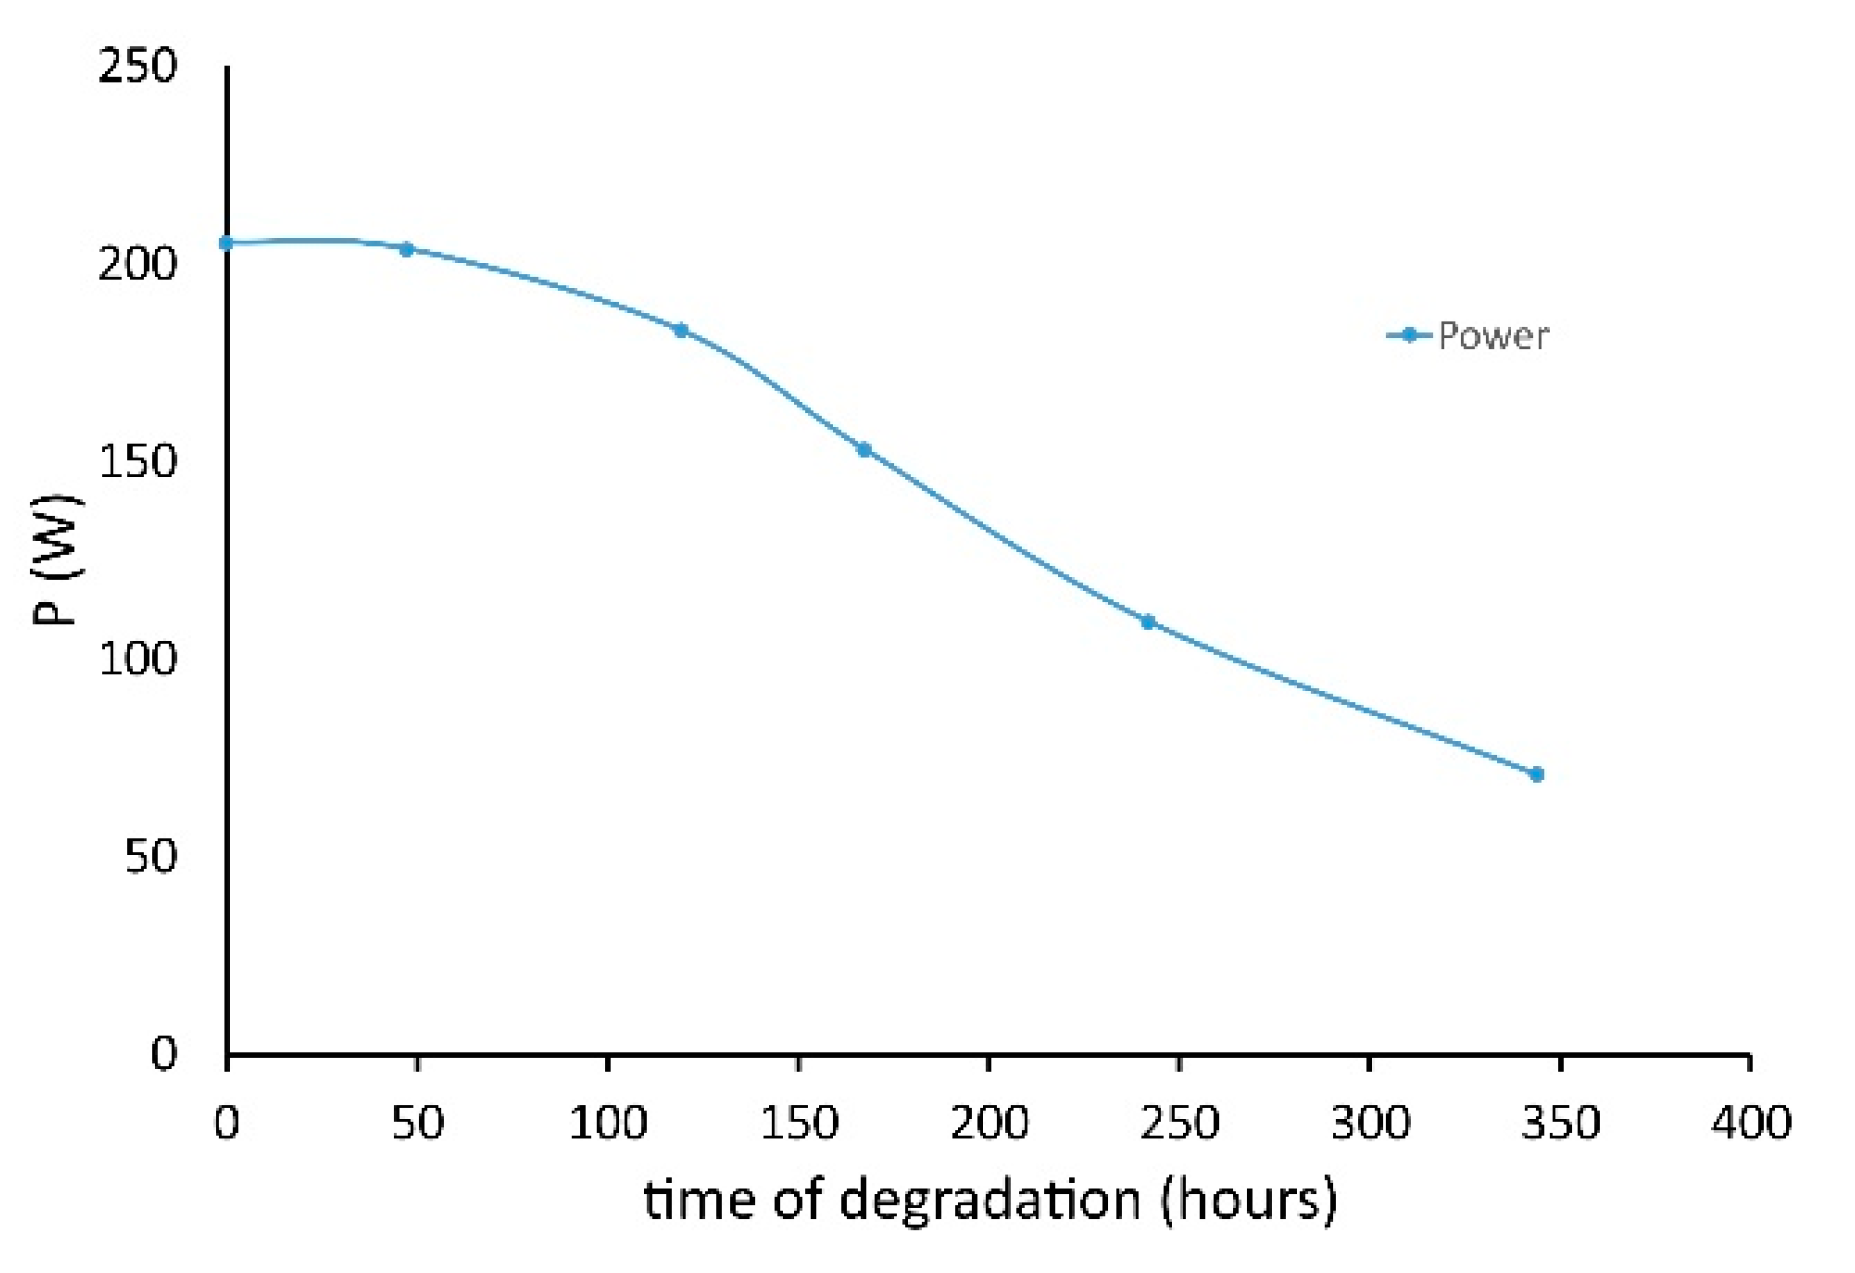
PID is most often evaluated due to a decrease in output power. The dependence of the output power on the degradation time is shown in Figure 11.
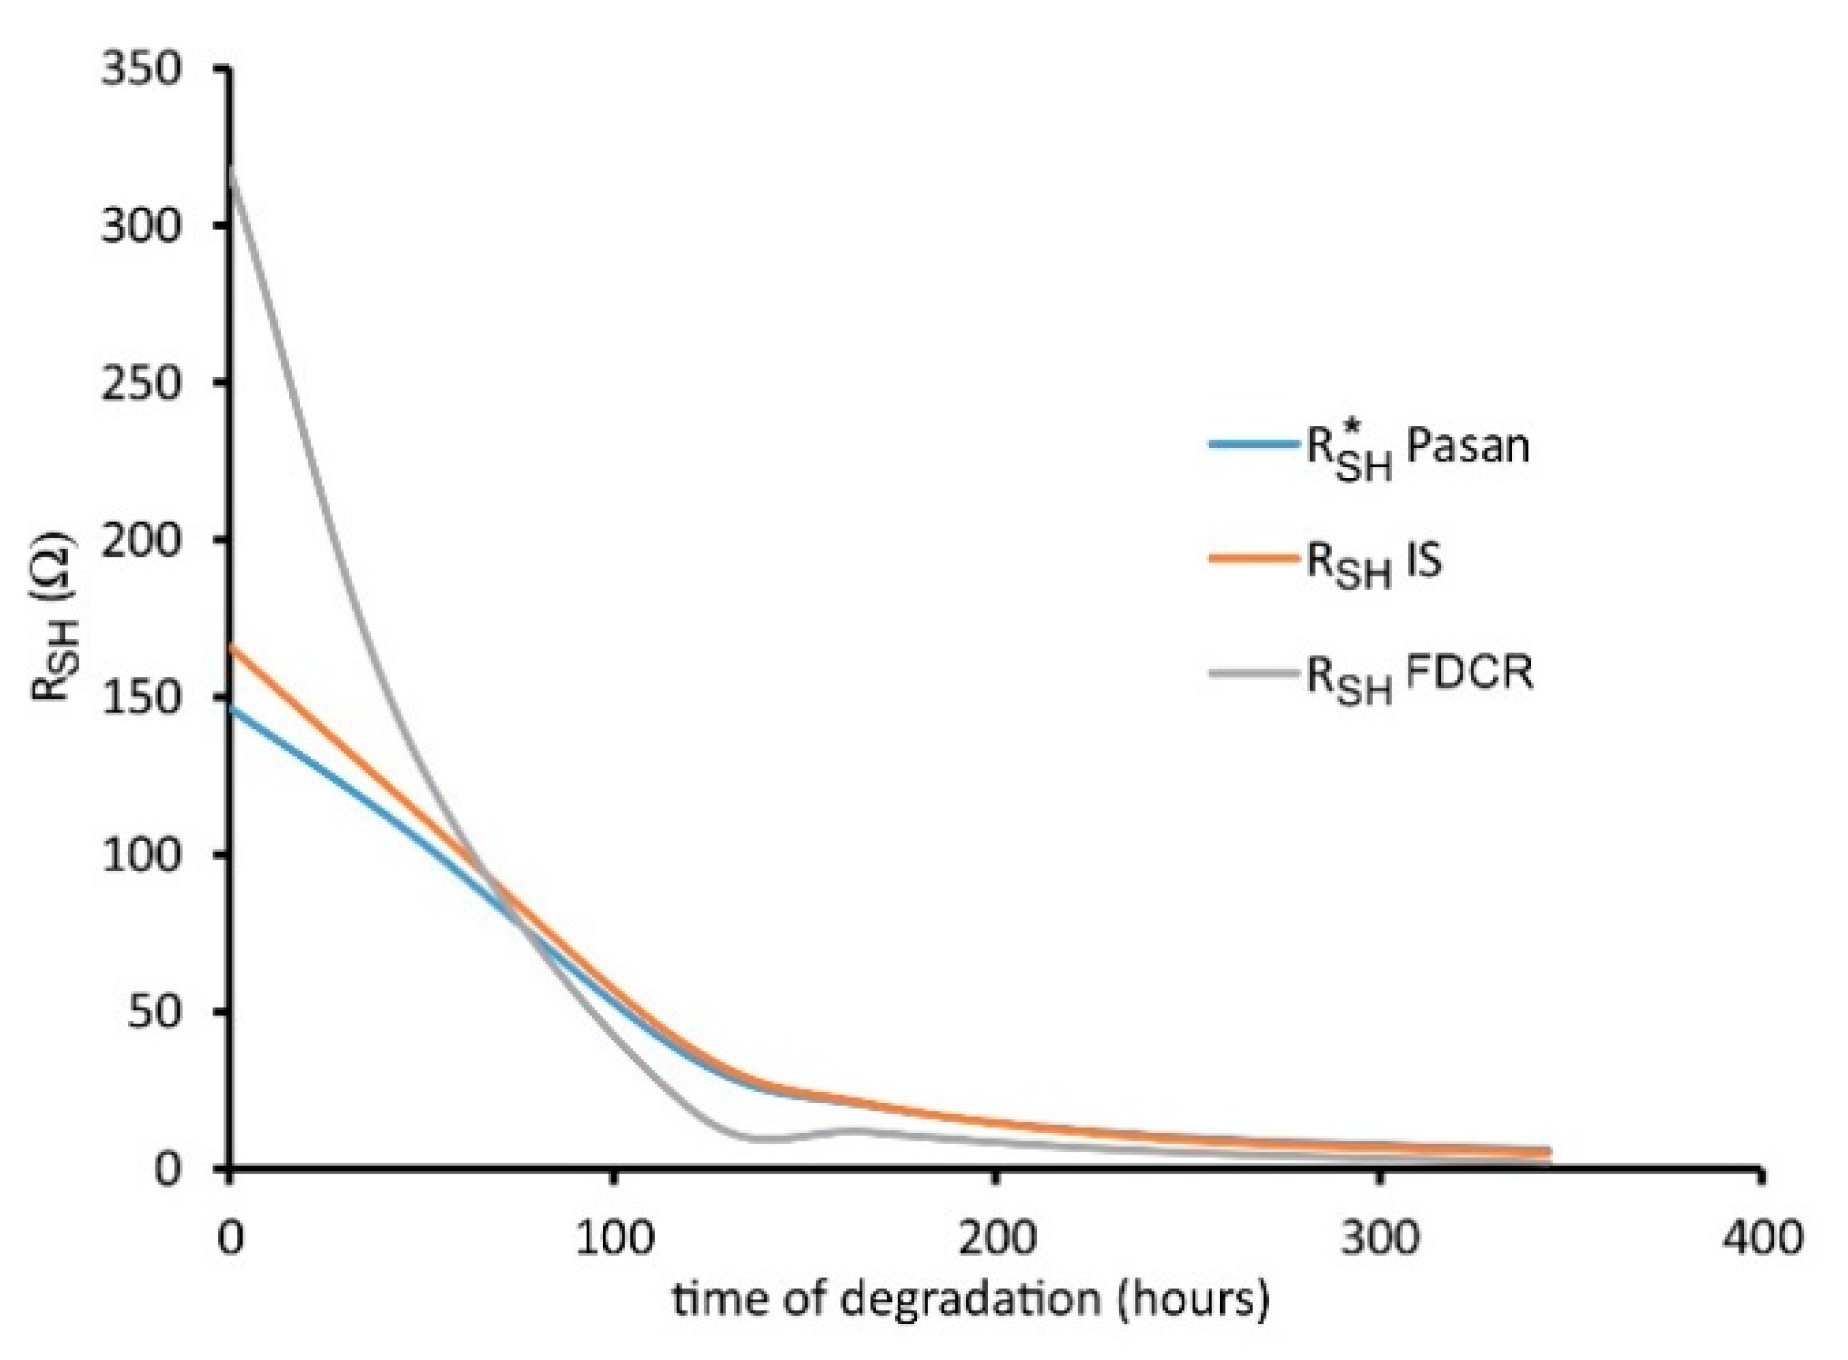
The shunt resistance of RSH is relatively sensitive to degenerative changes. The changes in RSH determined from the measurement of I-V characteristics, by impedance spectroscopy and by the measurement of dark current I-V are shown in Figure 12.
The dependence of the output power on the degradation time shows that in less than one hundred hours of degradation there is virtually no significant change, while in less than 50 h a significant reduction in the shunt resistance can be observed. The tested module already showed significant changes in the shunt resistance RSH after 47.5 h of degradation.
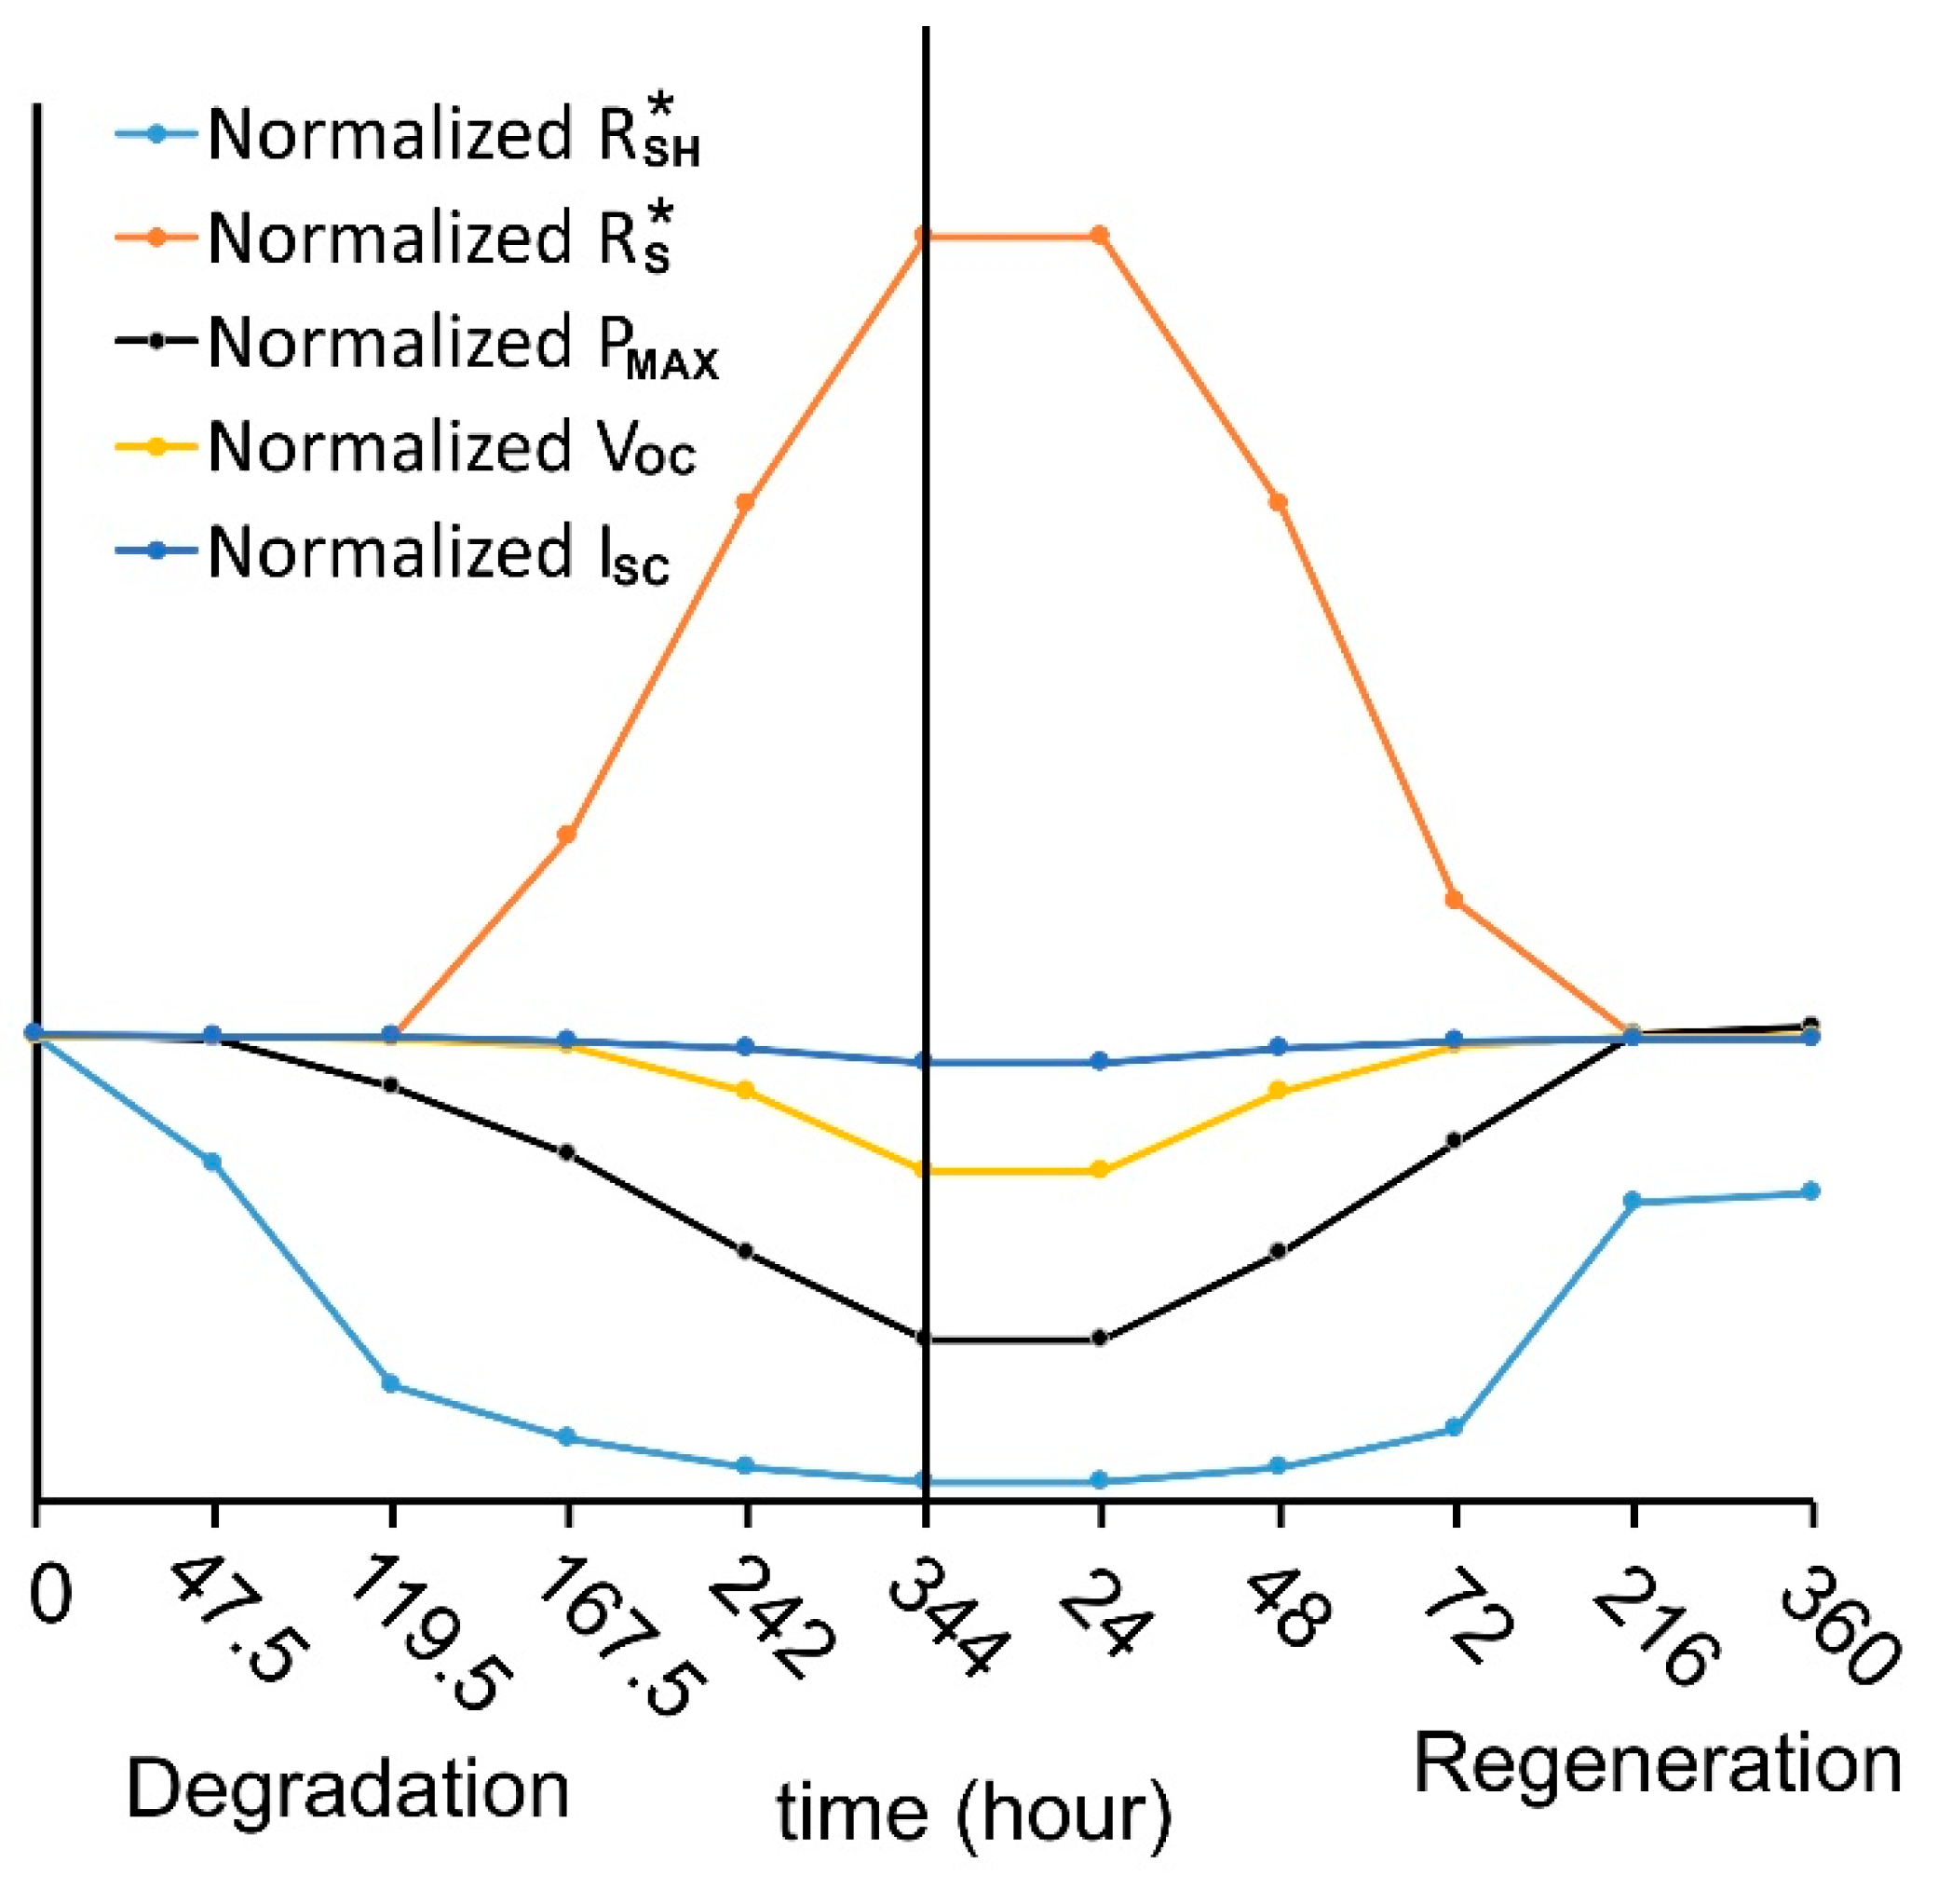
The dark I-V curve method proved to be the most sensitive, the IS and the flash tester are comparable in terms of determining the shunt resistance. The estimated shunt resistance value when using the flash tester and Equation (4), decreased by 27% in the first 47.5 h, in the case of IS by 30% and in the case of the dark I-V curve and Equation (5) even by 57%. In the first tens of hours of degradation, the dependence of the resistance RSH on the degradation time appears to be linear and gradually changes to the power function. The relative changes of the individual parameters of the photovoltaic module, measured by PASAN IIIc, during degradation and subsequent regeneration are shown in Figure 13. Individual parameters measured using Pasan IIIb are listed in Table 1
It is clear from the parameter changes that the PID first leads to a reduction in RSH*, then to a reduction in performance. The increase in series resistance RS* and the decrease in VOC occur only at a relatively advanced stage of degradation. The parameters power, Voc, Isc, RS* returned to their original values after 360 h of regeneration, only RSH* shows some hysteresis and did not return to the original value. However, this degradation of the RSH* value has not yet affected the performance of the module, but shows some irreversibility of the PID.
All parameters obtained from the flash test measurements somehow correspond to the increasing rate of PID, as can be seen in (Figure 13). The results show the importance of RSH measurements, mainly due to significant changes in this parameter in the initial stage of PID. All other monitored parameters showed a change only with more intense PID.
6. Conclusions
Based on the measurement of PV module data during PID and subsequent regeneration, it was found that the shunt resistance RSH is most sensitive to the incipient PID. A significant decrease of the shunt resistance RSH, compared to the original value, is observable before the power drops to 99% of the original value.
RSH monitoring makes it possible to detect the initial phases of PID using simple methods such as measuring dark I-V characteristics or impedance spectroscopy.
The required measuring technique is relatively inexpensive and there is no need to disassemble the modules from the structures and transport them to the laboratory, as is usual when using electroluminescence or measuring I-V characteristics using a solar simulator.
Author Contributions
T.F.; writing—original draft preparation, L.Č.; measurement of I–V curve, P.H.; preparation of an aging and healing experiment, D.R.; data analysis, V.B.; supervision. All authors have read and agreed to the published version of the manuscript.
Funding
This research was funded by Development Fund-Project “CENTRE OF ADVANCED PHOTOVOLTAICS” grant number (No. CZ.02.1.01/0.0/0.0/15_003/0000464).
Data Availability Statement
The data presented in this study are available on request from the corresponding author. The data are not publicly available due to that data are part of a wider study.
Conflicts of Interest
The funders had no role in the design of the study; in the collection, analyses, or interpretation of data; in the writing of the manuscript, or in the decision to publish the results.
References
- Pingel, S.; Frank, O.; Winkler, M.; Daryan, S.; Geipel, T.; Hoehne, H.; Berghold, J. Potential Induced Degradation of Solar Cells and Panels. In Proceedings of the 2010 35th IEEE Photovoltaic Specialists Conference, Honolulu, HI, USA, 20–25 June 2010; pp. 002817–002822. [Google Scholar]
- Hoffman, A.R.; Ross, R.G. Environmental Qualification Testing of Terrestrial Solar Cell Modules. In Proceedings of the 13th IEEE PVSC, Washington, DC, USA, 4–8 June 1978; pp. 835–842. [Google Scholar]
- Livera, A.; Theristis, M.; Makrides, G.; Georghiou, G.E. Recent Advances in Failure Diagnosis Techniques Based on Performance Data Analysis for Grid-Connected Photovoltaic Systems. Renew. Energy 2019, 133, 126–143. [Google Scholar] [CrossRef]
- Luo, W.; Khoo, Y.S.; Hacke, P.; Naumann, V.; Lausch, D.; Harvey, S.P.; Singh, J.P.; Chai, J.; Wang, Y.; Aberle, A.G.; et al. Potential-Induced Degradation in Photovoltaic Modules: A Critical Review. Energy Environ. Sci. 2017, 10, 43–68. [Google Scholar] [CrossRef] [Green Version]
- Peike, C.; Hülsmann, P.; Blüml, M.; Schmid, P.; Weiß, K.-A.; Köhl, M. Impact of Permeation Properties and Backsheet-Encapsulant Interactions on the Reliability of PV Modules. ISRN Renew. Energy 2012, 2012, 1–5. [Google Scholar] [CrossRef] [Green Version]
- Achintha, M. Sustainability of glass in construction. In Sustainability of Construction Materials; Elsevier: Amsterdam, The Netherlands, 2016; pp. 79–104. ISBN 978-0-08-100995-6. [Google Scholar]
- Liu, H.; Luo, W.; Kumar, A.; Reindl, T.; Hacke, P. Evaluation of Risk for Potential-Induced Degradation in Floating PV Systems. In Proceedings of the 36th European Photovoltaic Solar Energy Conference and Exhibition, Marseille, France, 9–13 September 2019; pp. 1324–1330. [Google Scholar] [CrossRef]
- IEC TS 62804-1:2015. Photovoltaic (PV) Modules—Test Methods for the Detection of Potential-Induced Degradation—Part 1: Crystalline Silicon; International Electrotechnical Commission: Geneva, Switzerland, 2015. [Google Scholar]
- Köntges, M.; Oreski, G.; Jahn, U.; Herz, M.; Hacke, P.; Weiß, K.-A. Assessment of Photovoltaic Module Failures in the Field: International Energy Agency Photovoltaic Power Systems Programme: IEA PVPS Task 13, Subtask 3: Report IEA-PVPS T13-09:2017; International Energy Agency: Paris, France, 2017; ISBN 978-3-906042-54-1. [Google Scholar]
- Florides, M.; Makrides, G.; Georghiou, G.E. Early Potential Induced Degradation (PID) Detection in the Field: Solar Cell Shunt Resistance Measurement at Different Bias Conditions. In Proceedings of the 35th European Photovoltaic Solar Energy Conference and Exhibition, Brussels, Belgium, 24–28 September 2018; pp. 1157–1160. [Google Scholar] [CrossRef]
- Florides, M.; Makrides, G.; Georghiou, G.E. Characterisation of the Shunt Resistance Due to Potential Induced Degradation (PID) in Crystalline Solar Cells. In Proceedings of the 2018 IEEE 7th World Conference on Photovoltaic Energy Conversion (WCPEC) (A Joint Conference of 45th IEEE PVSC, 28th PVSEC & 34th EU PVSEC), Waikoloa Village, HI, USA, 10–15 June 2018. [Google Scholar]
- Kwembur, I.M.; Crozier McCleland, J.L.; van Dyk, E.E.; Vorster, F.J. Detection of Potential Induced Degradation in Mono and Multi-Crystalline Silicon Photovoltaic Modules. Phys. B Condens. Matter 2020, 581, 411938. [Google Scholar] [CrossRef]
- Chenvidhya, D.; Kirtikara, K.; Jivacate, C. PV Module Dynamic Impedance and Its Voltage and Frequency Dependencies. Solar Energy Mater. Solar Cells 2005, 86, 243–251. [Google Scholar] [CrossRef]
- Florides, M.; Livera, A.; Makrides, G.; Georghiou, G.E. Shunt Resistance Relation to Power Loss Due to Potential Induced Degradation in Crystalline Photovoltaic Cells. In Proceedings of the 2019 IEEE 46th Photovoltaic Specialists Conference (PVSC), Chicago, IL, USA, 16–21 June 2019; pp. 1950–1954. [Google Scholar]
- Cotfas, P.; Cotfas, D.; Borza, P.; Sera, D.; Teodorescu, R. Solar Cell Capacitance Determination Based on an RLC Resonant Circuit. Energies 2018, 11, 672. [Google Scholar] [CrossRef] [Green Version]
- Silverman, T.J.; Deceglie, M.G.; VanSant, K.; Johnston, S.; Repins, I. Illuminated Outdoor Luminescence Imaging of Photovoltaic Modules. In Proceedings of the 2017 IEEE 44th Photovoltaic Specialist Conference (PVSC), Washington, DC, USA, 25–30 June 2017; pp. 3452–3455. [Google Scholar]
- Luque López, A.; Hegedus, S. (Eds.) Handbook of Photovoltaic Science and Engineering, 2nd ed.; [Fully Rev. and Updated]; Wiley: Chichester, UK, 2011; ISBN 978-0-470-97466-7. [Google Scholar]
- Krieger, U.K.; Lanford, W.A. Field Assisted Transport of Na+ Ions, Ca2+ Ions and Electrons in Commercial Soda-Lime Glass I: Experimental. J. Non-Cryst. Solids 1988, 102, 50–61. [Google Scholar] [CrossRef]
- Haque, A.; Bharath, K.V.S.; Khan, M.A.; Khan, I.; Jaffery, Z.A. Fault Diagnosis of Photovoltaic Modules. Energy Sci. Eng. 2019, 7, 622–644. [Google Scholar] [CrossRef] [Green Version]
- Cerna, L.; Benda, V.; Machacek, Z. A Note on Irradiance Dependence of Photovoltaic Cell and Module Parameters. In Proceedings of the 2012 28th International Conference on Microelectronics Proceedings, Nis, Serbia, 13–16 May 2012; pp. 273–276. [Google Scholar]
- Frazão, M.; Silva, J.A.; Lobato, K.; Serra, J.M. Electroluminescence of Silicon Solar Cells Using a Consumer Grade Digital Camera. Measurement 2017, 99, 7–12. [Google Scholar] [CrossRef]
- Kaminski, A.; Marchand, J.J.; Fave, A.; Laugier, A. New Method of Parameters Extraction from Dark I-V Curve. In Proceedings of the Conference Record of the Twenty Sixth IEEE Photovoltaic Specialists Conference, Anaheim, CA, USA, 29 September–3 October 1997; pp. 203–206. [Google Scholar]
- Cerná, L.; Finsterle, T.; Hrzina, P.; Benda, V. Note on Cole-Cole Diagrams of Photovoltaic Modules Evaluation. In Proceedings of the 33rd European Photovoltaic Solar Energy Conference and Exhibition, Amsterdam, The Netherlands, 25–29 September 2017; pp. 1537–1540. [Google Scholar] [CrossRef]
- Thongpron, J.; Kirtikara, K. Voltage and Frequency Dependent Impedances of Monocrystalline, Polycrystalline and Amorphous Silicon Solar Cells. In Proceedings of the 2006 IEEE 4th World Conference on Photovoltaic Energy Conference, Waikoloa, HI, USA, 7–12 May 2006; pp. 2116–2119. [Google Scholar]
- Johnson, J.; Schoenwald, D.; Kuszmaul, S.; Strauch, J.; Bower, W. Creating Dynamic Equivalent PV Circuit Models with Impedance Spectroscopy for Arc Fault Modeling. In Proceedings of the 2011 37th IEEE Photovoltaic Specialists Conference, Seattle, WA, USA, 19–24 June 2011. [Google Scholar]
- Abdullah, K.A.; Alloush, F.A.; Termanini, M.J.; Salame, C. Low Frequency and Low Temperature Behavior of Si, Solar Cell by AC Impedance Measurements. Energy Procedia 2012, 19, 183–191. [Google Scholar] [CrossRef] [Green Version]
- Spataru, S.V.; Parikh, H.R.; Hacke, P.; Dos Reis Benatto, G.A.; Sera, D.; Poulsen, P.B. Quantification of Solar Cell Failure Signatures Based on Statistical Analysis of Electroluminescence Images. In Proceedings of the 33rd European Photovoltaic Solar Energy Conference and Exhibition, Amsterdam, The Netherlands, 25–29 September 2017; pp. 1466–1472. [Google Scholar] [CrossRef]
- Annigoni, E.; Virtuani, A.; Sculati-Meillaud, F.; Ballif, C. Modeling Potential-Induced Degradation (PID) of Field-Exposed Crystalline Silicon Solar PV Modules: Focus on a Regeneration Term. In Proceedings of the 2017 IEEE 44th Photovoltaic Specialist Conference (PVSC), Washington, DC, USA, 25–30 June 2017; pp. 2794–2798. [Google Scholar]
- Mathiak, G.; Bogdanski, N.; Reil, F. Potential Induced Degradation (PID): Field Monitoring Data Evaluation and Climatic Chamber Tests with Field Modules. In Proceedings of the 32nd European Photovoltaic Solar Energy Conference and Exhibition, Munich, Germany, 20–24 June 2016; pp. 1898–1900. [Google Scholar] [CrossRef]
Figure 1.
(a) Equivalent circuit of serially connected PV cells into the module. (b) Simplified equivalent circuit of m serially connected PV cells.
Figure 1.
(a) Equivalent circuit of serially connected PV cells into the module. (b) Simplified equivalent circuit of m serially connected PV cells.

Figure 2.
PID polarization scheme.

Figure 3.
PID shunting scheme.

Figure 4.
(a) Cole-Cole diagram of PV cell (module). (b) Dynamic model of the PV cell.

Figure 5.
Modification of module for measuring individual cells.

Figure 6.
Electroluminescent images during degradation.

Figure 7.
(a) I-V curves during degradation for PV module. (b) Cole-Cole curve during degradation for PV module. (c) Dark I-V curve during degradation for PV module.
Figure 7.
(a) I-V curves during degradation for PV module. (b) Cole-Cole curve during degradation for PV module. (c) Dark I-V curve during degradation for PV module.

Figure 8.
(a) I-V curves during degradation for PV cell. (b) Cole-Cole curve during degradation for PV cell. (c) Dark I-V curve during degradation for PV cell.
Figure 8.
(a) I-V curves during degradation for PV cell. (b) Cole-Cole curve during degradation for PV cell. (c) Dark I-V curve during degradation for PV cell.


Figure 9.
(a) I-V curves during regeneration for PV module. (b) Cole-Cole curve during regeneration for PV module. (c) Dark I-V curve during regeneration for PV module.
Figure 9.
(a) I-V curves during regeneration for PV module. (b) Cole-Cole curve during regeneration for PV module. (c) Dark I-V curve during regeneration for PV module.


Figure 10.
(a) I-V curves during regeneration for PV cell. (b) Cole-Cole curve during regeneration for PV cell. (c) Dark I-V curve during regeneration for PV cell.
Figure 10.
(a) I-V curves during regeneration for PV cell. (b) Cole-Cole curve during regeneration for PV cell. (c) Dark I-V curve during regeneration for PV cell.

Figure 11.
Change of power of PV module due to PID.

Figure 12.
Change measured RSH of PV module due to PID.

Figure 13.
Photovoltaic module parameters during degradation and regeneration.


Table 1.
Module parameters measured with Pasan SunSim IIIc during degradation.
| Time of Degradation (Hour) | PMAX | RSH* (Ω) | RS* (Ω) | η | FF (%) | VOC (V) | ISC (A) |
|---|---|---|---|---|---|---|---|
| 0 | 205.6 | 146.5 | 0.68 | 12.56 | 66.35 | 36.8 | 8.3 |
| 47.5 | 203.3 | 106.3 | 0.68 | 12.66 | 66.40 | 36.9 | 8.3 |
| 119.5 | 182.9 | 36.1 | 0.73 | 11.28 | 60.09 | 36.6 | 8.2 |
| 167.5 | 152.9 | 20.0 | 0.95 | 9.43 | 51.47 | 36.1 | 8.2 |
| 242 | 109.4 | 10.5 | 1.51 | 6.75 | 41.74 | 32.4 | 8.0 |
| 344 | 70.7 | 5.9 | 1.88 | 4.63 | 34.39 | 26.2 | 7.8 |
Publisher’s Note: MDPI stays neutral with regard to jurisdictional claims in published maps and institutional affiliations. |
© 2021 by the authors. Licensee MDPI, Basel, Switzerland. This article is an open access article distributed under the terms and conditions of the Creative Commons Attribution (CC BY) license (https://creativecommons.org/licenses/by/4.0/).
Share and Cite
MDPI and ACS Style
Finsterle, T.; Černá, L.; Hrzina, P.; Rokusek, D.; Benda, V. Diagnostics of PID Early Stage in PV Systems. Energies 2021, 14, 2155. https://doi.org/10.3390/en14082155
AMA Style
Finsterle T, Černá L, Hrzina P, Rokusek D, Benda V. Diagnostics of PID Early Stage in PV Systems. Energies. 2021; 14(8):2155. https://doi.org/10.3390/en14082155
Chicago/Turabian StyleFinsterle, Tomáš, Ladislava Černá, Pavel Hrzina, David Rokusek, and Vítězslav Benda. 2021. "Diagnostics of PID Early Stage in PV Systems" Energies 14, no. 8: 2155. https://doi.org/10.3390/en14082155
Note that from the first issue of 2016, this journal uses article numbers instead of page numbers. See further details here.