1. Introduction
In the 1970s, the world witnessed significant global phenomenal shifts with relatively prolonged effects. From the economic viewpoint, one of the most important phenomena was the global oil price shock of 1973, which forced the global GDP and CO
2 emissions to trend differently. Afterwards, the common dependency on fossil fuel energy and the continuous rising demands for energy started to pose a challenge that would trap the world [
1,
2]. The trap called for global, multifaceted reform. The 1992 Rio summit, which initiated a dramatic shift in thinking about economic growth and mainstreaming environmental issues in economic agendas, was the result of such stress.
Several studies relate oil price shocks with economic growth uncertainty [
3,
4,
5]. Many possible external supply shocks subject oil prices to unpredictability at any point in time. Even if the prices continue to be comparatively stable over an extended period, an abrupt exogenous incident could unsettle the balance independently and cause substantial price changes. Such effects may exacerbate or diminish greenhouse gas (GHG) emissions in industrial countries and industry sectors more than service sectors [
5]. Early in the debate, Yang et al. [
6] outlined some of the principal avenues through which oil price and oil price volatilities could constrain the economy. A study by Hamilton [
7] also assesses a significant connection between oil price increase and economic recessions between 1948 and 1981, identifying the oil shocks causing global economic growth in the USA. Van de Ven and Fouquet [
8] recognized adverse demand shock effects of energy price and a relatively higher demand shock oil-importing economy. However, empirical literature that evaluates the effects of oil price and oil price volatility on GHG emission reduction and environmental stewardship is scant. Concerning the effect of oil price and oil price volatility on environmental stewardship, Vielle and Viguier [
9] cited Eberhard Rhein’s article of the International Herald Tribune (31 August 2005), saying, “the international community has been laboring for ten years under the Kyoto Protocol negotiations to agree on a global reduction of energy consumption and carbon dioxide emissions of less than 10% by 2012”. The article indicates that the market has achieved within a few months what international bureaucrats—including the United States, China, Australia and India—have struggled to obtain in a decade.
Along with this fact, the effects of price fluctuation and escalation do not appear to bring similar effects in oil-exporting and oil-importing countries. Unlike oil-importing countries, the transition to sustainable energy sources does not seem to be the biggest concern for oil-exporting countries. Perhaps, the transition to energy sources that produce less GHG and CO
2 and are environmental friendly is costly for oil-exporting countries [
10]. Different impediments are cited for obstructing the instigations of oil-exporting countries to diversify the energy sources. For example, Marques et al. [
11] identify some political, socioeconomic and country-specific factors as important features. These include, but are not limited to, policies (political factors), energy utilization subsidies and the difference in investment in research and development (R&D) between exporting countries. Krane [
12] identified the Middle Eastern oil-exporting countries’ energy subsidy reform as challenging the established rentier states assumption. According to the study, the subsidy is a politically motivated decision rather than a response to the global oil price change, increasing international environmental stress or a reaction to domestic consumption decline. According to Sachs and Warner [
13], these countries face the “resource curse” effects.
As complex systems, modern, innovative enterprises, as well as entire economies, do not create a strategy based solely on economic factors. In all their activities and endeavors, they pursue four broad goals that are strategically interdependent: ecologically sustainable development, economic competitiveness, social justice and democracy based on the rules of law [
14]. Any analysis assessing the impact of natural resources on economic growth has played a key role in creating the analytical framework for sustainable development [
15]. The energy–environment–economy nexus heavily relies upon the results of causality studies for policy and decision guidance [
16,
17,
18]. Theoretically, the relationship between economic development and energy intensity is argued for having both negative and positive linkages [
19].
Currently, with oil being the leading energy source accounting for 41% of total energy, achieving sustainable economic growth by cutting CO
2 and GHG emissions brings the topic to the forefront of the global sustainable economic growth agenda [
20]. Thus, assessing whether the resource curse effect is also curtailing countries’ sustainable economic growth provides broader policy feedback in the rentier states of oil-exporting countries and oil-importing countries. Similarly, Esseghir and Haouaoui Khouni [
21] propose a strategy of energy-saving and promotion policies as a priority to ensure sustainable development. Nevertheless, decreasing GHG emission without compromising economic growth is a significant challenge for policymakers and scientists [
16].
Recent notions surrounding research and development and technology paradigms refer to the effects of innovation on reducing emissions on economic growth and the environment [
22]. Innovations reflecting technological progress and modernity stimulate organizational development and build a competitive advantage [
23,
24]. This briefly highlights the recognition given to innovation for sustainable economic growth. According to Sagar and Holdren [
25], innovation is both the creation of new and efficient products, processes and technologies and their diffusion and application. Innovation is created in the R&D sectors, and it enables sustainable economic growth, according to Ulku [
26]. The essence of all enterprises’ investments is that after the assumed, usually long period, they return the costs incurred and bring specific benefits [
27]. The endogenous growth theory proposes careful research and development as a precondition to realize innovation and greater sustainability [
28]. The effects of innovation and technological progress improve the relationship between economic growth and environmental sustainability by improving replacements on polluting and outdated technologies and creating new and efficient alternative energy resources [
28,
29]. Even though the theory relates economic growth with an accumulation of skill knowledge, this study instead assesses the effects of R&D spending on GHG emission in the era of fossil fuel energy dominancy [
30].
From the environmental perspective, Fernández et al. [
31] acknowledge the aggregate effects of spending on R&D. The study identified the significant reduction in GHG emissions with increased R&D spending in developed countries. However, developed countries show quite different levels of renewable energy potential, GHG emissions, technological development and levels of energy utilization [
11]. Similarly, countries’ level of development, energy potential, policies and sources of major income have a paramount effect on the GHG emissions abatement initiatives. For instance, Brutschin and Fleig [
22] identified increasing fossil fuel rents to have a significant negative effect on innovation in renewable energies. Hence, this and other numerous factors may inter-play differently across countries to nullify the expected impacts of R&D or may adversely exacerbate GHG emissions. Thus, such effects are unfathomably essential in giving perspectives on how and which constraints affect the environment and sustainable economic growth in different economies.
Our hypothesis also includes the nexus between economic growth and energy consumption. Countries consume energy according to their level of economic development and production [
32,
33]. The study also hypothesizes that, like oil price volatility and oil price increase, economic growth triggers countries to look for sustainable alternative energy that produces less CO
2 and other GHGs. However, the scenario is different for oil-exporting and major oil-importing countries. For oil-exporting countries, the transition to alternative energy seems costly and poses different challenges compared to oil-importing countries. Hence, in this study, we probe and assess the effect of international crude oil price volatility, international oil price increase empirically and economic growth and R&D spending on GHG emission in oil-exporting and -importing countries.
The purpose of this paper is to investigate whether oil price and oil price volatility play a vital role in reducing GHG emissions in oil-importing and oil-exporting countries. In the study, the Driscoll–Kraay regression model is used to identify the effect of the factors included in the study. Furthermore, the study aims to provide empirical evidence for the debate on the comparative effectiveness between oil-exporting and -importing countries. This paper is organized as follows:
Section 1 provides the introduction of the study.
Section 2 briefly reviews the theoretical and empirical literature focusing on innovation, oil price, oil price volatility and GHG emission.
Section 3 provides the data sources and the econometric models used in the study.
Section 4 assesses and discusses the results of the study.
Section 5 provides the conclusion and policy recommendations.
2. Literature Review
The importance of energy as an input for economic growth had been ignored until the 1973–1974 and 1978–1979 oil crises. With these oil shocks, the entire world realized energy and energy-based inputs’ role in the production process [
34] and emission levels. As a result, the number of studies examining the relationship between energy price, innovation, economic growth and pollution gradually increased. This study, however, examines the effect of innovation, oil price and economic growth on GHG emissions in oil-exporting countries and oil-importing countries.
Scientists have been rigorously researching the environmental impacts of greenhouse gas (GHG) emissions in the world. In recent decades, concern has grown over the issues, especially when the resilience and shock absorbing ability of the environment fail to go with the trend of economic growth [
35]. The release of GHGs in the atmosphere is a clear example of a negative externality of economic growth that levies a substantial burden on a global scale [
16,
32]. In the language of economic theory, the current market for carbon-based energies such as coal, oil and natural gas considers only private gains and welfares, which leads to a market equilibrium that does not match the social optimum. From a social perspective, the selling price for fossil fuels is too low, and the quantity consumed is too high to induce exacerbated GHG emissions [
36]. According to Goodwin, Harris, Nelson, Roach and Torras [
35], global warming over the past era was tremendously human-induced. Likewise, the 2013 and 2014 Intergovernmental Panel on Climate Change (IPCC) reports attribute most of the current era’s climate change to human-induced GHG emissions. The IPCC also projected a temperature increase between 1.5 (2.7 °F) and 4.8 °C (8.6 °F) relative to pre-industrial levels by 2100 [
20,
37].
Studies on GHG emissions, economic growth, R&D and oil price and oil price volatility can be seen as an extension of the standard endogenous economic growth theory, where R&D and other energy inputs facilitate economic production on a different level [
29,
38]. R&D creates technological innovations that can alleviate the core global challenges. However, in this section, the study explores the related prior empirical works, focusing on the recent research undertaken on the welfare effects of R&D, oil price hike and volatility and economic growth on GHG reduction and environmental sustainability, building the foundation of the study.
The theories of Hicks [
39] and, later, Aghion, Howitt, Howitt, Brant-Collett and García-Peñalosa [
28] assume that a change in factor prices triggers the development of technical innovation to reduce the use of the factor due to which the price increased compared to others. It is possible to assume that following the oil price shock, the substantial investments made in alternative energy sources were put forth to diminish the oil consumption, which resulted in CO
2 emissions growing at a slower rate than GDP per capita. The emission trend continued to drop even with the 1980s oil price drop. This signaled a comprehensive structural transformation in technology, prompted by the need to innovate [
40]. Among others, such a model requires environmental steward societies, a society that integrates sustainability and invests in sustainable technologies that lead the global CO
2 emission level to decline as their income increases. In this area, research is limited, and much of the existing literature focuses on the determinants of GHG emissions across high oil-consuming and developed countries. Since the world is highly dependent on oil and non-renewable energy resources, GHG emissions are increasing with different trends between developed and less developed regions, oil-exporting and -importing economies [
2]. Hence, including oil-exporting countries may provide us with better details. Van de Ven and Fouquet [
8], using the United Kingdom’s statistics over the last three hundred years, found the transition from coal to oil to multiply the adverse influence of demand shocks. The study also indicated that an increase in venerability and resilience to shock failed to advance systematically and parallel with economic growth. According to Parker and Umar [
17], the strive for economic growth exacerbated the need for fossil fuel energy. At the same time, Mariyakhan et al. [
41] argue that the level of absorptive capacity matters for carbon intensity.
Through innovation, critical technological and structural changes can respond to and mitigate the effects of such change and realize sustainable economic growth without jeopardizing future generations’ development needs and capacities [
42,
43]. In this strategy, CO
2 emission reduction, energy-efficient technology as well as the provision of alternative sources are priorities. Aguirre and Ibikunle [
2] detected specific government-backed energy policies to impede renewable energy investments, thus significantly creating an obstacle in policy design to curtail GHG emission abatement. Such action inhibits the long-term objective of cutting GHG emissions by 20% compared with 1990 and ensuring at least 27% of total energy consumption from renewable energy sources [
20].
Considering the difficulty of implementing the Kyoto Protocol, at an epoch of post-Kyoto, the Paris Agreement on climate change strategies considers ways to maintain sustainable economic growth by reducing GHG emissions [
20]. Currently, the Paris Agreement considers global GHG emissions as the primary challenge for economic, environmental and social sustainability [
20]. Thus, one might be tempted to take the oil price shock and oil price volatility as good news [
9] to push oil-importing countries to look for or invent sustainable energy sources and technologies that reduce the current fossil fuel consumption level. Furthermore, the current political cover for reform takes the form of international campaigns to end fossil fuel subsidies and address negative externalities such as pollution and climate change. Multilateral agencies such as the G20, the International Monetary Fund, the World Bank and the International Energy Agency and the Paris climate agreement of 2015 intensified the pressure on countries to end price support for carbon-rich fuels. Middle Eastern oil exporters’ status as large suppliers, consumers and subsidizers of fossil fuels exposes them to blame for a disproportionate role in climate change. Saudi Arabia linked subsidy reform explicitly to climate change [
12]. Hence, the study empirically assesses how international efforts, together with the market forces, contribute to the ongoing GHG emissions and climate change improvements. Moreover, based on Fernández, López and Blanco [
31] and Hoxtell and Goldthau [
1], the study classifies the others’ oil importing because the challenge of emissions and the level of commitment of countries towards climate change and GHG reduction is different between countries.
3. Data Sources and Statistics
The study contains panel data of 22 oil-exporting countries, 26 European Union countries, China, including Hong Kong, and the USA over 24 years (1991–2015). Oil-exporting and -importing economies were identified and defined using the 2017 Central Investigation Agency (CIA) list of crude oil-importing and -exporting countries [
44]. To detect the GHG emission-abating effect of oil price, oil price volatility, R&D spending and economic growth, the study further segregated the importing countries. The further segregation enables the depiction of the nexus in regions with different sensitivities to global environmental challenges and countries with other ecological policy outlooks and economies. Thus, the study included 22 oil-exporting countries of the world and 26 European Union countries, the United States of America and China to analyze the effects of oil price, oil price volatility, economic growth and innovation on the global GHG emission.
The data source used was the World Bank Development Indicators (WDI). We favored this data source due to its better longitudinal coverage. As an indicator of innovation, the aggregated expenditure on R&D measured in millions of US dollars was used, where the figures are extracted from the WDI. From the perspective of abating GHG emissions, an economic growth proxy measured by per capita GDP in 2010 is considered in the study. These variables were included due to their strong correlation with GHG emission [
45]. The correlation also supplements the suitability of the variables considered in this study. Furthermore, countries considered in this study depict the differences in their economic growth level in absolute terms; thus, it provides better detail on the role of level of economic growth on environmental sustainability.
Economists identify oil price and oil price volatility to have a direct impact on economic growth and GHG emission [
40,
46]; thus, we included them as explaining variables of the study. Price volatility and international oil price change are comprehensive variables that force countries to make comparable policy and market response changes regardless of the types of economies. Studies have used different linear and nonlinear models to identify oil price and petrochemical volatility and its nexus with economic and non-economic factors [
47,
48,
49]. For instance, a low price may generate political instability and social unrest in some oil-producing countries [
6]; contrarily, it may exacerbate GHG emissions in oil-importing countries. Hence, the inclusion of these proxies may provide evidence on economic, political and social expectations with global environmental challenges. Thus, the study utilizes the Brent crude oil spot price data (USD per barrel), extracted from the BP Statistical Review of World Energy. Furthermore, the oil price volatility data were calculated using the standard deviation of monthly crude oil Brent price [
50].
To accommodate the countries that do not have continuous R&D spending data and different economies, the study used a dummy value to represent R&D expenditure. The dummy variable equal to 1 if the country has R&D spending in year j, and 0 otherwise. As time is required for R&D spending to have a tangible effect, we assumed this period as five years. This implies that if a country has set up R&D spending in year j, the R&D variable will take the value of 1 in year t + 5. Thus, by considering such important economic and policy factors, the study directly evaluates the global GHG emission-abating efforts of the different economies.
4. Descriptive Statistics
The descriptive statistics and the correlation between the variables are reported in
Table 1 and
Table 2, respectively. In the descriptive statistics, without making detail assessment, we can observe the economies’ trajectories regarding the GHG emission abating actions since 1991.
Table 1 shows the US to have the highest average emissions of GHG; nonetheless, China is increasing at an average annual rate of 6.34%. Based on the results described in
Table 1, the standard deviation of all values of the Oil exporting economy depicts a spectacular growth in GHG emission, reaching maximum values than the China and the USA economies. However, in per capita terms, the US is the most polluting country, followed by the EU. In an economic growth, the GDP per capita 2010 constant shows a lower value of oil-exporting countries than the USA and EU economies with a −0.15% annual average increment rate. Comparably, China has a lower per capita economic growth; however, its average yearly growth rate exceeds all the other economy considered in this study.
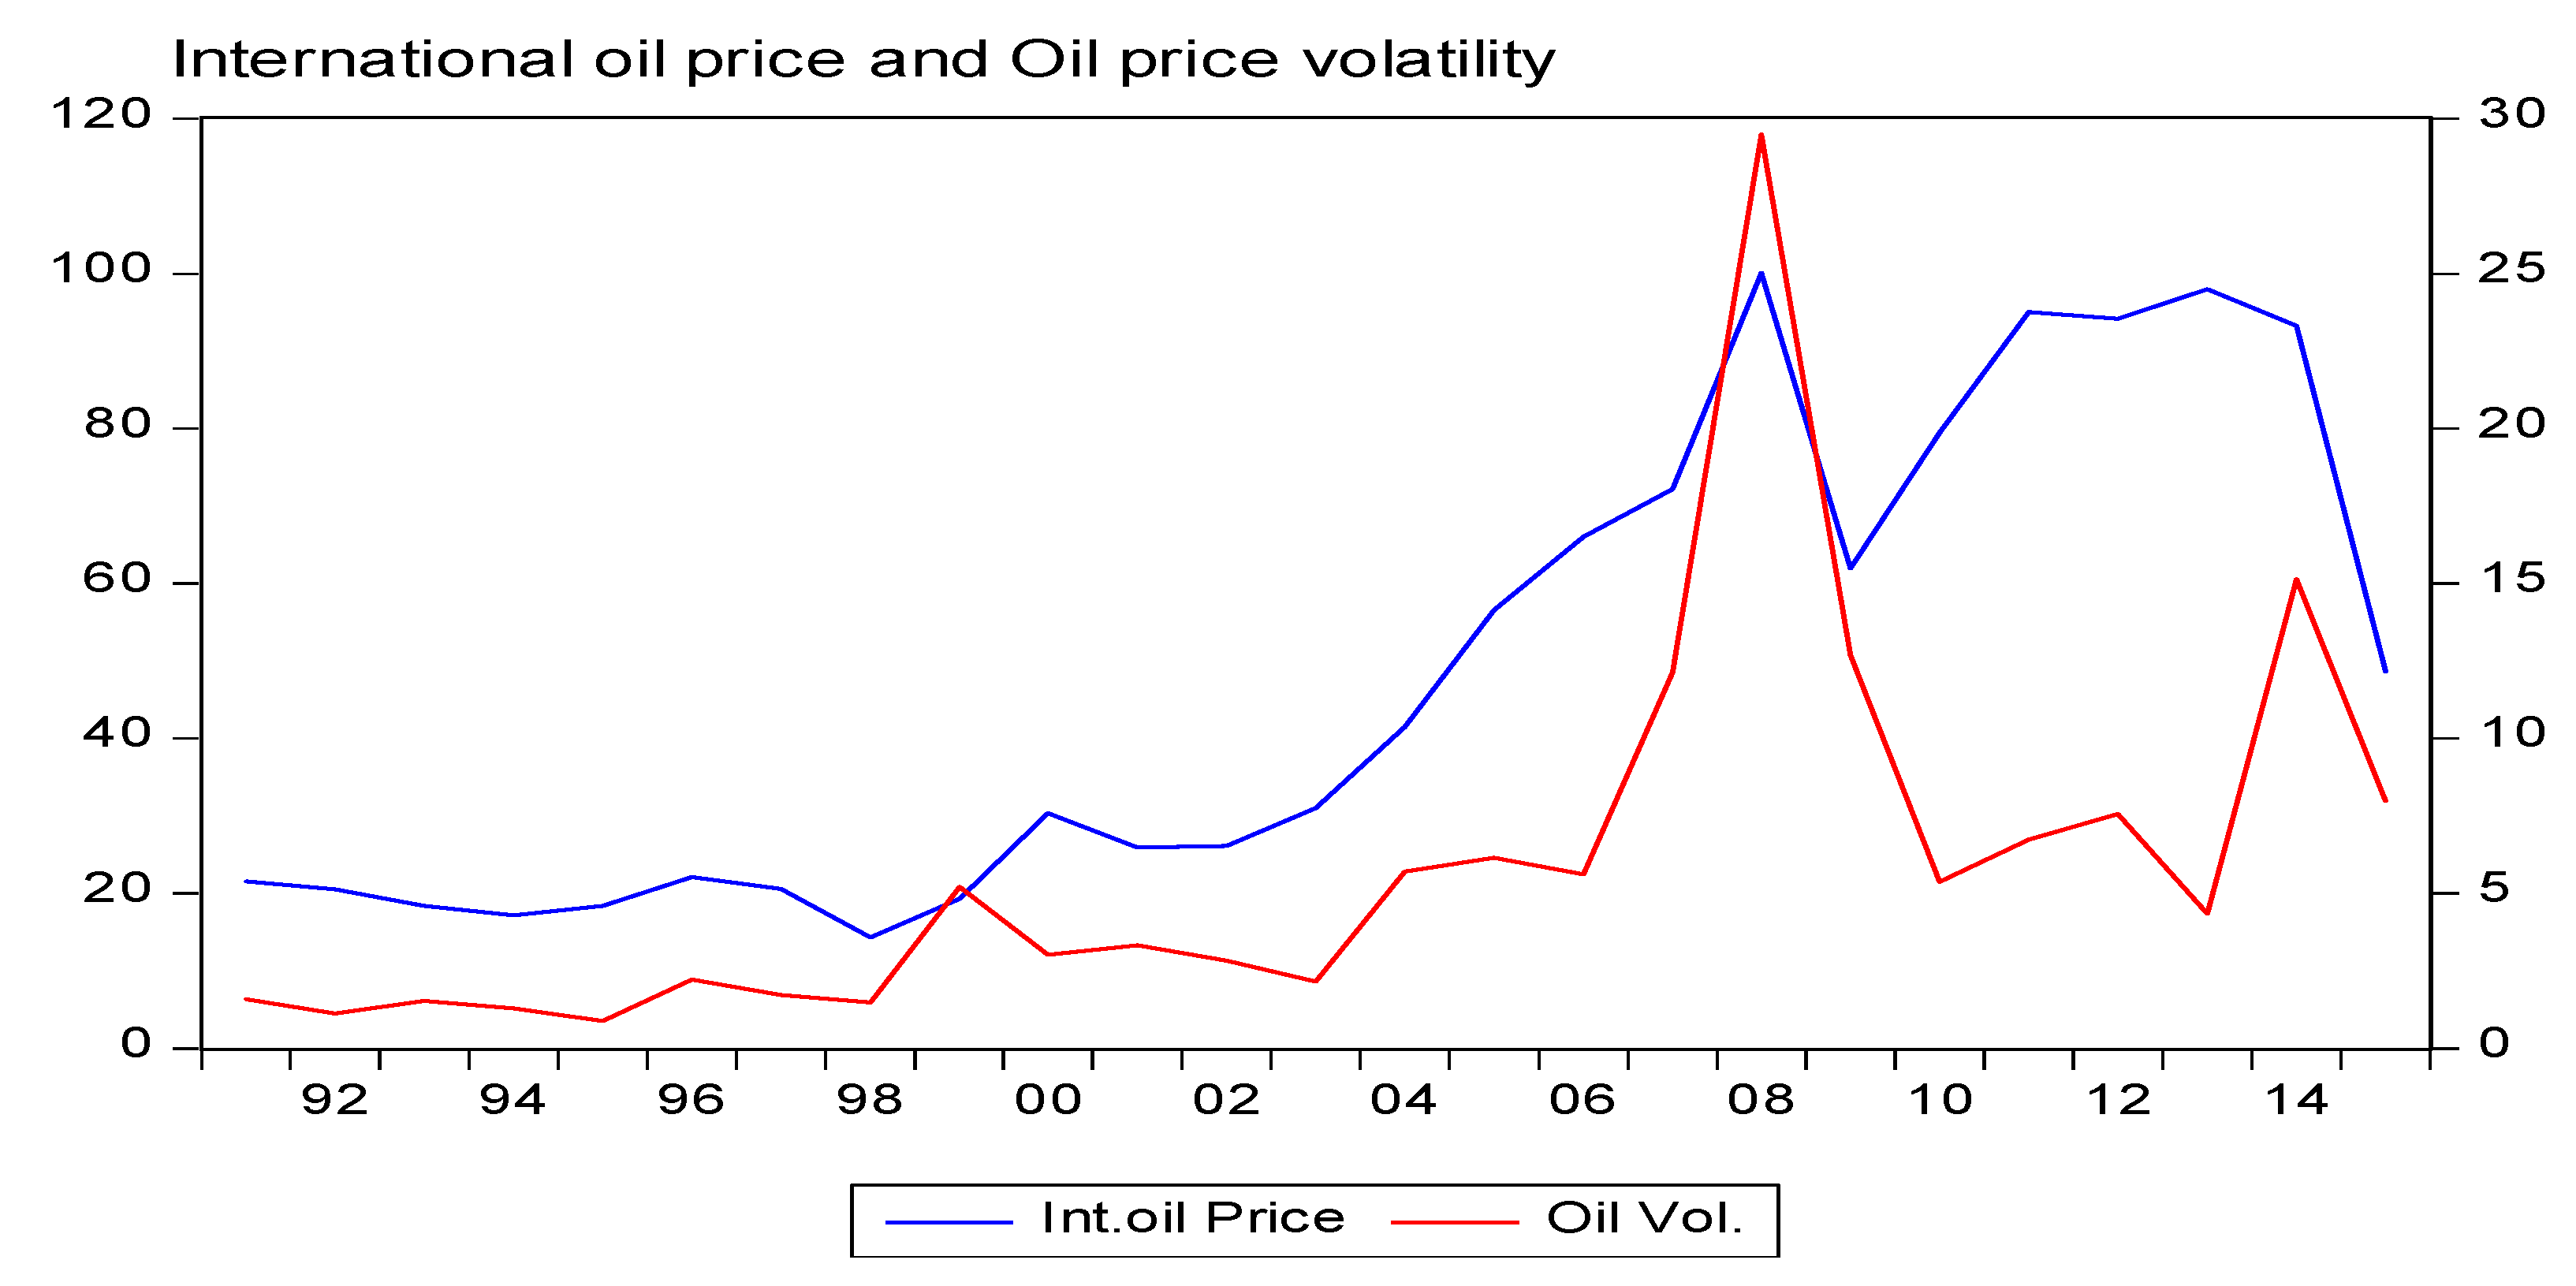
The descriptive statistics also depict that the average spending for R&D of the oil-exporting countries is lesser with a higher standard deviation, indicating increased variability between the highest and lowest spending for R&D than the other economies considered. The global oil price volatility shows a mean of 5.894026 with a variation of 6.233023 between the highest and lowest volatility and annual average increments of 6.956. Moreover, the crude oil price value indicates a mean price of 48.72791, a standard deviation from the mean 34.13862 and an average yearly growth rate of 4.093 (see
Figure 1). The price and the volatility values may not represent the oil-exporting countries’ selling price trajectories inside their premises. The rentier states’ sociological thoughts, oil-exporting countries and oil-resource-abundant countries’ subsidy deviate the domestic oil fuel selling price from the international market price. Thus, the effect of oil price and its volatility may differ significantly between oil-importing and -exporting countries [
4,
5,
12,
51,
52].
As illustrated in
Figure 2, the total GHG emission trend for the USA and EU has declined considerably. In contrast, the total emission trend kept increasing for China, including Hong Kong and oil-exporting countries. Though the countries’ share differs, the GHG emission graph of EU countries (26) depicted more than 17.1% of the 1992 emissions in 2015. Simultaneously, China and the oil-producing countries are skyrocketing the emissions with their increasing trends by contributing more than 43.39% and 29.9% in 2015 compared to the 1992 emissions. In terms of total emission, the USA is the most significant GHG and CO
2 emitter. Its total anthropogenic greenhouse gas emissions in 2007 were above 7.2% of the 2008 level and more than 10.8% of the 2015 total (
Figure 2). The decline in the USA’s total emissions from 7,244,272 million metric tons of carbon dioxide equivalent (MMTCO
2e) in 2008 to 6,648,991 MMTCO
2e in 2009 was the biggest since 1992. We can also infer from the graph that despite the USA pulling out from the Paris environmental agreement, the USA’s historical GHG emission peak is expected to remain lower than the historical rise of 2007.
As a supporting summary of the results, we calculated the correlations between GHG emissions, economic growth, R&D spending, oil price and oil price volatility. We can see from the results in
Table 2 that GHG emission is positively correlated with R&D spending. However, the correlation between GHG emission and R&D spending was negative for the EU (EU column 1, row 2). This may indicate a less polluting energy policy in the EU economy compared to the others. The correlation between economic growth measured by GDP per capita and GHG emission shows a positive result, signposting the positive correlation between economic growth and GHG emission.
Nevertheless, the correlation result depicts a weaker effect in the EU than in the USA, oil-exporting countries and China. The other important emphasis is on the correlation between international oil price volatility, international crude oil price and GHG emission. The estimations show that the result of the EU is negative; contrarily, the correlation effect of oil-exporting countries is positive, depicting an increase in oil price, and its volatility correlates with GHG emission. Regardless of the statistical significance, the correlation results of the GDP, R&D spending, oil price and the international oil price volatility with GHG emission do not worry us. It only depicts pairwise relationships of the variables rather than casual relationships. Hence, we kept the issue in mind while performing the econometric and the robustness estimations presented in the following section.
Model Specification
In panel and time series models, it is common to test stationarity using unit root tests. Thus, before undertaking the econometric estimation, we performed a series of panel unit root tests using the first-generation tests of Levin–Lin–Chu (LLC), Im–Pesaran–Shin (IPS), Augmented Dickey–Fuller (ADF)-Fisher and Phillips–Perron (PP)-Fisher. We also included the second-generation panel unit root test of (Pr) [
53], which considers the series’ cross-sectional dependence. All variables are stationary, and we reject the null hypothesis of unit roots at a 1% significance level at the first difference (see
Appendix A).
5. Econometric Analysis and Results
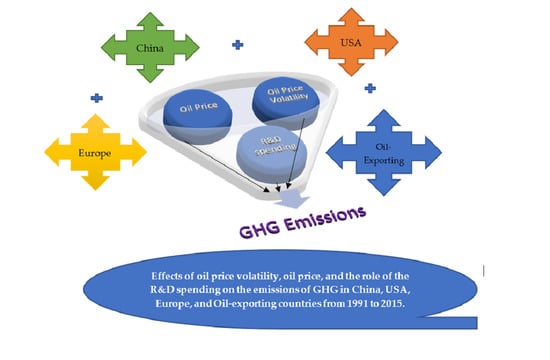
In this study, the effects of oil price volatility, oil price, economic growth and the role of R&D spending on the emissions of GHG are assessed using Driscoll and Kraay econometric estimation in oil-exporting and -importing countries from 1991 to 2015. Based on the CIA fact report of 2017, countries’ levels of oil export and import are considered to classify the economies as oil-importing and -exporting. Due to the various levels of commitment to diminish CO
2 emissions and the level of energy utilization as well as the status of fossil fuel production, the oil-importing countries are classified into three groups; the Chinese economy (including Hong Kong), the EU economy and the USA. Furthermore, combining the estimation of oil-exporting and -importing countries may generate biases as well as spatial and temporal correlation errors and heteroscedasticity [
54]. Several explanations such as omitted variables, errors in variables and, in particular, a potential simultaneous causality between GHG emission and economic growth are given to be the underlying reasons to believe that economic growth measures are correlated with the error term [
54]. Hence, we suppose that this study fills the methodological gap by assessing the nexus using different perspectives and competent methodologies. Furthermore, the technique used in this study, i.e., Driscoll and Kraay [
55], considers the spatial and temporal correlation problem and provides standard errors’ robustness to heteroscedasticity and serial correlation. The Driscoll and Kraay technique estimate the factors by allowing variables with a lag to control the possible endogeneity issues between variables [
56,
57]. Hence, we extend the analysis by taking the main factors of the study made by Fernández, López and Blanco [
31] and expanding the analysis by categorizing the economies in oil-exporting and oil-importing countries.
The oil-exporting countries comprise 22 oil-exporting countries of the world (the list is annexed), and the oil-importing countries are EU (26) member countries, China, including Hong Kong, and the USA (the complete list of the countries is annexed). The independent variable considered is the spending on research and development (R&D), per capita economic growth and oil price and oil price volatility. The oil price and oil price volatility effect perhaps provide a better picture of the market effect on stabilizing GHG emissions and ensuring environmental improvement between the different economies. For these reasons, international crude oil spot prices (Brent) together with the international crude oil price volatility are used. Moreover, due to the availability of data and direct co-integration between economic growth and CO
2 emission [
34,
45], the study considers economic growth (per capita GDP) as an explanatory variable instead of the total energy consumption. The model deployed to estimate the impacts of the independent variables is as follows:
where R&D is a dummy variable representing the gross spending on research and development, Vol is the international oil price volatility, OP is the international oil price/international spot crude price (Brent) and GDP represents the per capita GDP;
i and
t represent the country and time, respectively;
ε is the error term, which is not explained by the study. All the variable’s logarithms, except the R&D dummy variable, are taken to allow us to interpret in terms of elasticity. Hence, the model is estimated as follows:
Table 3 shows a highly significant value (at least at 95% confidence level) with strong predictions (R-square). The effect of R&D is negative and statistically significant for oil-importing economies; this result indicates, keeping other things constant, that a one percent marginal increment in R&D tends to decrease the emission of GHGs by 0.333, 0.246 and 0.154 in the USA, China and EU economies, respectively. This implies that when R&D spending increases, the emissions of GHGs in oil-exporting countries increase. The results indicate that GHG emission is exacerbating the effect of innovation in oil-exporting economies. Contrarily, the result of R&D depicts a negative and significant effect in oil-exporting countries. Ceteris paribus, a one-unit increase in R&D spending increases the emission by 0.320 in oil-exporting countries. The result of the oil-exporting countries contradicts the finding of Ulku [
26], which validated innovation in the R&D sectors. In this case, the representation of innovation in the oil-exporting countries does not seem to find energy-efficient, alternative energy sources and technologies; rather, it indicates investment that accelerates consumption and emission levels in the countries.
The outcome of GDP, regardless of the classification of countries, is positive and significant. Closer observation may provide us with the different impacts of GDP on the emission levels of the economies. The oil-exporting countries exert the highest emissions, followed by China and the USA. The EU countries depict a lesser impact due to economic growth. This probably implies that the EU economy is better positioned regarding environmental sustainability and uses less polluting energy sources comparatively. Contrarily, the oil-exporting countries seem to depend highly on unsustainable energy sources and show an inability to enact GHG emission-abating initiatives that may reduce the emission level. The estimation also depicts that a one-unit increase in GDP increases GHG emissions by 0.7%, keeping other things constant.
The other important factor found to affect the emission level of GHG is the oil price. With the oil price increase, the oil-exporting countries were found to increase GHG emissions. This perhaps comes with the effects of oil revenue on the per capita energy utilization of the countries. As oil-exporting countries’ economies are tied to oil revenue, the energy utilization and, perhaps, their economic growth are tied with oil price increment; thus, the increment in GHG emissions with the price increment undeniably makes sense. Hence, a one-unit increase in oil price in the oil-exporting economies increases GHG emissions by 0.012%.
On the other hand, the oil importing countries’ case shows a significant deviation from the oil-exporting countries as they indicate a negative and significant coefficient. For instance, the USA economy showed, for a 1% increment in oil price, a decrease of 0.012% in GHG emissions. Similarly, the Chinese economy responded by decreasing 0.010% of GHG emissions. Contrarily, the EU economy shows an insignificant and negative value for the international oil price increase. Though the result calls for further analysis, the negative and insignificant value may indicate how the EU economy is alienating from the unsustainable energy source.
Unlike oil price, oil price volatility shows a negative and significant effect regardless of the type of economy. Oil price volatility, therefore, seems to reduce the emissions of GHGs. Moreover, the result describes a significant and very high impact in oil-exporting countries. Keeping other things constant, a one-unit change in price volatility induces a reduction of 0.138% in GHG emissions in oil-exporting economies. Similarly, the effect of a 1% increase in volatility in the EU, USA and China reduces GHG emissions by 0.106, 0.020 and 0.101, respectively. The result also supplements Vielle and Viguier’s [
9] famous citation of Eberhard Rhein’s writing in the International Herald Tribune (31 August 2005). Thus, comparatively, one can contend the effect of oil price volatility on reducing GHG emissions more than other policy measures.
Furthermore, as described above, even though the Driscoll–Kraay technique addresses the endogeneity bias, the instrumental variable technique, it is also relevant to triangulate the estimations using a competent econometric model. Therefore, the generalized method of moments (GMM) was used for robustness estimation. The
p-value of the Durbin chi-square test and Wu–Hausman F test was 0.008 and 0.009, respectively, indicating that GDP is endogenous in the model. Hence, to address the underlying problems with the data, an extension of the GMM-Differenced of the robust estimator of [
58] with the addition of a two-year lag value of the dependent variable (GHG) was used. This is assumed to describe the effects of past emission-abating policy efforts. Furthermore, the effect of spending on R&D does not occur instantly; hence, taking a two-year delay may provide ample time to capture the effects of spending on R&D and price volatility on the environment.
According to the GMM-Differenced estimator, the AR (2) tests support the validity of the estimator, implying that the model does not suffer from over-identification [
59,
60].
Table 4 presents the results of the new model estimation with the inclusion of a two-year lag.
Table 3 and
Table 4 provide important results of the estimations used. Looking closely at the results of price volatility, one can identify that the effects in oil-importing and -exporting countries remain negative and statistically significant on GHG emissions. Quantitatively, the results do not show significant variation among the different economies considered in the study and are robust under the GMM-Differenced estimation. This implies that, environmentally, the effect of oil price volatility is benign. Holding other things constant, the coefficient indicates at least a one percent increase in oil price volatility decreases GHG emissions by 0.021% (
Table 3, the case of the USA). In line with this, Troster et al. [
61] also found that volatility in oil prices changes energy consumption and, in the long-term, is leading to a shift in the source of energy in the USA.
Table 4 shows that all oil-importing countries have a statistically negative and significant coefficient of R&D spending, and it supports the findings of [
22,
31]. The paradigm of expenditures on R&D enhances the invention of alternative technologies by replacing the outdated technologies and inventing efficient alternative technologies and environmentally friendly energy sources [
26]. Such progress, together with the perverse price and volatility of non-renewable energy sources, may considerably cut GHG emissions.
Contrarily, the results of R&D in oil-exporting countries show a positive and significant effect on GHG emissions. This conceivably coincides with the abundant availability of fossil fuel, its potential and the level of countries’ dependency on it. Perhaps this is impeding their progress towards sustainability. Aligned with this, Brutschin and Fleig [
22] identified an association between increasing fossil fuel rent and decreasing innovation in oil-exporting economies. Furthermore, most of the rentier states provide a subsidy on oil prices in the domestic market [
12]. Hence, the economy may not improve GHG emissions in the short term with R&D spending and innovation. Even though the finding invites further empirical studies, it is also possible to hypothesize that innovation in oil-exporting countries does not equip them for finding alternative energy sources and technologies, discouraging the oil-exporting countries’ effort at emancipating from the resource curse through slowing down their innovation efforts.
Regarding the GDP, the economic growth of the oil-exporting countries directly affects the level of GHG emissions, supporting the empirical finding of Begum, Sohag, Abdullah and Jaafar [
45], which identifies a long-term positive co-integration between the GHG emissions and economic growth of Malaysia. The relationship between GDP and GHG emissions also signals a strong correlation (see
Table 2). Hence, intuitively, the economic growth level indicates a long-term effect on total emissions in oil-exporting countries.
Table 4 also correspondingly shows the positive and significant GDP coefficient at a 99% significance level in China, the USA and the EU economies and 95% for the oil-exporting countries. However, comparatively, China, followed by the USA, reflects the highest effect on total emissions. The extent may, perhaps, relate to the source of energy and the level of production in the economy. The result is robust using the alternative econometric estimation.
On the one hand, the effect of oil price on GHG emissions is negative and significant in China, the USA and EU countries. Contrarily, the impact of oil price on total GHG emissions is positive and significant in exporting economies; the oil-exporting countries increase GHG emissions by 0.067% as the oil price increases by one dollar per barrel. On the other hand, the effect of oil price volatility supplements the results in
Table 3. It shows a negative and significant impact at 99% for China, the USA and the EU and 95% for oil-exporting economies. The coefficient is nearly similar across all of the economies, indicating that every one-unit increase in oil price volatility decreases the emissions by 0.021%.
The results of both models suggest that the oil price volatility abates the GHG emissions across all the observed economies. Hence, volatility may raise the attractiveness of renewable energy sources and lower that of unsustainable energy sources. However, even though oil price increase decreases the emission level, its effect begins in oil-importing countries, given that the economies of oil-exporting countries depend on the price of oil in the international market. Due to the domestic market’s subsidy, the increase in oil price may not have a soothing effect to decrease GHG emissions. Both models’ results are robust in indicating that the rise in oil price reduces GHG emissions in oil-importing countries and, contrarily, its positive effect in increasing GHG emissions in oil-exporting countries. Thus, our result’s comprehension is clear: an oil price increase is likely to be beneficial for the environment, but the economies’ contributions largely depend on the endowment and the level of availability of oil resources. Thus, it is possible to say that the oil-exporting countries do not have a strong incentive to change their source of energy and productions to more sustainable ones due to international oil price increase. Furthermore, unlike the oil-importing countries, the transformation to sustainable energy may be costly in oil-exporting countries.
6. Conclusions
Our study should be considered within the literature on energy consumption, international oil price, innovation and environmental sustainability. Regarding the GHG emission analysis, extensive literature was devoted to finding meaningful leaps towards policy measures, alternative efficient energy resources and technology as a way out of the phenomenon of climate change. This work aimed to analyze the implications of innovation, oil price, oil price volatility and economic growth regarding GHG emission reduction. For this, the Driscoll–Kraay econometric estimation was used to assess the effect of R&D spending, oil price, oil price volatility and economic growth on GHG emissions in major oil-exporting and oil-importing countries over 24 years (1991–2015). The countries were classified to vividly identify and compare how oil-exporting and -importing countries respond to the factors’ changes, thereby observing the contribution of each element to GHG emission reduction. Moreover, to check the robustness of the results and the superior advantage of addressing the problems of reverse causality between variables, the study used the GMM-Differenced econometric model.
The main empirical results point to a favorable implication between public expenditures in R&D and GHG emission reduction in oil-importing economies. Specifically, the estimation shows that EU countries use fewer polluting sources than China and the USA. Our results also strongly recommend the relevance of long-term policy objectives in R&D capacities’ development and commitment to implementing the international environmental agreement in the importing economies of EU, China and the USA to abate GHG emissions. The transformation of technologies and innovation to alternative technologies may facilitate the swift transitions of energy sources and thereby diminish climate change.
Contrarily, the effect of R&D spending has a positive impact on GHG emissions in oil-exporting economies. Even though further explicit assessment is required, the R&D in oil-exporting economies is not geared towards energy-efficient technologies that effectively reduce GHG emissions.
In this study, there was a limitation in using a dummy variable for R&D spending. Though the use of a dummy may limit our policy statement and may pose uncertainty [
62], it is possible to identify many implications for policymakers regarding abating GHG emissions. It is crucial to note that countries that initiate a policy that encourages innovative activities can enhance environmental stewardship. It is also necessary to increase the specific focus on oil-exporting countries to enable their public efforts on R&D geared towards improving environmental sustainability and sustainable development.
The results of oil price and oil price volatility also indicate broader implications on GHG emission reduction. In this case, two important implications are self-evident. The effect of oil price shows an asymmetrical impact between oil-exporting and -importing economies. The result identifies that oil price has an augmenting effect on emissions in oil-exporting countries, while the importing countries reduce their emission levels with the price increase. Thus, it is possible to say that the oil-exporting countries do not have a strong incentive to change their consumption of unsustainable energy sources and diminish GHG emissions due to price escalation.
Moreover, unlike oil-importing countries, oil-exporting countries do not change their energy source to more environmentally friendly energy sources, and the transformation to alternative energy sources may be costly in these countries. Unlike the oil price, the oil price volatility has a nearly similar effect between the exporting and importing economies. Thus, one might be tempted to take the volatility and the future uncertainty in oil price as a virtuous instance rather than oil price increment. Hence, high oil price volatility has a beneficial impact on climate change by forcing both producers and consumers to change their emission behaviors.
In both cases of oil-exporting and -importing countries, the effect of economic growth is empirically shown to provoke an increase in GHG emissions. It indicates that the rise in economic growth increases the GHG emissions across economies and does not have a welfare effect on climate change-abating initiatives. Hence, it should be noted that even though there are positive effects in innovation, oil price and oil price volatility with abating emissions of GHG, the cumulative effects are not adequate to counterbalance the adverse effect of economic growth. Thus, there is a need to devote more resources and efforts to carry out additional measures that promote sustainable resources and technologies. The best way to deal with the emissions may not come solely through the orthodox way of policy measures. Indirect market forces such as the international price volatility and oil price fluctuations may deliver much broader and better results than policy measures.
As for the relevant research in the future, further studies should be conducted with better detail on the dichotomies of countries. It would also be beneficial to analyze the different effects of public and private innovation activities, as there is a significant difference in their impacts and distributions between countries. Likewise, since other economic sectors and diverse energy sources are not evenly distributed across regions and countries, it will be interesting to investigate the effect of commonalities on GHG emission.


 ,
, 


