
Optimal Siting and Sizing of Distributed Generators by Strawberry Plant Propagation Algorithm


1
Department of Electrical and Computer Engineering, Abbottabad Campus, COMSATS University Islamabad, Abbottabad 22060, Pakistan
2
Department of Mechanical Engineering, Wah Campus, COMSATS University Islamabad, Wah 47040, Pakistan
*
Author to whom correspondence should be addressed.
†
These authors contributed equally to this work.
Energies 2021, 14(6), 1744; https://doi.org/10.3390/en14061744
Submission received: 4 February 2021
/
Revised: 12 March 2021
/
Accepted: 15 March 2021
/
Published: 21 March 2021
(This article belongs to the Special Issue Design and Implementation of New Control Schemes for Renewable Energy Systems)
Abstract
:Increasing the unplanned penetration of Distributed Generators (DGs) has spurred active and reactive power losses in the distribution system. This article suggests using a novel Strawberry Plant Propagation Algorithm (SPPA) for planning the placement of the DGs with the aim of reducing the network (active) power losses and improving the overall voltage profile. The proposed method (SPPA) has been tested on 33 and 69 node radial systems in MATLAB. A cost analysis was also performed and compared with other contemporary methods. The results for the considered variables show the significance of the proposed method in comparison to various other counterparts, including the Mine Blast Algorithm and Particle Swarm Optimization.
1. Introduction
The exponential increase in world population has resulted in a high consumption of electricity through industrial and domestic load [1]. Due to the high power density demand and high stress on the power system, it faces challenges such as energy loss, low voltage profile, and the low efficiency of the system. The optimal strategy for a conventional power system is to keep the voltage and frequency within the prescribed limits. State variables such as voltage or frequency usually exceed the prescribed limits due to rapid changes in loads or generations.
Consequent to the increasing investment in (renewable) distributed generation due to incentivizing drives led by various governments, Distributed Generators (DGs) are popping-up very rapidly. The lack of planning and the limited control of Distribution Network Operators (DNOs) in the placement of DGs are seen as major challenges in modern power distribution networks [2]. The need for detailed planning while considering all factors (such as the availability of primary energy for renewable DGs, land, and connection requirement to the main grid) affecting the optimal locations and sizing of DGs is suggested. It is also noteworthy that DG placement results in a completely different scenario of operation and control of distribution networks. Due to the installation of DGs, whether planned or unplanned, DNOs and DISCOsface numerous challenges. The controlling of power systems with DGs; the modeling and design of microgrid/multi-microgrids—e.g., [3,4]; and the trading in and operation of electricity markets—e.g., [5]—are also crucial factors that need to be included in planning. If such factors can also be included in the comprehensive planning of active distribution networks, the operation can be further facilitated. Optimally planned DG systems usually remain in order and do not exceed the prescribed limits [6].
Power systems usually have lagging power factors due to the inductive nature of most loads. With a lagging power factor, an increase in the flow of reactive currents occurs in conductors, leading to the rise of total power losses and deteriorated voltage profiles. Reducing the active power losses in distribution networks is an inspiring job for many utilities around the world [7]. DGs are extensively used due to their ability to improve the voltage profile, reduce active power loss, compensate for the reactive power, correct the power factor, and increase the feeder capacity in distribution systems [8]. The reduction in power losses occurs due to minimized current flow in the conductors [9]. To obtain this and numerous other related benefits including deferring the investment on grid reinforcement, improved hosting capacity, reducing continuous investment on transmission lines, system reliability and loadability enhancement, and the better controlling of the grid, the optimal placement of DGs in electrical distribution networks uses a widely studied technique [10,11]. To minimize the losses effectively, the appropriate size and location of DGs to be placed within the allowable limits of operational constraints must be determined [12]. Based on the output power, DGs can be classified into four types:
- Type 1:
- Injects active power into the system;
- Type 2:
- Injects both active and reactive power into the system;
- Type 3:
- Injects active power but absorbs reactive power;
- Type 4:
- Injects reactive power only.
Transmission network congestion and technical performance deterioration are the basic motivation behind the integration and consideration of the DG-Type 1 considered in this work.
Solving this optimization problem involves power flow solutions, which are nonlinear in nature. This causes the DG planning problem to be a non-convex combinatorial optimization problem, despite the fact that the planning variables (size and location) are discrete in nature [13]. There can be several local optima and a single global optimal solution [12]. Such non-convex, nonlinear, and combinatorial problems are not easily solved using conventional mathematical methods [13]. It also noteworthy that there can be several pros and cons related to any meta-heuristic optimization algorithm; hence, looking for the best algorithm may be considered pointless [14]. The efficacy of any algorithm depends on the nature of the problem being solved. Due to these reasons, optimization problems are usually solved with number of algorithms in order to find the method with the best efficacy [15].
In the recent past, numerous studies have attempted to achieve loss mitigation using optimal DG placement. A comprehensive list of studies considering power loss minimization as a planning objective is given in [16]. In all the listed methods, the minimization of losses has been achieved through the selection of the optimal size and site of DGs—i.e., the planning variables. The optimization techniques applied to this problem are broadly classified as analytical, classical, artificial intelligence (AI), and metaheuristic techniques [17]. A comprehensive review of the methodologies and techniques which are implemented, along with their classification and pros and cons, is given in [17,18].
The optimal placement of DGs is achieved using load concentration factor (LCF) and the optimal number of DGs and their sizes using an exact loss formula through analytical expression is executed in [10]. In [19], it is stated that resistance to reactance ratio escalates in a distribution network and thus paves the way for losses. Multiple optimization techniques have also been used to execute the optimal siting and sizing of DGs. The optimal placement of DGs and sizing has been solved by a simulated annealing algorithm (SA) [20] and genetic algorithm (GA) [21], but with a higher convergence time and less accuracy when high-quality results are required. The particle swarm optimization algorithm (PSO) [22] suffers from partial optimization, due to which its velocity and direction is not maintained and it is inefficient for large and complex systems. In the firefly algorithm (FA) [23], cuckoo search algorithm (CSA) [24], and bat algorithm (BA) [25], the convergence rate is very much affected by the adjustment of parameters, which is always needed in such problems. The local convergence and speed are lethargic in algorithms such as the flower pollination algorithm [26], the bacterial foraging optimization algorithm (BFOA) [27], the ant lion optimizer (ALO) [28,29], the Grey Wolf Optimizer (GWO) [30], the whale optimization algorithm (WOA) [31,32], and the harmony search algorithm (HSO) [33]. In the backtracking search optimization algorithm (BSOA) [34], difficulty is faced in global convergence. The MINLP, introduced in [35], is easy to implement; however, it is very difficult to reduce models into set of linear equations. In [36] parallel population based incremental learning (PPBIL) and particle swarm optimization (PSO) has been implemented in particular problems. During implementation, it was observed that the computation time of the PPBIL algorithm is closely related to the number of workers, which increased the computation time. Moreover, a recent article was published [37] with the objective to achieve the optimal placement and sizing of DG in an AC distribution network. This article uses a hybrid approach of second-order cone programming and discrete sine cos algorithm. However, the computation time taken by the novel approach to solve the problem is higher, and will further increase in complex models.
The Strawberry Plant Propagation Algorithm (SPPA) is a nature-inspired optimization technique. The effectiveness and superiority of SPPA is studied in several engineering problems in terms of function evaluation and found to be better than contemporary methods [15]. The SPPA, being a new method, has not been used in optimal DG placement problems. However, based on its promising results for nonlinear, mixed, and multimodal problems [38], SPPA is preferred for optimizing the placement of DGs in this work.
The article is organized as: A brief literature survey and explanation of the work is given in Section 1, followed by the explanation of the problem, its formulation, the optimization technique (SPPA), and the methodology in Section 2. The results are discussed in Section 3, and the work is concluded in Section 4.
2. Power Loss Reduction and Cost Analysis Formulation
2.1. Power Loss Reduction
The main objective of research is to minimize the total power loss in radial distribution system through optimal placement and sizing of DGs. Hence, the objective function is formulated as:
where is the real power loss in branch and n is total number of branches. The real power loss for any given branch is calculated as follows:
where is current magnitude in ampere and is resistance at branch i in ohm.
It is noteworthy that the losses depend upon the line current flows, which, in turn, are dependent upon the power injection () over the nodes connected to the lines. Therefore, the target in this study is to choose the values of —i.e., DG size ()—at given number of buses, such that the least is achieved. As a matter of fact, if the whole of a load connected to a certain node is fulfilled by a DG of equal size at the same node—i.e., site—the loss in the network would be zero. However, this is not practically feasible. Therefore, in order to improve the system performance and hosting capacity and achieve various technical benefits by reducing the network power losses, an optimal site and size need to be found. Hence, these are the target variables in this study. To evaluate the impact of site and size of DGs, the Power Loss Reduction (%PLR) is utilized and is given as:
where, and are system losses before and after DG installation. The operation constraints are prescribed as:
and are the real and reactive power output from DGs; n is the total number of DGs to be installed; and are the active and reactive power demands on node; N is the total number of nodes in the system; and are the lower and upper node voltage bounds; is the node voltage; is the flow on line; is the maximum loading limit of line.
2.2. Cost Analysis
The major objective of implementing SPPA for the optimal siting and sizing of DGs is to minimize power losses, which ultimately reduces the operational cost as well as helpsthe grid reinforcement. The installation of DGs helps to reduce the energy intake from external grid, which, in turn, reduces the cost of energy. Moreover, the minimized losses also translates into monetary savings given by Equation (11). The relationships for the input power from the main grid (), the total input energy in one year ( measured in ), the annual cost of energy (), and the percentage of cost reduced () are given by the Equations (8)–(11). Here, is the total loss in electrical network, is the total load connected, is the power injected by DG, and is the cost per .
3. Optimization Using Strawberry Plant Propagation Algorithm
It is fact that pure plants propagate through seeds appearing on their fruits, whereas hybrid plants are mostly infertile in nature. The most common practice in the propagation of hybrid plants is that they send runners. These runners, upon touching the ground, generate new roots, leading to the growth of daughter plant [38]. This process continues and generates new daughter plants where there is available moisture.
As with other techniques, SPPA is also a nature-inspired optimization technique that proceeds in three major steps: initialization, duplication, and elimination. The effectiveness and superiority of SPPA is studied in several engineering problems in terms of function evaluation and found to be better than contemporary methods [15]. It is observed that, due to the similarity in the nature of problem, SPPA offers the best result for particular problems (Optimal Sitting and Sizing of DGs). Analogously to that, each mother plant is randomly generated within the search space. Similarly, the objective function has dedicated constraints in our problem for the optimal siting and sizing of DG. The number of DGs to be installed in a vicinity to minimize losses is randomly placed on nodes. The Strawberry mother plant then generates runners and roots in search of minerals [38]. Similarly, load flow analysis is carried out in given node system to find the losses on each node. Fitness is calculated by each runner and root. Half of the runner and roots vanish due to the non-availability of minerals at their location. Similarly, half of the nodes becomes ineligible for hosting DG, as they are less prone with objective function. Process continues through iterations till the optimal location and size of DG is achieved.
Optimal Placement of DGs Using SPPA
The complete set of steps involved in implementing and solving the optimization problem for optimal DG placement by SPPA is given below:
- Take network input from user and read system data.
- Initialize the algorithm parameters (, , population size , network size, DG type, and variable I to store the results of each iteration).
- Calculate P, Q, V, , and .
- Rank nodes with respect to power losses in descending order.
- Randomly, the number of runners, (i.e., DG Size) generated by a solution should be proportional to its fitness, given as:where is the maximum number of runners that can be generated, r is the binary variable, and is the mapped fitness of the solution.
- Distance covered (Loss) by each runner—i.e., —will be given as:
- The placement of DG is performed through an equation, given as:The values are then adjusted to ensure that new points generated are within the bounds and ; the distance calculated will be used to update the solution i based on the bounds in .
- Calculate and .
- Compare if is less than the previous iteration.
- Update the results stored in variable I (step 2).
- Else existing placement of DG will be remaining stored in variable I.
- Check if , then go to step 13; otherwise, go to step 3.
- Print results, the global optima is found.
4. Results and Discussion
The proposed algorithm is executed for two standard radial test systems (IEEE 33-node and 69-node). The test systems have a standard line configuration with a balanced load connection. It is worth mentioning here that Mine Blast Algorithm is the latest optimization technique and has proved its superiority in efficiently solving the complex optimization problems. Therefore, it is implemented as a part of this work for the comparison of various results. The results for various other optimization techniques have also been taken from recent literature for comparison and validation purposes. The analysis case of the networks without any compensatory devices is termed as the base case.
The introduced SPPA is coded in MATLAB 2017 version. All the simulations are executed on laptop computer with Intel Core i5 4th Generation 2.50 GHz processor, 8 GB RAM, SSD Drive, and a 64-bit operating system.
4.1. 33-Node System
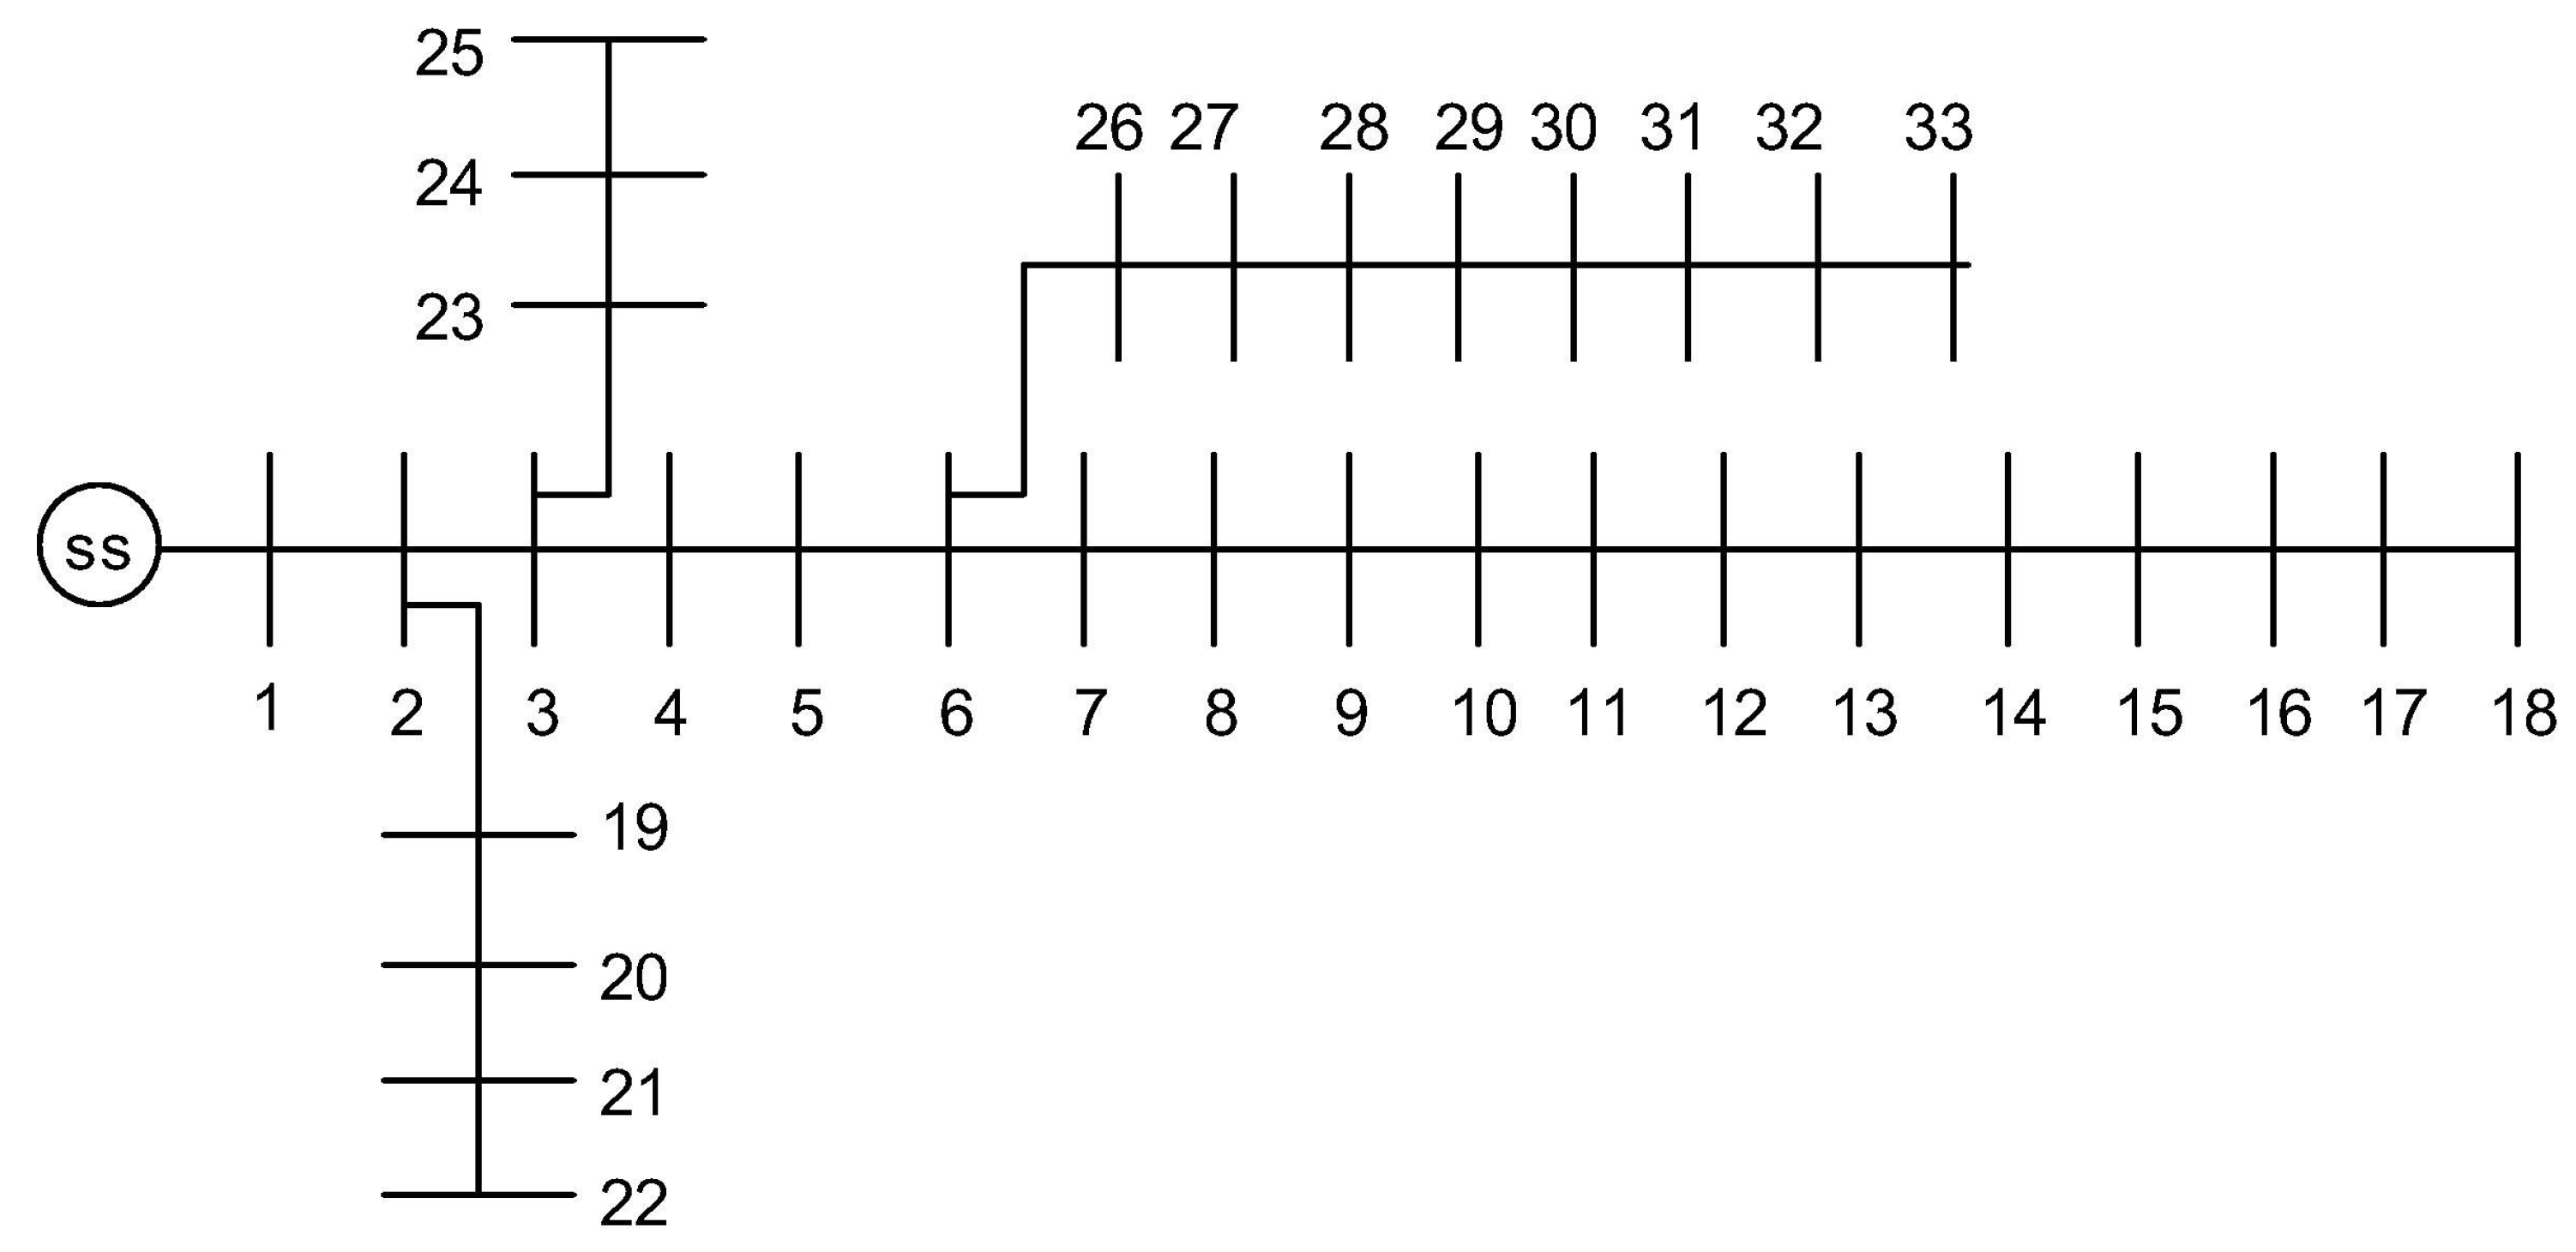
The 33-node radial balanced network, termed as NW-1 and given in Figure 1, has an existing rated load of 3.715 MW and 2.3 MVArs. A step-down transformer connected to node 1 provides 12.66 kV to the network. The feeder characteristics and line data are taken from [39] for NW-1. The power of 100 MVA and voltage of 12.66 kV are considered as base values in network. For NW-1, the losses are 210.99 kW and 143.12 kVAr, and the minimum voltage of 0.9038 pu is observed at node 18 in base case. The computation time for 30 iterations is 54.22 s.
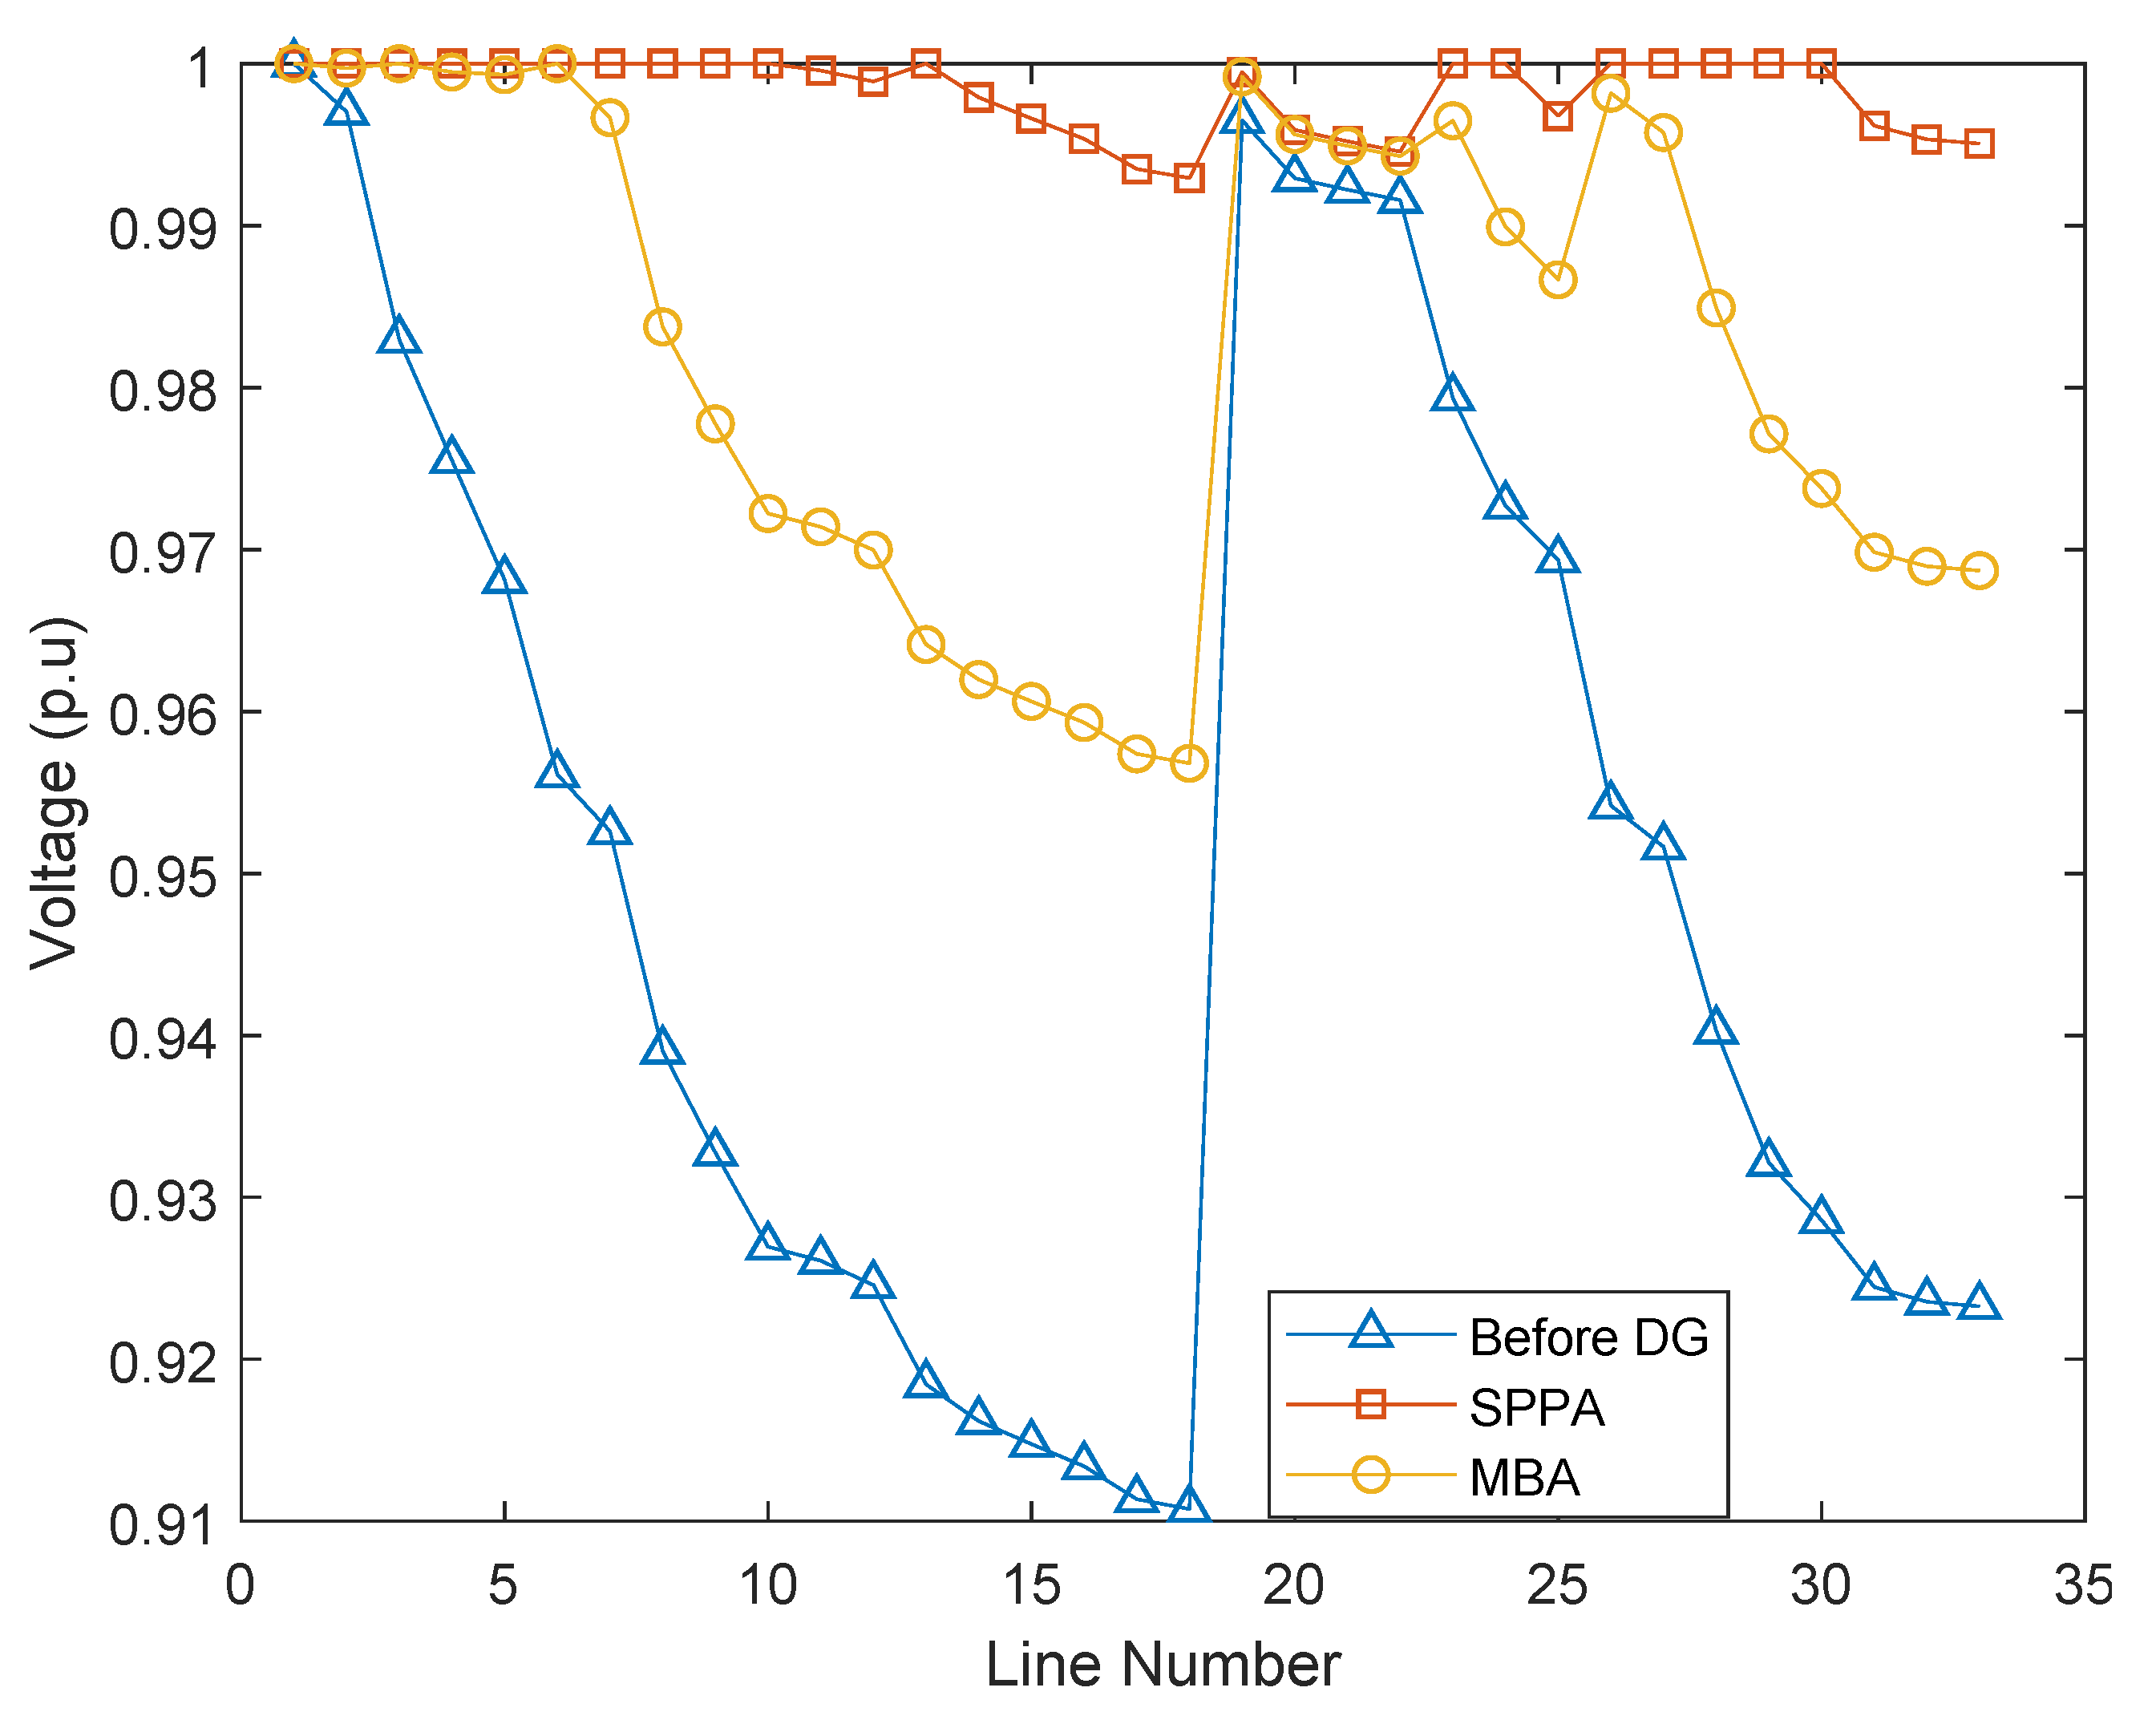
Voltage profile for DG-Type 1 has been compared between SPPA, MBA, and without DG. In this study, the external grid is connected to node 1, which is considered as the reference, and the voltage at node 1 is taken as 1 pu. After the optimal placement of DG with the SPPA technique, a significant improvement in the voltage profile is observed. After the optimal placement, the minimum voltage of 0.9929 pu occurs at Bus 18. These results are shown in Figure 2.
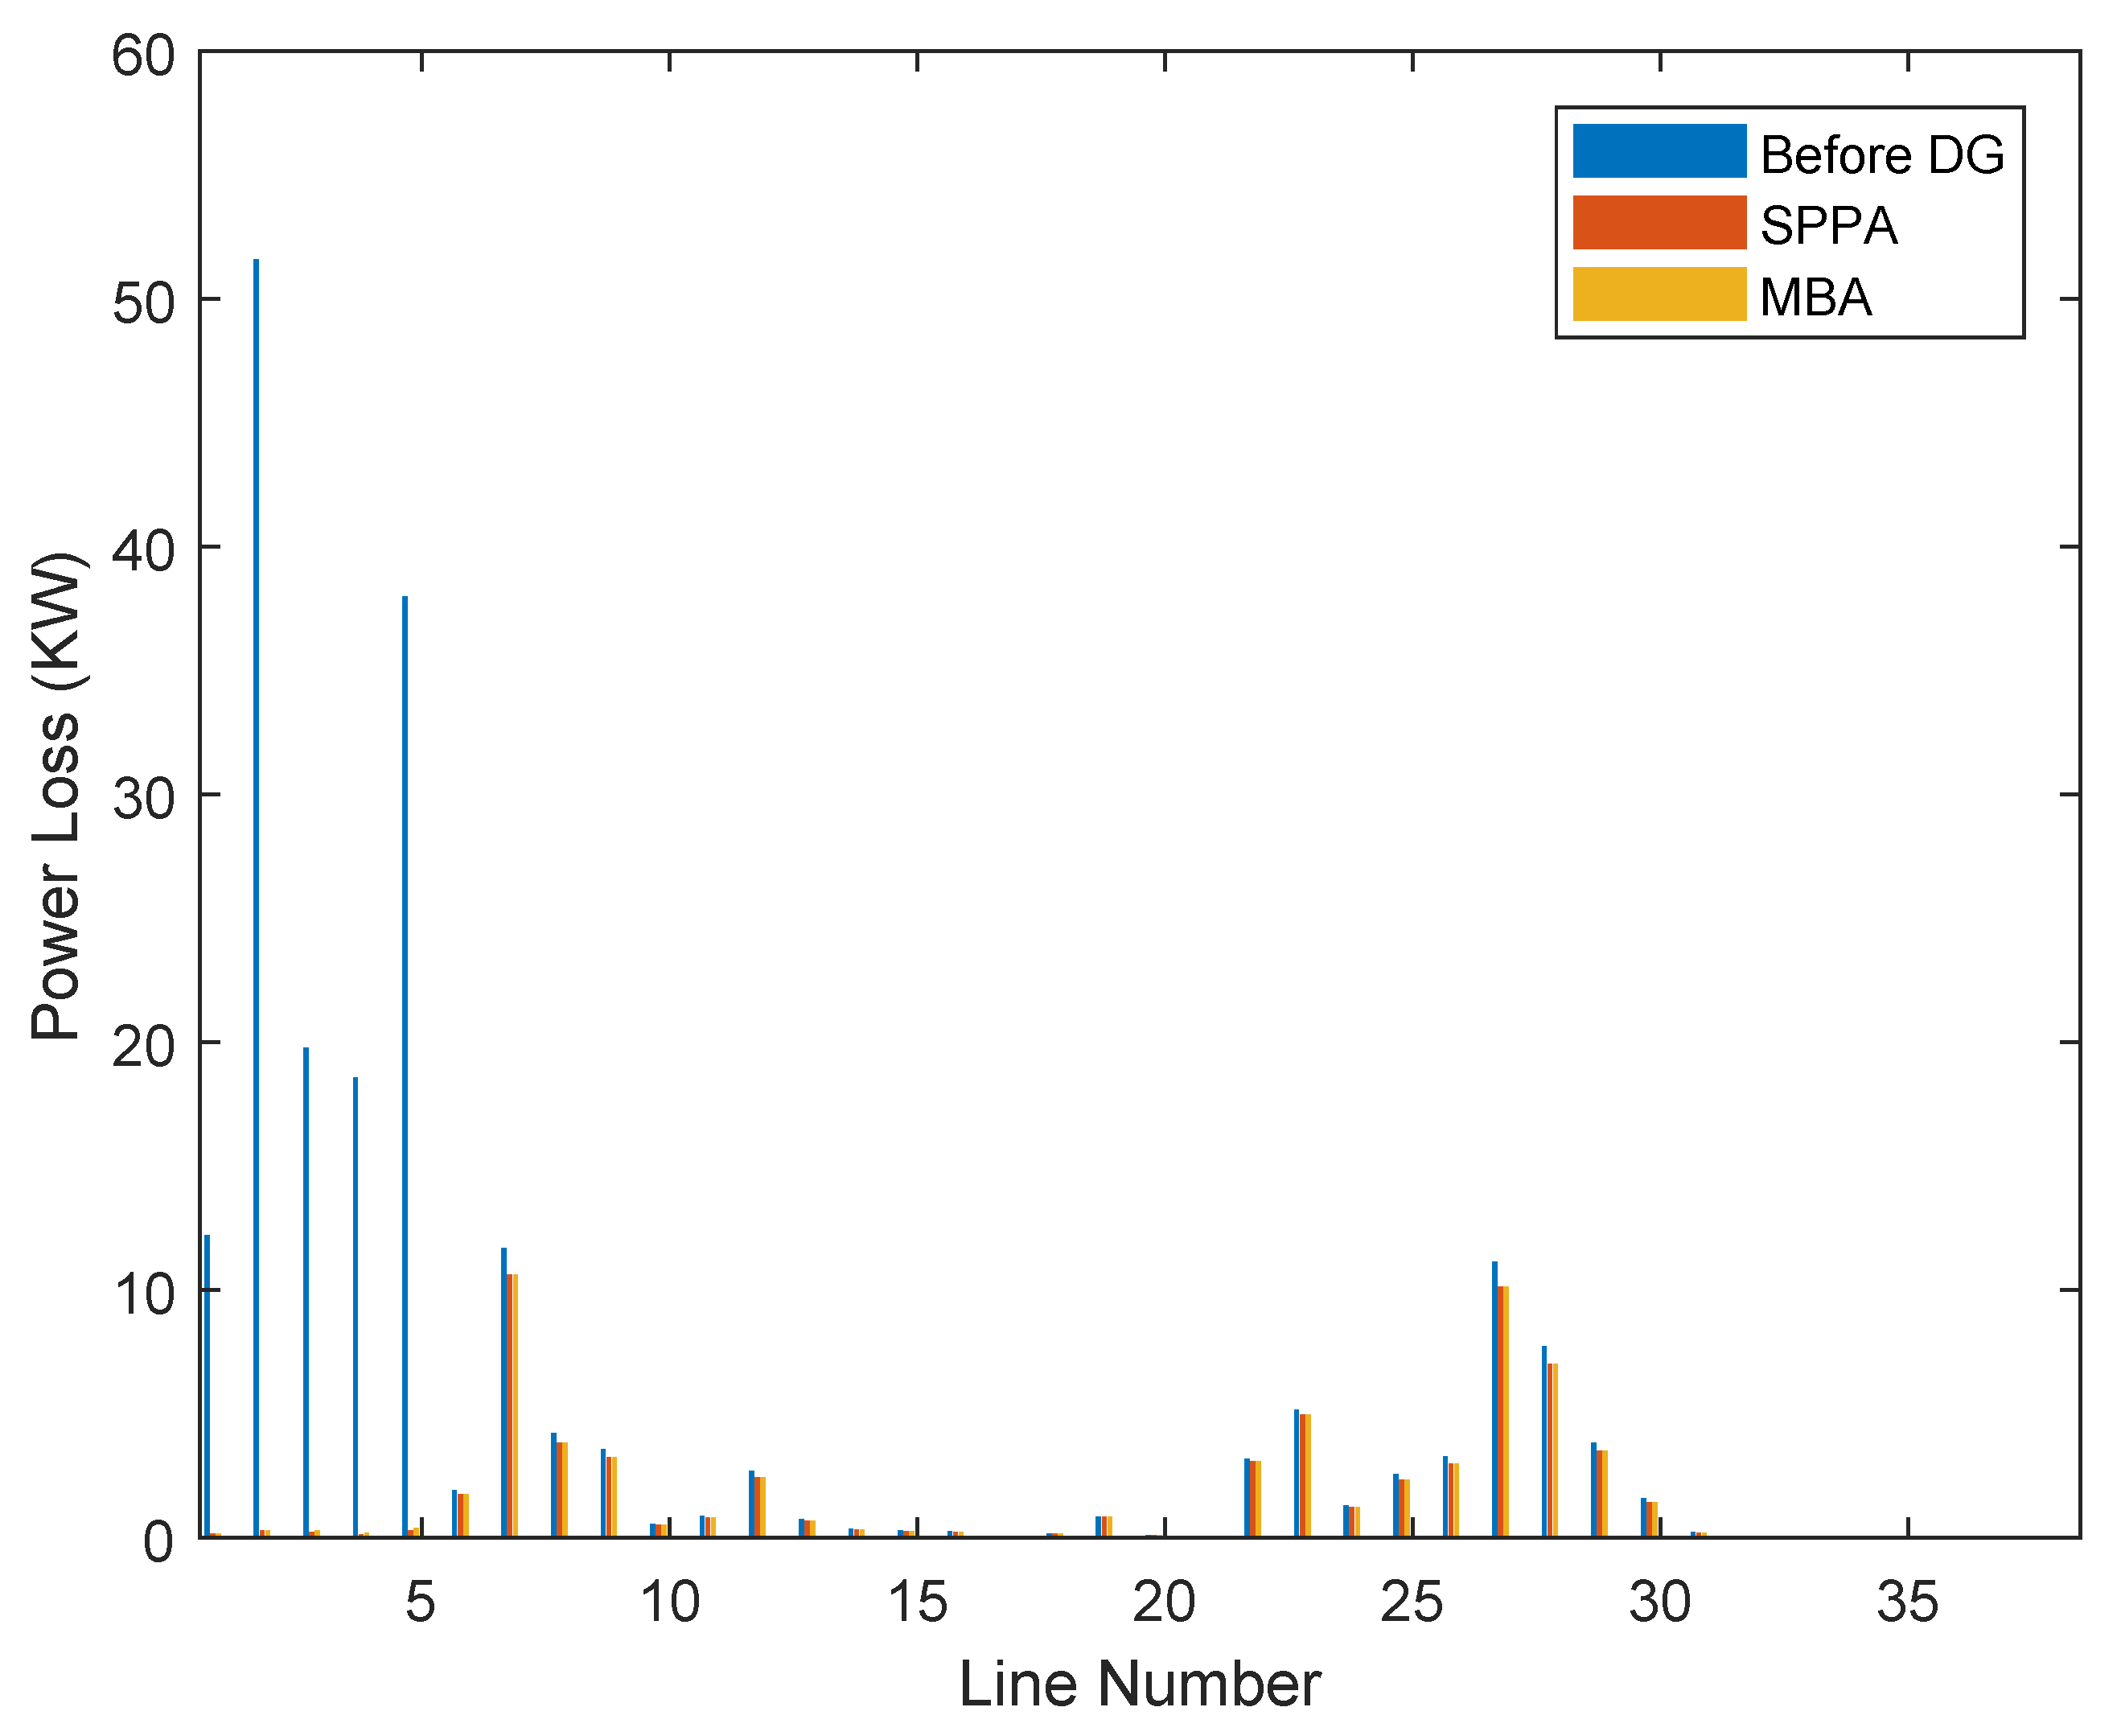
Active Power Losses have also been considerably decreased after the optimal siting and sizing of DG with SPPA. Cumulative active power loss for system without DGs is 208.45 kW, whereas after DG-Type 1 placement with MBA the cumulative active power loss is observed to be 64.34 kW. The active power loss is reduced to 63.74 kW for DG-Type 1 with the proposed method. The highest active losses occur at node number 27 which are 11.14 kW, 10.28 kW and 10.27 kW before DG placement, with MBA and with SPPA, respectively. The active power loss results are shown in Figure 3.
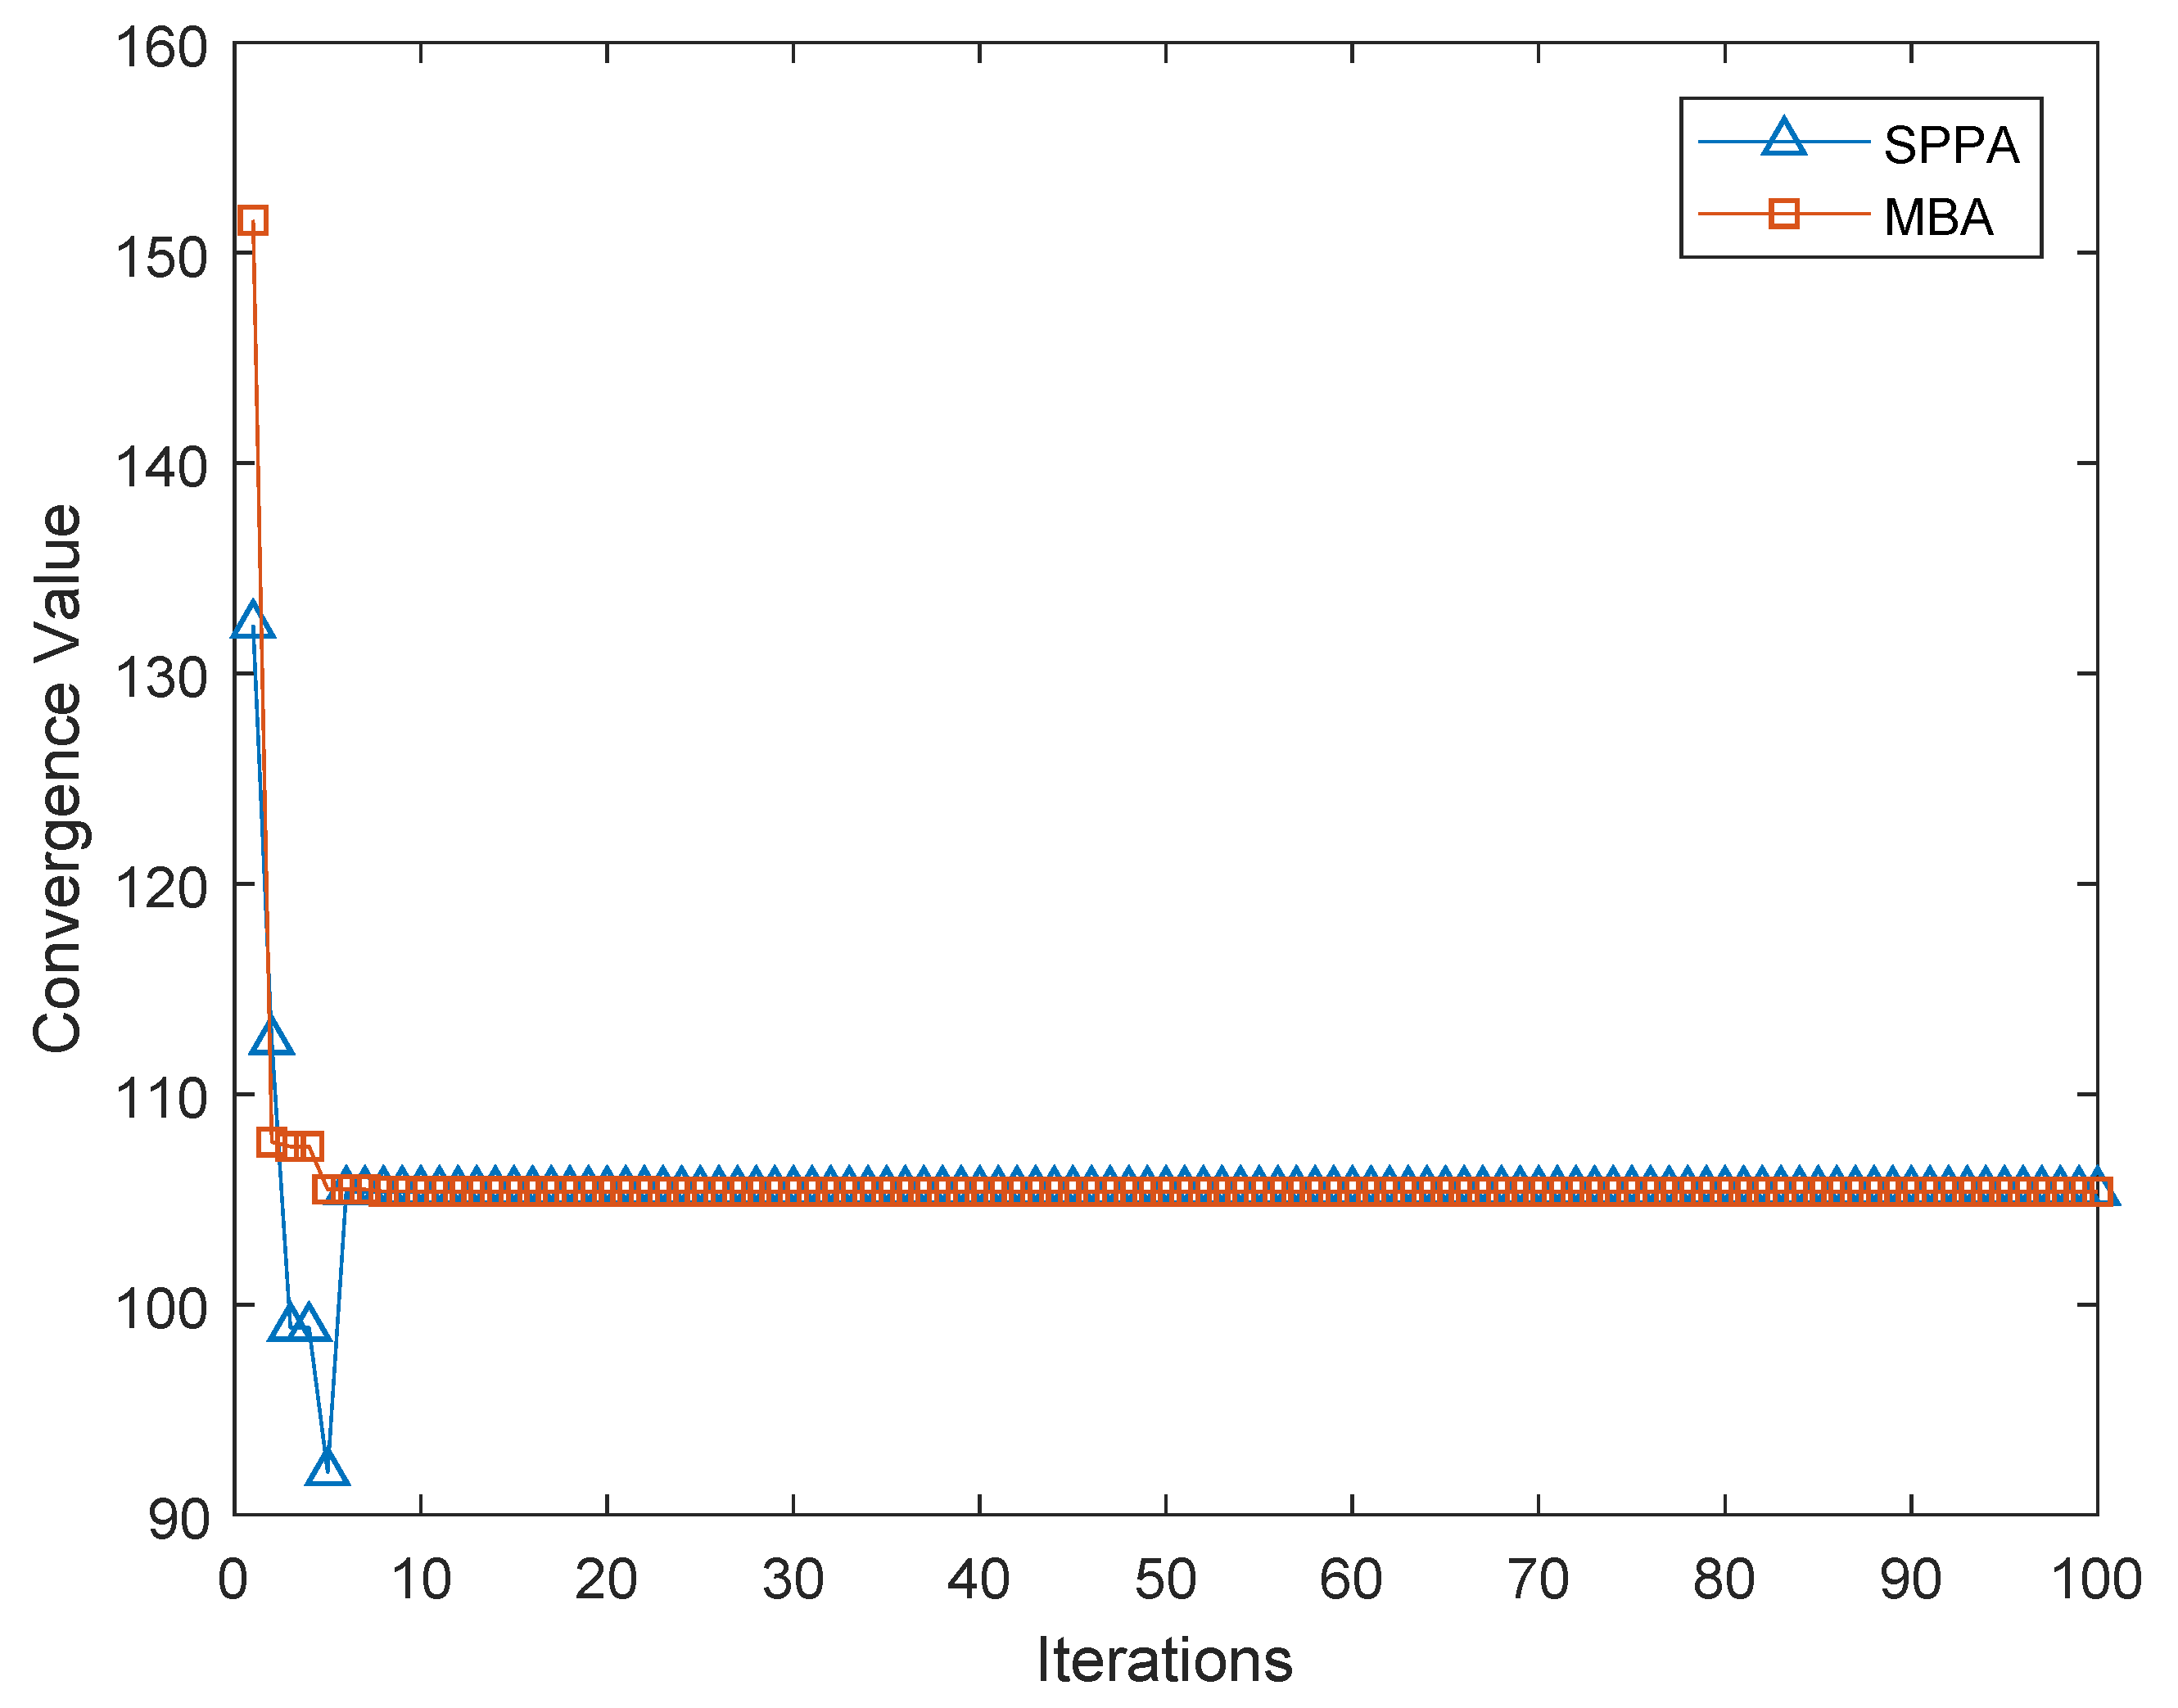
The convergence of both SPPA and MBA is compared for NW-1. It is observed for 100 iterations. Both techniques converge for the problem smoothly. However, it can be seen in Figure 4 that SPPA converges earlier than MBA. At the 6th iteration, the convergence is not stable (i.e., premature convergence), and it oscillates significantly, leading to a different solution in the next iteration, whereas in statistical analysis the repeated occurrence of an event is considered as the actual yield [40]. For that reason, there is a check set in the algorithm that if three consecutive iterations provide a similar result, then it is considered as a global optima; otherwise, although a better value is achieved for 1 iteration only, it is not treated as a stable solution and, hence, is discarded.
4.2. 69-Node System
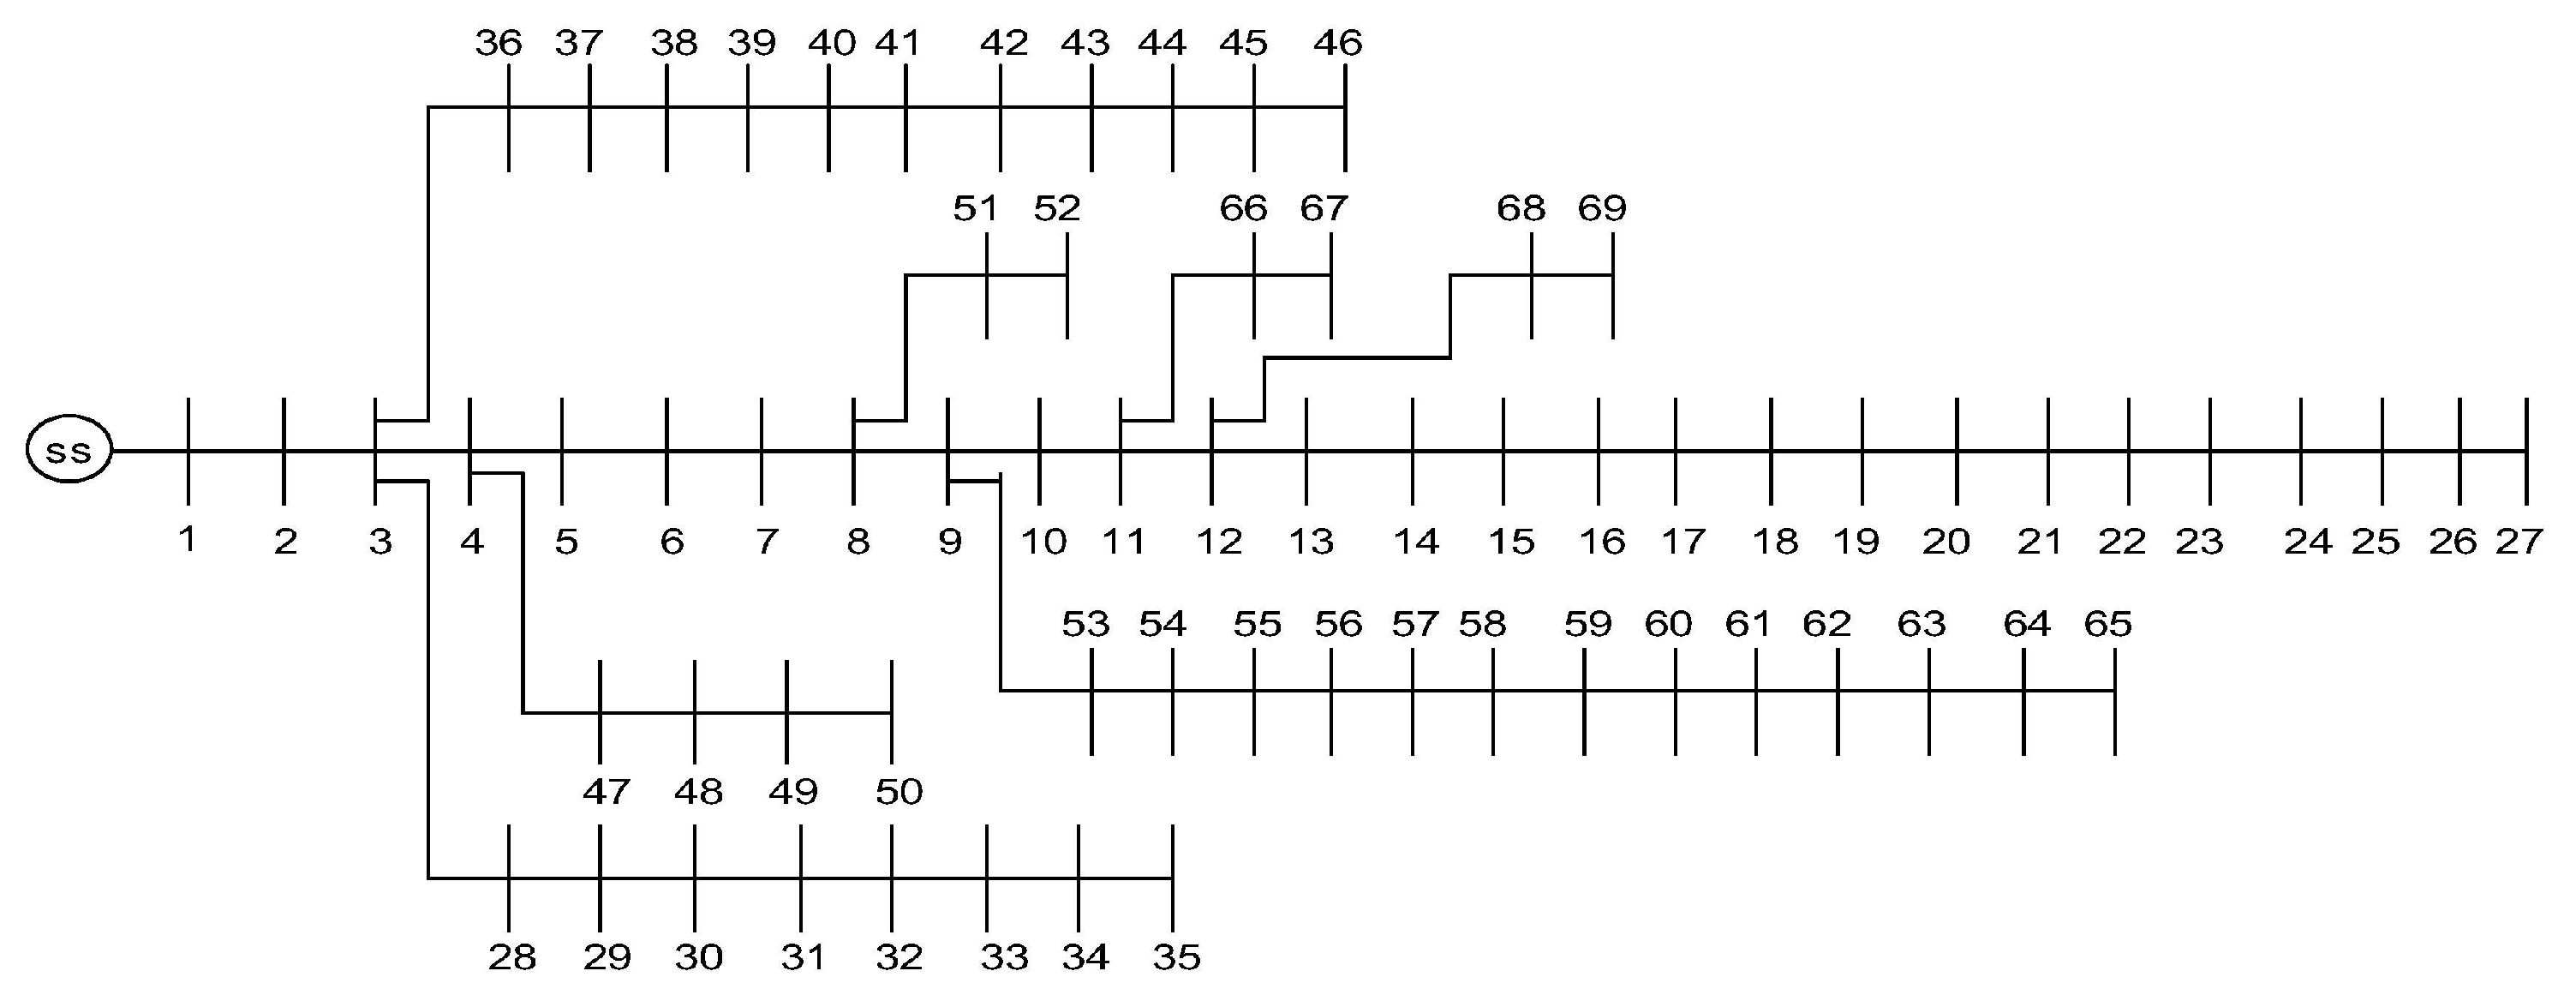
The proposed algorithm is executed for 69-node standard IEEE radial distribution networks. The test system has standard line configuration with balanced load connection. The 69-node radial balanced network, termed as NW-2 and given in Figure 5, has the rated load of 3.8021 MW and 2.6947 MVArs. A step-down transformer is connected before node 1, providing 12.66 kV to the network. The feeder characteristics and line data are taken from [41] for NW-2.
The total power of 100 MVA and voltage of 12.66 kV are considered as base values in the network. For NW-2 the losses are 224.9 kW and 102.17 kVAr, and the minimum voltage of 0.9092 pu appears at node 65 in base case. The computation time taken for 30 iterations is 70.18 s.
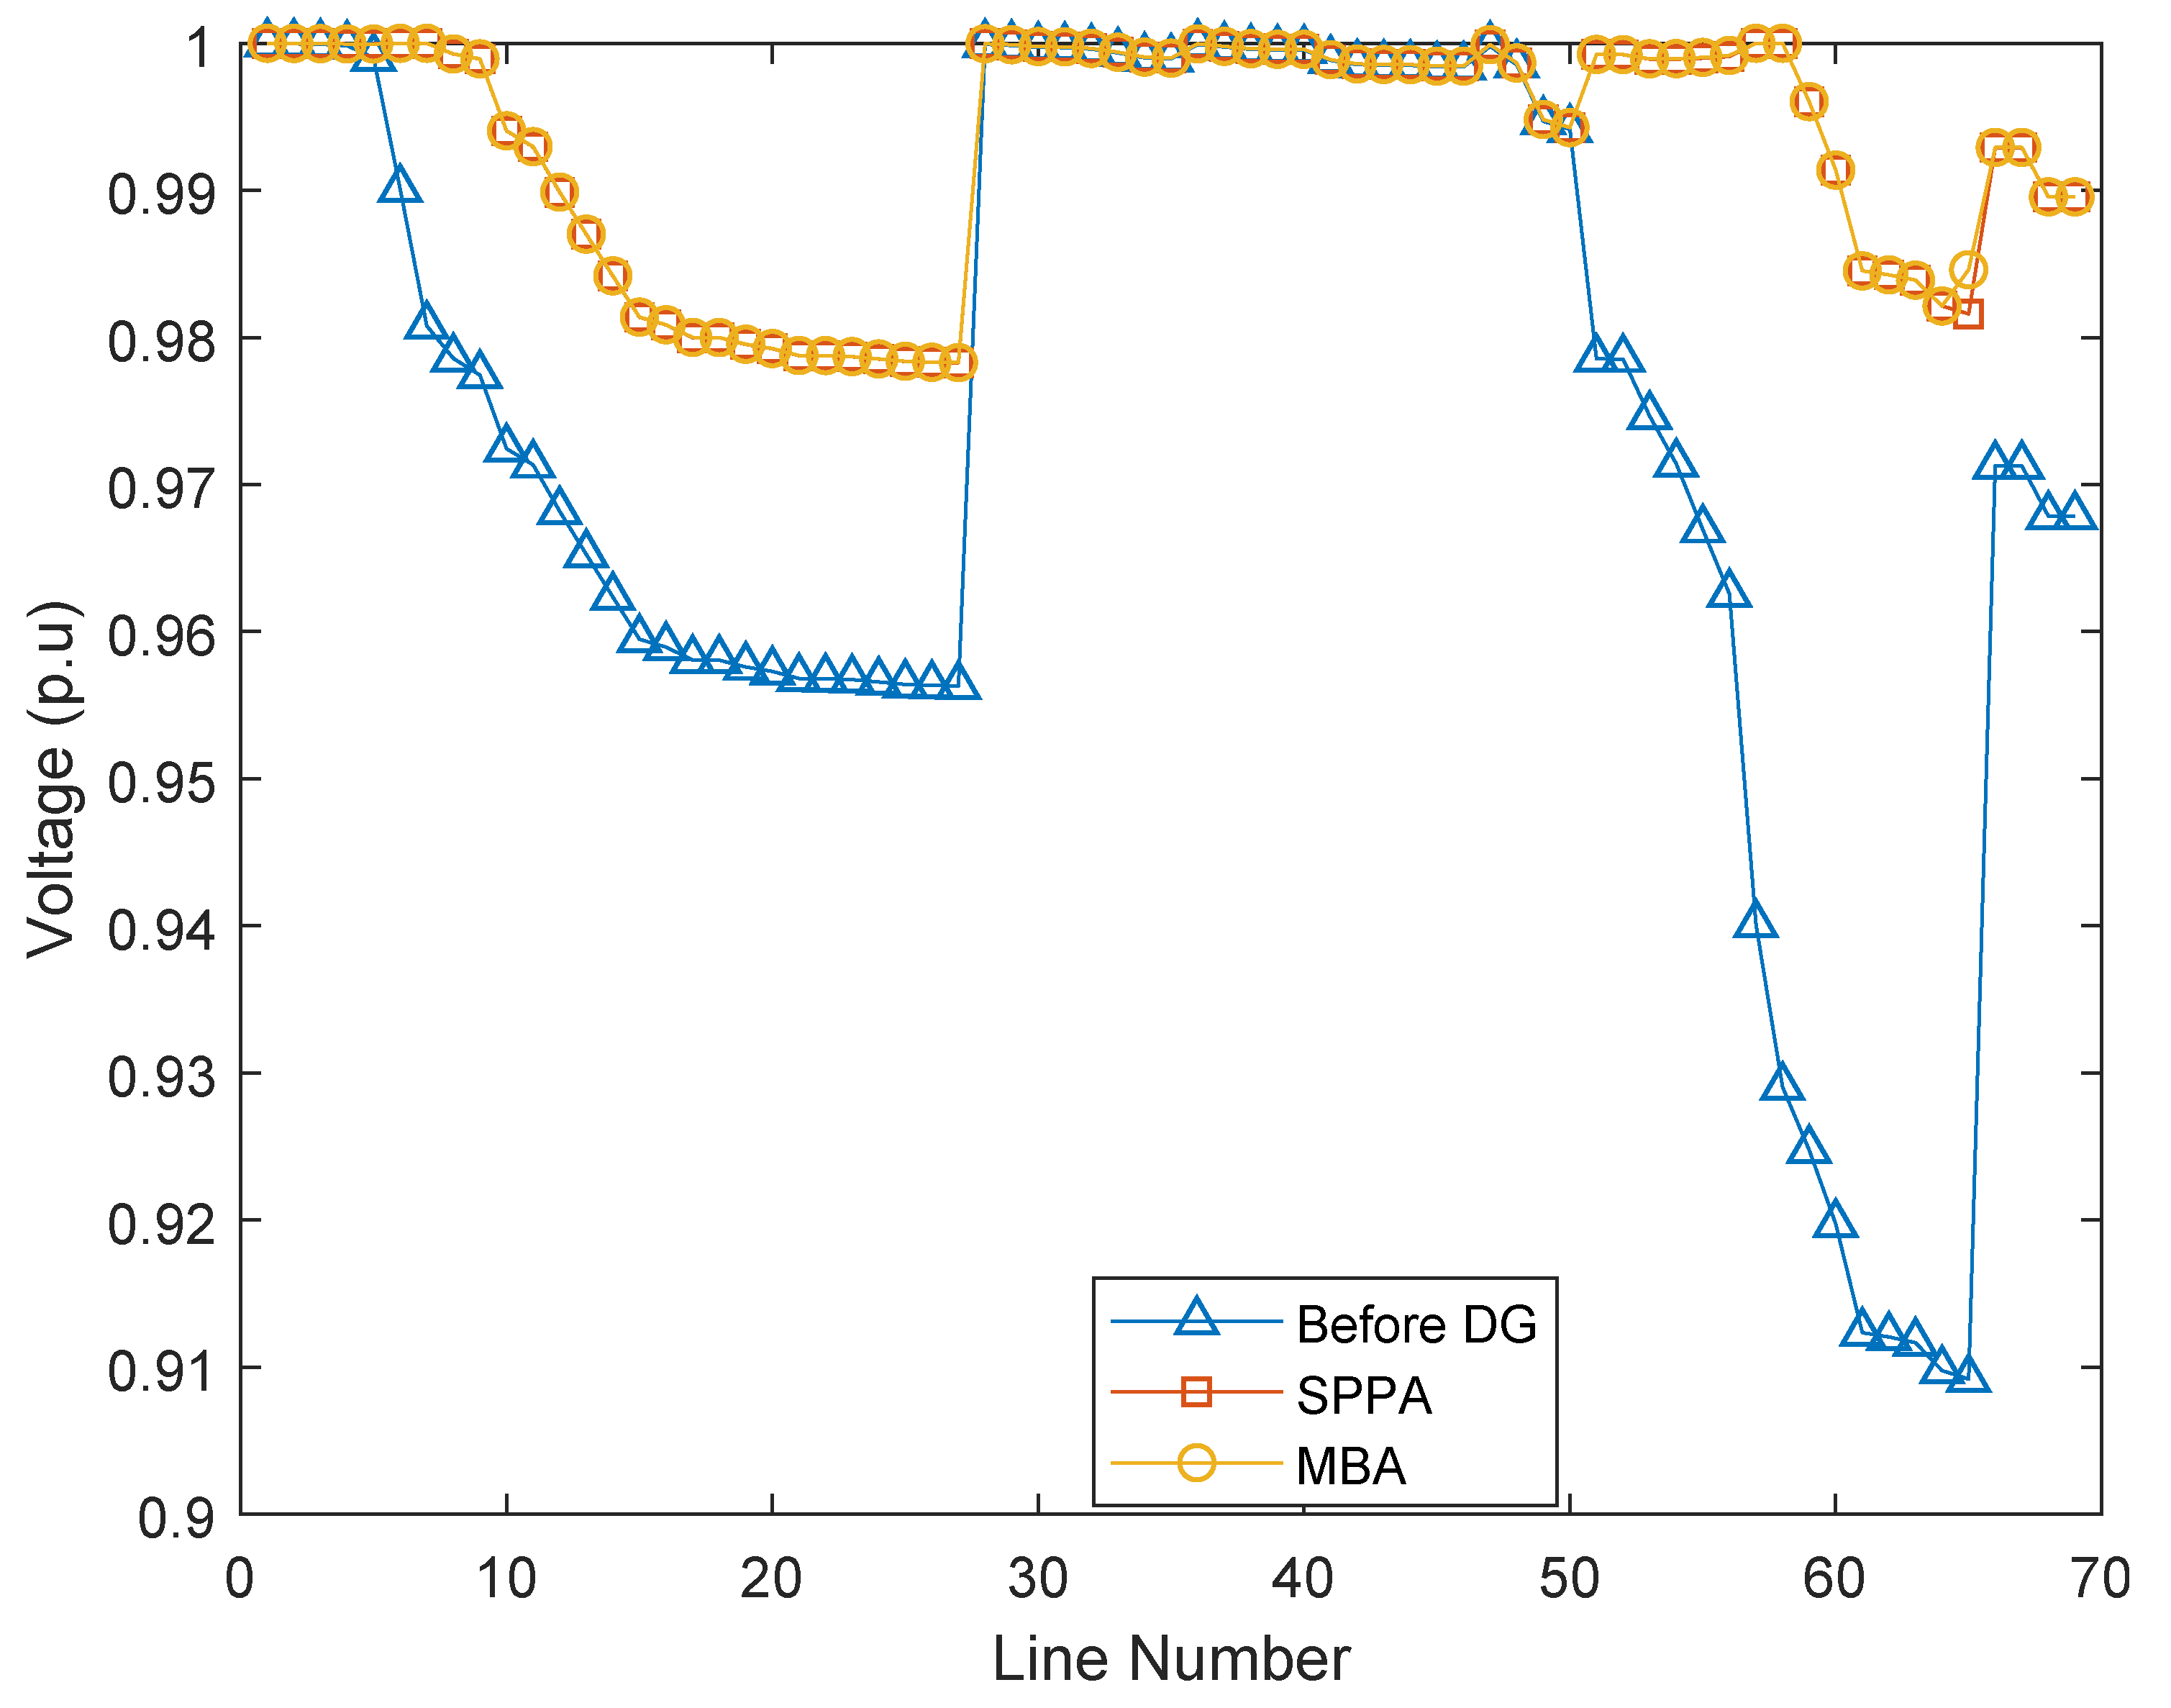
For IEEE, a 69-node radial network voltage profile after DG placement with MBA and SPPA is compared with the base case. SPPA showed better results than other two. After the optimal placement of DG with the SPPA technique, a significant improvement in voltage profile was observed and the minimum voltage occurs at node 28, which is 0.9782 pu, and after MBA the minimum voltage is 0.978 pu. Graphical representation is shown in Figure 6.
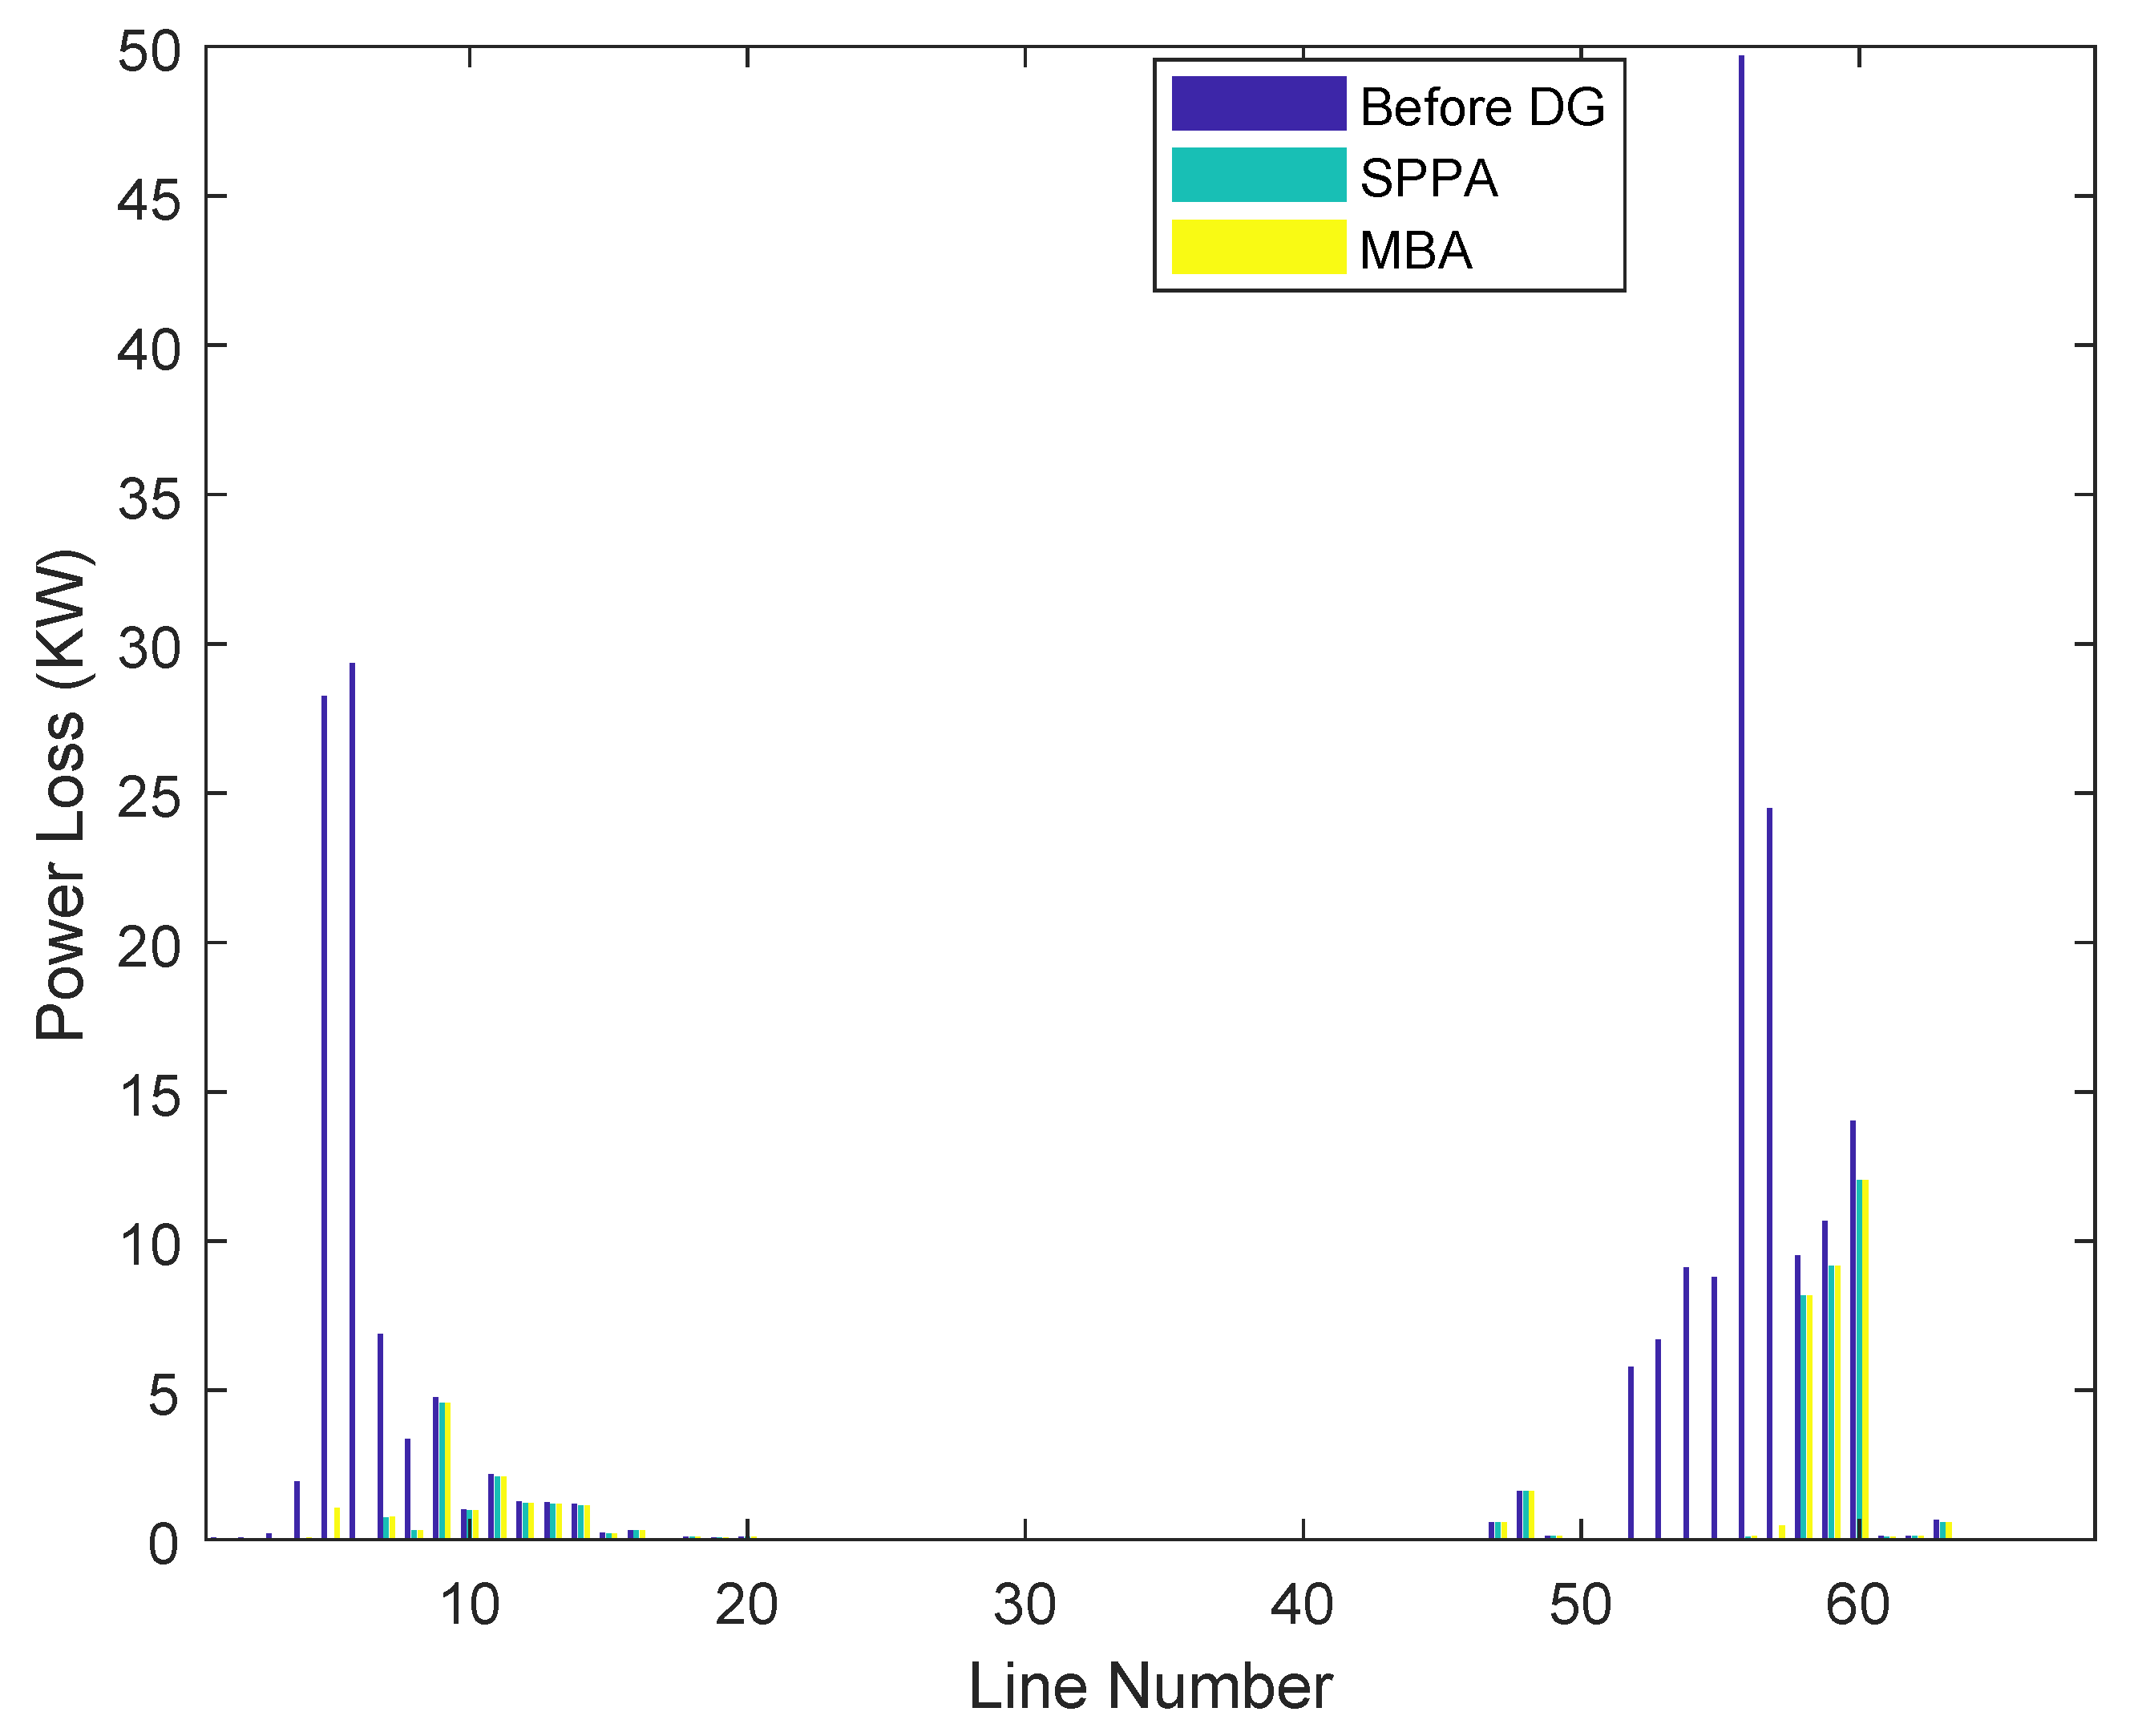
Active power losses for NW-2 are also reduced considerably by using SPPA for optimal siting and sizing of DG. Cumulative active power loss in the base case is 225 kW, with MBA it is 47.69 kW, and with the proposed technique it is 46.023 kW for DG-Type 1. The highest active losses occur at node number 60 and are 12.04 kW and 12.0 kW for MBA and SPPA, respectively. This is shown in Figure 7.
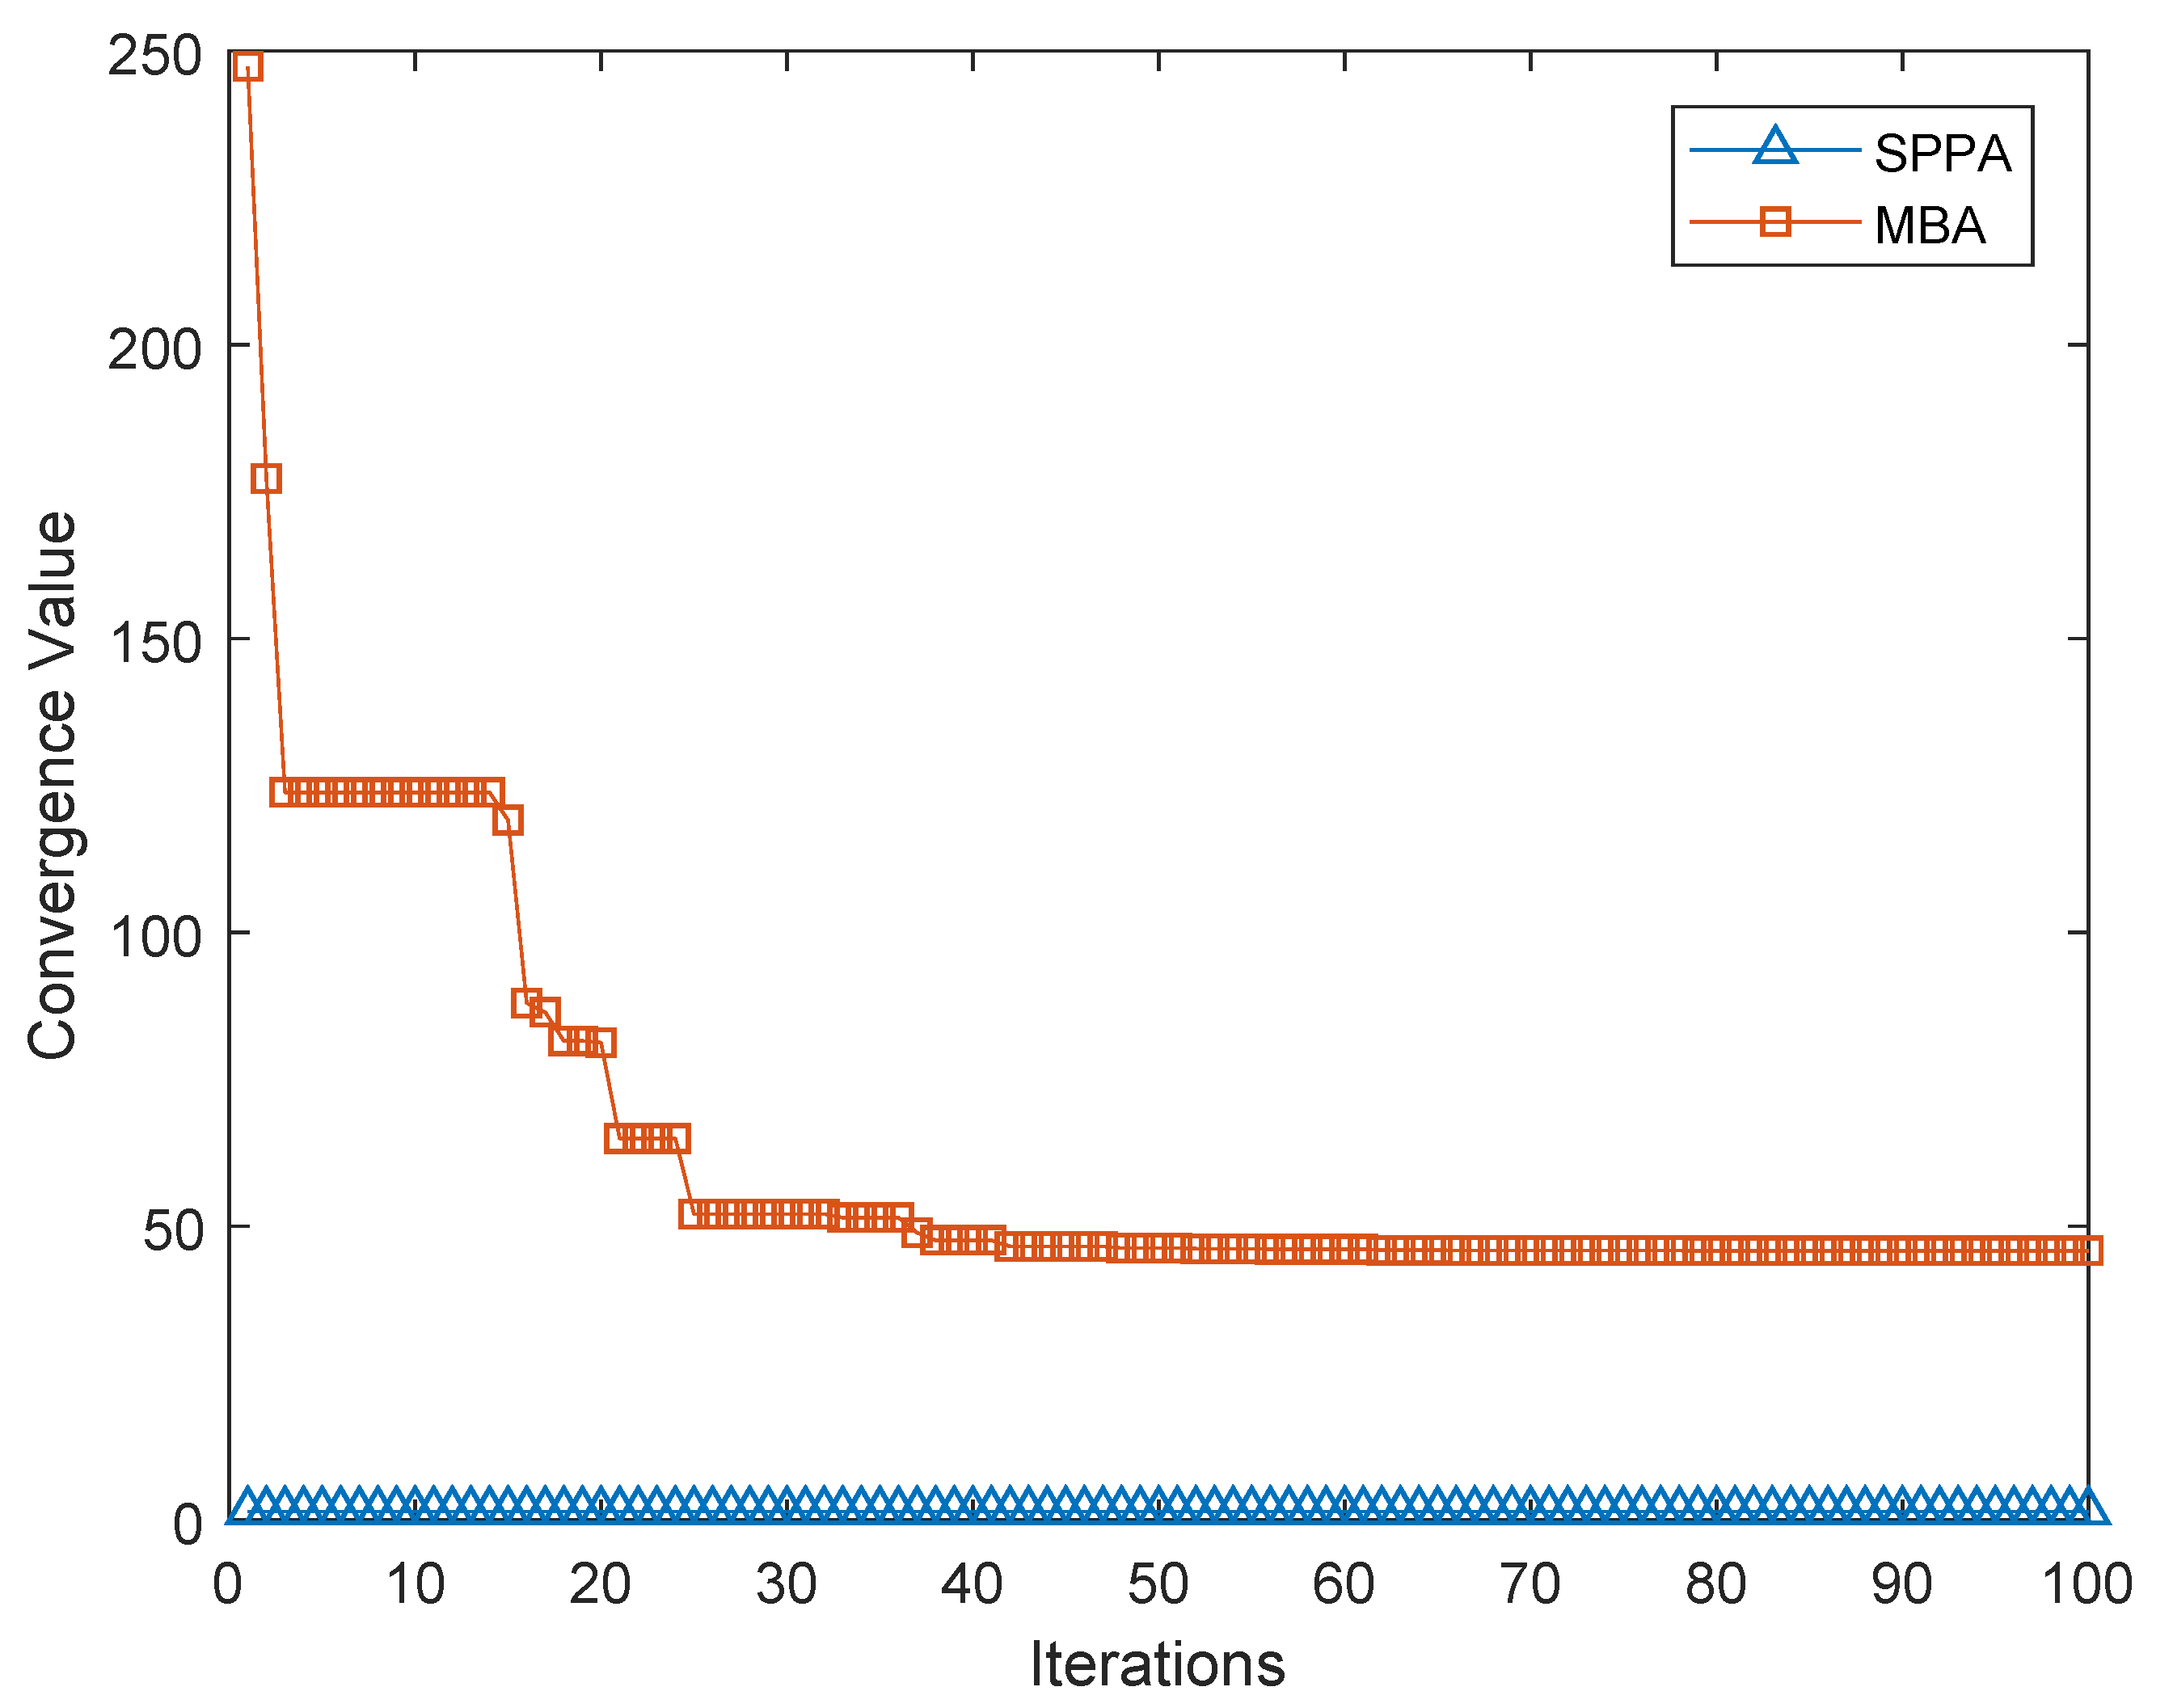
Convergence of both SPPA and MBA is compared for NW-2. It is observed for 100 iterations. Both techniques converge for the problem smoothly. However, it can be seen in Figure 8 that the SPPA converges earlier and more smoothly than MBA.
4.3. Results Comparison with Other Optimization Techniques
The proposed algorithm is further compared with other optimization techniques. These techniques include ALO (Ant Lion Algorithm), FPO (Flower Pollination Algorithm), PSO (Particle Swarm Optimization), GA (Genetic Algorithm), WOA (Whale optimization algorithm) PPBIL and PSO (Parallel Population Based Incremental Learning and Particle Swarm Optimization), IHHO (Improved Harris Hawks Optimizer), DSCA-SOCP (Discrete Sine Cos Algorithm-Second Order Cone Programming), GAMS (General Algebric Modelling System), and CBGA-VSA (Vertex Search and Chu-Beasley Genetic Algorithm). It is noteworthy that these techniques are not simulated as a part of this work. However, as the systems considered in this work as well as in the reference literature used for the mentioned techniques are standard IEEE systems with standard network data, their results are directly utilized for comparison purposes. Comparative results show that SPPA has most reduced power losses in both the IEEE 33- and 69-node systems. Table 1 and Table 2 explain these results in detail.
For NW-1, it can be seen that the highest power loss reduction (%) of 69.4% is achieved with SPPA, whereas the nearest competitors are GAMS and CBGA-VSA, with a (%) of 65.5%. Similarly, the best network voltage is also achieved with the SPPA, which is approximately 0.993 pu. For NW-2, the proposed SPPA outperformed other counterparts significantly. In this case, the (%) is even better than that of NW-1, which is 79.1% as compared to the nearest competitor, CBGA-VSA, which has a 69.15% power loss reduction.
Table 3 and Table 4 summarize the results of the reduction in cost due to savings from reduced power as well as energy losses. As before, various techniques have been used for comparison purposes from the mentioned literature. Cost reductions of approximately 93.5% and 76.6% were observed in the cases of NW-1 and NW-2, respectively.
5. Conclusions
This work presents the DG placement problem in radial distribution networks for the minimization of active power losses using the Strawberry Plant Propagation Algorithm (SPPA). It is observed that the optimal DG placement reduced the active power losses along with improving the voltage profile for both the considered networks—i.e., IEEE 33- and 69- node radial networks. The active power loss is reduced 69.4% in the 33-node network and 79.2% in the 69-node network with SPPA. The voltage profile is also improved and the minimum voltages of 0.9929 pu and 0.98 pu in are observed in the 33- and 69-node networks, respectively. The reduction in cost is also calculated and compared with various contemporary methods. It is observed that the cost is reduced significantly as well. The comparison with several DG placement techniques also highlights the effectiveness of the proposed method.
Author Contributions
Conceptualization, M.S. and W.A.; methodology, M.S.; software, W.A.; validation, M.S., W.A. and M.A.; formal analysis, M.S.; investigation, W.A. and B.U.; resources, W.A. and U.K.; data curation, B.U. and U.K.; writing—original draft preparation, W.A. and M.S.; writing—review and editing, M.S.; visualization, M.S. and M.A.; supervision, M.S.; project administration, M.S., W.A. and B.U.; All authors have read and agreed to the published version of the manuscript.
Funding
This research received no external funding.
Institutional Review Board Statement
Not applicable.
Informed Consent Statement
Not applicable.
Data Availability Statement
Not applicable.
Conflicts of Interest
The authors declare no conflict of interest.
References
- Van Bavel, J. The world population explosion: Causes, backgrounds and projections for the future. Facts Views Vis. ObGyn 2013, 5, 281. [Google Scholar] [PubMed]
- Shahzad, M. Power system planning with multiple distributed generators. Ph.D. Thesis, TU Wien, Vienna, Austria, 2016. [Google Scholar]
- Aboli, R.; Ramezani, M.; Falaghi, H. A hybrid robust distributed model for short-term operation of multi-microgrid distribution networks. Electr. Power Syst. Res. 2019, 177, 106011. [Google Scholar] [CrossRef]
- Chiu, W.Y.; Sun, H.; Poor, H.V. A multiobjective approach to multimicrogrid system design. IEEE Trans. Smart Grid 2015, 6, 2263–2272. [Google Scholar] [CrossRef] [Green Version]
- Lin, Y.; Dong, P.; Sun, X.; Liu, M. Two-level game algorithm for multi-microgrid in electricity market. IET Renew. Power Gener. 2017, 11, 1733–1740. [Google Scholar] [CrossRef]
- Perpinias, I.I.; Papanikolaou, N.P.; Tatakis, E.C. Optimum design of low-voltage distributed photovoltaic systems oriented to enhanced fault ride through capability. IET Gener. Transm. Distrib. 2015, 9, 903–910. [Google Scholar] [CrossRef]
- Abou El-Ela, A.A.; El-Sehiemy, R.A.; Kinawy, A.M.; Mouwafi, M.T. Optimal capacitor placement in distribution systems for power loss reduction and voltage profile improvement. IET Gener. Transm. Distrib. 2016, 10, 1209–1221. [Google Scholar] [CrossRef]
- Suresh, M.; Edward, J.B. A hybrid algorithm based optimal placement of DG units for loss reduction in the distribution system. Appl. Soft Comput. 2020, 91, 106191. [Google Scholar] [CrossRef]
- Shahzad, M.; Ahmad, I.; Gawlik, W.; Palensky, P. Active power loss minimization in radial distribution networks with analytical method of simultaneous optimal DG sizing. In Proceedings of the 2016 IEEE International Conference on Industrial Technology (ICIT), Taipei, Taiwan, 14–17 March 2016; pp. 470–475. [Google Scholar]
- Shahzad, M.; Ahmad, I.; Gawlik, W.; Palensky, P. Load concentration factor based analytical method for optimal placement of multiple distribution generators for loss minimization and voltage profile improvement. Energies 2016, 9, 287. [Google Scholar] [CrossRef] [Green Version]
- Almabsout, E.A.; El-Sehiemy, R.A.; An, O.N.U.; Bayat, O. A hybrid local Search-Genetic algorithm for simultaneous placement of DG units and shunt capacitors in radial distribution systems. IEEE Access 2020, 8, 54465–54481. [Google Scholar] [CrossRef]
- Acharya, N.; Mahat, P.; Mithulananthan, N. An analytical approach for DG allocation in primary distribution network. Int. J. Electr. Power Energy Syst. 2006, 28, 669–678. [Google Scholar] [CrossRef]
- Alarcon-Rodriguez, A.; Ault, G.; Galloway, S. Multi-objective planning of distributed energy resources: A review of the state-of-the-art. Renew. Sustain. Energy Rev. 2010, 14, 1353–1366. [Google Scholar] [CrossRef]
- Coello, C.A.C. A comprehensive survey of evolutionary-based multiobjective optimization techniques. Knowl. Inf. Syst. 1999, 1, 269–308. [Google Scholar] [CrossRef]
- Merrikh-Bayat, F. A numerical optimization algorithm inspired by the strawberry plant. arXiv 2014, arXiv:1407.7399. [Google Scholar]
- Sultana, U.; Khairuddin, A.B.; Aman, M.; Mokhtar, A.; Zareen, N. A review of optimum DG placement based on minimization of power losses and voltage stability enhancement of distribution system. Renew. Sustain. Energy Rev. 2016, 63, 363–378. [Google Scholar] [CrossRef]
- Prakash, P.; Khatod, D.K. Optimal sizing and siting techniques for distributed generation in distribution systems: A review. Renew. Sustain. Energy Rev. 2016, 57, 111–130. [Google Scholar] [CrossRef]
- Paliwal, P.; Patidar, N.; Nema, R. Planning of grid integrated distributed generators: A review of technology, objectives and techniques. Renew. Sustain. Energy Rev. 2014, 40, 557–570. [Google Scholar] [CrossRef]
- Viral, R.; Khatod, D.K. An analytical approach for sizing and siting of DGs in balanced radial distribution networks for loss minimization. Int. J. Electr. Power Energy Syst. 2015, 67, 191–201. [Google Scholar] [CrossRef]
- Crossland, A.; Jones, D.; Wade, N. Planning the location and rating of distributed energy storage in LV networks using a genetic algorithm with simulated annealing. Int. J. Electr. Power Energy Syst. 2014, 59, 103–110. [Google Scholar] [CrossRef] [Green Version]
- Hassan, A.A.; Fahmy, F.H.; Nafeh, A.E.S.A.; Abu-elmagd, M.A. Genetic single objective optimisation for sizing and allocation of renewable DG systems. Int. J. Sustain. Energy 2017, 36, 545–562. [Google Scholar] [CrossRef]
- Zeb, M.Z.; Imran, K.; Janjua, A.K.; Nadeem, M.; Amin, A. Optimal allocation and sizing of solar panels generation via particle swarm optimization algorithm. In Proceedings of the 2019 2nd International Conference on Computing, Mathematics and Engineering Technologies (iCoMET), Sukkur, Pakistan, 30–31 January 2019; pp. 1–5. [Google Scholar]
- Othman, M.; El-Khattam, W.; Hegazy, Y.; Abdelaziz, A.Y. Optimal placement and sizing of voltage controlled distributed generators in unbalanced distribution networks using supervised firefly algorithm. Int. J. Electr. Power Energy Syst. 2016, 82, 105–113. [Google Scholar] [CrossRef]
- Sudabattula, S.; Kowsalya, M. Optimal allocation of wind based distributed generators in distribution system using Cuckoo Search Algorithm. Procedia Comput. Sci. 2016, 92, 298–304. [Google Scholar] [CrossRef] [Green Version]
- Yuvaraj, T.; Devabalaji, K.; Ravi, K. Optimal allocation of DG in the radial distribution network using bat optimization algorithm. In Advances in Power Systems and Energy Management; Springer: Berlin/Heidelberg, Germany, 2018; pp. 563–569. [Google Scholar]
- Oda, E.S.; Abdelsalam, A.A. Optimal DGs allocation in distribution networks using modified flower pollination algorithm. In Proceedings of the 2017 Nineteenth International Middle East Power Systems Conference (MEPCON), Cairo, Egypt, 19–21 December 2017; pp. 1424–1429. [Google Scholar]
- Devabalaji, K.; Ravi, K. Optimal size and siting of multiple DG and DSTATCOM in radial distribution system using Bacterial Foraging Optimization Algorithm. Ain Shams Eng. J. 2016, 7, 959–971. [Google Scholar] [CrossRef] [Green Version]
- Ali, A.H.; Youssef, A.R.; George, T.; Kamel, S. Optimal DG allocation in distribution systems using Ant lion optimizer. In Proceedings of the 2018 International Conference on Innovative Trends in Computer Engineering (ITCE), Aswan, Egypt, 19–21 February 2018; pp. 324–331. [Google Scholar]
- George, T.; Youssef, A.R.; Kamel, S. Optimal Allocation of DGs and TCSC in Radial Networks Using Ant Lion Optimizer. In Proceedings of the 2018 Twentieth International Middle East Power Systems Conference (MEPCON), Cairo, Egypt, 18–20 December 2018; pp. 1092–1097. [Google Scholar]
- Sanjay, R.; Jayabarathi, T.; Raghunathan, T.; Ramesh, V.; Mithulananthan, N. Optimal allocation of distributed generation using hybrid grey wolf optimizer. IEEE Access 2017, 5, 14807–14818. [Google Scholar] [CrossRef]
- Prakash, D.; Lakshminarayana, C. Multiple DG placements in radial distribution system for multi objectives using whale optimization algorithm. Alex. Eng. J. 2018, 57, 2797–2806. [Google Scholar] [CrossRef]
- Sabarinath, G.; Manohar, T.G. Optimal sitting and sizing of renewable energy resources for power loss reduction in radial distribution systems using whale optimization algorithm. In Proceedings of the 2018 International Conference on Emerging Trends and Innovations In Engineering And Technological Research (ICETIETR), Ernakulam, India, 11–13 July 2018; pp. 1–5. [Google Scholar]
- Nekooei, K.; Farsangi, M.M.; Nezamabadi-Pour, H.; Lee, K.Y. An improved multi-objective harmony search for optimal placement of DGs in distribution systems. IEEE Trans. Smart Grid 2013, 4, 557–567. [Google Scholar] [CrossRef]
- El-Fergany, A. Optimal allocation of multi-type distributed generators using backtracking search optimization algorithm. Int. J. Electr. Power Energy Syst. 2015, 64, 1197–1205. [Google Scholar] [CrossRef]
- Mena, A.J.G.; García, J.A.M. An efficient approach for the siting and sizing problem of distributed generation. Int. J. Electr. Power Energy Syst. 2015, 69, 167–172. [Google Scholar] [CrossRef]
- Grisales-Noreña, L.F.; Gonzalez Montoya, D.; Ramos-Paja, C.A. Optimal sizing and location of distributed generators based on PBIL and PSO techniques. Energies 2018, 11, 1018. [Google Scholar] [CrossRef] [Green Version]
- Montoya, O.D.; Molina-Cabrera, A.; Chamorro, H.R.; Alvarado-Barrios, L.; Rivas-Trujillo, E. A Hybrid Approach Based on SOCP and the Discrete Version of the SCA for Optimal Placement and Sizing DGs in AC Distribution Networks. Electronics 2021, 10, 26. [Google Scholar] [CrossRef]
- Salhi, A.; Fraga, E. Nature-Inspired Optimisation Approaches and the New Plant Propagation Algorithm. In Proceedings of the The International Conference on Numerical Analysis and Optimization (ICeMATH’11), Yogyakarta, Indonesia, 6–8 June 2011. [Google Scholar]
- Baran, M.E.; Wu, F.F. Network reconfiguration in distribution systems for loss reduction and load balancing. IEEE Power Eng. Rev. 1989, 9, 101–102. [Google Scholar] [CrossRef]
- Aalen, O.O.; Husebye, E. Statistical analysis of repeated events forming renewal processes. Stat. Med. 1991, 10, 1227–1240. [Google Scholar] [CrossRef] [PubMed]
- Sahoo, N.; Prasad, K. A fuzzy genetic approach for network reconfiguration to enhance voltage stability in radial distribution systems. Energy Convers. Manag. 2006, 47, 3288–3306. [Google Scholar] [CrossRef]
- Sarfaraz; Bansal, A.; Singh, S. Optimal allocation and sizing of distributed generation for power loss reduction. IET Conf. Proc. 2016, 6. [Google Scholar] [CrossRef]
- Ali, E.; Abd Elazim, S.; Abdelaziz, A. Ant Lion Optimization Algorithm for optimal location and sizing of renewable distributed generations. Renew. Energy 2017, 101, 1311–1324. [Google Scholar] [CrossRef]
- Oda, E.S.; Abdelsalam, A.A.; Abdel-Wahab, M.N.; El-Saadawi, M.M. Distributed generations planning using flower pollination algorithm for enhancing distribution system voltage stability. Ain Shams Eng. J. 2017, 8, 593–603. [Google Scholar] [CrossRef] [Green Version]
- Vatani, M.; Alkaran, D.S.; Sanjari, M.J.; Gharehpetian, G.B. Multiple distributed generation units allocation in distribution network for loss reduction based on a combination of analytical and genetic algorithm methods. IET Gener. Transm. Distrib. 2016, 10, 66–72. [Google Scholar] [CrossRef]
- Selim, A.; Kamel, S.; Alghamdi, A.S.; Jurado, F. Optimal Placement of DGs in Distribution System Using an Improved Harris Hawks Optimizer Based on Single-and Multi-Objective Approaches. IEEE Access 2020, 8, 52815–52829. [Google Scholar] [CrossRef]
- Montoya, O.D.; Gil-González, W.; Grisales-Noreña, L. An exact MINLP model for optimal location and sizing of DGs in distribution networks: A general algebraic modeling system approach. Ain Shams Eng. J. 2020, 11, 409–418. [Google Scholar] [CrossRef]
- Montoya, O.D.; Gil-González, W.; Orozco-Henao, C. Vortex search and Chu-Beasley genetic algorithms for optimal location and sizing of distributed generators in distribution networks: A novel hybrid approach. Eng. Sci. Technol. Int. J. 2020, 23, 1351–1363. [Google Scholar]
- Musa, H.; Adamu, S.S. Optimal allocation and sizing of distributed generation for power loss reduction using modified PSO for radial distribution systems. J. Energy Technol. Policy 2013, 3, 1–8. [Google Scholar]
Figure 1.
IEEE 33-node test system—NW-1.

Figure 2.
Bus voltage profile of NW-1.

Figure 3.
Active power loss results of NW-1.

Figure 4.
Algorithm convergence for NW-1.

Figure 5.
IEEE 69-node test system–NW-2.

Figure 6.
Bus voltage profile of NW-2.

Figure 7.
Active power loss results of NW-2.

Figure 8.
Algorithm convergence for NW-2.


Table 1.
Comparison and performance analysis of NW-1.
| Technique | Optimal Size (kW) | Optimal Location | (kW) | (kW) | (%) | (pu) | Ref. |
|---|---|---|---|---|---|---|---|
| BFOA | 779, 880, 1083 | 14, 25, 30 | 2742 | 73.53 | 65.1 | – | [27] |
| WOA | 1072.8, 772.5, 856.7 | 30, 25, 13 | 2702 | 73.75 | 65.1 | 0.97 | [31] |
| PPBIL& PSO | 403, 524, 642 | 12, 15, 31 | 1569 | 91.5 | 56.6 | 0.96 | [36] |
| DSCA-SOCP | 801, 1091, 1053 | 13, 24, 30 | 2945 | 72.8 | 65.5 | – | [37] |
| SPSO | 640, 740, 420 | 16, 30, 32 | 1800 | 74 | 64.5 | 0.97 | [42] |
| ALO | 850, 1191 | 13, 30 | 2041 | 82.6 | 60.8 | 0.97 | [43] |
| FPA | 1039, 1086 | 12, 30 | 2125 | 89.2 | 57.7 | 0.97 | [44] |
| GA | 1323, 867 | 30, 13 | 2190 | 81.75 | 61.1 | 0.97 | [45] |
| IHHO | 775.5, 1080.8, 1066.7 | 14, 24, 30 | 2923 | 72.8 | 65.5 | – | [46] |
| GAMS | 770, 1096, 1065 | 14, 24, 30 | 2931 | 72.8 | 65.5 | – | [47] |
| CBGA-VSA | 801, 1091, 1053 | 13, 24, 30 | 2945 | 72.8 | 65.5 | 0.97 | [48] |
| SPPA | 1270, 2225 | 3, 6 | 3495 | 63.74 | 69.4 | 0.99 | Proposed |
Table 2.
Comparison and performance analysis of NW-2.
| Technique | Optimal Size (kW) | Optimal Location | (kW) | (kW) | (%) | (pu) | Ref. |
|---|---|---|---|---|---|---|---|
| WOA | 489, 476, 1680 | 11, 18, 61 | 2645 | 69.72 | 69 | 0.98 | [31] |
| PPBIL& PSO | 178, 1053, 420 | 26, 61, 66 | 1651 | 86.9 | 64.1 | 0.96 | [36] |
| DSCA-SOCP | 526, 380, 1719 | 11, 18, 61 | 2625 | 69.41 | 69.2 | – | [37] |
| SPSO | 1360, 520 | 61, 64 | 1880 | 81 | 64 | 0.98 | [42] |
| ALO | 538, 1700 | 17, 61 | 2238 | 70.75 | 68.6 | 0.98 | [43] |
| FPA | 463, 1771 | 17, 61 | 2234 | 71.7 | 68.1 | 0.97 | [44] |
| IHHO | 527.2, 382.5, 1719.4 | 11, 17, 61 | 2629.1 | 69.41 | 69.2 | – | [46] |
| GAMS | 813, 1444, 289 | 12, 61, 64 | 2546 | 72.09 | 68 | – | [47] |
| CBGA-VSA | 526, 380, 1719 | 11, 18, 61 | 2625 | 69.41 | 69.2 | 0.98 | [48] |
| PSO | 1293, 673, 868 | 61, 17, 50 | 2834 | 87.48 | 61.1 | 0.98 | [49] |
| SPPA | 42.8, 995, 102.1, 1768 | 57, 7, 6, 58 | 2907.9 | 46.89 | 79.2 | 0.98 | Proposed |
Table 3.
Cost reduction comparison of NW-1.
| Technique | (kW) | (kW) | (kW) | (kWh) | (kWh) | Cost Reduction | Ref. |
|---|---|---|---|---|---|---|---|
| BFOA | 73.53 | 2742 | 1046.5 | 9,167,603 | 1,672,171 | 73.1 | [27] |
| WOA | 73.75 | 2702 | 1086.8 | 9,520,315 | 1,736,505 | 72.3 | [31] |
| PPBIL& PSO | 91.5 | 1569 | 2237.5 | 19,600,500 | 3,575,131 | 42.9 | [36] |
| DSCA-SOCP | 72.8 | 2945 | 842.8 | 7,382,799 | 1,346,623 | 78.5 | [37] |
| SPSO | 74 | 1800 | 1989 | 17,423,640 | 3,178,072 | 49.3 | [42] |
| ALO | 82.6 | 2041 | 1756.6 | 15,387,816 | 2,806,738 | 55.2 | [43] |
| FPA | 89.2 | 2125 | 1679.2 | 14,709,792 | 2,683,066 | 57.2 | [44] |
| GA | 81.75 | 2190 | 1606.7 | 14,075,130 | 2,567,304 | 59.0 | [45] |
| IHHO | 72.79 | 2923 | 864.7 | 7,575,035 | 1,381,686 | 77.9 | [46] |
| GAMS | 72.01 | 2931 | 856.0 | 7,498,648 | 1,367,753 | 78.1 | [47] |
| CBGA-VSA | 72.09 | 2945 | 842.1 | 7,376,708 | 1,345,512 | 78.5 | [48] |
| SPPA | 63.74 | 3495 | 251.7 | 2,205,242 | 402,236 | 93.5 | Proposed |
| WITHOUT | 208.5 | 0 | 3923.5 | 34,369,503 | 6,268,997 |
Table 4.
Cost reduction comparison of NW-2.
| Technique | (kW) | (kW) | (kW) | (kWh) | (kWh) | Cost Reduction | Ref. |
|---|---|---|---|---|---|---|---|
| WOA | 69.7 | 2645 | 1226.7 | 10,746,067 | 1,960,083 | 69.5 | [31] |
| PPBIL& PSO | 86.9 | 2028 | 1860.9 | 16,301,484 | 2,973,391 | 53.8 | [36] |
| DSCA-SOCP | 69.4 | 2625 | 1246.4 | 10,918,552 | 1,991,544 | 69.1 | [37] |
| SPSO | 36 | 1880 | 1958 | 17,152,080 | 3,128,539 | 51.3 | [42] |
| ALO | 70.8 | 2238 | 1634.8 | 14,320,410 | 2,612,048 | 59.4 | [43] |
| FPA | 71.7 | 2234 | 1639.7 | 14,363,772 | 2,619,952 | 59.2 | [44] |
| IHHO | 69.4 | 2629 | 1242.3 | 10,882,636 | 1,984,993 | 69.1 | [46] |
| GAMS | 72.1 | 2546 | 1328.1 | 11,634,068 | 2,122,054 | 67.0 | [47] |
| CBGA-VSA | 69.4 | 2625 | 1246.4 | 10,918,464 | 1,991,528 | 69.0 | [48] |
| PSO | 87.5 | 2835 | 1054.5 | 9,237,245 | 1,684,873 | 73.8 | [49] |
| SPPA | 46.9 | 2907 | 941.9 | 8,250,956 | 1,504,974 | 76.6 | Proposed |
| WITHOUT | 225 | 0 | 4026.9 | 35,275,644 | 6,434,277 |
Publisher’s Note: MDPI stays neutral with regard to jurisdictional claims in published maps and institutional affiliations. |
© 2021 by the authors. Licensee MDPI, Basel, Switzerland. This article is an open access article distributed under the terms and conditions of the Creative Commons Attribution (CC BY) license (http://creativecommons.org/licenses/by/4.0/).
Share and Cite
MDPI and ACS Style
Shahzad, M.; Akram, W.; Arif, M.; Khan, U.; Ullah, B. Optimal Siting and Sizing of Distributed Generators by Strawberry Plant Propagation Algorithm. Energies 2021, 14, 1744. https://doi.org/10.3390/en14061744
AMA Style
Shahzad M, Akram W, Arif M, Khan U, Ullah B. Optimal Siting and Sizing of Distributed Generators by Strawberry Plant Propagation Algorithm. Energies. 2021; 14(6):1744. https://doi.org/10.3390/en14061744
Chicago/Turabian StyleShahzad, Mohsin, Waseem Akram, Muhammad Arif, Uzair Khan, and Barkat Ullah. 2021. "Optimal Siting and Sizing of Distributed Generators by Strawberry Plant Propagation Algorithm" Energies 14, no. 6: 1744. https://doi.org/10.3390/en14061744
Note that from the first issue of 2016, this journal uses article numbers instead of page numbers. See further details here.