
Integrated Performance Optimization of Higher Education Buildings Using Low-Energy Renovation Process and User Engagement


1
Institute for Future Transport and Cities, Coventry University, Coventry CV1 5FB, UK
2
Faculty of Computing, Engineering and the Built Environment, Birmingham City University, Birmingham B5 5JU, UK
3
School of Energy, Construction and Environment, Coventry University, Coventry CV1 5FB, UK
*
Author to whom correspondence should be addressed.
Energies 2021, 14(5), 1475; https://doi.org/10.3390/en14051475
Submission received: 31 January 2021
/
Revised: 12 February 2021
/
Accepted: 17 February 2021
/
Published: 8 March 2021
(This article belongs to the Special Issue Buildings Energy Efficiency and Innovative Energy Systems)
Abstract
:Building performance improvement through low-energy renovation traditionally involves building performance diagnostics of the existing building, technology evaluation, selection and implementation. Effective building performance diagnostics, post-retrofit assessment and user engagement are essential to deliver performance as well as achieving socio-economic and environmental benefits at every stage of the renovation project life cycle. User’s views are often ignored when renovating a building, causing sub-optimal energy performance, user comfort and wellbeing. This paper seeks to critically evaluate the low-energy renovation process and the role of user and stakeholder engagement in the strategic implementation of low-energy retrofit technologies for performance improvement of higher education buildings. The research focuses on renovation methodology, innovative materials/systems and end-user engagement throughout the renovation project phases (pre-renovation, the renovation process and post renovation). A mixed research method was adopted, which includes building performance modelling, monitoring and user evaluation questionnaires pre and post-renovation. The research is part of European Union (EU)-funded project, targeting 50% reduction in energy consumption using innovative materials and technologies in existing public buildings. The surveys allow comparative analysis of comfort levels and user satisfaction as an indicator of the efficacy of renovation measures. A new renovation process and user engagement framework was developed. The findings suggest that there is a direct relationship between retrofit intervention, improving energy performance of low-carbon buildings and the comfort of occupants. The technologies and strategies also appear to have different impacts on user satisfaction.
1. Introduction
The function of buildings is to provide a comfortable internal environment that meets occupant satisfaction and wellbeing with optimum use of energy. Existing building stock across the European Union is ageing and failing to meet expected energy efficiency and environmental performance standards. Buildings account for 40% of total energy consumption in Europe [1]; therefore, improving energy efficiency and occupant comfort in existing buildings is essential to reduce energy dependency and greenhouse gas emissions. Indeed, the replacement rate for existing building stock is very low (1–2% per year). Arguably, one of the most cost-effective measures to meet energy reduction targets is to address the performance of existing buildings [2]. However, there are several challenges in the process. Recent building performance evaluation studies highlight the existing gap between predicted and actual energy consumption. They also reveal failure of buildings to meet essential energy, environmental and occupant comfort performance standards [3,4]. One of the reasons for the performance gap is human behaviour during construction and building use, highlighting the significance of user and stakeholder engagement at every stage of the project life cycle.
Policy debate seems to be more focused on energy savings and emission reductions, rather than empirical research regarding end-user perspective and wellbeing [5]. To contribute to energy reduction in the building sector, various green rating systems have been established globally to evaluate sustainability of construction projects [6]. Buildings certified by these rating systems are considered to consume less energy, providing a better living environment and contributing to the overall reputation of the properties [7]. However, research shows that green building designs do not automatically guarantee occupant wellbeing and satisfaction [8]. Current sustainability tools tend to focus on technical aspects such as energy consumption, water use or materials, prioritising quantitative over qualitative factors. Yet it is the qualitative factors by which most people judge buildings and their environments, hence the measure of human satisfaction needs to play a bigger role when evaluating the performance of buildings.
There is limited research focusing on the process of end-user engagement relative to indoor comfort levels and general management of buildings before and after building renovation. Technology Strategy Board retrofit for the future report [9] argues that “engaging residents from the start can increase their understanding and acceptance of the works, and this can be a defining factor for success”, highlighting the importance of continuous refining of the process of user and stakeholder engagement in building retrofit. This study seeks to determine effectiveness of low-energy renovation technologies and user engagement methodology in achieving energy performance improvement, indoor environmental quality and general management of existing higher education buildings. The study is part of European funded project on retrofitting solutions and services for the enhancement of energy efficiency in public edifications (RESSEEPE). The project developed and tested a variety of passive and active technologies to improve the energy and environmental performance of public buildings in three European cities representative of the breadth of EU climate conditions: Coventry (United Kingdom), Barcelona (Spain) and Skelleftea (Sweden). This paper focuses on the research carried out at two demo-sites buildings located at Coventry University in the United Kingdom.
2. Literature Review
2.1. Low-Energy Renovation in Higher Education Buildings
Further and higher education (FHE) is a fast growing sector, with student numbers increasing by 44% over in the past ten years; with annual energy costs for the FHE sector estimated at around GBP 400M, resulting in CO2 emissions of around 3.1 million tonnes per year [10]. Many universities own a considerable number of 1960s and 1970s buildings; as a result, they are facing problems of out-of-date building stock that are not fit for purpose [11]. Sustainable renovation can be a more viable, practical and potentially affordable solution compared to complete demolition and reconstruction [12].
A number of strategies have been identified as key to deliver performance in deep renovation of existing buildings. According to Ma et al. [13] the low-energy renovation of existing buildings has many stages including: “project setup and pre-renovation survey, energy auditing and performance assessment, identification of renovation options, site implementation, commissioning, validation and verification”. The success of each of these stages has significant impact on the efficacy of the renovation intervention measures. Other researchers have proposed similar approaches, such as Piaia et al. [14], who have developed a procedure for deep renovation consisting on four stages (4M): mapping, modelling, making and monitoring. However, each of these stages will only succeed with the support and engagement of key stakeholders, relative to their feedback and insights, that will ensure successful evaluation and implementation of the renovation measures. This is arguably one of the most important elements for reducing performance and gap and unintended consequences of low-energy renovation.
2.2. Users Perception of Indoor Environments
Knowledge about effects, latest advances in low-carbon design, impact of building technologies on users’ health and wellbeing is still limited [15]. Energy consumption of buildings depends significantly on the criteria used for maintaining indoor environmental quality (IEQ) (temperature, ventilation and lighting), building design and operation. Kang and Mak [16] found that thermal comfort, indoor air quality, acoustics and lighting levels have proven to be important factors that significantly affect building users’ comfort, wellbeing and work performance. Giddings et al. [17] found other factors such as the provision of artwork, personal control of temperature and ventilation to be significant in increasing stimulation and user satisfaction. They also found that the most significant factors to consider during design stage are user choice of layout, design and décor and break areas, suggesting that these factors should be incorporated in pre-renovation diagnostics.
Traditionally, users’ perception about indoor conditions is often measured through feedback questionnaires. Occupant feedback questionnaires have been used as part of post-occupancy evaluation protocols (POE), as they provide an understanding of user satisfaction [18]. Meir et al. [19] categorised the benefits of POE into short, medium and long term. Short-term benefits include obtaining users’ feedback on problems in buildings and the identification of solutions; medium-term benefits include feed-forward of the positive and negative lessons learned into next building life cycle; long-term benefits aim at the creation of databases, update, upgrade and generation of planning and design protocols paradigms. Hay et al. [20] argued that the role of POE in systematic learning from previous projects is critical “to improving building performance, resulting in a built environment that better fits the needs of clients, end users, wider society and the environment”.
Baird [21] measured user perception in sustainable buildings and found that “refurbished buildings can rate very highly and, in some cases, surpass new buildings, and there are indications that a design process that includes the users can result in better perception scores”. In renovation projects, there is often change in internal layout mainly for space optimisation and utilisation purposes. These changes and their impact on the current users of the building should be of paramount importance. Malkoc and Ozkan [22] argue that assessing reaction of existing users using post-occupancy evaluation is the most efficient way to enhance space quality and important for developing future design. This demonstrates the need to engage the users at different stages of design and construction to achieve maximum satisfaction and energy performance.
2.3. Occupants’ Satisfaction in Educational Buildings
There is a growing concern about indoor environmental quality in educational premises. Many research studies show that indoor environment conditions can affect productivity and learning performance of individuals in non-domestic buildings [23]. Students in buildings with good environmental conditions earn test scores 5–17 percent higher than scores for students in substandard buildings [24] and have up to 14 percent lower student suspension rates [25]. Considering this, internal conditions and user comfort play a critical role in teaching and learning. Kim et al. [26] used student post-occupancy evaluation to establish space choice and rejection model. They established three categories of relationships: space-oriented relationship with space environmental performance and spatial form; user-oriented relationships with capacity and locational accessibility; equipment-oriented relationships with equipment adequacy and equipment conditions. In every major renovation project, these relationships should be clear to support informed performance improvement and maximise occupant’s satisfaction; otherwise, uncomfortable occupants may take adaptive actions to improve their comfort, which often leads to sub-optimal performance.
Despite the evidence on the effects of poor indoor environments in productivity and learning performance, energy refurbishment projects in higher education buildings tend to focus on energy savings, giving less attention to occupants’ comfort and engagement. Existing research in energy refurbishment in higher education buildings present optimized methodologies for reducing energy consumption [27,28], performance gap [29] and preserving the historical value and building usability while improving energy savings [30,31]. The lack of studies incorporating a holistic approach where the views of stakeholders are incorporated demonstrates the need of research in the area of user engagement, as a key element to minimise the energy gap and ensure user comfort and satisfaction. Thus, renovation of higher education buildings can be used for academic exercise to understand occupants’ satisfaction, behaviour and patterns of use before and after renovation processes.
3. Materials and Methods
Multi-methods research design involving use of case studies and QUAN-QUAL concept [32] was adopted; meaning that quantitative method is the lead data collection instrument, while qualitative data are used to support and validate the quantitative findings. The study adopted sequential explanatory type of mixed methods design strategies, because the research inquiry is designed to explain relationship between end-user engagement, indoor comfort levels and general management of the buildings before and after renovation. Research ethics approval was sought from Coventry University Research Ethics Committee, and it was granted.
The research monitors and analyses the implementation of low-energy renovation technologies, comfort levels and user satisfaction in Coventry University demo sites. Building performance modelling, monitoring and user evaluation questionnaires have been used before and after renovation. The surveys are designed to investigate user perception, develop a strategy for responding to negative changes, improve user comfort, measure the efficacy of the renovation actions, learning from the process and use the variables studied for improving future renovations. Integrated Environmental Solution Virtual Environment (IES-VE) has been used to model and simulate the performance of the building and several renovation technologies. The renovation technologies have been implemented in two real case study buildings located at Coventry University.
3.1. Case Study Location and Description
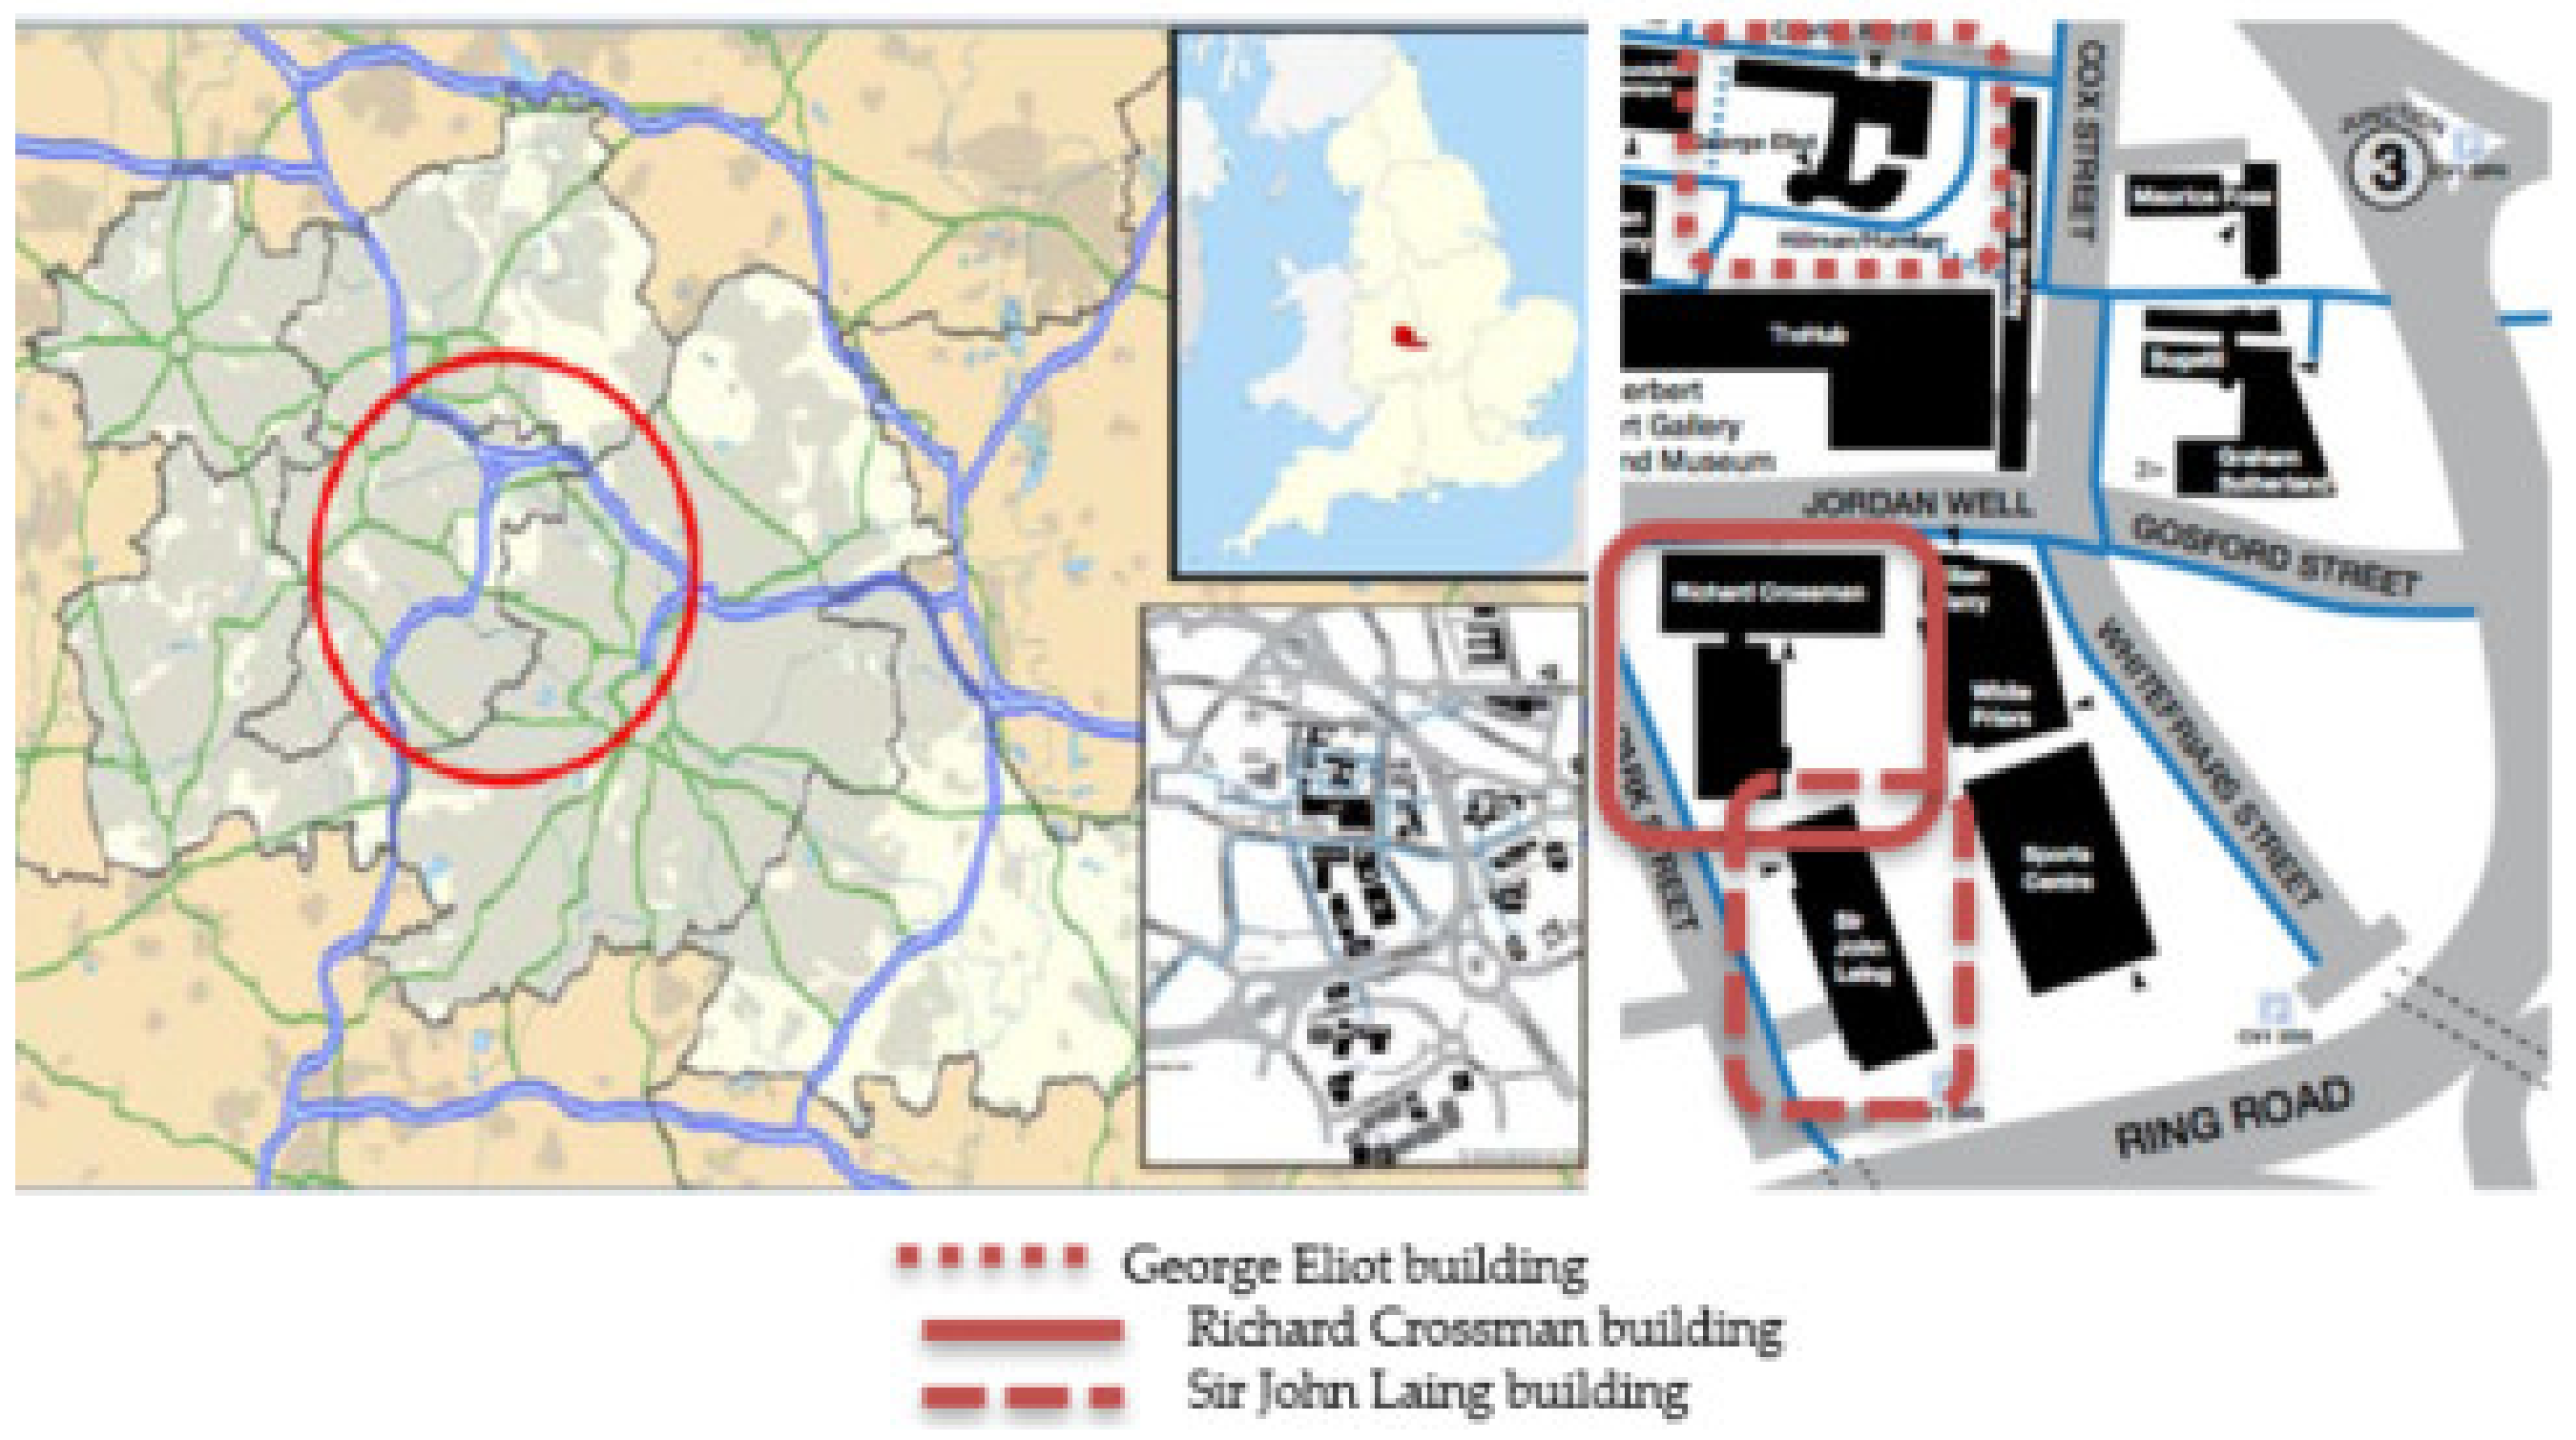
The study location was in Coventry, United Kingdom. Two buildings, namely, Richard Crossman (RC) and Sir John Laing Building (JL) owned by Coventry University have been used for the experiments. Coventry University and Coventry City Council own about 70–80% of the built assets within the city centre. Figure 1 shows the location of the case study buildings and the city centre.
Building Physical Properties
The case study buildings are typical 1970s buildings constructed of brick and single glazed metal frame windows. JL is a two-storey building with net floor area of 3660 m2, and RC is a five-storey building with a net floor area of 9306 m2. The façade in both buildings consists of brick masonry cavity wall with 6mm single glazing metal frame windows and concrete structure. Both buildings have a Display Energy Certificate Rating of “C”, which is an average energy efficiency rating. Table 1 shows full description of the case study buildings, pictorial view, year of completion, net area, electricity, gas and water consumption and carbon footprint. Recent planning approach for Coventry City Council moving forward is the recognition of a city living lab status, “establishing Coventry as a test-bed, incubation hub and international showcase for low carbon innovations” [33]. The living lab status is key element to this project. Thus, building selected encompasses a living lab ethos, acting as a live experimental facility for several innovative technologies. The heating energy data are based on the net heated floor area using the Display Energy Certificate calculation methodology. Carbon emission factor provided by UK Government to support Carbon Reduction Commitment (CRC) reporting has been used to calculate the total carbon emission (electricity—0.34885 kg CO2/kWh, natural Gas—0.2042 kg CO2/kWh and water—0.344 kg CO2/m3.) [34].
3.2. Decision-Making Process
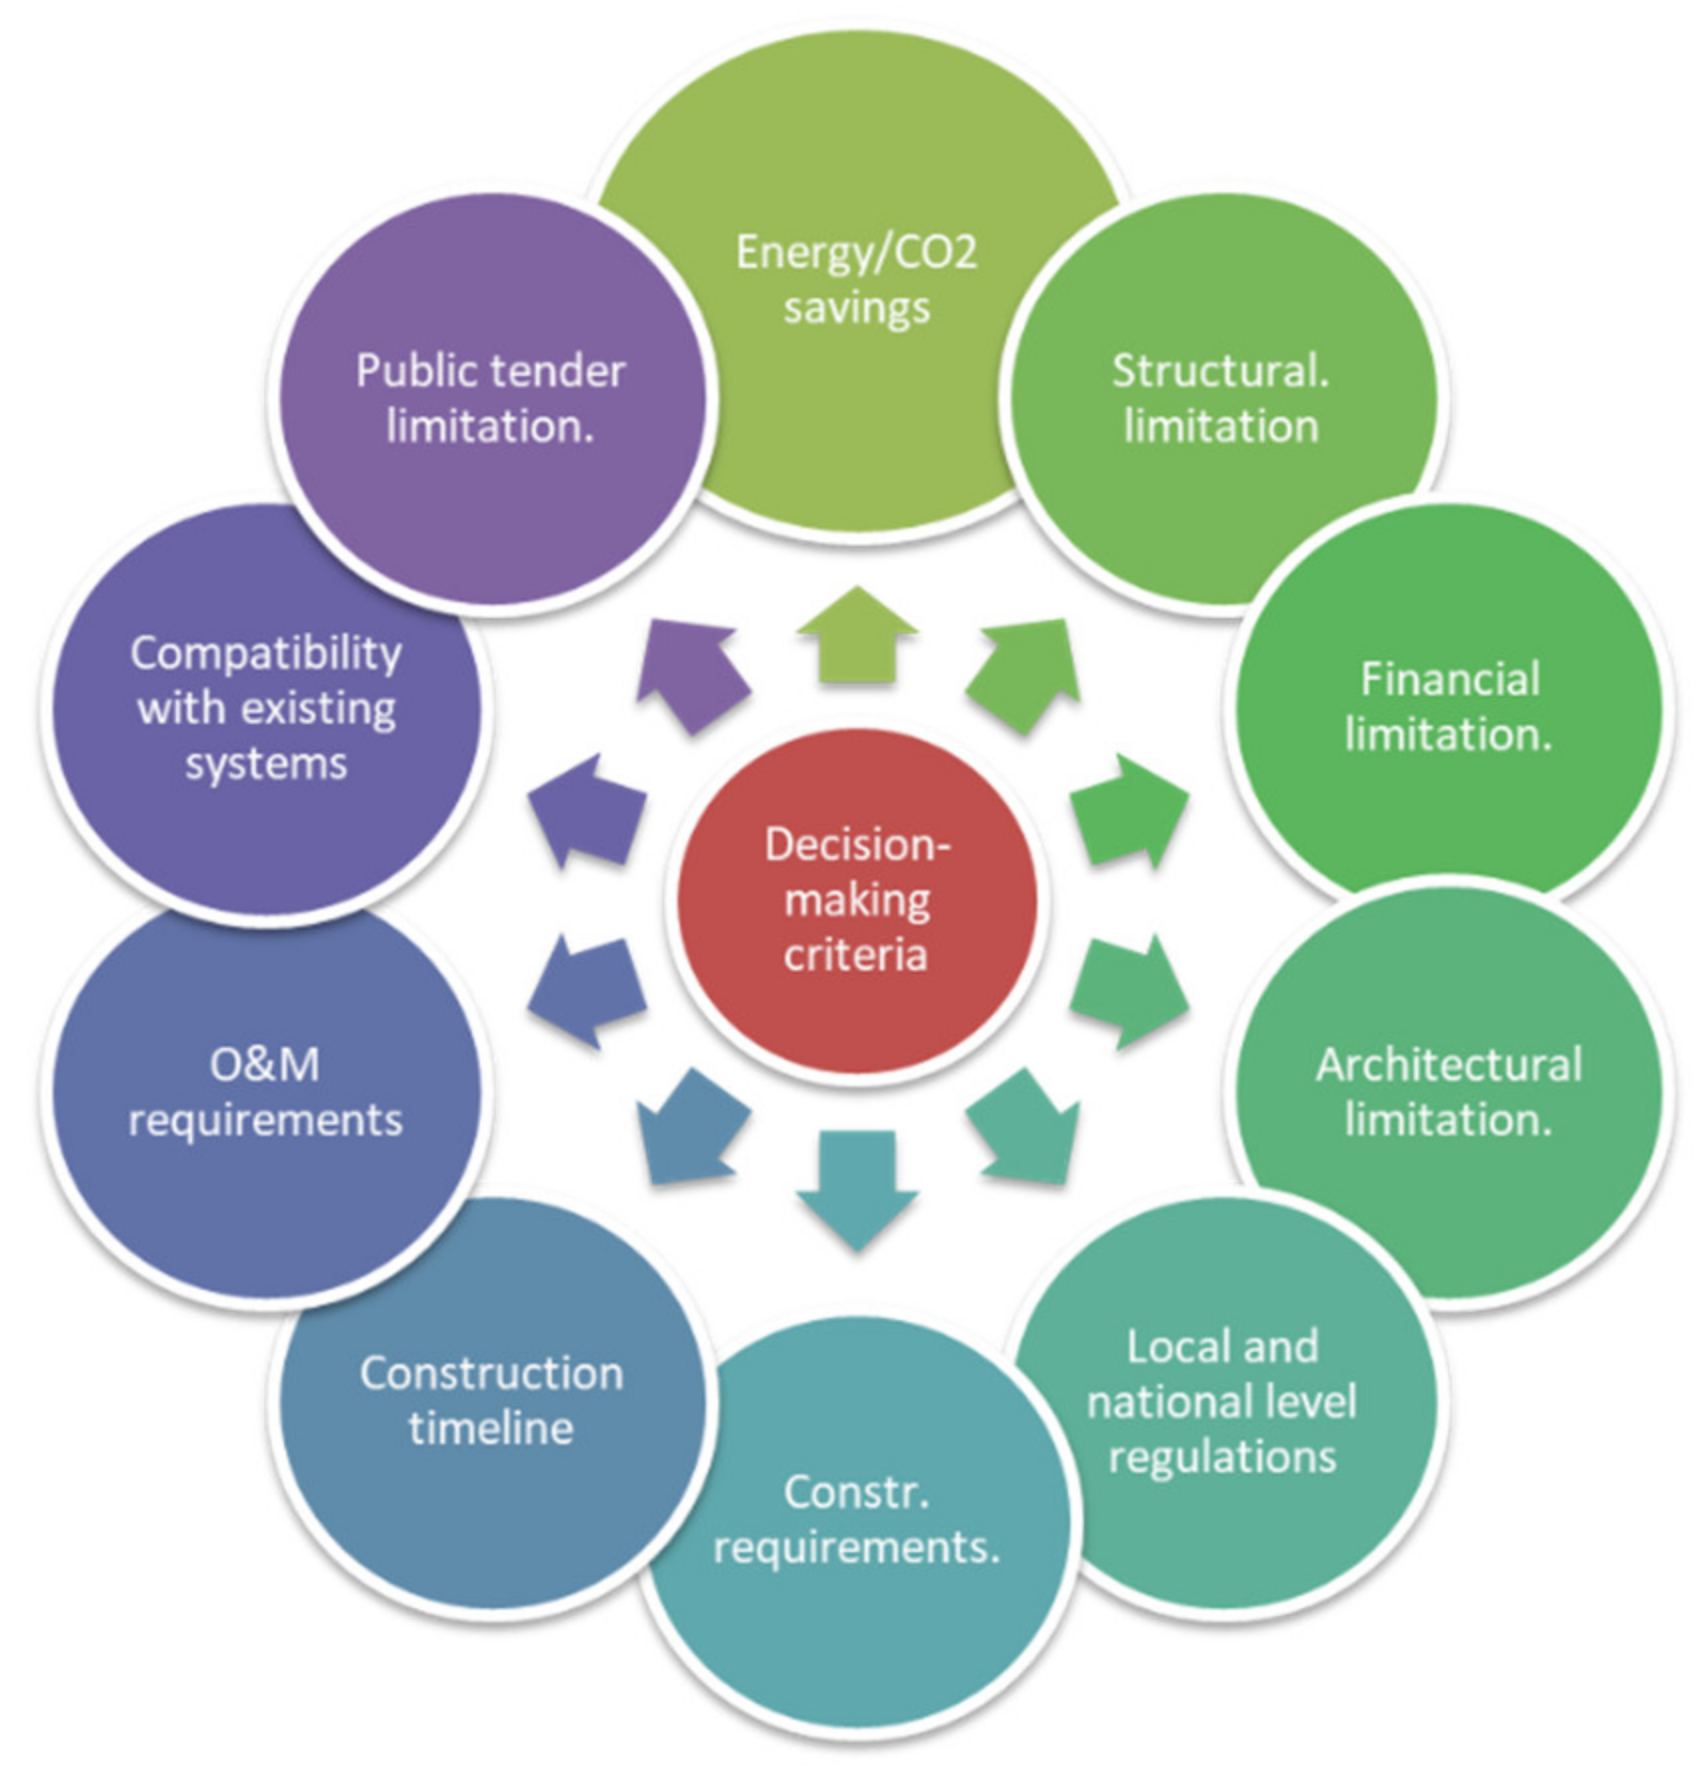
Due to the complexity of building renovation, many factors influence the selection of technologies. Figure 2 shows the decision-making criteria that informed the selection of the technologies and strategies for the demonstration buildings, most of these criteria involve user and stakeholder engagement. The decision-making criteria includes buildings related structural and Operation and Maintenance (O&M) requirements, organisational financial constraints, policy and regulatory limitations. Using this methodology, a decision-making matrix was developed, as shown in Table 2, to compare different materials and technology solutions to provide an initial basis for selecting the most efficient, cost effective and most beneficial solutions for each demo site to achieve the best possible renovation interventions based on the energy and indoor environmental quality requirement of the client.
3.2.1. Decision-Making Matrix
From the decision-making process, a decision-making matrix was derived for comparing different solutions to provide an initial ranking of the selection of the most efficient, cost effective and most beneficial solutions for each demo site to achieve the best possible retrofitting interventions. The decision-making matrix includes the different intervention materials considered for the retrofit, whilst marking it against the decision making. The matrix provides an overall cumulative score for each technology for each case study site (taking into consideration location, climatic conditions and use), which contributes towards selection of the optimum technology selection for the most beneficial renovation. The decision-making matrix uses both technical and financial feasibility, client and stakeholder perspectives and energy and environmental performance potentials.
3.2.2. Strategies for Technology Selection
A feasibility study of potential technologies was conducted with a target for reducing building energy demand. The construction materials and technologies proposed relate to envelop insulation, building services, passive solutions and renewable energy systems, ranging from absolute state of the art to market ready materials and technologies. Table 3 shows the list of technologies considered for the two demonstration buildings.
After the feasibility analysis, a twin strategy for implementation and testing of these technologies was developed. The first strategy was based on a whole-building renovation in RC building. In this strategy, advanced market-ready technologies for low-carbon renovation were implemented at a large scale. The second strategy was based on the design and implementation of innovative technologies for low-carbon renovation in selected areas of the JL building to test their efficacy in a living lab demo site.
Table 3 summarises all the materials and technologies considered for the renovation project. The innovative retrofit technologies include those that have been technically advanced, adapted, within the project; this includes aerogel-based insulating mortar, vacuum-insulated panels, ventilated façade and PCM seasonal thermal energy storage. These new technologies have been combined with other market ready technologies, such as Solar photovoltaics (PV), Electrochromic (EC) windows, light-emitting diode (LED) lights and Expanded Polystyrene with Graphite (EPS-G) insulation panels.
3.2.3. Strategic Intervention during Building Renovation
The low-carbon technologies implemented in RC and JL buildings have been summarised in Table 4, which includes LED lighting, solar photovoltaic panels, a building management system (BMS), double-glazed windows and thermal insulation for RC building; whereas for JL building, a range of fabric state-of-the-art technologies are included, such as aerogel-based mortar, vacuum-insulated panels, ventilated façade, EPA-G panels and passive PCM tube. They have been selected based on the decision-making criteria and decision-making matrix presented in Figure 2 and Table 2 in response to the key energy and IEQ challenges identified in the case study buildings.
3.3. Quantitate and Qualitative Data Collection
The research design entails user comfort evaluation exercise and energy evaluation using both quantitative and qualitative research methods. The data collection instrument includes questionnaires distributed to occupants before, during and after the renovation to collect data on perceived comfort, level of user control and level of user engagement in the renovation process shown in Table 5. The questionnaires have been distributed using hardcopies and BOS online platform. Population sample includes both students and staff of Coventry University. All data have been collected from October 2015 to February 2017. The questionnaires were designed following the standards EN 15251 and ISO 7730 [45,46]. The indoor environmental parameters included in the survey followed the recommendations of EN 15251, which identifies parameters for monitoring the indoor environment as recommended in the Energy Performance of Buildings Directive. These parameters refer to thermal environment, indoor air quality, humidity, lighting and noise. ISO 7730 was followed for assessing the general thermal sensation and degree of discomfort (thermal dissatisfaction) of occupants, through the analysis of the 7-point thermal sensation scale, based on the heat balance of the human body.
The questionnaire consists of four parts (Table 6). Part 1 targets user information, including age, gender, seat position, occupancy hours and the main work activity of respondents. Parts 2, 3 and 4 include a quantitative set of questions based on a 7-point scale and open-ended questions to capture qualitative views of users such as their experiences pre, during and post building renovation. Part 2 involves the perception of respondents’ relating to four key IEQ conditions (air quality, thermal environment, lighting environment and acoustic environment), rating 1 (very dissatisfied) to 7 (very satisfied). Temperature and air quality are rated 1 (very hot) to 7 (very cold) and from 1 (fresh) to 7 (stale), respectively. Part 3 investigates the level of user control of environmental conditions in the work area. Participants were asked to rate the level of heating, cooling, ventilation and lighting control from 1 (no control) to 7 (full control). Part 4 assesses the overall building performance from 1 (unsatisfactory) to 7 (satisfactory). An additional set of questions (part 5) have been included for RC to evaluate the level of satisfaction with the renovation process regarding indoor environmental quality improvement, disruption and level of user engagement during the design and construction stages. The stratified sampling method was used to target staff participants in RC building. The questionnaire has been distributed using staff mailing list, after completion of renovation works to assess IEQ improvement, level of engagement and project disruption (Table 2). The questionnaire was designed to make participants reflect on the changes between pre and post renovation environmental conditions.
3.4. Energy Modelling
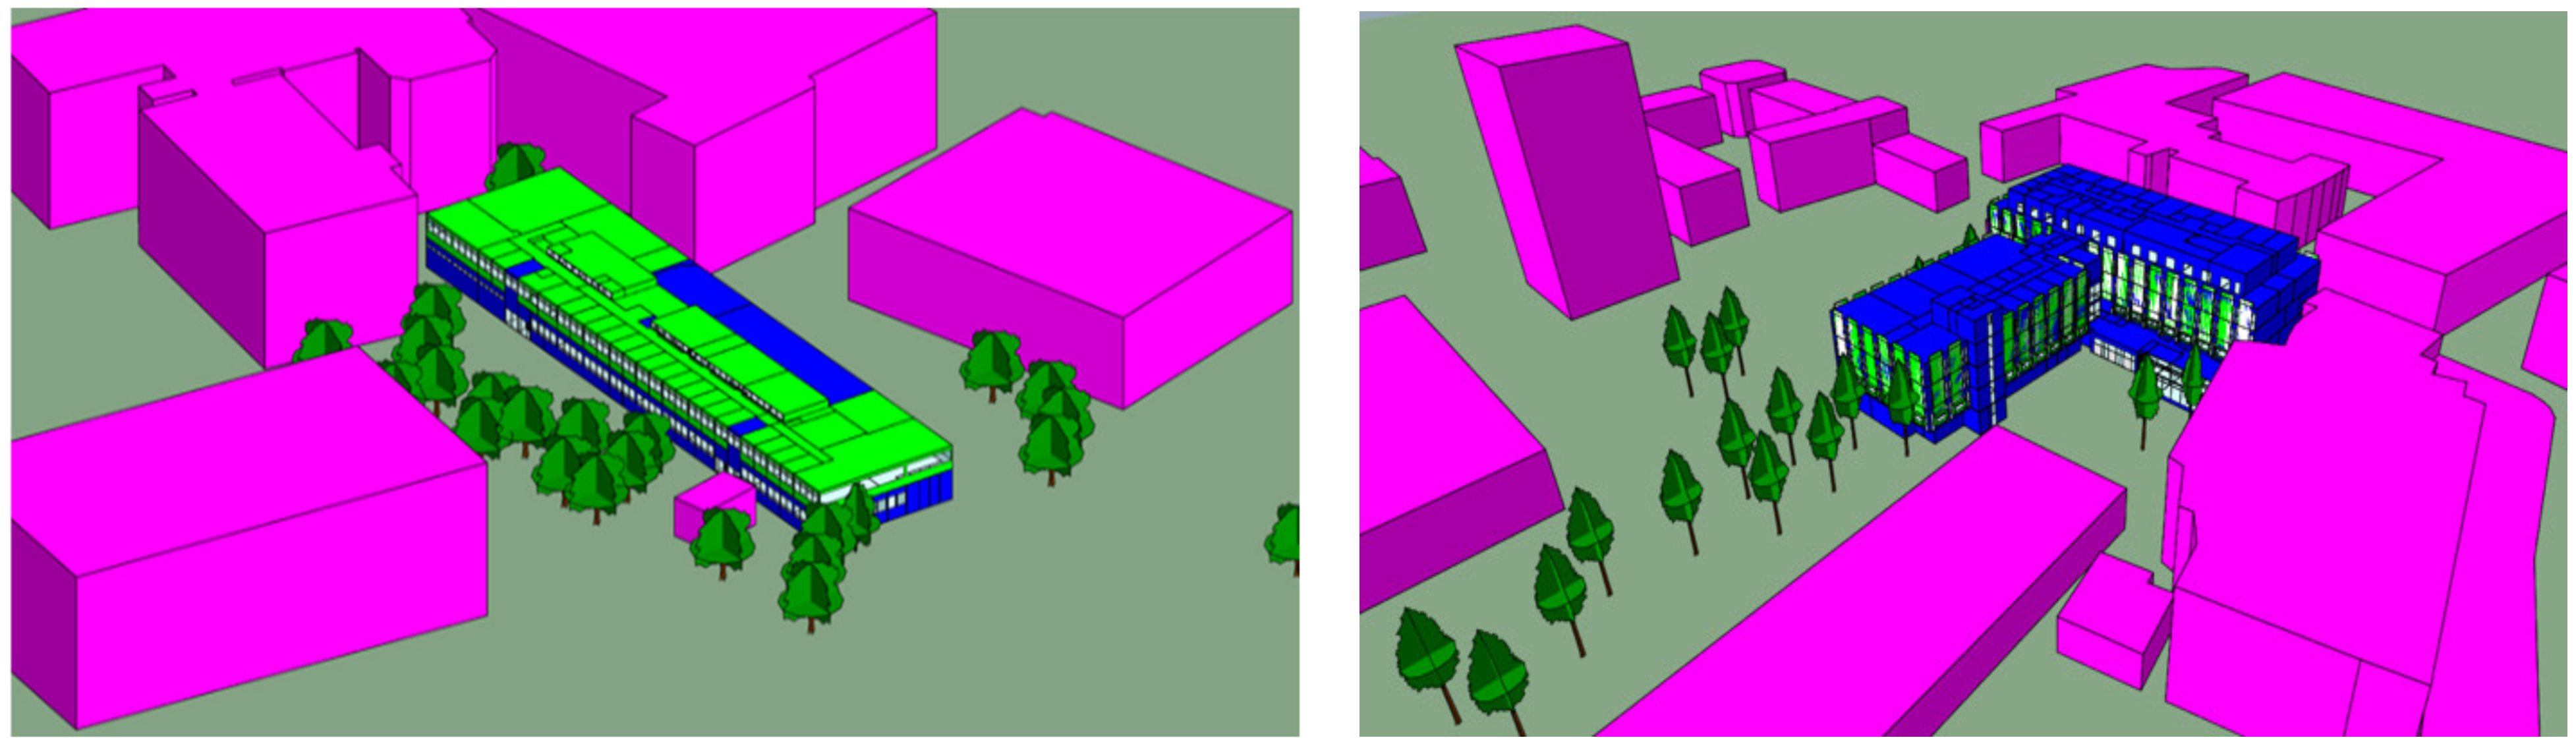
Building performance modelling and simulation has been used for building performance diagnosis, selection and optimisation of the different technologies. The building performance diagnosis methodology includes predicting potential impact of renovation technologies on the building energy and environmental performance has been assessed using building energy performance analysis simulations software IES Virtual Environment (IESVE), whole building modelling and simulation software (Software by Integrated Environmental Solutions Limited, Glasgow, UK). There are a number of building and system modelling software tools used within industry and academia for the predictive analysis of building systems and their impact on energy and environmental performance. Each program has unique features in terms of modelling resolution, solution algorithms, intended target audience, modelling options and ease of use vs. flexibility [47]. IES Virtual Environment (IESVE) is an in-depth suite of integrated analysis tools for the design and retrofit of buildings, which is widely used for research and industrial applications within the building services industry. IES-VE software 2018 version [48] has been used for the analysis. Crawley et al. [49] categorized the IESVE as one of the software that has undergone most rigorous validation studies in addition to other software such as EnergyPlus (Software by Department of Energy’s (DOE) and National Renewable Energy Laboratory (NREL) USA)., ESP-r (Software by University of Strathclyde, UK), ICE ((Software by Ice Edge Business Solutions, Ltd., USA) and TRNSY(Software by University of Wisconsin, USA) after robust critical comparison of their features and capabilities for building energy simulation programs. The first stage was to establish building information for RC and JL using legacy data as well as different retrospective surveying methods. The building data have been used to create an intelligent BIM models using Autodesk REVIT and IESVE dynamic energy simulation model with the building geometry, materials, buildings systems and building occupancy and use profile (Figure 3).
To maximise accuracy of the building performance prediction, three different sets of simulations were performed. The first set of simulations for energy savings were carried out on the pre retrofitting stage where no technologies had been installed to establish energy performance baseline scenario. The next set of simulations were carried out with the technologies proposed for each demo site, taking into consideration the exact location and installation of the technologies. The final set of simulations provided an extrapolation where the performance of the technologies were extrapolated to the whole building scale. The simulation results had been collected and analysed and used at different stages of the renovation project. The results also form the basis recommendations and prioritisation of technology selection and for the future verification and correct use of these technologies on the final installation places (demo sites).
4. Result Analysis
The estimated population in the buildings are 310 and 1378 for JL and RC, respectively, with staff population considered as stable. Indeed, students’ population are transient and, therefore, difficult to estimate with certainty, and it was estimated based on the average student population of the various modules using spaces in the buildings. Table 7 shows the distribution and characteristics of building users that responded to the questionnaire both before and after the various renovation actions were implemented, in JL, and after renovation was completed in RC.
As shown in Table 7, the response rate was higher in the JL Building (between 65 and 91.43%) than in the RC Building (48%). Perhaps, differences in response rate are because hard copy questionnaires were distributed and collected at JL, whereas online questionnaires were used in RC Building. The questionnaires in JL were distributed in person during class time, in the case of the Architecture Studio, or office by office. This action led to a considerable increase in the response rate.
4.1. Quantitative Data Analysis
SPSS version 25 and MS Excel have been used to analyse questionnaire data. The data analysis revealed Cronbach’s alpha sigma value of 0.71; meaning that the internal reliability of the quantitative data is very good. For emphasis and better understanding of the study, data collected were classified into five categories namely: individual factors, IEQ aspects, personal control, overall building conditions and renovation process. Subsequently, the data were analysed based on each individual building.
4.1.1. John Laing Building
Table 8 summarises the descriptive statistics of JL results pre- and post-renovation. Questions A2.1 to A5.3 are described in Table A1 in the Appendix A. Table 8 shows the statistical analysis of the data based on 7-point scale from 1 (uncomfortable) to 7 (comfortable). The results infer that classrooms participants (students) noticed a slight improvement in the overall thermal conditions in winter (A2.3), with a comfort mean value of 4.17 after renovation compared to 3.47 before renovation; the overall conditions in summer (A2.6), with a mean value of 4.17 after renovation compared to 3.81 before renovation. Temperature conditions (A2.1 and A2.4) improved, with the indoor environment being warmer in winter and cooler in summer. The result reveals improvement in user satisfaction with overall comfort condition in the building (A5.1) with a mean value of 4.00 after renovation compared to 3.51 before renovation and a healthier indoor environment (A5.3) with a mean value of 3.60 after renovation compared to 3.40 before renovation. In terms of spread, IEQ responses after renovation have a lower variance, and therefore, standard deviation, than before renovation. This means that there is no significant change in IEQ conditions post renovation, but there is a consensus among students that indoor conditions have improved. Findings from the study also infer that installation of a passive low-carbon technology such as PCM tubes made a positive impact on the indoor environment, because students identified indoor air temperature to be more stable both in winter and summer (A2.2 and A2.5). Note: PCM technology helps to reduce peak temperatures to a more stable indoor environment.
Similarly, staff identified significant improvement in the overall comfort of the offices (A5.1), with a mean value of 3.60 after renovation compared to 3.29 before renovation works as illustrated in Table 8. The perception of users regarding indoor temperature and air quality in winter show an improvement (A2.1 and A2.2) with a less cold environment and more stable air temperature. However, temperature conditions in summer (A2.4) did not show significant improvement with a mean value of 2.40 after renovation compared to 2.71 before renovation (rated on a 7-point scale from 1 (too hot) to 7 (too cold)). Additionally, variance is higher after renovation for summer conditions, which indicates a considerable performance difference between renovated offices. This might be related to the fact that PCM tubes were installed only in two offices, where staff benefitted from the reduction of up to 4 degrees Kelvin in the hottest days of summer. Despite the temperature reduction, the general user perception for the PCM renovated offices did not show any significant improvement in the summer temperature satisfaction (A2.4). However, an improvement in temperature stability was observed (A2.5) and overall conditions in summer (A2.6), as shown in Table 9. This might be linked to lack of night-time ventilation, because it was observed that rooms with PCM were warmer during early morning periods compared to rooms without PCM. Possibly, the issue could be avoided using effective night ventilation to remove the heat absorbed in the PCM during hot summer afternoons.
4.1.2. Richard Crossman Building
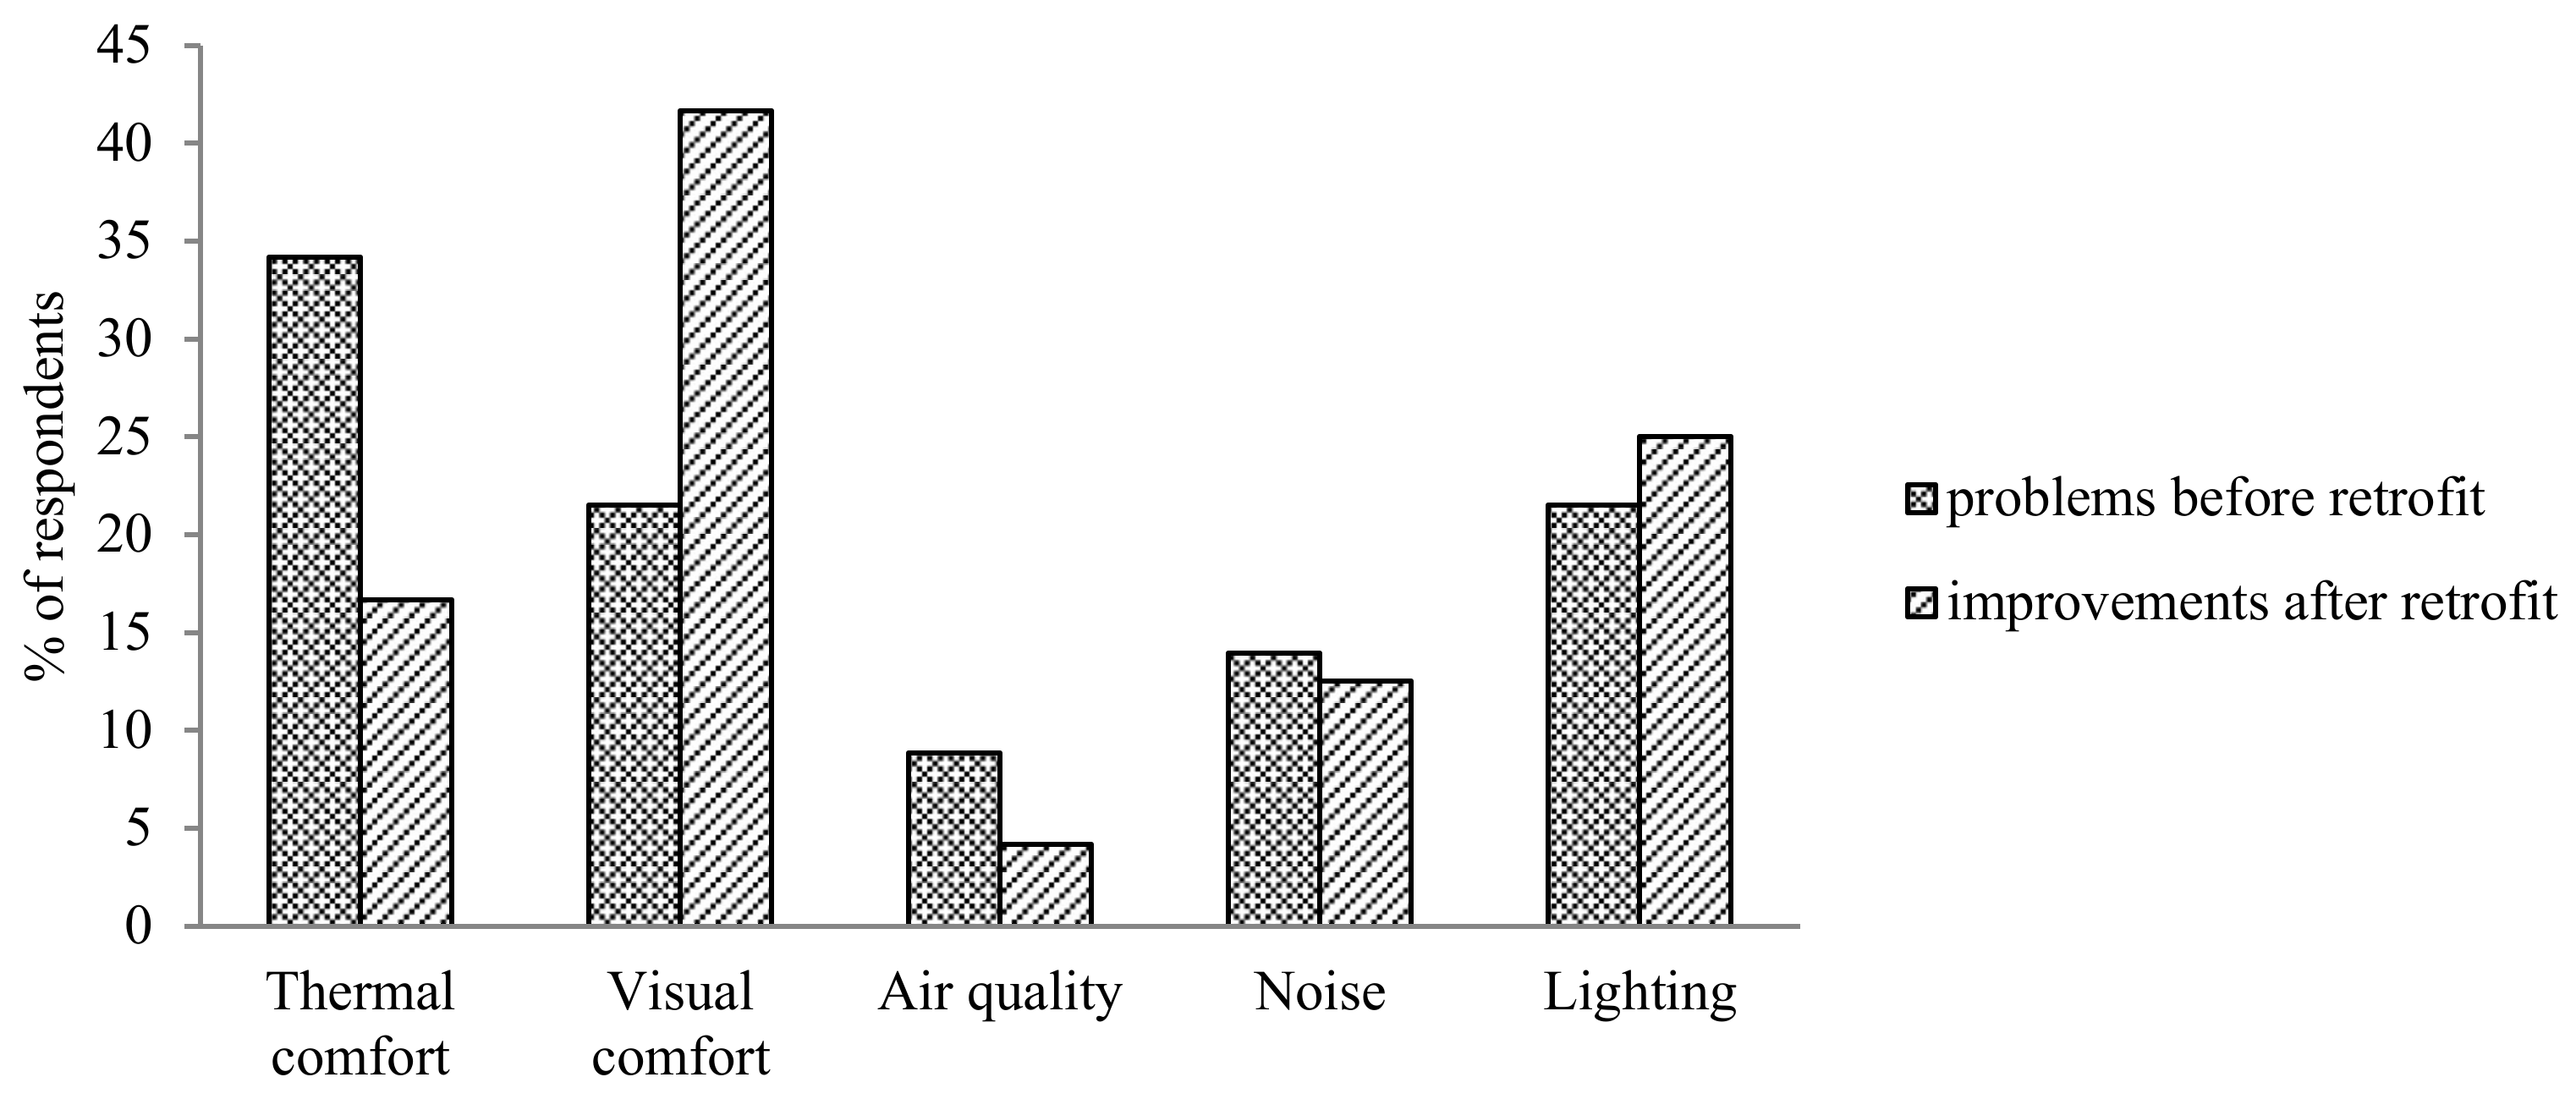
As mentioned in the research design, additional questions related to key problems before renovation, improvement of indoor environmental parameters and levels of stakeholder engagement with the renovation work were added to allow for comparison of the thermal comfort before and after the renovation. Figure 4 shows the indoor environmental parameters identified by study participants as major problems before low-carbon retrofit and level of improvement of the same factors after renovation. Respondents rated thermal comfort as the most important as the main indoor environmental problem before renovation 34.18%, followed by lighting/visual comfort at 21.52%, noise 13.92% and air quality by 8.86%. After renovation, visual comfort was identified as most significant improvement rated 41.67%; followed by lighting 25%, thermal comfort 16.67%, noise 12.50% and air quality 4.17%. The results obtained show that, although thermal comfort and noise have experienced some improvement, visual/lighting comfort experienced more significant improvement. This assessment is positive, considering the fact that visual comfort and lighting were identified as key environmental problems before renovation works.
Table 10 presents findings relating to IEQ questions. The assessment of overall thermal conditions in winter (A2.3) and summer (A2.6) is average, with mean values of 3.27 and 3.39, respectively. A5.3 has a low variance in relation to the other variables. All winter conditions (A2.1, A2.2 and A2.3) have a variance higher than 2.0, which highlight the difficulty of achieving uniformity and consistency of thermal comfort with new open-plan office layout design. Overall, the values obtained show that users are more satisfied with thermal conditions in summer compared to winter.
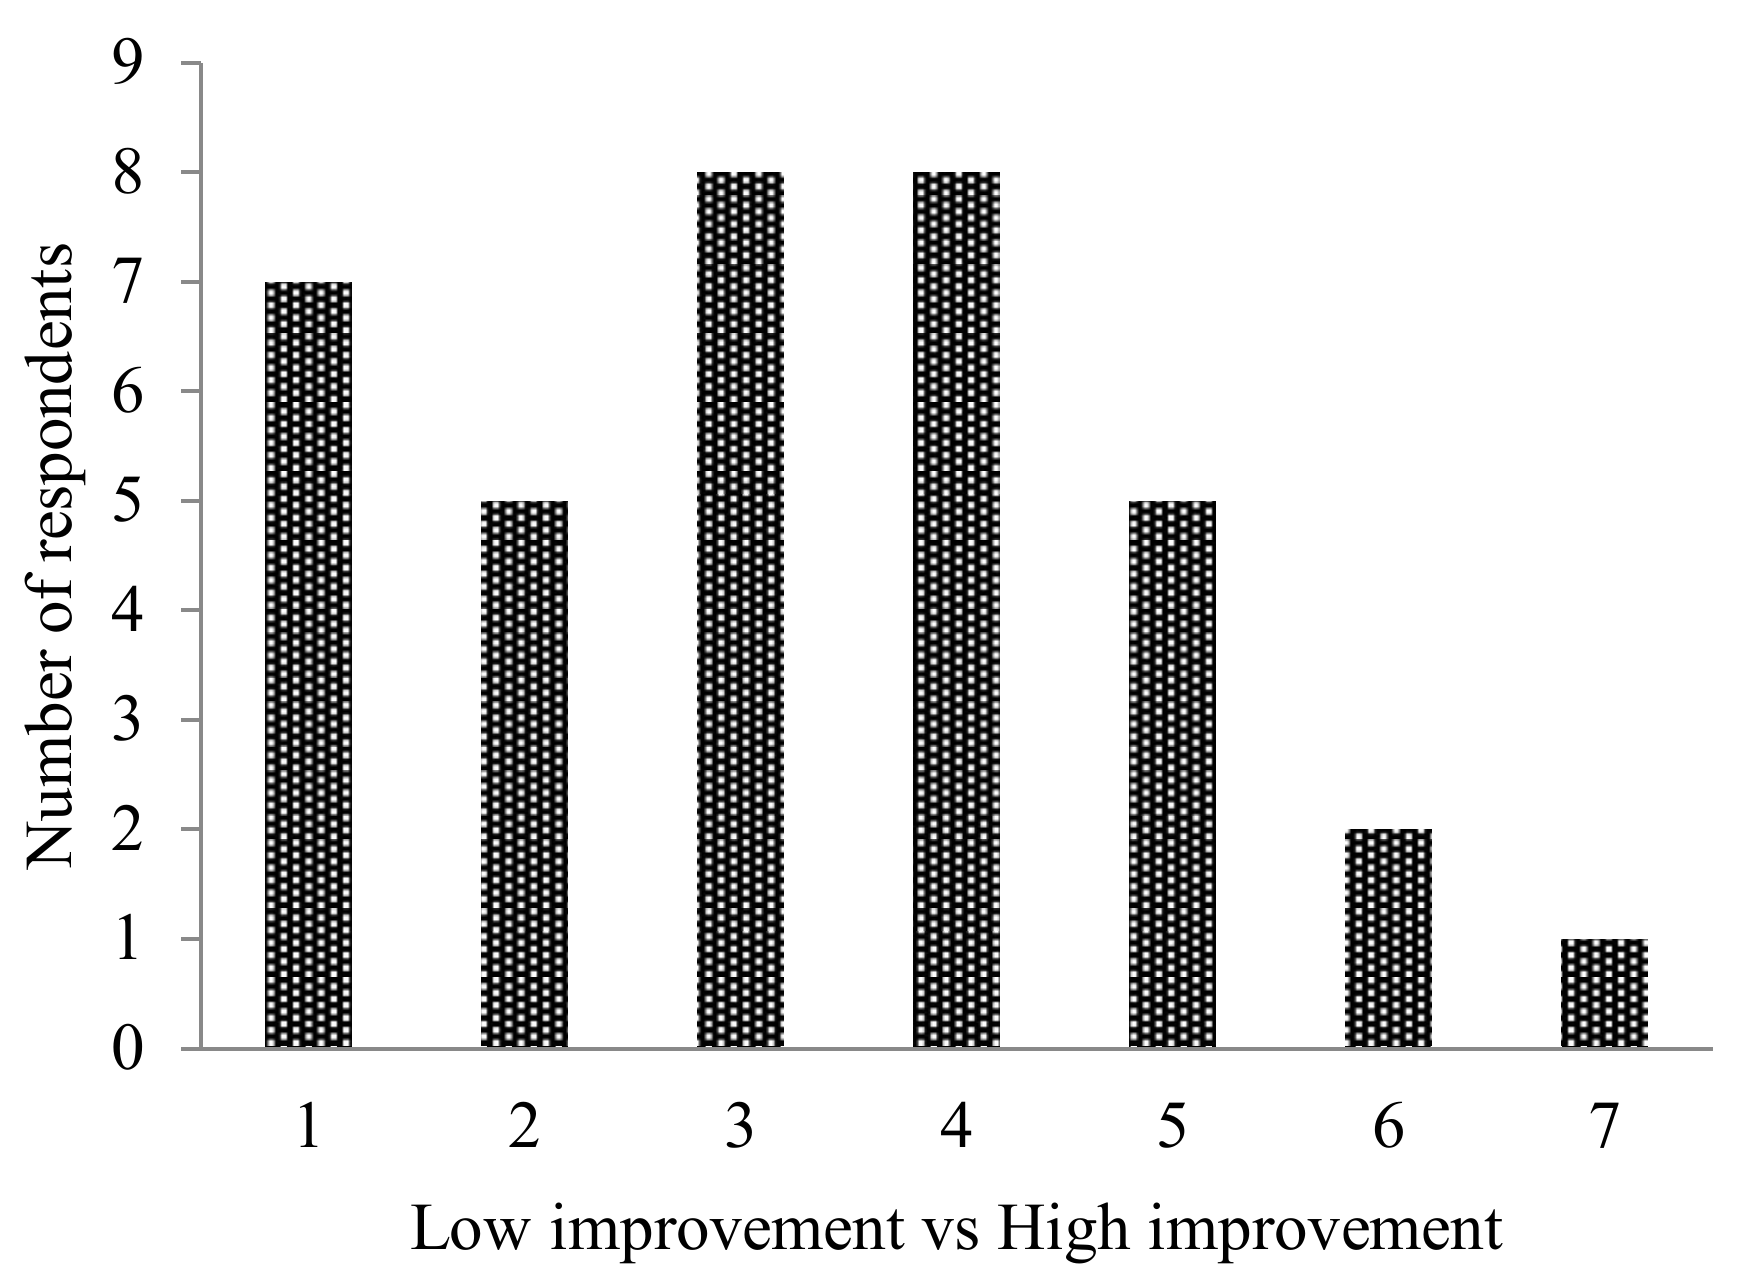
Significant improvement (mean value of 3.25) was observed for overall assessment of indoor environmental quality improvement (B.8), shown in Figure 5, similar to the overall IEQ of the building (A5.1), which is 3.46. Though variance for most variables is greater than 2.0, IEQ questions were included in the same questionnaire with additional questions about engagement in the renovation process and disruption experienced, which may have led to some bias in user responses.
4.2. Qualitative Data Analysis
Questionnaires had open-ended questions to providing opportunity to express views in more detail. To ensure validity of qualitative process; three main areas were addressed: production (questionnaire design, circulation and data recording), presentation (replicability, valid inference and data arrangement) and interpretation (data discussion). Content analysis is used for qualitative data.
Textual contents of the open-ended questions were transcribed into manuscript, inputted into NVivo 12 software and coded using key study themes. For example, when participants were asked to express their view concerning whether they observed noticeable improvements since building renovation; a host of issues was raised about the subject matter. Key issues observed by participants are mainly related to aesthetic improvements and new office arrangements due to new office layout and space allowance rather than indoor environmental aspects. For example, some comments highlight an increase in the noise pollution experienced, causing disruption and affecting staff concentration levels. This is due to the new office layout after renovation (from small offices to open-plan offices), which means a higher density of occupancy per unit area causing significant changes to the working environment compared to pre-renovation. This further emphasizes the need for robust user engagement during renovation planning to ensure user awareness and input into planned changes and the possible positive and negative impact of these changes so they can adapt to them when reoccupying the building post renovation.
In terms of lighting conditions, study participants claim to miss natural light because windows were small and have to rely on artificial light. Additionally, the new deeper open-plan offices have significantly less daylight penetration compared to perimeter offices before renovation. Though, users generally felt that lighting levels improved significantly during post renovation, due to the installation of new strip lighting, they find these lights to be very bright, causing glare and complaints of headaches and migraines. Overall, participants claim that there was significant improvement in indoor air quality, thermal comfort and room lights after renovation.
4.3. Energy Performance Result
Several simulations had been carried out regarding the demo sites, with simulations for a pre-renovation, post-renovation and post-renovation with renovation extrapolation. Through the development of the energy models and the building performance analysis simulations, the results summarised in Table 11 are derived showing the results of building energy performance based on the three scenarios for each of case study building.
Three scenarios have been presented in JL building, which include pre- and post-renovation results, because the renovation did not cover the total building area. A third scenario was created, and the results have been extrapolated based on the assumption that the total floor area of the building will be renovated, this has been referred to as “post full”. The results for Richard Crossman Building have only two scenarios simulated, due to the full-scale renovation plans; therefore, the extrapolation and the real intervention are the same. The results show the Richard Crossman Building having energy savings of 49%, which is a significant improvement compared to the base case scenario. The improvement is down to a mix of technologies targeting the building envelope, glazing and lighting. This includes the use of light-emitting diodes (LED) lighting, changing of the glazing and windows to a more efficient glazing system and frames and the improvement of the roofing material.
Furthermore, all three simulations were carried out for the JL Building, with the results showing a 10.58% savings in terms of energy performance. The savings are not as significant compared to the RC Building because the JL Building has been chosen as a living lab testing facility for the innovative renovation solutions. Different materials were selected at small scale for testing their efficacy. Further analysis is required to compare the different innovative materials at full extrapolation to find the most empowering innovative technology for optimum performance.
The results of the modelling of RC show significant reduction in total energy consumption for the entire building in the region of 49%, which meets the initial project objective of 50% post retrofit energy reduction. The modelling shows an increase in electricity consumption in the retrofit scheme due to increase in air-condition in areas that where otherwise naturally ventilated. Even though there is slight increase in electricity consumption, this will be upset by the 75 kWp Solar PV system integrated in the RC building.
4.4. Proposed New Methodology for User Comfort Evaluation
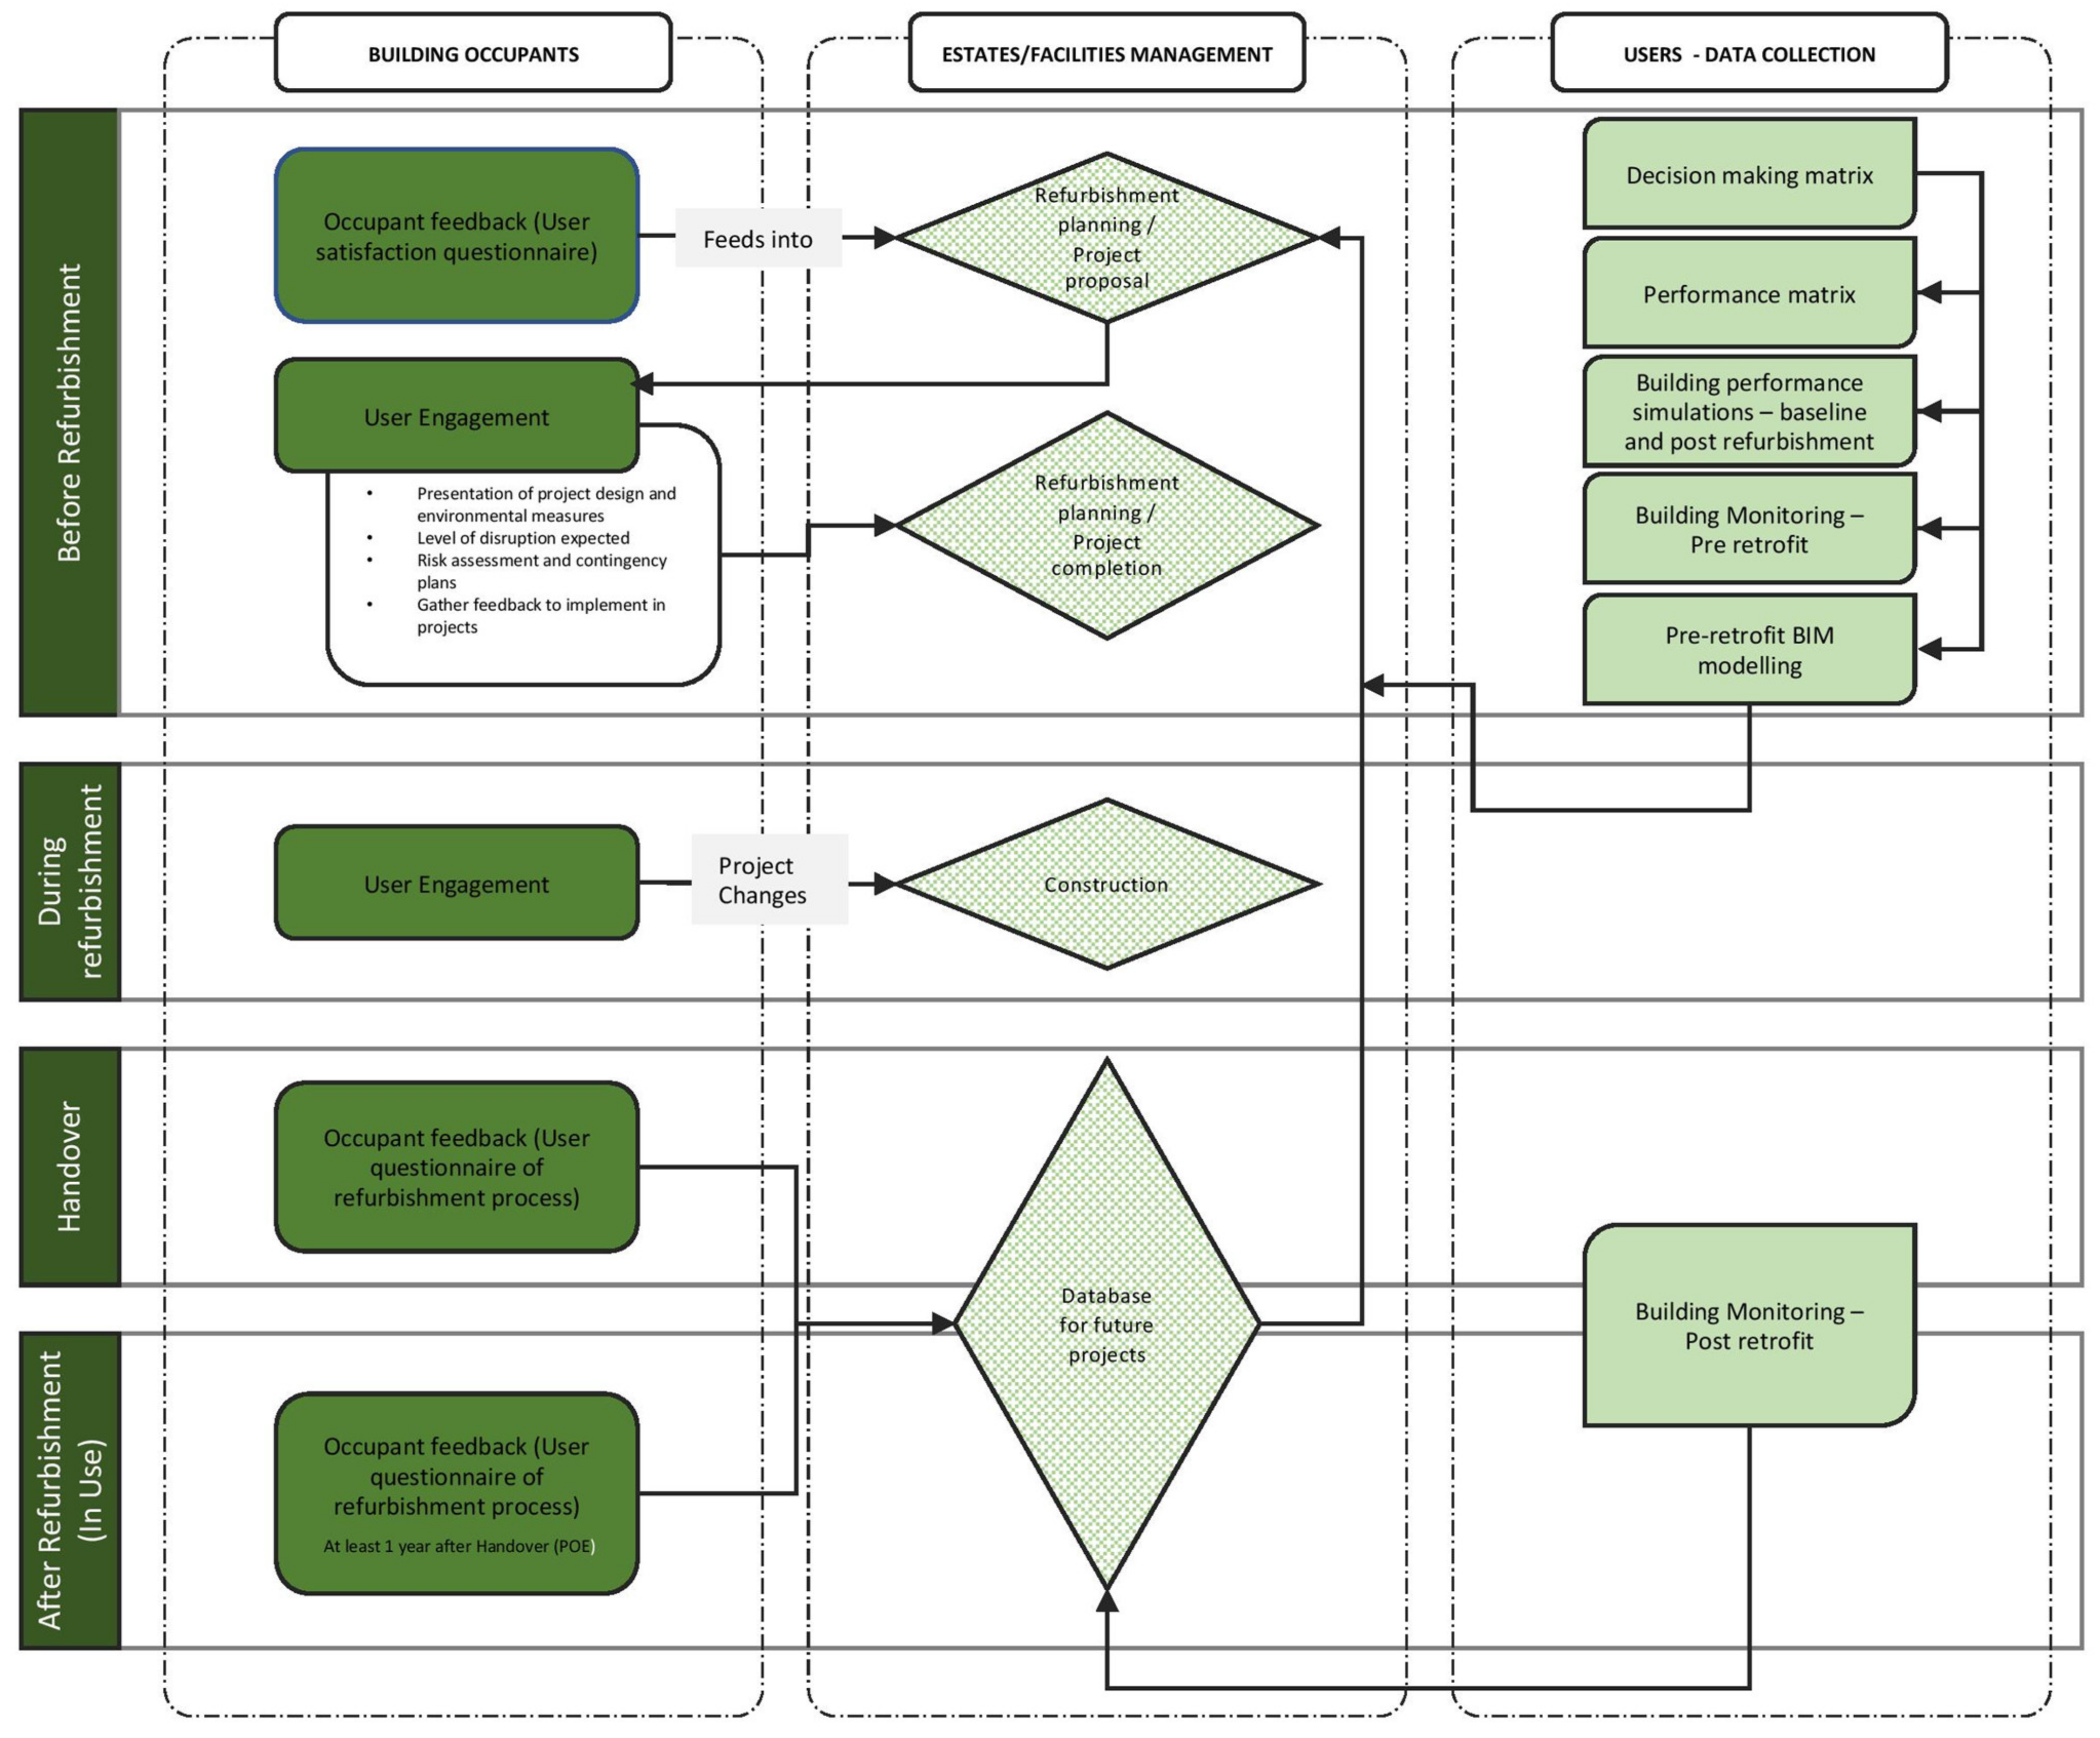
The evaluation of project implementation, decision-making process and the results obtained from the user comfort evaluation questionnaires led to the development of a new renovation process and stakeholder engagement protocol for managing low-energy renovation projects. The framework proposes the stages of continuous stakeholder engagement and information flow for effective building performance improvement and user satisfaction across renovation projects life cycle for higher education buildings. The framework has been structured in four stages: pre-renovation, during renovation and handover and post-occupancy/in-use stages. Figure 6 shows the proposed building renovation project framework with communication process flows between building occupants and the estates and facilities management team. The process has been broken down into four core stages:
Stage 1: Pre-renovation. This is the building performance diagnostic stage; the estates and facilities management team engage users to assess general building conditions and aspects of building environmental quality. This will feed into the project planning and be the basis for proposing alternative renovation designs. The estates management team further engages building users in relation to renovation plan and timelines, alternative space arrangement and contingency planning during renovation, before finalising the renovation design and planning. During this phase, the development and use of the decision-making and performance matrix should be developed and applied. Energy and indoor environmental data should be monitored and analysed where there is no existing building energy and environmental management system (BEEM). The application of Internet of Things (IoT)-enabled devices will make this process easier in building renovation projects without existing BEEM systems. Pre-renovation retrospective modelling and performance simulation should be planned and carried out at this stage.
Stage 2: Renovation/construction process: The construction team enhances continuous communication and engagement within timeline agreed in stage 1. Any potential construction work that may cause disruption or alter quality of internal environment such as noise, air quality (e.g., particulate matter) and cooling and heating systems should be adequately communicated. Workspace allocation and changes to construction timeline should be discussed and carefully communicated with all stakeholders. A two-way communication platform for reporting any significant deviation from to agreed protocol should be available construction team and building users.
Stage 3: Handover and occupancy stage: Estates management team prepares for handover and occupancy. This should involve an effective and smooth soft-landing process. Before occupants are fully back into the building, there should be effective communication and training relating to the new technologies and systems installed, especially the control systems and aspects of user control for opening and closing windows, lighting, HVAC, etc. Additionally, occupant feedback regarding the entire construction process, alternative accommodation arrangements and the process of moving back into the facility should be evaluated. A clear communication channel should be created for users to send feedback regarding any problems with operating any systems and for general maintenance requests.
Stage 4: Post-occupancy/in-use: Post-occupancy evaluation of the building should be done at least up to a year after handover using a range of objective and subjective building assessments. The subjective assessment focusses on the views of building users relating to the quality of the internal environment and the general building standard of operation. The estate/facilities management team should maintain a two-way user communication and feedback channels. A database should be created to document the findings from handover and post-occupancy evaluation, which will be helpful in optimising future maintenance and building renovation planning, design and implementation.
5. Conclusions
The paper presents a methodology for the implementation of low-energy renovation using innovative materials and technologies. The purpose is to improve the energy/environmental performance and user satisfaction in existing higher education facilities. The paper sets out to evaluate the role of technology, process and people in achieving the socio-economic and environmental benefits of low-energy renovation technologies and processes. By bringing together these components, it is essential to have a systematic approach from project inception to guide the renovation planning, technology integration and evaluation.
Building renovation is essential for improving energy and environmental performance, comfort and wellbeing of users. User evaluation questionnaires have been used to investigate end-user comfort and satisfaction in two existing higher education buildings with varying degrees of low-carbon renovation. Surveys were circulated before and after the refurbishment, providing data on user comfort and engagement at different stages of the project. The study shows the importance of using a holistic approach to meet not just the energy reduction targets, but also to improve the health and wellbeing of building occupants.
Overall, findings from the study suggest that there is a relationship between building performance improvement and an increase in the thermal comfort of occupants. However, user engagement at different stages of a project is essential for maximising the socio-economic and environmental benefits of low-energy renovation. Findings from the study infer that end-user engagement at the early stage is highly recommended, for smooth space configuration and control of indoor environment, which can be translated into a better comfort perception.
Where end-user views have not been implemented for technical and financial reasons, it is essential to engage them in constructive discussions regarding the new scheme and its potential impacts as well as adaptation measures necessary to mitigate effect of changes. Learnings from the renovation project and feedback from stakeholders were used to propose a new renovation and communication framework. Continuous engagement is vital to renovation process, not only for understanding user perception, but to improve user comfort and quicker response to adverse changes.
Ultimately, the study also indicates efficacy of renovation and its potential to achieve up to a 50% reduction in energy consumption through a mix of systematic and robust planning, diagnostics and selection of the most empowering combination of active and passive materials and technologies. Successful low-energy renovation can be achieved if a holistic process that gives strong consideration for both energy and user satisfaction is implemented.
Author Contributions
Conceptualization, A.A. (Abdullahi Ahmed) and M.M.-G.; methodology, A.A. (Abdullahi Ahmed) and A.A. (Andrew Arewa); software, A.A. (Abdullahi Ahmed) and K.C.; validation, M.M.-G. and A.A. (Abdullahi Ahmed); formal analysis, M.M.-G. and A.A. (Andrew Arewa); investigation, A.A. (Abdullahi Ahmed), M.M.-G.; resources, A.A. (Abdullahi Ahmed); data curation, M.M.-G. and A.A. (Andrew Arewa); writing—original draft preparation, A.A. (Abdullahi Ahmed) and M.M.-G.; writing—review and editing, A.A. (Abdullahi Ahmed) and K.C.; visualization, M.M.-G. and K.C.; project administration, A.A. (Abdullahi Ahmed), M.M.-G. and K.C.; funding acquisition, A.A. (Abdullahi Ahmed) and K.C. All authors have read and agreed to the published version of the manuscript.
Funding
This research was funded by European Union Framework 7, grant number 609377.
Institutional Review Board Statement
The study was conducted according to the guidelines of the Declaration of Helsinki, and approved by the Institutional Ethics Committee of Coventry University (Ethics code P38547 and approved 11/2016)
Informed Consent Statement
Informed consent was obtained from all subjects involved in the study.
Data Availability Statement
The data presented in this study are available on request from the corresponding author.
Acknowledgments
We would like to acknowledge the contribution of all project partners for their participation and ideas during the development of the project.
Conflicts of Interest
The authors declare no conflict of interest.
Appendix A

Table A1.
Questions analysed.
| Topics | Rating Scale | |
|---|---|---|
| Temperature and air quality | ||
| A2.1 | Temperature in winter | Too Hot = 1 to Too cold = 7 |
| A2.2 | Air in winter | Stable = 1 to 7 = Varies through day |
| A2.3 | Overall conditions in winter | Uncomfortable = 1 to Comfortable = 7 |
| A2.4 | Temperature in summer | Too Hot = 1 to Too cold = 7 |
| A2.5 | Air in summer | Stable = 1 to 7 = Varies through day |
| A2.6 | Overall conditions in summer | Uncomfortable = 1 to Comfortable = 7 |
| Overall building performance | ||
| A5.1 | How do you rate the overall comfort of the building environment? | Unsatisfactory = 1 to Satisfactory = 7 |
| A5.2 | In the building as a whole, do the facilities meet your needs? | Unsatisfactory = 1 to Satisfactory = 7 |
| A5.3 | Do you feel less or more healthy when you are in the building? | Uncomfortable = 1 to Comfortable = 7 |
| Additional questions for Richard Crossman building | ||
| B.1 | In your opinion what were the key indoor environmental problems with the building before retrofit? | Thermal comfort/Visual comfort/Air quality/Noise/Lighting |
| B.2 | What level of engagement did you have with the refurbishment project before construction works started? | Just informed/I was engaged in the process/None/Other |
| B.3 | What level of engagement did you have during the construction works? | Just informed/I was engaged in the process/None/Other |
| B.4 | Were you provided with clear information about potential disruptions during retrofit works? | Yes/No/Some |
| B.5 | What was the level of disruption experienced during refurbishment? | Moving from your offices/Changing lecture rooms/Noise/Pollution/Other |
| B.6 | Would you have liked to be more engaged in the refurbishment process? | Yes/No/I don´t know |
| B.7 | Which of the following improvements are noticeable since refurbishment? | Thermal comfort/Visual comfort/Air quality/Noise/Lighting/Aesthetics/Toilets/Other |
| B.8 | What is your overall assessment of the indoor environmental quality improvement? | Low improvement = 1 to High improvement = 7 |
| B.9 | What is your overall assessment of the quality of building improvement? | Low improvement = 1 to High improvement = 7 |
References
- The Directive 2010/31/EU of the European Parliament and of the Council of 19 May 2010 on the energy performance of buildings, Official Journal of the European Union, L153. 2010. Available online: http://eur-lex.europa.eu/LexUriServ/LexUriServ.do?uri=OJ:L:2010:153:0013:0035:EN:PDF (accessed on 24 February 2021).
- Baker, N. The Handbook of Sustainable Renovation: Non-Domestic Buildings; Earthscan: London, UK, 2009; pp. 3–4. [Google Scholar]
- Gupta, R.; Gregg, M. Empirical evaluation of the energy and environmental performance of a sustainably designed but under-utilised institutional building in the UK. Energy Build. 2016, 128, 68–80. [Google Scholar] [CrossRef] [Green Version]
- Johnston, D.; Farmer, D.; Brooke-Peat, M.; Miles-Shenton, D. Bridging the domestic building fabric performance gap. Build. Res. Inf. 2016, 44, 147–159. [Google Scholar] [CrossRef]
- Storey, J.B.; Pedersen Zari, M. Factor X-Wellbeing as A Key Component of Next Generation Green Buildings. In Proceedings of the 12th Rinker International Conference Rethinking Sustainable Construction 2006, Sarasota, FL, USA, 19–22 September 2006. [Google Scholar]
- Doan, D.T.; Ghaffarianhoseini, A.; Naismith, N.; Zhang, T.; Ghaffarianhoseini, A.; Tookey, J. A critical comparison of green building rating systems. Build. Environ. 2017, 123, 243–260. [Google Scholar] [CrossRef]
- Yu, S.M.; Tu, Y. Are Green Buildings Worth More Because They Cost More? In NUS Institute of Real Estate Studies Working Paper (IRES2011-023); National University of Singapore: Singapore, 2011. [Google Scholar]
- Altomonte, S.; Schiavon, S. Occupant satisfaction in LEED and non-LEED certified. Build. Environ. 2013, 68, 66–76. [Google Scholar] [CrossRef]
- Technology Strategy Board (TSB). Retrofit for The Future: Reducing Energy Consumption in Existing Homes—A Guide to Making Retrofit Work. Available online: https://assets.publishing.service.gov.uk/government/uploads/system/uploads/attachment_data/file/669113/Retrofit_for_the_future_-_A_guide_to_making_retrofit_work_-_2014.pdf (accessed on 10 July 2019).
- Carbon Trust, Further and higher education Training colleges and universities to be energy efficient. Sector Overview Report. 2014. Available online: https://se-ed.co.uk/edu/wp-content/uploads/2014/03/Carbon-Trust-advice-FE-HE.pdf (accessed on 21 April 2019).
- Association of University Directors of Estate (AUDE). The Legacy of 1960′s University Buildings. 2008. Available online: https://www.sustainabilityexchange.ac.uk/legacy-of-1960s-buildings-aude-research-project (accessed on 1 July 2016).
- Painting, N.J.; Piroozfar PA, E.; Farr, E.R.P. Refurbishment of higher education premises: Stakeholder engagement in the process and product. In Proceedings of the 30th Annual ARCOM Conference, Portsmouth, UK, 1–3 September 2014; pp. 955–964. Available online: https://www.arcom.ac.uk/-docs/proceedings/ar2014-0955-0964_Painting_Piroozfar_Farr.pdf (accessed on 28 October 2018).
- Ma, Z.; Cooper, P.; Daly, D.; Ledo, L. Existing building retrofits: Methodology and state-of-the-art. Energy Build. 2012, 55, 889–902. [Google Scholar] [CrossRef]
- Piaia, E.; Turillazzi, B.; Longo, D.; Boeri, A.; di Giulio, R. Plug-and-Play and innovative process technologies (Mapping/Modelling/Making/Monitoring) in deep renovation interventions. TECHNE J. Technol. Archit. Environ. 2019, 18, 215–225. [Google Scholar] [CrossRef]
- Ucci, M.; Yu, C.W.F. Low-carbon buildings, health, and wellbeing: Current perspectives and critical challenges. Indoor Built Environ. 2014, 23, 335–339. [Google Scholar] [CrossRef]
- Kang, S.; Ou, D.; Mak, C.M. The impact of indoor environmental quality on work productivity in university open-plan research offices. Build. Environ. 2017, 124, 78–89. [Google Scholar] [CrossRef]
- Giddings, B.; Thomas, J.; Little, L. Evaluation of the Workplace Environment in the UK, and the Impact on Users’ Levels of Stimulation. Indoor Built Environ. 2013, 22, 965–976. [Google Scholar] [CrossRef] [Green Version]
- Royal Institute of British Architects (RIBA). Post Occupancy Evaluation and Building Performance Evaluation Primer; RIBA: London, UK, 2016; Available online: https://www.architecture.com/-/media/gathercontent/post-occupancy-evaluation/additional-documents/ribapoebpeprimerpdf.pdf (accessed on 18 January 2019).
- Meir, I.A.; Garb, Y.; Jiao, D.; Cicelsky, A. Post-occupancy evaluation: An inevitable step toward sustainability. Adv. Build. Energy Res. 2009, 3, 189–219. [Google Scholar] [CrossRef]
- Hay, R.; Samuel, F.; Watson, K.J.; Bradbury, S. Post-occupancy evaluation in architecture: Experiences and perspectives from UK practice. Build. Res. Inf. 2018, 46, 698–710. [Google Scholar] [CrossRef]
- Baird, G. Users’ perceptions of sustainable buildings e Key findings of recent studies. Renew. Energy 2015, 73, 77–83. [Google Scholar] [CrossRef]
- Malkoc, E.; Ozkan, M.B. Post-occupancy Evaluation of a Built Environment: The Case of Konak Square (Izmir, Turkey). Indoor Built. Environ. 2010, 19, 422–443. [Google Scholar] [CrossRef]
- AlHorr, Y.; Arif, M.; Katafygiotou, M.; Mazroei, A.; Kaushik, A.K.; Elsarrag, E. Impact of indoor environmental quality on occupant wellbeing and comfort: A review of the literature. Int. J. Sustain. Built Environ. 2016, 5, 1–11. [Google Scholar] [CrossRef]
- Earthman, G.I. School Facility Conditions and Student Academic Achievement. In UCLA’s Institute for Democracy, Education, and Access. Williams Watch Series: Investigating the Claims of Williams v. State of California: Document wws-rr008-1002. 2002. Available online: https://escholarship.org/uc/item/5sw56439 (accessed on 1 July 2019).
- Boese, S.; Shaw, J. New York State School Facilities and Student Health, Achievement, and Attendance: A Data Analysis Report. 2005. Available online: https://files.eric.ed.gov/fulltext/ED510053.pdf (accessed on 1 July 2019).
- Kim, T.W.; Cha, S.; Kim, Y. Space choice, rejection, and satisfaction in university campus. Indoor. Built. Environ. 2018, 27, 233–243. [Google Scholar] [CrossRef]
- Ascione, F.; Borrelli, M.; de Masi, R.F.; de’Rossi, F.; Vanoli, G.P. Energy refurbishment of a University building in cold Italian backcountry. Part 2: Sensitivity studies and optimization. Energy Procedia 2019, 159, 10–15. [Google Scholar] [CrossRef]
- Bellia, L.; Borrelli, M.; de Masi, R.F.; Ruggiero, S.; Vanoli, G.P. University building: Energy diagnosis and refurbishment design with cost-optimal approach. Discussion about the effect of numerical modelling assumptions. J. Build. Eng. 2018, 18, 1–18. [Google Scholar] [CrossRef]
- Figueiredo, A.; Kämpf, J.; Vicente, R.; Oliveira, R.; Silva, T. Comparison between monitored and simulated data using evolutionary algorithms: Reducing the performance gap in dynamic building simulation. J. Build. Eng. 2018, 17, 96–106. [Google Scholar] [CrossRef]
- Cho, H.M.; Yun, B.Y.; Yang, S.; Wi, S.; Chang, S.J.; Kim, S. Optimal energy retrofit plan for conservation and sustainable use of historic campus building: Case of cultural property building. Appl. Energy 2020, 275, 115313. [Google Scholar] [CrossRef]
- de Santoli, L.; Mancini, F.; Clemente, C.; Lucci, S. Energy and technological refurbishment of the School of Architecture Valle Giulia, Rome. Energy Procedia 2017, 133, 382–391. [Google Scholar] [CrossRef]
- Creswell, J.W.; Creswell, J.D. Mixed Method Procedure. In Research Design: Qualitative, Quantitative, and Mixed Methods Approaches, 5th ed.; Sage: London, UK, 2018; pp. 213–246. [Google Scholar]
- City Lab Coventry. Available online: www.openlivinglabs.eu/livinglab/city-lab-coventry (accessed on 27 October 2017).
- GOV.UK. Greenhouse Gas Reporting: Conversion Factors 2017. 2017. Available online: https://www.gov.uk/government/publications/greenhouse-gas-reporting-conversion-factors-2017 (accessed on 7 September 2018).
- Grupopuma. TRADITERM® EPS-G PANEL. 2018. Available online: https://www.grupopuma.com/en-WW/products/show/traditerm-panel-eps-g-ww-en (accessed on 24 September 2019).
- Sarawade, P.B.; Kim, J.; Hilonga, A.; Kim, H.T. Production of low-density sodium silicate-based hydrophobic silica aerogel beads by a novel fast gelation process and ambient pressure drying process. Solid State Sci. 2010, 12, 911–918. [Google Scholar] [CrossRef]
- Va-Q-Tec Limited, Vacuum Insulated Panel (VIP). Available online: https://va-q-tec.com/technologie/vakuumisolationspaneele/ (accessed on 1 May 2019).
- Fthenakis, V.M.; Kim, H.C.; Frischknecht, R.; Raugei, M.; Sinha, P.; Stucki, M. IES Photovoltaic Power System Report Annual Report: IEA-PVPS T12-02:2019. 2019. Available online: https://iea-pvps.org/wp-content/uploads/2020/05/IEA-PVPS-AR-2019-1.pdf (accessed on 2 February 2020).
- Ure, Z. Thermal Storage: PCM Products. Available online: http://www.pcmproducts.net/files/TES-2008.pdf (accessed on 3 February 2020).
- Sbar, N.L.; Podbelski, L.; MoYang, H.; Pease, B. Electrochromic dynamic windows for office buildings. Int. J. Sustain. Built Environ. 2012, 1, 125–139. [Google Scholar] [CrossRef] [Green Version]
- Barbosa, S.; Ip, K. Perspectives of double skin façades for naturally ventilated buildings: A review. Renew. Sustain. Energy Rev. 2014, 40, 1019–1029. [Google Scholar] [CrossRef]
- Lenk, R.; Lenk, C. Practical Lighting Design with LEDs, 1st ed.; The Institute of Electrical and Electronics Engineers: Piscataway, NJ, USA, 2011. [Google Scholar]
- TSM-PDG5. The Most Durable Module—Technical Brochure. Available online: https://www.enfsolar.com/Product/pdf/Crystalline/51650b738832c.pdf (accessed on 20 July 2020).
- Kingspan. Flat Roof Insulation|Thermaroof TR27 LPC/FM. 2020. Available online: https://www.kingspan.com/gb/en-gb/products/insulation/insulation-boards/therma/thermaroof-tr27-lpc-fm (accessed on 24 July 2020).
- BS EN 16798. Energy Performance of Buildings. Ventilation for Buildings. Indoor Environmental Input Parameters for Design and Assessment of Energy Performance of Buildings Addressing Indoor Air Quality, Thermal Environment, Lighting, and Acoustics. British Standard Organisation Module M1-6. 2019. Available online: https://shop.bsigroup.com/ProductDetail/?pid=000000000030297474 (accessed on 3 December 2019).
- ISO 7730, Ergonomics of The Thermal Environment—Analytical Determination and Interpretation of Thermal Comfort Using Calculation of The PMV and PPD Indices and Local Thermal Comfort Criteria International Standard Organisation. 2005. Available online: https://www.iso.org/standard/39155.html (accessed on 24 February 2021).
- Loonen, R.C.; Favoino, F.; Hensen, J.L.; Overend, M. Review of current status, requirements and opportunities for building performance simulation of adaptive facades. J. Build. Perform. Simul. 2017, 10, 205–223. [Google Scholar] [CrossRef] [Green Version]
- IES-VE. Integrated Environmental Solution Virtual Environment Software®, Version 2018, Glasgow UK. 2018. Available online: https://www.iesve.com/software (accessed on 24 February 2021).
- Crawley, D.; Hand, J.; Kummert, M.; Griffith, B. Contrasting the Capabilities of Building Energy Performance Simulation Programs. Build. Environ. 2008, 43, 661–673. [Google Scholar] [CrossRef] [Green Version]
Figure 1.
Location of Coventry and Coventry University.

Figure 2.
Decision-making criteria.

Figure 3.
Building simulation IESVE models of John Laing and Richard Crossman.

Figure 4.
Improvement of indoor environmental parameters in Richard Crossman.

Figure 5.
Overall assessment of the indoor environmental quality improvement. Mean rank 3.25, variance 2.58, standard deviation 1.61.
Figure 5.
Overall assessment of the indoor environmental quality improvement. Mean rank 3.25, variance 2.58, standard deviation 1.61.

Figure 6.
Proposed renovation project user engagement and evaluation framework.

Table 1.
Building characteristics.
| Building | John Laing Building | Richard Crossman Building |
|---|---|---|
 |  | |
| Year of completion | 1970 | 1971 |
| Net area (m2) | 3660 | 9306 |
| Electricity (kWh/m2/year) * | 94 | 116 |
| Gas (kWh/m2/year) * (heated floor area) | 129 | 129 |
| Water (m3/annum) * | 957 | 2462 |
| Carbon Footprint (tonnes/year) * | 282 | 841 |
* Consumption and emissions per year.
Table 2.
Decision-making matrix.
| - | - | - | T3.2 Isolation Strategies for Energy Conservation | T3.3 Solar Strategies for Energy and Heat Recovery | T3.4 Strategies for Thermal Energy Storage | T3.6 Efficient Lighting | |||||||
|---|---|---|---|---|---|---|---|---|---|---|---|---|---|
| Criteria | Demo Site Owner Weight | Aerogel- Super Insulating Mortars | VIP Panels | EC/PV Window | Ventilated Façade BIPV | Electrical Storage/Solutions | Solar AC | PCM Thermal Storage | Passive Cooling | Heat Recovery | Indoor LED Lighting | Urban LED Lighting | |
| - | Technical Feasibility | 10 | 8 | 2 | 8 | 2 | 5 | 2 | 5 | 3 | 2 | 8 | 10 |
| - | Certificated? | 5 | 2 | 2 | 5 | 5 | 0 | 5 | 5 | 5 | 5 | 5 | 5 |
| Key Attributes | Initial cost | 4.00 | 4 | 1 | 1 | 1 | 2 | 2 | 1 | 3 | 2 | 2 | 2 |
| Operating Cost and Maintenance | 4.00 | 5 | 5 | 4 | 2 | 2 | 2 | 4 | 4 | 2 | 4 | 4 | |
| Environmental Impact (Potential CO2 reduction) | 5.00 | 2 | 2 | 3 | 5 | 3 | 5 | 3 | 3 | 4 | 2 | 4 | |
| Service Lifetime (Durability) | 3.00 | 5 | 5 | 4 | 3 | 2 | 3 | 4 | 4 | 3 | 4 | 4 | |
| Construction | Construction Works (5=Small amount of work, 1=A lot of work) | 3.00 | 3 | 2 | 2 | 1 | 3 | 2 | 3 | 3 | 1 | 2 | 4 |
| Specialist contractors require ment for installation (Y = 1, N = 5) | 1.00 | 4 | 4 | 4 | 1 | 5 | 4 | 4 | 5 | 5 | 5 | 5 | |
| Other specifications | Aesthetics | 4.00 | 4 | 4 | 4 | 1 | 3 | 1 | 5 | 4 | 5 | 3 | 4 |
| Space requirements | 3.00 | 4 | 3 | 5 | 3 | 2 | 1 | 1 | 2 | 1 | 5 | 5 | |
| Air Quality | 2.00 | 3 | 3 | 3 | 3 | 3 | 3 | 3 | 3 | 4 | 3 | 3 | |
| Noise | 3.00 | 2 | 5 | 4 | 3 | 5 | 3 | 5 | 3 | 2 | 3 | 3 | |
| Control Capability | 3.00 | 5 | 5 | 5 | 3 | 5 | 3 | 2 | 2 | 5 | 5 | 5 | |
| Environment Friendly (Embodied Carbon) | 3.00 | 3 | 4 | 4 | 5 | 2 | 5 | 3 | 3 | 4 | 2 | 4 | |
| Compatibility with the existing systems | 3.00 | 4 | 2 | 4 | 1 | 1 | 1 | 2 | 3 | 1 | 1 | 3 | |
| Total | 56 | 240 | 168 | 250 | 150 | 164 | 154 | 200 | 185 | 165 | 228 | 280 | |
| Weighted Vote | 4.29 | 3.00 | 4.46 | 2.68 | 2.93 | 2.75 | 3.57 | 3.30 | 2.95 | 4.07 | 5.00 | ||
| Decision | Y | N | Y | N | N | N | Y | Y | N | Y | Y | ||
Table 3.
Summary of materials and technologies.
| Technology | Description | Image |
|---|---|---|
| EPS-G Panel | This technology is an improved thermal insulation panel, which is made from a self-extinguishing expanded polystyrene, which is used in the TRADITERM® external thermal insulation system. This is a great insulator, with characteristics being lightweight, workable and a very low conductivity [35]. |  |
| Aerogel-Based Insulating Mortar | Combines its properties with cementitious materials to provide low thermal conductivity at <0.020 W/mK. RESSEEPE aims to admix aerogels into cement to design a super-insulating mortar. The insulation performance of the aerogel was preserved [36]. |  |
| Vacuum-Insulated Panels | Vacuum Insulated Panels (VIP)panels consist of a mesoporous core typically fumed silica, which is wrapped in a multilayer laminate foil barrier. They have a low value of thermal conductivity (λ = 0.003–0.004 W/mK) [37]. |  |
| Solar PV | Solar photovoltaics (PV) allow the production of electricity from sunlight. The conversion happens in the PV cell, where a semiconductor generates a direct current (DC electricity). This happens when it is exposed to light and in turn due to the photovoltaic effect. The electricity produced can be used on the spot (off-grid systems also called stand-alone PV systems) or into the grid (grid connected systems) or both [38]. |  |
| PCM Seasonal Thermal Energy Storage | This technology stores and releases thermal energy during the process of melting and freezing. When they freeze, they release large amounts of energy. When they melt, energy is absorbed from the environment when changing from solid to liquid [39]. |  |
| EC Windows | Changes the light transmission properties in a controlled and reversible manner through a small electric current which flows through the device. This technology can reduce energy expenses by 19 and 48% in cooling and lighting demand. They are considered smart windows [40]. |  |
| Ventilated Façade | This is a construction system consisting of the attachment of an outer skin of ventilated cladding to a new or existing building which avoids thermal bridges and improves thermal and acoustic performance of the envelope. The ventilated facade generates electric power through the vertical PV [41]. |  |
| LED Lighting | Light-emitting diodes (LEDs) are semiconductor diodes, which emit light when a voltage is applied. LEDs are more efficient, durable, versatile and longer lasting than incandescent lighting and compact fluorescent lighting (CFL) [42]. |  |
| BIPV | Trina Solar modules were selected as the PV panels for a vertical installation. The selected PV modules TSM-PDG5 by Trina Solar have dimensions of 1685 × 997 mm2 with a thickness of 6 mm. This technology was implemented in combination with the ventilated façade [43]. |  |
| Roof Insulation | Kingspan TR27 insulation bonded in Sarnacol adhesive with a U value of 0.18 W/m2K was selected as roof insulation for RC. An adhered system is to be installed using Sarnafil G410-18ELF Lead Grey with integral 300 g/m2 polyester fleece as the main roof sheet and Sarnafil G410-15EL Lead Grey or S327-15EL Lead Grey for all detail work flashings [44]. |  |
Table 4.
Summary of retrofit technologies.
| Technology (m2) | Demo-Site | |
|---|---|---|
| Richard Crossman Building | John Laing Building | |
| EPS-G Panels | - | 57 |
| Aerogel-Based Insulating Mortar | - | 57 |
| Vacuum-Insulated Panels | - | 56 |
| Solar PV | 9395 | - |
| Seasonal Thermal Energy Storage (Water and PCM) | - | - |
| EC Windows | - | 56 |
| Ventilated Façade | - | 28 |
| LED Lighting | 2600 | - |
| High-Efficiency Windows | 9395 | 28 |
| BIPV | - | 57 |
| Solar Thermal Collectors—UPC | - | - |
| Solar Thermal Collectors | - | - |
| Roof Insulation | 934 | - |
| Total Area of Site Affected | 9395 (m2) | 3660 (m2) |
Table 5.
Research method for user comfort evaluation.
| Process Followed | Parameters Analysed | |
|---|---|---|
| Before renovation | User satisfaction survey | User characteristics: role, age, gender, preference, interests |
| User experience: Indoor Environmental Quality (IEQ) Level of control General maintenance | ||
| During renovation | User satisfaction survey of the renovation process * | User characteristics: role, age, gender, preference, interests Evaluation of the renovation process: Level of engagement Level of disruption |
| After renovation | User satisfaction survey | User characteristics: role, age, gender, preference, interests |
| User experience: IEQ Level of control General maintenance | ||
| Assessment of the IEQ improvement |
* Only in Richard Crossman building.
Table 6.
User satisfaction survey structure.
| Part 1 | Part 2 | Part 3 | Part 4 | Part 5 * |
|---|---|---|---|---|
| Individual Factors | IEQ Aspects | Personal Control | Overall Building Conditions | Richard Crossman Renovation |
| Age Gender Seat position Hours in the building | Temperature Air quality Lighting Noise | Heating Cooling Ventilation Lighting | Comfort Facilities Health | Indoor environment improvement Level of engagement Disruption |
Table 7.
Characteristics of respondents.
| Building | John Laing | Richard Crossman | ||||
|---|---|---|---|---|---|---|
| Architecture Studio | Offices | |||||
| Before | After | Before | After | |||
| Questionnaires distributed | 35 | 35 | 20 | 20 | - | |
| Number of questionnaires fully completed | 32 | 30 | 18 | 13 | 48 | |
| Response % | 91.43% | 85.71% | 90% | 65% | 48% | |
| Age | Under 30 | 33 | 28 | 0 | 0 | 2 |
| Over 30 | 3 | 2 | 19 | 13 | 45 | |
| Sex | Male | 21 | 17 | 18 | 12 | 7 |
| Female | 14 | 13 | 1 | 1 | 41 | |
| Days per week in the building | 4.93 | 4.27 | 4.71 | 4.46 | 3.81 | |
| Hours per day | 7.53 | 6.45 | 7.97 | 7.92 | 7.21 | |
| Hours per day at desk | 5.96 | 5.42 | 5.39 | 5.31 | 5.04 | |
Table 8.
Descriptive statistics for IEQ responses in John Laing Building.
| - | Classrooms | Offices | ||||||||||
|---|---|---|---|---|---|---|---|---|---|---|---|---|
| Before | After | Before | After | |||||||||
| Mean | Variance | Standard Deviation | Mean | Variance | Standard Deviation | Mean | Variance | Standard Deviation | Mean | Variance | Standard Deviation | |
| A2.1 | 4.83 | 1.66 | 1.29 | 4.13 | 1.22 | 1.11 | 4.86 | 0.81 | 0.90 | 4.60 | 0.80 | 0.89 |
| A2.2 | 4.30 | 3.46 | 1.86 | 3.73 | 1.93 | 1.39 | 5.29 | 4.24 | 2.06 | 4.00 | 4.00 | 2.00 |
| A2.3 | 3.47 | 2.05 | 1.43 | 4.17 | 1.87 | 1.37 | 4.43 | 2.29 | 1.51 | 4.40 | 1.80 | 1.34 |
| A2.4 | 3.41 | 1.25 | 1.48 | 3.77 | 0.46 | 0.68 | 2.71 | 0.90 | 0.95 | 2.40 | 0.80 | 0.89 |
| A2.5 | 4.26 | 2.66 | 2.02 | 4.00 | 1.59 | 1.26 | 5.14 | 3.81 | 1.95 | 3.60 | 5.30 | 2.30 |
| A2.6 | 3.81 | 2.31 | 1.52 | 4.17 | 0.76 | 0.87 | 3.29 | 1.24 | 1.11 | 3.40 | 2.30 | 1.52 |
| A5.1 | 3.51 | 2.08 | 1.44 | 4.00 | 1.38 | 1.17 | 3.29 | 2.24 | 1.50 | 3.60 | 1.80 | 1.34 |
| A5.2 | 4.03 | 3.26 | 1.81 | 3.83 | 1.94 | 1.53 | 3.29 | 3.57 | 1.89 | 3.80 | 2.70 | 1.64 |
| A5.3 | 3.40 | 1.60 | 1.26 | 3.60 | 0.94 | 0.97 | 3.57 | 0.62 | 0.79 | 3.60 | 0.80 | 0.89 |
Table 9.
IEQ descriptive statistics for offices with PCM and control rooms in the JL Building.
| - | Offices Not Retrofitted | Offices Retrofitted with PCM | ||||||||||
|---|---|---|---|---|---|---|---|---|---|---|---|---|
| Before | After | Before | After | |||||||||
| Mean | Variance | Standard Deviation | Mean | Variance | Standard Deviation | Mean | Variance | Standard Deviation | Mean | Variance | Standard Deviation | |
| A2.1 | 4.36 | 2.05 | 1.43 | 4.13 | 2.41 | 1.55 | 5.5 | 0.33 | 0.58 | 4.5 | 1.00 | 1.00 |
| A2.2 | 4.18 | 2.76 | 1.66 | 4.88 | 0.98 | 0.99 | 6.25 | 0.92 | 0.96 | 4 | 5.33 | 2.31 |
| A2.3 | 4.36 | 2.85 | 1.69 | 3.75 | 2.21 | 1.49 | 4.25 | 2.92 | 1.71 | 4.25 | 2.25 | 1.50 |
| A2.4 | 2.58 | 1.36 | 1.16 | 2.75 | 2.50 | 1.58 | 2.75 | 1.58 | 1.26 | 2.5 | 1.00 | 1.00 |
| A2.5 | 5.17 | 2.52 | 1.59 | 4.88 | 2.41 | 1.55 | 6 | 0.67 | 0.82 | 4.25 | 4.25 | 2.06 |
| A2.6 | 3.17 | 2.33 | 1.53 | 2.25 | 1.07 | 1.04 | 2.75 | 0.92 | 0.96 | 3.5 | 3.00 | 1.73 |
| A5.1 | 4.33 | 1.33 | 1.15 | 3.63 | 1.41 | 1.19 | 2.75 | 2.92 | 1.71 | 3.25 | 1.58 | 1.26 |
| A5.2 | 3.83 | 1.06 | 1.03 | 3.25 | 1.64 | 1.28 | 3 | 4.00 | 2.00 | 3.25 | 1.58 | 1.26 |
| A5.3 | 3.92 | 1.17 | 1.08 | 2.75 | 0.79 | 0.89 | 3.25 | 0.92 | 0.96 | 3.5 | 1.00 | 1.00 |
Table 10.
Descriptive statistics for IEQ responses in the Richard Crossman Building.
| Mean | Variance | Standard Deviation | |
|---|---|---|---|
| A2.1 | 4.62 | 2.83 | 1.68 |
| A2.2 | 5.74 | 2.24 | 1.50 |
| A2.3 | 3.27 | 2.07 | 1.44 |
| A2.4 | 3.02 | 1.50 | 1.22 |
| A2.5 | 5.25 | 2.10 | 1.45 |
| A2.6 | 3.39 | 1.93 | 1.39 |
| A5.1 | 3.46 | 2.00 | 1.41 |
| A5.2 | 3.42 | 1.99 | 1.41 |
| A5.3 | 2.96 | 1.06 | 1.03 |
Table 11.
Energy performance result of both buildings.
| Performance Parameter | Richard Crossman Building | John Laing Building | ||||||
|---|---|---|---|---|---|---|---|---|
| Pre | Post | Post Full | Change | Pre | Post | Post Full | Change | |
| Boilers energy (MWh) | 2593.34 | 749.83 | 0.71 | 418.76 | 399.30 | 371.25 | 0.11 | |
| Total system energy (MWh) | 3180.57 | 1097.08 | 0.66 | 448.84 | 428.90 | 401.35 | 0.11 | |
| Total lights energy (MWh) | 0.00 | 0.00 | 0.00 | 0.00 | 0.00 | |||
| Total equip energy (MWh) | 0.00 | 0.00 | 0.00 | 0.00 | 0.00 | |||
| Total nat. gas (MWh) | 2593.34 | 749.83 | 0.71 | 418.76 | 399.30 | 371.25 | 0.11 | |
| Total electricity (MWh) | 1103.26 | 1168.41 | −0.06 | 30.08 | 30.10 | 30.10 | 0.00 | |
| Total Carbon Emissions (Kgco2) | 1,132,751.00 | 632,847.00 | 0.44 | 106,064.00 | 101,614.00 | 95,810.00 | 0.10 | |
| Total energy (MWh) | 3696.60 | 1885.39 | 0.49 | 448.84 | 428.90 | 401.35 | 0.11 | |
| Total energy (MWh/m2) | 0.39 | 0.20 | 0.49 | 0.12 | 0.12 | 0.11 | 0.11 | |
| Total energy (KWh/m2) | 393.46 | 200.68 | 0.49 | 122.63 | 117.19 | 109.66 | 0.11 | |
| Total grid disp. Elec (Mwh) | 0.00 | −32.84 | ||||||
Publisher’s Note: MDPI stays neutral with regard to jurisdictional claims in published maps and institutional affiliations. |
© 2021 by the authors. Licensee MDPI, Basel, Switzerland. This article is an open access article distributed under the terms and conditions of the Creative Commons Attribution (CC BY) license (http://creativecommons.org/licenses/by/4.0/).
Share and Cite
MDPI and ACS Style
Ahmed, A.; Mateo-Garcia, M.; Arewa, A.; Caratella, K. Integrated Performance Optimization of Higher Education Buildings Using Low-Energy Renovation Process and User Engagement. Energies 2021, 14, 1475. https://doi.org/10.3390/en14051475
AMA Style
Ahmed A, Mateo-Garcia M, Arewa A, Caratella K. Integrated Performance Optimization of Higher Education Buildings Using Low-Energy Renovation Process and User Engagement. Energies. 2021; 14(5):1475. https://doi.org/10.3390/en14051475
Chicago/Turabian StyleAhmed, Abdullahi, Monica Mateo-Garcia, Andrew Arewa, and Kassim Caratella. 2021. "Integrated Performance Optimization of Higher Education Buildings Using Low-Energy Renovation Process and User Engagement" Energies 14, no. 5: 1475. https://doi.org/10.3390/en14051475
Note that from the first issue of 2016, this journal uses article numbers instead of page numbers. See further details here.