
The Energy-Saving Potential of Chilled Ceilings Combined with Personalized Ventilation


1
Department of Heating, Ventilation and Dust Removal Technology, Faculty of Energy and Environmental Engineering, Silesian University of Technology, 44-100 Gliwice, Poland
2
International Centre for Indoor Environment and Energy, Department of Civil Engineering, Technical University of Denmark, DK-2800 Kgs. Lyngby, Denmark
*
Author to whom correspondence should be addressed.
Energies 2021, 14(4), 1133; https://doi.org/10.3390/en14041133
Submission received: 11 January 2021
/
Revised: 13 February 2021
/
Accepted: 17 February 2021
/
Published: 20 February 2021
(This article belongs to the Special Issue Heating, Cooling, and Ventilation Systems: Applications and Performance)
Abstract
:The energy consumption of purely convective (i.e., various air volume (VAV) mixing ventilation) and combined radiant and convective HVAC systems (chilled ceiling combined with mixing ventilation—CCMV or personalized ventilation—CCPV) was investigated with multi-variant simulations carried out the IDA Indoor Climate and Energy software. We analyzed three different climates: temperate, hot and humid, and hot and dry. Our results show that the use of CCPV substantially reduced energy consumption compared to the conventional VAV system in hot climates. We also show that increasing the room temperature to 28 °C is an effective energy-saving strategy that can reduce consumption by as much as 40%. In the temperate climate, the VAV system was preferable because it used less energy as it benefited from outdoor air free-cooling. The control strategy of the supply temperature of personalized air had an impact on the energy demand of the HVAC system. The most efficient control strategy of the CCPV system was to increase the room temperature and keep the supply air temperature in the range of 20–22 °C. This approach consumed less energy than VAV or CCMV, and also improved the relative humidity in the hot climate.
1. Introduction
Personalized ventilation (PV) provides clean air to individual workstations and is known to have substantial energy-saving potential because it allows for different control strategies to be implemented simultaneously. The primary approach to reduce energy consumption is to decrease the supply airflow rates compared to conventional ventilation solutions. First, the outdoor airflow rate can be reduced due to higher ventilation effectiveness of the PV at workstations [1]. In addition, the supply of the ventilation air due to occupancy can be limited to times when people are present at workplaces. Another strategy is to increase the room temperature above the comfort limits given in standards [2,3,4] and use local convective cooling, while also giving individuals control to set local thermal environment preferences at their workstations. For this approach, it has already been demonstrated that the thermal environment of the room will still be acceptable [1,5,6,7].
Several studies on PV systems focused on hot climates where the usual design room temperature is relatively low (21–23 °C), mostly due to the dehumidification. Thus, increasing the target room temperature using PV can provide significant energy savings. Moreover, since outdoor temperatures are often above 20 °C, the energy required for air-cooling in the air handling unit (AHU) are a considerable part of building energy needs. Sekhar et al. [8] reported energy savings between 15–30% by implementing PV combined with mixing ventilation relative to mixing ventilation alone in a warm and humid climate (Singapore) when the room temperature setpoint was increased to 26 °C. The savings depended on the outdoor airflow rate provided by mixing ventilation working as a conventional system (7 or 15 L/s per person).
Schiavon et al. [9] performed multi-variant energy simulations to study the influence of different energy savings strategies on energy consumption in Singapore. They showed energy use could be reduced up to 51% using PV instead of the total volume systems commonly used today. They confirmed that increasing the room temperature, reducing supplied air via improved local ventilation effectiveness at the workstations, and supplying air according to occupancy are effective energy-saving strategies. Skwarczyński [10] studied the influence of dehumidification on energy consumption, which is especially relevant for hot and humid climates. Traditionally, the dehumidification process is carried out by cooling outdoor air below the dew point temperature and reheating it to the supply temperature, thereby increasing the energy consumption. Compared to mixing ventilation with dehumidification, energy savings between 54–73% were achieved by using PV combined with mixing ventilation with dehumidification, and savings ranged from 24–51% for PV with dehumidification combined with mixing ventilation. When dehumidification was implemented in both ventilation systems, the energy savings increased between 44–63%, and maximum savings were achieved when the room temperature setpoint was increased to 28 °C.
Schiavon and Melikov [11] studied the energy use of PV in Copenhagen’s cold climate. They showed that the energy consumption of PV was between 61–268% compared to mixing ventilation depending on the control of the supply temperature of personalized air. The most efficient approach for PV was to supply air at a constant temperature of 20 °C and increase the target room temperature to 28 °C. They also showed that reducing the supply airflow rates was not an effective energy-saving strategy in the cold climate.
Another promising, energy-saving solution for HVAC systems utilizes radiant cooling technique, which is more efficient than total volume air systems. The most popular heat carrier for radiant hydronic cooling systems is water. Due to differences in density and specific heat capacity, the thermal conductivity of water is roughly 4000 times than air for the same fluid volume. Furthermore, the chilled ceiling (CC) is defined as a high-temperature cooling system since it operates using relatively high temperatures of the cooling water (usually between 14 °C and 16 °C); thus there are extensive possibilities for low energy or free-cooling refrigeration processes. Because the CC removes a substantial amount of sensible heat from the space, the supply air rate can be reduced to the amount required to remove latent heat and fulfill the hygienic air quality requirements [4], which, in turn, allows for the dimensions of ducts and fans to be reduced. Such design should provide greater energy savings, because less air needs to be transported and conditioned in the AHU.
In practice, the energy savings of radiant cooling depends on ventilation operation (supply air temperature, outdoor airflow rates), cooling loads of the zone, and climate [12]. Due to the superior cooling efficiency of water compared to air, an increase in the cooling load leads to an increase in energy savings for a CC compared to total air cooling systems. The tendency is valid for the CC combined both with mixing ventilation and with the displacement ventilation. Thus, savings are higher in a hot climate, where air-conditioning requires substantially more energy than in a temperate climate. Energy savings reported for a system that combined CC and displacement ventilation in Kuwait varied from 25 to 53%, depending on the outdoor air ratio [13,14,15,16,17]. Energy analyses of CC combined with desiccant cooling in Hong Kong indicated savings up to 44% in primary energy were attainable compared to a constant total volume system. Investigations performed in the Dutch climate showed similar energy use of air-water system to all-air system working on various air volume (VAV) mode [18]. Sodec [19] performed simulations using TRNSYS (Thermal Energy System Specialists, LLC, Madison, WI, USA) for the climate in Essen (Germany), in which he compared a VAV system, CC combined with mixing ventilation, and CC combined with displacement ventilation. All three systems had equal energy use under standard operation. However, savings between 10–20% were possible when free-cooling was implemented into refrigeration for the CC. In Essen’s climate, the CC combined with mixing ventilation had 17% lower energy use than when combined with displacement ventilation. The difference was due to a higher supply air temperature with displacement ventilation.
The use of CC has an impact on the capital costs [12]. Reducing the airflow rate allows for a smaller AHU, but the installation of a CC carries additional costs for the cooling panels. Conversely, as cooling loads increase, total air systems’ capital costs grow more rapidly than for a system combined with a CC [12]. Moreover, the use of a chilled ceiling reduces the electrical peak power consumption, contributing to the electrical network’s stability. However, despite the decreased energy consumption of the fans that results from reducing the airflow, the electrical demand for cooling towers and pumps increases as well, thus, the total energy use of the system must be considered when analyzing it’s overall effect on the network stability. Life cycle assessment analyzes showed that CC system and its components have a lower impact on the environment compared to the VAV system in tropics [20].
Energy analysis studies have shown that computer simulations may be used to improve the HVAC systems’ performance and maximize the efficiency of the CC system to reduce energy use [12,18,21,22,23,24,25]. The energy performance of a combined CC and PV has not been studied yet.
This study compares the energy consumption of three systems: chilled ceiling combined with personalized ventilation (CCPV), the chilled ceiling combined with constant air volume (CAV) mixing ventilation (CCMV) and VAV mixing ventilation. Different climate zones were considered to identify the conditions for which chilled ceiling combined with personalized ventilation is an optimal energy consumption solution.
2. Materials and Methods
We performed energy consumption simulations for a zone representing an office room with the IDA Indoor Climate and Energy (IDA ICE) 4.62 software (EQUA Simulation AB, Solna, Sweden). The IDA ICE software has been validated according to methods given in standards EN 15255:2007, EN 15265:2007 and ANSI/ASHRAE Standard 140–2004 [26,27,28] and by empirical study [29,30,31,32,33,34]. We simulated identical buildings located in three different climates: temperate (Katowice, Poland), hot and humid (Singapore), and hot and dry (Dubai). The ASHRAE IWEC2 “typical” weather files were used for each location. The “typical” year weather files were based on the Integrated Surface Hourly (ISH) weather data archived in the National Climatic Data Center. We carried out all analyses with dynamic simulations with 1 h timestep for the calculation period of one year.
2.1. Zone Description
In this study, the zone we considered represents one office room for two employees. It was located on the first floor and had one external wall (orientation south). The details of building envelope construction are presented in Table 1. Internal walls, floor and ceiling were modeled as adiabatic, and the effect of thermal mass was considered.
Different building operation strategies were analyzed to account for the impact solar shading control had on the climate control system. The primary case considered here assumed a window without shading. Additionally, we also modelled the effect of integrated shading using two specific device types: internal vertical blinds (g multiplier 0.45, T multiplier 0.12, U multiplier 0.5), and external blinds (g multiplier 0.14, T multiplier 0.09, U multiplier 1.0). The solar radiation was used as a shading control, and we assumed that the shading device was drawn when the solar radiation exceeded 100 W/m2 on the inside of the window.
2.2. Internal Heat Gains and Occupancy
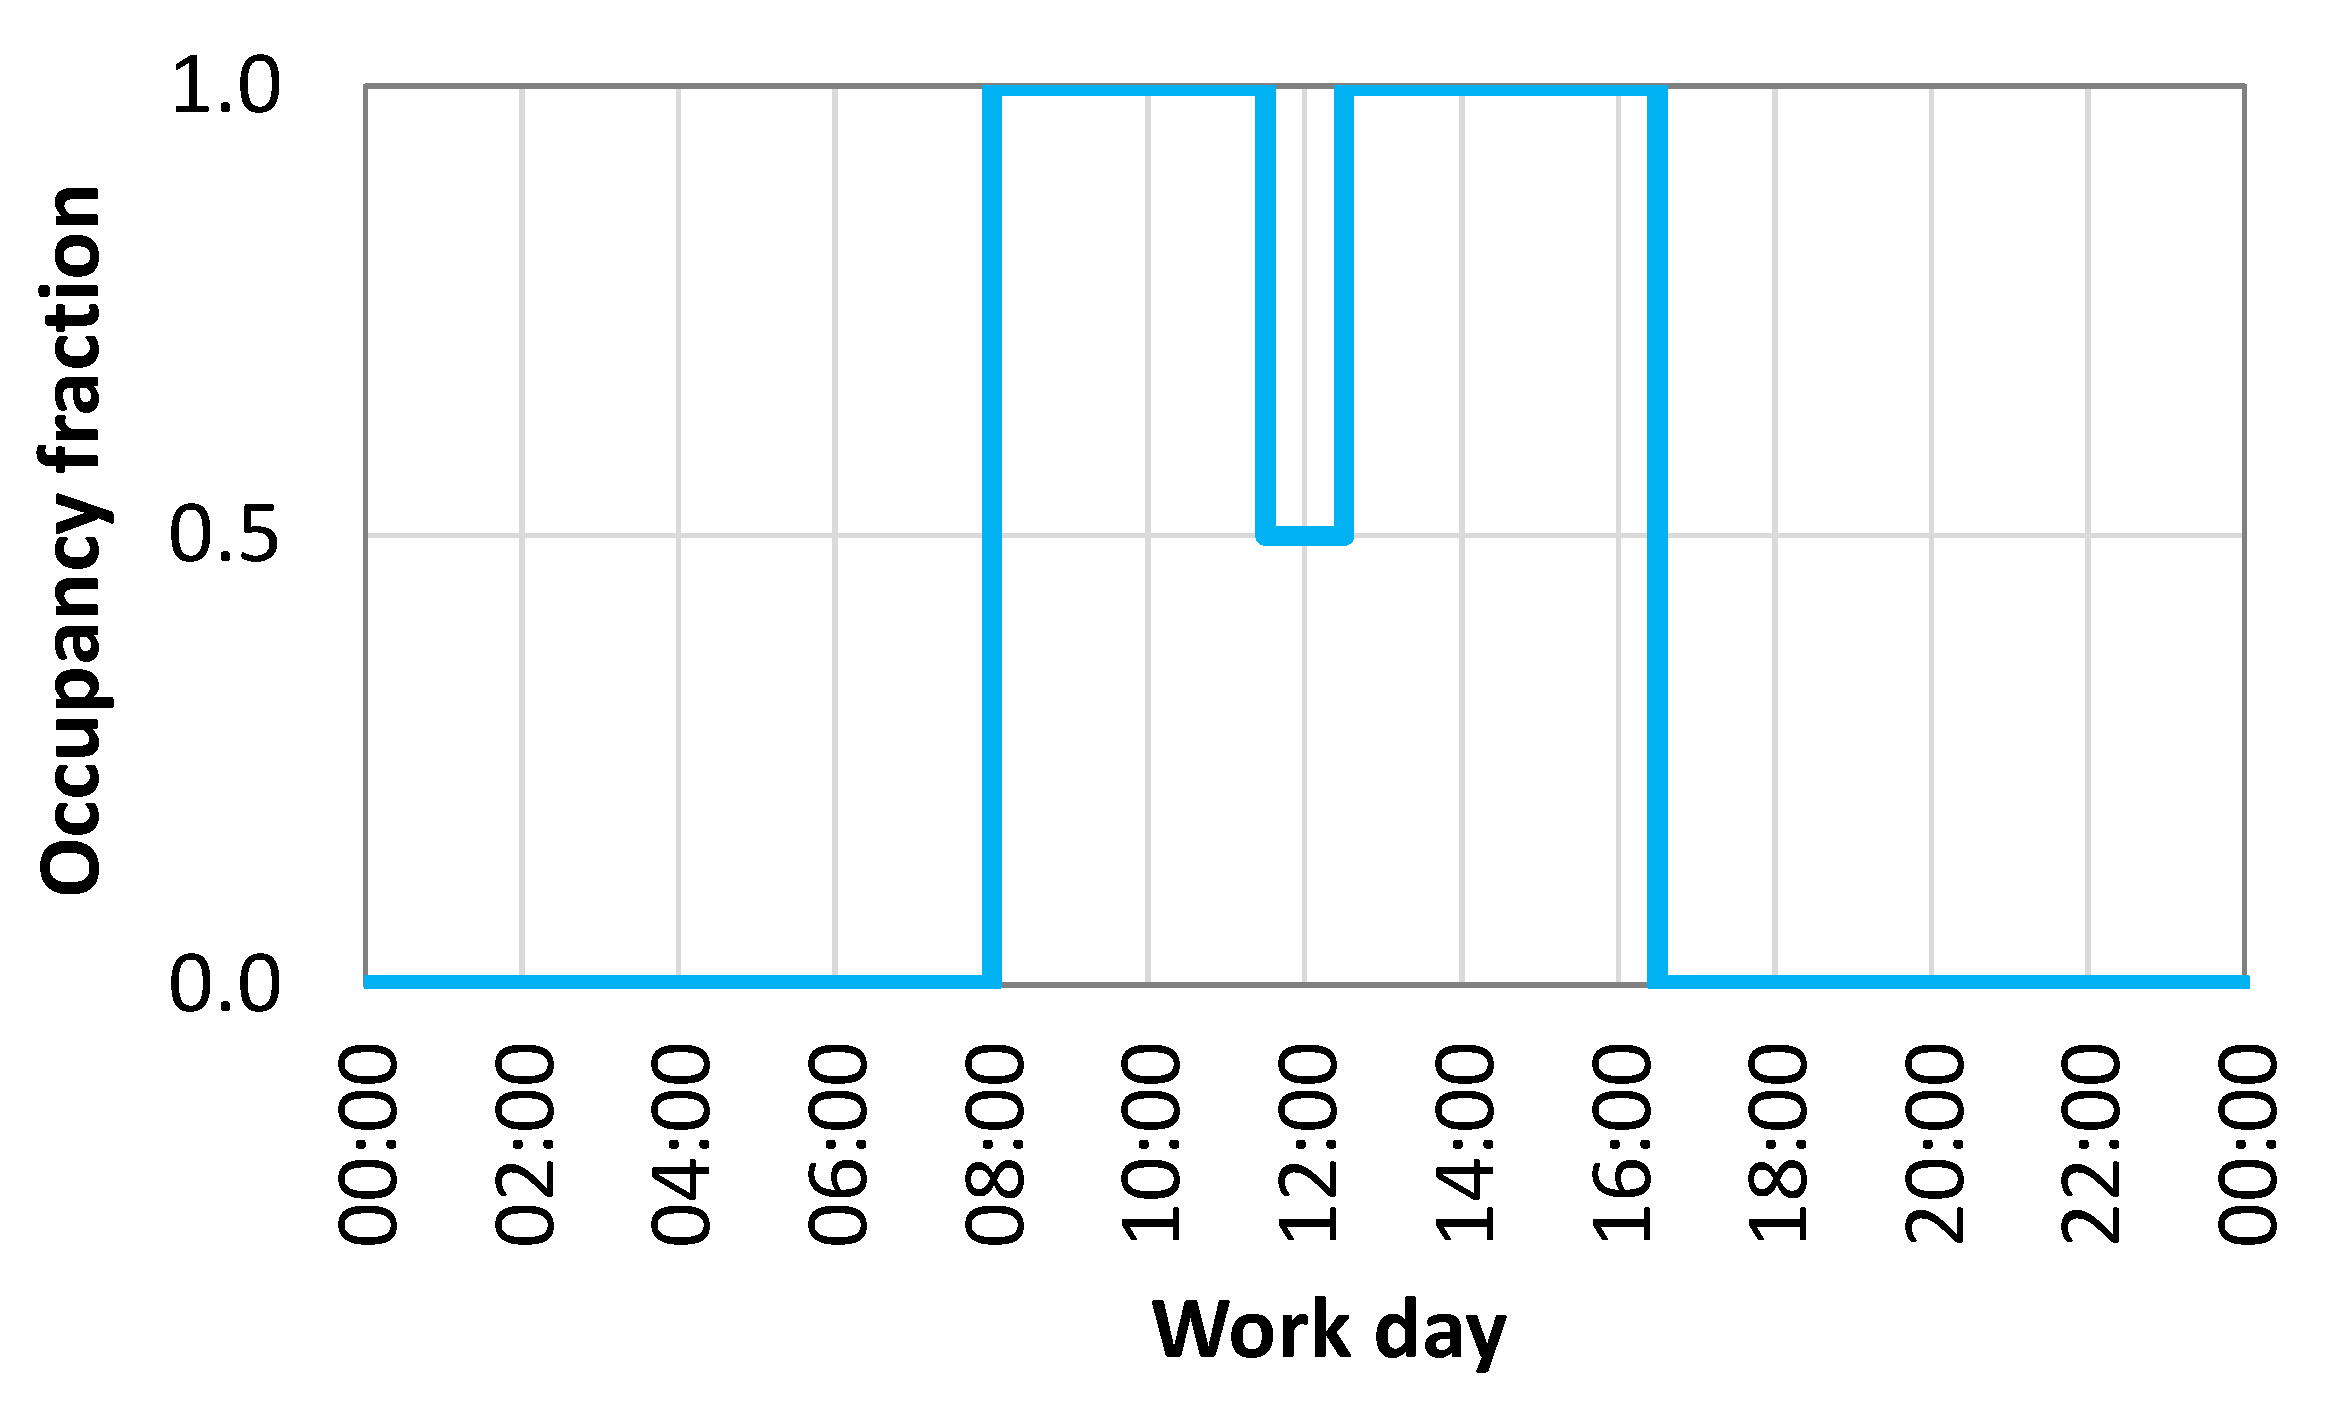
We simulated two occupants with an activity level of 1.2 met in the model. The occupancy profile, shown in Figure 1, assumed an 8 h working day with a 0.5 h lunch break. Weekends and public holidays in Poland were taken as days off. Each occupant used a personal computer (65 W), which was turned on when the employee was present in the office.
Four ceiling light units with a power of 40 W and luminous efficacy of 100 lm/W were included in the model. The control strategy was based on the light intensity set points and schedule. Electric lighting was turned on during working weekdays from 8:00 AM to 4:30 PM when the light intensity at the workplace was below 500 Lux and switched off when it increased above 1000 Lux.
2.3. Simulated Cases
All simulated cases are listed in Table 2, and the VAV mixing ventilation was chosen as the reference system. The second system is the chilled ceiling combined with CAV mixing ventilation working on reduced airflows (CCMV). For those two systems, the maximum room temperature was 26 °C [4]. The third simulated system was chilled ceiling combined with personalized ventilation (CCPV). Three operation strategies were analyzed for this system:
- (1)
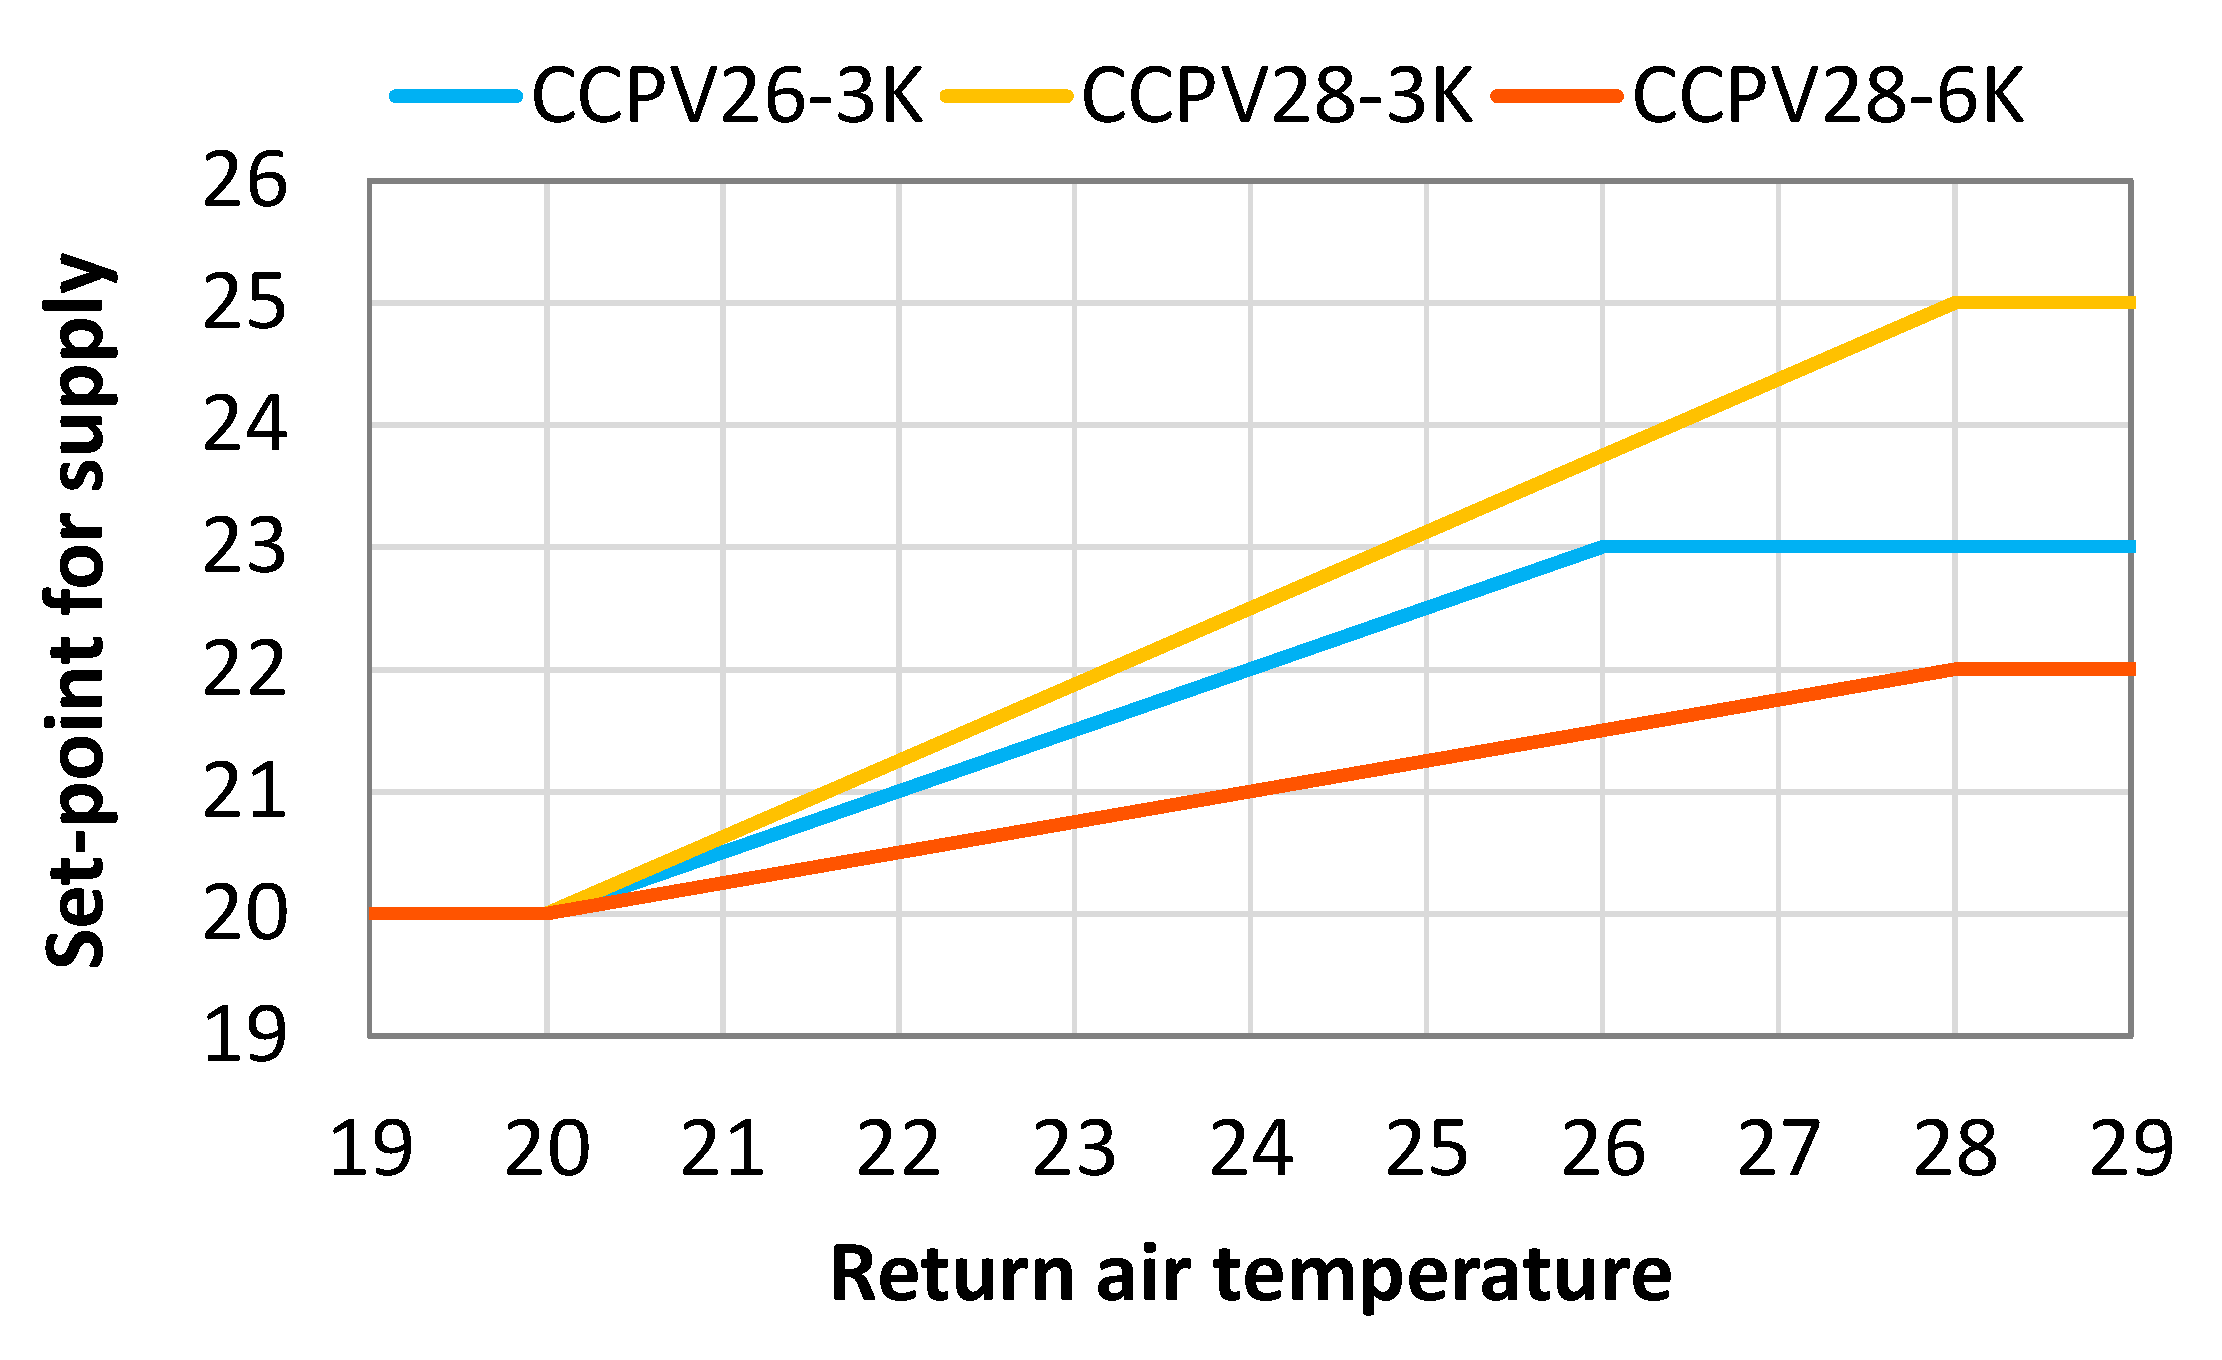
- CCPV26-3K–the system maintained a maximum room temperature of 26 °C. The supply air temperature was controlled based on the room air temperature (equal to the return air temperature), as shown in Figure 2. When the room air temperature was less than or equal to 20 °C, the supply air temperature was kept at 20 °C. As the room air temperature increased, the supply air temperature was linearly increased to the design temperature difference of 3 K (between room setpoint temperature and supply air temperature). If the room temperature exceeded 26 °C, then the supply air temperature was kept at 23 °C;
- (2)
- CCPV28-3K–the maximum room temperature was increased to 28 °C with the design supply temperature difference of 3 K. The supply air temperature was controlled in the range from 20 to 25 °C as shown in Figure 2;
- (3)
- CCPV28-6K–the maximum room temperature was 28 °C. The designed temperature difference between room air temperature and supply air temperature was increased to 6 K. The supply air temperature was controlled in the range from 20 to 22 °C as shown in Figure 2.
We analyzed the performance of each system when subjected to various levels of solar heat gains and studied three solar shading strategies: none, external horizontal blinds, and internal vertical blinds.
Current standards [3,4] recommend the operative temperature as designed room temperature. However, because VAV systems are controlled according to air temperature and it is difficult to describe local conditions at workstations with PV, the air temperature was a base room temperature setpoint parameter, while additional cases used operative temperature (coded with OT). Therefore, the influence of the room temperature control parameter on the energy use was studied. Moreover, systems using CC were also analyzed with the dew-point supervisor control to limit the vapor condensation risk (cases are coded with Ctrl).
The supply airflow rates were selected to fulfill recommendations in EN 16798-1 [4]. The differences in the response time of the PV and the mixing ventilation system to occupants’ activities were not studied.
2.4. Description of HVAC Systems
2.4.1. Chilled Ceiling (CC)
In our calculations we assumed that CC panels covered 75% of the ceiling area and had total cooling power of 1700 W (100 W/m2 according to recommendations [12]). We built the supervisory control macro to avoid vapor condensation on the ceiling surface (coded as Ctrl). The supply water temperature was controlled based on the moisture content of the return air. There was no control of the relative humidity of the air supplied by the ventilation systems.
2.4.2. Personalized Ventilation (PV)
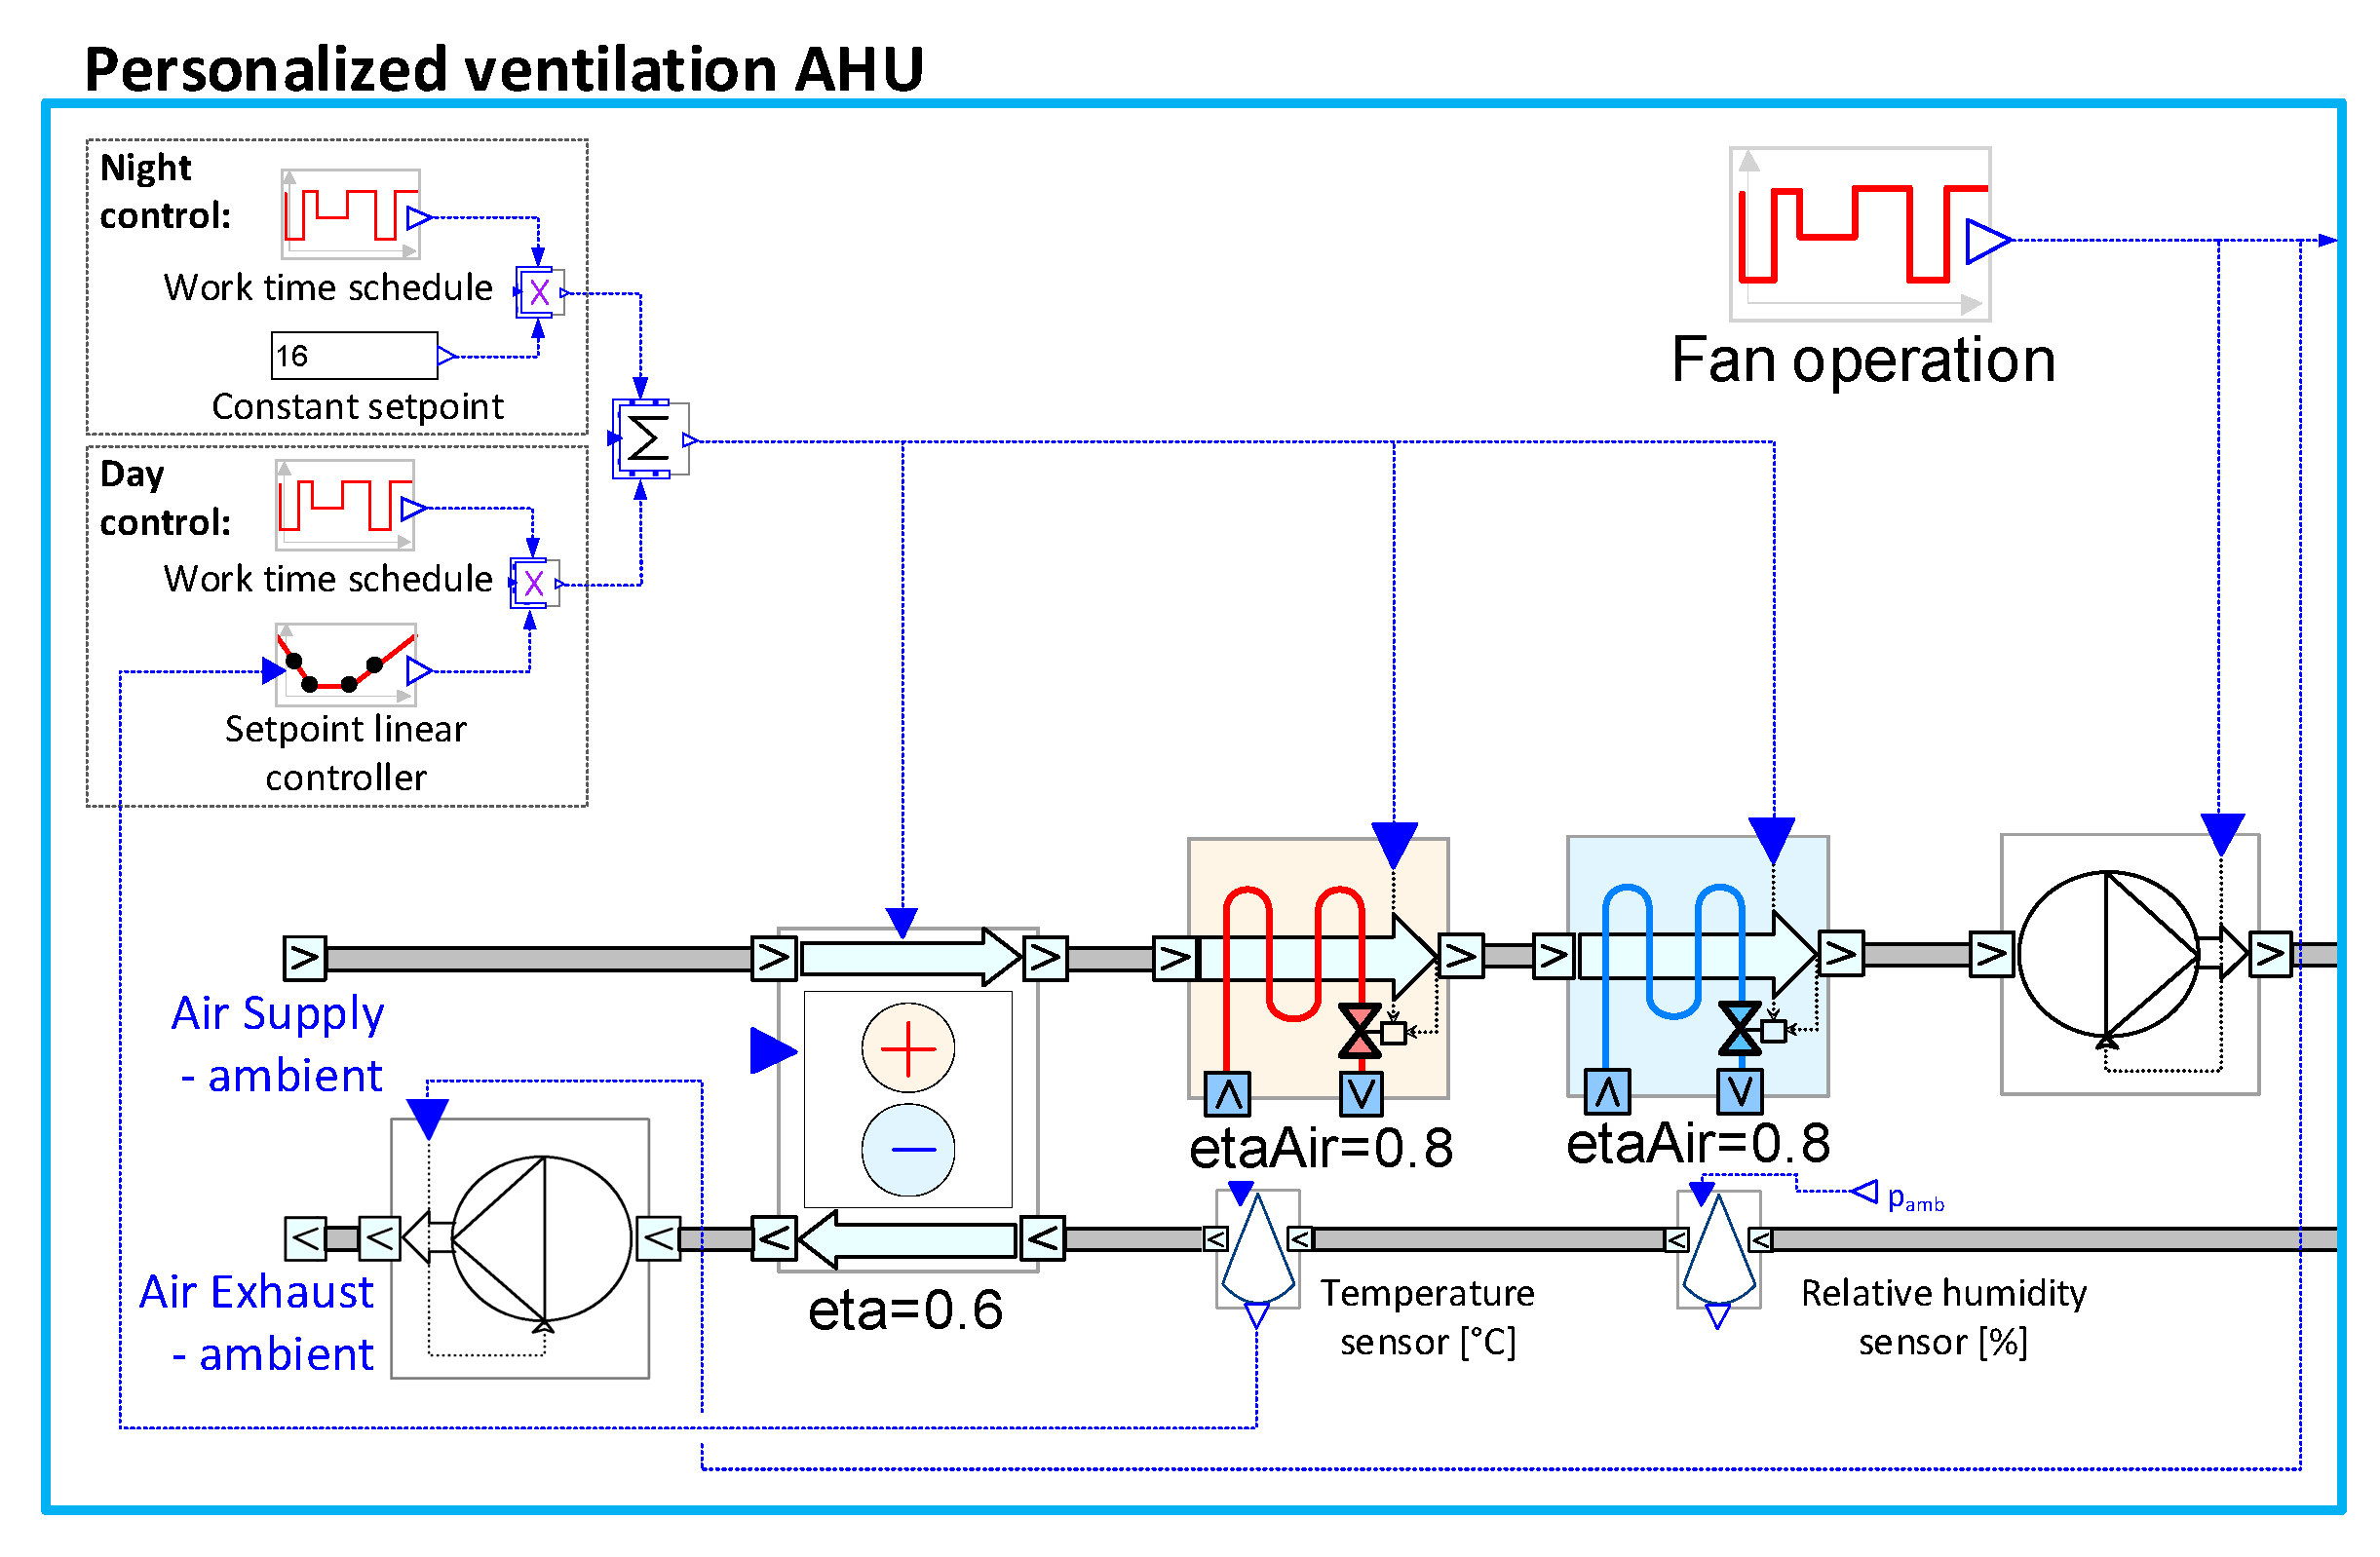
The PV system supplied 100% outside air. We used two temperature setpoint controls. During working hours (8:00 A.M. to 4:30 P.M. on weekdays), the supply air temperature was controlled based on the return air temperature (Figure 2). For all other times, we kept the constant setpoint of 16 °C. Figure 3 presents the schematic model of the air-handling unit for personalized ventilation.
2.4.3. CAV and VAV Mixing Ventilation (MV)
For cases with mixing ventilation, the air-handling unit was identical to the PV. The setpoint for supply air temperature was kept constant at 16 °C.
2.4.4. Zone Heating
The office located in the temperate climate of Katowice (Poland) requires an additional heating system in winter. The electric radiator was located under the window to compensate heating demand and keep the minimum room temperature of 20 °C.
3. Results
Used energy provides a measure of the amount of energy supplied by the plant to the distribution systems. It consists of energy for zone heating and cooling, AHU heating and cooling, and the domestic hot water circuit (not included in analyses). Detailed reports on used energy for each climate also gives the amount of free energy recovered in the AHU air-to-air heat exchanger.
The use of a hydronic CC system improves the heat transport efficiency because it uses water instead of air as the thermal distribution fluid. It also enhances the plant efficiency, since the cold water temperatures are higher compared to air systems, and influences the energy demand of fans and pumps [12,24]. Thus, in this work we report the delivered energy to the used energy to provide an overview of the total energy that has been purchased to cover building demands.
The thermal environment was evaluated based on the average values of the following parameters: air temperature, operative temperature and relative humidity according to EN 16798-1 [4] for occupied time. The classification based on the relative humidity separates the requirements for dehumidification and humidification. The results of the thermal environment evaluation for cases with maximum heat gain level and room air temperature control are presented in the following for simplicity.
3.1. Temperate Climate (Katowice)
3.1.1. Energy Use
In Figure 4 the energy usage of each system is shown for a temperate climate. The most energy-efficient system at high heat load was VAV. The use of the CC resulted in lower energy use for air-cooling in AHU, but its energy use for zone cooling was substantial, whereas VAV benefits from outdoor air free-cooling. The change of the ventilation system from MV to PV further increased energy use. The warmer supply air from PV resulted in lower energy use for air-cooling and zone heating, but CC’s energy use increased by 41% and the air heating by 95%. The increase of the room temperature from 26 °C to 28 °C at CCPV system resulted in 22% lower energy use of CC, achieving total energy use comparable to CCMV system. Changing the control strategy of personalized air temperature between CCPV28-3K and CCPV28-6K resulted in additional 10% energy savings. Supplying cooler air reduced the amount of energy used by CC and for air heating in AHU.
Solar shading decreased solar heat gains substantially—by 52–54% with internal vertical blinds and 64–69% with external blinds, and resulted in a substantial decrease in the energy used for zone cooling. The most notable reductions in CC energy use due to external shading occurred for the CCMV (99.4%) and the CCPV28-6K (99.5%) systems. With the VAV, the energy used for air-cooling in the AHU decreased by 40–60%. However, in the temperate climate of Katowice, the solar shading also resulted in higher zone heating needs—30–40% higher for internal blinds and double for external shading. The type of solar shading device did not influence the total energy used for VAV, CCMV and CCPV28-6K. For the CCPV26-3K and CCPV28-3K, external blinds were more energy efficient than internal solar protection.
The use of solar shading devices reduces the total energy used by the CCPV so much that it consumes less than VAV. The most economical combination was CCPV28-3K with external blinds, and, in both cases, CCPV28-6K with solar shading. The energy used by these systems was 14–16% lower than comparable cases with VAV.
Controlling the system based on operative temperature resulted in a 5–11% increase in energy use of CC compared to control using air temperature, and the impact on the other components of energy use was negligible.
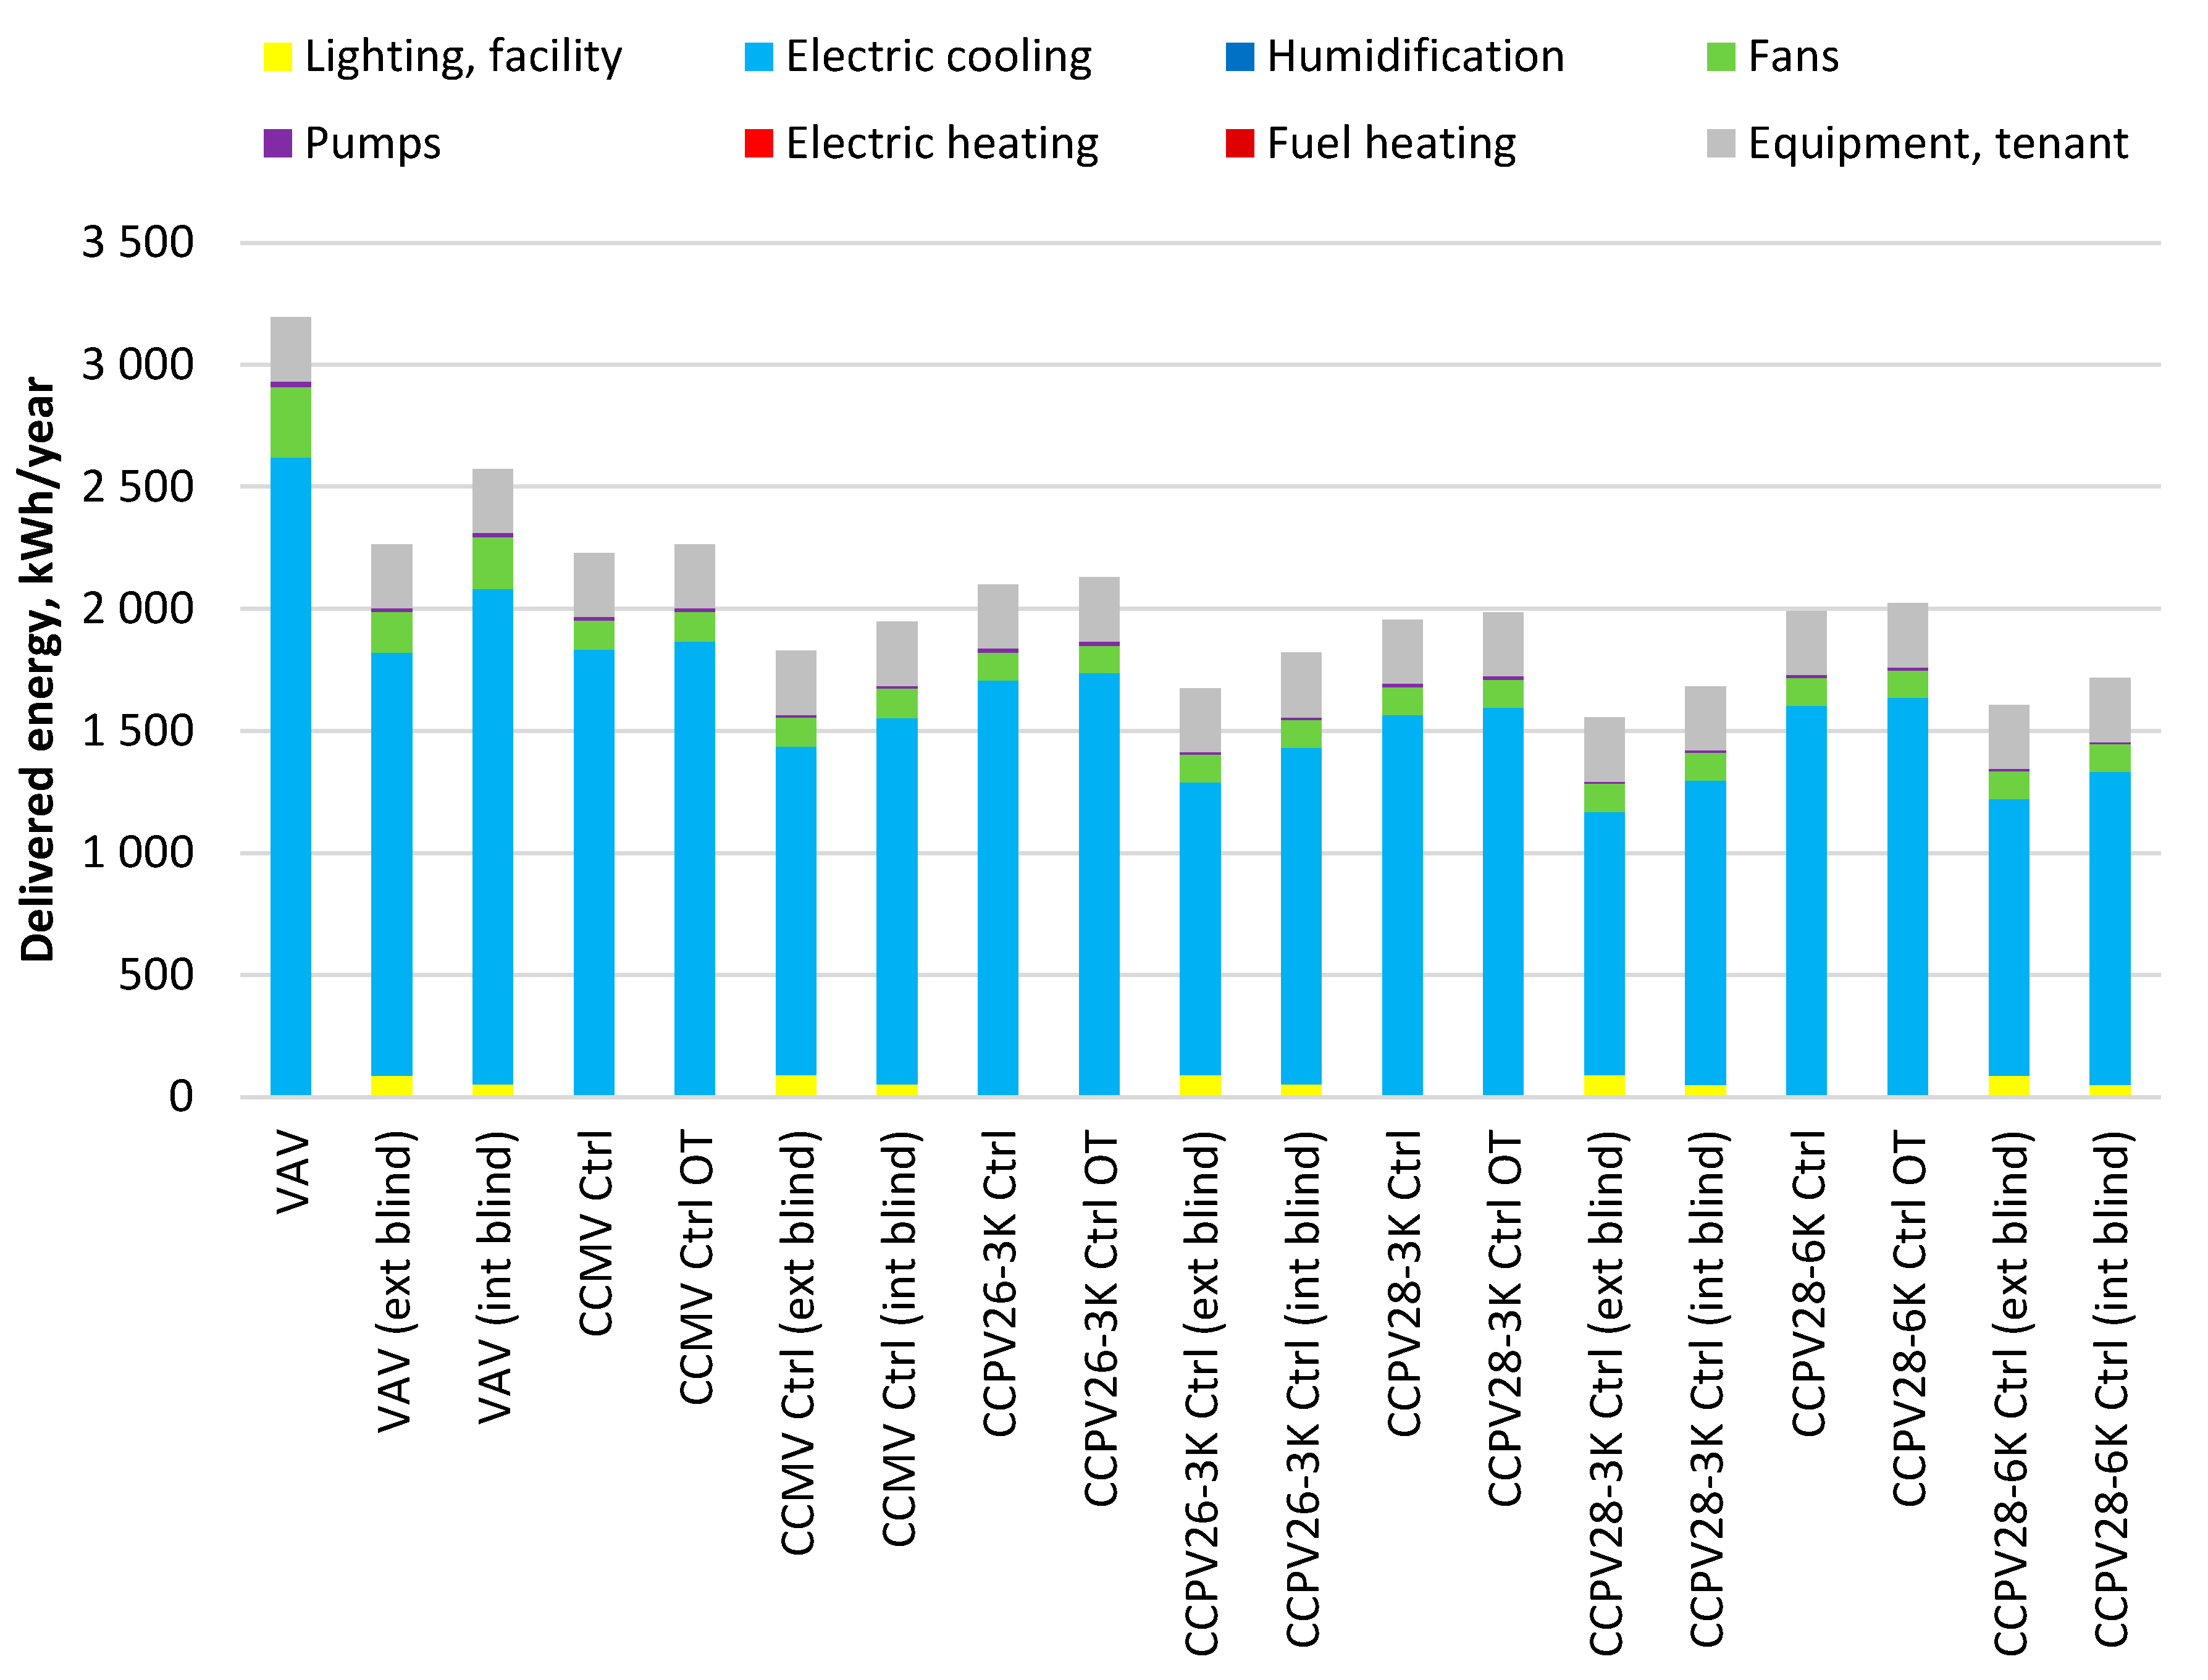
3.1.2. Delivered Energy
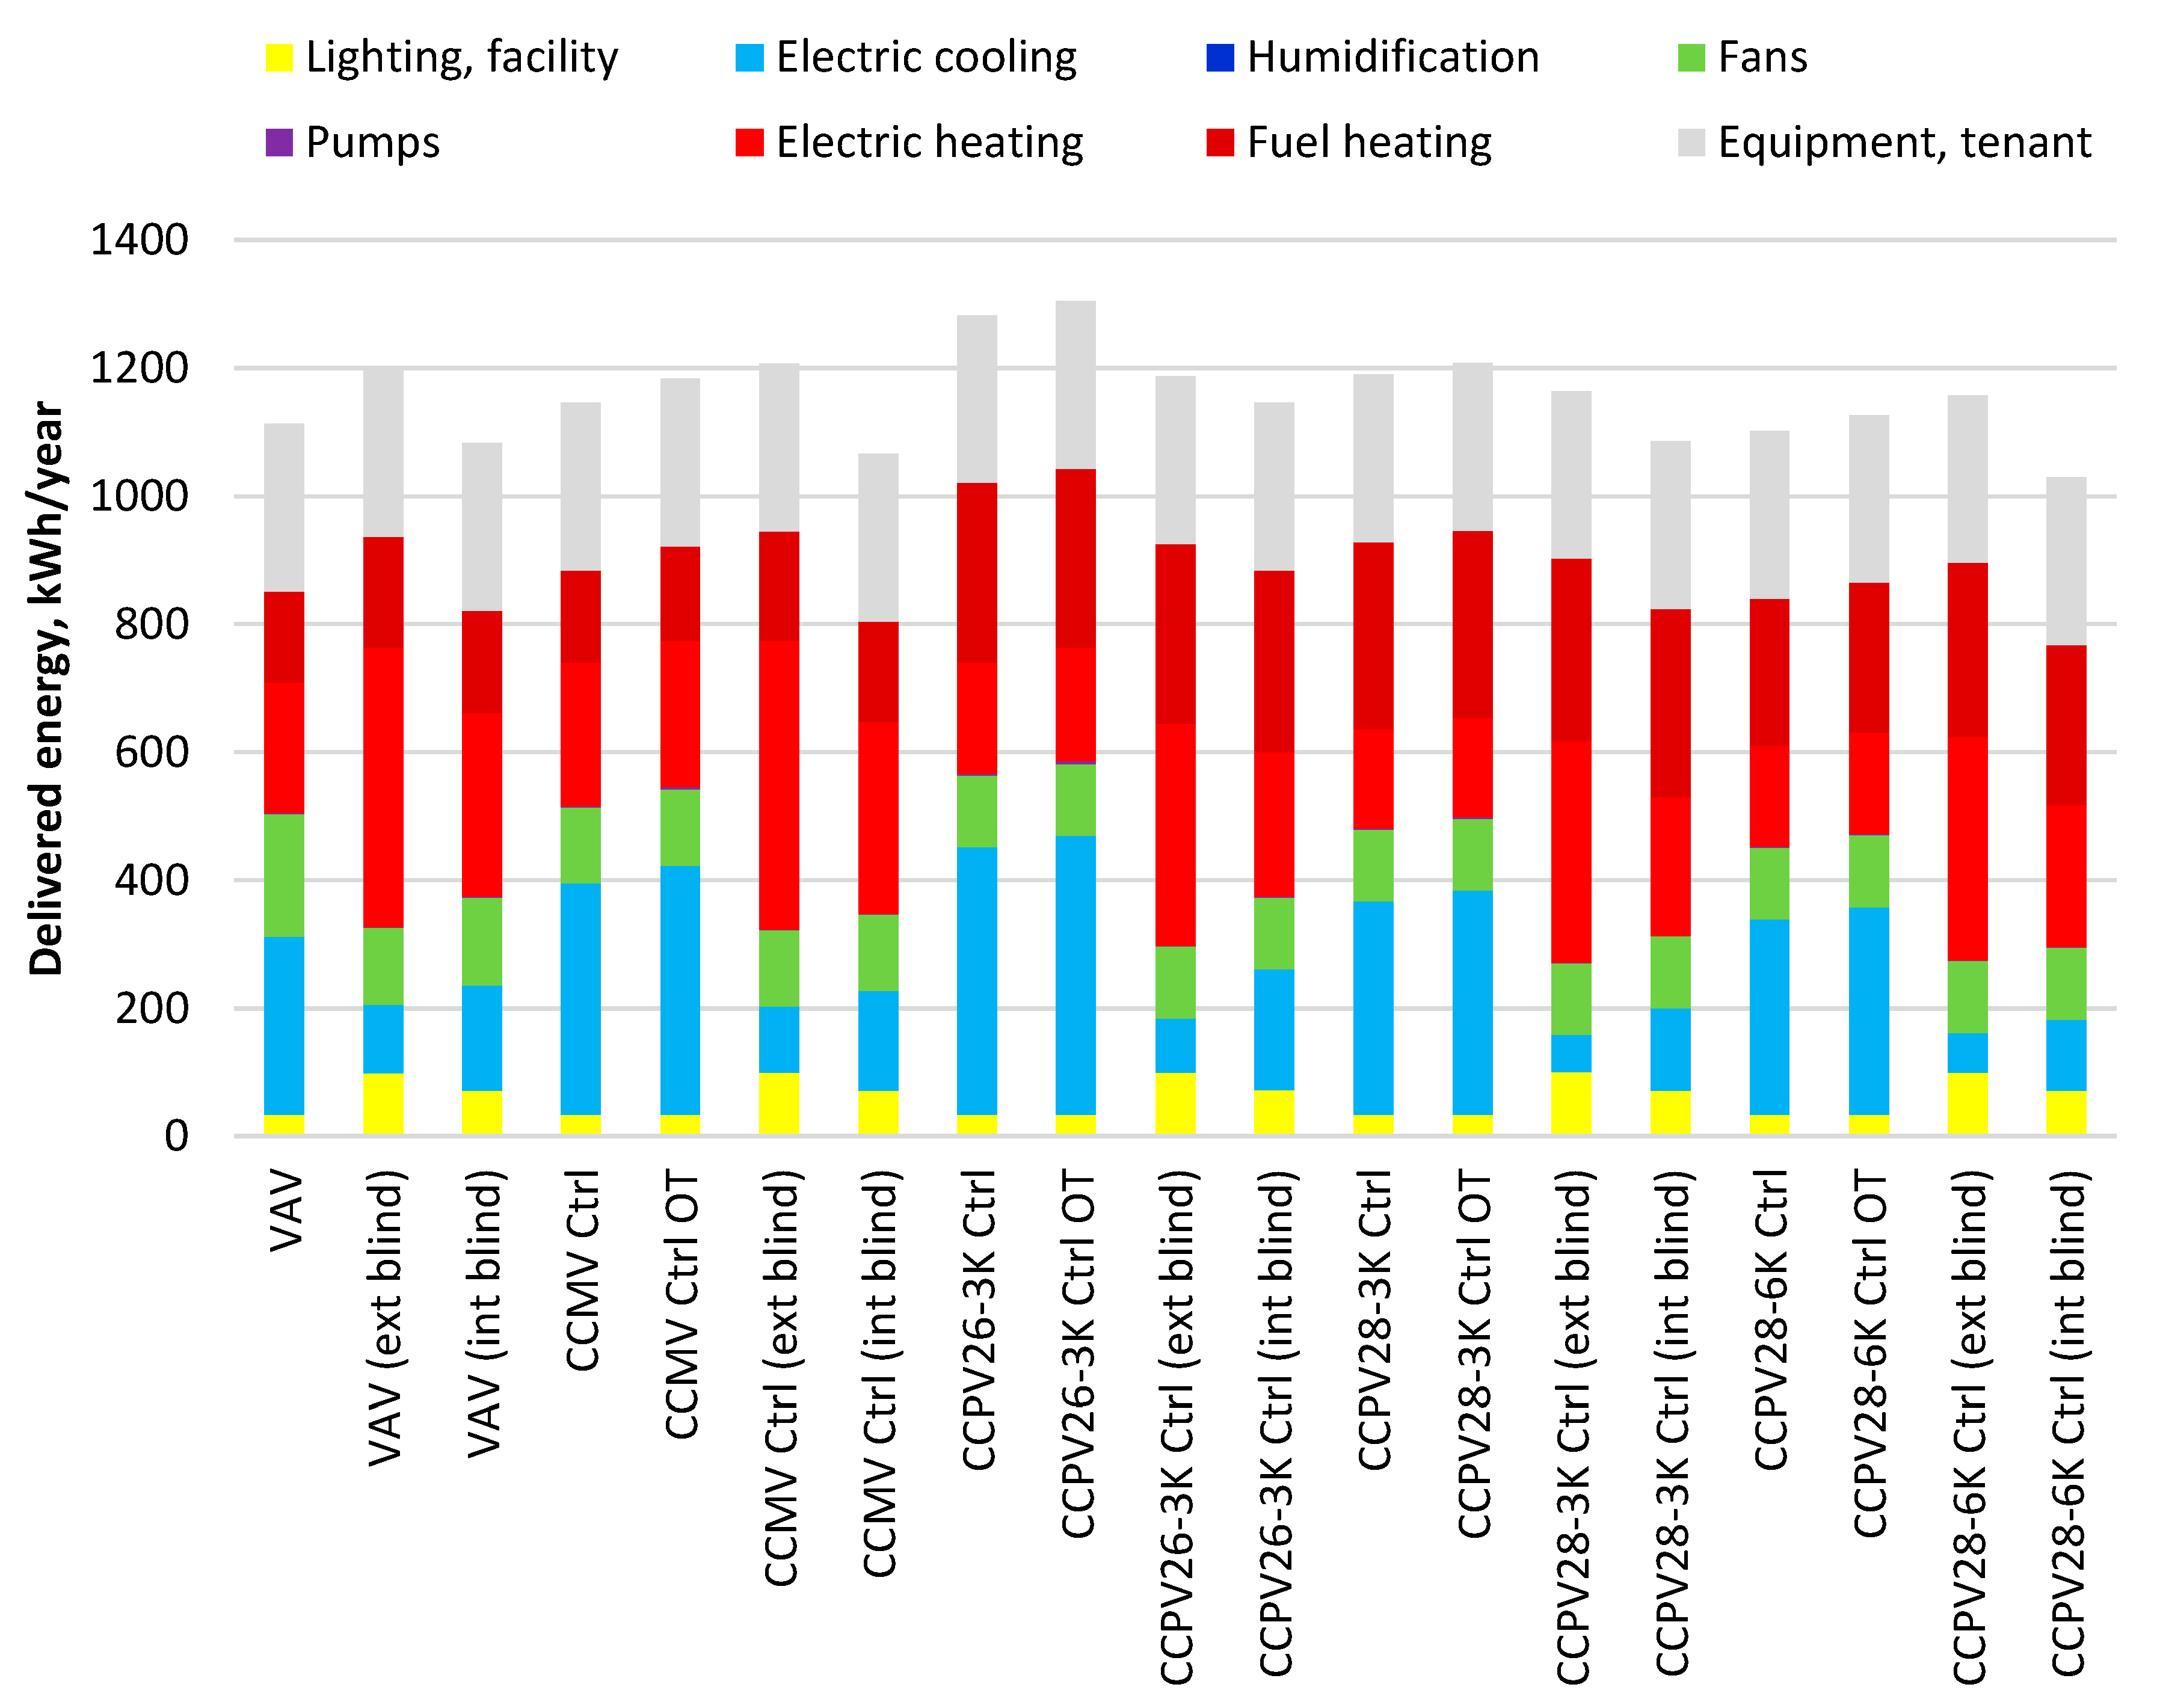
The energy delivered for the zone conditioning is presented in Figure 5, where it can be seen that the CCMV performed similarly to VAV. At 26 °C, the largest amount of delivered energy occurred for the CCPV system without solar shading and was 15% higher than VAV. This increase is due to higher demand for cooling and heating personalized air in the AHU.
Increasing the room temperature to 28 °C did not reduce the total amount of delivered energy at CCPV28-3K compared to VAV and CCMV. The energy for cooling was similar to CCMV, but more energy was required for heating the supply air in the AHU. A slight decrease of 1% was achieved with CCPV28-6K. Supplying personalized air at a lower temperature than with CCPV28-3K resulted in a lower amount of energy for heating air in the AHU.
These results indicate that external blinds are not an efficient solar shading strategy to reduce delivered energy in Katowice. It reduces the energy consumed for cooling, but it simultaneously increases the demand for zone heating. Aside from CCPV26-3K and CCPV28-3K, the total delivered energy was higher when external blinds were used than when there was no solar shading. In the cases considered here, internal blinds were more efficient and each system’s total delivered energy was lowest. They decreased the cooling demands by 34–41%, but increased heating up to 12%.
The total delivered energy for all cases was lowest for CCPV28-6K with integrated internal blinds, which used 5% less energy compared to VAV with internal blinds. The use of operative temperature instead of air temperature as a control parameter resulted in a 1–3% increase in the total delivered energy.
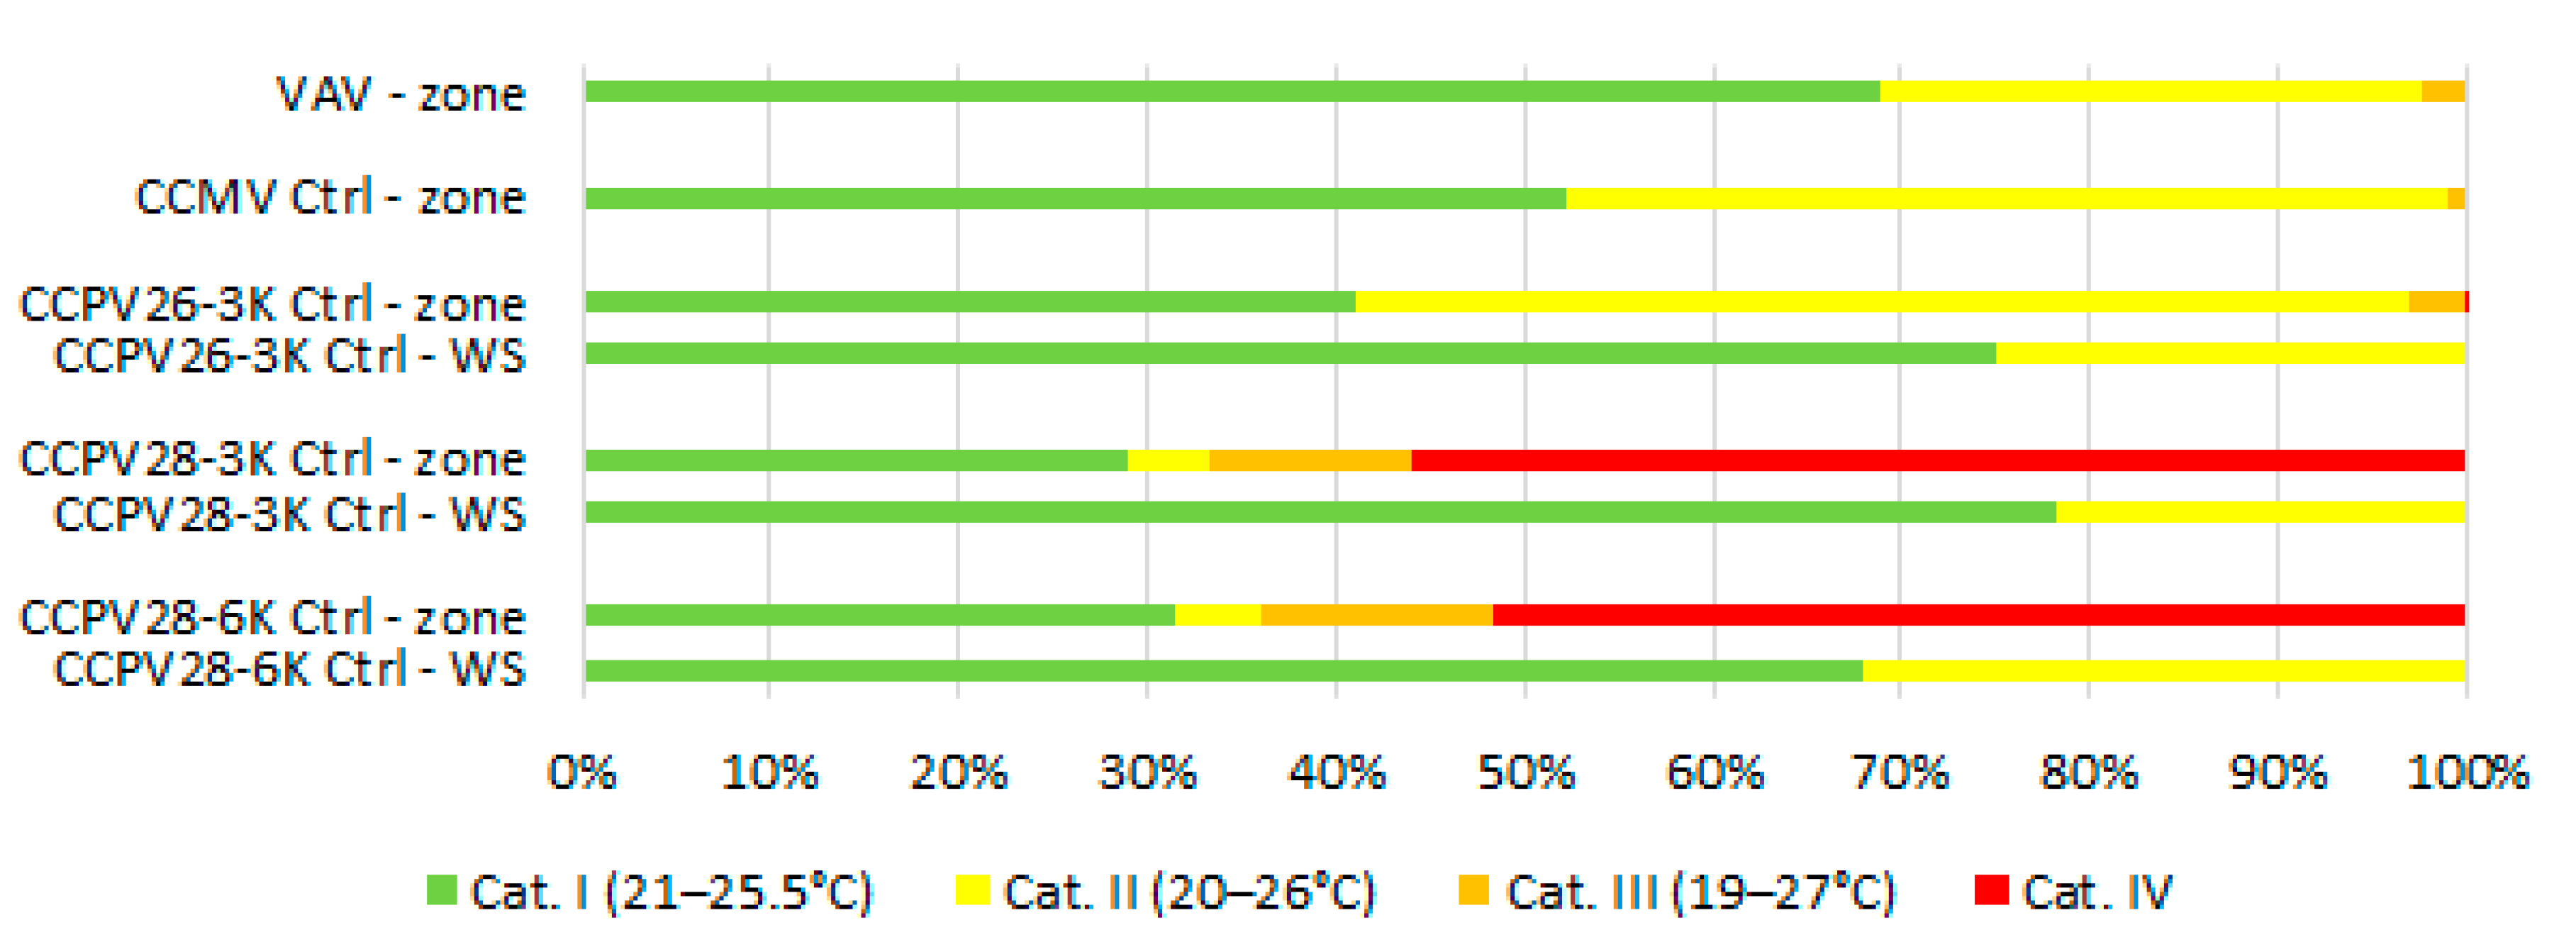
3.1.3. Thermal Environment Quality in Room
In cases where mixing ventilation was used, i.e., VAV and CCMV, the zone air temperature met the requirements for category I over 50% of the occupied time (Figure 6). With CCPV26-3K, the criteria was met 41% of the time, but conditions at workstations were substantially improved because of the PV. All three systems at the setpoint temperature of 26 °C performed at a satisfactory level and provided room thermal environment conditions that met category II criteria for nearly the entire occupied time. The cooling requirements were not met when there was no shading with two systems: VAV (9 h per year), CCPV26-3K with dew-point control (4 h) and when control was based on operative temperature (2 h); however, such short periods are considered negligible.
At both CCPV28-3K and CCPV28-6K, room air and operative temperature were above 27 °C for 47–52% of the occupied time and did not exceed the 28 ± 0.5 °C setpoint. Both system configurations provided conditions of a higher category to the workstation compared to other space in the zone. These results indicate CCPV28-3K as a configuration with better performance than CCPV28-6K.
When we used the system control based on the air temperature, the VAV system performed slightly better in the long-term than CCMV. The maximum air and operative room temperatures were obtained with the VAV system, 27.5 °C and 28.5 °C respectively. Using CCPV26-3K, the maximum values were 0.2 K lower than with VAV. With the CCMV, the maximum air temperature was 26.3 °C and operative temperature was 27.7 °C. Changing the control parameter to operative temperature resulted in an improved thermal environment for CCMV and CCPV26-3K. At both CCPV28-3K and CCPV28-6K, the differences were negligible. For all systems, both internal and external solar shading systems improved thermal conditions in the zone.
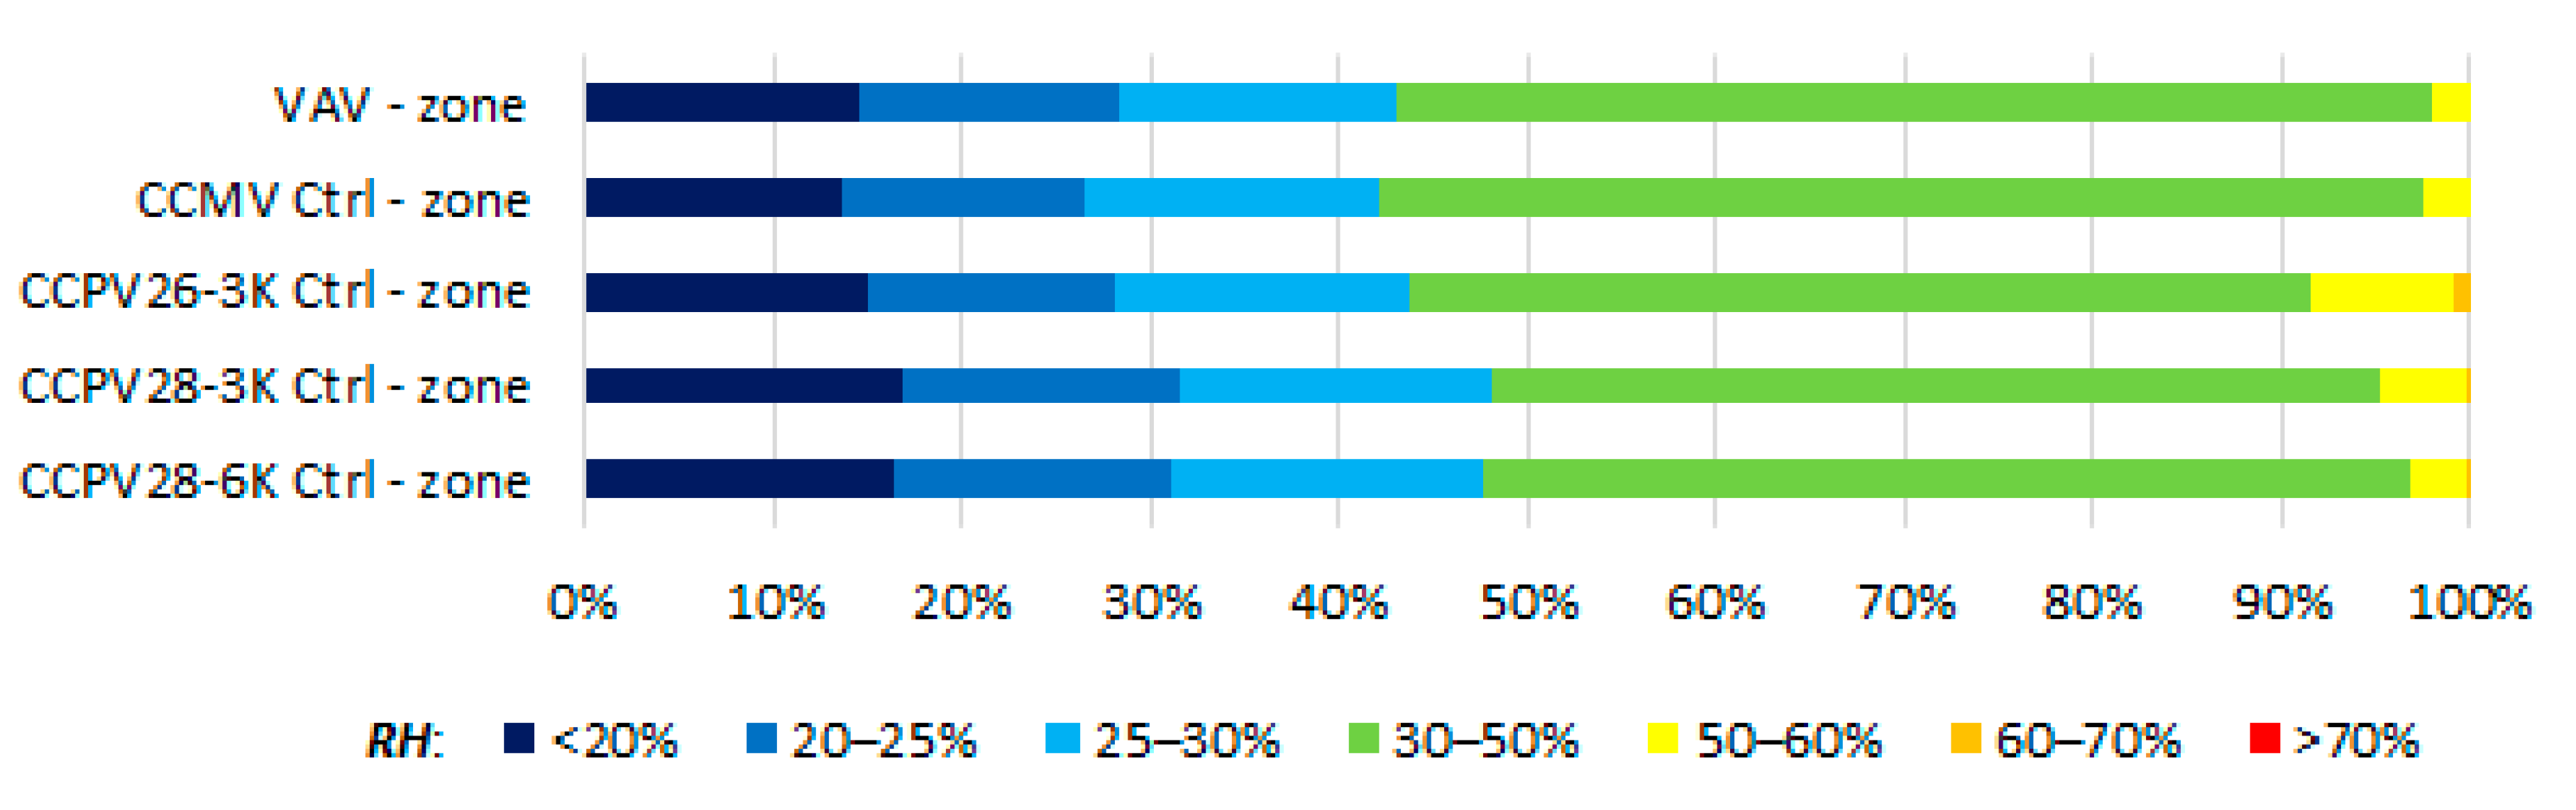
Figure 7 presents the zone relative humidity in the percentage of the occupied time. The relative humidity was only slightly affected by the system type or solar gains (differences were within ±5%). Most of the time, the relative humidity was between 30% RH and 50% RH, but it decreased during the heating season. The minimum relative humidity in all cases was at the level of 5–7% RH.
3.2. Hot and Humid Climate (Singapore)
3.2.1. Energy Use
The energy use, shown in Figure 8, indicates substantial energy savings due to CC in the climate of Singapore. The energy used for air-cooling in the AHU was reduced by 39% with CCMV compared to VAV, which resulted in a 27% lower total energy use compared to VAV. The replacement of the MV with PV resulted in further energy savings. CCPV26-3K brought 26% savings in the energy used for air-cooling in the AHU and 49% increase of energy used by CC comparing CCMV. Due to CC’s high energy efficiency, the total energy used at CCPV26-3K was reduced by 38% and 14% for VAV and CCMV respectively.
The elevated room temperature of 28 °C resulted in a 22% reduction in cooling demand for CC at CCPV28-3K and 35% lower at CCPV28-6K compared to CCPV26-3K. However, keeping the design temperature difference between supplied personalized air and room temperature of 6 K at CCPV28-6K resulted in 8 and 13% higher energy use for air-cooling compared to CCPV26-3K and CCPV28 -3K.
Both solar shading devices performed well. The solar gains were reduced by 38–46% with external blinds and by 39–48% with internal vertical blinds, which decreased the total energy use. For VAV system, both solar shading devices netted energy savings of 18%. When the CC was used, energy savings were 8–10% with external blinds and 5–6% with internal blinds.
Regardless of the solar shading control, CCPV28-3K used the lowest amount of energy. The potential savings were predicted to be 36–43% compared to VAV and 22–23% compared to CCMV. The use of the operative temperature instead of air temperature as a control parameter resulted in 1% higher total energy use, which is negligible.
3.2.2. Delivered Energy
Figure 9 presents the amount of delivered energy for each case in Singapore. The highest energy demand was for the VAV system, even with solar shading. The use of CC decreased the amount of delivered energy by 26% for the CCMV system and by 35% at CCPV26-3K compared to VAV. Increasing the room temperature resulted in further energy saving, for example, the energy demand at CCPV28-3K was 40% lower than at VAV. The decrease in energy consumption was lower at CCPV28-6K (36%).
Solar shading had the most significant impact on delivered energy with a VAV system. The external shading resulted in a 14% decrease in delivered energy, and savings for internal blinds were 9%. For systems using CC, decrease in energy demand was 5% with external blinds and 3–4% with internal blinds.
When the external blinds were used, radiant systems’ total energy savings compared to VAV were smaller than when without solar protection, but still substantial–18% for CCMV, 28% for CCPV26-3K, 34% for CCPV28-3K, and 30% for CCPV28-6K. Similarly, with the internal blinds savings were 21%, 36% and 33%, respectfully.
The lowest total delivered energy was for the CCPV28-3K case with external blinds, which netted a 34% reduction compared to VAV. Moreover, the energy demand for this system was the smallest for all solar control strategies. In this climate, the increase in energy demand due to control according to operative temperature instead of air temperature was only 1%.
3.2.3. Thermal Environment Quality in the Room
The conditions provided by the VAV system met the criteria for the highest thermal environment category, evaluated based on the zone air temperature (Figure 10), at all solar gain levels. The VAV system also performed better than CCMV and CCPV due to the zone operative temperature–except for the case of CCMV with room temperature control using operative temperature. For this configuration, the CCMV system performed best and held the maximum zone air temperature to 25.8 °C with operative temperature of 26.1 °C.
At the CCPV26-3K, the air temperature exceeded 26 °C for 53% of the time when there was no solar shading (66 h in which cooling requirements were not met, and a maximum air temperature 27.9 °C and operative temperature 28.4 °C). Due to the operative temperature, the CCPV26-3K performed slightly worse than CCMV when solar gains were maximum. With solar shading, both systems performed comparably. At all three configurations of CCPV-3K, the supply air temperature from personalized ventilation for the entire occupied time met the category I requirements. When the room temperature was 28 °C, CCPV28-3K did not meet the cooling needs for 6 h, and neither did CCPV-28-6K for 4 h; however, such short periods are considered negligible.
Solar shading improved the thermal environment for VAV and CCPV26-3K. For other systems, solar shading had a minor impact on the quality of the thermal environment.
Changing the system control from air temperature to operative temperature resulted in a decrease in both the air and operative temperature by 0.1–0.3 K. This led to an improvement of the thermal environment category in the room for systems using 26 °C as the setpoint.
The use of PV as the sole ventilation system in the room had a major impact on the relative humidity (Figure 11). At CCPV26-3K, the relative humidity exceeded 70% RH for 81–83% of the time. When the room temperature was set to 28 °C, the CCPV28-6K provided an indoor environment with lower relative humidity than CCPV28-3K, as the supply air was more cooled and, therefore, dehumidified in the AHU.
Solar shading had a negligible influence on the zone relative humidity. The room control using operative temperature instead of air temperature slightly increased the room’s relative humidity, but the impact was negligible. The differences in the classification were within ±1% of the occupied time.
3.3. Hot and Dry Climate (Dubai)
3.3.1. Energy Use
As shown in Figure 12, Dubai’s energy use was highest for the VAV system without solar shading. The use of CC resulted in substantial energy savings for air-cooling in the AHU. For CCMV, the AHU cooling was 54% lower than for VAV, which, including energy used by CC, resulted in 30% lower total energy use compared to VAV. Changing the ventilation system from MV to PV resulted in further energy savings for air-cooling—65% less energy compared to VAV. Thus, including energy used for zone cooling, CCPV26-3K brought total energy use savings of 35%.
Increasing the room temperature from 26 to 28 °C was an effective energy-saving strategy. It resulted in 15% and 23% lower energy use of CC at CCPV28-3K and CCPV28-6K, respectively, than at CCPV26-3K. The CCPV26-3K and CCPV28-3K were the only configurations that required heating in the AHU; however, the energy used in this process was exceptionally small (0.1–0.2 kWh/year for CCPV26-3K and 0.3–0.8 kWh/year for CCPV28-3K). Changing the supply air temperature control using lower temperatures for CCPV28-6K resulted in no heating in the AHU. The lowest energy use was at CCPV28-3K, followed by CCPV28-6K. Compared to VAV, the energy savings depended on the solar gains and were around 38–40% and 35–39% for CCPV28-3K and CCPV28-6K respectively.
Solar gains decreased by 54–60% with external blinds and between 50–53% with internal blinds, and, therefore, strongly influenced the energy use. The external horizontal blinds were more efficient than the internal vertical blinds. The external blinds led to 26–34% savings in energy use, whereas the internal blinds resulted in 18–22% savings. Using operative temperature instead of air temperature as a room control parameter increased the energy used by the AHU for air-cooling and by CC. In total, energy use increased by 2%.
3.3.2. Delivered Energy
Results of energy consumption analyses, shown in Figure 13, indicate that radiant cooling systems are an efficient solution for Dubai’s climate. The use of CC resulted in substantial energy savings. For the largest heat gains considered here, the CCMV systems required 30% less delivered energy than the VAV system. Replacing the mixing ventilation with PV increased savings to 34% at CCPV26-3K compared to VAV. Increasing the room temperature to 28 °C resulted in an additional 5% savings with CCPV28-3K and 4% with CCPV28-6K.
The use of solar shading devices corresponded to the largest savings with the VAV system—which was the most energy-consuming system—and the performance improved by 29% with external blinds and 19% with internal blinds. With the CC, energy consumption was 18–20% lower with external blinds, and 13–14% less when compared to cases with no shading devices. The delivered energy was the lowest for all cases using the CCPV system and external shading (savings compared to VAV of 26% at CCPV26-3K, 31% at CCPV28-3K and 29% at CCPV28-6K).
3.3.3. Thermal Environment Quality in Room
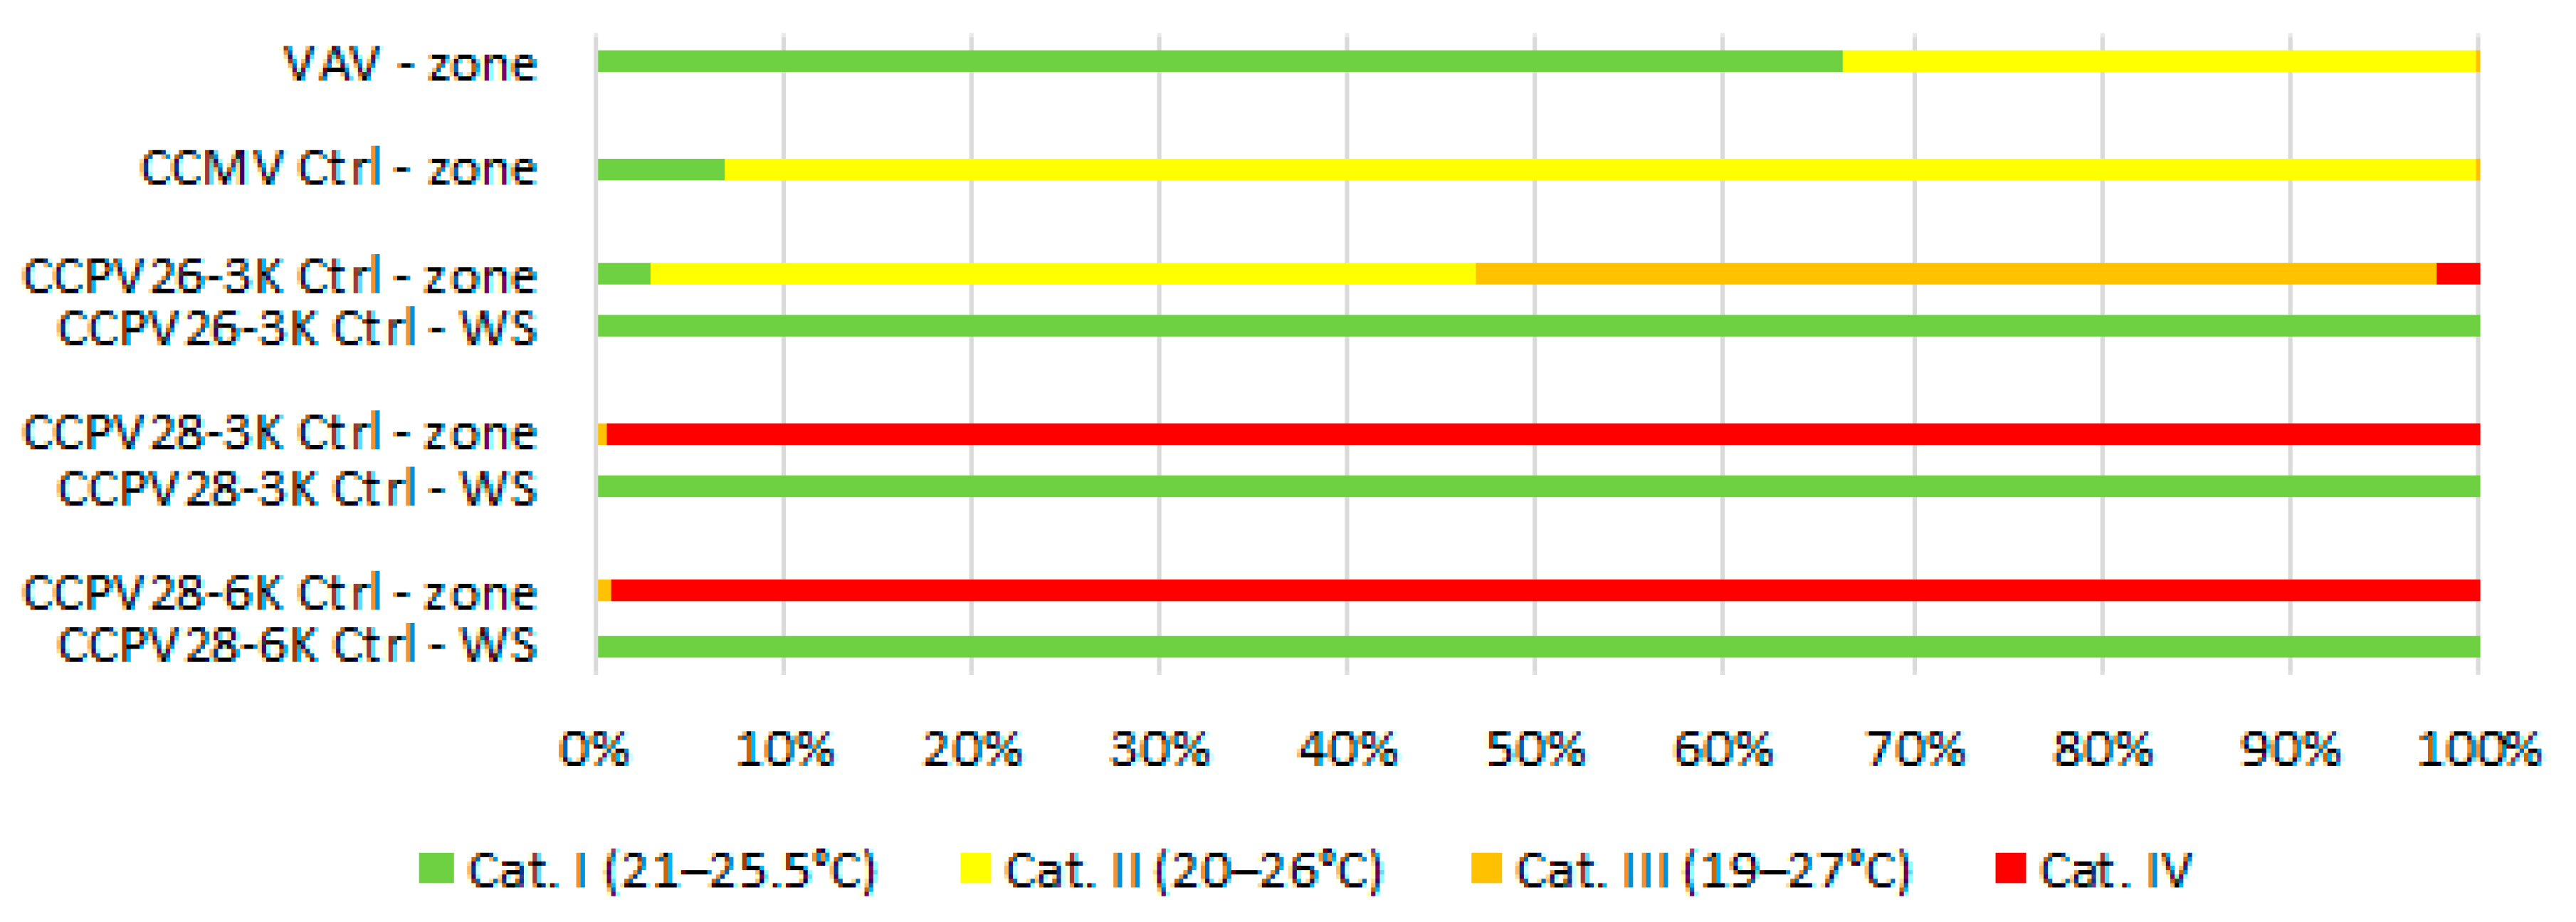
Results of simulations show that the conditions corresponding to the thermal environment category I were most often provided in the zone at 26 °C with the VAV system (Figure 14). Category II requirements were exceeded by the VAV system without shading (2% of the occupied time) and by CCPV26-3K (from 5 to 17% depending on the heat load). For 46 h, the CCPV26-3K could not meet the zone’s cooling needs (38 h with the control regarding operative temperature). This, in turn, resulted in a large overshoot above the 26 °C setpoint—the maximum air temperature was 28.6 °C and operative temperature 29.2 °C. At CCPV28-3K, the cooling requirements were not met for 26 h (with the control according to operative temperature for 19 h), which led to 2.2 K overshoot above the setpoint.
In all cases with the CCPV system, the temperature of the personalized air supplied at the workstation met the criteria for the category I nearly the entire time (99–100%).
The use of solar shading resulted in lower room air and operative temperatures for each system considered here. In addition, the use of operative temperature as a control parameter decreased both the air and operative temperature up to 0.3 K. The thermal environmental quality in the room improved as a result of these control strategies.
For nearly entire time, the relative humidity met the criteria for category II for the VAV and CCMV systems (Figure 15). With the CCPV, the maximum room relative humidity increased to 83.7%. The high values occurred most often for CCPV26-3K (14% of the occupied time with the relative humidity above 70%). For CCPV28-6K, the relative humidity did not exceed 73% and met the category II requirements 86% of the time.
The solar control strategy and the room temperature control using air/operative temperature had a negligible impact. The differences in the classification were within ±1% of the occupied time.
4. Discussion
In both hot climates, the systems we propose that combine chilled ceiling with personalized ventilation were found to be the most energy-efficient systems among HVAC solutions considered. In such climates, the energy consumption is due to cooling the supply air in the AHU. Using the chilled ceiling substantially decreased the energy use for air-cooling in the AHU, and, ultimately, reduced the total energy delivered to the building. Compared to VAV, the CCMV system required 18–26% less energy in Singapore and 18–30% less in Dubai. Replacing mixing ventilation with PV netted additional savings of 4–7%. These energy savings were the result of the control strategy—PV operated with airflow rates dependent on the occupancy, and increasing the supply air temperature setpoint. Warmer supply air led to greater demand for cooling by the CC, however, the energy savings for air-cooling in the AHU was larger than this increase.
The CCPV system provides different thermal conditions at the workstation compared to other regions in the occupied zone due to PV, which was shown in [1]. We used the supply air temperature from PV to evaluate the thermal environment quality at workstations for the CCPV system in energy simulations. In all cases, the thermal environment provided by PV at the workstation was in a higher category than in the remaining room space. Thus, the use of the localized convective cooling from PV directly at workstations is an efficient, energy-saving strategy that holds the elevated temperature in the room without negatively impacting the occupants. Increasing the setpoint from 26 °C at CCPV26-3K to 28 °C at CCPV28-3K decreased the delivered energy by 8% in Singapore and by 7% in Dubai.
The energy savings in both locations depended on the heat loads in the zone, which were influenced by the solar gains. The largest savings were 39–40% compared to VAV, and occurred when no solar shading devices were used with the CCPV28-3K. These results are consistent with the findings reported in previous studies which have also shown that of the energy savings of CC increase as the heat gains increase [12]. For all system configurations considered here, the CCPV28-3K consumed the least energy.
Simulation results showed that replacing mixing ventilation with PV strongly affected the room’s relative humidity in Singapore and Dubai. The maximum relative humidity with CCPV reached 84% and exceeded 70% for most of the occupied time in Singapore. High room temperature and humidity adversely affects occupants’ comfort, health, performance, and PAQ. However, all studies on PV, including previous sections of this project [1,7], showed that PV significantly improves occupants’ thermal comfort at the workstation. Moreover, previous studies on PV revealed that it significantly improves occupants’ wellbeing [6,7]. At the temperature of 28 °C and RH of 70%, the SBS symptoms intensity, performance, and PAQ were comparable to results obtained at 23 °C and 40% RH without PV. Based on these results, we conclude that an increase in relative humidity is not an issue regarding the occupants, especially in Dubai where high RH values occurred less often than in Singapore. The RH in Singapore exceeded 70% for more than 80% of the occupied time at CCPV26-3K, and 70% of the time at CCPV28-3K. If the humidity is held at these relatively high values for long periods of time, unwanted side effects like to microbial growth and degradation of the building construction can occur. Present studies do not include the dehumidification of supplied air; nonetheless, the CCPV28-6K protocol showed that centering the control strategy on the temperature of personalized air supply substantially decreased the room’s relative humidity. Changing the allowable maximum temperature difference between room and supply air from 3 K to 6 K resulted in 1350 less occupied hours (50% of the occupied time in the year) with RH above 70%. This improvement was achieved using only 5% more energy than CCPV28-3K, but the energy savings compared to the VAV system were still substantial (33–37% in energy demand, 31–40% in energy needs). Similar savings were reported by Skwarczyński [10], who studied the influence of the PV combined with mixing ventilation with and without dehumidification on energy consumption in Singapore. Energy consumption reduced as much as 38% when dehumidification was integrated with PV and mixing ventilation compared to mixing ventilation alone. It is the only energy simulation study on PV where the influence of the dehumidification process on energy use was included. Further studies on the CCPV system should include control of the room humidity in the climates via dehumidification in the AHU or by room portable dehumidifiers.
The CCPV system appears to be a very promising energy-saving solution for hot climates. However, further analyses in a hot and humid climate that include a dehumidification are needed. Previous studies [9,10] on energy consumption of PV combined with mixing ventilation in Singapore showed that the supply air temperature does not change the energy consumption. In present studies of PV combined with radiant cooling, changing the supply temperature control strategy from CCPV28-3K to CCPV28-6K increased energy consumption up to 7% and 3%, respectively. Moreover, the control strategy affected the room’s relative humidity, as the PV was the only ventilation system in the room. Decreasing the supply air temperature increased the energy needed for air-cooling, but it could be a sufficient strategy to reduce the room’s relative humidity. Moreover, lower supply air temperature would drop the secondary heating coil’s energy use during the dehumidification process when needed. Decreasing the supply air temperature would also be positive from the perspective of the life cycle assessment of the CC [20].
In the temperate climate of Katowice, the VAV system outperformed the CCPV system. When there was no solar shading, the most energy-efficient system was VAV, as cold outdoor air had a free-cooling effect. The performance of VAV and CCMV were nearly equivalent with external blinds, which reduced the zone cooling needs by almost 100%. Based on the investment costs and these results, the VAV system is preferable. For the CCPV system, the personalized air temperature control required supply air heating for most of the year, even with the recuperator. It generated additional energy needs compared to VAV and CCMV systems. These results are consistent with previous findings on PV systems operating in cold climates [11]. However, we observed the energy savings were possible with CCPV when combined with solar shading. The energy usage was 7% lower at a room temperature of 26 °C and 14% lower at 28 °C when compared to similar VAV cases. In both instances with CCPV at 28 °C, the zone cooling was substantially reduced when external blinds were used. Comparing CCPV28-3K and CCPV28-6K, it can be noted that changing the supply temperature control influences the energy needs for zone cooling. Lower supply temperatures at CCPV28-6K resulted in lower heating needs in the AHU and decreased the CC needs to 3.5 kWh/year. Such a low value indicates further PV analyses without conjunction with a separate cooling system in the temperate and cold climate. Schiavon and Melikov [11] suggest that the best control strategy for personalized air in a cold climate is to keep it constant at 20 °C. Implementing this control strategy in current studies would further decrease the zone cooling needs. Still, the combination of PV with a zone heating system may be necessary.
For the temperate climate, the energy consumption at VAV and CCPV28-6K was similar when external blinds were used. Yet the use of PV would give occupants the individual control over the thermal conditions at their workstations and improve their comfort, PAQ, and bring health benefits compared to VAV [35,36]. As previous research showed, differences in preferable sensation could be up to 1.4 points on the 7-point sensation scale [37,38]. Moreover, the PV system’s response time to achieve optimum room environment with varying occupant activity level (e.g., moving apart and coming back to the workstation) is much faster than total volume systems [7]. On the other hand, PV combined with a CC would increase the initial investment costs. It has been shown that the use of external blinds substantially decreases the zone cooling needs. When the proper solar control strategy is used, personalized ventilation could be proposed as a single ventilation and cooling system in the zone.
The operative temperature is recommended by standards [3,4] as a parameter to control the designed room temperature. However, in this study the air temperature was selected as a setpoint parameter for simplification in comparing analyzed systems (VAV systems was controlled according to air temperature) and due to difficulties in describing local conditions at workstations with PV. Results showed that when the operative temperature was used as a control parameter, the thermal environment quality improved. However, it slightly increased the energy use for zone cooling and, in a case of the supply air temperature control based on room temperature, for air-cooling in the AHU. The total delivered energy increased by 1–3% in all three climates when the room control was regarding the operative temperature.
5. Conclusions
The CCPV system is a promising solution for hot climates and substantially decreased the energy consumption compared to the VAV system and was also superior to the CCMV system. Increasing the maximum allowed room temperature further improved the energy efficiency of this strategy. In the temperate climate, the VAV system was preferable as it benefits from outdoor air free-cooling and has lower initial costs. The similar energy performance for the CCPV system was achieved at elevated room temperature of 28 °C when solar shading devices were used. It has been shown that in all three climates, the proper control of the supply temperature of personalized air is relevant. The CCPV system influences energy needs and consumption and affects the room’s relative humidity in the hot climate. In the temperate climate, however, only an impact on energy use was observed. The most efficient control strategy of the CCPV system was to increase the room temperature and keep the maximum permissible supply temperature difference of 6 K (CCPV28-6K), i.e., in the range of 20–22 °C. It allowed for lower energy consumption than with VAV and CCMV, and improved the relative humidity in the room located in the hot climate. In the temperate climate, it allowed for lower energy consumption compared to other control strategies. In addition to substantial energy savings, it improved the room’s relative humidity without extra dehumidification in a hot climate.
Author Contributions
Literature review, Methodology, investigation, formal analyses, Writing—Original draft, A.L.; Supervision, Writing—Review and editing, J.K. and A.M. All authors have read and agreed to the published version of the manuscript.
Funding
The work has been funded by: (1) Aleksandra Lipczynska’s scholarship under the “DoktoRIS-Scholarship programme for innovative Silesia” co-financed by the European Union under the European Social Fund covered by Human Capital Programme (POKL.08.02.02-24-001/13) and (2) Statutory Research Funding of Silesian University of Technology.
Data Availability Statement
Data is contained within the article.
Conflicts of Interest
The authors declare no conflict of interest.
Nomenclature
| Abbreviations | |
| AHU | air handling unit |
| CC | chilled ceiling |
| CAV | constant air volume |
| CTRL | control macro for cooling water temperature of CC |
| HVAC | heating, ventilation and air-conditioning |
| MV | mixing ventilation |
| OT | room temperature control based on operative temperature |
| PAQ | perceived air quality |
| PV | personalized ventilation |
| SBS | sick building syndrome |
| VAV | variable air volume |
| Symbols | |
| A | surface area, m2 |
| d | thickness of wall layer, m |
| g | solar heat gain coefficient (SHGC) |
| q | flow rate, L/s |
| RH | relative humidity, % |
| T | light transmittance |
| Tv | visible light transmittance (VLT) |
| ta | air temperature, °C |
| to | operative temperature, °C |
| tw | cooling water temperature, °C |
| U | heat transfer coefficient, W/(m2∙K) |
| λ | thermal conductivity, W/(m∙K) |
| Subscripts | |
| B | pollution source from the building |
| P | pollution source from people |
References
- Lipczynska, A.; Kaczmarczyk, J.; Melikov, A.K. Thermal Environment and Air Quality in Office with Personalized Ventilation Combined with Chilled Ceiling. Build. Environ. 2015, 92, 603–614. [Google Scholar] [CrossRef]
- American Society of Heating, Refrigerating and Air-Conditioning Engineers. ANSI/ASHRAE Standard 55 Thermal Environmental Conditions for Human Occupancy; American Society of Heating, Refrigerating and Air-Conditioning Engineers, Inc.: Atlanta, GA, USA, 2017. [Google Scholar]
- European Committee for Standardization. EN ISO 7730 Ergonomics of the Thermal Environment—Analytical Determination and Interpretation of Thermal Comfort Using Calculation of the PMV and PPD Indices and Local Thermal Comfort Criteria; European Committee for Standardization: Brussels, Belgium, 2005. [Google Scholar]
- European Committee for Standardization. EN 16798-1 Energy Performance of Buildings—Ventilation for Buildings—Part 1: Indoor Environmental Input Parameters for Design and Assessment of Energy Performance of Buildings Addressing Indoor Air Quality, Thermal Environment, Lighting and Acoustics—Module M1-6; European Committee for Standardization: Brussels, Belgium, 2019. [Google Scholar]
- Dalewski, M.; Melikov, A.K.; Vesely, M. Performance of Ductless Personalized Ventilation in Conjunction with Displacement Ventilation: Physical Environment and Human Response. Build. Environ. 2014, 81, 354–364. [Google Scholar] [CrossRef]
- Melikov, A.; Skwarczynski, M.; Kaczmarczyk, J.; Zabecky, J. Use of Personalized Ventilation for Improving Health, Comfort, and Performance at High Room Temperature and Humidity. Indoor Air 2013, 23, 250–263. [Google Scholar] [CrossRef] [PubMed]
- Lipczynska, A.; Kaczmarczyk, J.; Marcol, B.; Melikov, A.K.; Kierat, W. Human Response to Personalized Ventilation Combined with Chilled Ceiling. In Proceedings of the 13th SCANVAC International Conference on Air Distribution in Rooms, São Paulo, Brazil, 19–22 October 2014. [Google Scholar]
- Sekhar, S.; Gong, N.; Tham, K.; Cheong, K.; Melikov, A.; Wyon, D.; Fanger, P. Findings of Personalized Ventilation Studies in a Hot and Humid Climate. HVACR Res. 2005, 11, 603–620. [Google Scholar] [CrossRef]
- Schiavon, S.; Melikov, A.; Sekhar, C. Energy Analysis of the Personalized Ventilation System in Hot and Humid Climates. Energy Build. 2010, 42, 699–707. [Google Scholar] [CrossRef]
- Skwarczyński, M. Impact of Personalized Ventilation on Perceived Indoor Environmental Quality, Work Performance and Energy Consumption. Ph.D. Thesis, Lublin University of Technology, Lublin, Poland, 2012. [Google Scholar]
- Schiavon, S.; Melikov, A. Energy-Saving Strategies with Personalized Ventilation in Cold Climates. Energy Build. 2009, 41, 543–550. [Google Scholar] [CrossRef] [Green Version]
- Novoselac, A.; Srebric, J. A Critical Review on the Performance and Design of Combined Cooled Ceiling and Displacement Ventilation Systems. Energy Build. 2002, 34, 497–509. [Google Scholar] [CrossRef]
- Bahman, A.; Saade, R.; Chakroun, W.; Ghali, K.; Ghaddar, N. Performance Comparison of Conventional and Chilled Ceiling/Displacement Ventilation Systems in Kuwait. Ashrae Trans. 2009, 115 Pt 1, 587–594. [Google Scholar]
- Chakroun, W.; Ghali, K.; Ghaddar, N. Energy Saving Using Mixed Air in Rooms Conditioned by Chilled Ceiling Displacement Ventilation System. Ashrae Trans. 2011, 117 Pt 2, 67–75. [Google Scholar]
- Chakroun, W.; Ghali, K.; Ghaddar, N. Air Quality in Rooms Conditioned by Chilled Ceiling and Mixed Displacement Ventilation for Energy Saving. Energy Build. 2011, 43, 2684–2695. [Google Scholar] [CrossRef]
- Chakroun, W.; Ghaddar, N.; Ghali, K. Chilled Ceiling and Displacement Ventilation Aided with Personalized Evaporative Cooler. Energy Build. 2011, 43, 3250–3257. [Google Scholar] [CrossRef]
- Niu, J.; Zhang, L.; Zuo, H. Energy Savings Potential of Chilled-Ceiling Combined with Desiccant Cooling in Hot and Humid Climates. Energy Build. 2002, 34, 487–495. [Google Scholar] [CrossRef]
- Niu, J.; Kooki, J.; Ree, H. Energy Savings Possibilities with Cooled-Ceiling Systems. Energy Build. 1995, 23, 147–158. [Google Scholar] [CrossRef]
- Sodec, F. Economic Viability of Cooling Ceiling Systems. Energy Build. 1999, 30, 195–201. [Google Scholar] [CrossRef]
- Liu, S.; Schulz, U.W.; Sapar, M.H.; Qian, S. Evaluation of the Environmental Performance of the Chilled Ceiling System Using Life Cycle Assessment (LCA): A Case Study in Singapore. Build. Environ. 2016, 102, 207–216. [Google Scholar] [CrossRef]
- Tian, Z.; Love, J. Energy Performance Optimization of Radiant Slab Cooling Using Building Simulation and Field Measurements. Energy Build. 2009, 41, 320–330. [Google Scholar] [CrossRef]
- Talami, R.; Jakubiec, J.A. Early-Design Sensitivity of Radiant Cooled Office Buildings in the Tropics for Building Performance. Energy Build. 2020, 223, 110177. [Google Scholar] [CrossRef]
- Bauman, F.; Feng, J.; Schiavon, S. Cooling Load Calculations for Radiant Systems Are They the Same as Traditional Methods? ASHRAE J. 2013, 55, 20–27. [Google Scholar]
- Feng, J.; Bauman, F.; Schiavon, S. Experimental Comparison of Zone Cooling Load between Radiant and Air Systems. Energy Build. 2014, 84, 152–159. [Google Scholar] [CrossRef] [Green Version]
- Ghaddar, N.; Ghali, K.; Saadeh, R.; Keblawi, A. Ashrae Design Charts for Combined Chilled Ceiling Displacement Ventilation System. ASHRAE Trans. 2008, 114, 574–587. [Google Scholar]
- Kropf, S.; Zweifel, G. Validation of the Building Simulation Program IDA-ICE According to CEN 13791 “Thermal Performance of Buildings–Calculation of Internal Temperatures of a Room in Summer Without Mechanical Cooling–General Criteria and Validation Procedures”; Hochschule Technik + Architektur Luzern, HLK Engineering: Horw, Switzerland, 2001. [Google Scholar]
- EQUA. Validation of IDA Indoor Climate and Energy 4.0 with Respect to CEN Standards EN 15255-2007 and EN 15265-2007; EQUA: Solna, Sweden, 2010. [Google Scholar]
- EQUA. Validation of IDA Indoor Climate and Energy 4.0 Build 4 with Respect to ANSI/ASHRAE Standard 140-2004; EQUA: Solna, Sweden, 2010. [Google Scholar]
- Achermann, M.; Zweifel, G. RADTEST—Radiant Heating and Cooling Test Cases. A Report of Task 22, Subtask C, Building Energy Analysis Tools Comparative Evaluation Tests; International Energy Agency: Paris, France, 2003. [Google Scholar]
- International Energy Agency. Empirical Validation of EDF ETNA and GENEC Test-Cell Models. A Report of Task 22 Building Energy Analysis Tools; International Energy Agency: Paris, France, 1999. [Google Scholar]
- Bring, A.; Sahlin, P.; Vuolle, M. Models for Building Indoor Climate and Energy Simulation. A Report of Task 22 Building Energy Analysis Tools; International Energy Agency: Paris, France, 1999. [Google Scholar]
- Cornaro, C.; Pierro, M.; Roncarati, D.; Puggioni, V. Validation of a PCM Simulation Tool in IDA ICE Dynamic Building Simulation Software Using Experimental Data from Solar Test Boxes. In Proceedings of the Building Simulation Applications BSA 2017, Bolzano, Italy, 8–10 February 2017. [Google Scholar]
- Salvalai, G. Implementation and Validation of Simplified Heat Pump Model in IDA-ICE Energy Simulation Environment. Energy Build. 2012, 49, 132–141. [Google Scholar] [CrossRef]
- Hilliaho, K.; Lahdensivu, J.; Vinha, J. Glazed Space Thermal Simulation with IDA-ICE 4.61 Software—Suitability Analysis with Case Study. Energy Build. 2015, 89, 132–141. [Google Scholar] [CrossRef]
- Kaczmarczyk, J.; Melikov, A.; Fanger, P. Human Response to Personalized Ventilation and Mixing Ventilation. Indoor Air 2004, 14, 17–29. [Google Scholar] [CrossRef]
- Melikov, A.; Knudsen, G. Human Response to an Individually Controlled Microenvironment. HVACR Res. 2007, 13, 645–660. [Google Scholar] [CrossRef]
- Humphreys, M.A.; Nicol, J.F. The Validity of ISO-PMV for Predicting Comfort Votes in Every-Day Thermal Environments. Energy Build. 2002, 34, 667–684. [Google Scholar] [CrossRef]
- Humphreys, M.A.; Hancock, M. Do People like to Feel ‘Neutral’?: Exploring the Variation of the Desired Thermal Sensation on the ASHRAE Scale. Energy Build. 2007, 39, 867–874. [Google Scholar] [CrossRef]
Figure 1.
Occupancy profile.

Figure 2.
Supply air setpoint control during the working day.

Figure 3.
Schematic model of the personalized ventilation air-handling unit.

Figure 4.
Energy use for Katowice.

Figure 5.
Delivered energy for Katowice.

Figure 6.
Quality of room thermal indoor environment in % of the occupied time in four categories in Katowice based on air temperature (room—mean zone air temperature, WS—supply air temperature of personalized air).
Figure 6.
Quality of room thermal indoor environment in % of the occupied time in four categories in Katowice based on air temperature (room—mean zone air temperature, WS—supply air temperature of personalized air).

Figure 7.
Relative Humidity in % of the Occupied Time in Katowice

Figure 8.
Energy use for Singapore.

Figure 9.
Delivered energy for Singapore.

Figure 10.
Quality of thermal indoor environment in % of the occupied time in four categories in Singapore based on air temperature (room—mean zone air temperature, WS—supply air temperature of personalized air).
Figure 10.
Quality of thermal indoor environment in % of the occupied time in four categories in Singapore based on air temperature (room—mean zone air temperature, WS—supply air temperature of personalized air).

Figure 11.
Relative humidity in % of the occupied time in Singapore.

Figure 12.
Energy use for Dubai.

Figure 13.
Delivered energy for Dubai.

Figure 14.
Quality of thermal indoor environment in % of the occupied time in four categories in Dubai based on air temperature (room—mean zone air temperature, WS—supply air temperature of personalized air).
Figure 14.
Quality of thermal indoor environment in % of the occupied time in four categories in Dubai based on air temperature (room—mean zone air temperature, WS—supply air temperature of personalized air).

Figure 15.
Relative humidity in % of the occupied time in Dubai.


Table 1.
Characteristic of building envelope construction.
| Building Envelope | Area (m2) | U (W/(m2∙K)) | U∙A (W/K) | % of Total |
|---|---|---|---|---|
| Wall: gypsum d = 0.026 m; λ = 0.220 W/(m∙K) concrete d = 0.150 m; λ = 1.700 W/(m∙K) light insulation d = 0.180 m; λ = 0.036 W/(m∙K) concrete d = 0.080 m; λ = 1.700 W/(m∙K) gypsum d = 0.026 m; λ = 0.220 W/(m∙K) | 5.82 | 0.18 | 1.05 | 11.36 |
| Windows: glazing: Pilkington Insulight 6-15Ar-S(3)4 (2-glass) with outer glass Optifloat Clear, cavity width 15 mm argon, inner glass Pilkington Optitherm S3. g = 0.59, T = 0.52, Tv = 0.79, U = 1.1 W/(m2∙K) frame: U = 2.0 W/(m2∙K) | 6.36 | 1.19 | 7.57 | 81.85 |
| Thermal bridges | 0.63 | 6.79 | ||
| Total | 12.18 | 0.76 | 9.25 | 100.00 |
Table 2.
Details on the simulation cases (MV—mixing ventilation, PV—personalized ventilation, CC—chilled ceiling, CAV—constant air volume, VAV—variable air volume, Ctrl—cases using supervisory control macro, OT—cases using operative temperature as room temperature control).
Table 2.
Details on the simulation cases (MV—mixing ventilation, PV—personalized ventilation, CC—chilled ceiling, CAV—constant air volume, VAV—variable air volume, Ctrl—cases using supervisory control macro, OT—cases using operative temperature as room temperature control).
| Case | Room Temperature | Ventilation System | Room Cooling Units | Window Shading Blinds | |||
|---|---|---|---|---|---|---|---|
| Setpoints | Control Sensor | Type | Supply Airflows | Type | Supervisory Control | ||
| VAV | Min.: 20 °C Max.: 26 °C | ta | VAV MV const. 16°C | Minimum: qB = 12 L/s or qB + 2∙qP = 26 L/s (during occupancy) Maximum: depending on the cooling demand | - | - | None |
| VAV (ext blind) | External horizontal | ||||||
| VAV (int blind) | Internal vertical | ||||||
| CCMV | Min.: 20 °C Max.: 26 °C | ta | CAV MV const. 16 °C | Constant: qB = 12 L/s At occupied hours: qB + 2∙qP = 26 L/s | CC 1700 W | None | None |
| CCMV Ctrl | ta | Dew-point | None | ||||
| CCMV Ctrl OT | to | Dew-point | None | ||||
| CCMV Ctrl (ext blind) | ta | Dew-point | External horizontal | ||||
| CCMV Ctrl (int blind) | ta | Dew-point | Internal vertical | ||||
| CCPV26-3K | Min.: 20 °C Max.: 26 °C | ta | PV Δt = 3 K | Constant: qB = 12 L/s Additional due to occupancy: qP = 7 L/s per person when present | CC 1700 W | None | None |
| CCPV26-3K Ctrl | ta | Dew-point | None | ||||
| CCPV26-3K Ctrl OT | to | Dew-point | None | ||||
| CCPV26-3K Ctrl (ext blind) | ta | Dew-point | External horizontal | ||||
| CCPV26-3K Ctrl (int blind) | ta | Dew-point | Internal vertical | ||||
| CCPV28-3K | Min.: 20 °C Max.: 28 °C | ta | PV Δt = 3 K | Constant: qB = 12 L/s Additional due to occupancy: qP = 7 L/s per person when present | CC 1700 W | None | None |
| CCPV28-3K Ctrl | ta | Dew-point | None | ||||
| CCPV28-3K Ctrl OT | to | Dew-point | None | ||||
| CCPV28-3K Ctrl (ext blind) | ta | Dew-point | External horizontal | ||||
| CCPV28-3K Ctrl (int blind) | ta | Dew-point | Internal vertical | ||||
| CCPV28-6K | Min.: 20 °C Max.: 28 °C | ta | PV Δt = 6 K | Constant: qB = 12 L/s Additional due to occupancy: qP = 7 L/s per person when present | CC 1700 W | None | None |
| CCPV28-6K Ctrl | ta | Dew-point | None | ||||
| CCPV28-6K Ctrl OT | to | Dew-point | None | ||||
| CCPV28-6K Ctrl (ext blind) | ta | Dew-point | External horizontal | ||||
| CCPV28-6K Ctrl (int blind) | ta | Dew-point | Internal vertical | ||||
Publisher’s Note: MDPI stays neutral with regard to jurisdictional claims in published maps and institutional affiliations. |
© 2021 by the authors. Licensee MDPI, Basel, Switzerland. This article is an open access article distributed under the terms and conditions of the Creative Commons Attribution (CC BY) license (http://creativecommons.org/licenses/by/4.0/).
Share and Cite
MDPI and ACS Style
Lipczynska, A.; Kaczmarczyk, J.; Melikov, A. The Energy-Saving Potential of Chilled Ceilings Combined with Personalized Ventilation. Energies 2021, 14, 1133. https://doi.org/10.3390/en14041133
AMA Style
Lipczynska A, Kaczmarczyk J, Melikov A. The Energy-Saving Potential of Chilled Ceilings Combined with Personalized Ventilation. Energies. 2021; 14(4):1133. https://doi.org/10.3390/en14041133
Chicago/Turabian StyleLipczynska, Aleksandra, Jan Kaczmarczyk, and Arsen Melikov. 2021. "The Energy-Saving Potential of Chilled Ceilings Combined with Personalized Ventilation" Energies 14, no. 4: 1133. https://doi.org/10.3390/en14041133
Note that from the first issue of 2016, this journal uses article numbers instead of page numbers. See further details here.