
Validation and Performance of Satellite Meteorological Dataset MERRA-2 for Solar and Wind Applications


Faculty of Computer Science, Electrical Engineering and Mathematics, Electrical Energy Technology-Sustainable Energy Concepts (EET-NEK), Paderborn University, Warburger Str. 100, 33098 Paderborn, Germany
*
Author to whom correspondence should be addressed.
Energies 2021, 14(4), 882; https://doi.org/10.3390/en14040882
Submission received: 10 January 2021
/
Revised: 27 January 2021
/
Accepted: 1 February 2021
/
Published: 8 February 2021
(This article belongs to the Special Issue Sustainable Energy Concepts for Energy Transition)
Abstract
:Fast-growing energy demand of the world makes the researchers focus on finding new energy sources or optimizing already-developed approaches. For an efficient use of solar and wind energy in an energy system, correct design and sizing of a power system is of high importance and improving or optimizing the process of data obtaining for this purpose leads to higher performance and lower cost per unit of energy. It is essential to have the most precise possible estimation of solar and wind energy potential and other local weather parameters in order to fully feed the demand and avoid extra costs. There are various methods for obtaining local data, such as local measurements, official organizational data, satellite obtained, and reanalysis data. In this paper, the Modern-Era Retrospective analysis for Research and Applications dataset version 2 (MERRA-2) dataset provided by NASA is introduced and its performance is evaluated by comparison to various locally measured datasets offered by meteorological institutions such as Meteonorm and Deutscher Wetterdienst (DWD, or Germany’s National Meteorological Service) around the world. After comparison, correlation coefficients from 0.95 to 0.99 are observed for monthly global horizontal irradiance values. In the case of air temperature, correlation coefficients of 0.99 and for wind speed from 0.81 to 0.99 are observed. High correlation with ground measurements and relatively low errors are confirmed, especially for irradiance and temperature values, that makes MERRA-2 a valuable dataset, considering its world coverage and availability.
1. Introduction
It is impossible to correctly size a renewable energy supply system with poor basic data. These data include load demands, financial resources, and regional regulations, but most importantly, local power potential data. When designing a photovoltaic (PV) or wind power system, it is essential to choose system components in a way to be able to fulfill the demand at all times with minimum over- or underestimation and maximum capacity factor. Not meeting these conditions leads to electricity shortage, curtailment, possibly a grid outage, and higher costs. For the correct sizing of the system, long-time historical local meteorological data is required.
There are various methods for obtaining this data; however, availability and precision of potential data are two important factors to consider. It is not always logical to measure this data by installing measurement devices at the desired location, since they need to be installed and supervised for a long time to be considered as reliable. Forecasting of the meteorological conditions is another method of obtaining potential data. For instance, in [1], photovoltaic yield prediction using an irradiance forecast model based on multiple neural networks is presented and analyzed. Multiple feed-forward models proposed in [1] predicted the global horizontal irradiance with a mean absolute error of 3% and 23% on a sunny day and a cloudy day in Stuttgart (Germany), respectively. In the present study, the focus is not on forecasting the data but on verification and comparison of historical data.
In [2], a validation of hourly global horizontal irradiance derived from satellite imagery and reanalysis is studied. The authors verified the accuracy of the global reanalysis irradiance product (Modern-Era Retrospective analysis for Research and Applications dataset version 2 (MERRA-2)) against the records from Baseline Solar Radiation Network (BSRN) stations. “BSRN is the largest research-grade solar radiation monitoring network that provides freely available data for locations worldwide” [2] and, as of early 2019, contains 76 stations within the world [2]. BSRN irradiance data with 1-min resolution is checked for quality and then are aggregated to hourly records [2] to be able to be compared to MERRA-2. However, there are some drawbacks observed in BSRN data, such as missing timestamps and probable missing, and wrong, measurements. The authors in [2] filtered the wrong records before the comparison, but in some stations there were no data points left, leading to fewer numbers of stations available for the comparison. In that study, normalized mean bias error (NMBE) and normalized root mean square error (NRMSE) of MERRA-2 were calculated for 57 stations for global horizontal irradiance. Since the stations were chosen only from available stations in BSRN, they may not be necessarily close to the corresponding MERRA-2 locations. In the present paper, MERRA-2 monthly averaged measurements are validated (in contrast to [2]), since they correspond to the targeted applications of this study.
In [3], the authors discussed how MERRA and MERRA-2 reanalysis and a satellite dataset can be used to produce hourly PV simulations across Europe in order to prove “the suitability of reanalysis data to simulate PV output for Europe-wide studies” [3]. Authors simulated a PV power plant in each MERRA grid cell in Germany, UK, and Italy and found that MERRA and MERRA-2 generally overestimate the sites’ output [3]. They also compared hourly PV power production (and not irradiance measurements) of reanalysis datasets to the measured data of a single site in Czech Republic. They found “slightly better accuracy from satellite data, but greater stability from reanalysis data” [3].
Measurement of global horizontal irradiance of MERRA (and not MERRA-2) is validated for some stations in Czech Republic in [4]. MERRA was compared to in-situ measurements and two solar radiation satellite-derived databases, HelioClim-1 and HelioClim-3 [4]. They showed that for global horizontal irradiance, MERRA shows a good agreement with the in-situ measurements and HelioClim-3 database [4]. Since production of MERRA was completed in 2016 and a second version of MERRA is available since then, the focus of the present paper is on the updated version.
A comparison on long-term wind speed data at a wind farm located in the northeast of Brazil is studied in [5] between meteorological mast observations (at 78 m height) and MERRA-2 from 2009 to 2018. MERRA-2 showed satisfactory correlations with the mast data for monthly means; however, the wind speed observations were systematically underestimated and unable to capture extreme winds [5]. Correlation coefficients of 0.91 for monthly mean and 0.59 for hourly mean values were observed for that specific location [5].
Another study in this area [6] evaluated MERRA-2 to estimate solar irradiance over the Indonesia region using ground observations. The authors evaluated MERRA-2 for a period of one year (2018) on an hourly and monthly basis for six sites in Indonesia [6]. In clear sky conditions, MERRA-2 seemed to underestimate the ground values, whilst on cloudy days it overestimated the observed values [6]. It must be mentioned that the parameter considered in MERRA-2 (SWGNT) in [6] is not global irradiance, but the sum of direct and diffuse irradiance [7]. Correlation coefficients of MERRA-2 irradiance values with six ground locations in Indonesia varied from 0.86 to 0.9 [6].
Abovementioned studies and a few more pieces of literature in this area [8,9,10,11] evaluated reanalysis datasets, including MERRA, for a specific location, duration, parameter, or region; however, none of them propose a general method and comparison for evaluation of MERRA-2. In the present study, any location could be freely chosen in the datasets to be compared. The selected stations in this paper are chosen because they fulfill two main conditions: first, they have 100% locally measured data for all the considered parameters, and secondly, they are chosen in a way to have a MERRA-2 datapoint as nearby as possible. Additionally, this paper goes beyond single parameter comparison for a specific location and application and considers irradiance, air temperature, surface temperature, and wind speed measurements for various locations around the world. Moreover, the measurements are compared directly within the datasets, which prevents influence of other factors that might affect the evaluation.
In the following section, the Modern-Era Retrospective analysis for Research and Applications dataset version 2 (MERRA-2) [7] is introduced. Later datasets for solar and wind applications offered by Meteonorm [12], which is widely used by planners and investors in energy projects, and datasets offered by Deutsche Wetterdienst (DWD) [13] are discussed. In the next part, these datasets are obtained for various locations. Meteonorm and DWD are considered as the reference datasets, and MERRA-2 dataset validity is verified in comparison to them. If MERRA-2 offers acceptably precise data, it could be a very useful source for solar and wind applications, considering its advantages, such as availability for the whole world and long-time measurements.
2. Power Potential Estimation
A precise estimation of local power potential in order to correctly design and size a renewable energy system is inevitable. In other words, dimensions of a system can be correctly planned if, and only if, the designer has the precise data needed for estimation of the potential of the installation site. There are various options for obtaining this data, such as local measurements, official organizational measured data, satellite data, etc. In this part, these methods are discussed in more detail.
2.1. Local Data Measurements
Measuring all the required parameters in the exact location of the installation site seems to be the best option. On one hand, the most precise meteorological data and behavior for the exact installation site is taken into account by installing multiple measuring devices, such as Pyranometers, for solar irradiance measurements, thermometers for temperature measurements, anemometers and wind vanes in different heights for wind speed and its direction measurements, pressure sensors, etc. On the other hand, the problem of this method is that stable measurements and data distribution, which are countable, need to be carried out for a very long time and often multiple years. This is not possible for most cases, because waiting for some years just to decide if it is a good place for the system is often not an option. Additionally, maintenance and calibration of measurement devices during the measuring period in order to achieve good data quality are a huge amount of the workload, but very critical.
2.2. Official Meteorological Data
Another solution is to use data already measured by forecasting or research organizations. There are various organizations, universities, or airports that are observing meteorological parameters for various purposes, such as aviation and weather forecast. The problem of this type of data is that it is not available for all locations. It means for using them, one needs to consider the closest measurement sites to the installation site, which could be far away and obviously with different climatic conditions, and calculate an estimation based on their proximity. However, this is often not countable enough.
2.3. Satellite Obtained and Reanalysis Data
The need for availability of precise data for a long period and for all desired locations leads to the meteorological parameters to be measured by weather satellites. There are a few datasets available for the entire world provided by different organizations. The European Centre for Medium-Range Weather Forecasts (ECMWF) and the National Aeronautics and Space Administration (NASA) are two of the organizations providing various climatic data. ERA5 [14] is an example of a reanalysis dataset offered by ECMWF, and NASA offers a multidecadal reanalysis dataset called MERRA-2 [7] jointly from aerosol and meteorological observations [15] for the time since 1980.
3. MERRA–2
MERRA-2 offers a variety of parameters for each measurement point for over almost the past 40 years. MERRA-2 arranges the Earth in latitudinal direction with a resolution of 0.5 degrees and in longitudinal direction with the resolution of 0.625 degrees [7]. This leads to a matrix of 576 rows of different latitudes and 361 columns of different longitudes, which means 207,936 geographical measurement points overall. This implies that MERRA-2 offers the data with a geographical resolution of about 50 km in the latitudinal direction [7].
Looking for solar energy parameters in MERRA-2, the radiation diagnostics (RAD) dataset is the data related to radiation diagnostics. It has been available since 1 January 1980 for the whole globe and contains parameters such as surface albedo for various wavelengths, cloud fraction, surface incoming shortwave flux (global irradiance), surface skin temperature, etc. (Table 1). The full list of parameters of MERRA-2 is available in [7].
The MERRA-2 single-level diagnostics (SLV) dataset offers single-level diagnostics parameters, such as specific humidity, surface pressure, 2-, 10- and 50-m temperature, and eastward/northward wind velocity since 1980.
In this study, MERRA-2 data for global irradiance, air temperature, surface temperature, and wind speed is studied and verified for various locations to see whether it is a suitable option for obtaining a site’s solar and wind energy potential. This is done by comparing MERRA-2 with datasets provided by Meteonorm and Germany’s National Meteorological Service, the Deutscher Wetterdienst (DWD).
4. Meteonorm
Meteonorm contains worldwide weather data gathered from 8325 weather stations and five geostationary satellites [16]. “Meteonorm generates accurate and representative typical years for any place on Earth. The user can choose from more than 30 different weather parameters. Today Meteonorm has more than 2000 active users and is included in almost every PV, solar thermal or building simulation software on the market. All this makes Meteonorm a global standard and a powerful tool for solar energy applications, building design, heating and cooling systems, education, agriculture, forestry and many more” [12].
For this study, Meteonorm software version 7.3.4 (which is a product of Meteotest AG, Bern, Switzerland) is used to obtain and extract the desired data. Any location in the world can be chosen in the software; however, not all of them have local measurement data. For this comparison, only the stations are selected that have 100% share of local measurements and 0% share of satellite or interpolated data.
The data can be extracted for hourly, daily, monthly, and yearly distributions. Hourly datasets are in local time and may need to be shifted to compare with other datasets. As another point, Meteonorm offers measurement values for a single typical year. This typical year is calculated mathematically based on the historical measurements of a location; however, it is different from an average year, as Meteonorm claims. In an average year and for a northern hemisphere station, a summer day always shows high values of irradiance since it is the average of that day through many years. However, for a typical year distribution, a summer day can have very low irradiance levels as well, since this is possible in real life in any year. This is why comparison between hourly values of Meteonorm and MERRA-2 is not possible. A typical year yet corresponds to the long-term mean when averaged. Since Meteonorm offers hourly data for a single typical year for a station, averaging through months and year must be done first to be able to compare with MERRA-2 monthly values. This can be done through the software itself by exporting the data in a custom monthly format.
5. DWD
“The Deutscher Wetterdienst is a public institution with partial legal capacity under the Federal Ministry of Transport and Digital Infrastructure. Germany’s National Meteorological Service, the Deutscher Wetterdienst (DWD), is responsible for meeting meteorological requirements arising from all areas of economy and society in Germany” [13].
DWD offers various meteorological services, such as short- and long-term recording, monitoring, and evaluation of meteorological processes in the atmosphere, its structure, and composition [17]. The forecasting of meteorological processes, the operation of the necessary measuring and observation systems, and also the provision, storage, and documentation of meteorological data and products are other tasks of this organization [17].
DWD offers various datasets, such as air temperature, pressure, cloud type, cloudiness, precipitation, pressure, soil temperature, solar irradiance and duration, visibility, wind speed, wind direction, etc. for 1 min, 10 min, daily, hourly, monthly, and multi-annual intervals. Since these data are measured locally and by installation of various measuring devices, they offer a high precision. DWD has about 56 stations/locations for solar energy data and 606 stations/locations for temperature and humidity around Germany [18,19].
6. Methodology
In the first part of this study, the Meteonorm dataset is used as reference to verify and validate MERRA-2 data. For this, mutual locations must be found and considered in both datasets. Geographical coordinates of measurement locations are provided in MERRA-2 and Meteonorm data.
In order to achieve the highest possible precision in the comparison, it is logical to find the closest two locations in both datasets. In this paper, those locations have been selected that are available in both datasets and have the least distances apart as well. Altitude difference is another point to consider for datapoint selection.
All selected stations were chosen to have only locally measured values in Meteonorm, and no share of interpolated or satellite data–in order to achieve highly accurate data as a reference. Then those datapoints in MERRA-2 have been chosen that have the least distance from the Meteonorm stations. Table 2 contains the meteorological sites considered in Meteonorm, their corresponding datapoints in MERRA-2, and their corresponding distance and altitude difference.
Table 3 is the list of mutual parameters and their corresponding names in Meteonorm and MERRA-2 datasets to be compared in this study.
Parameters in Meteonorm can be extracted in a prepared manner–just ready for comparison. In Meteonorm, G_Gh is the mean of daily global irradiation in Wh/m2 d for each month of the year. However, for MERRA-2, the global irradiance values are a continuous sequence of irradiance data averaged over an hour in W/m2 [7]. To be able to compare these values, first, the sum of MERRA-2 hourly values has been calculated for every day (in Wh/m2 d). Then, the values of daily irradiated energy have been averaged for each month of the year.
Since the time period covered by Meteonorm values and parameters could be different for each station, MERRA-2 data for each location must get extracted for different periods equal to Meteonorm periods. Table 4 contains each station’s uncertainty of yearly values of global horizontal radiation and air temperature values, and also the time periods available in Meteonorm which are considered for MERRA-2 data extraction. Uncertainty of wind speed values (FF) is not available in the Meteonorm software.
After extracting the Meteonorm data for all locations, a program in Python was developed to download the MERRA-2 data for a desired time frame, extract wanted hourly measured parameters, and modify the data to achieve the corresponding data in Meteonorm.
Correlation coefficient (R) is a factor with a value between −1 and 1, and is calculated by Equation (1) [1]. If the correlation coefficient between two datasets is −1, it indicates that they are entirely anti-correlated and if it is +1, it means that the datasets are fully correlated.
If irradiance, temperature, and wind values in Meteonorm are considered as the reference data because of their precision since they are recorded as local ground measurements, is each Meteonorm measurement and is the mean of Meteonorm measurements. Similarly, is each MERRA-2 measurement and is the mean of MERRA-2 values. N is the number of measurements in datasets.
Still considering Meteonorm as the reference data, statistical error formulas can be implemented as well to obtain errors of the MERRA-2 datasets. Mean absolute error (MAE) and root mean square error (RMSE) formulas are used as Equations (2) and (3) [1].
When calculating root mean square error, extreme differences in values have higher impact on the result and that is why RMSE for irradiance is higher than its corresponding MAE. Therefore, normalized root mean square error (NRMSE) (Equation (4)) could possibly give a better understanding of accuracy of MERRA-2 since RMSE will be normalized by the full range of values (irradiance or temperature), or in better words, maximum measurement minus minimum measurement.
In the following section, the results of the study are discussed in diagrams and tables for all sites. Additionally, time series comparison between MERRA-2 and DWD for Bremen in Germany is analyzed.
7. Results and Discussion
7.1. MERRA-2 vs. Meteonorm
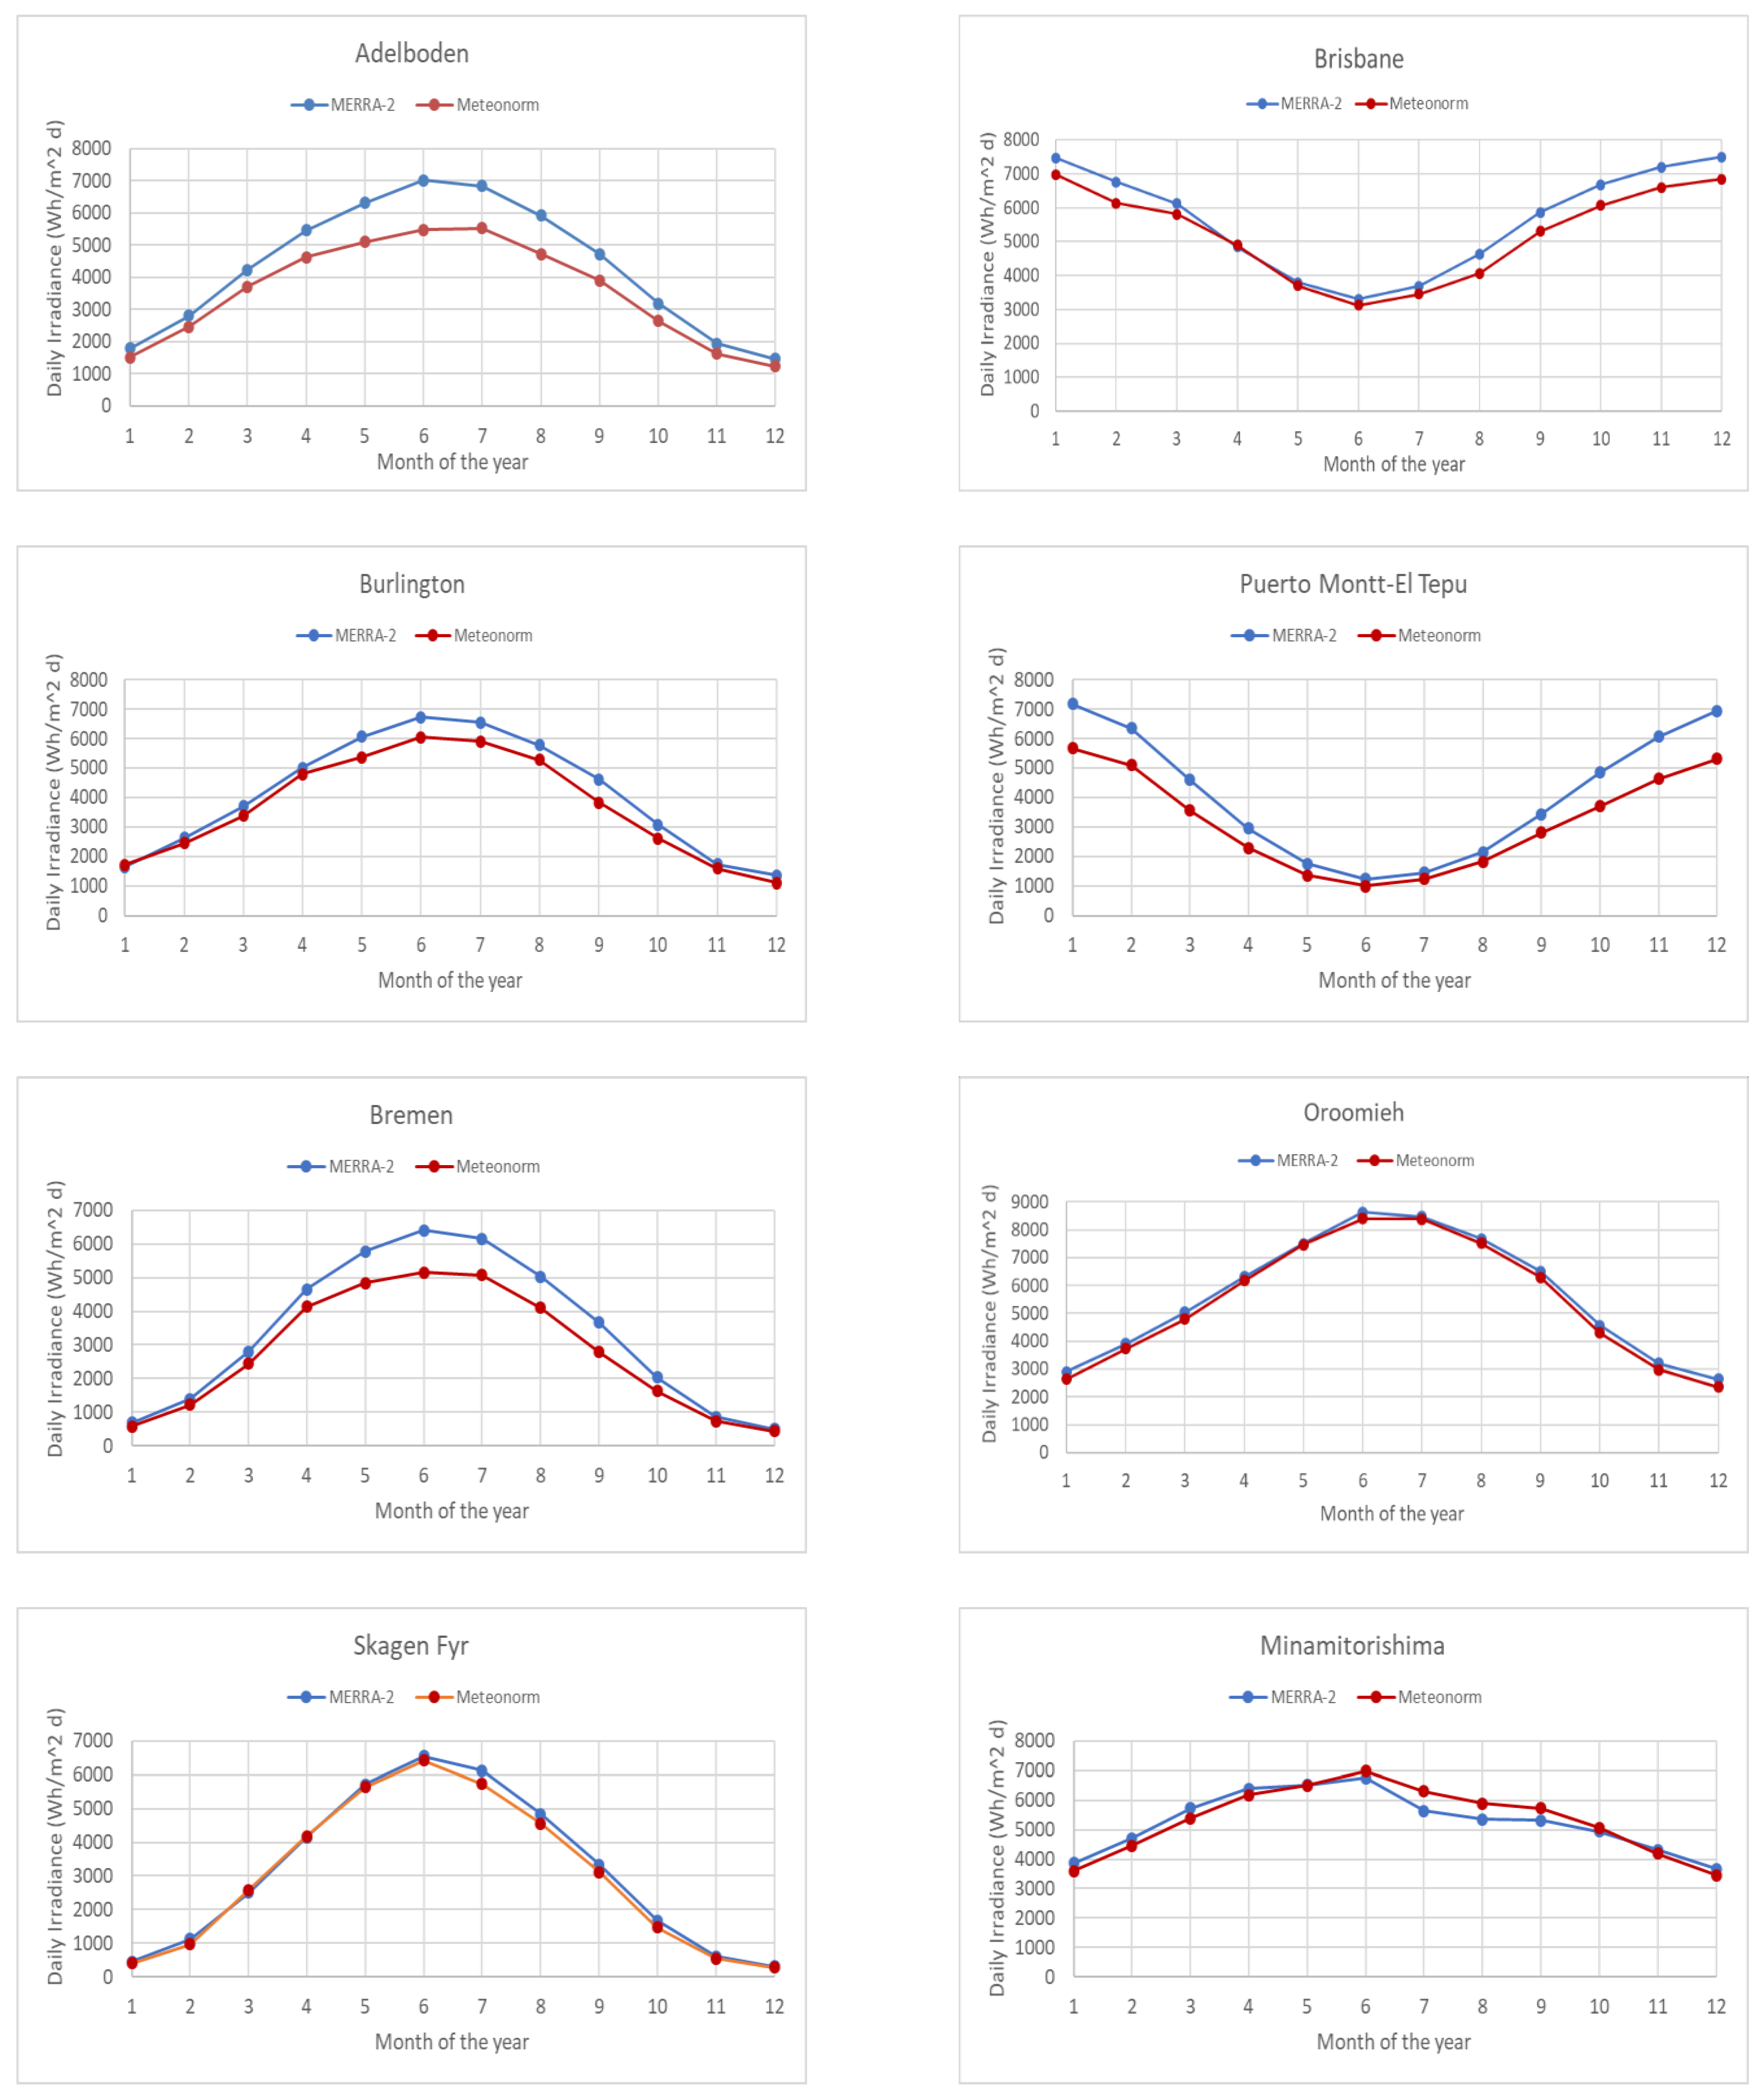
Figure 1 shows diagrams of average daily irradiance values in MERRA-2 and Meteonorm for all the stations for every months of the year. As it can be seen, the highest differences happen during the summer months of the year that have the highest irradiance levels in the year.
For Brisbane, Oroomieh, Skagen Fyr, and Minamitorishima, the differences are minimal, and MERRA-2 has an almost perfect accuracy when considering Meteonorm typical year data as reference. For Adelboden, Burlington, Puerto Montt, and Bremen, the differences are higher, however, both datasets follow each other’s distribution very precisely. An interesting point is that MERRA-2 seems to overestimate the irradiance levels to some extent in all the stations except Minamitorishima. Since this overestimation is not happening for all the stations and its amount is not equal, no pattern can be recognized and no correction can be suggested at this step.
Table 5 contains the correlation coefficient and other errors for average daily global irradiance levels for all stations. All values should be evaluated considering the altitude difference and distance of datapoints in both datasets. As it can be seen, the correlation coefficients are very high, confirming MERRA-2 follows Meteonorm distribution almost perfectly. The least correlation (0.959) is for the off-shore station Minamitorishima (Japan), which is still a very good value considering about 31 km distance between datapoints. The rest of the stations have very high correlation coefficients, even for locations with high altitude difference and distances, such as Adelboden with a 1038-meter difference in altitude.
MAE and RMSE show better understanding of dataset differences. By looking at the distribution of monthly average values of daily irradiance levels, it can be verified that highest differences for irradiance data occur during the summer months. As shown in Table 5, MAE values vary between 140 and 872 Wh/m2 d, which is reasonable even for the highest MAE, considering that the highest error happens in summer months and daily irradiance levels in summer months are very high (6500–7500 Wh/m2 d). Highest MAE values are for Adelboden (Switzerland) and Puerto Montt-El Tepu (Chile). In the case of Adelboden, it should be considered that the datapoints in Meteonorm and MERRA-2 are 1038 m different in altitude, since the MERRA-2 data acquisition point is located on a high mountain. This leads to receiving much more irradiance, especially in summer months, and the mean absolute error of 759 Wh/m2 d is an acceptable result for daily irradiance value of about 6000 Wh/m2 d for July. On the other hand, there are very good results, such as for datapoints in Oroomieh (Iran) that are 93 m different in altitude, but the MAE is 194.55 Wh/m2 d, which is outstanding. The least MAE value (140.65 Wh/m2 d) is for Skagen Fyr, which is an off-shore site in Denmark almost 26 km distance between measurement points.
RMSE magnifies extreme differences in measurements. In other words, RMSE is close to MAE for locations that do not have very high differences. On the other hand, a much higher RMSE (in comparison to MAE) occurs for the locations with extreme difference between the measurements. Adelboden, Puerto Montt, and Bremen show higher root mean square errors, meaning that the differences in sunnier months of the year are considerable. As a result, NRMSE values for these three locations are also high and are between 14.8 and 21.5% of the irradiance in Meteonorm. Looking at the rest of the locations, RMSE and NRMSE values are good, especially looking at Oroomieh and Skagen Fyr.
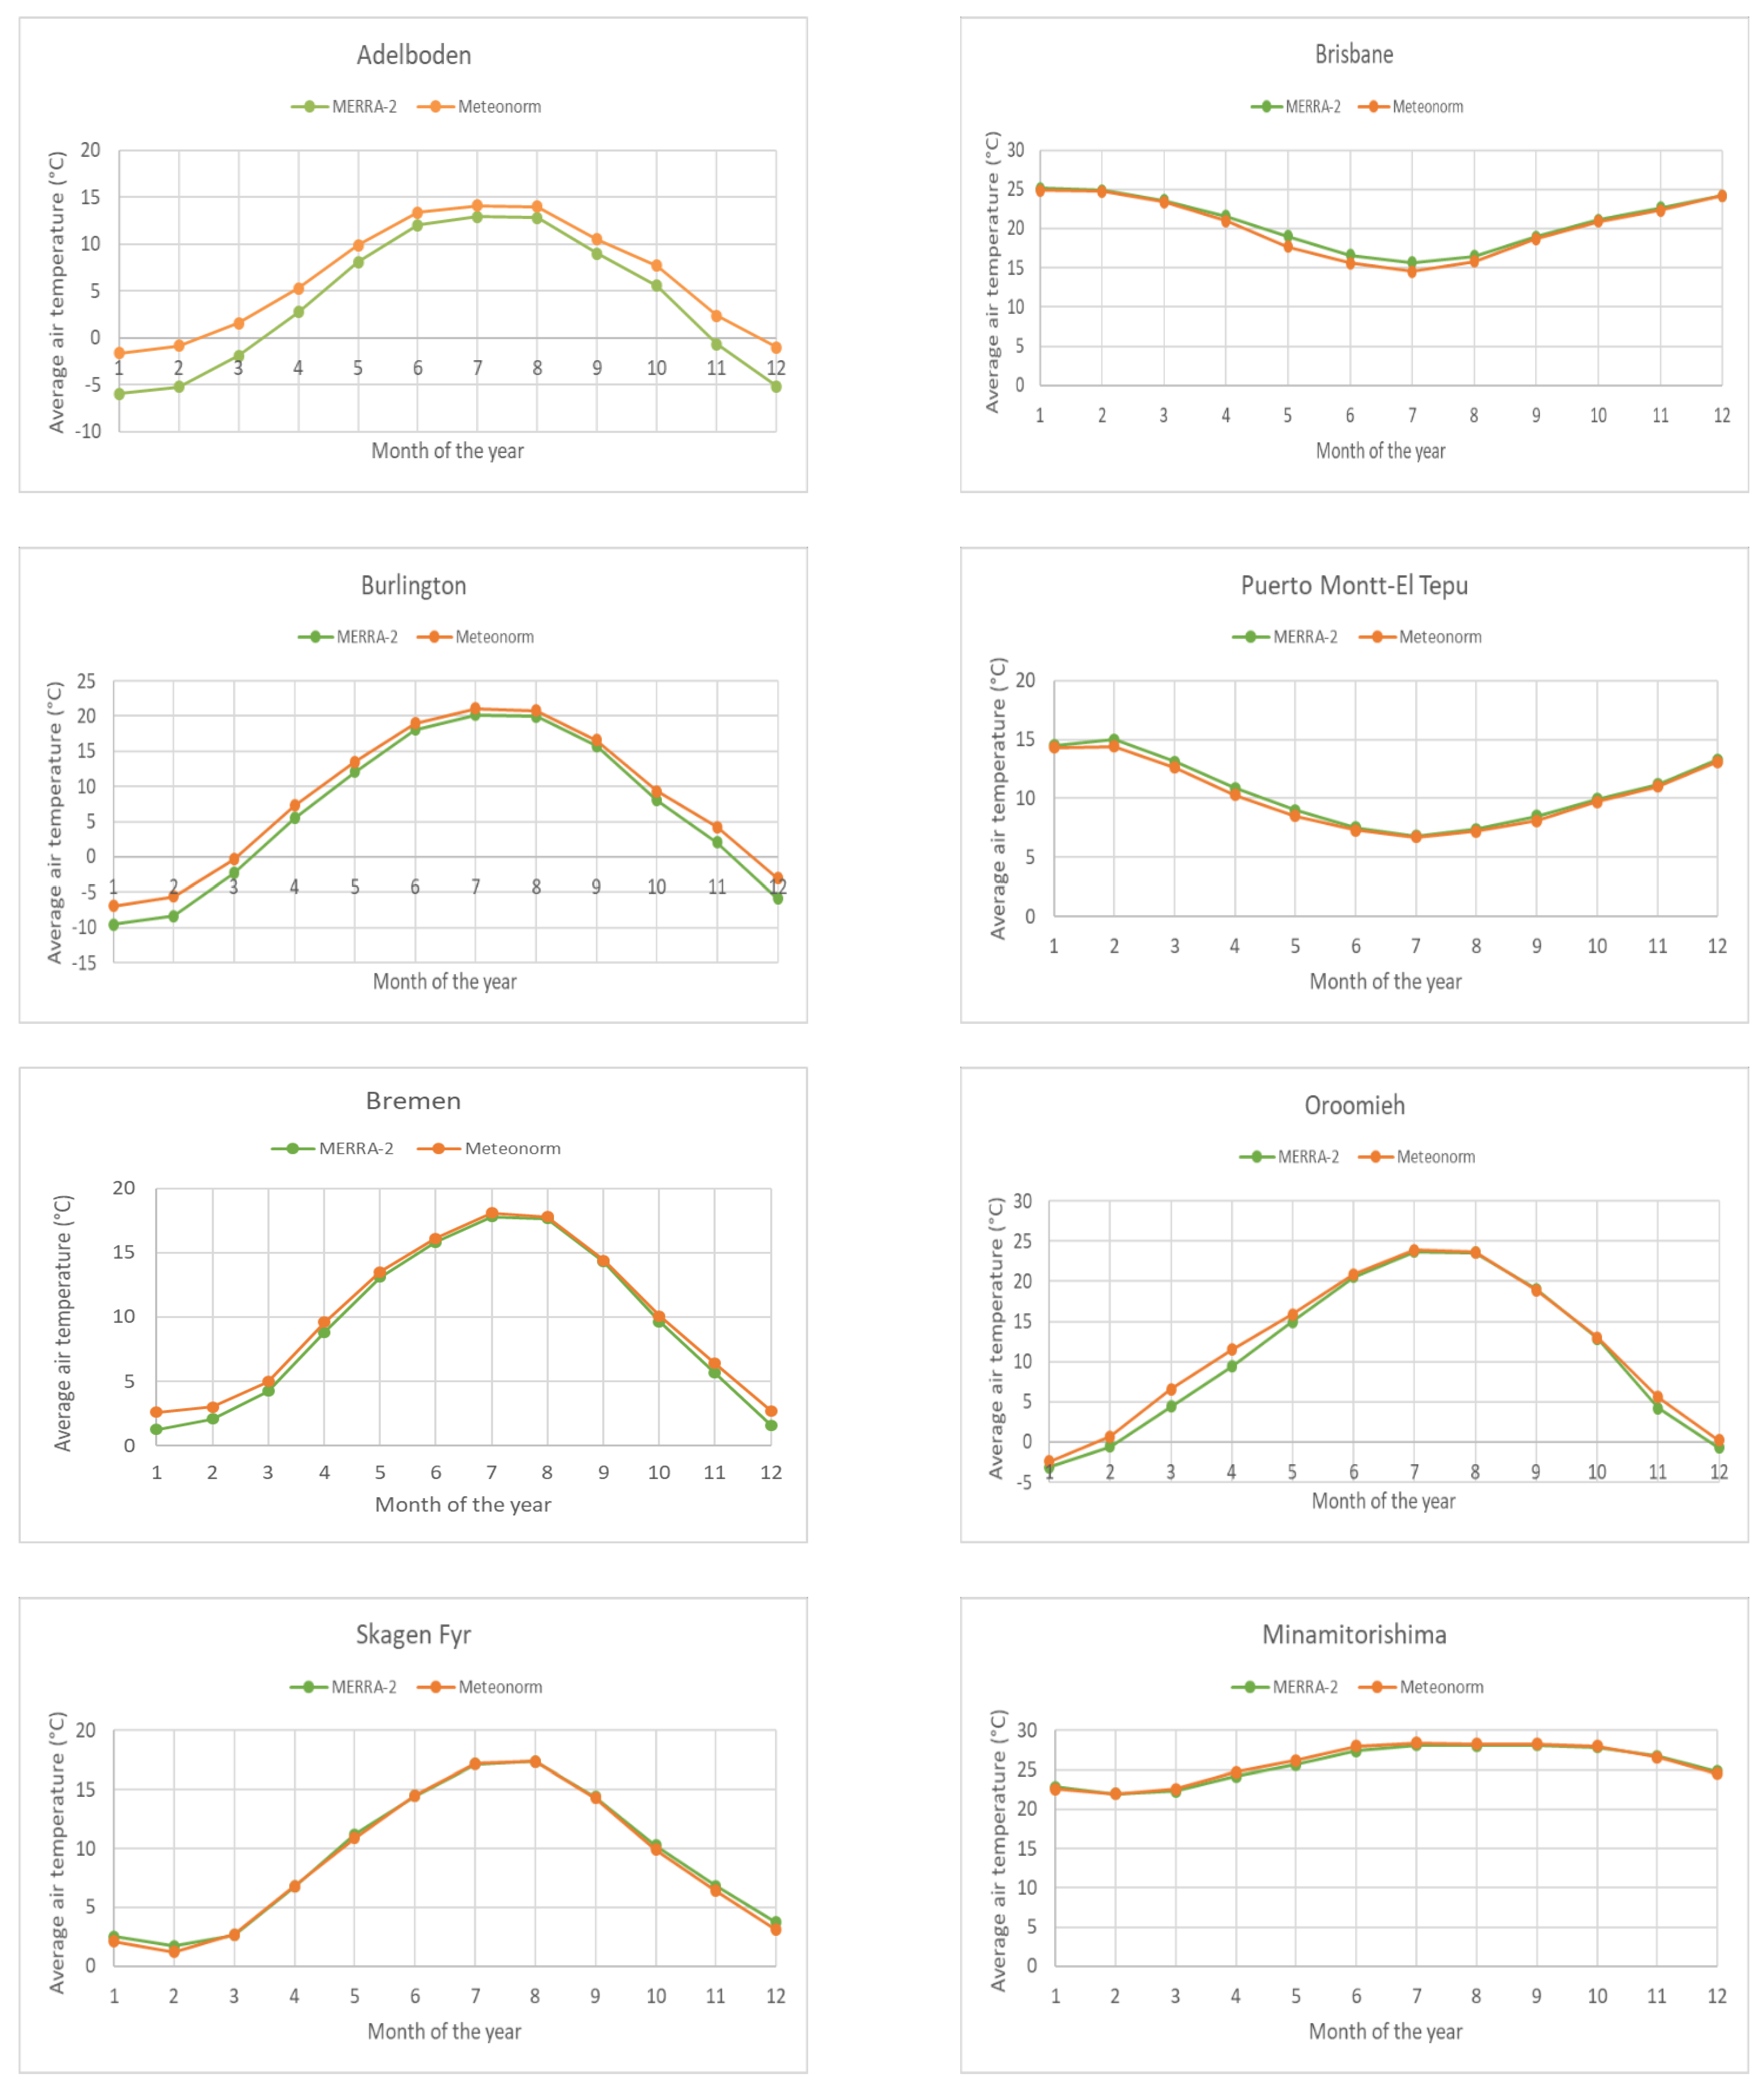
Figure 2 shows the distribution of average air temperature for every month of the year for all the locations. The difference between two distributions is minimal for air temperature for all cases except Adelboden. In the case of Adelboden, since the MERRA-2 datapoint is more than 1000 m higher than the one from Meteonorm, the MERRA-2 diagram shows considerably lower temperature values especially in winter months, which can be explained by very high altitude difference.
Table 6 shows the correlation coefficients, mean absolute error, root mean square error, and normalized root mean square error values for monthly average air temperature for all the locations in Table 2. All correlation coefficients are very high and almost 1. MAE values are also acceptable for a monthly average value. For Adelboden, MAE is 2.59 °C which is high, however, it is reasonable considering the altitude difference between two datapoints especially in colder months of the year. RMSE values for all stations are not very different from MAE, meaning that the differences in corresponding air temperature values are not extreme. NRMSE is also very low and below 7%, and even, for some cases, around 2%, confirming the precision of MERRA-2 data. As expected, Adelboden has the highest NRMSE of about 18%, which is still due to very high altitude difference.
In the case of 10-m wind speed, the correlation coefficients were calculated, which can be seen in Table 7.
In the case of Adelboden and Oroomieh, with altitude differences of more than 1000 m and 90 m, respectively, it can be confirmed that there is very little correlation but this is expected, since the wind parameters vary dramatically even with small distances depending on altitude, buildings, vegetation, and terrain. Nevertheless, much better correlation for other stations can be seen, and in the cases of Skagen Fyr and Bremen very good correlation coefficients are observed. One can say that if the altitude of datapoints in both datasets are close, MERRA-2 can be used for estimation of wind energy potential if monthly average values considered.
7.2. MERRA-2 vs. DWD
Due to limitations of Meteonorm, the comparisons are done within the monthly averaged values so far. Now, time series comparison, considering hourly measurements, is brought into this section. For this, Bremen was considered, since it has local measurements of the wanted parameters in the DWD dataset and it has the shortest distance in Germany between a local station and a MERRA-2 datapoint.
In this study, all data were gathered into two recent datasets for the years 2016 and 2017 and compared for both datasets, MERRA-2 and DWD. The DWD data contain some missing measurements which had to be removed since they were set to a value of −999. Corresponding measurements were also removed from the MERRA-2 dataset to achieve exact mutual number of measurements. After modification of data, the available data lines can be seen in Table 8. It is good to remember that 2016 was a leap year.
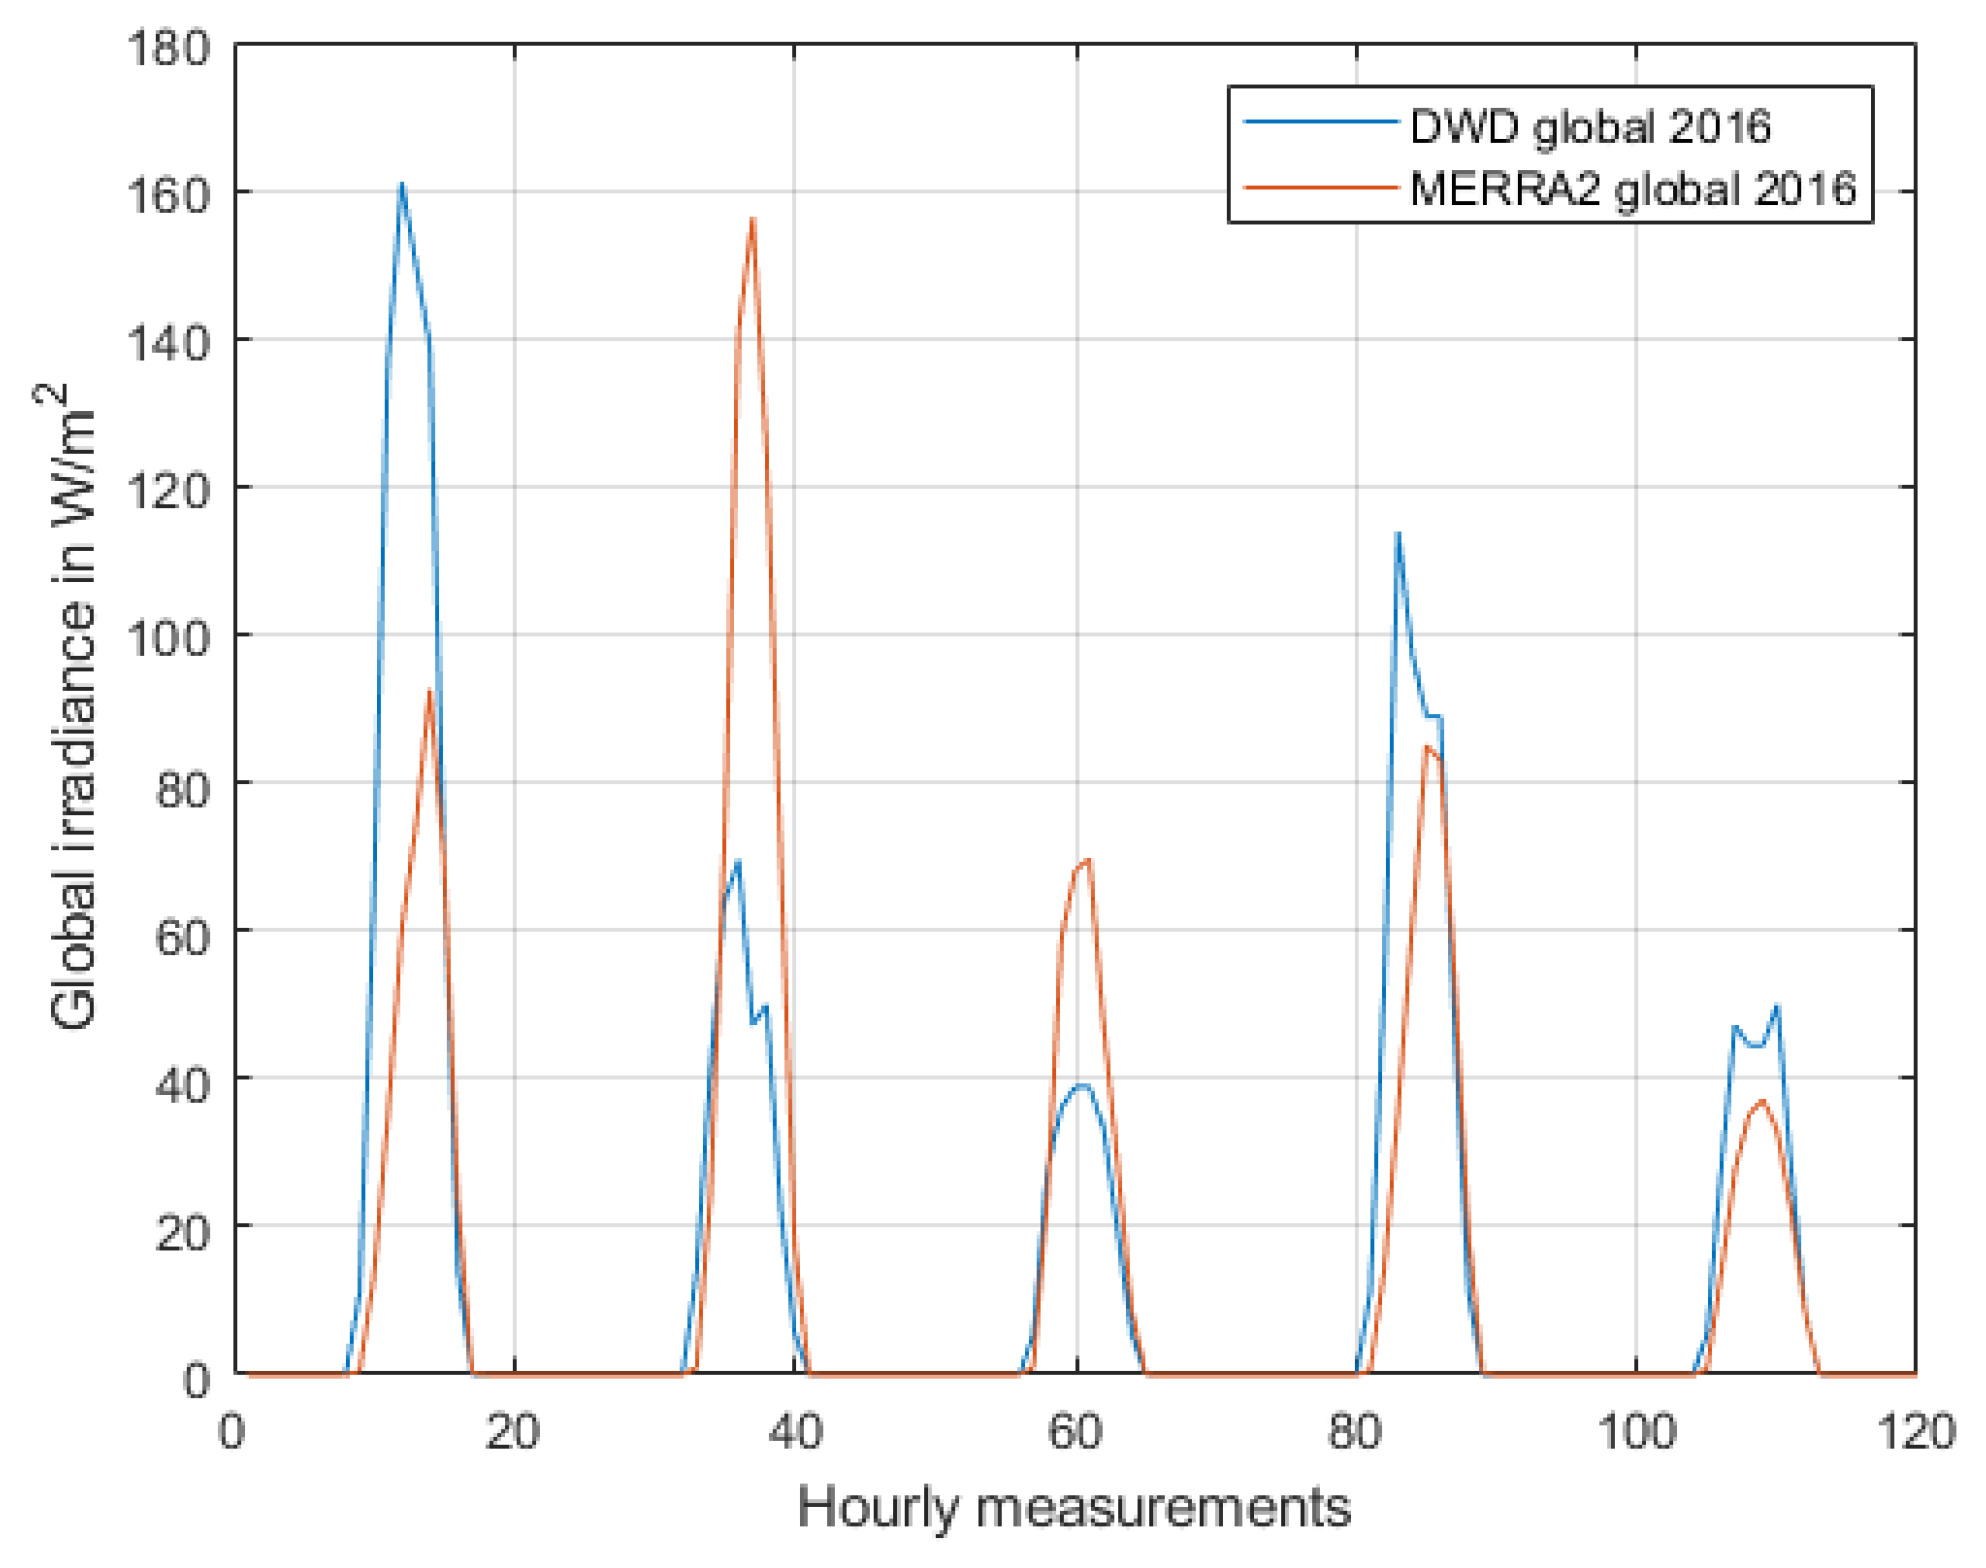
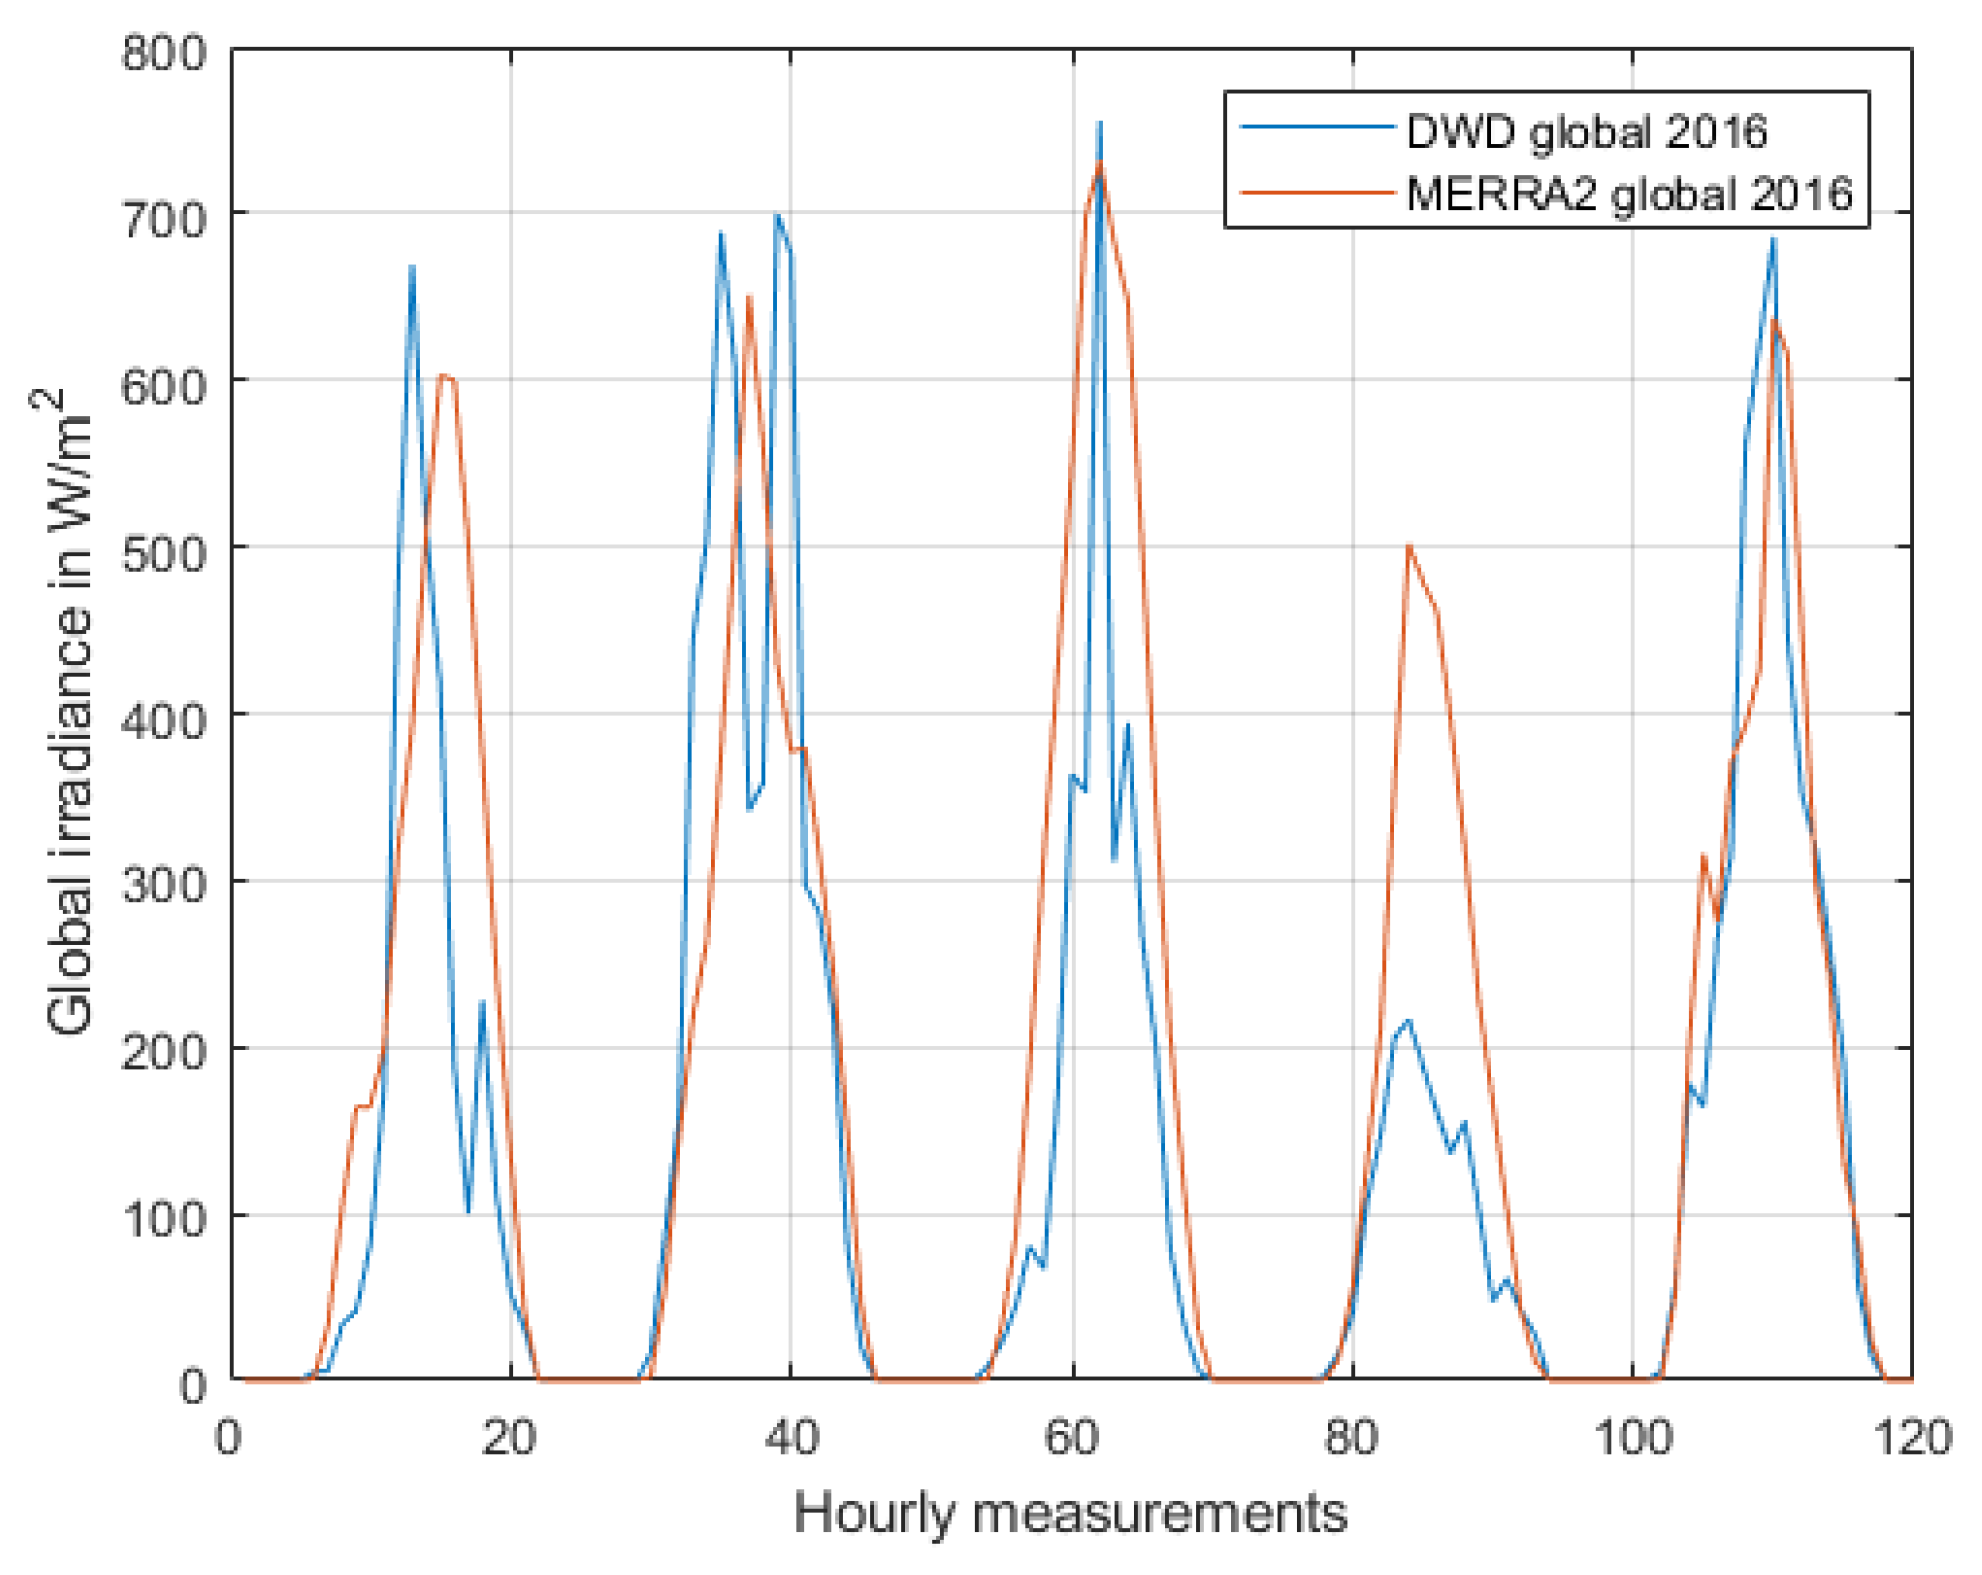
Figure 3 and Figure 4 indicate examples of the distribution of global irradiance data for both datasets in two timeslots of 1 January 2016–5 January 2016 for winter and 1 August 2016–5 August 2016 for summertime, respectively. The horizontal axis is the hours of measurement starting from one to 120 h, as for 5 days. For instance, on 1st of January 2016 (Figure 3), DWD shows the maximum irradiance of 161.1 W/m2 at 12 o’clock; however, MERRA-2′s corresponding irradiance is 60.13 W/m2. Looking at the irradiance diagram for summer (Figure 4), this difference between DWD and MERRA-2 is smaller, considering higher irradiance levels of around 700 W/m2.
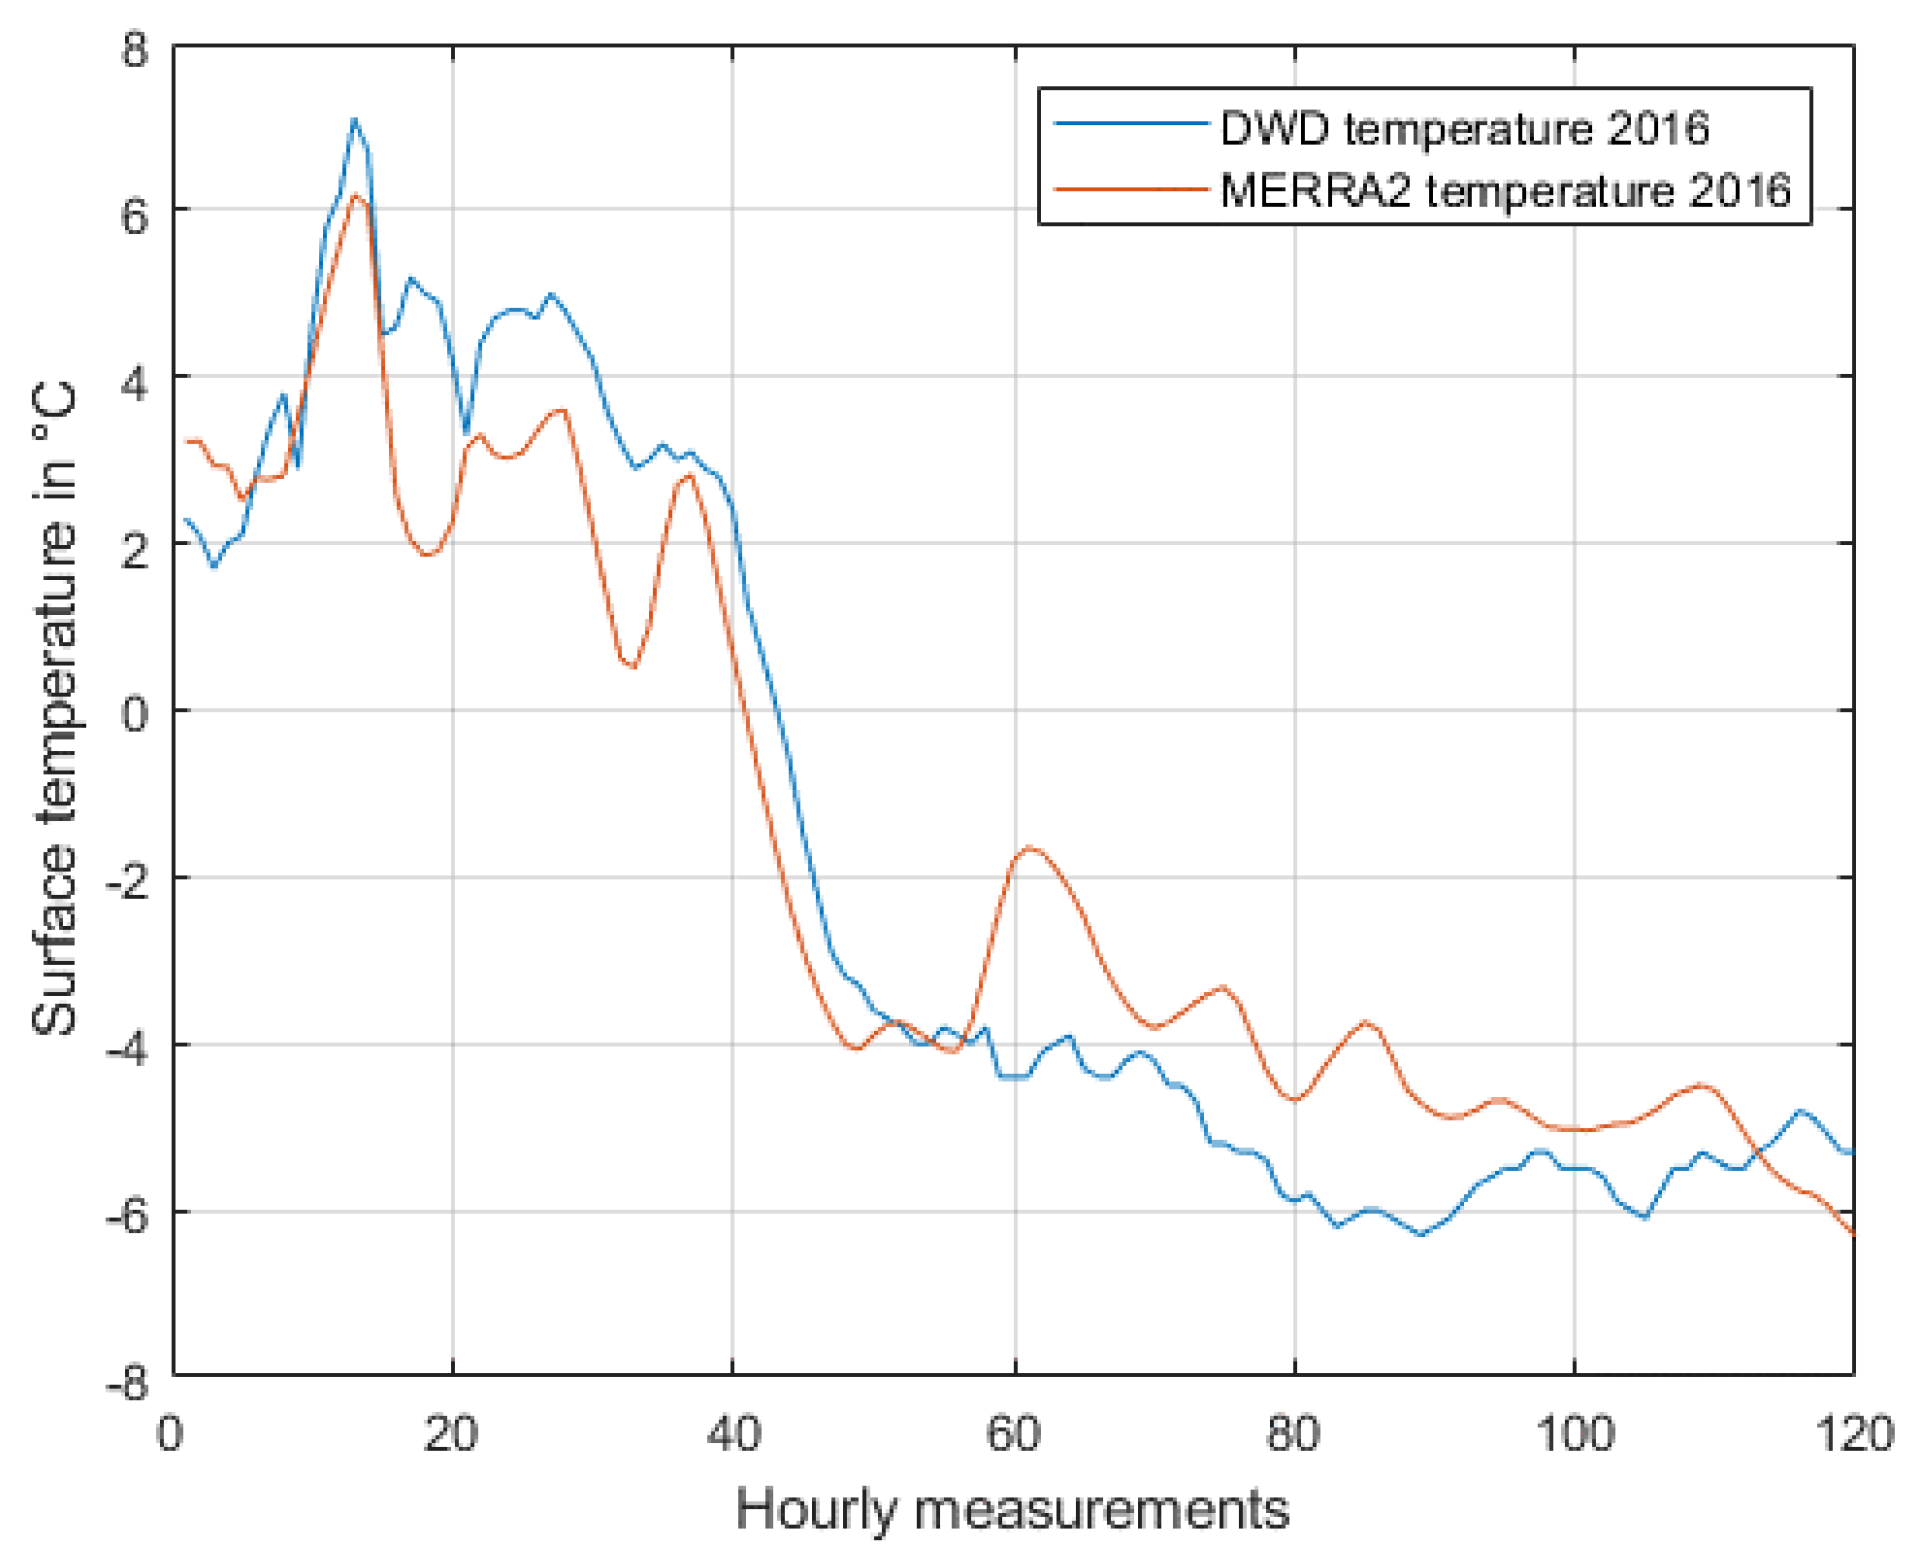
Figure 5 shows the temperature data for both datasets for the first five days of January 2016. Clearly, MERRA-2 follows the temperature measurements of DWD, as expected. Later on, the scatter diagrams and error calculations show better understandings about validity of both datasets.
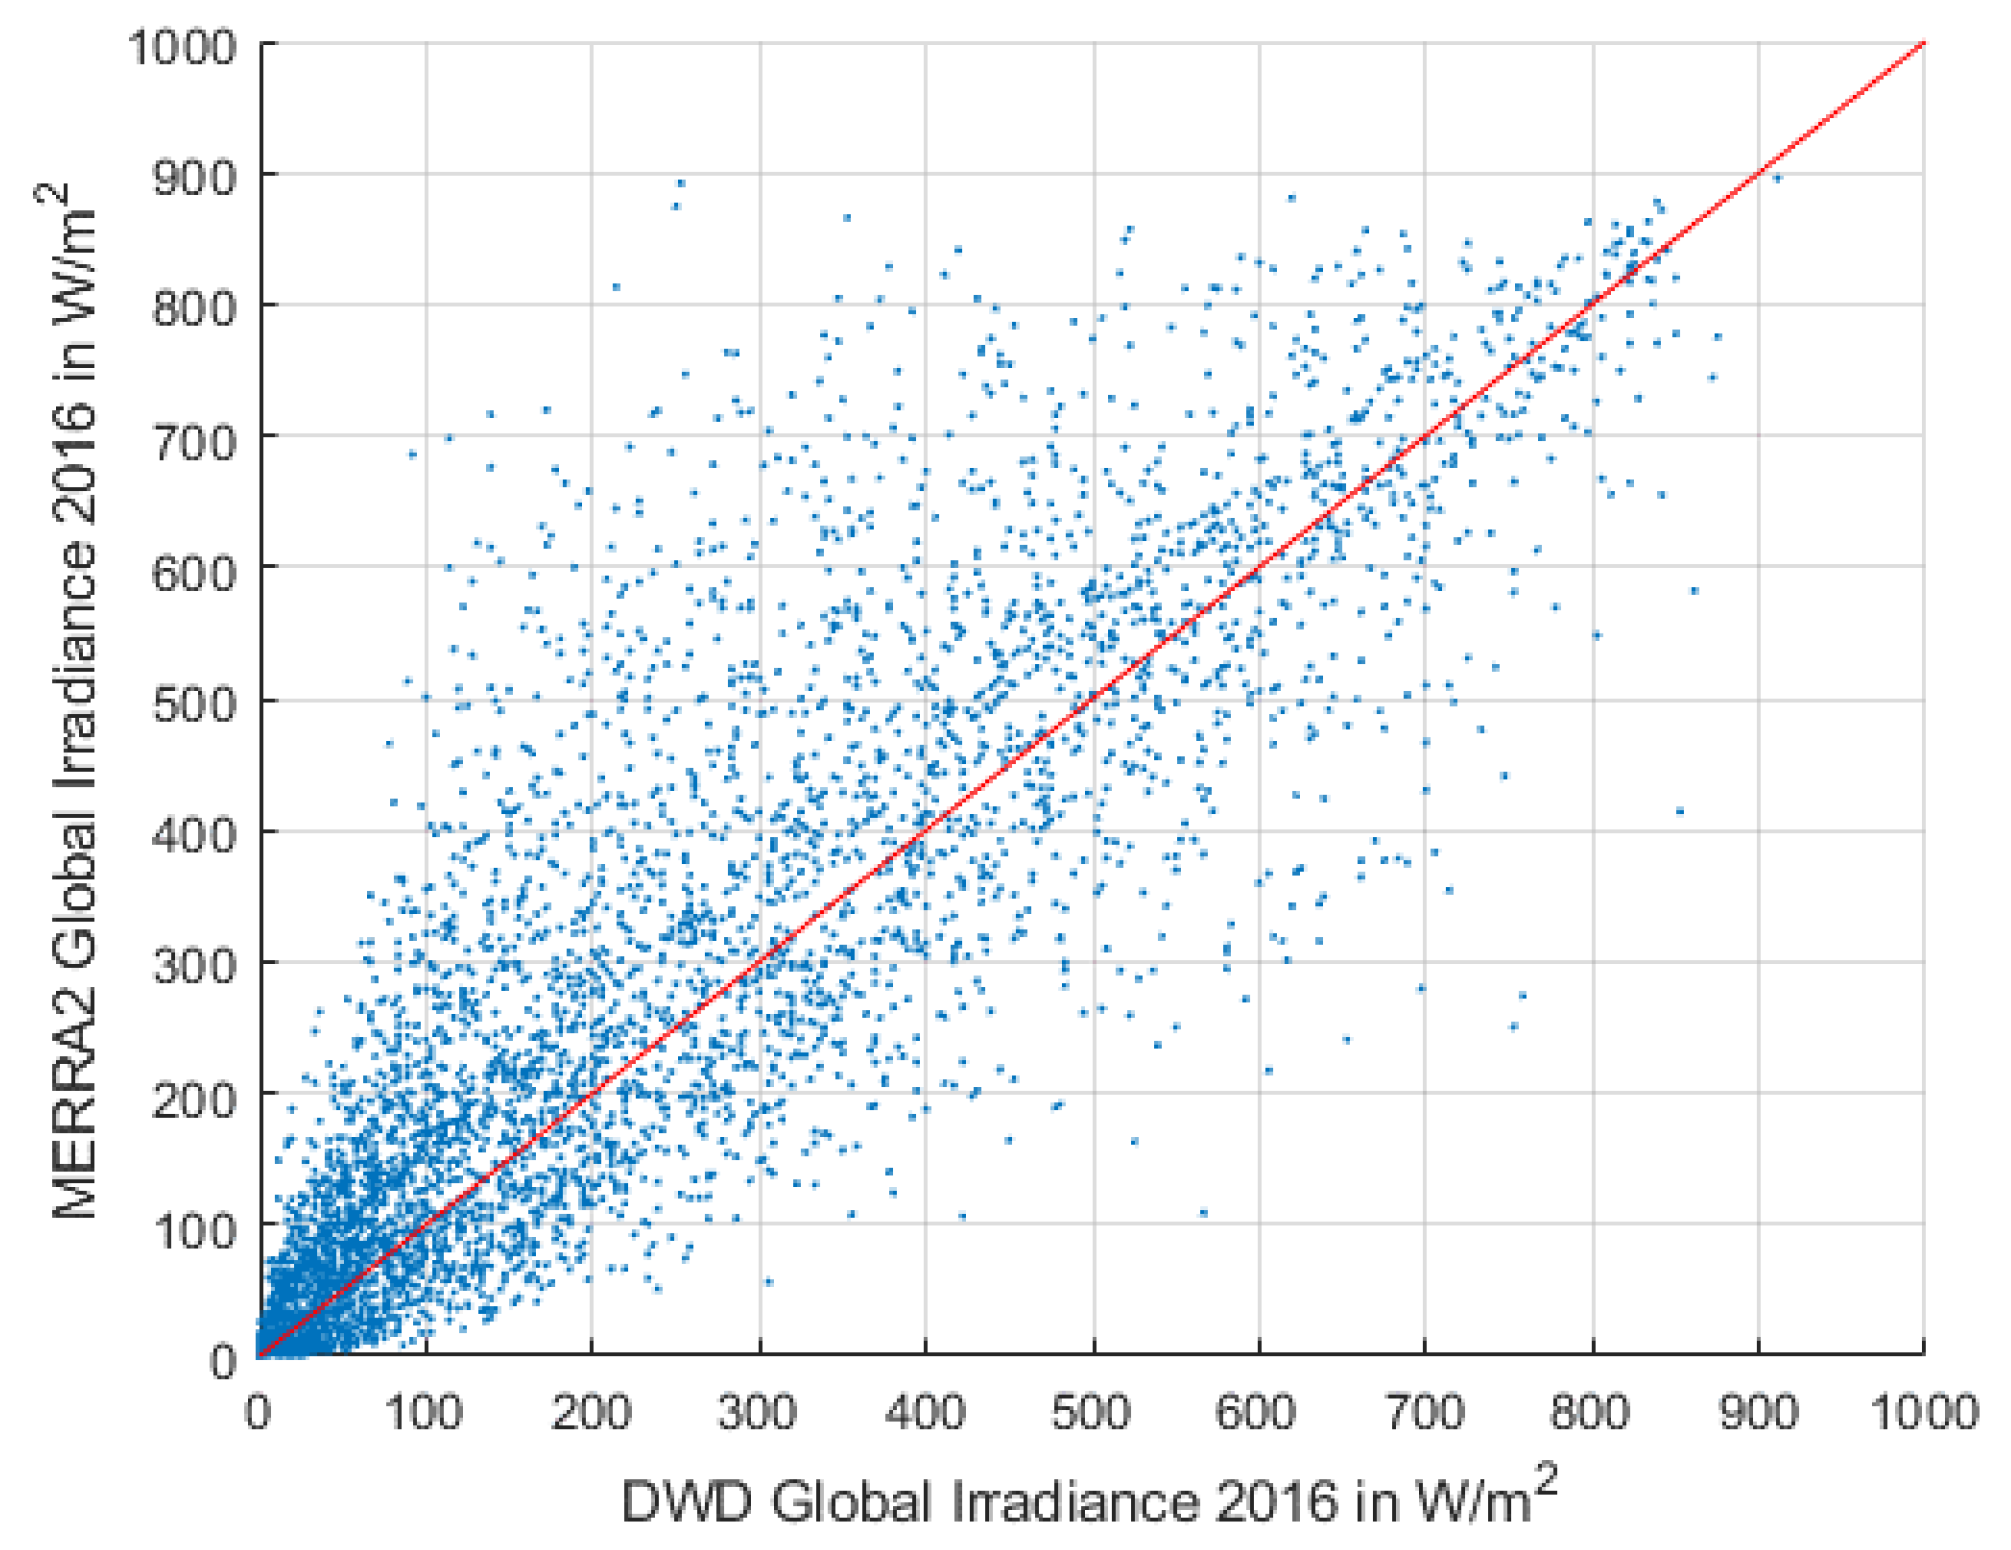
Figure 6 and Figure 7 show the scatter diagrams of global irradiance in Bremen for both datasets in 2016 and 2017.
As it can be seen, the diagrams are by some means linearly distributed along the reference line. The data points are more expanded with higher amounts of irradiance. This is expected since the errors between two datasets are minimal in hours of no radiation or zero irradiance. Another point is that MERRA-2 mainly offers somewhat higher irradiance amounts in comparison with DWD. In other words, it slightly overestimates the irradiance. However, the distribution of both datasets in both years look highly correlated. For a better comparison in correlation, it is necessary to calculate the correlation coefficient.
Considering DWD as the reference data, the correlation coefficient for global irradiance in Bremen between DWD and MERRA-2 datasets for 2016 is 0.9164, which indicates that the datasets are highly correlated. This factor for year 2017 is 0.9145, which is slightly less than 2016.
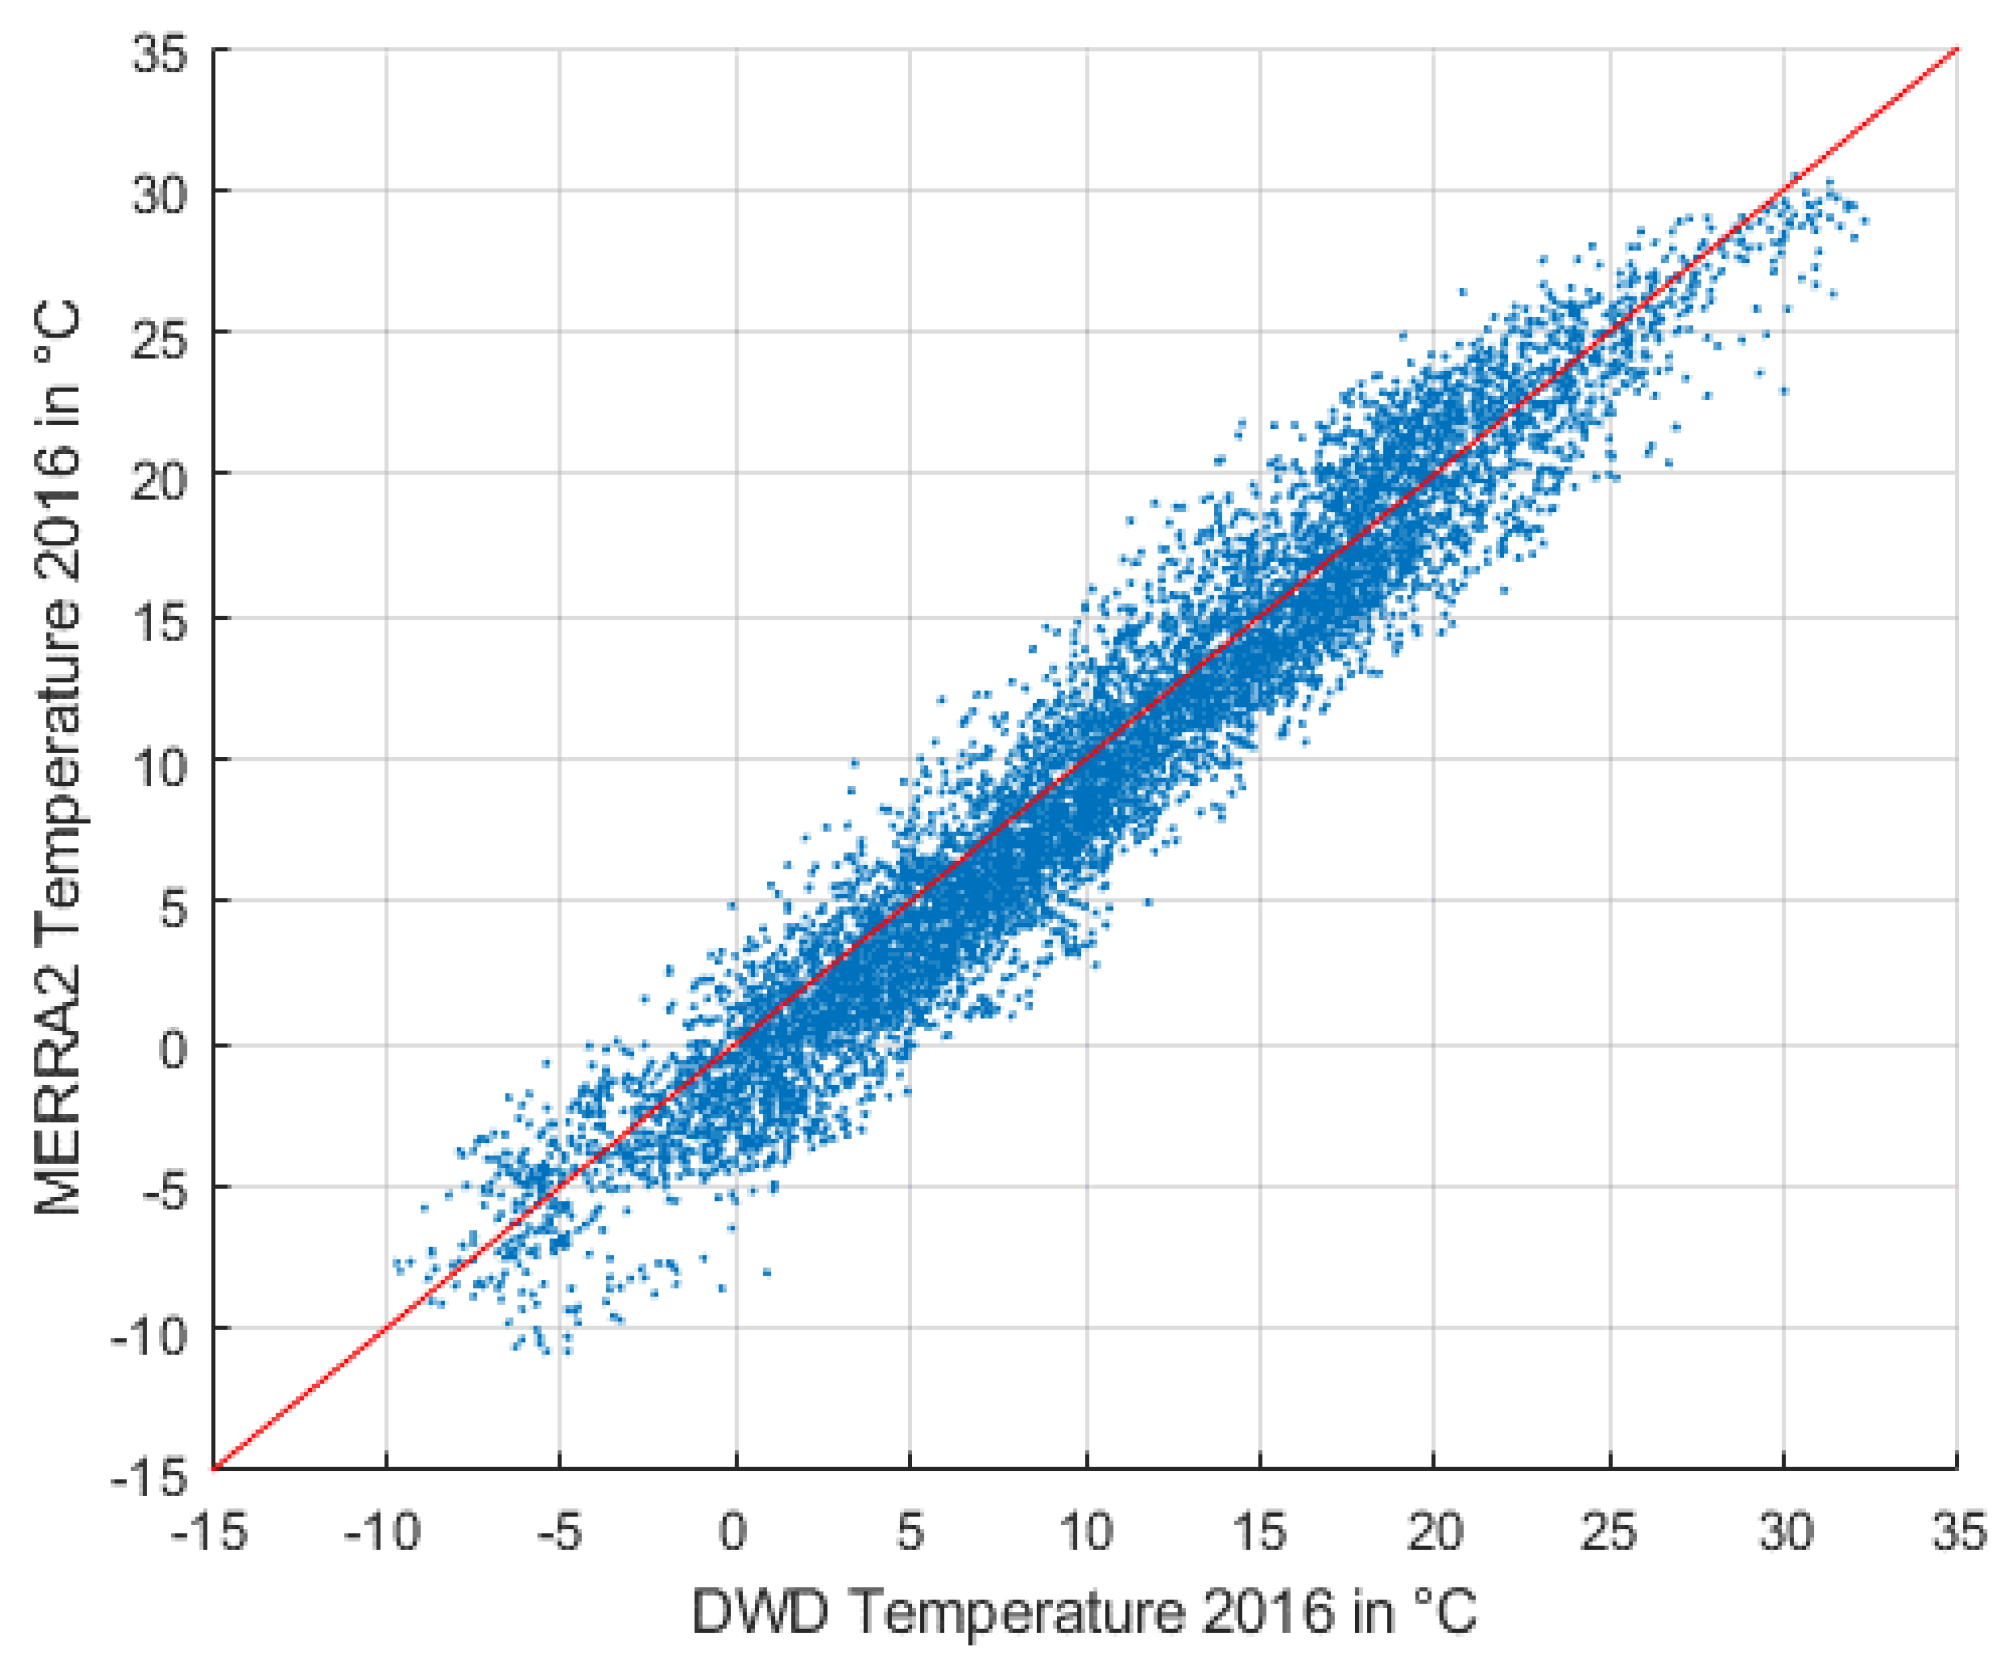
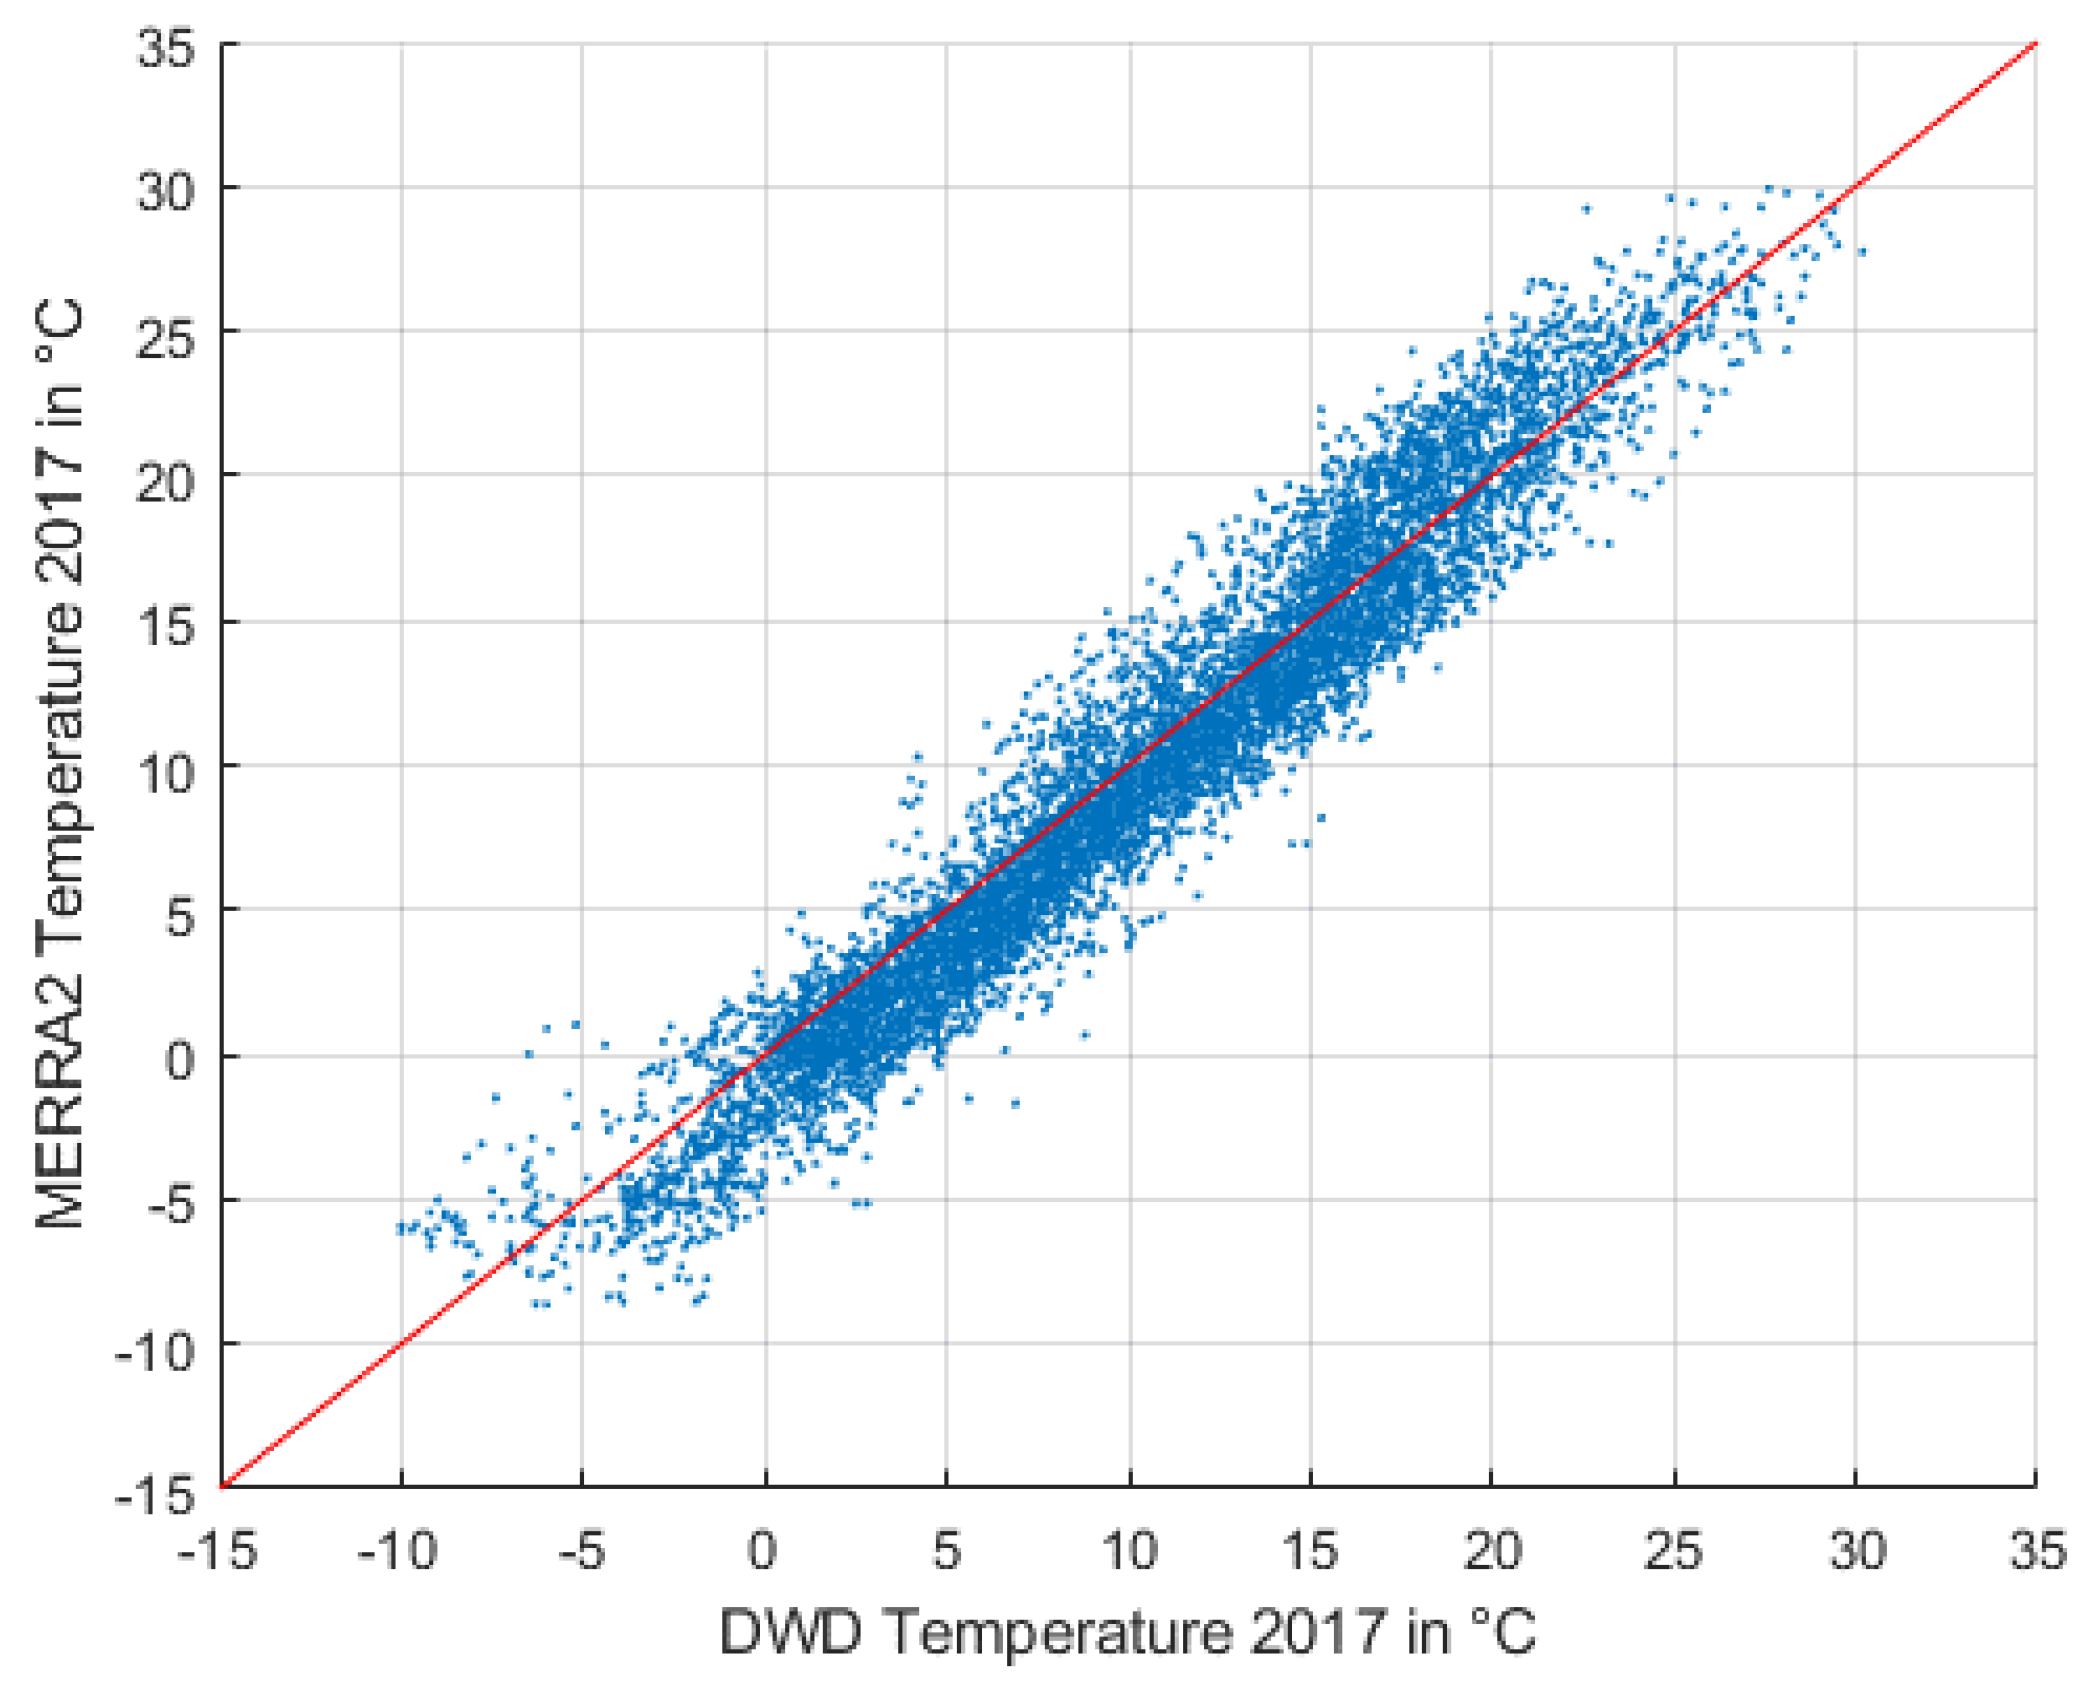
Figure 8 and Figure 9 illustrate the scatter diagrams for surface temperature in both datasets for the years 2016 and 2017. As it is shown, the data are highly correlated and distributed almost linearly according to the reference line.
As a result, the MERRA-2 and DWD datasets are more correlated in temperature than global irradiance; however, irradiance correlation is still highly acceptable. Correlation coefficient (R) for temperature measurements in 2016 for Bremen is 0.9677, which is indicating high precision of MERRA-2. This coefficient in 2017 is slightly increased to 0.9690.
Still considering DWD as the reference data, statistical error formulas can be implemented as well, to obtain errors of the MERRA-2 dataset. After these calculations, mean absolute errors (MAEs) for global irradiance in 2016 and 2017 are 42.12 W/m2 and 41.50 W/m2, respectively. These errors in the case of surface temperature are 1.82 °C and 1.71 °C, respectively, which are convenient numbers considering the full range of irradiance and temperature levels.
Root mean square error (RMSE) is 87.22 W/m2 for global irradiance measurements in 2016 and 85.93 W/m2 for 2017. This error is 2.23 °C for temperature measurements in 2016 and 2.08 °C for 2017. Since RMSE is a non-negative parameter and perfectly fit data will have RMSE of zero, this type of error in this study indicates a high agreement between DWD and MERRA-2, especially in the case of temperature measurements and considering hourly measurements of a year.
NRMSE for irradiance measurements in 2016 and 2017 are 0.0957 and 0.0913, respectively. NRMSE for temperature in 2016 and 2017 are 0.0531 and 0.0518, which confirms high quality of MERRA-2.
In Table 9, all the calculated errors and coefficients can be seen for the comparison of MERRA-2 and DWD datasets.
8. Conclusions
When designing a renewable energy system, access to precise historical meteorological data is of extreme importance. A flawless and adequate system can only be designed based on accurate data. Considering reanalysis data, which are available for many more sites than locally measured data, MERRA-2 offers a very detailed and precise reanalysis dataset to be used for system design applications. In this study, the validity of this dataset has been proven by comparison to local ground measurements recorded by Meteonorm and DWD datasets which are provided by Meteotest and Deutscher Wetterdienst. For this matter, eight sites in Meteonorm and DWD data were chosen that have 100% local measurements and have minimum distance from their corresponding datapoints in the MERRA-2 dataset. Various steps needed to be done for all datasets, including downloading data, finding corresponding parameters, timestamp synchronization, and averaging the data for achieving monthly average values to achieve the exact corresponding datasets and parameters for the whole period of available years.
Meteonorm measurements are provided as for measurements from a typical year which are calculated mathematically based on local measurements, however they do not reflect real average measurements through years, meaning that they may be not applicable for purposes requiring real historical data. Taking everything into account and after several error calculations and comparisons (Table 5, Table 6, Table 7 and Table 9), it can be said that MERRA-2 is a valuable dataset considering its stability, availability since 1980, and its geographical coverage and resolution. Its precision and correlation with local data is high, considering monthly averaged values. NRMSE of 2.9% to 21.5% compared to Meteonorm were calculated for eight globally distributed stations for monthly average of daily sum of irradiated energy. NRMSE of 2% to 18.2% were found for monthly average values of air temperature in comparison to Meteonorm. As explained in the results section, the highest errors corresponded to the locations that have high altitude differences among datapoints in MERRA-2 and Meteonorm.
Considering hourly measurements, correlation coefficients and errors were calculated for a station in Bremen (from DWD) in Germany. NRMSE of hourly values for global irradiance and surface temperature were around 9% and 5%, respectively, confirming that the precision is still high that makes MERRA-2 (with more than 41 years of available data) a countable choice for long-term applications such as renewable energy potential calculations for any location around the world.
Author Contributions
Conceptualization, methodology, software, validation, data curation, writing—original draft preparation, writing—review and editing and visualization: A.K.; supervision and project administration: S.K. All authors have read and agreed to the published version of the manuscript.
Funding
This research received no external funding.
Institutional Review Board Statement
Not applicable.
Informed Consent Statement
Not applicable.
Data Availability Statement
The data presented in this study are available on request from the corresponding author.
Conflicts of Interest
The second author is the guest editor of this special issue.
References
- Durrani, S.P.; Balluff, S.; Wurzer, L.; Krauter, S. Photovoltaic yield prediction using an irradiance forecast model based on multiple neural networks. J. Mod. Power Syst. Clean Energy 2018, 6, 255–267. [Google Scholar] [CrossRef]
- Yang, D.; Bright, J.M. Worldwide validation of 8 satellite-derived and reanalysis solar radiation products: A preliminary evaluation and overall metrics for hourly data over 27 years. Sol. Energy 2020, 210, 3–19. [Google Scholar] [CrossRef]
- Pfenninger, S.; Staffell, I. Long-term patterns of European PV output using 30 years of validated hourly reanalysis and satellite data. Energy 2016, 114, 1251–1265. [Google Scholar] [CrossRef] [Green Version]
- Juruš, P.; Eben, K.; Resler, J.; Krč, P.; Kasanický, I.; Pelikán, E.; Brabec, M.; Hošek, J. Estimating climatological variability of solar energy production. Sol. Energy 2013, 98, 255–264. [Google Scholar] [CrossRef]
- Santos, J.; Sakagami, Y.; Haas, R.; Passos, J.; Machuca, M.; Radünz, W.; Dias, E.; Lima, M. Wind speed evaluation of MERRA-2, ERA-interim and ERA-5 reanalysis data at a wind farm located in brazil. In Proceedings of the ISES Solar World Congress 2019 (ISES 2019), Santiago, Chile, 4–7 November 2019. [Google Scholar]
- Sianturi, Y.; Marjuki; Sartika, K. Evaluation of ERA5 and MERRA2 reanalyses to estimate solar irradiance using ground observations over Indonesia region. AIP Conf. Proc. 2020, 2223, 020002. [Google Scholar]
- Bosilovich, M.G.; Lucchesi, R.; Suarez, M. MERRA-2: File Specification. GMAO Office Note No. 9 (Version 1.1). 2016. Available online: https://gmao.gsfc.nasa.gov/pubs/docs/Bosilovich785.pdf (accessed on 19 June 2018).
- Jourdier, B. Evaluation of ERA5, MERRA-2, COSMO-REA6, NEWA and AROME to simulate wind power production over France. Adv. Sci. Res. 2020, 17, 63–77. [Google Scholar] [CrossRef]
- Zhang, X.; Lu, N.; Jiang, H.; Yao, L. Evaluation of reanalysis surface incident solar radiation data in China. Sci. Rep. 2020, 10, 3494. [Google Scholar] [CrossRef] [PubMed] [Green Version]
- Bendfeld, J.; Balluff, S.; Wübbeke, S.; Krauter, S. Performance of MERRA2 data compared to floating LIDAR. In Proceedings of the DEWEK 2017, Bremen, Germany, 17–18 October 2017. [Google Scholar]
- Bendfeld, J.; Balluff, S. Performance of MERRA data in Offshore Windenergy applications. In Proceedings of the DEWEK 2015, Bremen, Germany, 19–20 May 2015. [Google Scholar]
- Meteonorm. Meteonorm Software. Available online: https://meteonorm.com/en/ (accessed on 28 August 2020).
- Deutscher Wetterdienst (DWD). Available online: https://www.dwd.de/EN/aboutus/aboutus_node.html (accessed on 5 February 2021).
- Huld, T.; Urraca, R.; Gracia Amillo, A.; Trentmann, J. A global hourly solar radiation data set using satellite and reanalysis data. In Proceedings of the 33rd European Photovoltaic Solar Energy Conference and Exhibition, Amsterdam, The Netherlands, 25–29 September 2017. [Google Scholar]
- Gelaro, R.; Mccarty, W.; Suárez, M.J.; Todling, R.; Molod, A.; Takacs, L.; Randles, C.A.; Darmenov, A.; Bosilovich, M.G.; Reichle, R.; et al. The modern-era retrospective analysis for research and applications, Version 2 (MERRA-2). J. Clim. 2017, 30, 5419–5454. [Google Scholar] [CrossRef] [PubMed]
- Meteonorm, Meteonorm Documents. Available online: https://meteonorm.com/assets/downloads/broschuere-mn-7.1.pdf (accessed on 28 August 2020).
- Deutscher Wetterdienst (DWD). Sphere of Tasks. Available online: https://www.dwd.de/EN/aboutus/tasks/task_node.html (accessed on 5 February 2021).
- DWD. Available online: ftp://opendata.dwd.de/climate_environment/CDC/observations_germany/climate/hourly/solar/ST_Stundenwerte_Beschreibung_Stationen.txt (accessed on 5 February 2021).
- DWD. Available online: ftp://opendata.dwd.de/climate_environment/CDC/observations_germany/climate/hourly/air_temperature/historical/TU_Stundenwerte_Beschreibung_Stationen.txt (accessed on 5 February 2021).
Figure 1.
MERRA-2 and Meteonorm comparison for monthly average values of daily irradiance for all locations (through the years from Table 4, column “Radiation period”).
Figure 1.
MERRA-2 and Meteonorm comparison for monthly average values of daily irradiance for all locations (through the years from Table 4, column “Radiation period”).

Figure 2.
MERRA-2 and Meteonorm comparison for monthly average values of air temperature for all locations through years 2000–2009.
Figure 2.
MERRA-2 and Meteonorm comparison for monthly average values of air temperature for all locations through years 2000–2009.

Figure 3.
Deutsche Wetterdienst (DWD) and MERRA-2 hourly global irradiance (GI) for 1 January 2016–5 January 2016 in Bremen.
Figure 3.
Deutsche Wetterdienst (DWD) and MERRA-2 hourly global irradiance (GI) for 1 January 2016–5 January 2016 in Bremen.

Figure 4.
DWD and MERRA-2 hourly global irradiance (GI) for 1 August 2016–5 August 2016 in Bremen.

Figure 5.
DWD and MERRA-2 surface temperature (TS) for 1 January 2016–5 January 2016 in Bremen.

Figure 6.
Scatter diagram of global irradiance (GI) for DWD and MERRA-2 in 2016 in Bremen.

Figure 7.
Scatter diagram of global irradiance (GI) for DWD and MERRA-2 in 2017 in Bremen.

Figure 8.
Scatter diagram of surface temperature (TS) for DWD and MERRA-2 in 2016 in Bremen.

Figure 9.
Scatter diagram of surface temperature (TS) for DWD and MERRA-2 in 2017 in Bremen.


Table 1.
Some sample parameters in the RAD and SLV datasets of Modern-Era Retrospective analysis for Research and Applications version 2 MERRA-2 [7].
Table 1.
Some sample parameters in the RAD and SLV datasets of Modern-Era Retrospective analysis for Research and Applications version 2 MERRA-2 [7].
| Parameter Name | Description | Units |
|---|---|---|
| ALBEDO | “Surface albedo” | 1 |
| CLDTOT | “Total cloud area fraction” | 1 |
| SWGDN | “Surface incoming shortwave flux” | W/m2 |
| SWGNT | “Surface net downward shortwave flux” | W/m2 |
| TS | “Surface skin temperature” | K |
| T10M | “10-meter air temperature” | K |
| U10M | “10-meter eastward wind” | m/s |
| V10M | “10-meter northward wind” | m/s |
| PS | “Surface pressure” | Pa |
Table 2.
Chosen Meteonorm stations vs. their corresponding MERRA-2 datapoints.
| Station | Meteonorm Coordinates | MERRA-2 Coordinates | Distance (km) ≈ | Altitude Difference (m) ≈ |
|---|---|---|---|---|
| Adelboden (Switzerland) | 46.492° N, 7.5611° E | 46.5° N, 7.5° E | 4.73 | 1038 |
| Brisbane (Australia) | 27.383° S, 153.1° E | 27.5° S, 153.125° E | 13.30 | 5 |
| Burlington (USA) | 44.467° N, 73.15° W | 44.5° N, 73.125° W | 4.19 | 3 |
| Puerto Montt-El Tepu (Chile) | 41.417° S, 73.083° W | 41.5° S, 73.125° W | 9.82 | 27 |
| Bremen (Germany) | 53.05° N, 8.8° E | 53° N, 8.75° E | 6.49 | 5 |
| Oroomieh (Iran) | 37.533° N, 45.083° E | 37.5° N, 45° E | 8.19 | 93 |
| Skagen Fyr (Denmark, off-shore) | 57.733° N, 10.633° E | 57.5° N, 10.625° E | 25.89 | 0 |
| Minamitorishima (Japan, off-shore) | 24.3° N, 153.967° E | 24.5° N, 153.75° E | 31.26 | 0 |
Table 3.
Parameters to compare between Meteonorm and MERRA-2.
| Parameter | Name in Meteonorm | Name in MERRA-2 |
|---|---|---|
| Mean irradiance of global radiation horizontal | Gh | SWGDN |
| Air temperature | Ta | T2M |
| Wind speed (10 m) | FF | U10M, V10M |
Table 4.
Time period and uncertainty of available data in Meteonorm.
| Station | Radiation Period | Gh Uncertainty | Wind and Temperature Period | Ta Uncertainty |
|---|---|---|---|---|
| Adelboden (Switzerland) | 1996–2015 | 3% | 2000–2009 | 0.3 °C |
| Brisbane (Australia) | 1990–2008 | 2% | 2000–2009 | 0.3 °C |
| Burlington (USA) | 1991–2005 | 3% | 2000–2009 | 0.3 °C |
| Puerto Montt-El Tepu (Chile) | 1997–2013 | 4% | 2000–2009 | 0.3 °C |
| Bremen (Germany) | 2006–2015 | 2% | 2000–2009 | 0.3 °C |
| Oroomieh (Iran) | 1985–2000 | 3% | 2000–2009 | 0.3 °C |
| Skagen Fyr (Denmark, off-shore) | 2001–2010 | 2% | 2000–2009 | 0.3 °C |
| Minamitorishima (Japan, off-shore) | 1991–2010 | 2% | 2000–2009 | 0.3 °C |
Table 5.
Errors and correlation coefficient of monthly average values of daily global irradiance (through the years from Table 4, column “Radiation period”).
Table 5.
Errors and correlation coefficient of monthly average values of daily global irradiance (through the years from Table 4, column “Radiation period”).
| Global Irradiance | R | MAE (Wh/m2 d) | RMSE (Wh/m2 d) | NRMSE |
|---|---|---|---|---|
| Adelboden | 0.9973 | 759.02 | 879.24 | 0.205 |
| Brisbane | 0.9925 | 416.44 | 469.52 | 0.122 |
| Burlington | 0.9956 | 415.87 | 479.11 | 0.097 |
| Puerto Montt-El Tepu | 0.9986 | 872.30 | 1004.41 | 0.215 |
| Bremen | 0.9974 | 567.95 | 700.28 | 0.148 |
| Oroomieh | 0.9997 | 194.55 | 207.09 | 0.034 |
| Skagen Fyr | 0.9986 | 140.65 | 177.03 | 0.029 |
| Minamitorishima | 0.9593 | 284.01 | 334.64 | 0.095 |
Table 6.
Errors and correlation coefficient of monthly average values of air temperature through years 2000–2009.
Table 6.
Errors and correlation coefficient of monthly average values of air temperature through years 2000–2009.
| Air Temperature | R | MAE (°C) | RMSE (°C) | NRMSE |
|---|---|---|---|---|
| Adelboden | 0.9995 | 2.59 | 2.85 | 0.182 |
| Brisbane | 0.9972 | 0.51 | 0.66 | 0.064 |
| Burlington | 0.9998 | 1.68 | 1.84 | 0.066 |
| Puerto Montt-El Tepu | 0.9982 | 0.31 | 0.36 | 0.046 |
| Bremen | 0.9997 | 0.61 | 0.71 | 0.046 |
| Oroomieh | 0.9977 | 0.87 | 1.13 | 0.043 |
| Skagen Fyr | 0.9994 | 0.25 | 0.32 | 0.020 |
| Minamitorishima | 0.9929 | 0.28 | 0.33 | 0.052 |
Table 7.
Correlation coefficients of monthly average values of wind speed at a height of 10 m through years 2000–2009.
Table 7.
Correlation coefficients of monthly average values of wind speed at a height of 10 m through years 2000–2009.
| Wind Speed 10 m | R |
|---|---|
| Brisbane | 0.8128 |
| Burlington | 0.9011 |
| Puerto Montt-El Tepu | 0.9180 |
| Bremen | 0.9453 |
| Skagen Fyr | 0.9900 |
| Minamitorishima | 0.8809 |
Table 8.
Number of available mutual hourly measurements in both datasets for years 2016 and 2017 in Bremen.
Table 8.
Number of available mutual hourly measurements in both datasets for years 2016 and 2017 in Bremen.
| Year | Hourly Global Irradiance Measurements (GI) | Hourly Surface Temperature Measurements (TS) |
|---|---|---|
| 2016 | 8783 | 8783 |
| 2017 | 8717 | 8759 |
Table 9.
MERRA-2 error for hourly measurements of global irradiance (GI) and surface temperature (TS) of Bremen in 2016 and 2017, in comparison with DWD.
Table 9.
MERRA-2 error for hourly measurements of global irradiance (GI) and surface temperature (TS) of Bremen in 2016 and 2017, in comparison with DWD.
| MERRA-2 vs. DWD | Global Irradiance 2016 | Global Irradiance 2017 | Surface Temperature 2016 | Surface Temperature 2017 |
|---|---|---|---|---|
| R | 0.9164 | 0.9145 | 0.9677 | 0.9690 |
| MAE | 42.12 W/m2 | 41.50 W/m2 | 1.82 °C | 1.71 °C |
| RMSE | 87.22 W/m2 | 85.93 W/m2 | 2.23 °C | 2.08 °C |
| NRMSE | 0.0957 | 0.0913 | 0.0531 | 0.0518 |
Publisher’s Note: MDPI stays neutral with regard to jurisdictional claims in published maps and institutional affiliations. |
© 2021 by the authors. Licensee MDPI, Basel, Switzerland. This article is an open access article distributed under the terms and conditions of the Creative Commons Attribution (CC BY) license (http://creativecommons.org/licenses/by/4.0/).
Share and Cite
MDPI and ACS Style
Khatibi, A.; Krauter, S. Validation and Performance of Satellite Meteorological Dataset MERRA-2 for Solar and Wind Applications. Energies 2021, 14, 882. https://doi.org/10.3390/en14040882
AMA Style
Khatibi A, Krauter S. Validation and Performance of Satellite Meteorological Dataset MERRA-2 for Solar and Wind Applications. Energies. 2021; 14(4):882. https://doi.org/10.3390/en14040882
Chicago/Turabian StyleKhatibi, Arash, and Stefan Krauter. 2021. "Validation and Performance of Satellite Meteorological Dataset MERRA-2 for Solar and Wind Applications" Energies 14, no. 4: 882. https://doi.org/10.3390/en14040882
Note that from the first issue of 2016, this journal uses article numbers instead of page numbers. See further details here.