Characteristic Analysis of Water Quality Variation and Fish Impact Study of Fish-Lighting Complementary Photovoltaic Power Station


1
Key Laboratory of Land Surface Process and Climate Change in Cold and Arid Regions, Northwest Institute of Eco-Environment and Resources, Chinese Academy of Sciences, Lanzhou 730000, China
2
College of Resources and Environment, University of Chinese Academy of Sciences, Beijing 100049, China
*
Authors to whom correspondence should be addressed.
Energies 2020, 13(18), 4822; https://doi.org/10.3390/en13184822
Submission received: 27 July 2020
/
Revised: 9 September 2020
/
Accepted: 14 September 2020
/
Published: 15 September 2020
Abstract
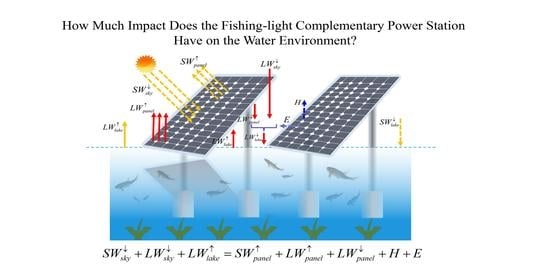
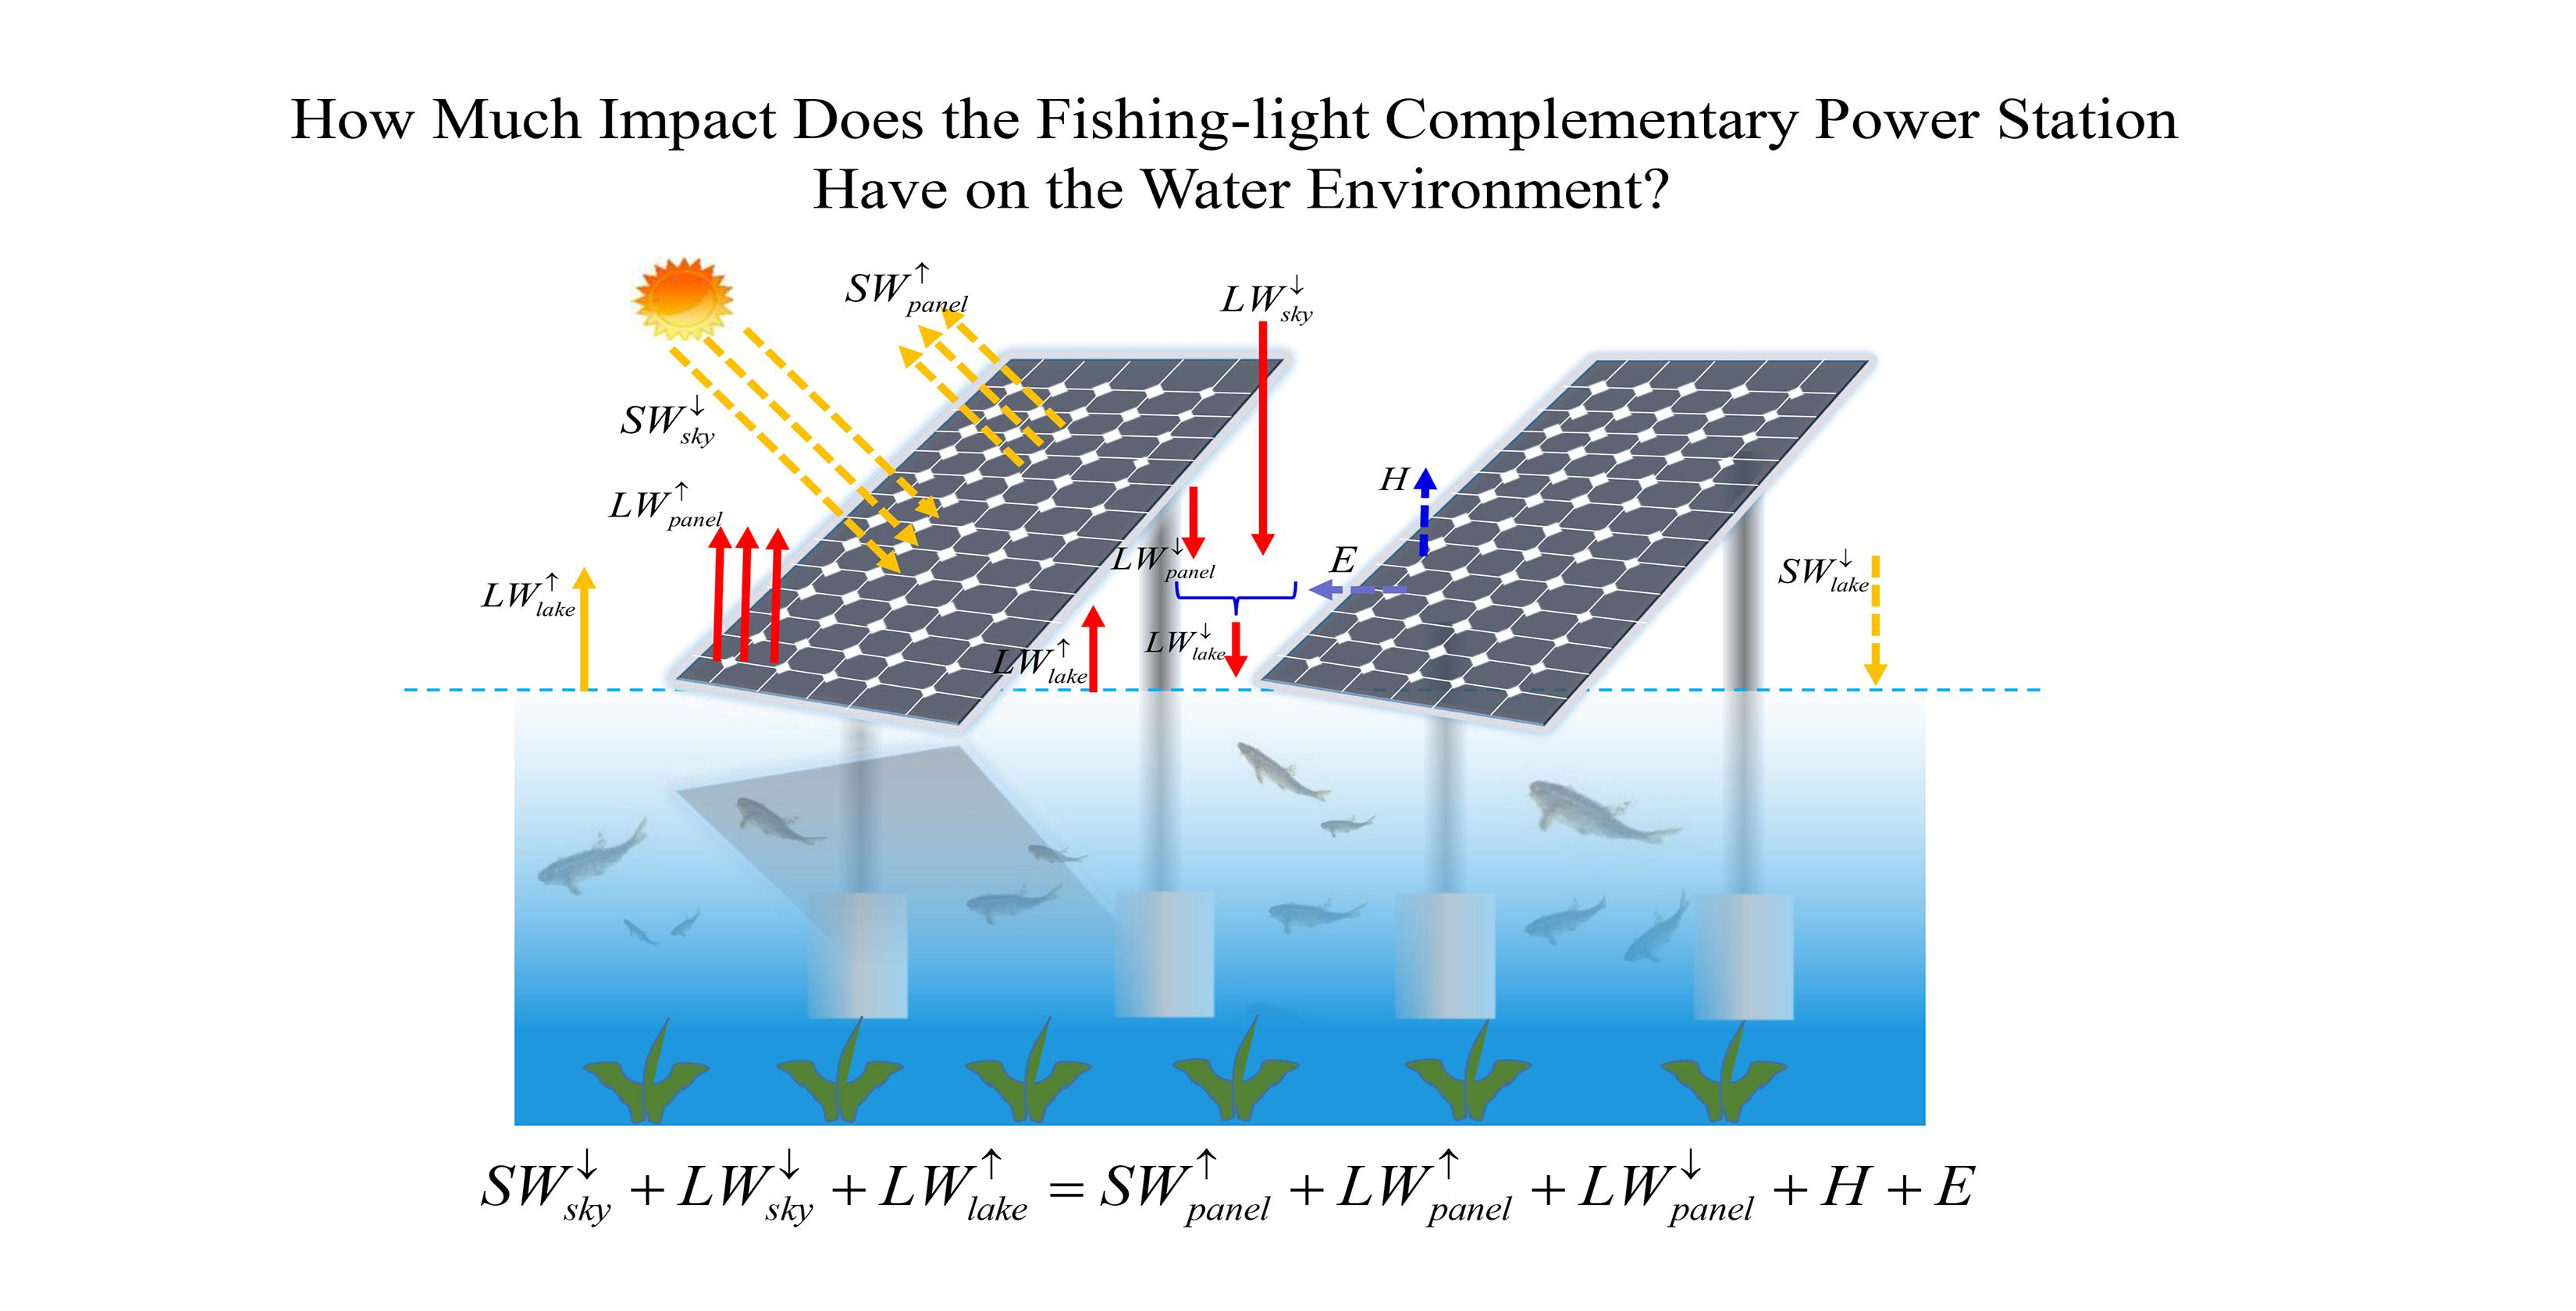
:Fish-lighting complementary photovoltaic power station organically combines aquaculture and renewable energy. In this study we aimed to develop a solar photovoltaic that is not confined to land. We used a shade net to simulate photovoltaic panels, and studied the effects of different proportions of photovoltaic panels on water and fish. The results showed that the average light intensity of the unshaded area and the shaded area were 16,661.7 Lux and 2437.0 Lux. The average light intensity of the shaded area was 85.4% lower than that of the unshaded area. The effective range of the shaded area for the light intensity of the water layer was 0 cm~30 cm. The temperature and pH in the water body showed a linear decreasing trend with the increase of the photovoltaic deployment ratio, and the dissolved oxygen showed an inverted “U”-shaped change characteristic, but this effect was limited. When the photovoltaic deployment ratio was 25% to 75%, the dissolved oxygen in the water body increases by an average of 2.37% compared to the unshaded area. The appropriate proportion of photovoltaic deployment did not affect the dissolved oxygen content in the water body. When the photovoltaic deployment ratio reached 75%, the number of algae species and algae biomass was the largest, and the fish production was the highest at 8094.6 kg·acre−1, which is an increase of 166.2 kg·acre−1 compared to the average yield in unshaded areas. Therefore, photovoltaic layout will not affect the growth of fish, and the proportion of 75% is the best layout choice.
1. Introduction
Global economic development and population growth are driving enormous energy demand. Oil, natural gas, and coal resources are becoming increasingly depleted, and the consumption of traditional fossil energy causes environmental pollution and climate warming, which makes human beings face the double severe challenge of energy shortage and global ecological deterioration [1,2,3]. As an important form of renewable energy utilization, solar photovoltaic power generation is one of the effective ways to solve these problems [4], which has been highly valued and strongly supported by governments around the world. China, Europe, the United States, Japan, and India are the major global photovoltaic markets, accounting for about 90%. Among them, China is the world’s first market, with a market share of about 46% [5]. According to the report of the Intergovernmental Panel on Climate Change (IPCC), photovoltaic power generation will account for 12% of global power generation in 2030 and 33% in 2050 [6]. According to the prediction of the European Commission’s Joint Research Center, more than 20% of the world’s energy consumption will be solar photovoltaic power generation in 2040 [7]; solar photovoltaic power generation will account for more than 60% of the world’s energy structure by the end of this century. It has very broad development prospects.
With the rapid development of solar energy, the underlying earth surface of photovoltaic layout is also diversified. Wu et al. analyzed the temperature and humidity changes inside and outside the photovoltaic power plant under the Qinghai Gonghe desert. The results showed that the temperature change was small in the photovoltaic power plant during the day, and the temperature dropped sharply in the photovoltaic power plant at night; the relative humidity also increased in the station [8]. Armstrong et al. [9] studied the difference in microclimate between the area under the photovoltaic array, the gap area, and the control area on a grassland with a solar array installed in the United Kingdom. The results of the study showed that the temperature of the area under the photovoltaic array in summer was lower than that of the gap area and the control area. It was 5.2 °C lower and drier, and the daily changes were a reduction in temperature and humidity; in winter, the gap area of the photovoltaic array was 1.7 °C lower than the temperature under photovoltaic arrays and the control area. Tian Wei et al. [10] simulated the influence of integrating photovoltaic buildings in Tianjin on the microclimate of the urban canopy. The simulation results showed that the photovoltaic roofs and photovoltaic facades with ventilation gaps significantly changed the surface temperature of the building and the sensible heat flux density. However, compared with the urban canyon without photovoltaic, the effect on the temperature of installing photovoltaic cells was not great. With the help of Energyplus simulation software, Scherba et al. [11] explored the role of different environmentally-friendly roofing technologies in influencing the energy balance of roofs, and the resulting sensible heat flux transferred to the urban atmosphere, with a focus on the urban heat island effect in summer. The layout of large-scale photovoltaic panels will break the radiation balance process of the original surface, and then act on the local climate. However, there are differences in the radiation balance process of different underlying surfaces.
Laying photovoltaic panels on the water surface can reduce the evaporation of water [12], and the low temperature environment can improve the conversion efficiency of photovoltaic panels [13]. At present, photovoltaic conversion efficiency is one of the important factors restricting the increase of photovoltaic power generation, and the temperature of the photovoltaic panel directly determines the photovoltaic conversion efficiency. The surface temperature of the water body is lower than that of the land surface. The photovoltaic panel installed on the water surface can improve the photovoltaic conversion efficiency because of the cooling effect of the water body [14,15,16,17,18], thereby increasing the photovoltaic power generation. Not only limited to photovoltaic power generation, it can also combine the floating photovoltaic system on the water with the pumped storage system to achieve multiple benefits of the photovoltaic system. Liu et al. [19] proposed a novel integrated floating photovoltaic and pumped storage power system, and used genetic algorithm method to study the performance of the system under the dual constraints of the maximum benefits of electricity generation and the minimum energy imbalance. The research results show that the system has great potential for achieving both goals at the same time. In addition, the fish-lighting complementary photovoltaic power plant plays an important role in the aquaculture for solving the energy demand. Campana et al. [20] tested four alternatives to the electricity demand in shrimp farms of Thailand, and the floating tracking photovoltaic system of them showed higher competitiveness. However, the quantitative research on the complementary of renewable energy is still relatively weak. The concept of complementary is often mentioned, but there are few practical applications [21]. Fish-lighting complementary photovoltaic is a new application mode. Recently, the impact of the fish-lighting complementary photovoltaic power plant on water quality and fish is still unclear. Therefore, by designing different photovoltaic layout scenarios, this paper studies the impact of different photovoltaic layouts on water quality and fish, providing scientific basis and data support for the large-scale use of photovoltaics on the water surface and aquaculture.
2. Tests and Methods
2.1. Overview of the Test Area
The test was conducted at Nanjing Tongwei Aquatic Technology Company, which is located in Yingfang Village, Zhenjiang City, Jiangsu Province (32°18.1908′ N, 119°47.5116′ E). A total of five treatment groups are set for the simulation of photovoltaic panel laying, with two repeats for each group (Table 1). The size of the pond is 110 m × 205 m, surrounded by cement slopes, and the silt of the pond is 20 cm to 50 cm thick at the bottom. The water level around the pond is deep (about 2.3 m) and the middle water level is shallow (about 1.5 m).
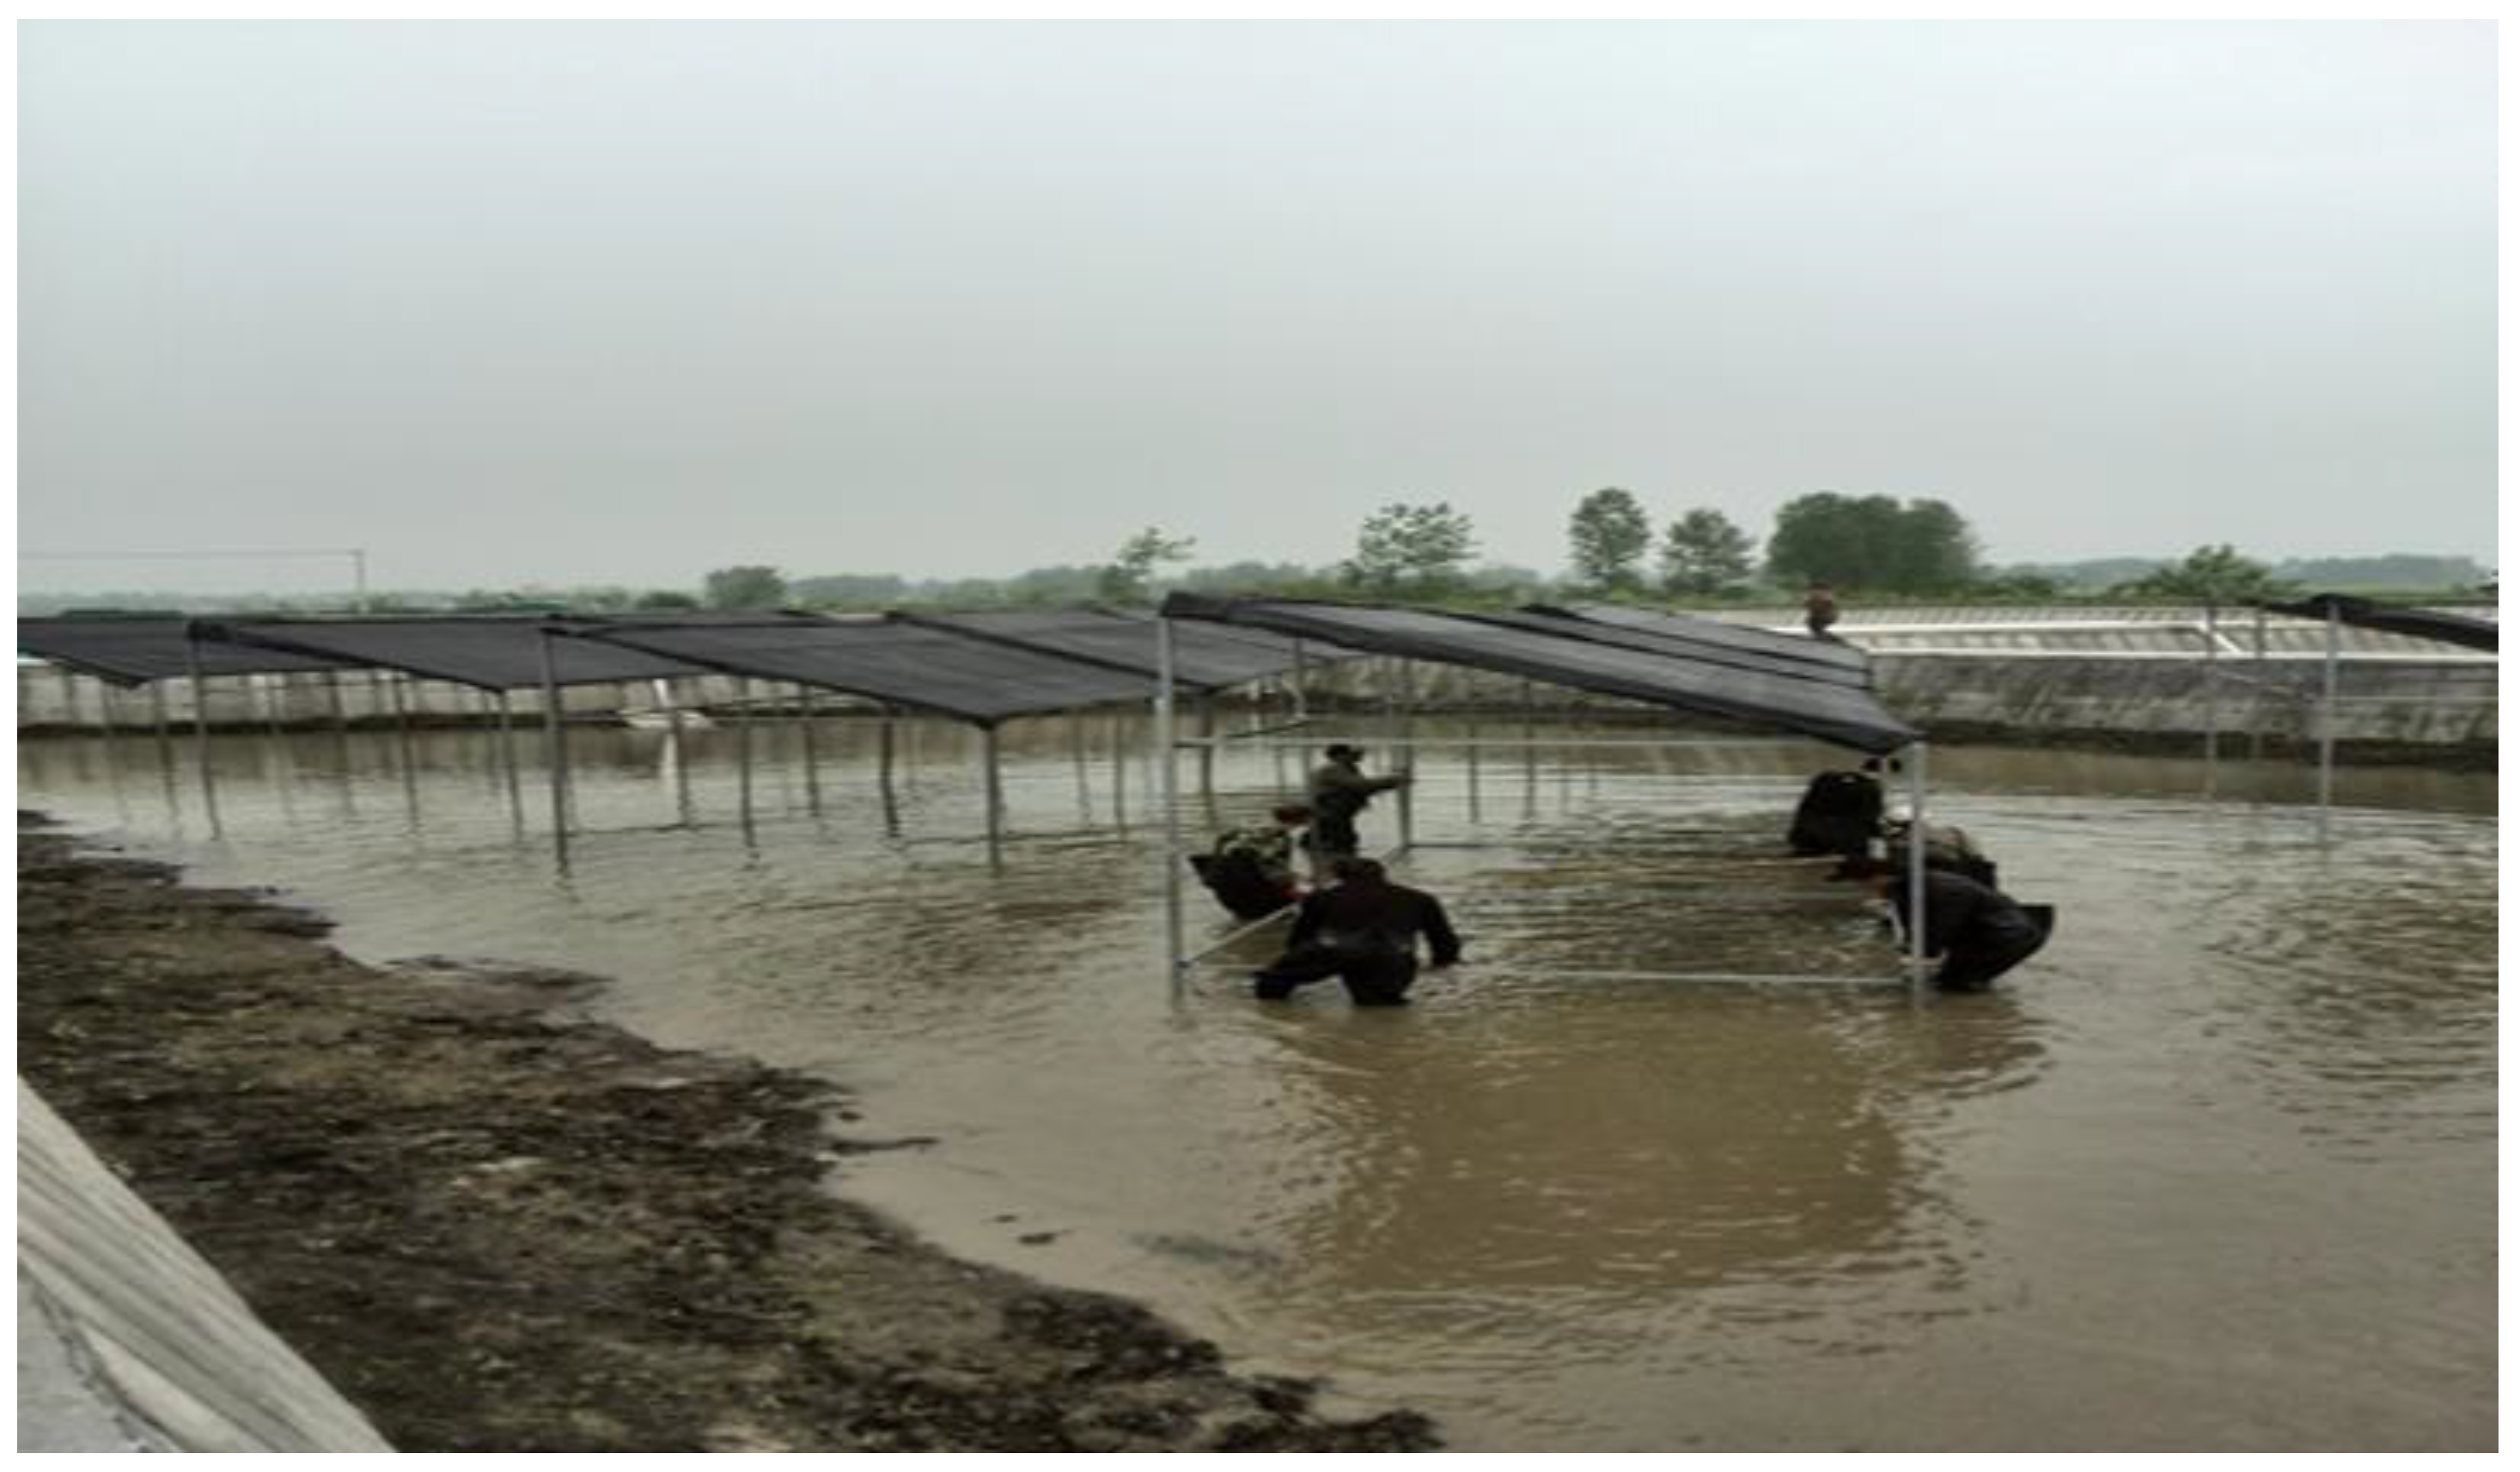
The photovoltaic shading simulation was installed in April 2019. Galvanized square tubes, shade nets, and other materials were used to simulate photovoltaic components, and the installation is shown in Figure 1. After the photovoltaic shading simulation installation was completed, the tilt angle and spacing were consistent with the layout of the solar photovoltaic modules. The tilt angle was 34.6°, the spacing was 2.75 m, and the shade net size was 0.99 m × 1.64 m. The test period was from April 2019 to October 2019. A barreled fishing net was arranged in the test area of each treatment group, and the edge of the fishing net was fixed with aluminum alloy with a diameter 2 m and a depth of 1 m to limit the range of fish movement in the test area to ensure the accuracy of data. Water quality indicators and algae populations were measured four times a month, on the 1st, 10th, 15th, and 25th of each month. The determination of Pelteobagrus fulvidraco also used the same time. Each time 50 fish were caught from the fishing net in the corresponding area, the population size of fish Qs estimated by the capture–mark–release–recapture method [22], a total of 3 times, and the average value taken to represent the weight of the fish in the corresponding area. The test fish species was Pelteobagrus fulvidraco, the water larvae that was reproduced in early September 2018, the stocking amount was 81,000 fish·acre−1, the specification was 22.8 g·tail−1, and the planned output was 6630 kg·acre−1. The test feed was no.8916 special puffed compound feed for Pelteobagrus fulvidraco produced by Suzhou Tongwei Special Feed Company. The crude protein was 40% and the particle size was 2.0 mm to 3.0 mm.
The data was sorted by Microsoft Excel 2013, the graphics and data analysis were performed using OriginPro 2021 (Learning Edition), and the hypothesis test was analyzed using one-sample t-test.
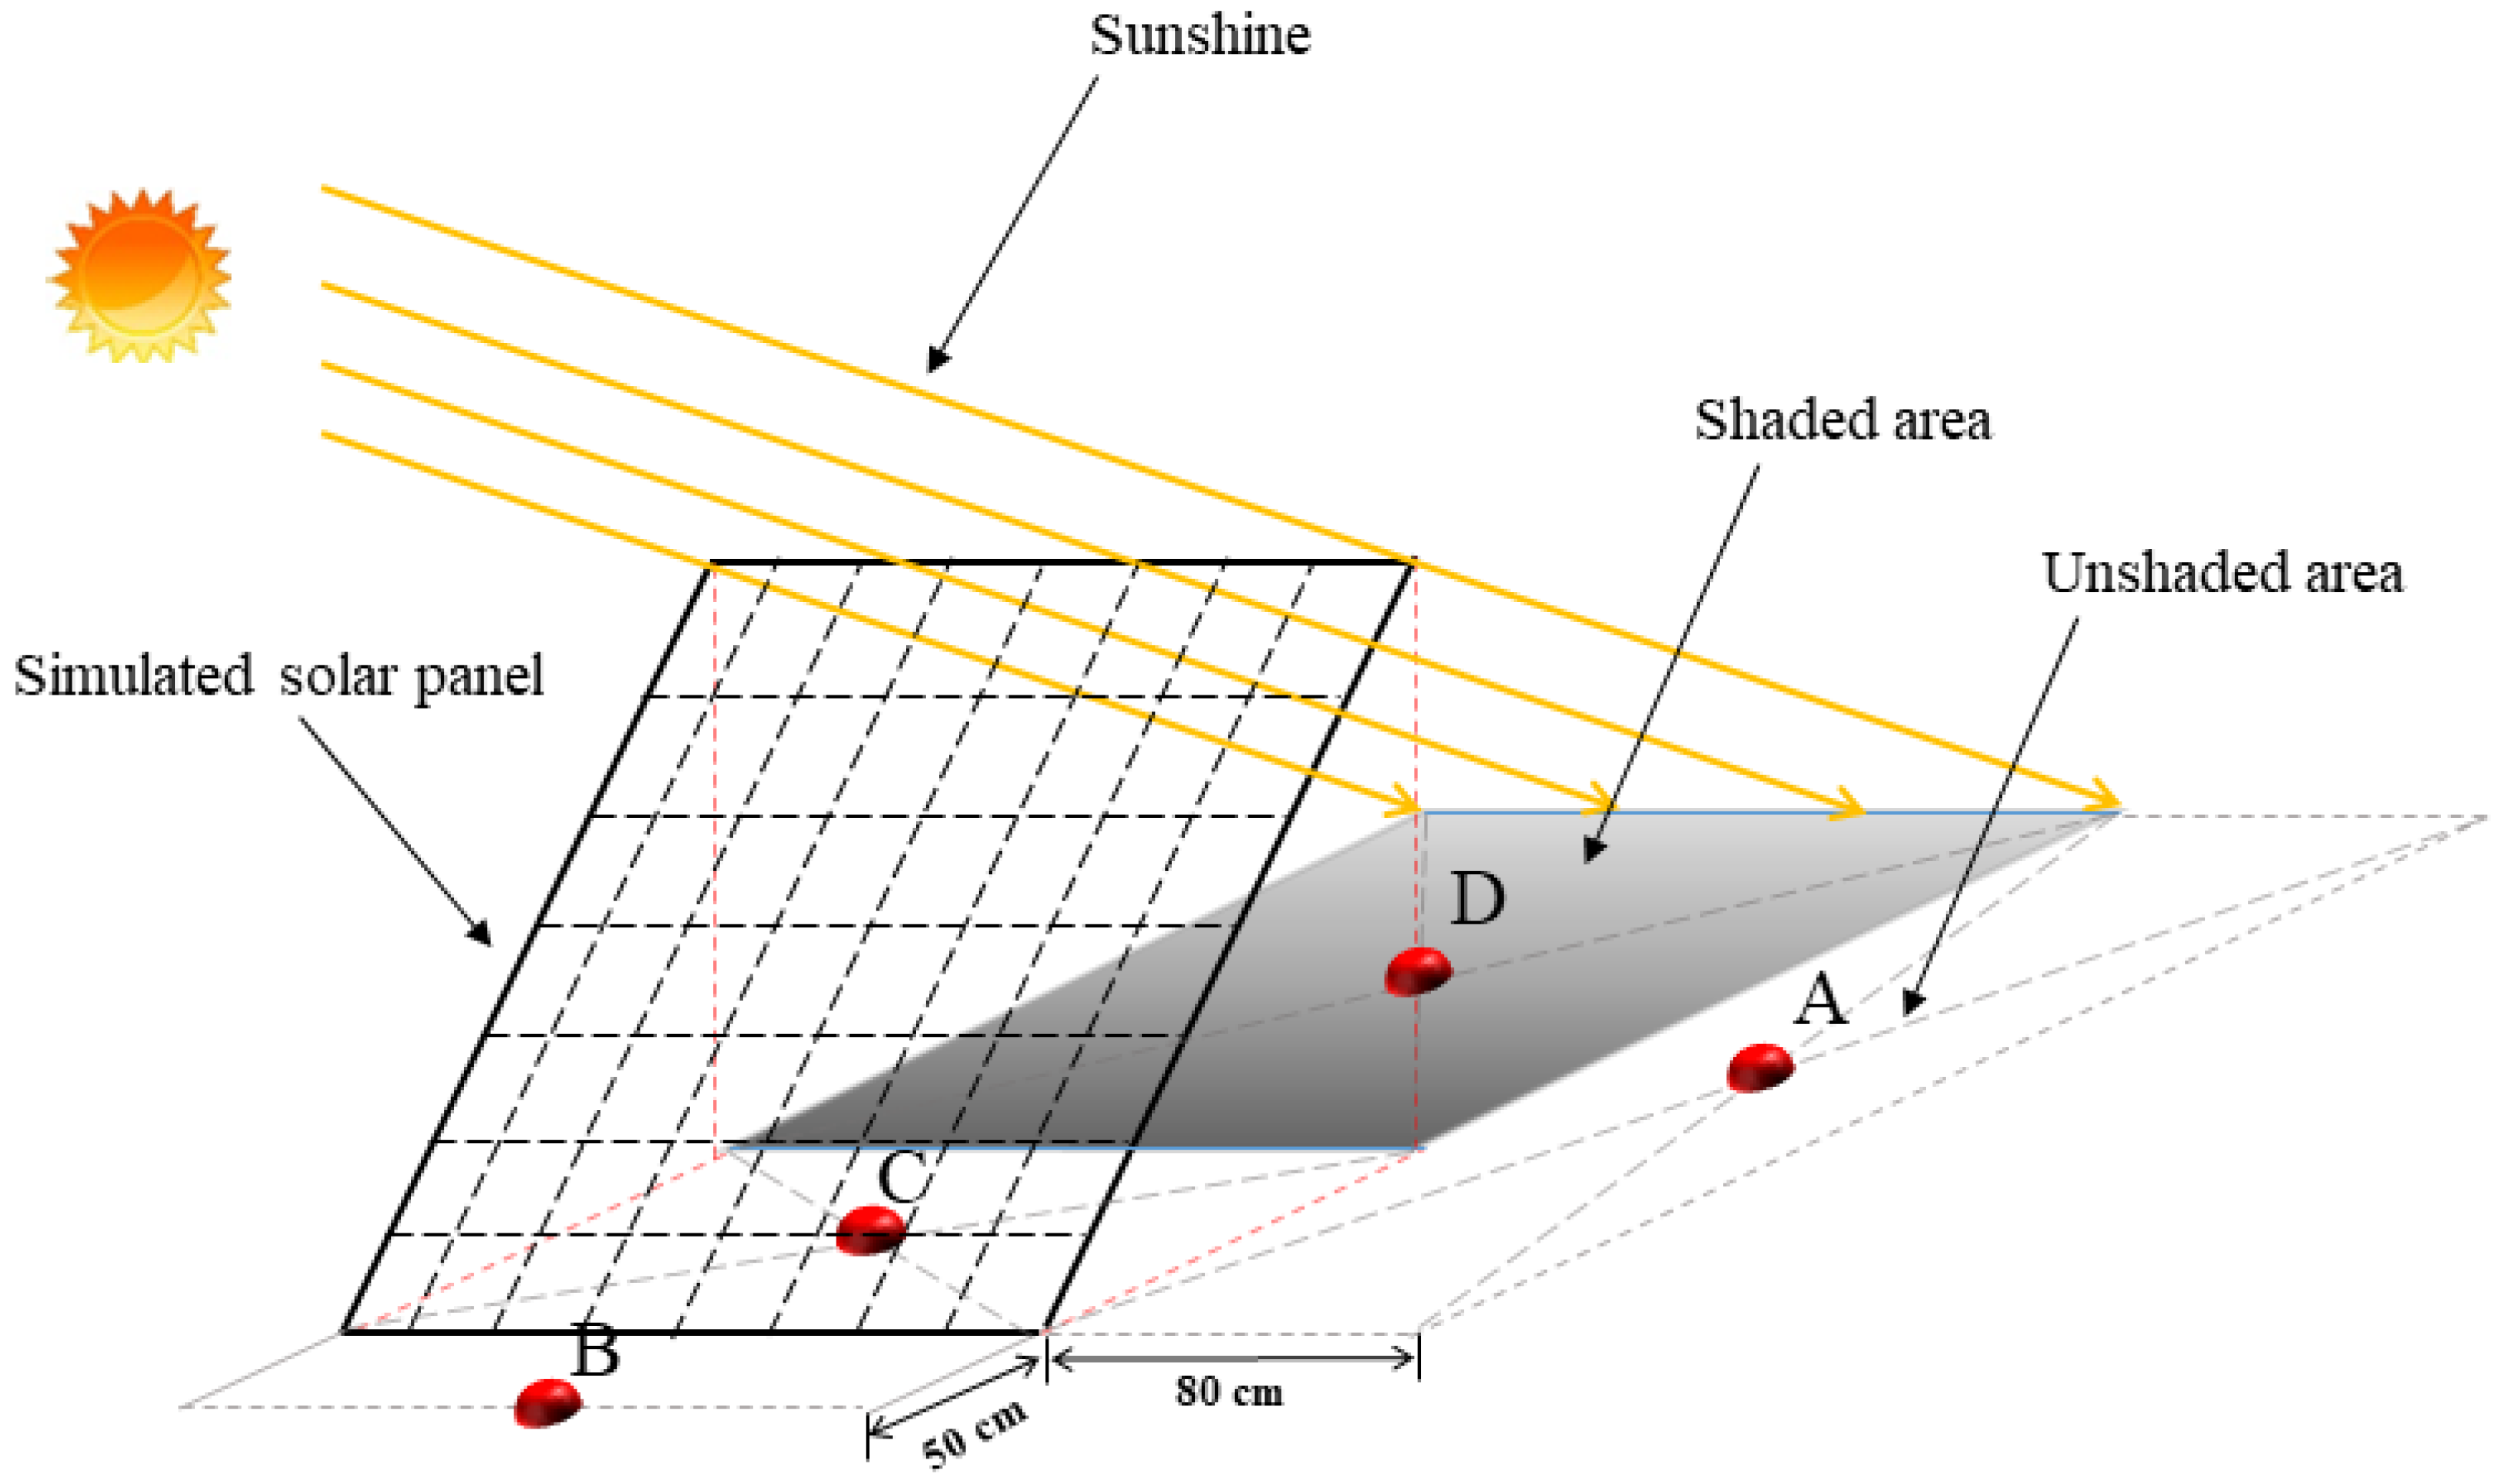
In order to study the influence of the cover shade net on the light intensity, four sampling points around the photovoltaic simulation device were selected to measure the light intensity. Point A is at unshaded place, point B is 50 cm from the edge of the photovoltaic simulation device, point C is under the photovoltaic simulation device center, and point D is under the shadow center. The schematic diagram of the arrangement of measurement points are shown in Figure 2. A total of five sample points were selected for the test simulation device, which were distributed among the four corners and the center of the pond. The four corners of the device are 20 m away from the edge of the pond.
2.2. Index Measurement Method
Water samples were collected using 500 mL polytetrafluoroethylene brown plastic bottles, and two bottles of water samples were collected from each sample point. Before each collection, the sampler was used to collect the water sample, and then the sample bottle was washed twice with the water sample to collect the water sample. After collecting all samples, we immediately put them in an incubator with ice cubes and returned them to the laboratory to measure the concentration of water components. Water temperature, pH, and dissolved oxygen were measured by Hach Water Quality Tester (HQ40d, Hach) on-site. The determination of ammonia nitrogen and nitrite nitrogen in water samples was based on Standard Methods for the Examination of Water and Wastewater (Version 4) [23]. For the concentration of active phosphorus, the water sample was first passed through a 0.45 μm organic filter membrane, and then the filtered water sample was continuously heated at 80 °C for 12 h to remove impurities and measured by a segmented continuous flow analyzer (Futura, France).
3. Result Analysis
3.1. Analysis of the Influence of Photovoltaic Layout on Light
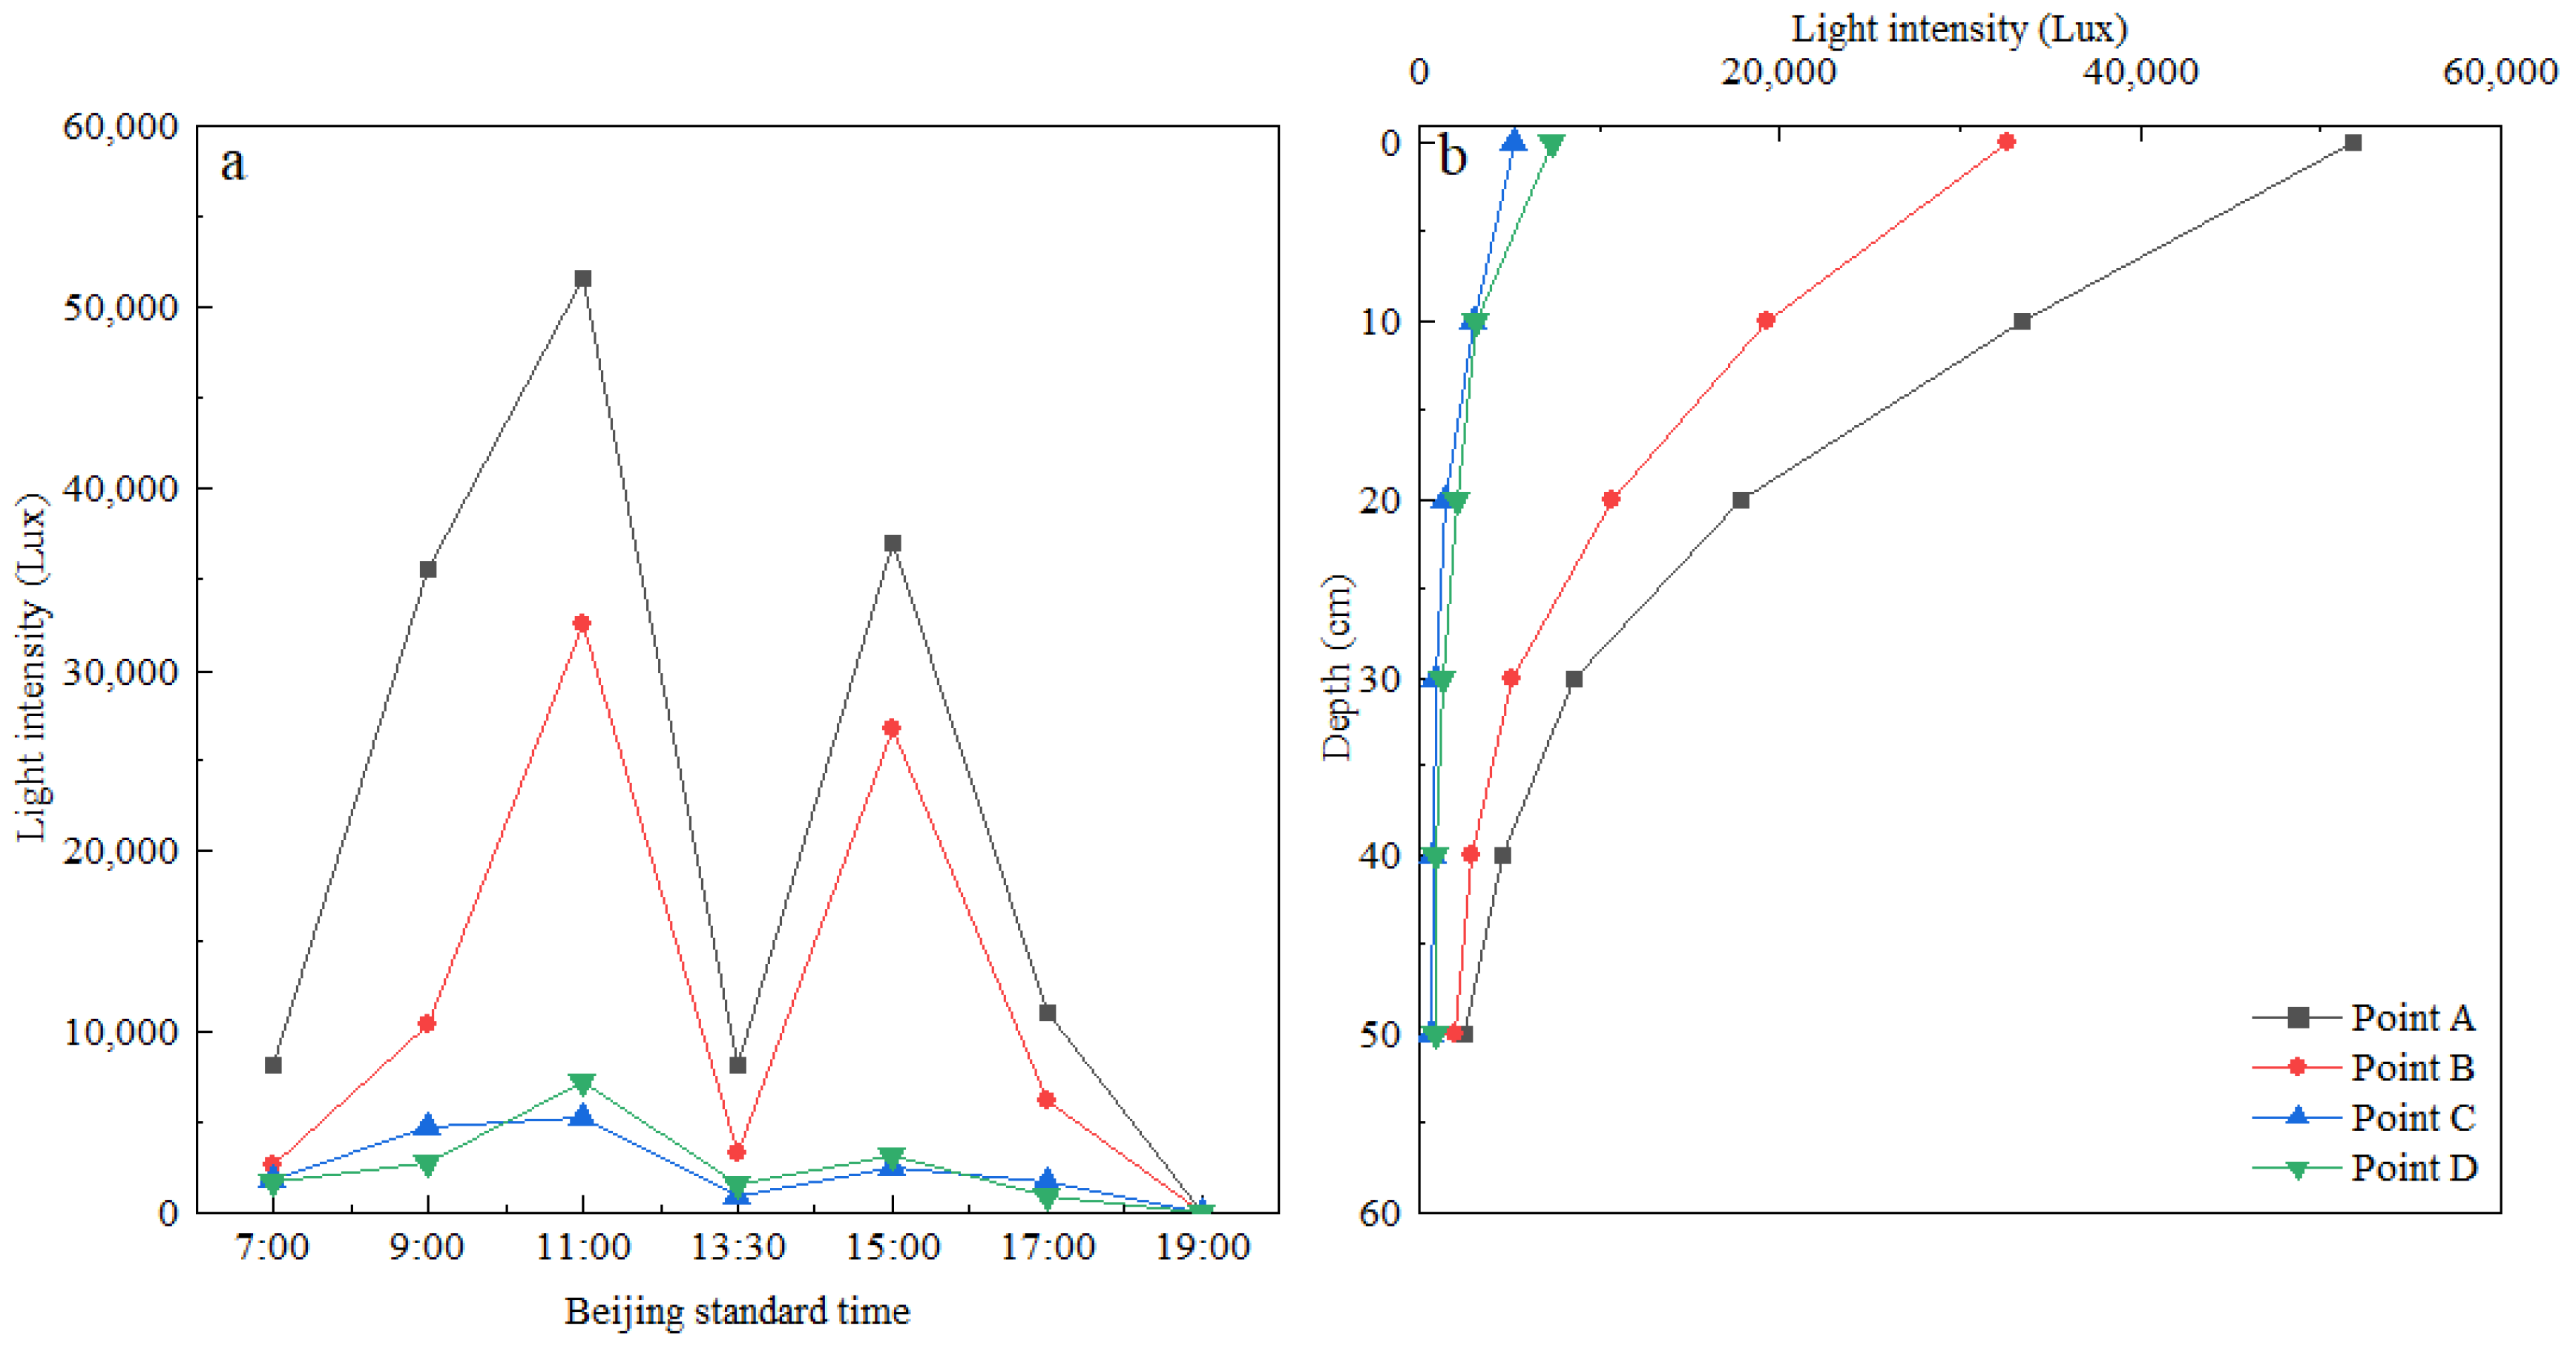
The effect of photovoltaic layout on light intensity is shown in Figure 3. As can be seen from Figure 3a, the diurnal variation of light intensity is generally characterized by a double peak type, with peaks appearing at 11 and 15 o’clock in Beijing, and the peaks of the four samples are consistent in time.
The average light intensity at point A, point B, point C, and point D were 21,663.3 Lux, 11,660.2 Lux, 2409.6 Lux and 2464.4 Lux, respectively. It can be seen that the light intensity showed a clear downward trend with the appearance of shadows, and the average decrease of points C and D relative to points A and B is 85.4%. From point A to point D, the peaks were 51,600 Lux, 32,600 Lux, 5230 Lux, and 7180 Lux at 11 o’clock in Beijing; the peaks were 37,000 Lux, 26,600 Lux, 2450 Lux, and 3090 Lux at 15 o’clock in Beijing. It can be seen that the light intensity at 11 o’clock in Beijing from point A to point D was greater than the light intensity at 15 o’clock in Beijing, and the appearance of peaks at 11 and 15 is consistent. From 7:00 to 19:00, the average light intensity from point A to point D decreases in the order of point A, point B, point D, and point C.
The change of light intensity with water depth is shown in Figure 3b. Overall, the light intensity shows a decreasing trend with the increase of water depth. From point A to point D, the light intensity changed significantly from 0 cm to 30 cm, and the light intensity below 30 cm was basically stable. Since point A and point B were in the unshaded area, the change in light intensity from 0 cm to 30 cm was significantly larger than that in point C and point D, which were in the shaded area, that is, the amount that the light intensity in the shaded area was affected by the water depth was small. The average light intensity of the unshaded area from 0 cm to 30 cm relative to the shaded area decreased by 86.3%. The average light intensity point A~point D from 0 cm to 50 cm is 19,800 Lux, 12,100 Lux, 2000 Lux, and 2625 Lux, respectively. Among them, the average light intensity of points C and D from 0 cm to 30 cm is 3075 Lux, and the average light intensity from 40 cm to 50 cm is 787.5 Lux; the average light intensity of points A and D is from 0 cm to 30 cm is 22,425 Lux, and the average light intensity at 40 cm to 50 cm is 3000 Lux. It can be seen that the influence of shading on the light intensity of 0 cm to 30 cm was much greater than that of water layers below 30 cm, namely, the effective range of shading on the light intensity of the water layer is 0 cm~30 cm.
3.2. Analysis of the Influence of Photovoltaic Layout on Water Quality
3.2.1. Relationship between Photovoltaic Installation Area and Water Temperature, Dissolved Oxygen and pH
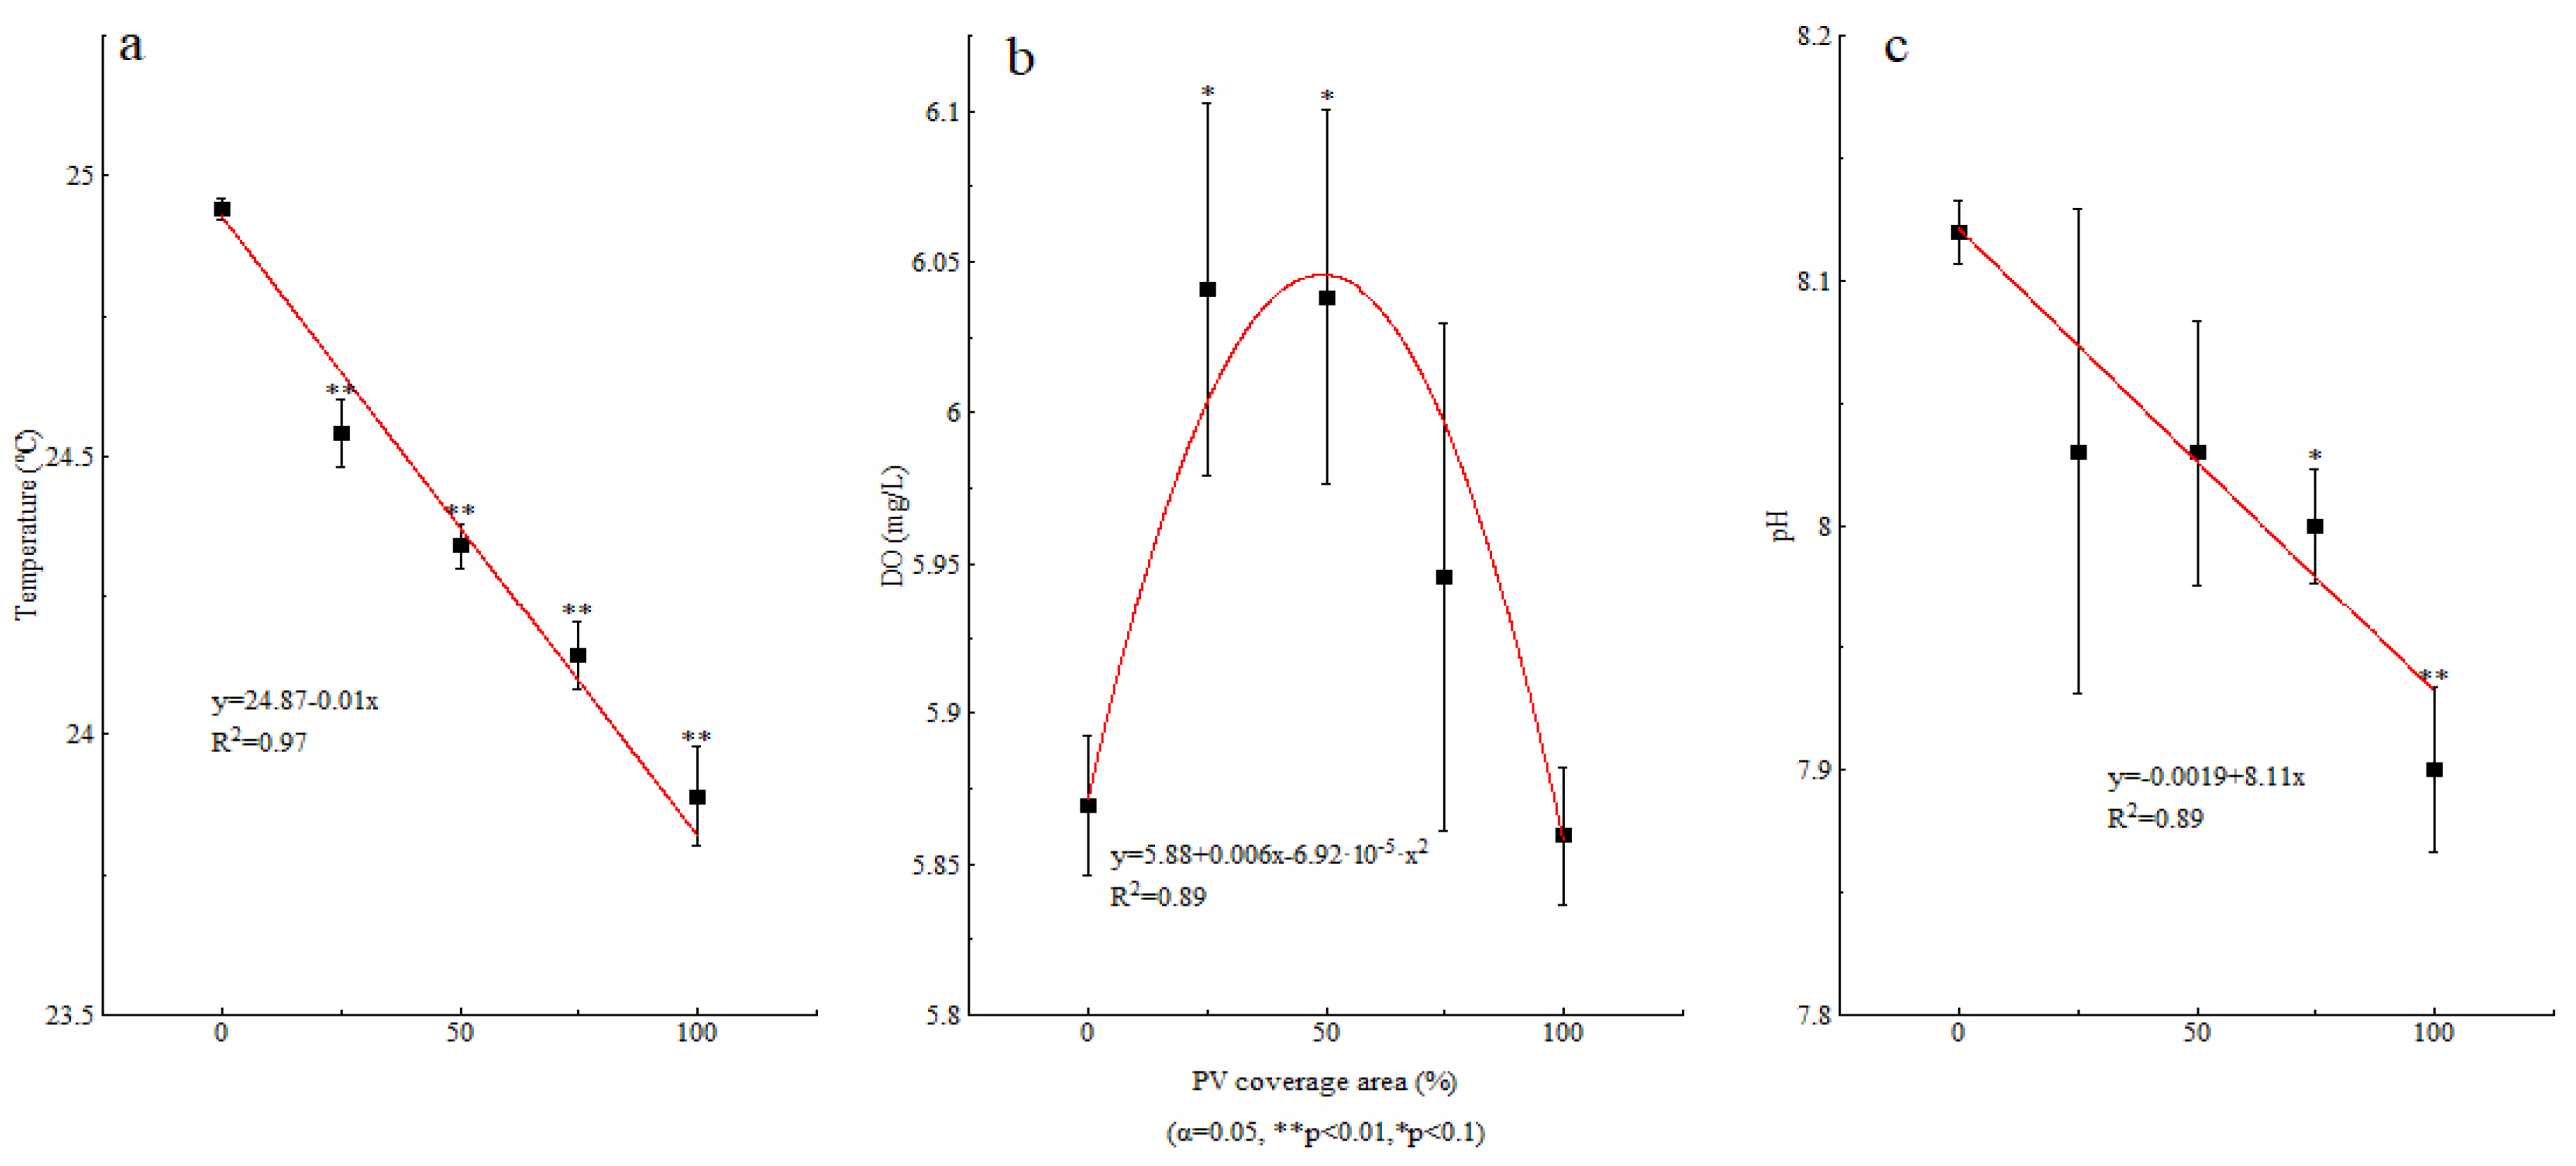
Water temperature (T), dissolved oxygen (DO), and pH are the key factors affecting the growth of aquatic plants and animals. The influence of the simulated photovoltaic power plant placed in the pond on this index is shown in Figure 4. In general, temperature and pH have a linear relationship with photovoltaic installation area, and dissolved oxygen has a parabolic relationship with photovoltaic installation area.
With the increase of photovoltaic installation area, the temperature of the pond decreased significantly. The temperature in the unshaded area was 24.9 °C, and the average temperature in the shaded area was 24.2 °C. Compared with the unshaded area, the temperature of the shaded area was reduced by 0.7 °C. It can be seen that the photovoltaic layout can significantly reduce the surface temperature of the water body, but the decrease is limited.
The relationship of the dissolved oxygen content of the water body and the photovoltaic layout area was an inverted U-shaped change characteristic. When the photovoltaic layout area was 50%, the dissolved oxygen content was the largest in the water body, which was 6.04 mg/L. When the area ratio of photovoltaic sheltered waters was between 0 and 50%, the amount of dissolved oxygen was increasing. With the further increase of the photovoltaic layout area, the dissolved oxygen content showed a significant decreasing trend, because the dissolved oxygen was closely related to the temperature of the water body and the air velocity of the water surface. When the photovoltaic installation area increased, it affected the air mobility of the surface of the water body. On the other hand, the increased photovoltaic installation increased the shading effect, which also caused the temperature of the water body to decrease, but the overall performance was the decrease of the dissolved oxygen content in the water body. Among them, the dissolved oxygen content of the 25%, 50%, and 75% shading test group was higher than that of the non-shading test group, indicating that proper shading does not affect the normal content of dissolved oxygen in the pond.
With the increase of the photovoltaic layout area, the pH value of the water body generally showed a decreasing trend. Among them, the pH value of the unshaded area is the largest at 8.1 and it is the smallest at 7.9 in the completely shaded area. When the proportion of photovoltaic installation area is 25–75%, the pH value of the water body was basically stable, with an average value of 8.0. It can be seen that the photovoltaic layout did not cause large fluctuations in the pH of the water body. The pH range of the entire test group was within the pH range that was most suitable for fish survival, and will not affect the growth of fish.
3.2.2. Influence of Photovoltaic Layout Area on the Content of Nitrogen and Phosphorus in Water
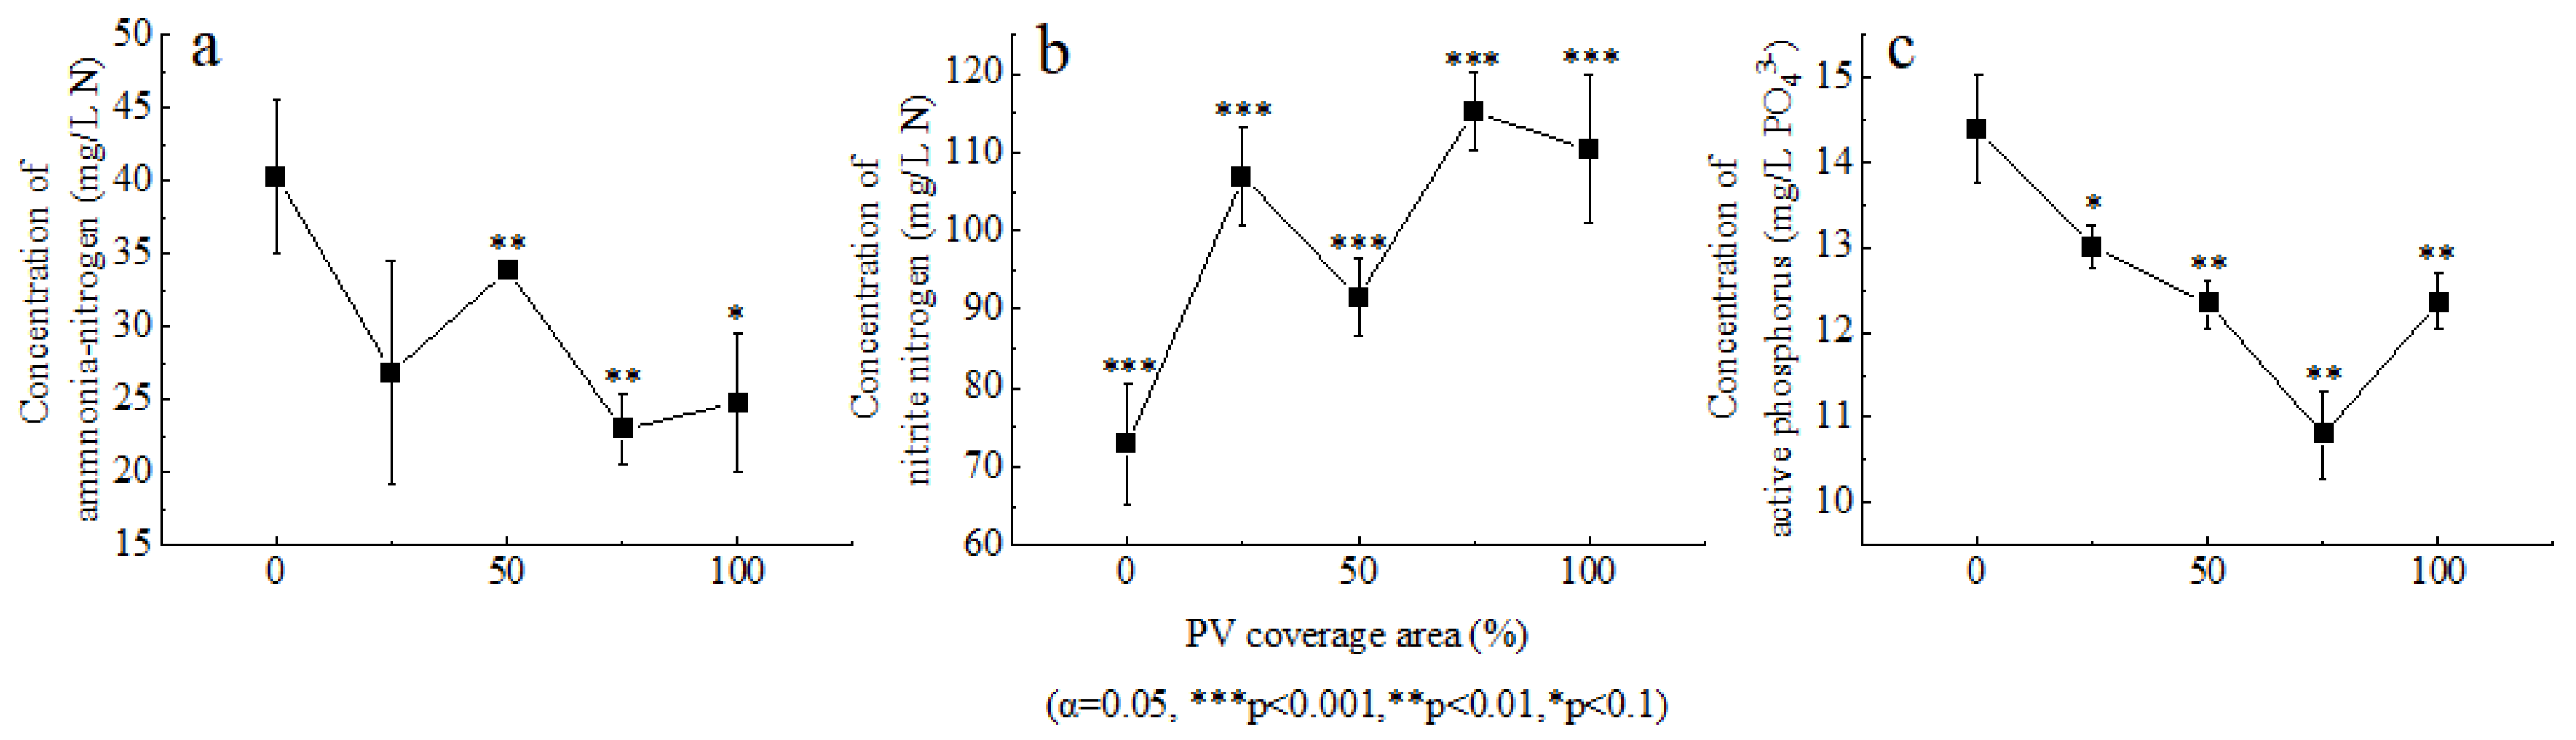
The nutrient content of nitrogen and phosphorus in the water body plays an important role in the stability of the water body ecology. Too much content will cause eutrophication of the water body and cause water pollution. The variation characteristics of ammonia nitrogen, nitrite nitrogen, and active phosphorus in the water body with the photovoltaic layout area are shown in Figure 5. On the whole, ammonia nitrogen, nitrite nitrogen, and active phosphorus have no obvious changes, but show the characteristics of jagged fluctuations.
The average contents of ammonia nitrogen, nitrite nitrogen, and active phosphorus were 29.72 mg/L, 99.35 mg/L and 12.58 mg/L, respectively. The ammonia nitrogen content in the unshaded area was the highest at 40.25 mg/L. When the shaded area ratio was 75%, the ammonia nitrogen content was the lowest at 22.91 mg/L. In general, photovoltaic shading caused a decrease in the ammonia nitrogen content in water. The change of nitrite nitrogen was opposite to the change of ammonia nitrogen. The content of nitrite nitrogen increased with the change of photovoltaic shading ratio. When the shading area ratio was 75%, the content of nitrite nitrogen was the largest at 115.15 mg/L. Compared with the unshaded area, the average content of nitrite nitrogen in the shaded area increased by 45.5%. The content of active phosphorus was the lowest when the proportion of shading area reaches 75%, which was 10.80 mg/L; the content of active phosphorus in the water body of the unshaded area was 14.39 mg/L, it can be seen that the shading effect formed by photovoltaic layout can reduce active phosphorus content in water body.
3.3. Analysis of the Influence of Photovoltaic Layout on Phytoplankton and Fish
The effect of shading formed by photovoltaic layout on phytoplankton in water is shown in Figure 6a. Overall, the changing characteristics of phytoplankton in water bodies under different shading ratios did not show consistency. Among them, when the shading ratio was 50%, although the number of algae species was large, algae density and biomass were very low, indicating that the shading ratio has an inhibitory effect on the growth of phytoplankton. The number of algae species was maximum when the shading ratio was 75%, up to 15.9 × 10⁴ individuals/mL. When the photovoltaic shading ratio was 25%, the algae density was the largest, but the biomass was not the largest, indicating that the algae cells were small. The algal biomass was the largest when the photovoltaic shading ratio was 75%, and it was the lowest when the photovoltaic shading ratio was 50%. When the photovoltaic shading ratio reached 100%, the algal biomass was at an intermediate level. Therefore, different photovoltaic shading ratios will affect the number, density, and biomass of algae. When the photovoltaic shading ratio was 75%, the productivity of algae was the highest. The impact on fish is shown in Figure 6b. The fish production in the unshaded area was 8007.6 kg·acre−1, and the average fish production in the shaded area was 7841.4 kg·acre−1. When the photovoltaic shading ratio was 75%, the fish production was the highest at 8094.6 kg·acre−1. Therefore, the shading effect of photovoltaic installation will not affect the growth of fish, and proper shading measures will increase fish production. Among them, when the photovoltaic shading ratio was 75%, it was the optimal photovoltaic layout choice.
4. Conclusions and Discussion
The diurnal variation of light intensity is characterized by a double peak, with peaks at 11 o’clock and 15 o’clock Beijing time, and the peak value at 11 o’clock is the largest. The average light intensity in the unshaded area was 16,661.7 Lux, the average light intensity in the shaded area was 2437.0 Lux, and the light intensity in the shaded area was 85.4% lower than the average light intensity in the unshaded area. The light intensity decreased with the depth of the water. The light intensity of the 30 cm water layer was basically stable, the effective range of shading for the light intensity of the water layer was 0 cm~30 cm. Studies have shown that the behavior of fish is closely related to the light cycle, and artificial interference with natural light intensity will adversely affect fish [18], and artificial lighting at night (i.e., street lights, transportation networks, and industrial lighting) affects fish reproduction, community structure, and movement in nocturnal fish [24,25,26]. Structural changes that also occur by limiting natural light penetration can also alter the behavior of active fish around the clock [27]. Therefore, the sensitivity of fish to light intensity is one of the important influencing factors to be considered for fish farming in fish-lighting complementary photovoltaic power stations.
With the increase in the proportion of photovoltaic installations, the temperature and pH in the water showed a linear decreasing trend, and dissolved oxygen showed an inverted U-shaped change characteristic, but this effect was limited. The temperature and pH of shaded areas decreased by 0.7 °C and 0.1 respectively compared to unshaded areas. When the shaded ratio was between 25% and 75%, the dissolved oxygen content in the water increased by an average of 2.37% compared to unshaded areas, indicating that the suitable proportion of photovoltaic deployment does not affect the normal dissolved oxygen level in the water body. The content of ammonia nitrogen and active phosphorus in the water body was the lowest when the proportion of shading area was 75%, respectively 22.91 mg/L and 10.80 mg/L; the content of nitrite nitrogen was the highest at this shading ratio, 115.15 mg/L.
The variation characteristics of phytoplankton in the water body under different shading ratios did not show consistency. When the proportion of the shading area reached 75%, the number of algae species and algal biomass is the largest, and the fish production was the highest at 8094.6 kg·acre−1. The increase in algae will accelerate the photosynthesis in the water body, provide more oxygen to the respiration of fish, and also absorb impurities with improving the quality of the water environment. However, the dissolved oxygen in the water body was not the largest at this time, because the dissolved oxygen content was also related to environmental factors such as water temperature and wind speed. Compared with the unshaded area, the average fish production in the shaded area was increased by 166.2 kg·acre−1. It can be seen that the photovoltaic layout will not affect the growth of fish. The photovoltaic layout ratio of 75% is the best layout choice.
Author Contributions
Conceptualization, P.L. and X.G.; methodology, X.G.; software, P.L. and J.J.; validation, L.Y., P.L. and J.J.; formal analysis, Y.L.; investigation, Y.L.; resources, X.G.; data curation, J.J; writing—original draft preparation, P.L.; writing—review and editing, P.L.; visualization, P.L. and Y.L.; supervision, X.G.; project administration, X.G.; funding acquisition, X.G. and L.Y. All authors have read and agreed to the published version of the manuscript.
Funding
This research was funded by the National Key R&D Program of China (2018YFB1502800) and the National Natural Science Foundation of China (No. 41805085).
Acknowledgments
We thank the three anonymous reviewers for feedback that improved this study. We thank Nanjing Tongwei Aquatic Technology Company for their cooperation on and support of this project.
Conflicts of Interest
The authors declare no conflict of interest.
References
- Valipour, M. Comparison of Surface Irrigation Simulation Models: Full Hydrodynamic, Zero Inertia, Kinematic Wave. J. Agric. Sci. 2012, 4, 68–74. [Google Scholar] [CrossRef]
- Yannopoulos, S.I.; Lyberatos, G.; Theodossiou, N.; Li, W.; Valipour, M.; Tamburrino, A.; Angelakis, A.N. Evolution of Water Lifting Devices (Pumps) over the Centuries Worldwide. Water 2015, 7, 5031–5060. [Google Scholar] [CrossRef] [Green Version]
- Zou, H.Y.; Du, H.B.; Ren, J.Z.; Sovacool, B.K.; Zhang, Y.J.; Mao, G.Z. Market dynamics, innovation, and transition in China’s solar photovoltaic (PV) industry: A critical review. Renew. Sustain. Energy Rev. 2017, 69, 197–206. [Google Scholar] [CrossRef] [Green Version]
- Nugent, D.; Sovacool, B.K. Assessing the lifecycle greenhouse gas emissions from solar PV and wind energy: A critical meta-survey. Energy Policy 2014, 65, 229–244. [Google Scholar] [CrossRef]
- Li, S.; Weigand, J.; Ganguly, S. The Potential for Climate Impacts from Widespread Deployment of Utility-Scale Solar Energy Installations: An Environmental Remote Sensing Perspective. J. Remote Sens. GIS 2017, 2, 6. [Google Scholar] [CrossRef]
- Fraunhofer, I. Levelized Cost of Electricity: Renewable Energy Technologies Study; Fraunhofer Institute for Solar Energy Systems ISE: Freiburg, Germany, 2013. [Google Scholar]
- Demirbas, A. Global Renewable Energy Projections. Energy Sources Part B Econ. Plan. Policy 2009, 4, 212–224. [Google Scholar] [CrossRef]
- Wu, W.; Yue, S.; Zhou, X.; Guo, M.; Wang, J.; Ren, L.; Yuan, B. Observational Study on the Impact of Large-Scale Photovoltaic Development in Deserts on Local Air Temperature and Humidity. Sustainability 2020, 12, 3403. [Google Scholar] [CrossRef] [Green Version]
- Armstrong, A.; Ostle, N.J.; Whitaker, J. Solar park microclimate and vegetation management effects on grassland carbon cycling. Environ. Res. Lett. 2016, 11, 074016. [Google Scholar] [CrossRef] [Green Version]
- Tian, W.; Wang, Y.; Xie, Y.; Wu, D.; Zhu, L.; Ren, J. Effect of building integrated photovoltaics on microclimate of urban canopy layer. Build. Environ. 2007, 42, 1891–1901. [Google Scholar] [CrossRef]
- Scherba, A. Modeling the Impact of Roof Reflectivity, Integrated Photovoltaic Panels and Green Roof Systems on the Summertime Heat Island. Master’s Thesis, Portland State University, Portland, Oregon, 2011. [Google Scholar] [CrossRef]
- Trapani, K.; Redon Santafe, M. A review of floating photovoltaic installations: 2007–2013. Prog. Photovolt. 2015, 23, 524–532. [Google Scholar] [CrossRef] [Green Version]
- Bahaidarah, H.; Subhan, A.; Gandhidasan, P.; Rehman, S. Performance evaluation of a PV (photovoltaic) module by back surface water cooling for hot climatic conditions. Energy 2013, 59, 445–453. [Google Scholar] [CrossRef]
- Sahu, A.; Yadav, N.; Sudhakar, K. Floating photovoltaic power plant: A review. Renew. Sustain. Energy Rev. 2016, 66, 815–824. [Google Scholar] [CrossRef]
- Dash, P.; Gupta, N. Effect of temperature on power output from different commercially available photovoltaic modules. Int. J. Eng. Res. Appl. 2015, 5, 148–151. [Google Scholar]
- Gotmare, J.A.; Prayagi, S. Enhancing the performance of photovoltaic panels by stationary cooling. Int. J. Sci. Eng. Technol. 2014, 2, 1465–1468. [Google Scholar]
- Fesharaki, V.J.; Dehghani, M.; Fesharaki, J.J.; Tavasoli, H. The Effect of Temperature on Photovoltaic Cell Efficiency. In Proceedings of the 1st International Conference on Emerging Trends in Energy Conservation–ETEC, Tehran, Iran, 20–21 November 2011; pp. 20–21. [Google Scholar]
- Baskar, D. Efficiency improvement on photovoltaic water pumping system by automatic water spraying over photovoltaic cells. Middle-East J. Sci. Res. 2014, 19, 1127–1131. [Google Scholar]
- Liu, L.Y.; Sun, Q.E.; Li, H.L.; Yin, H.Y.; Ren, X.H.; Wennersten, R. Evaluating the benefits of integrating floating photovoltaic and pumped storage power system. Energy Convers. Manag. 2019, 194, 173–185. [Google Scholar] [CrossRef]
- Campana, P.E.; Wästhage, L.; Nookuea, W.; Tan, Y.T.; Yan, J.Y. Optimization and assessment of floating and floating-tracking PV systems integrated in on- and off-grid hybrid energy systems. Sol. Energy 2019, 177, 782–795. [Google Scholar] [CrossRef]
- Jurasz, J.; Canales, F.A.; Kies, A.; Guezgouz, M.; Beluco, A. A review on the complementarity of renewable energy sources: Concept, metrics, application and future research directions. Sol. Energy 2020, 195, 703–724. [Google Scholar] [CrossRef]
- Kingsnorth, C.; Cruickshank, C.; Paterson, D.; Diston, S. Caught ya! A school-based practical activity to evaluate the capture-mark-release-recapture method. School Sci. Rev. 2017, 98, 25–30. [Google Scholar]
- China, M. Standard Methods for the Examination of Water and Wastewater (Version 4); China Environmental Science Press: Beijing, China, 2002. [Google Scholar]
- Becker, A.; Whitfield, A.K.; Cowley, P.D.; Jarnegren, J.; Naesje, T.F. Potential effects of artificial light associated with anthropogenic infrastructure on the abundance and foraging behaviour of estuary-associated fishes. J. Appl. Ecol. 2013, 50, 43–50. [Google Scholar] [CrossRef]
- Riley, W.D.; Bendall, B.; Ives, M.J.; Edmonds, N.J.; Maxwell, D.L. Street lighting disrupts the diel migratory pattern of wild Atlantic salmon, Salmo salar L. smolts leaving their natal stream. Aquaculture 2012, 330, 74–81. [Google Scholar] [CrossRef]
- Ryer, C.H.; Stoner, A.W.; Iseri, P.J.; Spencer, M.L. Effects of simulated underwater vehicle lighting on fish behavior. Mar. Ecol. Prog. Ser. 2009, 391, 97–106. [Google Scholar] [CrossRef] [Green Version]
- Jones, M.J.; Baumgartner, L.J.; Zampatti, B.P.; Beyer, K. Low light inhibits native fish movement through a vertical-slot fishway: Implications for engineering design. Fish. Manag. Ecol. 2017, 24, 177–185. [Google Scholar] [CrossRef]
Figure 1.
Install scene of photovoltaic shading simulation device.

Figure 2.
Schematic diagram of the arrangement of measurement points for the influence of photovoltaic simulation devices on the light intensity.
Figure 2.
Schematic diagram of the arrangement of measurement points for the influence of photovoltaic simulation devices on the light intensity.

Figure 3.
Characteristic curves of light intensity change in different positions and water layers. (a) Daily change of light intensity at different sampling points, (b) Variation of light intensity at different sampling points with water depth.
Figure 3.
Characteristic curves of light intensity change in different positions and water layers. (a) Daily change of light intensity at different sampling points, (b) Variation of light intensity at different sampling points with water depth.

Figure 4.
Relationship between PV coverage area and water temperature, dissolved oxygen and pH. (a) Temperature changes under different PV coverage area, (b) Dissolved oxygen changes under different PV coverage area, (c) pH changes under different PV coverage area.
Figure 4.
Relationship between PV coverage area and water temperature, dissolved oxygen and pH. (a) Temperature changes under different PV coverage area, (b) Dissolved oxygen changes under different PV coverage area, (c) pH changes under different PV coverage area.

Figure 5.
Effect of PV coverage area on the concentration of nitrogen and phosphorus. (a) Concentration of ammonia-nitrogen changes under different PV coverage area, (b) Concentration of nitrite nitrogen changes under different PV coverage area, (c) Concentration of active phosphorus changes under different PV coverage area.

Figure 6.
Impact of photovoltaic coverage area on phytoplankton and fish. (a) Changes in algal species and algal density and algal biomass under different PV coverage area, (b) Changes of Pelteobagrus fulvidraco production under different PV coverage area.
Figure 6.
Impact of photovoltaic coverage area on phytoplankton and fish. (a) Changes in algal species and algal density and algal biomass under different PV coverage area, (b) Changes of Pelteobagrus fulvidraco production under different PV coverage area.


Table 1.
The layout ratio table of photovoltaic stimulation panel.
| Group Number | The Proportion of Photovoltaic Modules Covering Pond Area |
|---|---|
| Control group | 0% |
| Treatment group 1 | 25% |
| Treatment group 2 | 50% |
| Treatment group 3 | 75% |
| Treatment group 4 | 100% |
© 2020 by the authors. Licensee MDPI, Basel, Switzerland. This article is an open access article distributed under the terms and conditions of the Creative Commons Attribution (CC BY) license (http://creativecommons.org/licenses/by/4.0/).
Share and Cite
MDPI and ACS Style
Li, P.; Gao, X.; Jiang, J.; Yang, L.; Li, Y. Characteristic Analysis of Water Quality Variation and Fish Impact Study of Fish-Lighting Complementary Photovoltaic Power Station. Energies 2020, 13, 4822. https://doi.org/10.3390/en13184822
AMA Style
Li P, Gao X, Jiang J, Yang L, Li Y. Characteristic Analysis of Water Quality Variation and Fish Impact Study of Fish-Lighting Complementary Photovoltaic Power Station. Energies. 2020; 13(18):4822. https://doi.org/10.3390/en13184822
Chicago/Turabian StyleLi, Peidu, Xiaoqing Gao, Junxia Jiang, Liwei Yang, and Yujie Li. 2020. "Characteristic Analysis of Water Quality Variation and Fish Impact Study of Fish-Lighting Complementary Photovoltaic Power Station" Energies 13, no. 18: 4822. https://doi.org/10.3390/en13184822
Note that from the first issue of 2016, this journal uses article numbers instead of page numbers. See further details here.