The Design and Test for Degradation of Energy Density of a Silica Gel-Based Energy Storage System Using Low Grade Heat for Desorption Phase


Department of Power Equipment, Faculty of Mechanical Engineering, Technical University of Liberec, 461 17 Liberec, Czech Republic
*
Author to whom correspondence should be addressed.
Energies 2020, 13(17), 4513; https://doi.org/10.3390/en13174513
Submission received: 4 August 2020
/
Revised: 24 August 2020
/
Accepted: 26 August 2020
/
Published: 1 September 2020
(This article belongs to the Special Issue Development in Thermochemical Energy Storage)
Abstract
:This paper presents the design and a short cycle repeatability test of a silica gel-based thermal energy storage system using low grade heat for the desorption phase. The system was designed to test the degradation in the energy storage density of the adsorbent material for a 2 h working period in a short number of cycles (5 cycles). Low grade heat of 70 °C is used for regeneration during the desorption phase in each cycle. It was found that a reduction of 1.6 W/kg per each cycle of energy storage was observed, up to 5 cycles. The maximal heat storage density was 292 kJ/kg at the first cycle and reduced to 225 kJ/kg at the fifth cycle. Furthermore, the total amount of water vapor adsorbed in the silica gel was observed as well. The test of energy storage was performed under a short time period (maximal approx. 165 min).
1. Introduction
The current demands on energy conservation, taking into consideration the pollution of the environment resulting from significant emissions of greenhouse gases, have led to studies involving the utilization of alternative energy sources. Primary energy demand is predicted to rise by 50% by 2050 with high exploitation of fossil fuels [1,2]. Due to the depletion and harmful impacts of fossil fuels on the environment, more focus is placed specifically on renewables and the technologies used in energy extraction and recycling to produce effective and zero emission energy systems [1]. Renewable energies share a small percentage in the used total energy mix due to challenges encountered in the extraction, storage, as well as the conversion to other energy forms. Owing to this, a demand for efficient energy storage system development is greatly considered to control the losses occurring during conversions. One of the major energy forms of focus involves thermal energy storage (TES) systems, with interest in their charging and discharging cycles.
A myriad of research in TES systems has been done with the development of highly efficient technologies for applications in power generation, and heating and cooling systems for buildings and industries. Moreover, TES systems combined with solar power plants have become increasingly relevant in order to store solar heat for electricity for a full 24 h operation [3,4]. These technologies present an advantage of increased overall efficiency, reliability and minimal pollution to the environment. The downside to these systems is mainly due to cost and degradation of the storage material and system. Of these systems, latent heat and sensible heat systems have made it to the stage of commercial availability, while sorption and chemical energy storage systems still remain in the prototype phase [4].
Sorption energy is a branch of energy storage that embodies both absorption and adsorption. The process involved in the sorption system is usually an exothermic reaction and the energy dissipated is the useful energy obtained. The sorption system can either be opened or closed, where the opened system is usually designed as a desiccant system and the closed system is designed for adsorption or absorption systems [5]. The process involves basically two steps, the adsorption and the desorption phases. During the adsorption phase, humid air at a given temperature and relative humidity interacts with the surface of the adsorbent. Based on certain parameters such as the adsorbate/adsorbent working pair, the wettability of the adsorbate, adsorbent porosity, adsorbent size, pore size distribution and the surface area of the adsorbent, a specified amount of energy is released [6]. During the desorption phase, high temperature is used to charge the system by trying to return it to its original state. Thus, water vapor is released from the system. Depending on the available temperature for charging, the sorption material may need an external source of energy for complete regeneration. For this reason, a regeneration phase may be needed.
The adsorption material goes further to be the core of the sorption system in most energy storage systems. Moreover, the cost, efficiency and the repeatability, toxicity, thermal stability and environmental friendliness of the adsorbent material affects the commercialization of the system [6,7]. Adsorbent materials are usually grouped into chemical, physical and composite adsorbents. The chemical adsorbents work with a mechanism of valence force interaction between the adsorbent and the adsorbate working pair [8]. This is one major reason why chemical adsorbents have much more efficient adsorption kinetics than physical adsorbents [9]. The major drawback of these kinds of adsorbents is stability, agglomeration and swelling which ends up impeding the heat and mass transfer performance of the sorption system [10]. It makes it difficult to implement chemical adsorbents where cycle efficiency and repeatability is a big priority. Physical adsorbents are the most used and researched adsorbents for sorption energy storage, although their performance in terms of energy density and thermal power delivered is much lower than that of chemical adsorbents. Some physical adsorbents include silica gel, activated alumina, activated carbon and molecular sieves; a physical adsorbent such as zeolite can have power delivered to almost the same level as that of chemical adsorption [7,11].
Due to the high adsorption capacity, low grade heat needed for system operation and cost effectiveness of silica gel, it has widely been employed in thermal energy sorption systems and it is purposely chosen as the adsorbent material for this study [12].
Aristov et al. studied the adsorption isotherms and the kinetics of adsorption of silica gel/water systems with various grain sizes and concluded the sizes had a significant effect on the activation energy and the heat transfer characteristics of the system [13]. Ng et al. also used the Henry-type equations to fit the adsorption isotherms for various types of silica gel and concluded that the RD silica gel and type 3A should be considered when cycle repeatability and a low grade heat source are required [14]. A microporous silica gel of about 350 kg was used in a closed sorption system by Deshmukh et al. The system was designed to store 18 kWh of heat and deliver it at an average of 3 kW for 6 h. The obtained specific heating effect was reported to be about 190 kJ/kg [15]. A space heating and cooling system was designed by the Solar Energy Research Center (SERC) and their industrial partner. The experimental result from the research indicated a high energy density of 253 kWh/m3 for the adsorbent and 85 kWh/m3 for the prototype [15,16]. Li et al. performed an energy and exergy analysis using the FAM-Z01/water working pair [17]. By utilizing a finned heat exchanger for improved heat transfer characteristics, they reported a storage density of 805 kJ/kg. ZAE Bayern performed a study on an open adsorption storage system using zeolite 13X as the adsorbent [15]. The system was to provide heat during winter to a school building, and the local district heating network in Munich provided the desorption heat. With 7000 kg of adsorbent, they attained a storage density of 124 kWh/m3 and a maximum power of 130 kW. In another experiment, a 700 mm diameter by 300 mm depth open sorption reactor was developed with zeolite as the adsorbent material by Zettle et al. [11]. With an inlet specific humidity of 16 g/kg of dry air, and a temperature of 25 °C, they reported a maximum thermal power of 1500 W per 50 kg of storage material.
This research presents the development of an open adsorption heat storage system for heating applications that utilizes low grade heat of 70 °C for the desorption phase. The system utilizes the heat of adsorption from the silica gel/water working pair. The main goal of this research is to test the degradation in the energy storage density of the silica gel for an approx. 2 h working period after a short cycle. The research progresses the knowledge of change in the storage densities of silica gel- based thermal energy storage systems by demonstrating the effect of low-grade heat on storage densities during cycle operations. The specific power and heat delivered are also examined.
2. Materials and Methods
2.1. Design of the Storage System
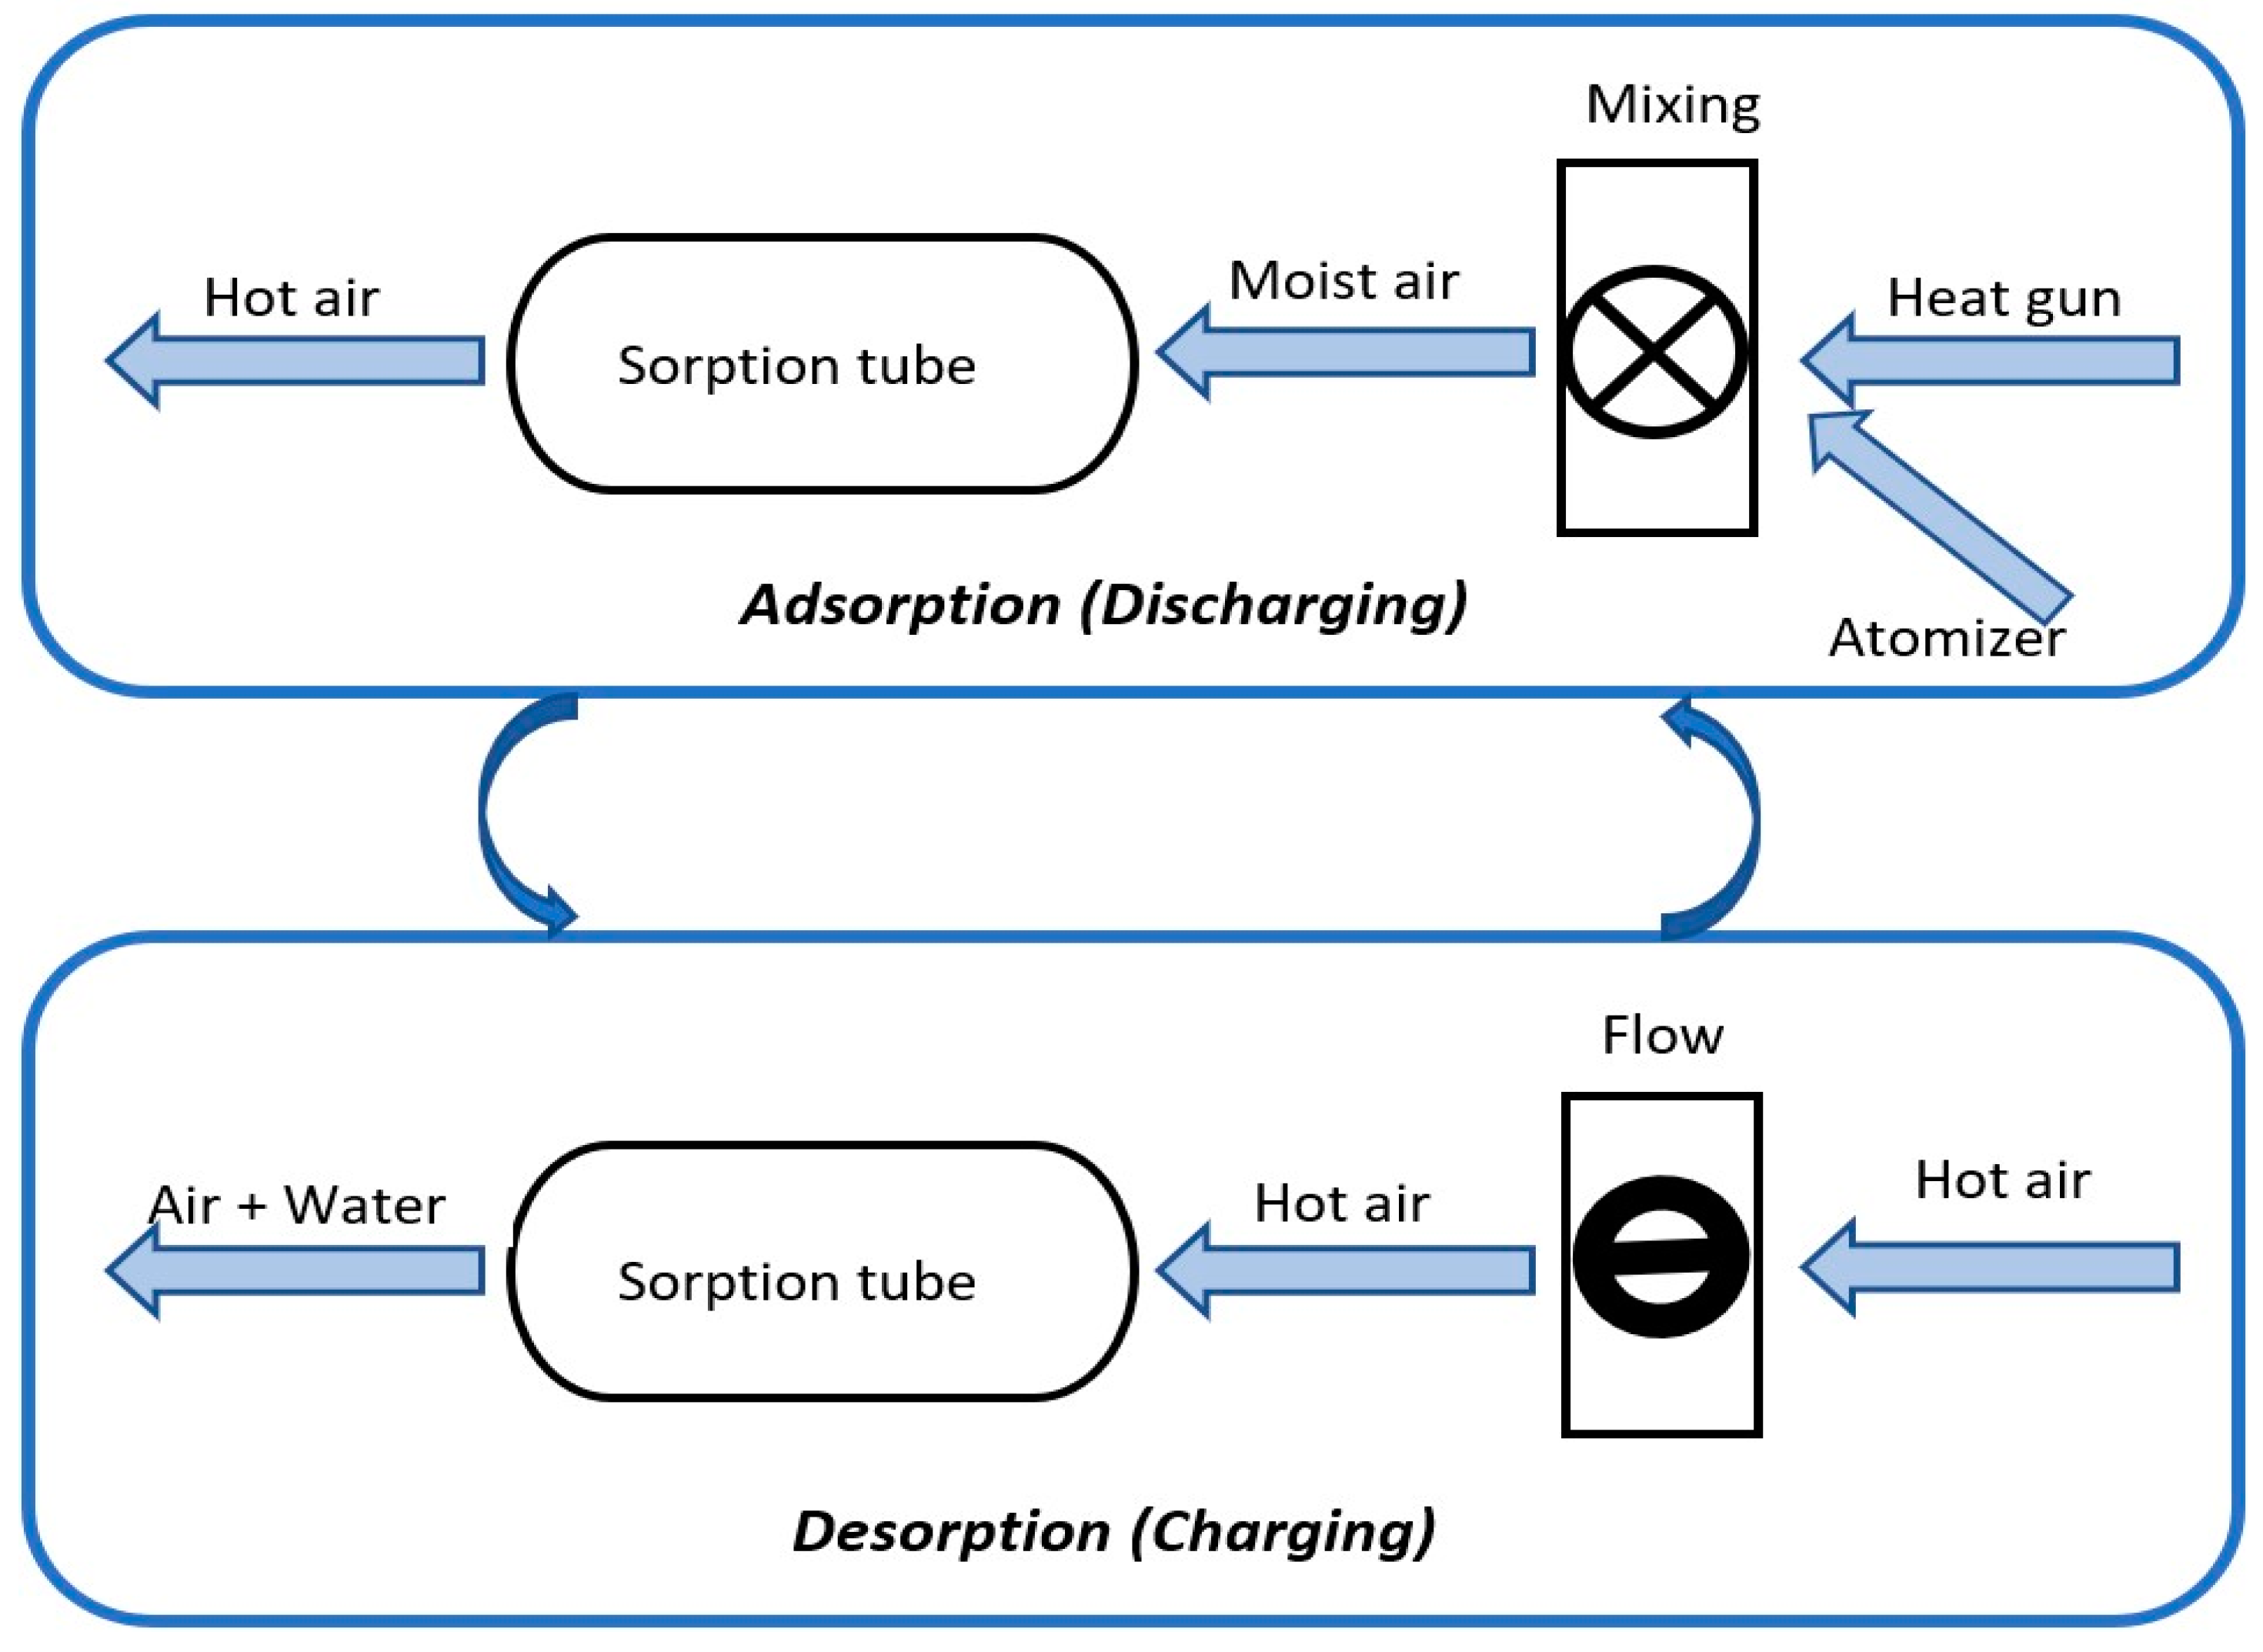
Design components of a TES system are mainly dependent on their particular application. For the purpose of heating, the system is comprised of an insulated chamber to house the storage material. The heat losses from the system are reduced by an insulation material of the chamber. Figure 1 depicts the system architecture and interconnection between the two phases. The first step is known as the adsorption phase. This process integrates the heat gun, atomizer, the sorption tube, control valves and the connecting ducts. The heat gun and the atomizer are turned on while the inlet valve remains closed to ensure homogeneity in mixing before the air enters the sorption tube. The outlet valve is closed as well to prevent adsorption of moisture from the atmosphere. The temperature and relative humidity are carefully monitored at this point of the mixing section. After a specific time period, the inlet and outlet valves are opened for adsorption. The moist air flows directly to the center of the bed, which is then distributed outward through the pores. Heat is then released when adsorption occurs since the process is exothermic, where the heat released is transferred to the heat transfer fluid and stored as sensible heat. During the desorption phase, which is comprised of the system without the atomizer, the air is heated with a heat gun to high temperatures. The hot air flows through the bed to cause release of moisture from the adsorbent. The inlet, outlet and bed temperatures and the relative humidity are monitored.
2.2. Sorption Tube Design and System Set-Up
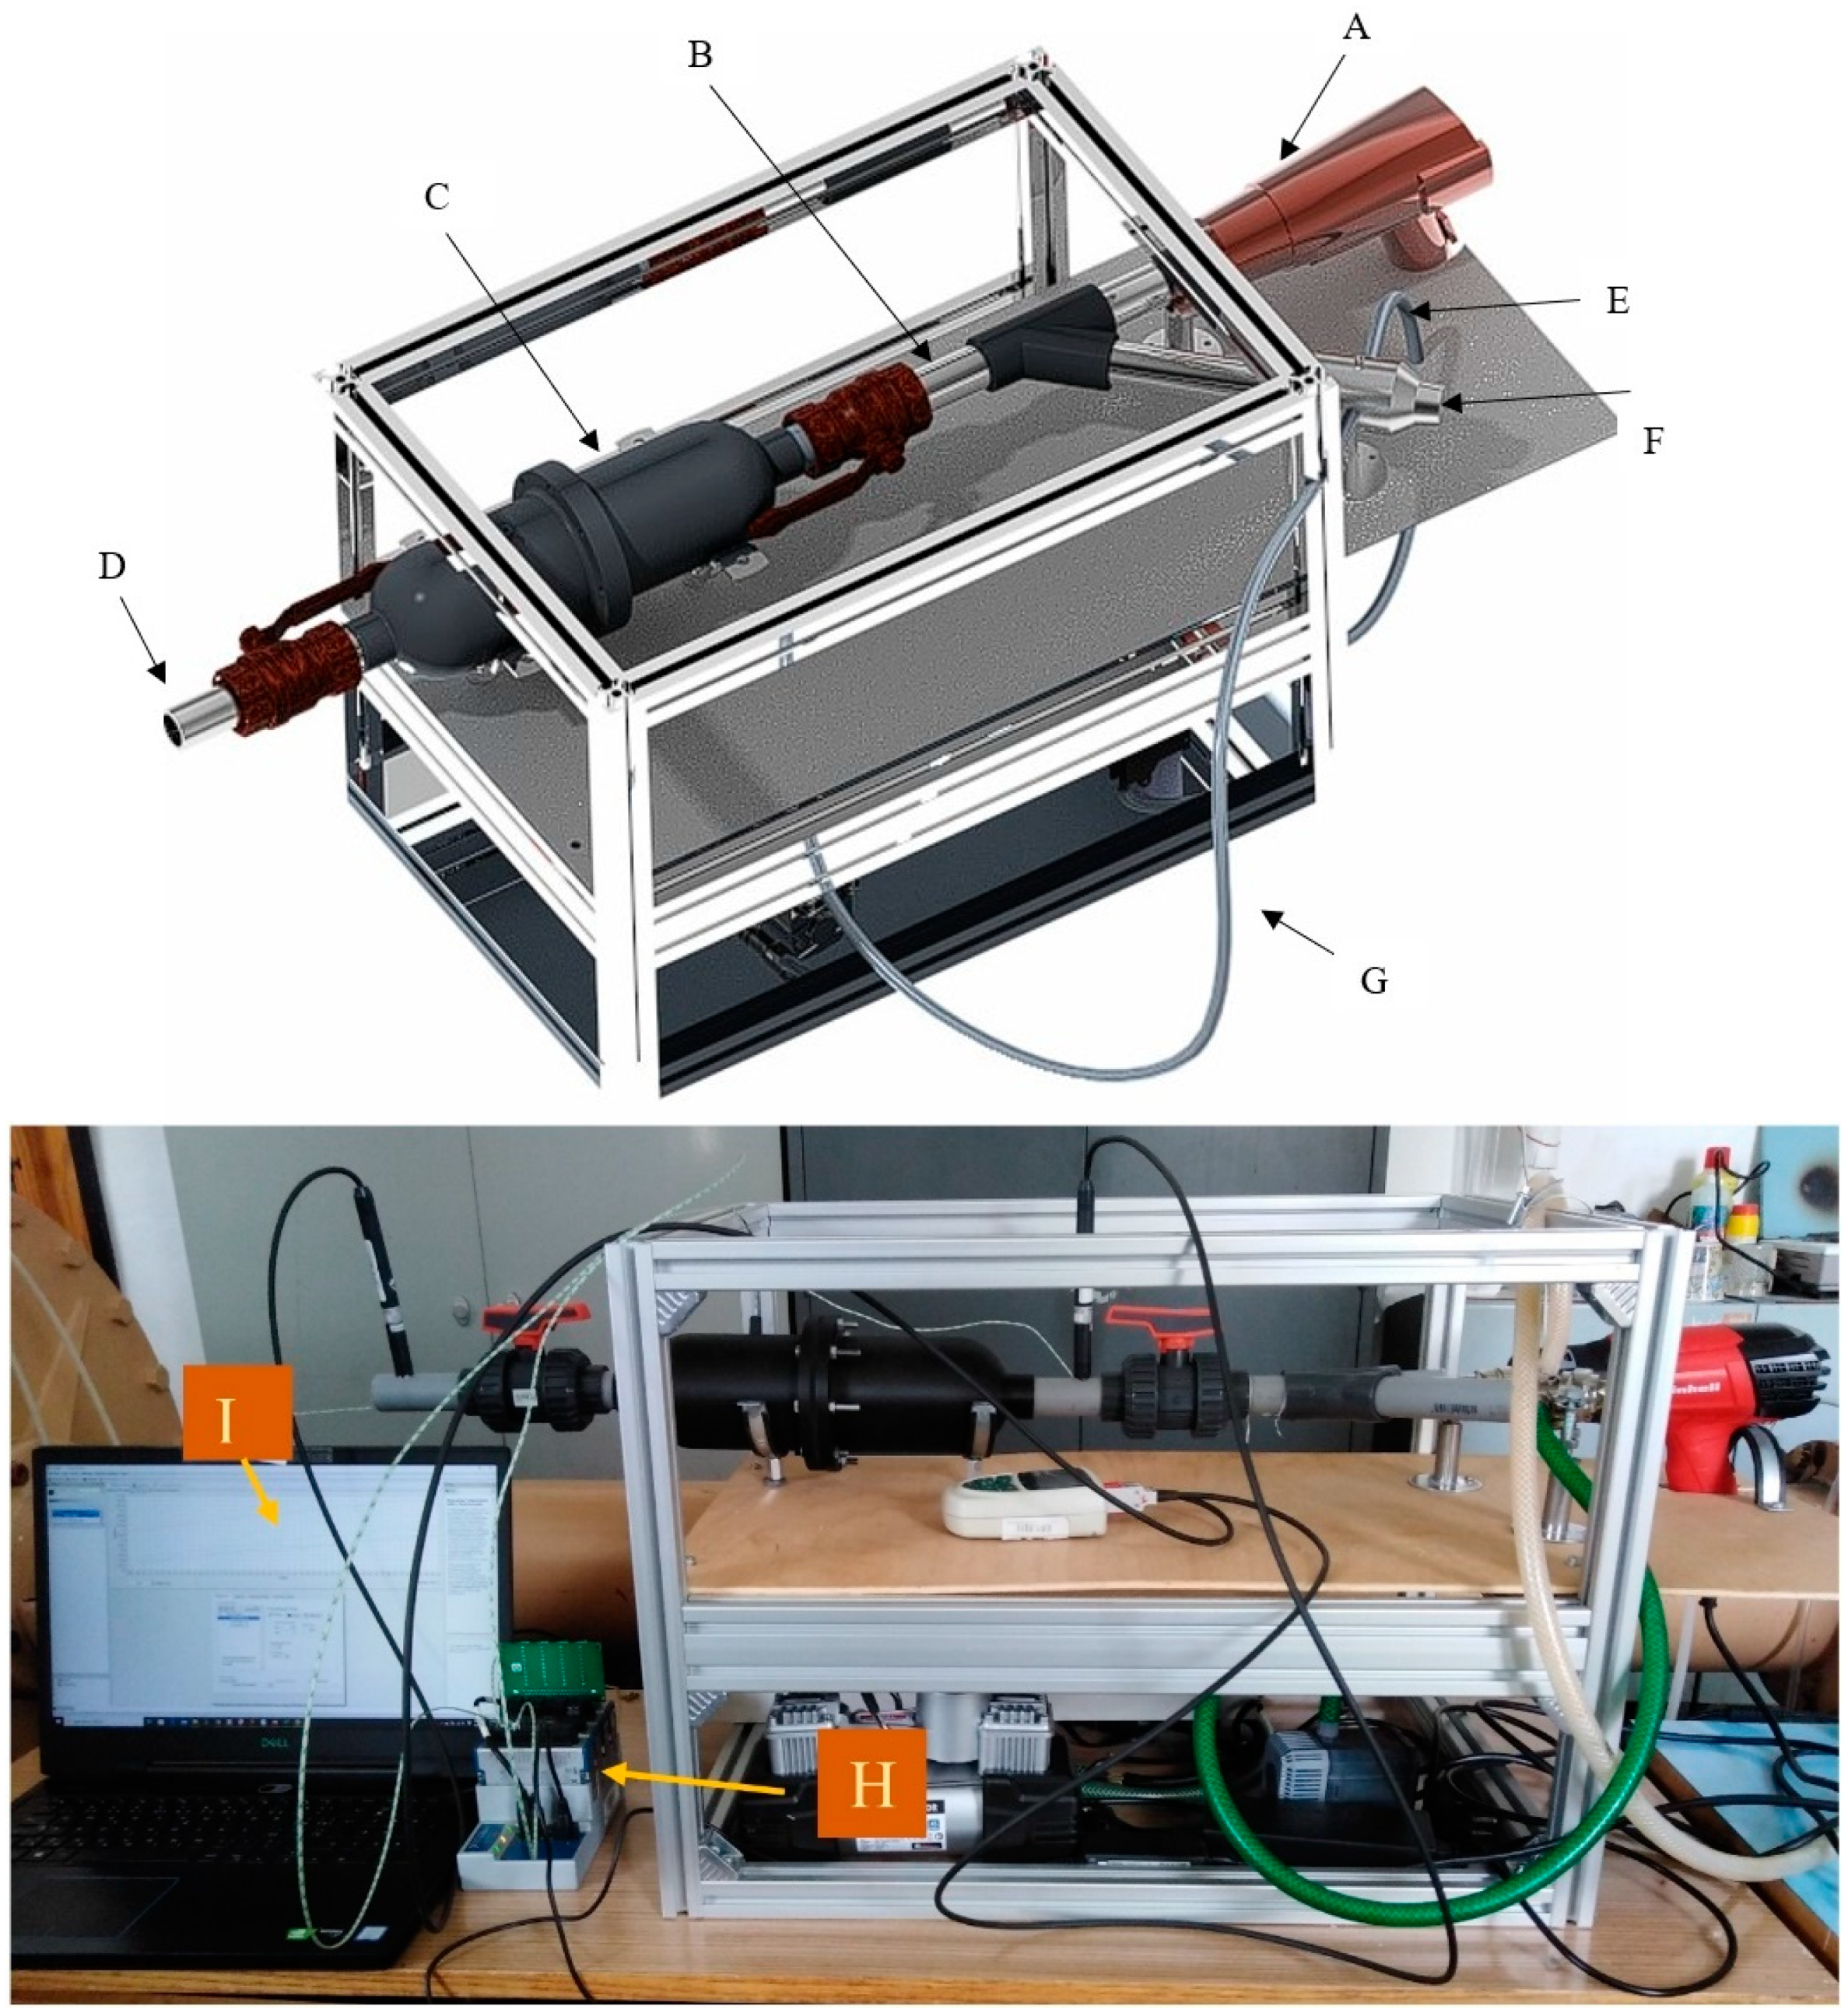
The fact that cycle repeatability tests will be performed, the tube is supposed to be able to withstand moderate temperatures of about 70 °C during desorption, have accessibility to the inside as well as to have a high fatigue life and good creep resistance. The sorption tube length is 0.36 m, the internal diameter is 0.09 m and the thickness is 0.003 m. Due to the aforementioned requirements, the composite material based on acrylonitrile butadiene styrene (ABS) enforced by carbon fibers was chosen for the tube design due to good heat resistivity, low water adsorption at saturation, high temperature material, good fracture toughness, high strength, high processability and flow characteristics. The whole system consists of the sorption tube, valves to control the moist air flow into and out of the tube, a heat gun, an atomizer and flow ducts to drive the air flow into and out of the system (see Figure 2). The system has a length of 0.9 m and a width of 0.45 m. The atomizer and the heat gun are positioned 45° away from each other with a 45° y-channel duct joint. The heat gun is positioned uniaxially to the sorption tube and the atomizer is at a distance 3 times that of the heat gun away from the y-channel to ensure that the water is completely atomized before it mixes with the air from the heat gun. This is to ensure efficient mixing before it enters the sorption tube. The experimental prototype with connections of temperature, humidity and velocity sensors to the data acquisition device, which is also connected to a computer, is shown at the bottom of Figure 2.
2.3. Specification of Operating Conditions
The efficiency of the proposed system is highly dependent on the operating parameters to enable the determination of the measuring cycle repeatability and degradation [18,19]. Specific air flow rates are selected to allow effective heat adsorption and delivery from the selected storage material. The sorption tube material (acrylonitrile butadiene styrene (ABS) with carbon fibers) is included in the control of strength to weight ratio. However, the insulative capabilities were reduced due to the high thermal conductivity of carbon fibers. The amount of 800 g of silica gel was used as the thermo-physical material for the testing of the storage capability of the system. During the adsorption phase, the pump in conjunction with the compressor is fed to the atomizer to deliver a 0.045 L/h flow rate of fine atomized water. The airflow rate entering the sorption tube was regulated at approximately 3.0 by means of a flow control valve. Several tests were carried out during the experiment by varying the inlet conditions to obtain optimum and constant inlet temperature and relative humidity of 25 °C and 70%, respectively, after mixing. The desorption phase is performed with an inlet temperature of 70 °C and with a flow rate of the heat gun at approximately 3.5 .
2.4. Material Properties of Silica Gel
Due to the high specific surface area of silica gel (300–1000 m2/g), it has a high tendency to adsorb mostly hydrophilic materials such as water even at high temperatures and low relative humidity [20]. It is also known to increase in adsorption as relative humidity increases [21]. Silica gel is also readily available, only requires low temperature heat for desorption or regeneration, has high energy density and it has low cost. These are objectives for the selection of the silica gel as the adsorbent material. Research on silica gel types by Aristov et al. [13,22] reported that the apparent diffusivity, the pre-exponential factor and the activation energy were (3.7–4.7) × 10−7, 2.9 × 10⁻⁴ m2/s and 41.5 kJ/mol, respectively. The silica gel chosen for this experimental work is a type A gel which has diameters from 1 to 2.5 mm, bed porosity of 0.35 to 0.4, pore diameter of 2 to 3 nm and has a density of 700 g/dm3. The regeneration temperature is given by the manufacturer as 130–160 °C [23].
2.5. Measuring
The measurement of the temperature, relative humidity and the flow rate parameters were taken at the inlet, the bed of the sorption tube and at the outlet (see the bottom of Figure 2). The measurement of the temperature and the airflow rate through the ducts was made using the FVAD 35 TH5Kx temperature and velocity sensor, which was obtained from Ahlborn (data logger ALMEMO), with accuracy of ±0.7 °C and 0.01 m/s, respectively. The accuracy of the humidity sensor used was ±4.0% RH in the range of 5% RH to 98% RH. Data-logging sensors (20 mm diameter) were also used in-situ to measure the temperature of the walls and the bed. The total errors due to data acquisition and wire connections are presented in Appendix A. These measurements were taken at intervals of 15 min over a total time of 165 min.
3. Mathematical Models
The mathematical relations are introduced in order to calculate relevant parameters used for experiments. Two isothermal model concepts, from Dubinin [24] and Freundlich [18,24], were adopted and used to fit the experimental data in order to determine the maximum adsorption of water at high pressures. The Freundlich isotherm is more suited for multilayer adsorption and it also defines the surface heterogeneity and the exponential distribution of the surface-active sites and their energies [24,25].
3.1. Adsorption Isotherm
3.1.1. Freundlich Isotherm Model
In case of heterogeneous adsorption layers, the Freundlich model describes the linear adsorption isotherm between water uptake X (kg of adsorbate per kg of adsorbent), vapor pressure pv and saturation vapor ps, at the adsorbent temperature. The homogeneity of the surface (1/n) is identified between 0 and 1.
The model above is not valid for extremely low and high vapor pressures, with maximum uptake, Xo, representing the adsorbent capacity.
3.1.2. Dubinin Isotherm
A modified form of the Dubinin-Radushkevich isotherm model was developed to improve mathematical calculations and this resulted in the assumption that the adsorbed phase density remains constant [18]. The resultant is the D–A equation, and it is given by:
D is the coefficient of affinity and it depends on the adsorbate/adsorbent pair as well as the microstructure of the adsorbent material.
3.2. Adsorption Rate
The rate at which the adsorbent takes up the adsorbate is given by
where is the mass transfer coefficient of adsorption and is given by:
From this relation the activation energy Ea can be obtained from the surface diffusivity () by:
where is a pre-exponential term with the value of 2.54 × 10⁻⁴ m2/s, R is the gas constant, and is the radius of silica gel particles.
3.3. Energy Balance
The average temperature out and the average temperature lift during adsorption is given as follows:
Average temperature out;
Average temperature lift;
The total energy balance during adsorption is calculated as the sum of the heat obtained by convection, as sensible heat, by losses and as sorption heat, which is equal to zero:
where subscripts v, a, c, B, and W represent water vapor, air, middle of the bed, bed and wall, respectively. The terms , Cp, Tin, Tout, t, R, ρ represent the mass flow rate, the specific heat capacity, the temperature at the inlet and outlet, time, heat resistance and density, respectively. The first term on the left of Equation (9) represents the power produced during adsorption, the second term represents the power lost through air flow through the bed, the third term represents the amount used to heat up the adsorbent, and the last term represents the loss through the sorption tube.
The power derived from sorption is calculated for n cycles and a graph of power versus the number of cycles is plotted to study the number of cycles passed until significant deterioration of the adsorbent or the system begins. Values of the relevant parameters used in the system are summarized in Table 1.
4. Results
4.1. Adsorption
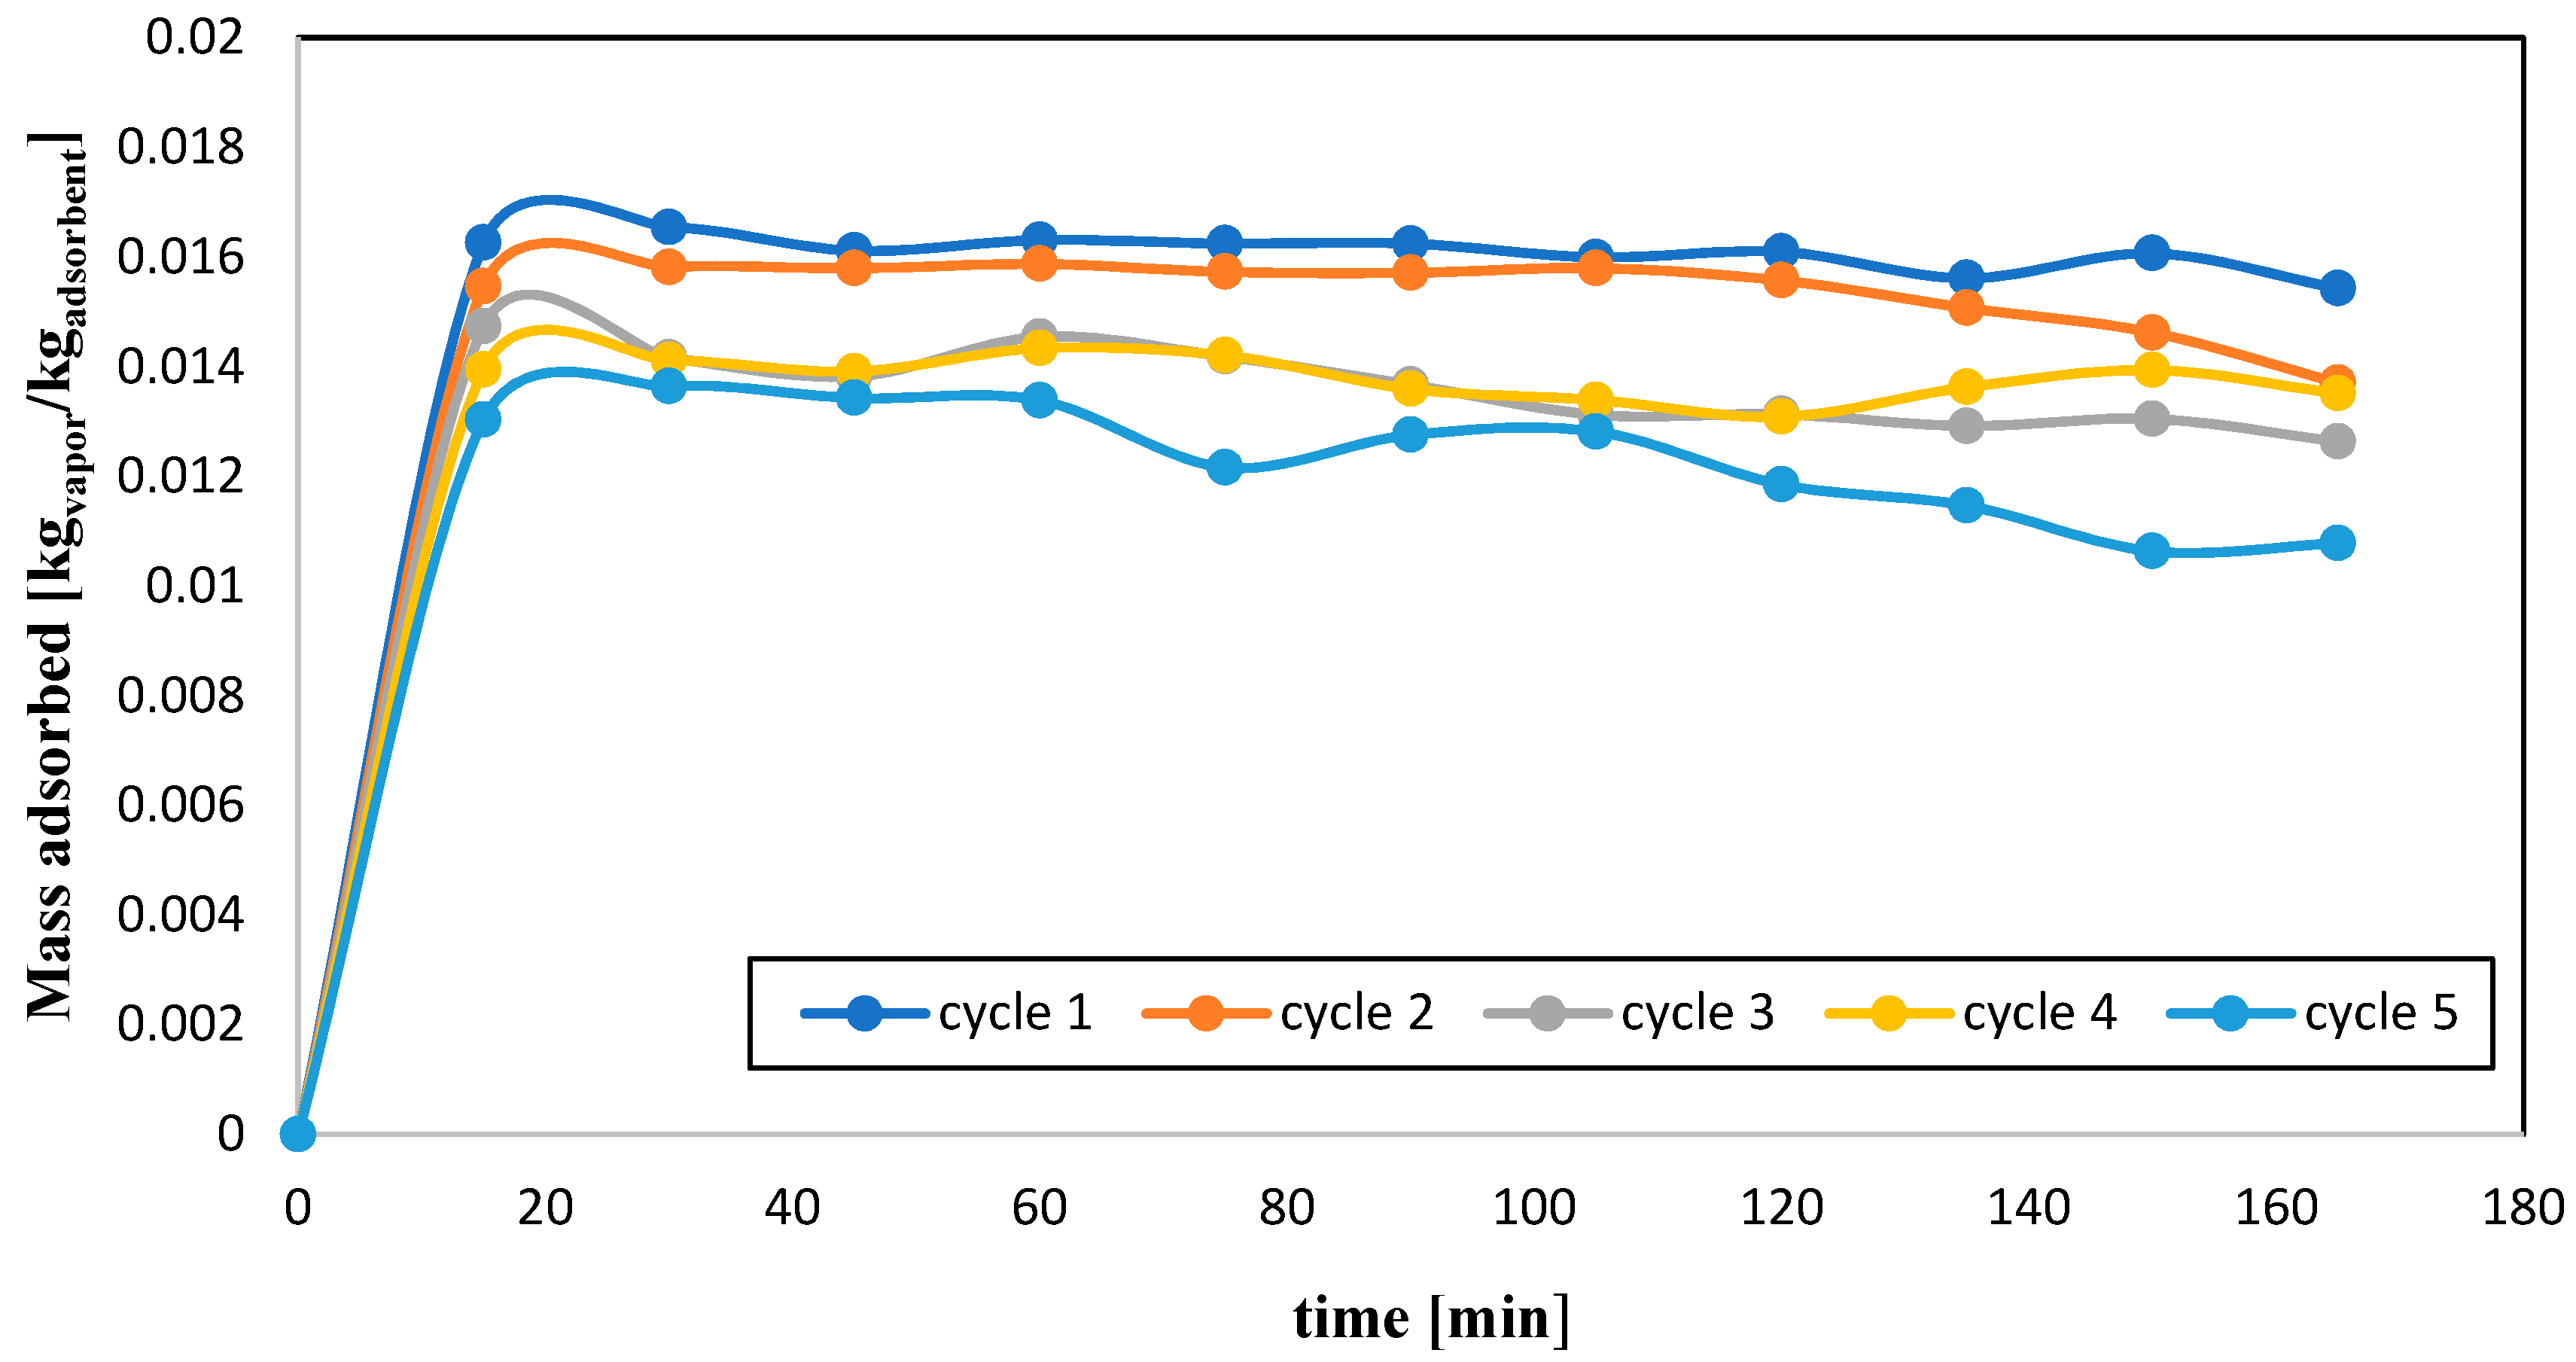
Figure 3 compares the mass adsorbed with time for 5 cycles. The highest capacity for moisture adsorption was found at the first cycle, with a decrease in the subsequent cycles. However, the decrease in adsorption in each cycle is low; this means there is a higher tendency for more adsorption for higher adsorption time duration. Thus, saturation is not reached for all cycles. Several researches on silica gel have shown adsorption of moisture for over 7 h duration [19,26]. Hence, it will require an additional 4 h for saturation to be reached in this work. However, this is not needed in this work since the study finds the change in the energy density for about a 2 h working period for a given number of cycles of operation. Moreover, the experimental results also show that there is almost a constant rate of water adsorption between time 40 min and 105 min before a decline begins for cycles 1 and 2.
Furthermore, it is seen that there is a net change of about 0.003 kg of vapor/kg of silica gel in the first 30 min to 0.006 kg of vapor/kg of silica gel from the first cycle to the fifth cycle, at the end of the 165 min. This corresponds to about an 18% decrease in adsorption capacity after 5 cycles. The standard error of the mass adsorbed was obtained as ±0.78 g. That is, for higher numbers of cycles with similar desorption conditions (70 °C for a period of 165 min and 3.5 m3/h flow rate), the phase amount of water adsorbed will gradually decrease until complete regeneration is performed as prescribed in literature or by the manufacturer. This is because the desorption temperature (70 °C) and time of 165 min used during the desorption phase is not high enough to completely regenerate the silica gel to its initial conditions. Hence, the amount of water molecules that exist in the silica gel reduces the amount that is adsorbed and gives slower adsorption kinetics during the adsorption phase. Works from Jahnig and Ng et al. [14,27] show that silica gel is usually regenerated with temperatures between 90 to 160 °C over a period of 5 h. The difference in the mass adsorbed between the first and fifth cycles in the first 20 min during adsorption is about 3 g of water vapor per kg of adsorbent. This difference increases with time, and reaches about 5 g per kg of adsorbent at the end of the 165 min duration, and it is expected to gradually increase for longer periods [19].
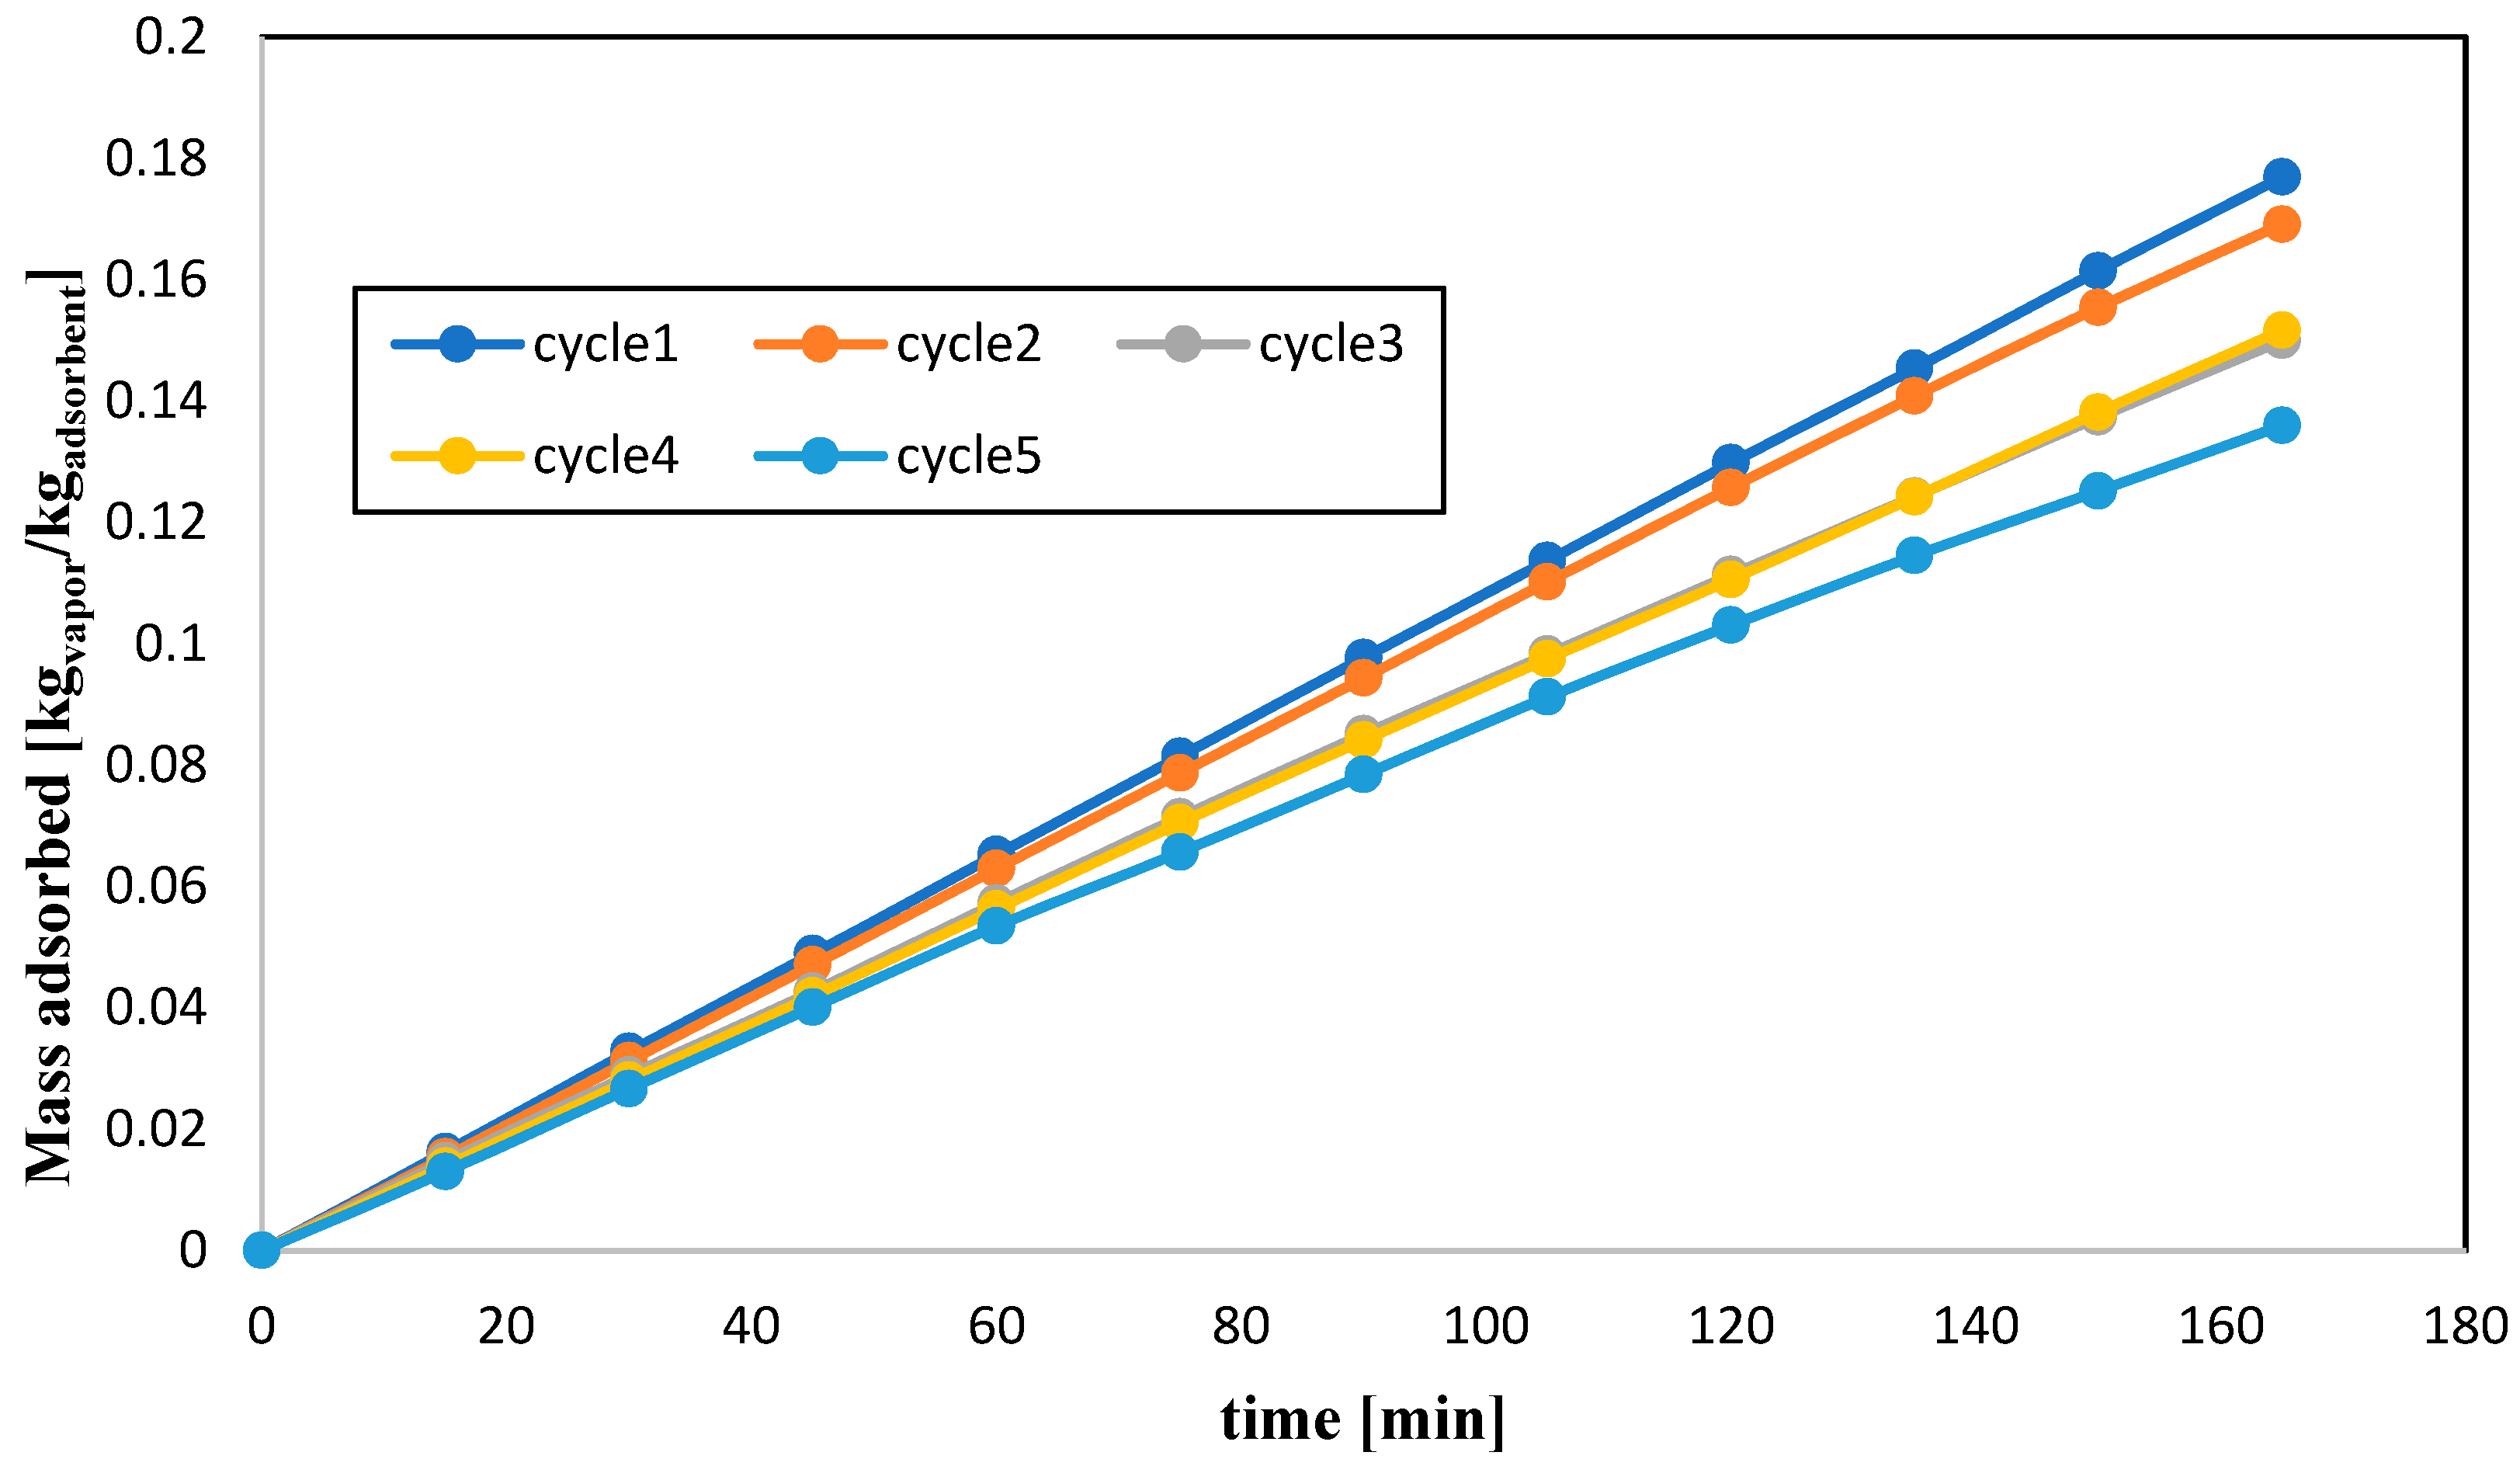
Results shown in Figure 4 illustrate the maximum amount of water vapor that can be adsorbed by the silica gel in the given time of operation. The total amount adsorbed for the duration is highest for the first cycle, and decreases with increasing number of cycles. The graph of cycles 1 and 2 is linear, indicating that the saturation point is not yet reached. Nonetheless as we increase the number of cycles, the adsorption capacity approaches its saturation point, which is seemingly lower than that of the previous cycles. This should be clearer for a time period of over 7 h. For 5 g of silica gel RD-2060 with particle size of 0.3–0.79 mm and for about 35 min, Mohammed et al. [28] demonstrated the expected behavior of the silica gel as it nears its maximum adsorption. They showed that the curve bends as the adsorption approaches saturation. Furthermore, results from Amorim et al. [19] showed that for 650 g of silica gel with particle diameter of 4 mm, inlet temperature of 26 °C, flow speed of 0.5 m/s and relative humidity of 70%, the phase amount of water adsorbed approaches 0 kg of water vapor/kg of silica gel after 20 h. However, there was about 27% more water adsorbed in 2 h and 45 min for this work than was reported by Amorim et al., and this may be due to higher flow velocity used (1.4 m/s). Therefore, it is expected to see the leveling of the curve sooner than 20 h.
Experimental results in Figure 4 show about 0.03 kg of water vapor per kg of silica gel difference in adsorption between the first and the fifth cycles at the end of the 165 min. This is equivalent to losing about 9% of the adsorption capacity of the silica gel after 5 cycles of operation. This follows, that saturation would be reached sooner with an increasing number of cycles, due to the presence of already adsorbed vapor from previous cycles. This loss of adsorption capacity with an increasing number of cycles is due to the incomplete regeneration during the desorption phase. For this reason, less than 60% of the adsorbed moisture is desorbed after every cycle. Hence to regain the full adsorption capacity of the silica gel, higher temperatures such as proposed by the manufacturer (130 to 160 °C) should be used.
4.2. Temperature
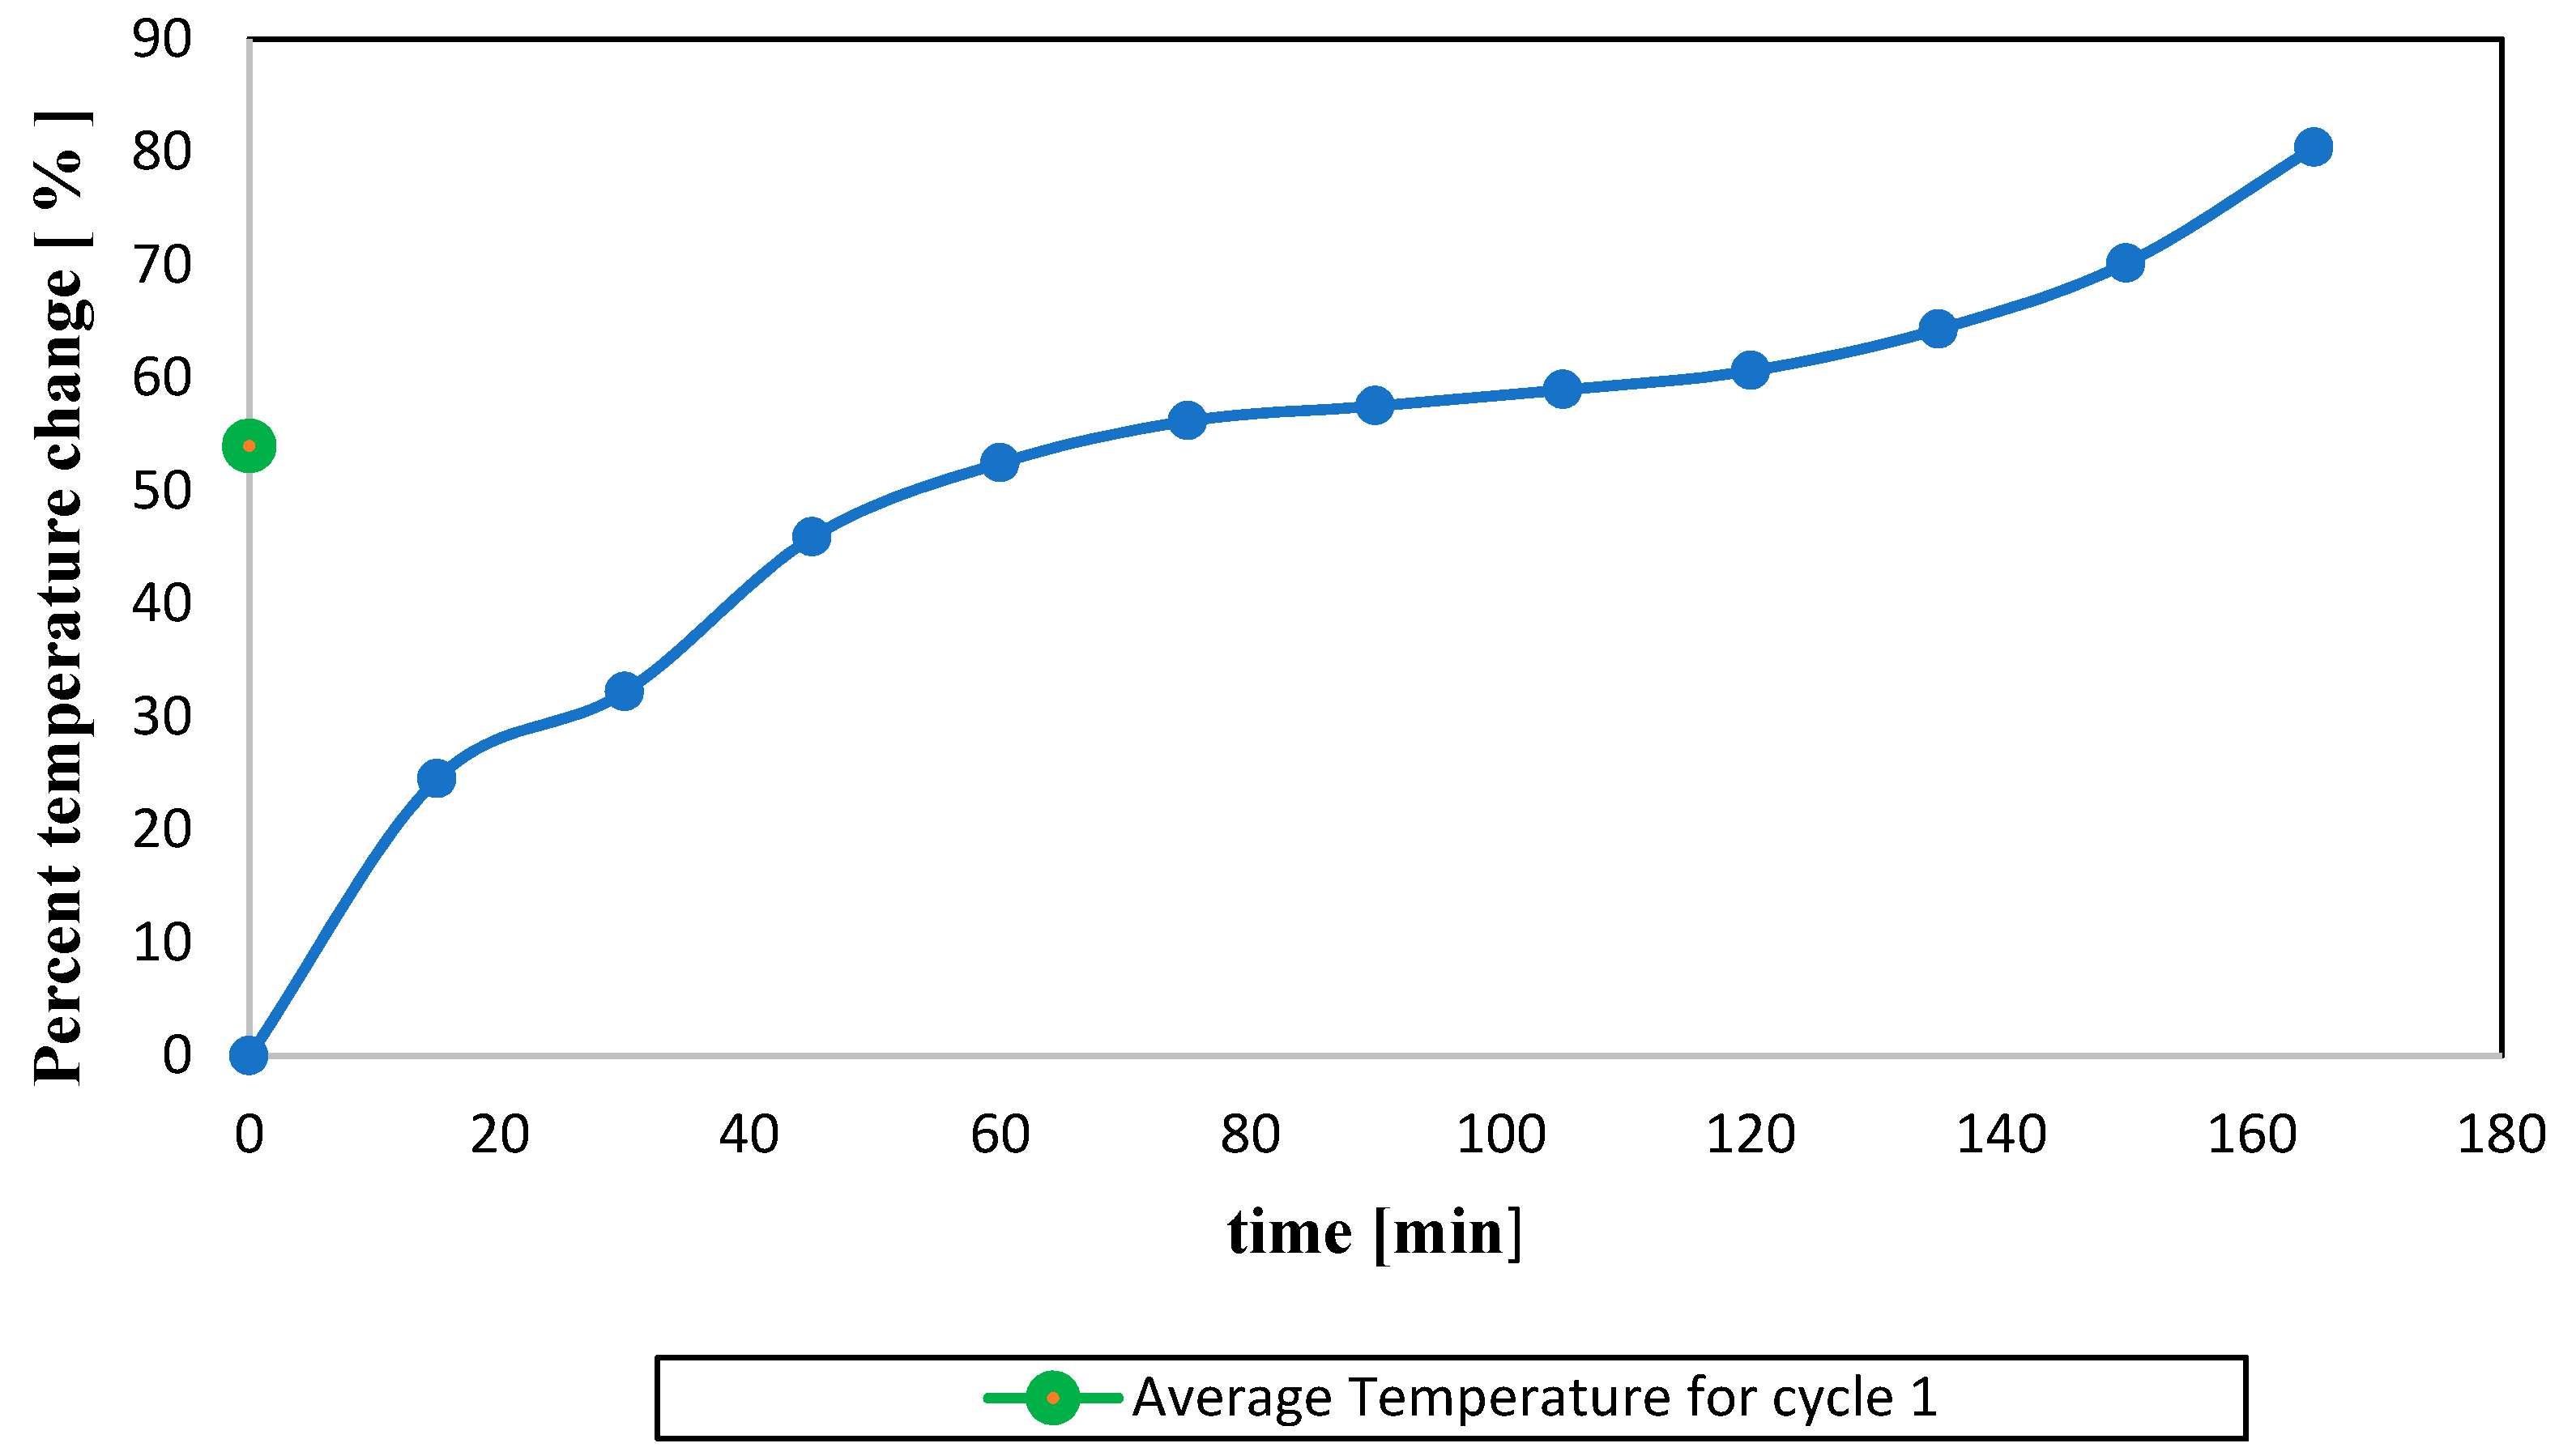
For the first cycle operation, the percent temperature differences against time are plotted in Figure 5. The percent temperature difference is expressed as the temperature difference between the inlet and outlet temperatures divided by the inlet temperature. The experimental results show that it takes about 60 min for the temperature difference to rise to a point where the temperature is almost steady for about 60 min.
After this, there is a steep rise in the temperature difference, where the highest temperature reached for the duration is 45 °C, which is equivalent to an 80% increase in temperature at the outlet. The heating capacity continuously increases as the reaction progresses and it is expected to reach much higher temperatures with extended time duration before it begins to decrease or become constant. Hence for 0.8 kg of silica gel and the given conditions during adsorption, an average temperature lift is about 12.2 °C. The maximum error of the temperature measurement was found to be 4.5%, as presented in Appendix A. Results from Deshmukh et al. [15] indicated an average temperature lift of 25 °C was obtained with a closed system that operated using 350 kg of silica gel and with a water mass flow rate of 0.029 kg/s during a 6 h period of adsorption.
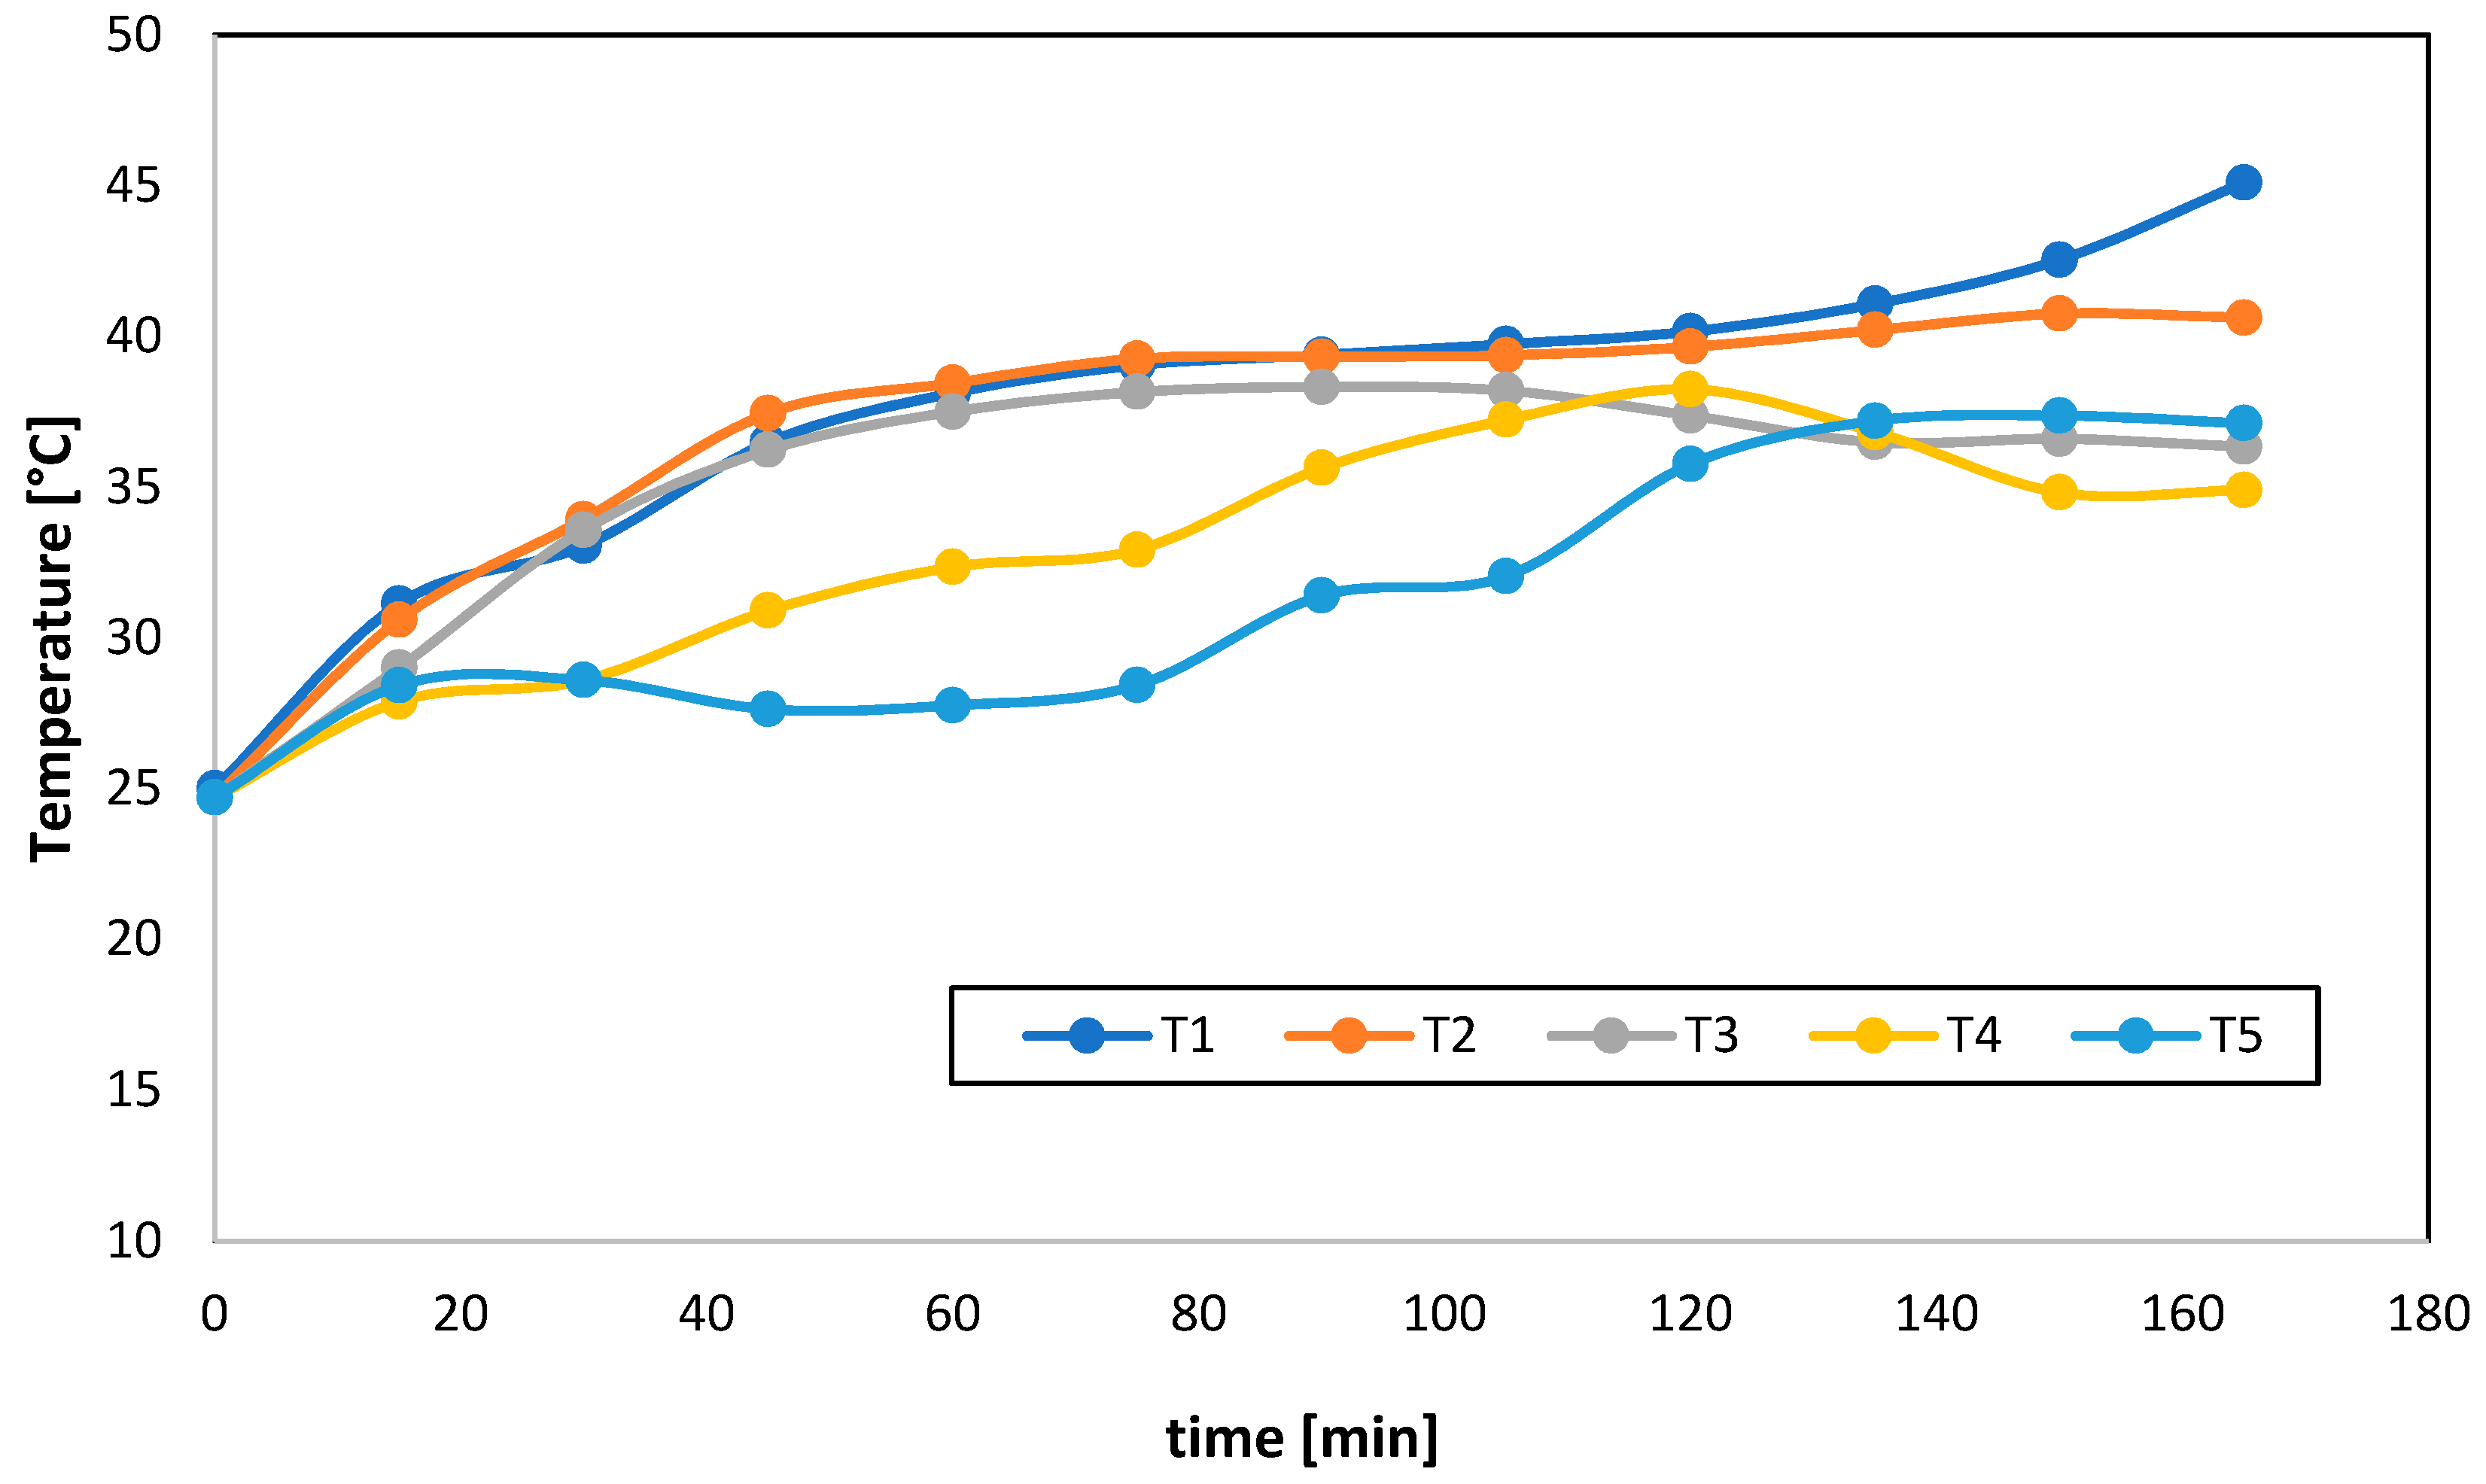
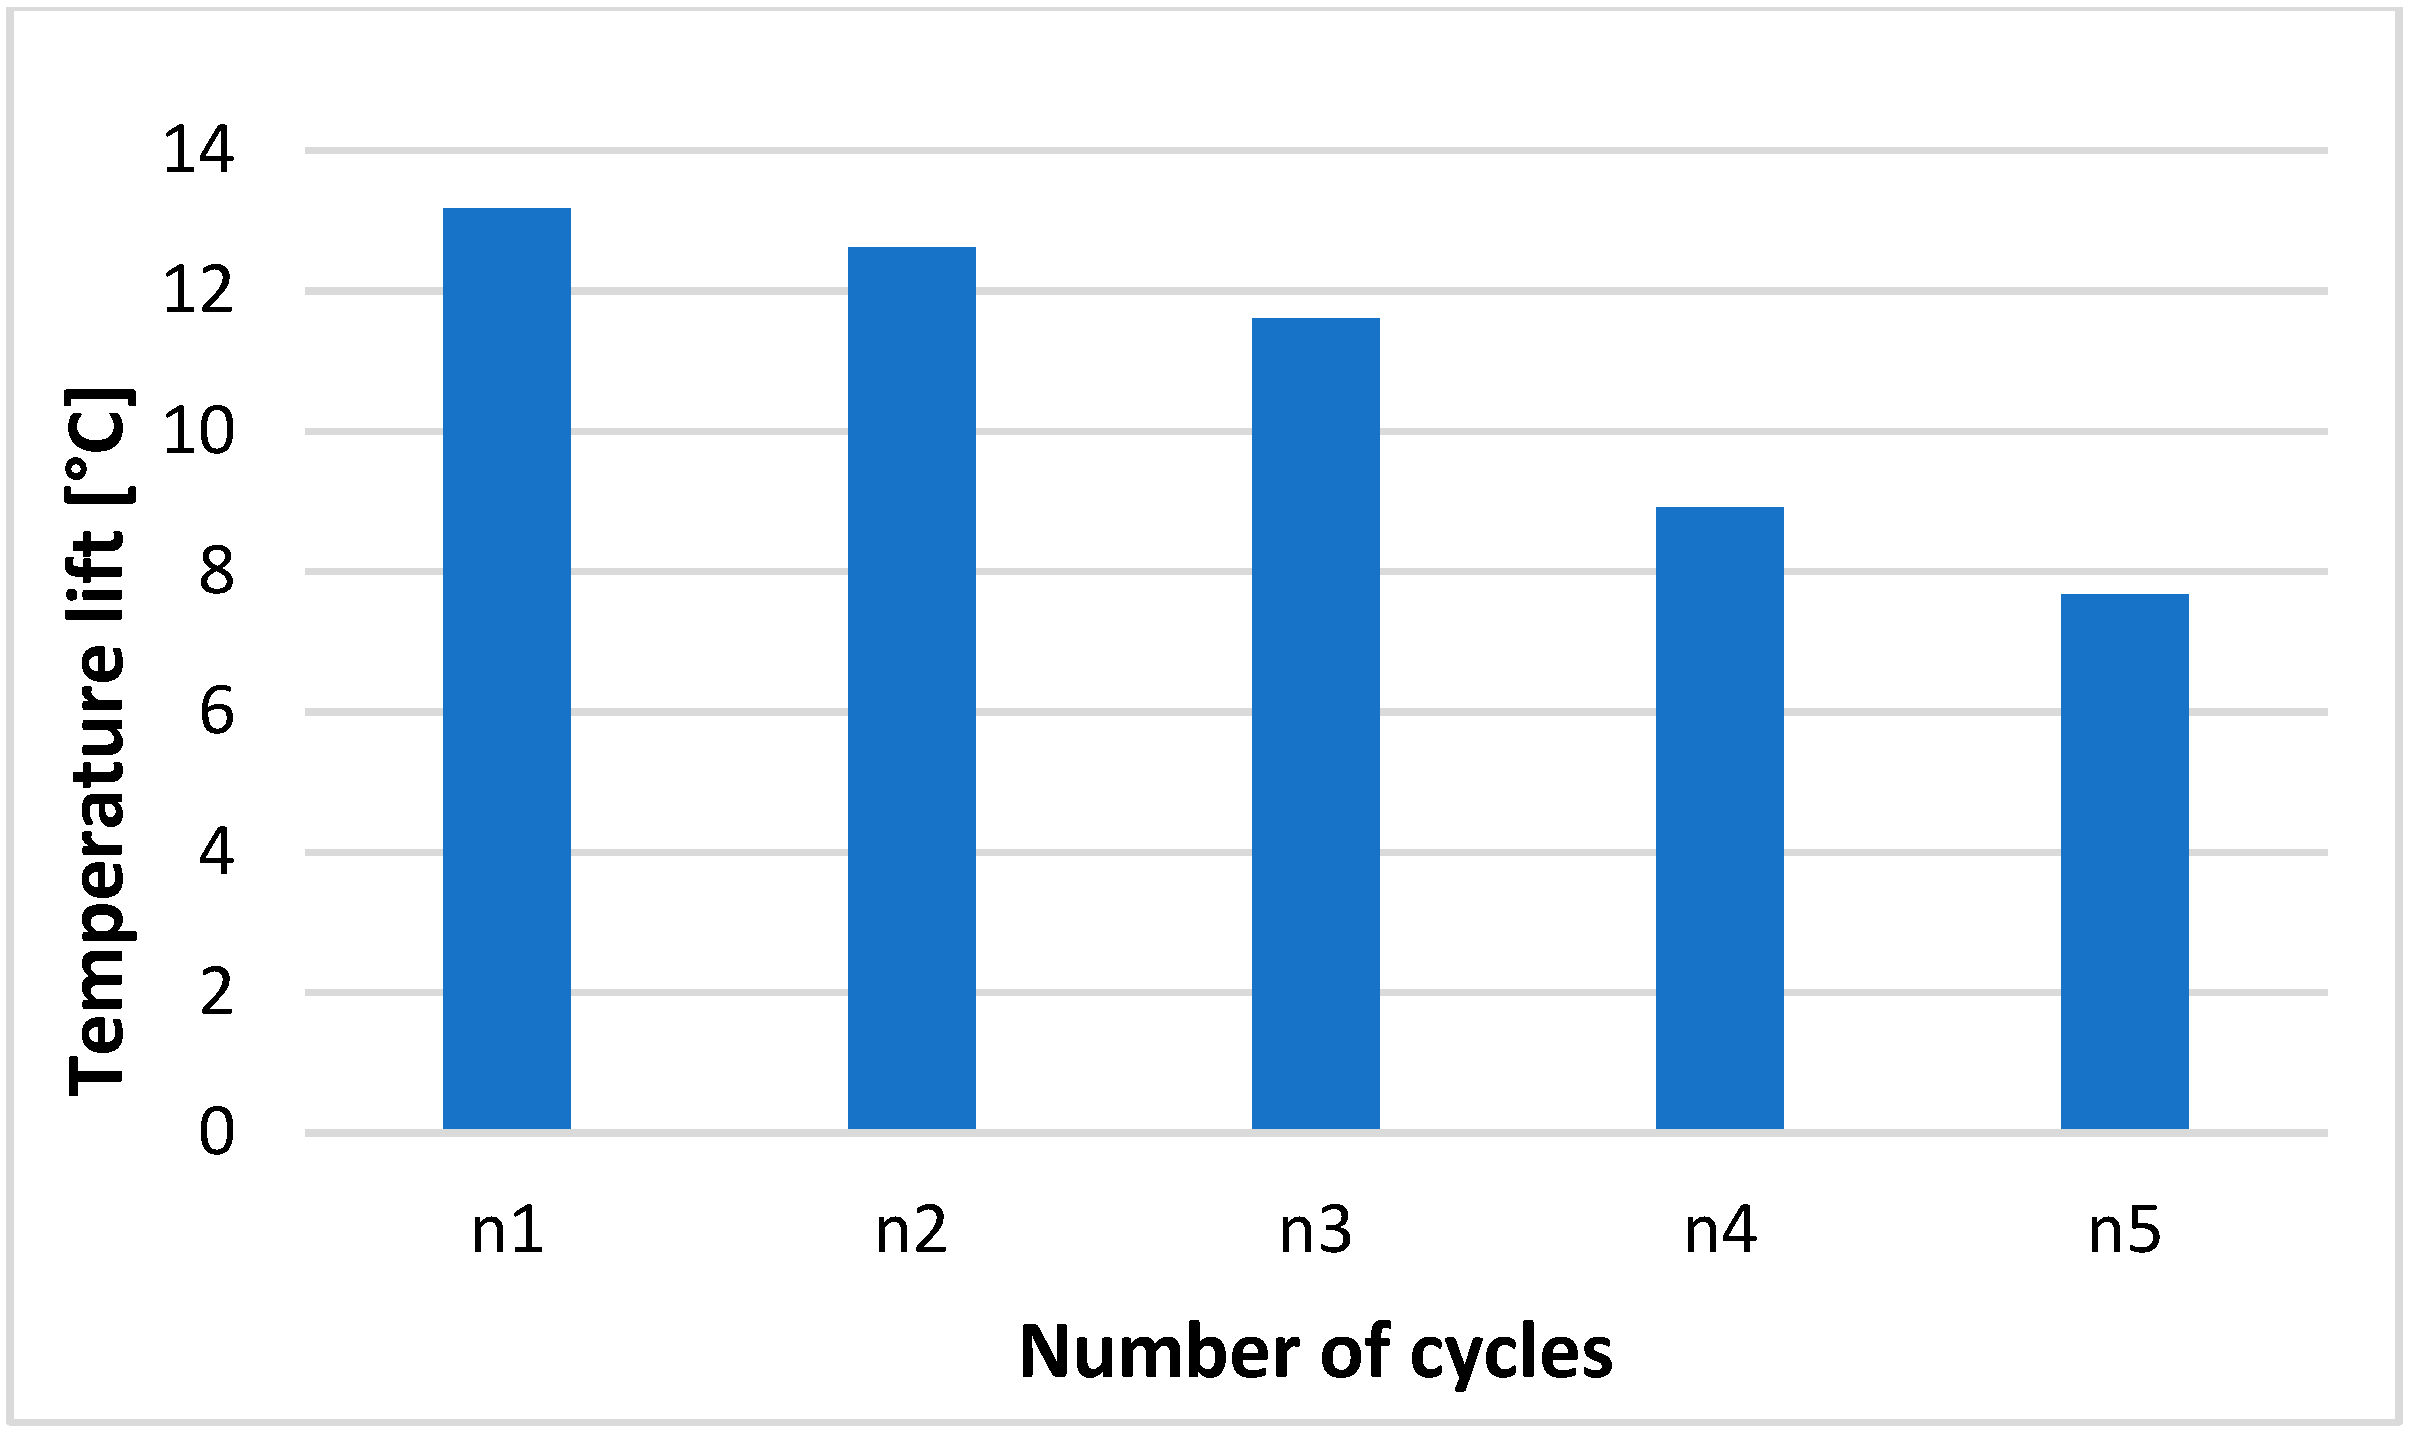
The outlet temperature for the first cycle is compared to the subsequent four cycles over time in Figure 6. The first, second and third cycles take almost the same path for the first 100 min; they all rise to about 38 °C where they remain constant for about 40 min. After this, the temperature for the first cycle begins to increase again to about 45 °C, showing a high probability of reaching a much higher temperature for a longer duration before it decreases. For the second cycle outlet temperature, it remains constant, while that for the third cycle decreases before remaining constant. If more cycles are performed, the temperature will be lower than temperatures of previous cycles. This is evident in the decreasing of the average temperature lifts as the number of cycles increases (see Figure 7). The relatively lower temperature is due to lower moisture adsorption during the process, since more adsorption means more released energy, hence higher temperatures.
4.3. Power and Energy
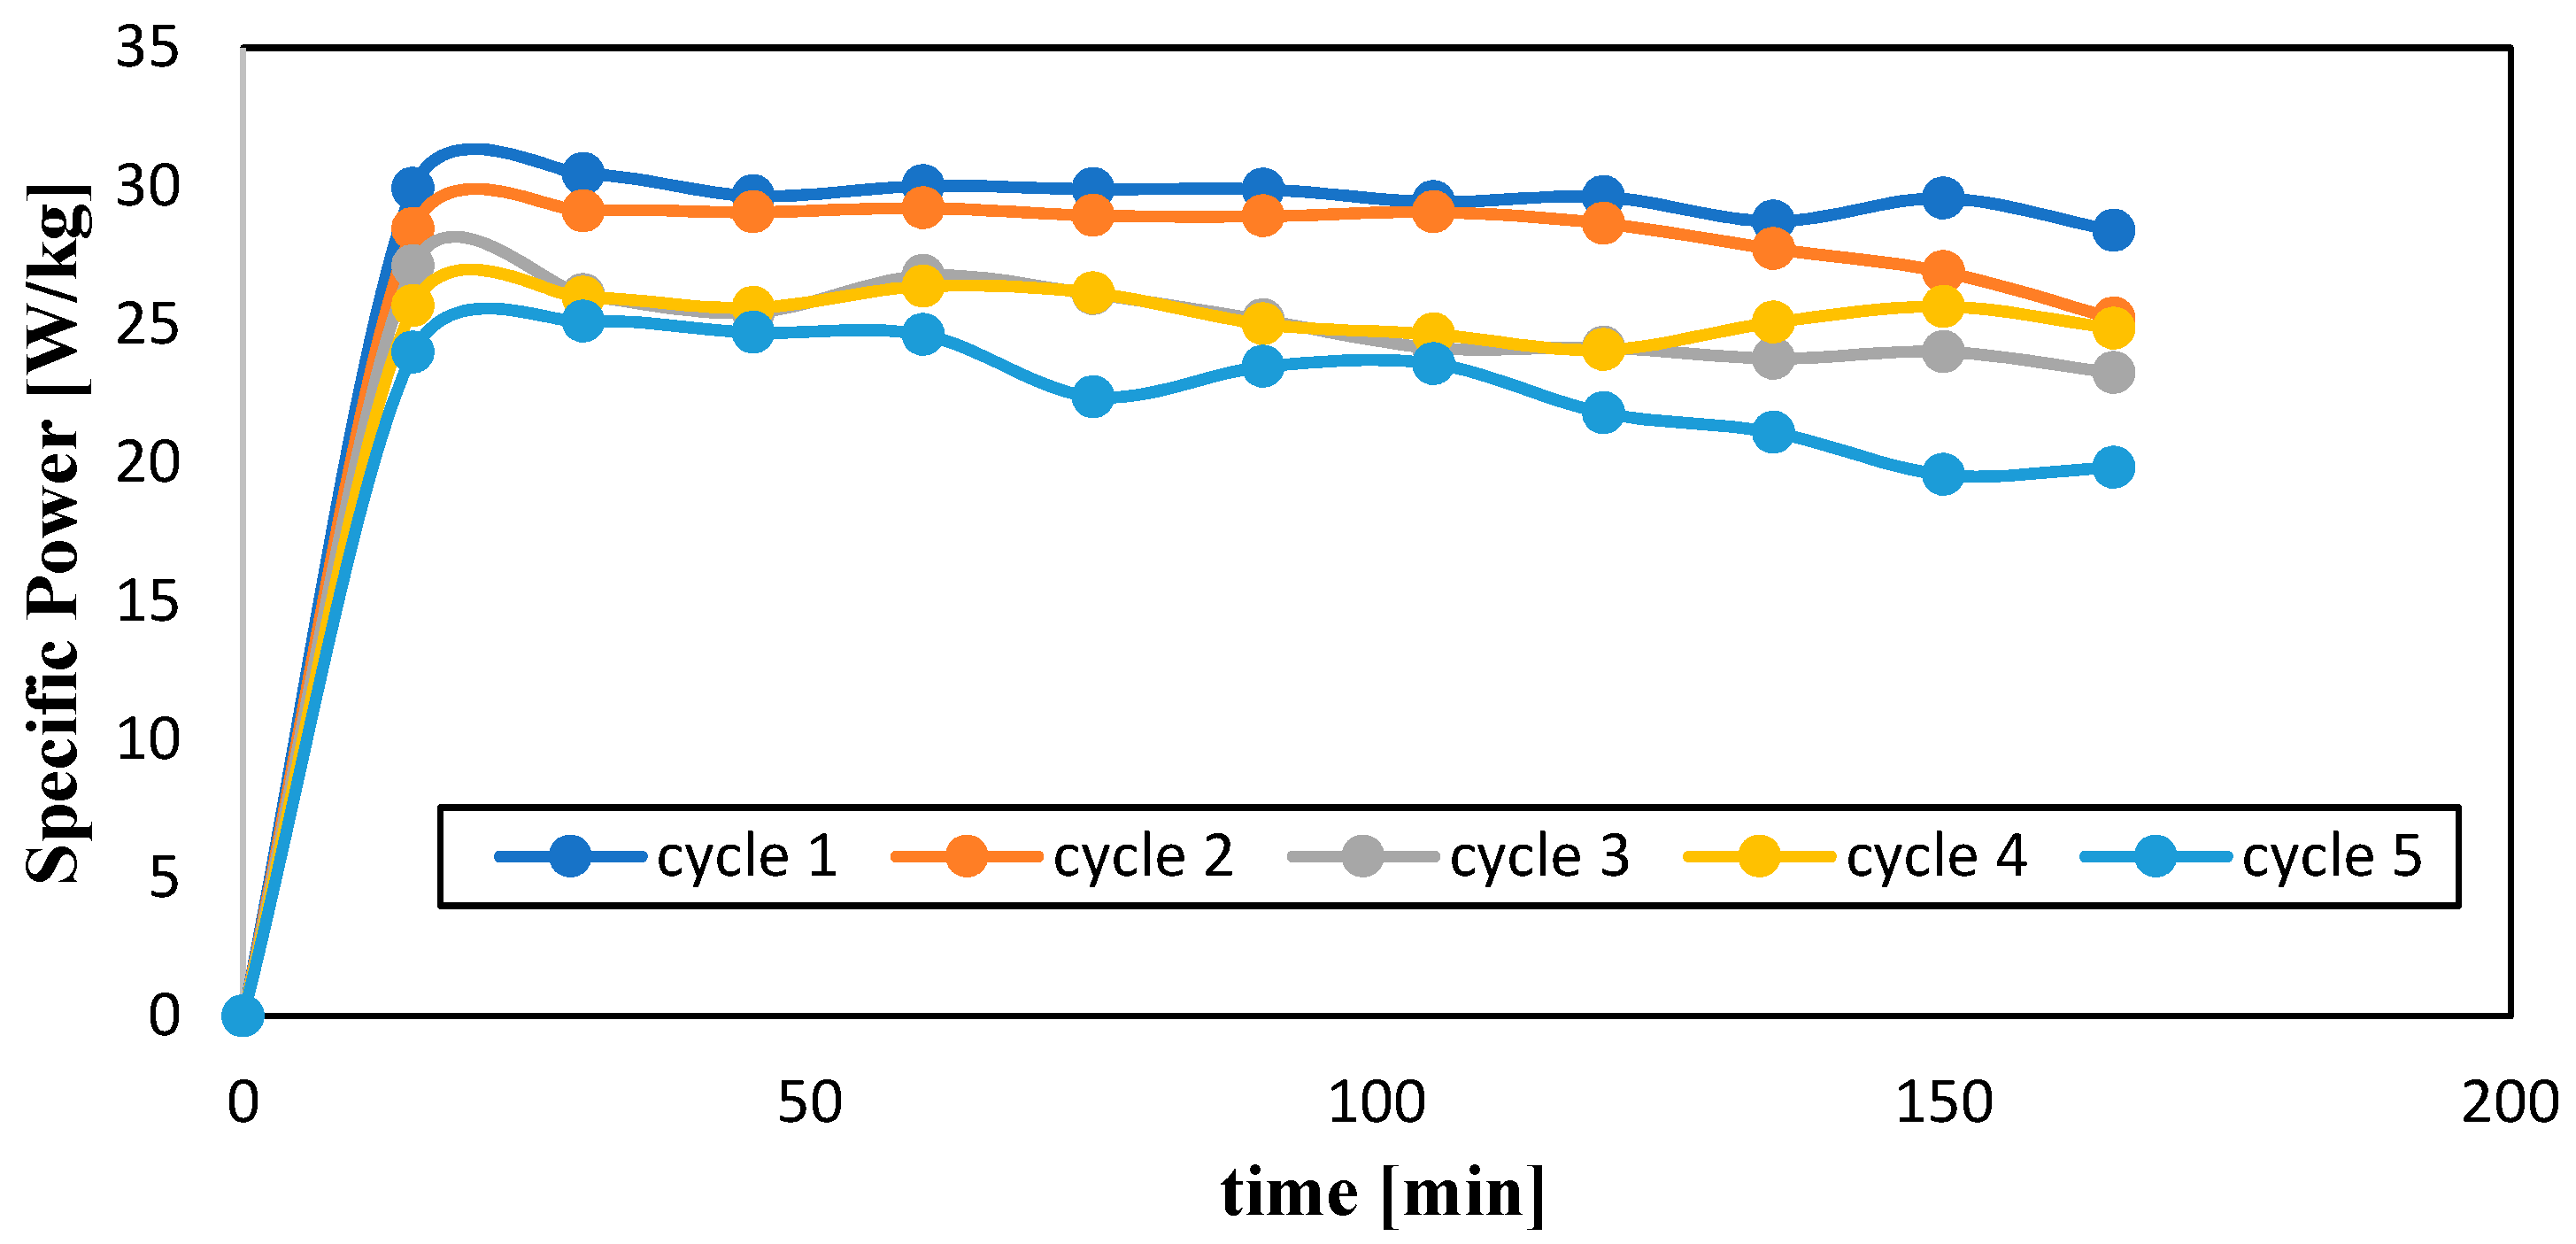
The power generated and the average specific power generated by the system for all cycles are shown in Figure 8 and Figure 9, respectively. The graph tends to have a strong correlation with the mass adsorbed by the bed (see Figure 3). Since the amount of water adsorbed for each cycle decreases with time, the power generated also decreases as time proceeds due to less exothermic process is occurring. The maximum and minimum power obtained for the 5 cycles occurs at the first and fifth cycles with a value of 30.4 and 19.5 W/kg, respectively (see Figure 8). The specific power delivered by cycle 1 compares with one reported in a work by M. Gaeini, who used zeolite as the adsorbent material [29].
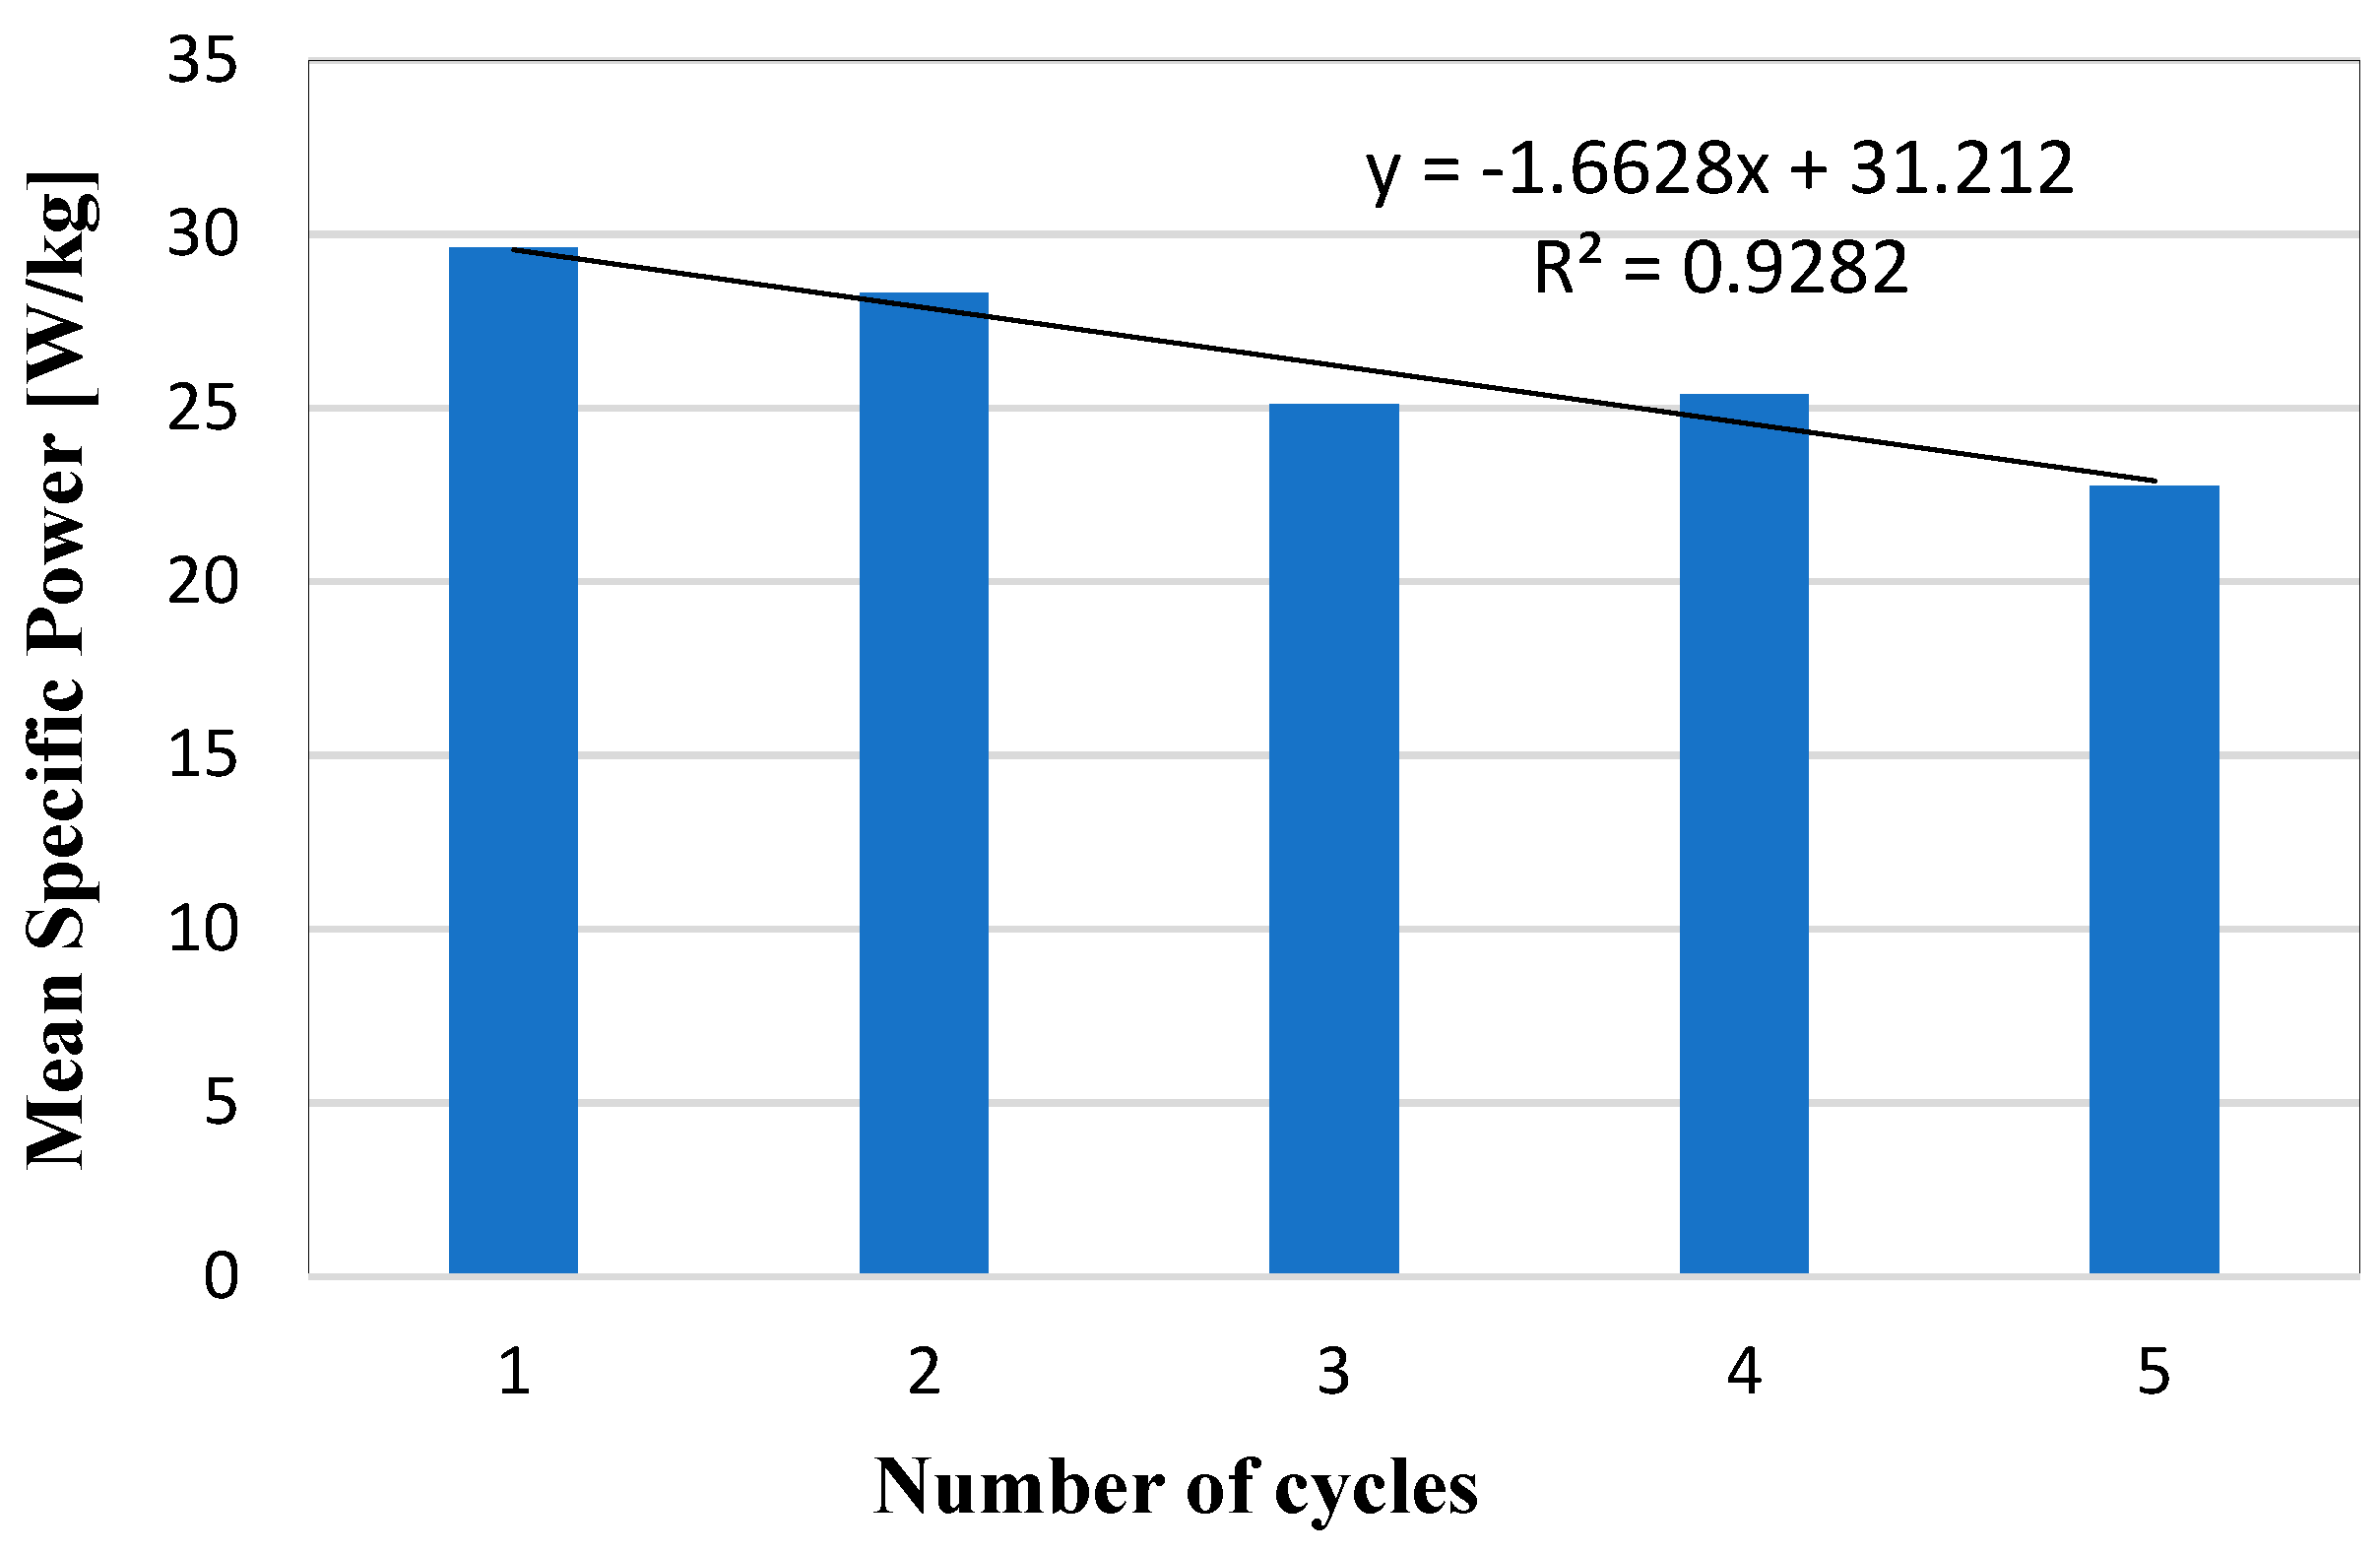
With an R2 value of 0.92, there was a reduction in power density at the rate of 1.6 W/kg per cycle (see Figure 9). The silica gel is shown to have good power density. The average specific power for the first cycle was about 29.5 W/kg. This is comparable to an open sorption system with zeolite as the adsorbent material which was reported to have a specific power of 27.5 W/kg in a work by Johannes et al. [30]. However, the power produced and the average specific power decreases with increasing number of cycles with an average specific power reduction of 5.5 W/kg after 5 cycles. This reduction in specific power with cycles is due to less exothermic process occurring caused by incomplete regeneration by the desorption conditions.
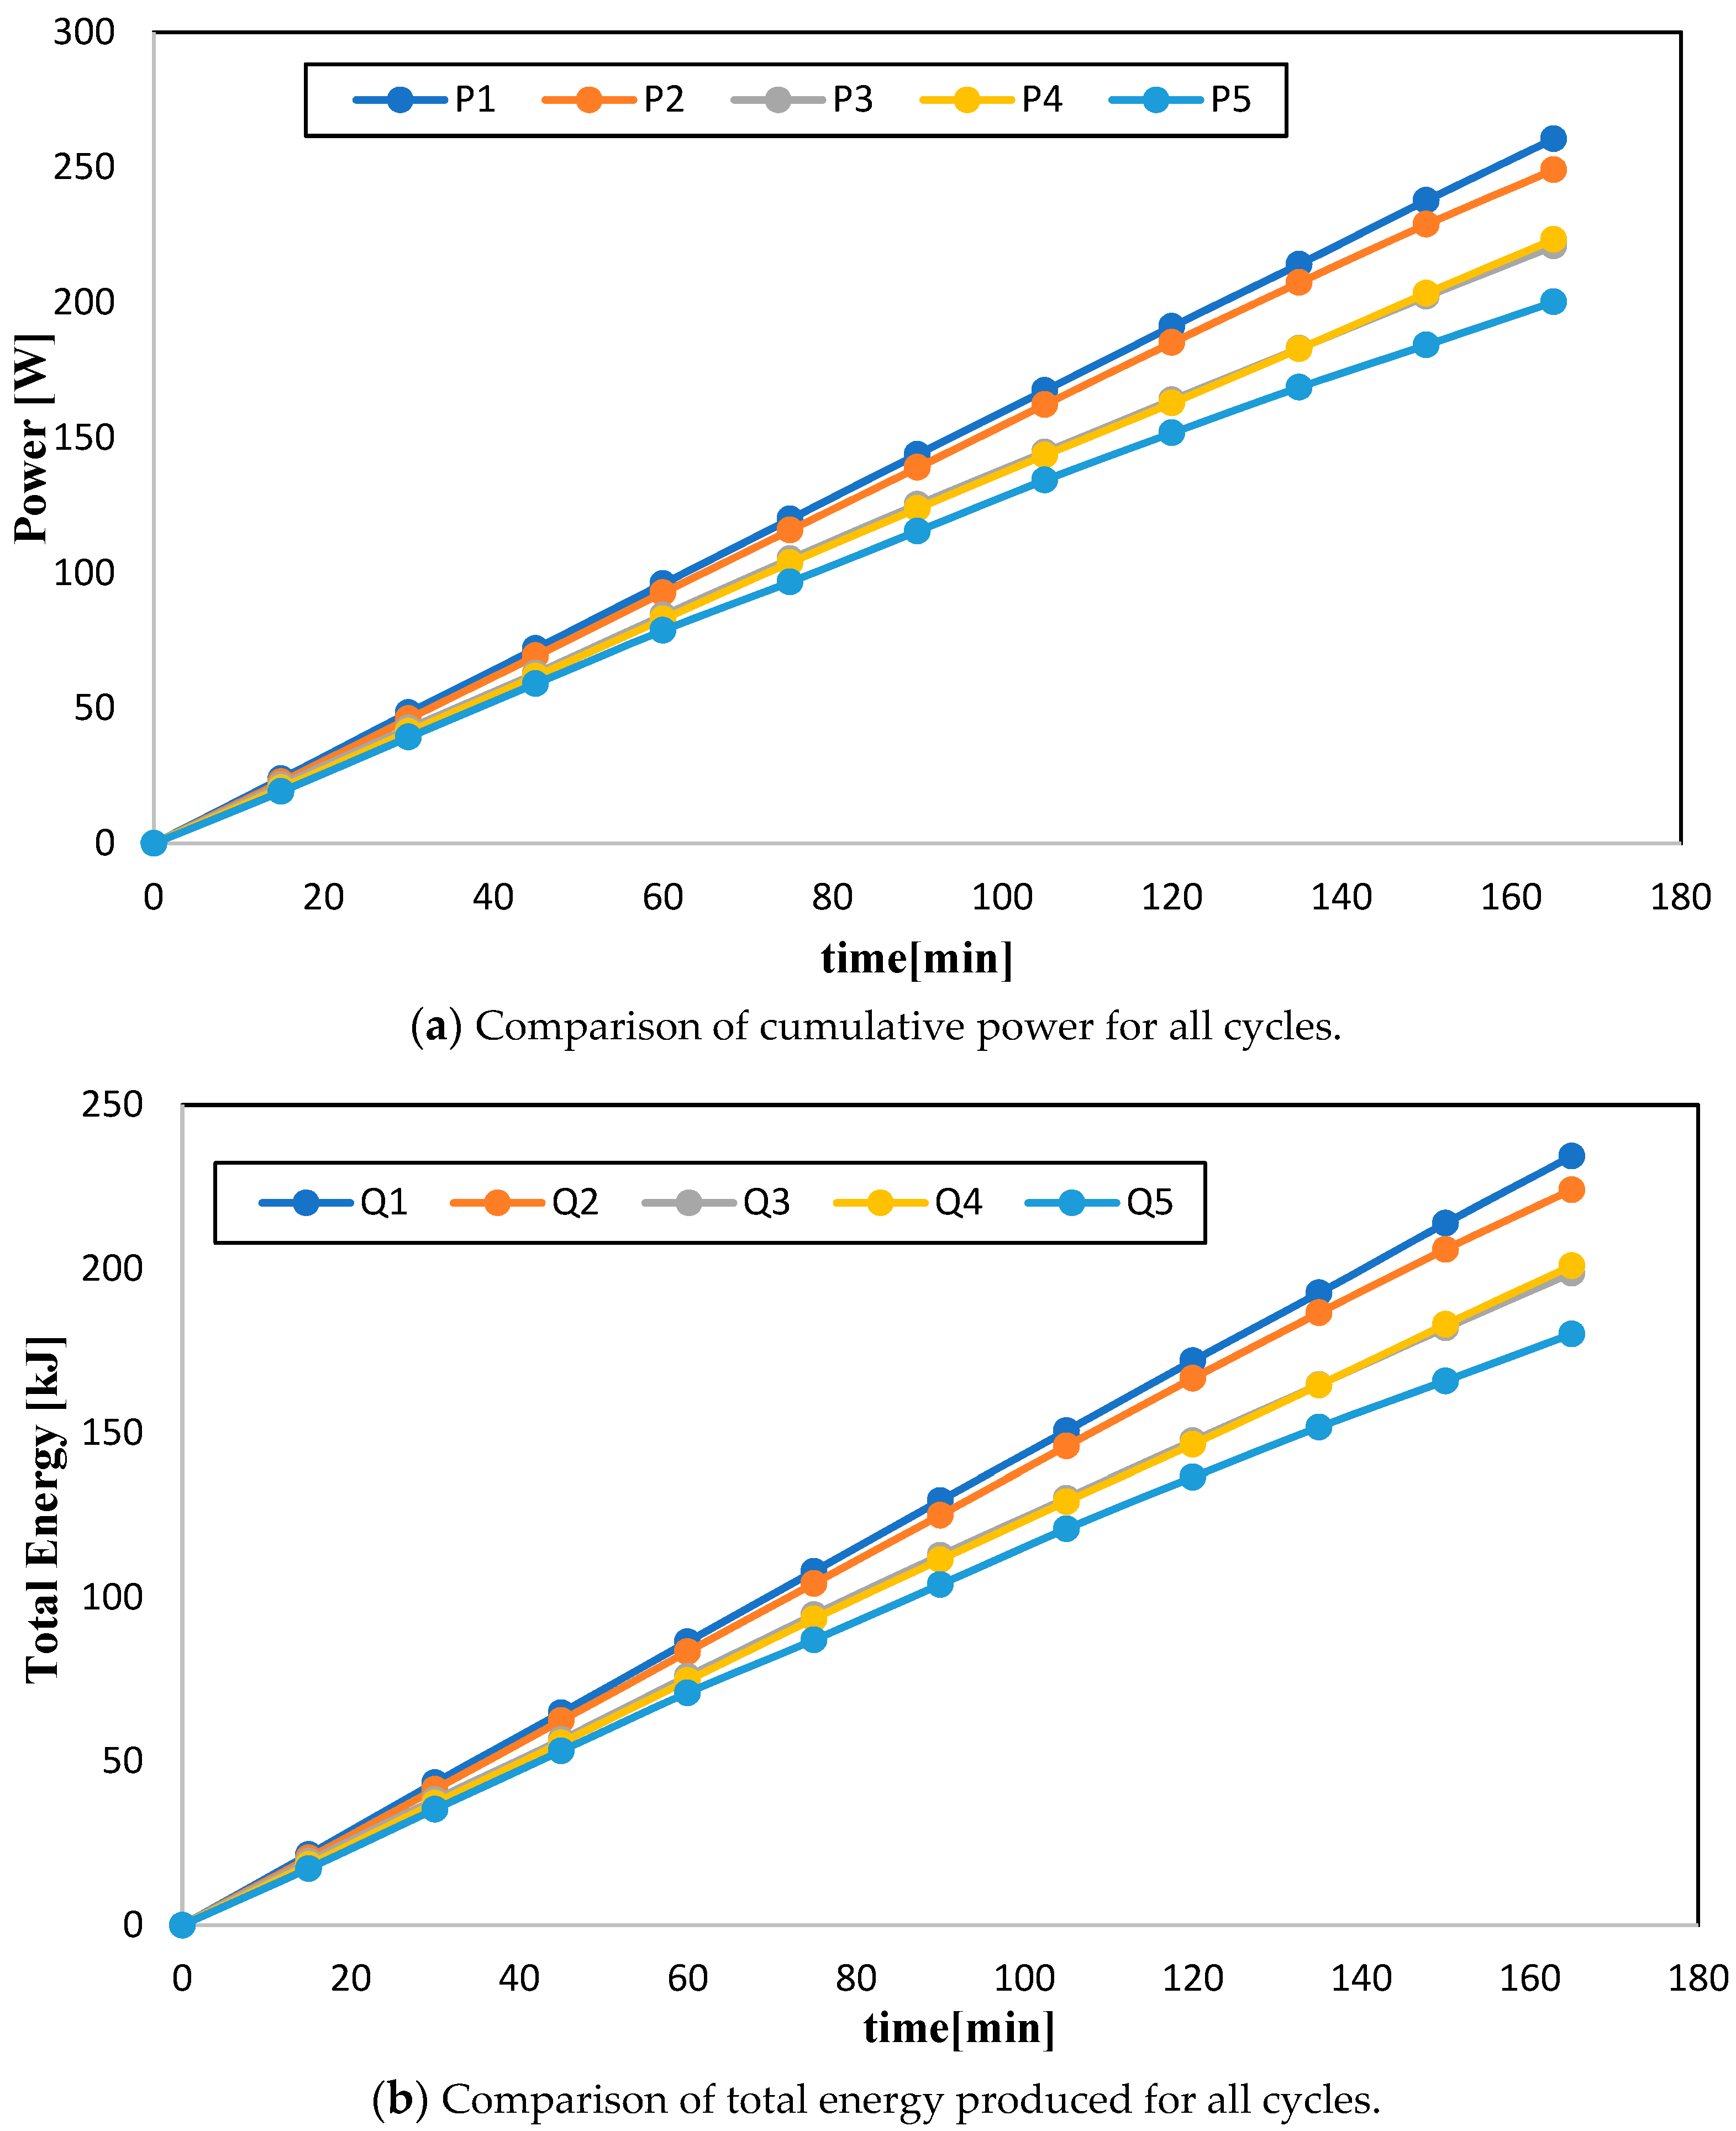
The cumulative power and energy (shown in Figure 10a,b) also follows the same pattern as the cumulative mass adsorbed (see Figure 4). The highest power achieved is by the first cycle, with over 260 W, and the least power is achieved by the fifth cycle, with a total power of about 200 W. Thus, about 60 W is lost after a 5-cycle operation. This reduction is caused by less moisture adsorption with an increasing number of cycles.
Although the power with time seems linear for the first (P1) and second cycles, cycles P2, P3, P4 and P5 show the beginning of the leveling of the curve, with P5 being more prominent. Thus, the power produced in the fifth cycle (P5) is approaching its saturation and this is similar to the total energy produced. The energy produced after 165 min is 234 kJ (equivalent to the heat density 292 kJ/kg) which decreases to 180 kJ (equivalent to the heat density 225 kJ/kg) after the 5-cycle operation. The desorption conditions used were not capable of sufficiently regenerating the silica gel in order to maintain the energy storage density with increasing cycles.
5. Conclusions
An experimental device was designed for testing the change in energy storage density of silica gel using low grade heat for desorption in a small number of cycles. The results show that high adsorption and outlet temperatures can be achieved with this design. A high specific power of 29.5 W/kg was also achieved using silica gel as the adsorbent material. For this study, 292–225 kJ/kg of energy storage density was obtained in a 5 cycle operation. It was also found that with increasing cycles and with the use of low-grade heat (70 °C) during the desorption phase, the amount of moisture adsorbed decreases. This is due to incomplete regeneration (about 60%) caused by the desorption conditions used. Thereby, decreasing the power produced by the silica gel with increasing cycles. The rate of decrease in the storage density was observed to be about 1.6 W/kg. It is also possible that the degradation of the silica gel contributed to the reduction in the power produced with the increasing number of cycles. More cycles would have to be performed in the future to see whether there will be a continuous reduction in the power produced, or whether a constant value will be reached after n cycles. This would give more information on the effect of the degradation on the power produced by the silica gel.
The next step of our work is to perform a large number of cycles, but for higher desorption temperatures (120 °C), and compare it to this work to measure the effects that a low-grade heat source and degradation of the silica gel have on the performance. The efficiencies and coefficient of performance (COP) will also be compared.
Author Contributions
Conceptualization, E.N.A. and K.F.; methodology, E.N.A. and K.F.; formal analysis, E.N.A.; investigation, E.N.A. and K.F.; resources, E.N.A.; data curation, E.N.A.; writing—original draft preparation, E.N.A.; writing—review and editing, K.F.; visualization, E.N.A.; supervision, K.F.; project administration, K.F.; funding acquisition, K.F. All authors have read and agreed to the published version of the manuscript.
Funding
This research was funded by the European Union and the Czech government, in the project “Hybrid materials for hierarchical structures”, grant number CZ.02.1./0.0/0.0/16_019/0000843.
Acknowledgments
The work has been supported by the project “Hybrid materials for hierarchical structures”, research goal: Composite materials and structures, research program: Materials and structures on the metal basis, reg. no. CZ.02.1./0.0/0.0/16_019/0000843 provided by the European Union and the Czech government. I thank Maxwell Amoah and Rhoda Ayorkor Sai for their participation in this work.
Conflicts of Interest
The authors declare no conflict of interest.
Appendix A. Error Analyses
The error analysis was done based on factors that lead to errors in the temperature and relative humidity measurements as well as the accuracy of the measuring devises. The errors in Equations (A1) and (A2) are due to connections (E1), the data logger (E2), the thermocouple (E3) and the humidity sensors (E4). The error in temperature (ET) and the error in relative humidity (ERH) are given as follows:
and
From the given equations above, the maximum error of the temperature and humidity measurements were found to be 4.5% and 4.1%, respectively.
References
- International Renewable Energy Agency (IRENA). Global Energy Transformation: A Roadmap to 2050; IRENA: Abu Dhabi, UAE, 2018; ISBN 1059-910X. [Google Scholar]
- U.S. EIA. Annual Energy Outlook 2019 with Projections to 2050; U.S. EIA: Washington, DC, USA, 2019; Volume 44, pp. 1–64. [Google Scholar]
- Edwards, J.; Bindra, H.; Sabharwall, P. Exergy analysis of thermal energy storage options with nuclear power plants. Ann. Nucl. Energy 2016, 96, 104–111. [Google Scholar] [CrossRef] [Green Version]
- Chidambaram, L.A.; Ramana, A.S.; Kamaraj, G.; Velraj, R. Review of solar cooling methods and thermal storage options. Renew. Sustain. Energy Rev. 2011, 15, 3220–3228. [Google Scholar] [CrossRef]
- Yu, N.; Wang, R.Z.; Wang, L.W. Sorption thermal storage for solar energy. Prog. Energy Combust. Sci. 2013, 39, 489–514. [Google Scholar] [CrossRef]
- Zhang, Y.; Wang, R. Sorption thermal energy storage: Concept, process, applications and perspectives. Energy Storage Mater. 2020, 27, 352–369. [Google Scholar] [CrossRef]
- Wolak, E. The cooling effect by adsorption-desorption cycles. E3S Web Conf. 2017, 14, 01052. [Google Scholar] [CrossRef]
- Silberberg, M.S. Principles of General Chemistry—V1.0M; McGraw-Hill Education: New York, NY, USA, 2009; p. 915. [Google Scholar]
- Li, S.L.; Wu, J.Y.; Xia, Z.Z.; Wang, R.Z. Study on the adsorption performance of composite adsorbent of CaCl2 and expanded graphite with ammonia as adsorbate. Energy Convers. Manag. 2009, 50, 1011–1017. [Google Scholar] [CrossRef]
- Li, T.X.; Wang, R.Z.; Oliveira, R.G.; Kiplagat, J.K.; Wang, L.W. A combined double-way chemisorption refrigeration cycle based on adsorption and resorption processes. Int. J. Refrig. 2009, 32, 47–57. [Google Scholar] [CrossRef]
- Zettl, B.; Englmair, G.; Steinmaurer, G. Development of a revolving drum reactor for open-sorption heat storage processes. Appl. Therm. Eng. 2014, 70, 42–49. [Google Scholar] [CrossRef]
- Sorbentsystems Desiccant Chart Comparisons. 2006. Available online: https://www.sorbentsystems.com/desiccants_charts.html (accessed on 5 May 2020).
- Aristov, Y.I.; Tokarev, M.M.; Freni, A.; Glaznev, I.S.; Restuccia, G. Kinetics of water adsorption on silica Fuji Davison RD. Microporous Mesoporous Mater. 2006, 96, 65–71. [Google Scholar] [CrossRef]
- Ng, K.C.; Chua, H.T.; Chung, C.Y.; Loke, C.H.; Kashiwagi, T.; Akisawa, A.; Saha, B.B. Experimental investigation of the silica gel-water adsorption isotherm characteristics. Appl. Therm. Eng. 2001, 21, 1631–1642. [Google Scholar] [CrossRef]
- Deshmukh, H.; Maiya, M.P.; Srinivasa Murthy, S. Study of sorption based energy storage system with silica gel for heating application. Appl. Therm. Eng. 2017, 111, 1640–1646. [Google Scholar] [CrossRef]
- Bales, C.; Gantenbein, P.; Jaenig, D.; Kerskes, H.; Summer, K.; Van Essen, M.; Weber, R. Laboratory Tests of Chemical Reactions and Prototype Sorption Storage Units. Available online: http://www.task49.iea-shc.org/data/sites/1/publications/task32-b4.pdf (accessed on 5 May 2020).
- Li, G.; Qian, S.; Lee, H.; Hwang, Y.; Radermacher, R. Experimental investigation of energy and exergy performance of short term adsorption heat storage for residential application. Energy 2014, 65, 675–691. [Google Scholar] [CrossRef]
- Mohammed, R.H.; Mesalhy, O.; Elsayed, M.L.; Su, M.C.; Chow, L. Revisiting the adsorption equilibrium equations of silica-gel/water for adsorption cooling applications. Int. J. Refrig. 2018, 86, 40–47. [Google Scholar] [CrossRef]
- Amorim, J.A.; Vieira, H.M.; Andrade, C.H.T.; Medeiros, J.M.; Santos, J.C.; Gurgel, J.M. Experimental Sorption Dynamic in Packed Bed of Silica Gel. J. Porous Media 2013, 16, 515–525. [Google Scholar] [CrossRef]
- Takahashi, R.; Sato, S.; Sodesawa, T.; Kawakita, M.; Ogura, K. High surface-area silica with controlled pore size prepared from nanocomposite of silica and citric acid. J. Phys. Chem. B 2000, 104, 12184–12191. [Google Scholar] [CrossRef]
- Sultan, M.; Miyazaki, T.; Koyama, S. Optimization of adsorption isotherm types for desiccant air-conditioning applications. Renew. Energy 2018, 121, 441–450. [Google Scholar] [CrossRef]
- Chakraborty, A.; Saha, B.B.; Aristov, Y.I. Dynamic behaviors of adsorption chiller: Effects of the silica gel grain size and layers. Energy 2014. [Google Scholar] [CrossRef]
- Traiva. technický—produktový list technický—produktový list. Available online: https://www.google.com.hk/url?sa=t&rct=j&q=&esrc=s&source=web&cd=&ved=2ahUKEwiWxJiJyb_rAhWIvZQKHT2NDhQQFjAAegQIBBAB&url=https%3A%2F%2Fwww.traiva.cz%2F_doc%2F4835_technicky_list_SG_6.pdf&usg=AOvVaw3cDl7enXbJx_pacLORfwJN (accessed on 5 May 2020).
- Al-Ghouti, M.A.; Da’ana, D.A. Guidelines for the use and interpretation of adsorption isotherm models: A review. J. Hazard. Mater. 2020, 393, 122383. [Google Scholar] [CrossRef]
- Ayawei, N.; Ebelegi, A.N.; Wankasi, D. Modelling and Interpretation of Adsorption Isotherms. J. Chem. 2017, 2017. [Google Scholar] [CrossRef]
- Wang, J.Y.; Wang, R.Z.; Wang, L.W. Water vapor sorption performance of ACF-CaCl2 and silica gel-CaCl2 composite adsorbents. Appl. Therm. Eng. 2016, 100, 893–901. [Google Scholar] [CrossRef]
- Jähnig, D.; Hausner, R.; Wagner, W.; Isaksson, C. Thermo-Chemical storage for solar space heating in a single-family house. In Proceedings of the AEE—INTEC (Austria), Ecostock Conference, Pomona, NY, USA, 31 May–2 June 2006; pp. 1–7. [Google Scholar]
- Mohammed, R.H.; Mesalhy, O.; Elsayed, M.L.; Hou, S.; Su, M.; Chow, L.C. Physical properties and adsorption kinetics of silica-gel/water for adsorption chillers. Appl. Therm. Eng. 2018, 137, 368–376. [Google Scholar] [CrossRef]
- Gaeini, M. Thermochemical Seasonal Heat Storage for the Built Environment. Available online: https://research.tue.nl/files/70475072/20170704_Gaeini.pdf (accessed on 5 May 2020).
- Johannes, K.; Kuznik, F.; Hubert, J.L.; Durier, F.; Obrecht, C. Design and characterisation of a high powered energy dense zeolite thermal energy storage system for buildings. Appl. Energy 2015, 159, 80–86. [Google Scholar] [CrossRef]
Figure 1.
Functional architecture of the proposed storage system.

Figure 2.
Top: Depicts the 3D outline of (A) the experimental prototype heat gun, (B) the upstream duct, (C) the sorption tube, (D) the downstream duct, (E) the connection to the pump, (F) the atomizer, and (G) the connection to the compressor. Bottom: (H) The data acquisition device, and (I) the computer.

Figure 3.
Phase mass adsorbed.

Figure 4.
Cumulative mass adsorbed.

Figure 5.
A graph showing temperature out and average temperature lift for cycle 1.

Figure 6.
Output temperatures for all cycles.

Figure 7.
Average temperature lift plotted against the number of cycles.

Figure 8.
Comparison of power generated at a given time for all cycles.

Figure 9.
Change in mean specific power over five cycles.

Figure 10.
Comparison of cumulative power (a) and energy for all cycles (b).


Table 1.
Parameters used for the analysis of the system.
| Symbol | Parameter | Value |
|---|---|---|
| Cps | Specific heat capacity of silica gel | 924 J/kg/K |
| Cpw | Specific heat capacity of water | 4180 J/kg/K |
| Cpv | Specific heat capacity of vapor | 1866 J/kg/K |
| ∆H | Isosteric heat of adsorption | 2.07 × 10⁶ J/kg |
| Ea | Activation energy | 3.73 × 10⁴ J/mol |
| Dso | Pre-exponential term | 2.54 × 10⁻⁴ m2/s |
| Rp | Adsorbent particle radius | 1 × 10⁻³ m |
| R | Universal gas constant | 8.314 J/mol/K |
| Ṽ | Air flow rate | 3.0 m3/h |
| dp | Pore diameter | (2.0–3.0) nm |
| n | Uploading factor | 1.6 (-) |
© 2020 by the authors. Licensee MDPI, Basel, Switzerland. This article is an open access article distributed under the terms and conditions of the Creative Commons Attribution (CC BY) license (http://creativecommons.org/licenses/by/4.0/).
Share and Cite
MDPI and ACS Style
Ayisi, E.N.; Fraňa, K. The Design and Test for Degradation of Energy Density of a Silica Gel-Based Energy Storage System Using Low Grade Heat for Desorption Phase. Energies 2020, 13, 4513. https://doi.org/10.3390/en13174513
AMA Style
Ayisi EN, Fraňa K. The Design and Test for Degradation of Energy Density of a Silica Gel-Based Energy Storage System Using Low Grade Heat for Desorption Phase. Energies. 2020; 13(17):4513. https://doi.org/10.3390/en13174513
Chicago/Turabian StyleAyisi, Emmanuel Nyarko, and Karel Fraňa. 2020. "The Design and Test for Degradation of Energy Density of a Silica Gel-Based Energy Storage System Using Low Grade Heat for Desorption Phase" Energies 13, no. 17: 4513. https://doi.org/10.3390/en13174513
Note that from the first issue of 2016, this journal uses article numbers instead of page numbers. See further details here.