Application of Second-Law Analysis for the Environmental Control Unit at High Ambient Temperature †


1
Mechanical Engineering Department, College of Engineering and Petroleum, Kuwait University, P.O. Box 5969, Safat 13060, Kuwait
2
Ray W. Herrick Laboratories, School of Mechanical Engineering, Purdue University, 177 S. Russell Street, West Lafayette, IN 47907-2099, USA
*
Author to whom correspondence should be addressed.
†
This paper is an extended version of our paper published in Proceedings of the 16th International Refrigeration and Air Conditioning Conference at Purdue, West Lafayette, IN, USA, 11–14 July 2016, Paper ID: 2328.
Energies 2020, 13(12), 3274; https://doi.org/10.3390/en13123274
Submission received: 2 May 2020
/
Revised: 14 June 2020
/
Accepted: 18 June 2020
/
Published: 24 June 2020
Abstract
:This paper assesses the application of the second-law of thermodynamics in a military Environmental Control Unit (ECU) to evaluate the exergy destruction (or irreversibility) in each component when operating at high ambient temperature. Experimental testings were conducted on three ECUs, 1.5 (5.3 kW), 3 (10.6 kW), and 5 (17.6 kW) tons of refrigeration (RT), to assess the potential contribution of each component to enhance the overall energy efficiency of the system, and to determine the feasibility of the thermodynamic model presented herein. The analysis provided for extreme high ambient conditions up to 51.7 °C (125 °F). The results yielded that the highest irreversibility was associated with compressors (32.4% to 42.5%). This is followed by the heat exchanges (19.6% to 32.9%) in the case of 1.5-RT and 3-RT units, whereas for the 5-RT unit, the highest irreversibility was associated with the evaporator followed by the one of the compressors. In the 3-RT ECU, the condenser’s second-law efficiency enhanced due to an additional fan, yet the working refrigerant increased the irreversibility in the expansion device. The second-law analysis recognized the components with the highest exergy destruction and identified the direction to enhance the exergetic efficiency of any ECU operating at high-temperature climate.
Key Contribution: Second-law analysis has been developed to improve energy efficiency for environmental control units (ECUs). Extensive experimental testing has been conducted for three ECUs; 1.5-RT, 3-RT and 5-RT. Analytical results have been provided for extreme high ambient condition up to 51.7 °C (125 °F). The study yielded that the highest irreversibility associated with compressor (32.4% to 42.5%), followed by heat exchanges (19.6% to 32.9%).
1. Introduction
Environmental Control Units (ECUs) have been commonly used by the military for space cooling inside shelters in hot climate regions. An ECU is a packaged air conditioner using a typical vapor compression cycle. The main components include a compressor, a condenser, an expansion valve, an evaporator, and a controller. The energy performance of the ECU, typically quantified by the Energy Efficiency Ratio (EER) or the Coefficient of Performance (COP) is evaluated based on the first law of thermodynamics. According to the first law of thermodynamics, energy cannot be created or destroyed. The second law of thermodynamics associates quality with energy and can be used to evaluate the degradation in the quality of energy during a process or a cycle. Therefore, compared to energy analysis, the exergy analysis can be used to detect the location of irreversibilities. The exergetic efficiency of an ECU is a result of the destruction of available energy (or exergy) generated by the individual system’s parts. Therefore, a combined first- and second-law analysis directly identifies the components with the potential to improve the efficiency of the ECU. Second-law analyses can be categorized into irreversibility and exergy (or availability) analyses. The former discusses the entropy generation with irreversibility, while the latter addresses the conversion and loss of exergy.
In recent studies, second-law analyses have increasingly been applied to a variety of heating, ventilating, and air conditioning (HVAC) applications. Bejan [1] developed an analytical method to conduct second law analyses for thermal systems; whereas Cengel and Boles [2], Moran et al. [3], Dincer and Rosen [4] drafted the second-law analysis for HVAC applications. Fartaj et al. [5], Xu et al. [6] studied super-critical CO cycle using second-law analysis. Meunier et al. [7], Şencan et al. [8] utilized the second-law analysis to absorption and adsorption refrigeration systems. Kilicarslan and Hosoz [9], Gill and Singh [10] applied second-law analysis to a cascade refrigeration system using various refrigerant pairs, namely R-152a/R-23, R-290/R-23, R-507/R-23, R-234a/R-23, R-717/R-23, R-404a/R-23, and R-134a/LPG; whereas Arora and Kaushik [11], Oruç and Devecioğlu [12], Yataganbaba et al. [13] examined alternative refrigerants such as R-502, R-404A, R-507A, R-417A, R-424A, R-1234yf, and R-1234ze to replace refrigerants harmful to the environment (i.e., R-22 and R-134a) using exergy analysis. Similarly, Mota-Babiloni et al. [14], Babarinde et al. [15], Gill et al. [16], Modi et al. [17], de Paula et al. [18] utilized the exergy analysis in vapor compression refrigeration systems using alternatives R-143m, R-1234yf, R-161, R-450A, R-513A, R-1270, R-290, R-600a, and R-744 to replace R-134a.
As for vapor compression refrigeration systems, Ahamed et al. [19] reviewed studies on exergy analysis for vapor compression refrigeration systems and found that irreversibilities can be reduced by condenser subcooling of up to 5 °C and reducing the temperature difference between the external fluid temperatures and the evaporating and condensing temperatures. They showed that the significant portion of irreversibilities was intrinsic to the compressor that could be reduced by maintaining compressor discharge and suction temperatures within 65 °C and 14 °C, respectively. Bridges et al. [20] performed a second-law analysis to evaluate the irreversibilities associated with the system’s parts in an R-134a household refrigerator with a volume of 0.51 m (18 ft) and a split-system R-410A air conditioner with a capacity of 3 tons of refrigeration (RT). They identified the potential in the individual system’s part to enhance the overall exergetic efficiency. The results declared that the proportion of irreversibilities inherent to the refrigerator’s components conformed the sequence; compressor, condenser, and then evaporator; whereas, for the air conditioner unit, the evaporator ranked first, then the condenser and the compressor. Likewise, Yumrutaş et al. [21] numerically studied the effects of evaporating and condensing temperatures using exergy analysis on the performance of a vapor compression refrigeration cycle with a cooling load of 1 kW using refrigerant R-717. They showed significant degradation in exergy, and an increase in the component’s irreversibility as the temperature lift increased. The exergy loss was estimated to be around 50% in the compressor when operating at a condensing temperature of 30 °C and a evaporating temperature of °C. Kabul et al. [22] investigated the irreversibility of using hydrocarbons (i.e., R-600a) in a case study of 1 kW refrigeration system with an internal heat exchanger. The results showed that the compressor had the highest irreversibility rate of 46.41%, while the internal heat exchanger had the lowest of 2.29% relative to the overall irreversibility. Lee [23] applied exergy analysis to data sets obtained from a modified water-cooled screw-chiller with a cooling capacity of 100-RT using refrigerant R-22. The analytical results showed that the irreversibility percentages associated with the components followed the order; compressor 38% to 47%, followed by condenser 22% to 27%, and then evaporator 17% to 23%. Byrne and Ghoubali [24] numerically utilized exergy analysis for an air-source heat pump system with R-407C and R-290 for simultaneously heating and cooling. The analysis was averaged for outlet cold source/outlet hot source temperatures: 7/25 °C, 7/35 °C, and 7/45 °C. The results showed that the exergy destruction occurred mainly in the compressor by approximately 55% due to the high heat losses. In addition, maximizing the area of the heat exchangers would minimize the exergy destruction, but further exergo-economic analysis was required to optimize for the cost. Furthermore, Voloshchuk et al. [25] found that for an R-134a air-source heat pump system, the maximum exergy destruction is associated with the evaporator by 63% due to its thermodynamics inefficiency (i.e., high pressure drops or high temperature differences).
The literature review above shows that the application of a second-law analysis of a military Environmental Control Unit (ECU) under extremely high ambient conditions (e.g., 51.7 °C (125 °F) or higher) is still lacking. Therefore, this study aims to develop a methodology to assess the irreversibilities within the components of an ECU using a second-law analysis, and to distinguish the potential contribution in each system’s component relative to the overall exergetic efficiency when operating at high ambient temperature conditions of outdoor temperature condition of 51.7 °C (125 °F) and indoor temperature condition of 32.2 °C (90 °F) with a relative humidity of 50%. Three ECUs, 1.5 (5.3 kW), 3 (10.6 kW), and 5 (17.6 kW) tons of refrigeration (RT), are tested at a high ambient condition to confirm the model developed herein. The ECUs are packaged air conditioners that have a scroll type compressor, a micro-channel type condenser, a thermostatic expansion valve, and a fin-and-tube type evaporator. The 1.5-RT and 5-RT ECUs have hot-gas by-pass circuits and use R-407C as the refrigerant, while the 3-RT ECU uses R-410A. Comparisons were made to yield a clear decision on how to enhance the system exergetic efficiency of the ECU. To be noted that this paper is an extension of Bahman and Groll [26]. The main contribution of this work includes, but not limited to, literature review, experimental analysis and verification, uncertainty analysis, and parametric analysis.
2. Second-Law Analysis
2.1. Thermodynamic Modeling
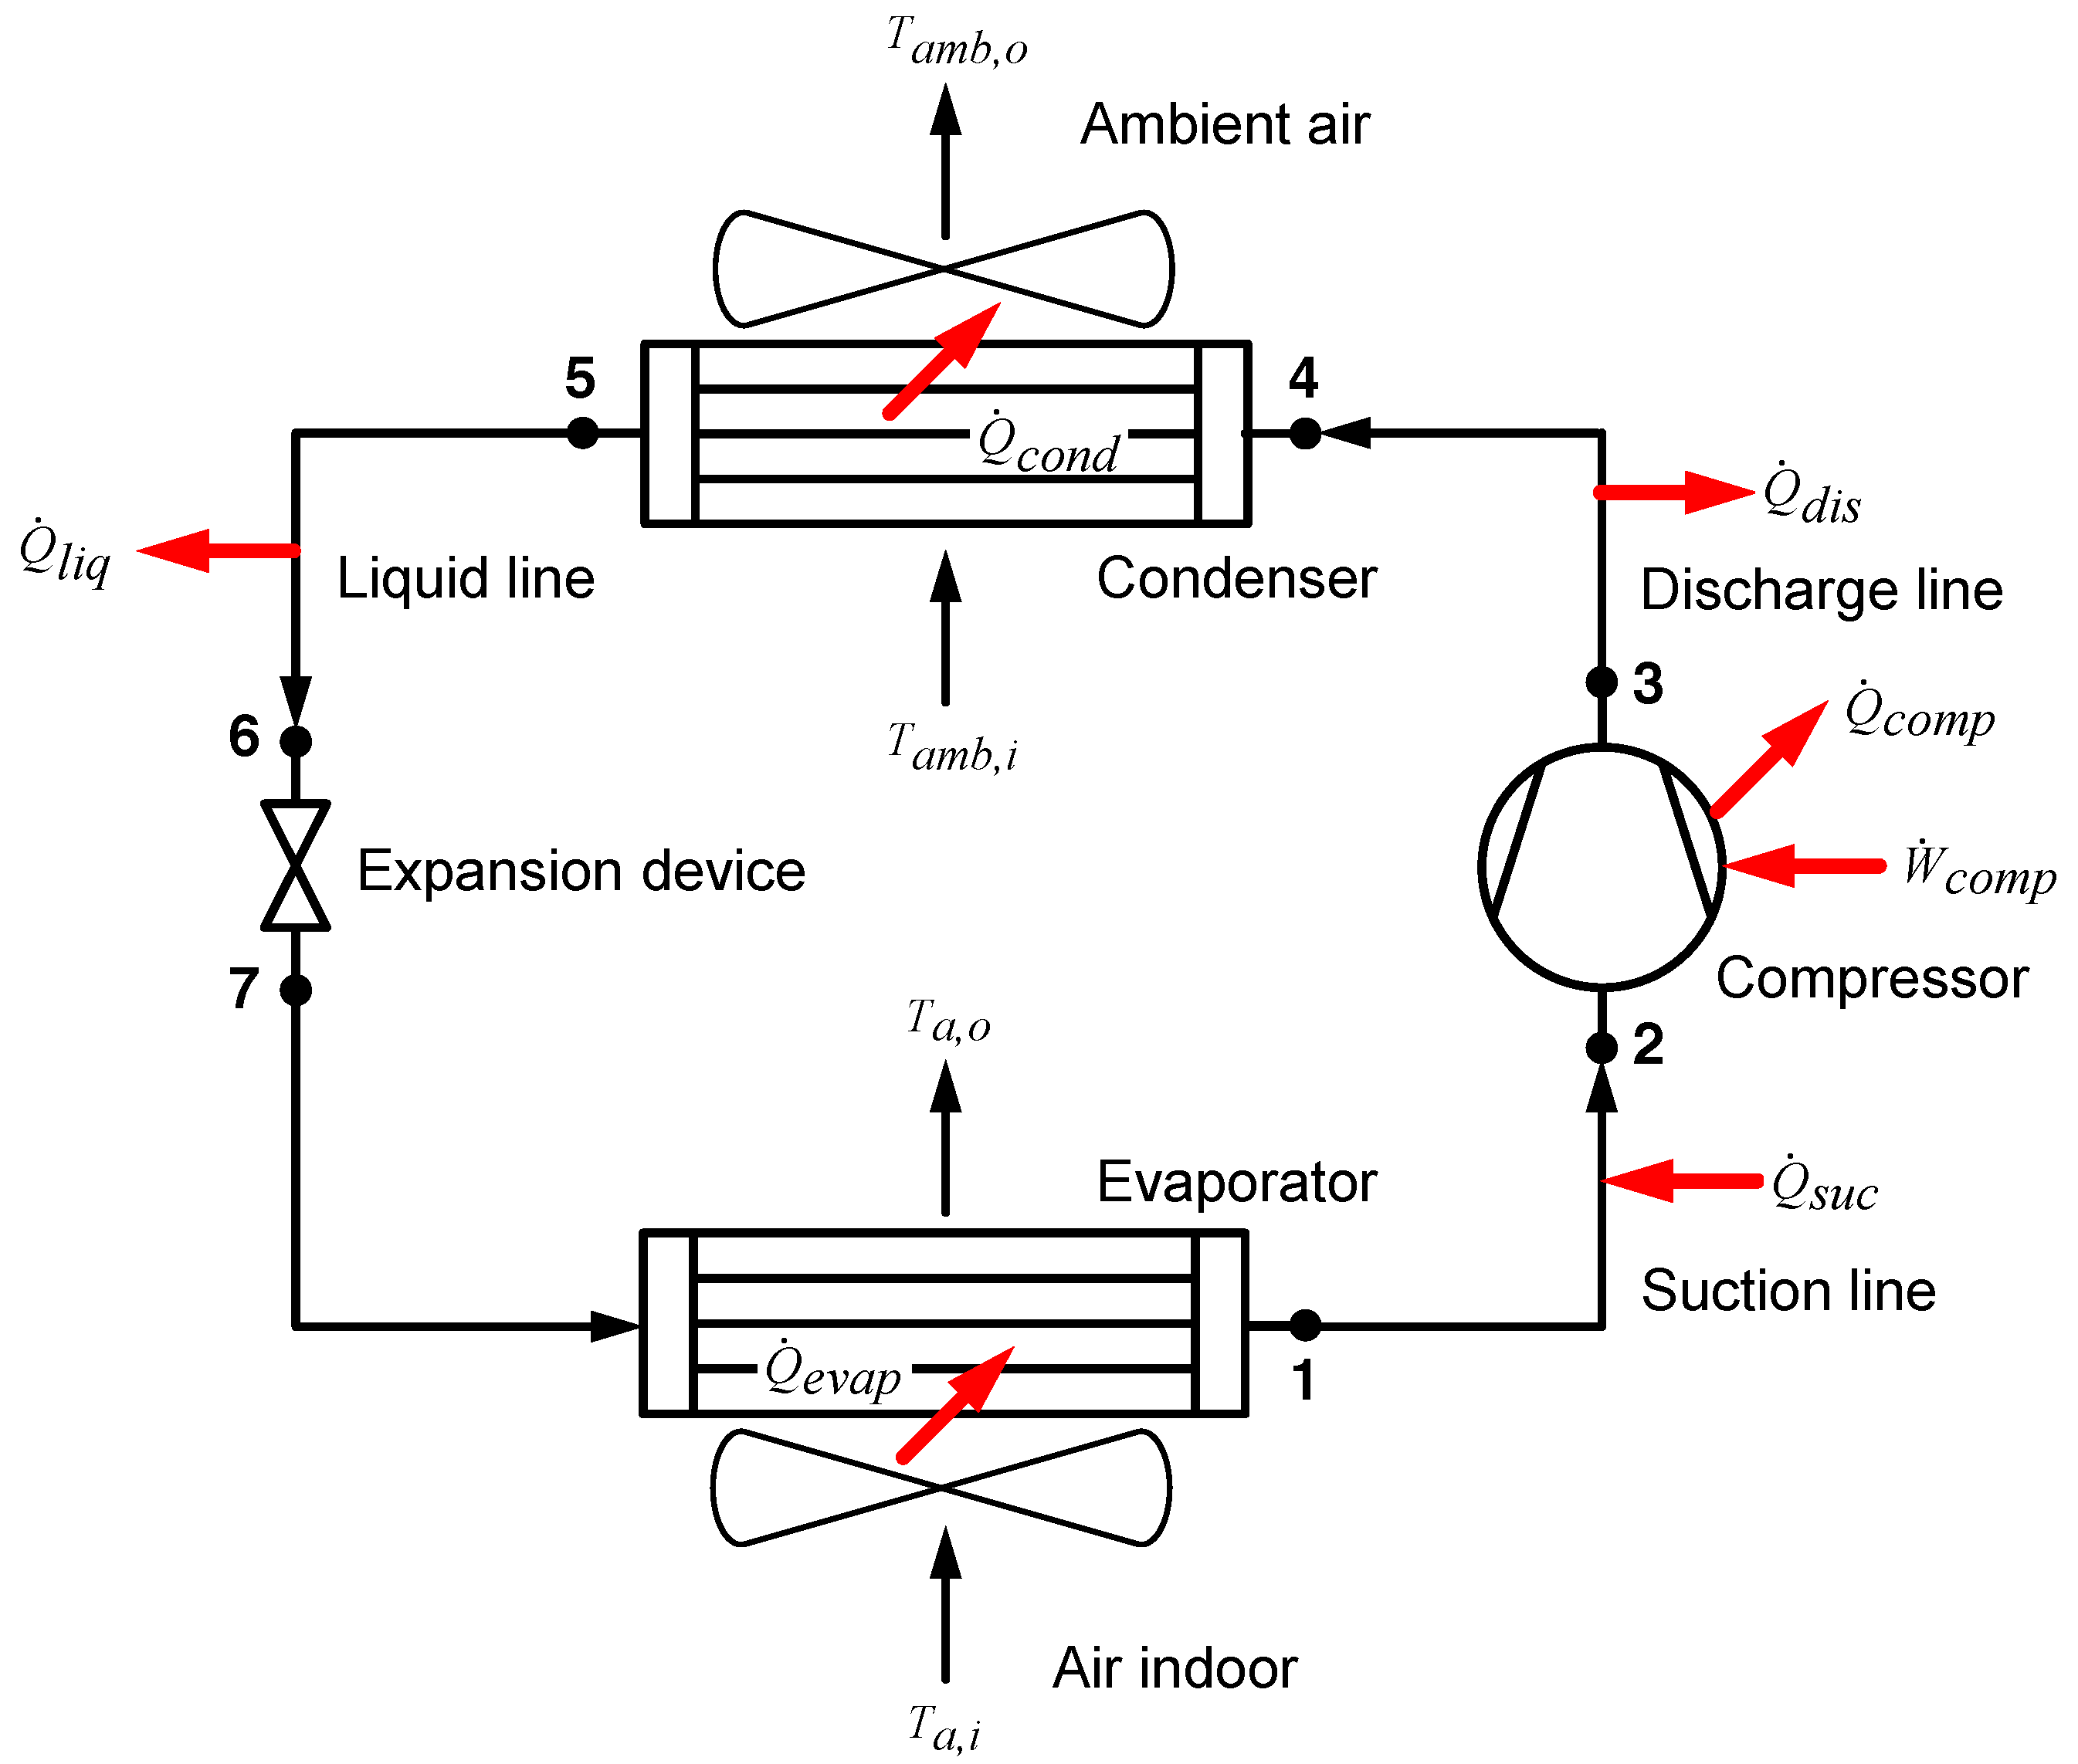
The typical vapor compression refrigeration cycle comprises several parts, such as a compressor, a condenser, an evaporator, an expansion device, and connecting tubes. It varies from the ideal cycle in various ways, mostly due to the irreversibility associated with different parts. In the actual refrigeration cycle, two well-known sources of irreversibility are heat transfer across a finite temperature difference and fluid friction, which causes a pressure drop.
Figure 1 shows each component of a vapor compression system designated by control volumes that experience steady-flow processes. Cengel and Boles [2] gave mathematical expressions for the first- and the second-laws of thermodynamics for a steady-flow steady-state process can be expressed as follows:
The exergy destruction (or irreversibility) during each process can be estimated with the Gouy-Stodola equation as follows:
The exergy (or availability) for a steady-flow process of each component is calculated from the reduced form of the general exergy balance as:
The energy, entropy, and exergy balances can be simplified further with additional assumptions for every device. The condenser, evaporator, expansion device, and connecting tubes are assumed to conduct no work. The refrigerant undergoes an actual compression process in the compressor. The throttling process of the expander is assumed to be isenthalpic. The changes in kinetic and potential energy of the refrigerant within every component are negligible. Analyses on evaporator and condenser fans are excluded because the irreversibilities are relatively negligible compared to the other main components [4].
2.2. Second-Law and Availability Analysis for ECU Components
2.2.1. Evaporator
In the evaporator process analysis, the control volume selected consists of the evaporator’s physical structure and the refrigerant and indoor airflow through the evaporator. In this process, energy is transferred by heat from the indoor air to the refrigerant. The evaporator heat transfer rate , from the indoor air to the refrigerant, and the evaporator entropy generation rate , can be estimated as follows:
where is the sink temperature, which is the bulk temperature of the indoor environment.
Component second-law efficiency , can be defined as the ratio of exergy recovered (or availability recovered) to the exergy supplied (or availability supplied). Therefore, evaporator second-law efficiency can be defined as the ratio of the change in indoor air exergy to the change in refrigerant exergy:
where and can be determined as follows:
2.2.2. Compressor
The compressor exhibited an irreversible and non-adiabatic process. In the compression process, the energy transfers across the control volume include an external input work from the surroundings to the compressor and a heat loss from the compressor to the surroundings. The rate of heat loss is:
and compressor entropy generation during the compression process can be estimated by:
where is the bulk temperature of the surroundings, is the input work rate to the compressor, and is the refrigerant mass flow rate, all of which are experimentally measured.
Compressor second-law efficiency is defined as the ratio of the change in flow exergy across the compressor to the actual work consumption:
where is simplified from Equation (4) as:
2.2.3. Condenser
The control volume used to analyze the condenser encloses the condenser’s physical structure and includes the refrigerant and ambient airflow through the condenser. Energy is transferred from the refrigerant to the ambient air as heat. The heat transfer rate, , from the refrigerant to the ambient air can be determined as follows:
and the rate of entropy generation during the condensing process can be estimated by:
where is the source temperature, which is the bulk temperature of outdoor ambient air.
Condenser second-law efficiency can be explained as the ratio of the change in ambient air exergy to the change in refrigerant exergy:
where and are simplified from Equation (4) as:
2.2.4. Expansion Valve
The throttling valve is assumed to be exhibited an isenthalpic expansion process. Hence, the energy and entropy balances yield:
Expansion valve second-law efficiency is explained as the ratio of the outlet exergy to the inlet exergy:
where and are expressed as follows:
2.2.5. Connecting Pipelines
The pipelines considered in this work involve the suction, the discharge, and the liquid lines, but exclude the line between the expander and the evaporator because this line is relatively short. The heat loss or heat gain between the connecting tubes and the surrounding can be estimated as follows:
The associated rate of entropy generation between the pipelines and their surrounding can be determined by:
The second-law efficiency for the connecting pipes can be defined as the ratio of the outlet exergy to the inlet exergy:
where the exergy , for each connecting pipe is expressed as follows:
2.3. First- and Second-Law Efficiency of ECUs
The sum of the exergy destruction (or irreversibility) of a vapor compression refrigeration cycle can be calculated by:
Therefore, the exergy destruction ratio for every part of the vapor compression cycle is estimated as follows:
The coefficient of performance (COP) of the vapor compression cycle, explained based on the first law of thermodynamics can be determined by:
The efficiency of the second-law, , is explained as the ratio of the actual COP to the maximum possible COP under the same operating conditions which can be expressed as follows:
where COP is defined asy
where and are the absolute source and sink temperatures, respectively.
3. Experimental Methodology
3.1. Experimental Setup and Procedures
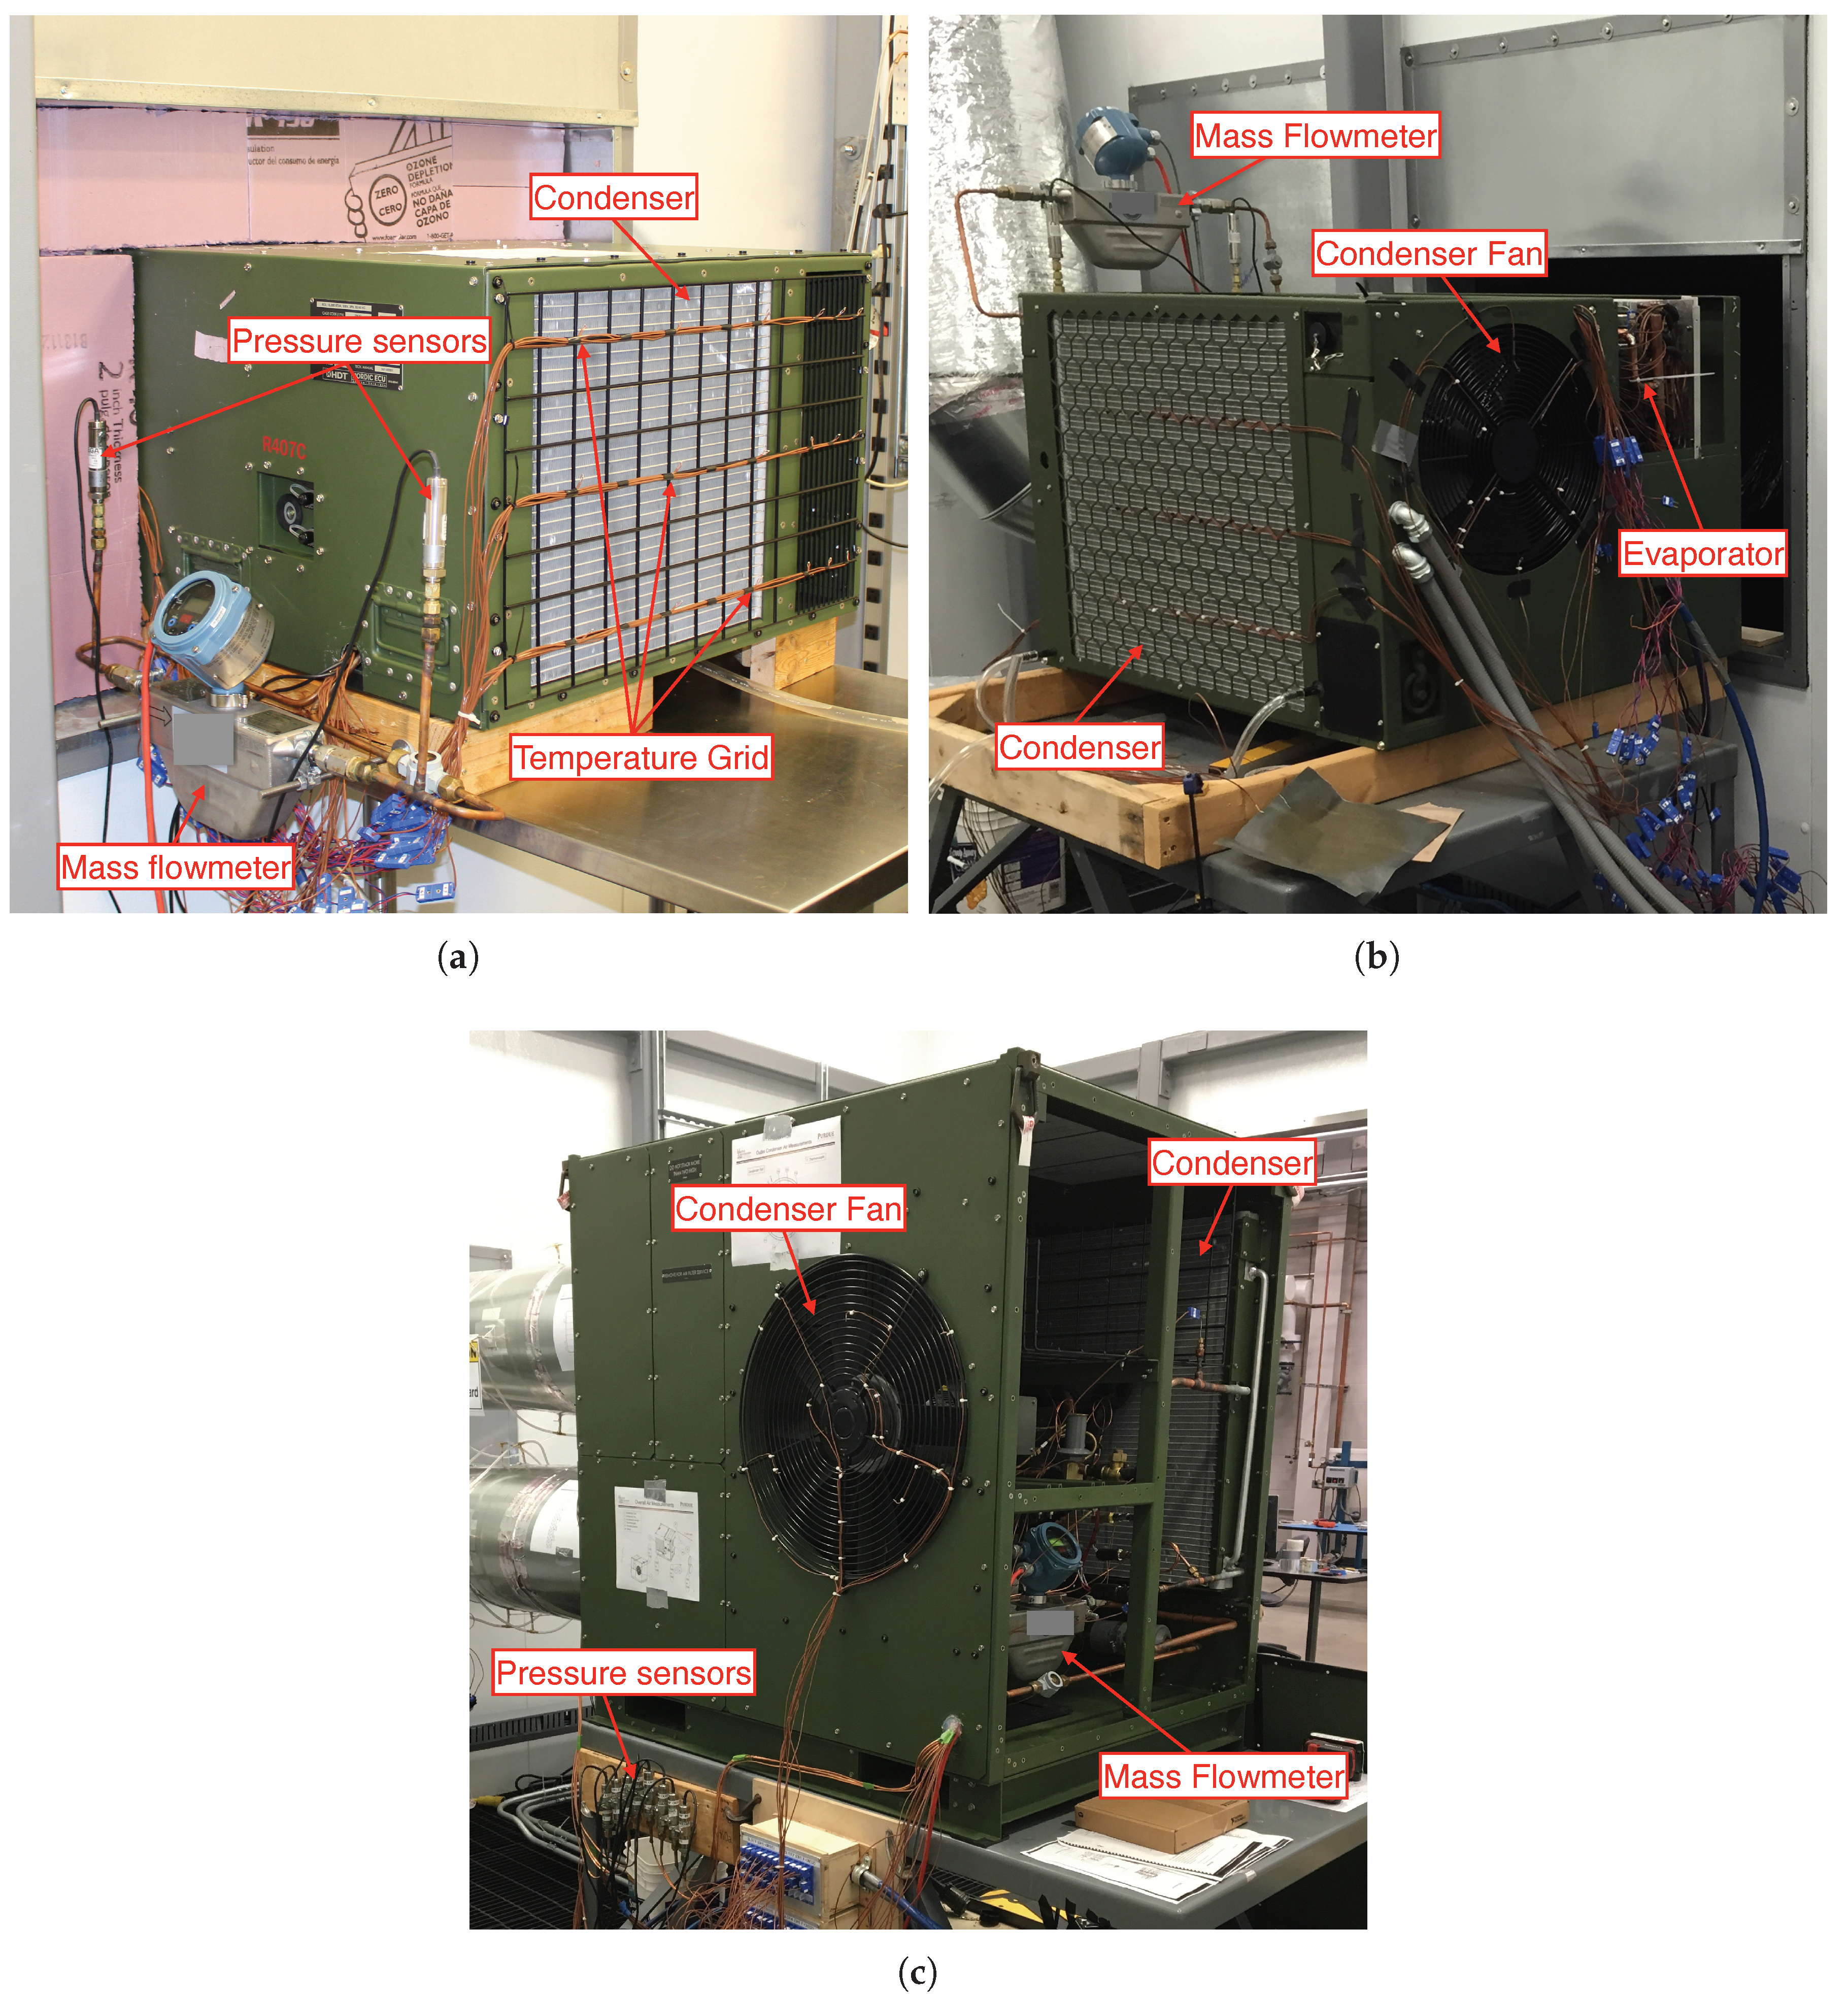
Three Environmental Control Units (ECUs), shortened as 1.5-RT, 3-RT, and 5-RT ECUs as shown in Figure 2, were tested under the same extreme conditions in adjacent pairs of psychrometric chambers to validate the effectiveness of the second-law analysis. Figure 3 presents the ECU system schematic. The 1.5-RT ECU uses R-407C as a working refrigerant and has a rated capacity of 5.3 kW (18,000 Btu/h). The evaporator is a fin-and-tube type heat exchanger made of copper material tubes and corrosion resistance with E-coating. The evaporator fins are made of aluminum material with E-coating. The condenser is a multi-louvered micro-channel type made of aluminum material, treated with clad material for corrosion protection. The throttling valve is a thermostatic expansion device with external pressure equalizer. The compressor is a hermetic scroll type compressor. Note that there is also a hot-gas by-pass loop that allows the system to continue to operate even during the cases when the thermostat set-point temperature was reached. Both the hot-gas and the de-superheating valves are separated with isolation ball valves; therefore, only four components are in operation. The 5-RT ECU is of the same type as the 1.5-RT ECU except that it is rated for a cooling capacity of 17.6 kW (60,000 Btu/h). The 3-RT ECU is of the same type as the 1.5-RT ECU except that the 3-RT ECU has no by-pass circuit, and it is rated for a cooling capacity of 10.6 kW (36,000 Btu/h). It has two condenser fans and uses refrigerant R-410A. The 1.5-RT, 3-RT, and 5-RT ECUs were charged with 1.48 kg (3.27 lb), 2.36 kg (5.21 lb), and 2.98 kg (6.56 lb), respectively. The 1.5-RT, 3-RT, and 5-RT ECUs had scroll type compressors from Emerson/Copland (models: ZR24K3E-TF5, ZP44K5E-TF5, and ZR68KCE-TF5) with a displacement of 7.14 m/h, 8.82 m/h, and 19.53 m/h, respectively.
Two side-by-side psychrometric rooms were utilized to experimentally test the ECUs with performance tests. The psychrometric chambers provide a uniform airflow rate where air temperature and air humidity remained within ±0.55 °C and ±0.5% of set-points, respectively. The following variables were measured: pressure and temperatures at the inlet and outlet of all components, air humidity at the inlet and outlet of the cooling coil, refrigerant flow rate, and power consumption. All experimental instrumentation measurements followed the requirements of ANSI/AHRI Standard 210/240 [27]. Figure 3 shows the location of each measurement instrument, whereas Table 1 summarizes the accuracy of the corresponding instruments. It is also assumed that the pressure is constant in the tube-side of the suction and discharge lines because of the design compactness of the unit sizes.
3.2. Experimental Methods
The experimental tests were performed in side-by-side psychrometric rooms to simulate indoor and outdoor environments, with the ECUs in the outdoor room. Table 2 lists all the testing conditions conducted in this work. Test Conditions 4 is the typical rating condition conformed by ANSI/AHRI Standard 210/240 [27]; whereas Test Conditions 1 to 3 provide the ambient temperature conditions for hot climates. Test Condition 4 was selected to charge all ECUs. All ECUs were charged with the amount mentioned in Section 3.1 to maintain a constant subcooling degree of 8 °C at Test Condition 4.
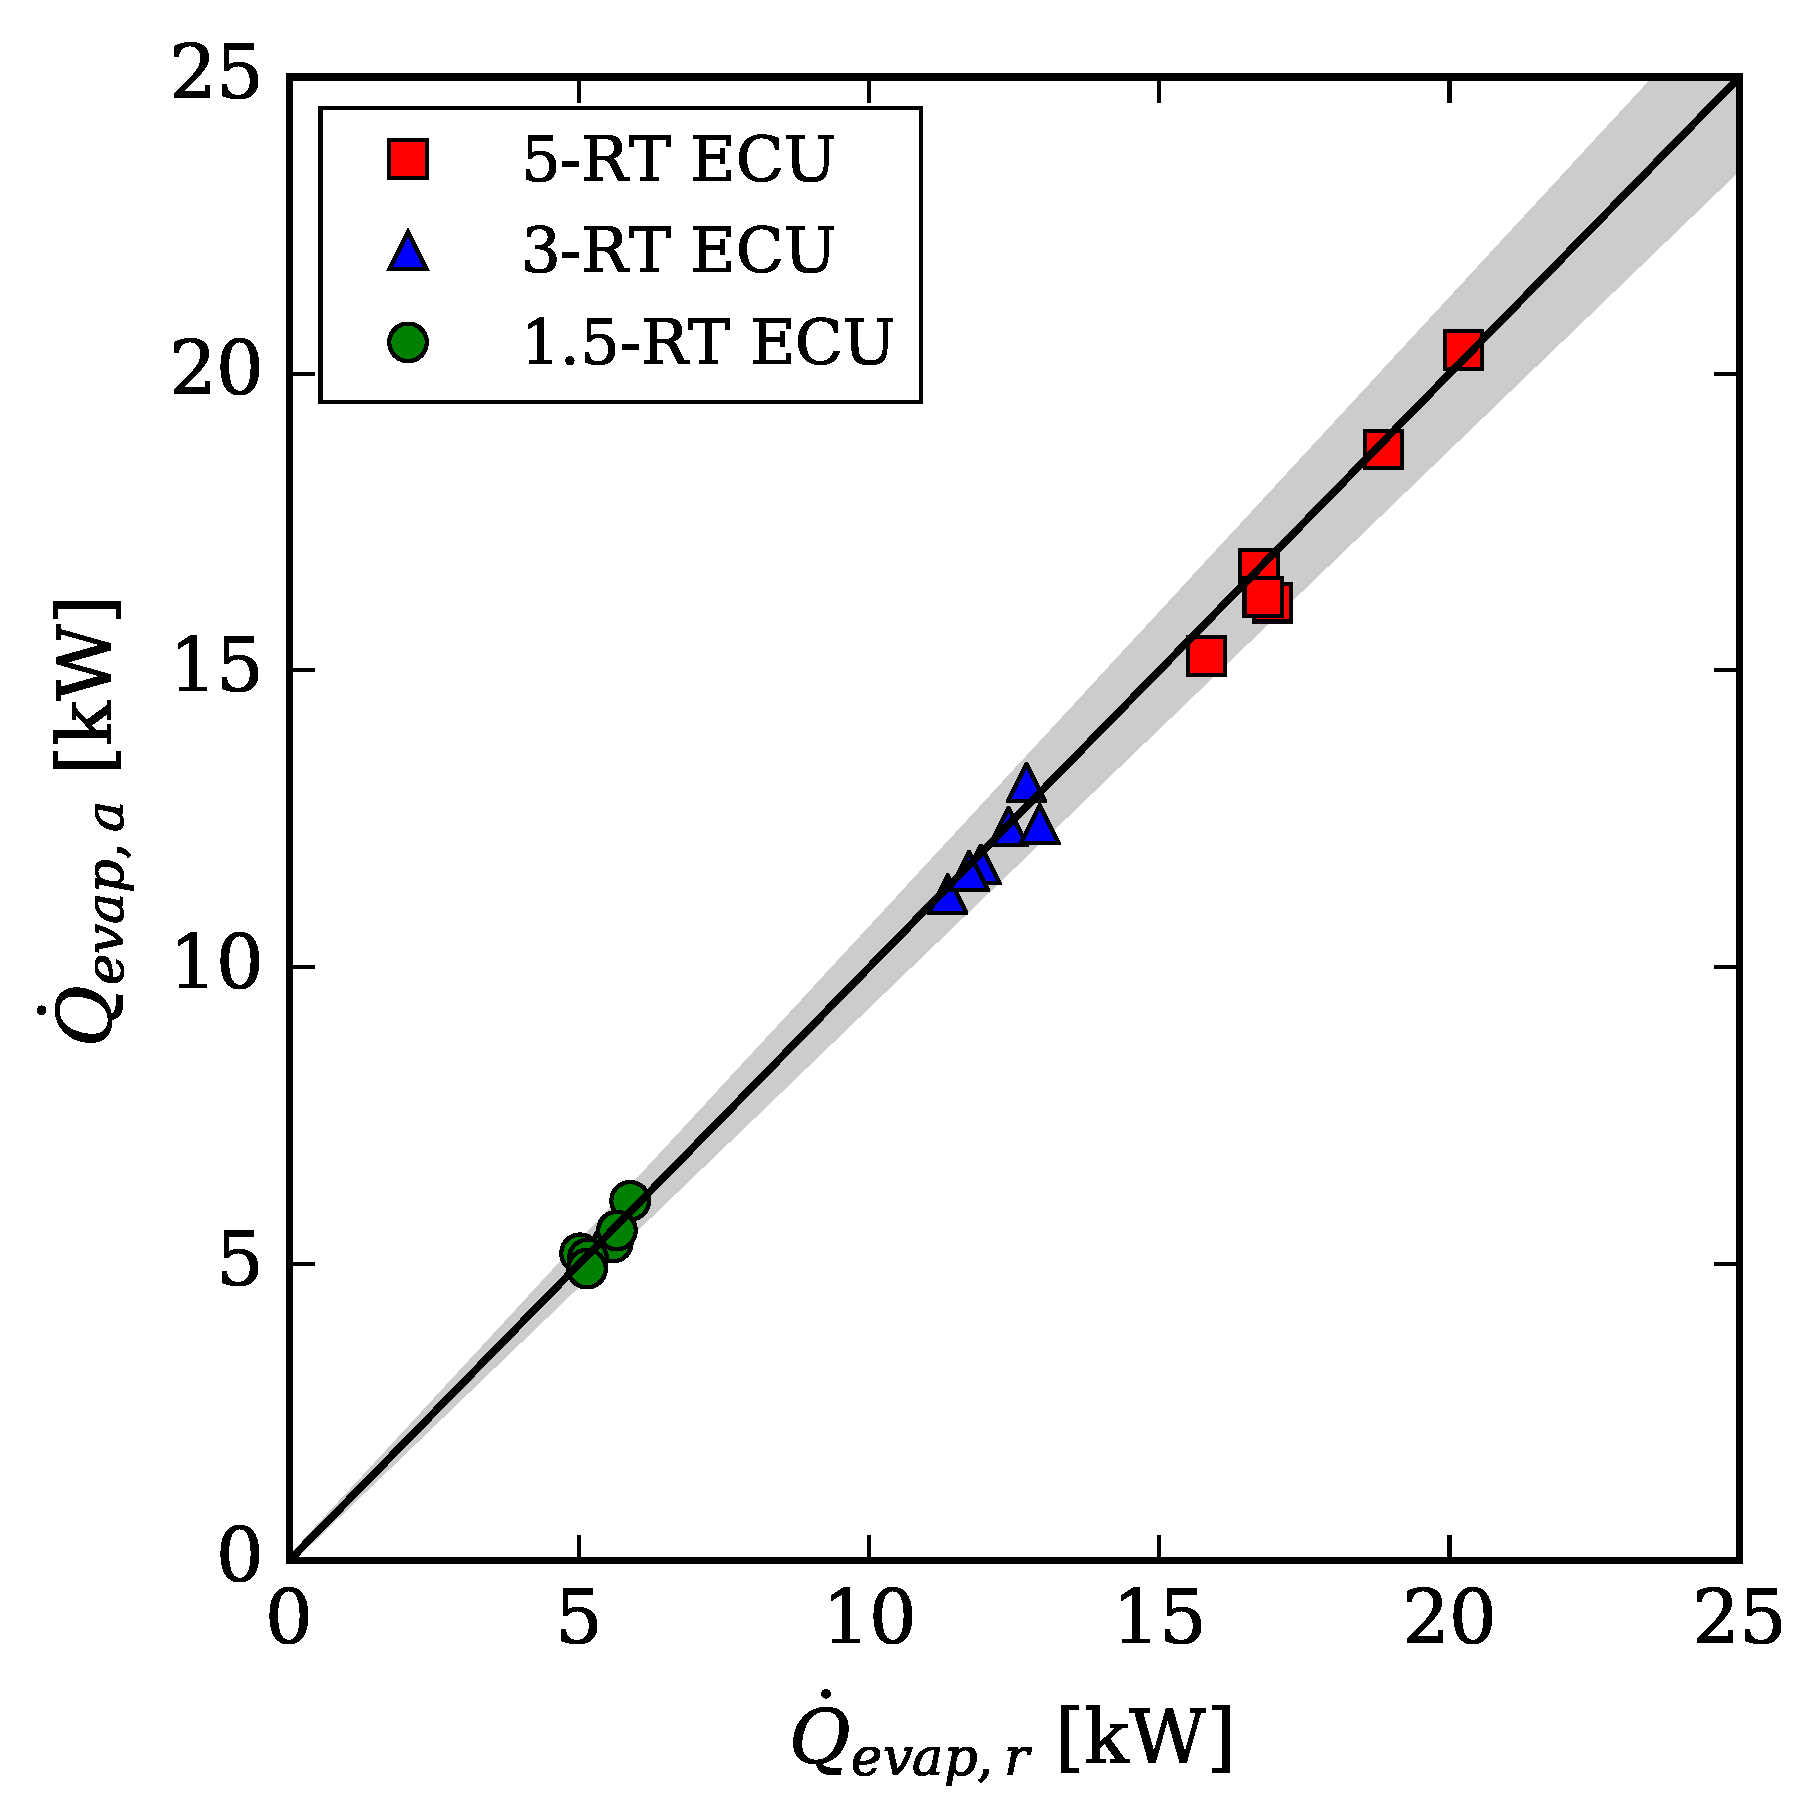
Once the ECU kept operating for more than one hour, steady-state condition was reached, and then, data measurements were sampled every two seconds and averaged for a total time of 20 min. The averages data results were utilized in the second-law analysis to evaluate irreversibility. To enhance the reliability of the experimental results, each ECU test was carefully conducted at the same temperatures in the indoor and outdoor psychrometric chambers. In each experimental test, the energy balance between the refrigerant-side and air-side, as shown in Figure 4, was within 6% as recommended by ANSI/AHRI Standard 210/240 [27]. Note from Figure 4 that two test points (i.e., Test Condition 5 and 6) resulted in higher cooling capacity than the performance rated cooling capacity because the 5-RT ECU was operating at an off-design point. The analysis in the following section is based on the results of the extreme case of Test Condition 1.
4. Results and Discussion
The mathematical model in this work was developed using Engineering Equation Solver EES [28]. The state parameters given as input to the simulation model are chosen to be those measured during the performance tests. In addition, EES software [28] is used to compute the thermodynamics state properties as well as the uncertainty analysis. The uncertainty analysis is based on the method presented by Taylor and Kuyatt [29], which combined both the accuracy of the instruments and the propagation of instrument accuracies through the calculated properties. The resulting uncertainties are tabulated with the results in this section.
4.1. ECUs Coefficient of Performance
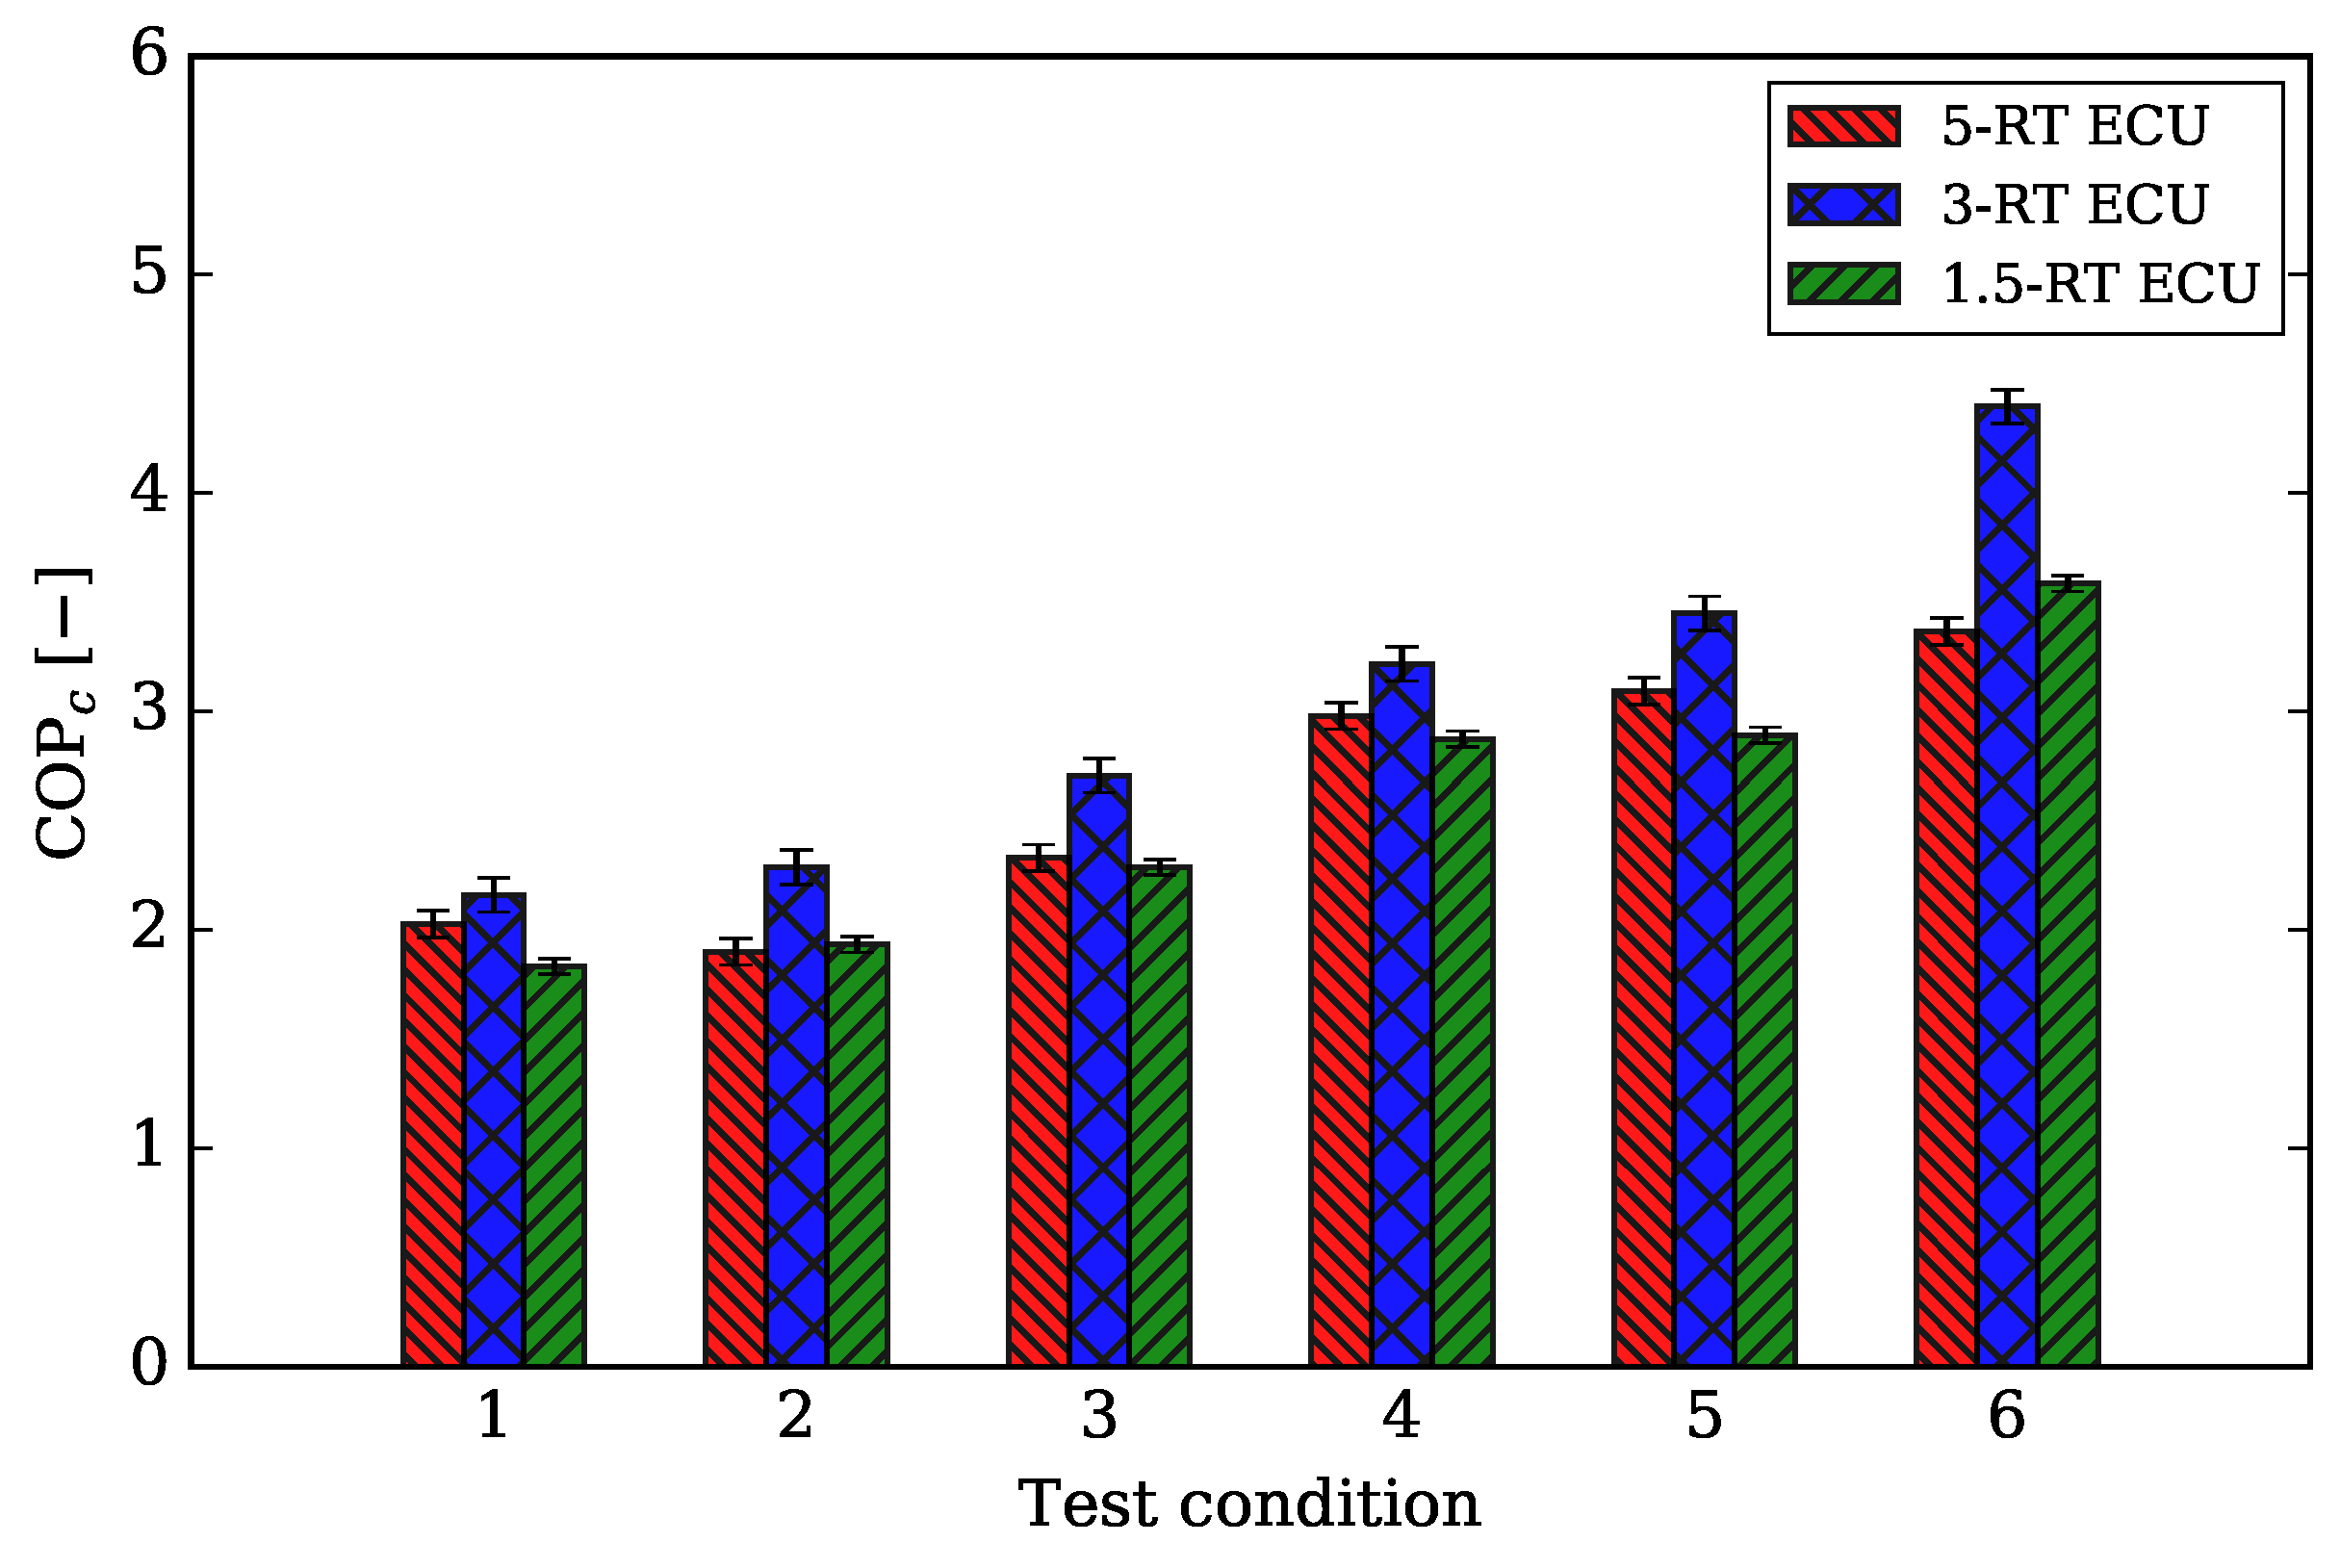
The cycle coefficient to performance (COP) changes with the tested conditions, as shown in Figure 5 for the three ECUs. Figure 5 indicates that all the ECUs exhibited a significant increase in the COP approximately from 2 to 4 for Test Condition 1 to Test Condition 6, respectively. This is because the units power consumption reduced as the temperature lift decreased; therefore, the COP improved.
For all testing conditions in Figure 5, the COP was maintained relatively equal among all the ECUs. However, the COP for the 3-RT ECU was relatively higher than the other two ECUs by approximately 15%. The 3-RT ECU used two condenser’s fans, which helped improve the heat rejection rate and, therefore, enhanced the COP.
4.2. ECUs Exergy Destruction (or Irreversibility)
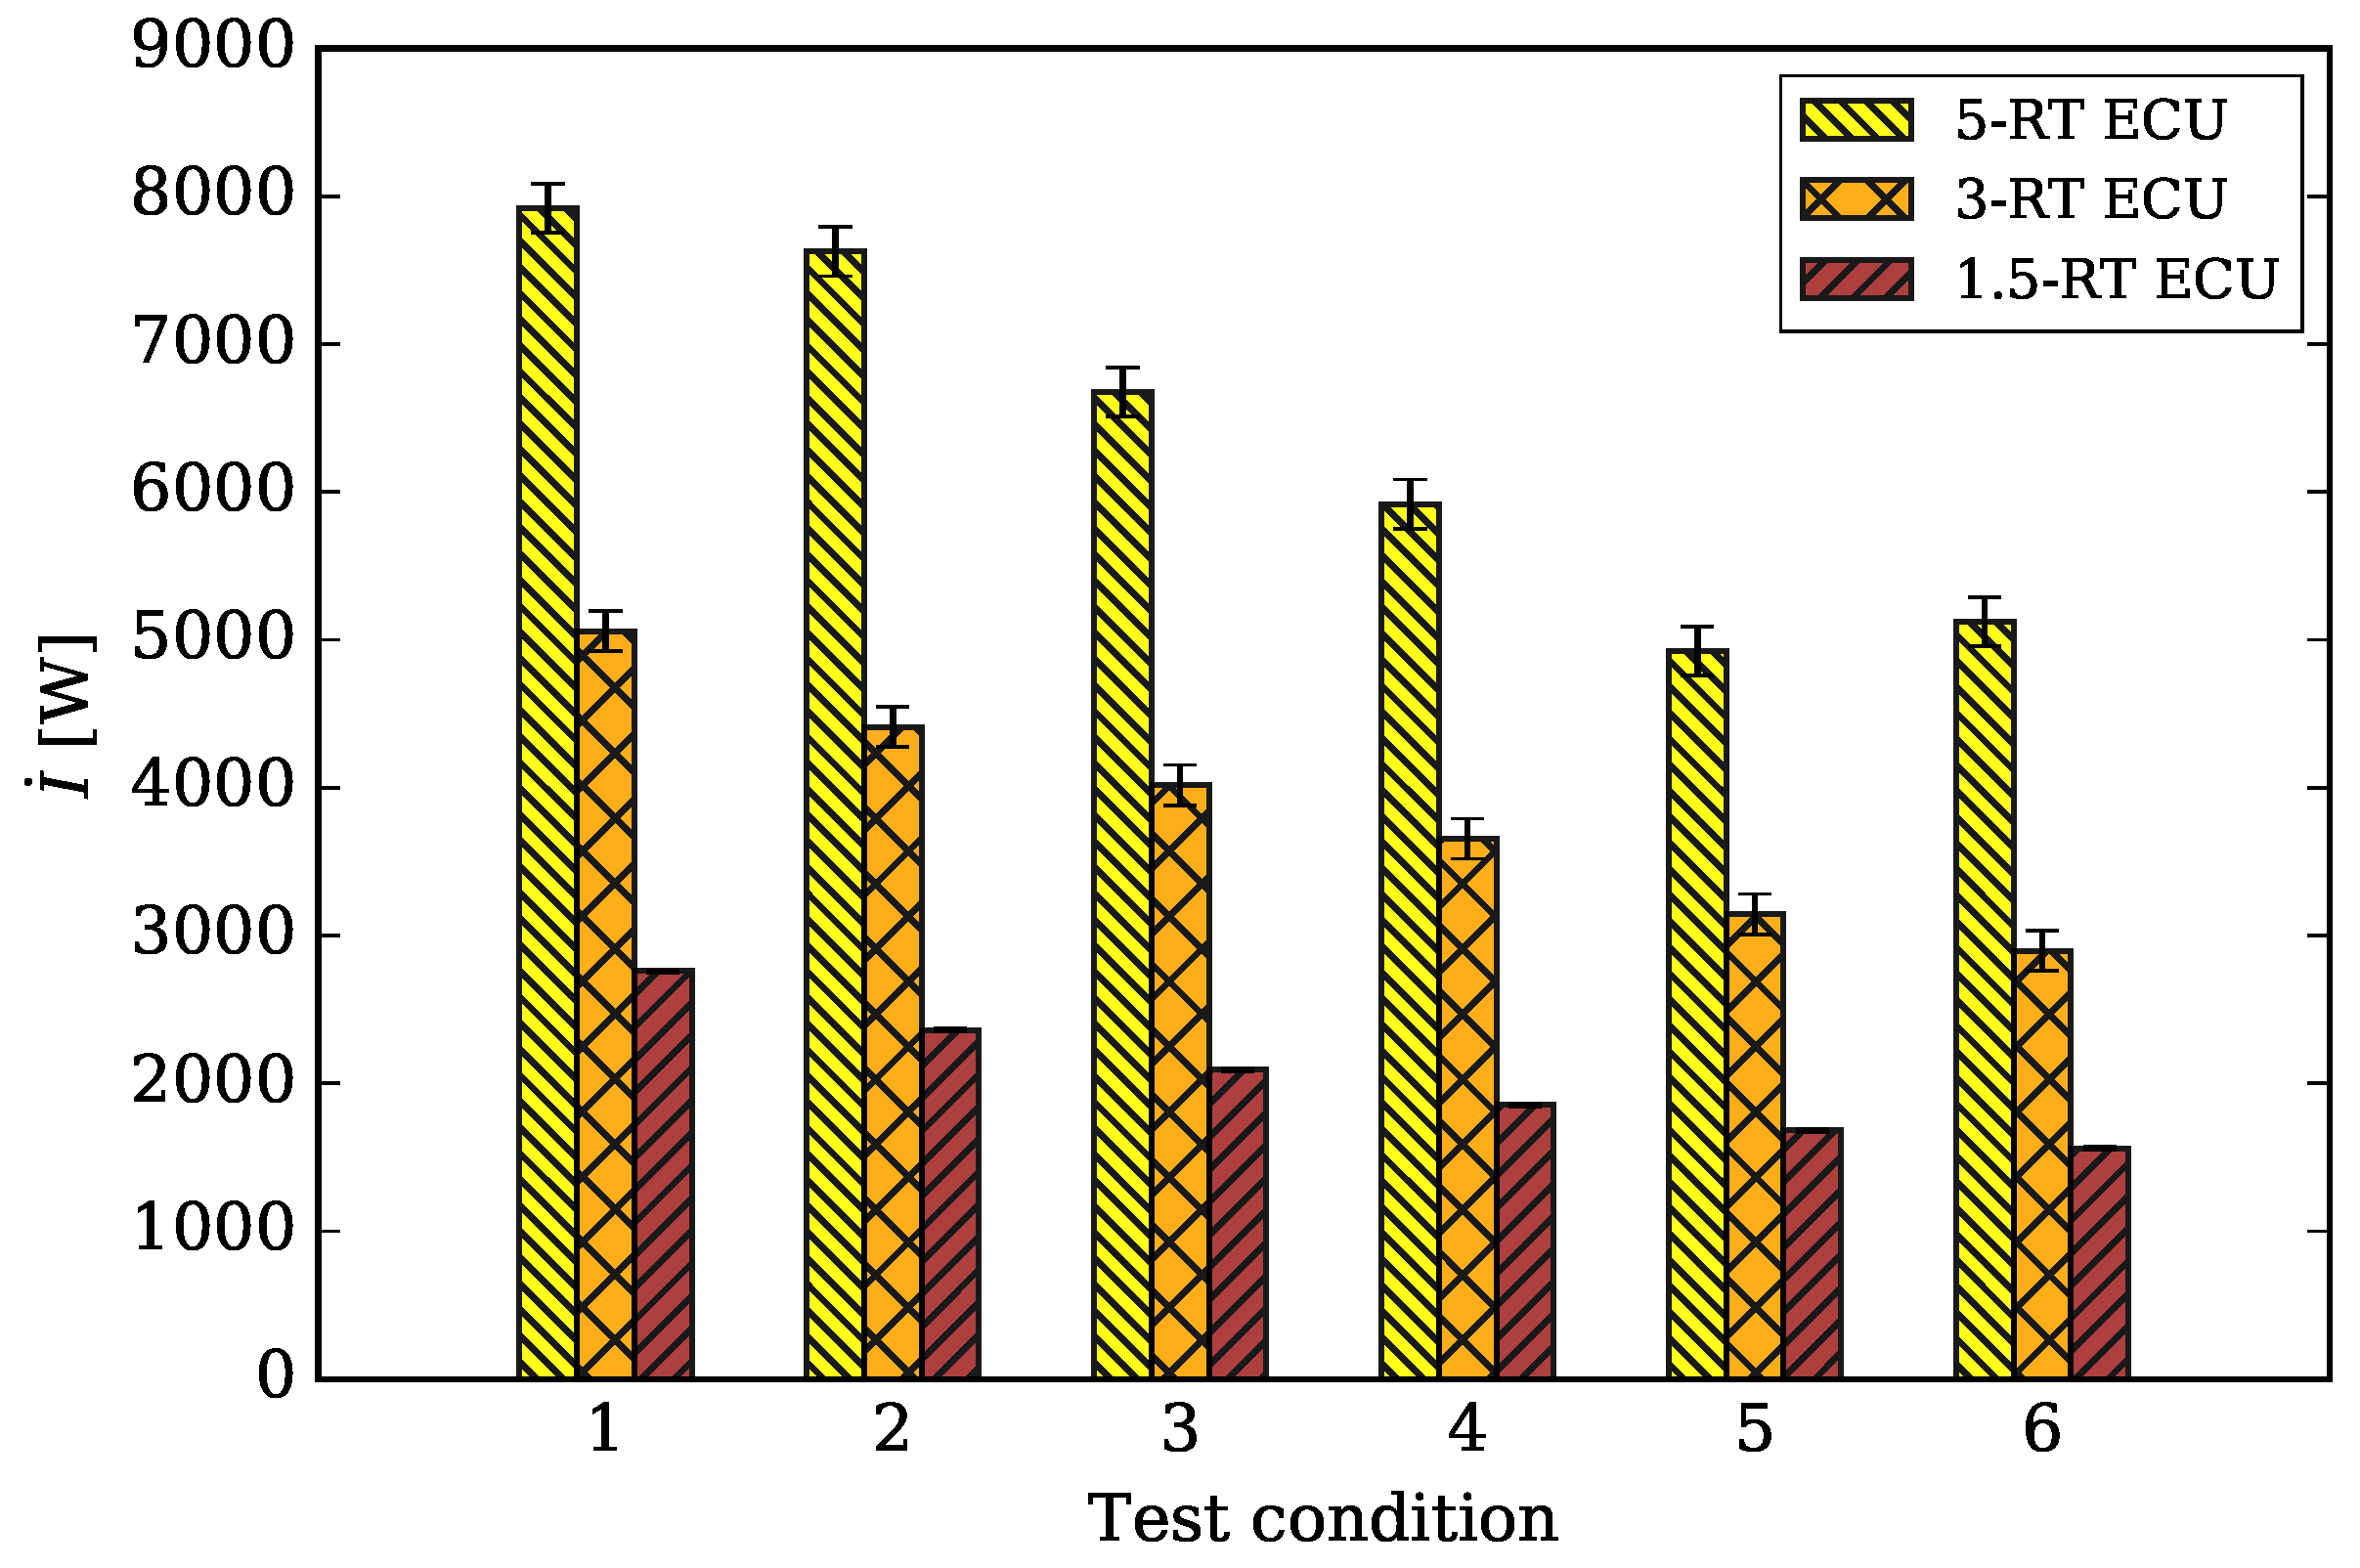
The exergy destruction (or irreversibility) changes with the operating conditions for the tested ECUs as shown in Figure 6. For all the ECUs, Figure 6 shows that the irreversibility reduced by approximately 40% from Test Condition 1 to Test Condition 6. The reduction in outdoor temperature from Test Condition 1 to Test Condition 6 (i.e., from 51.7 °C (125 °F) to 23.9 °C (75 °F)) decreased the system entropy generation and therefore, reduced the total system irreversibility.
For every testing condition in Figure 6, the maximum irreversibility was associated with the 5-RT ECU followed by the 3-RT ECU, and then the 1.5-RT ECU. The increase rate of the irreversibility was found to be approximately 40% between the three ECUs. This is mainly due to the excess heat rejection with the larger ECUs that resulted in higher entropy generation, and therefore excessive irreversibility.
4.3. ECUs Second-Law Efficiency
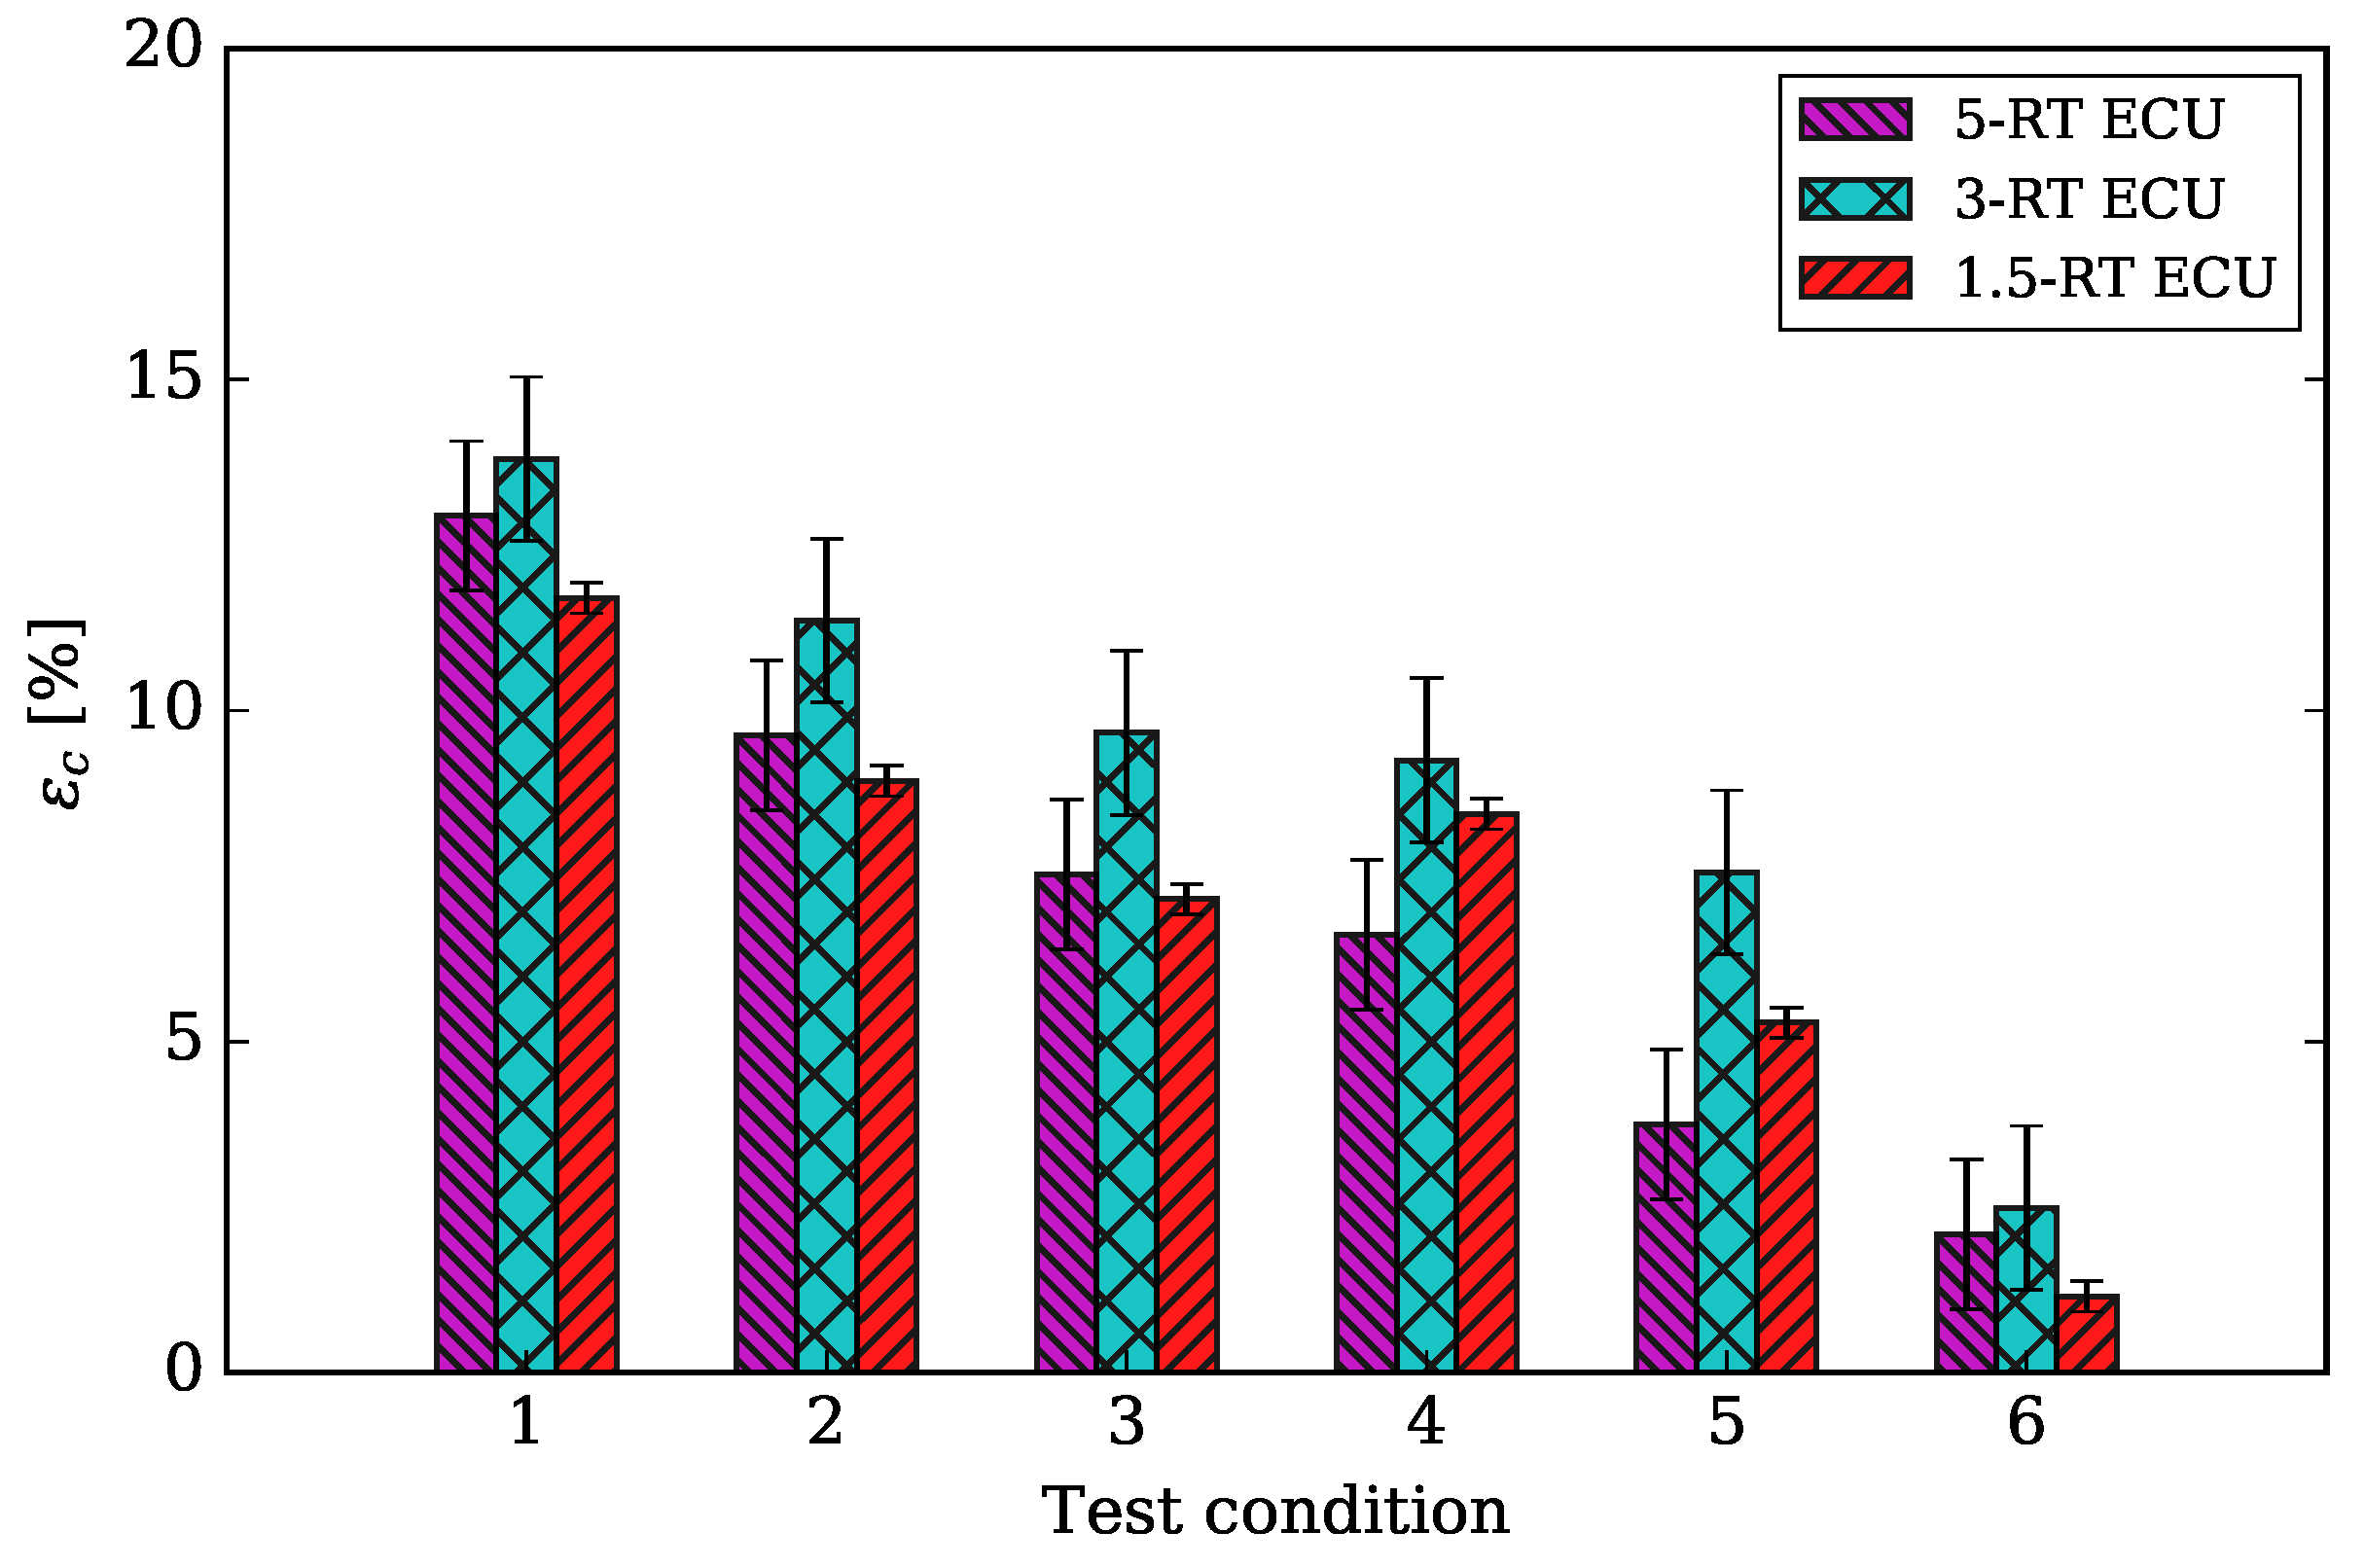
The second-law efficiency () presents the units’ performance relative to the maximum performance possible under the same testing condition, as shown in Figure 7. Figure 7 shows that was reduced by approximately 10% from Test Condition 1 to Test Condition 6 for all ECUs. For all tested ECUs, the maximum of approximately 12% was attained at Test Condition 1, while the minimum of approximately 2% was found at Test Condition 6. This is because all the ECUs were designed and optimized to operate in situations similar to that of Test Condition 1.
4.4. ECUs Performance at the Extreme Case
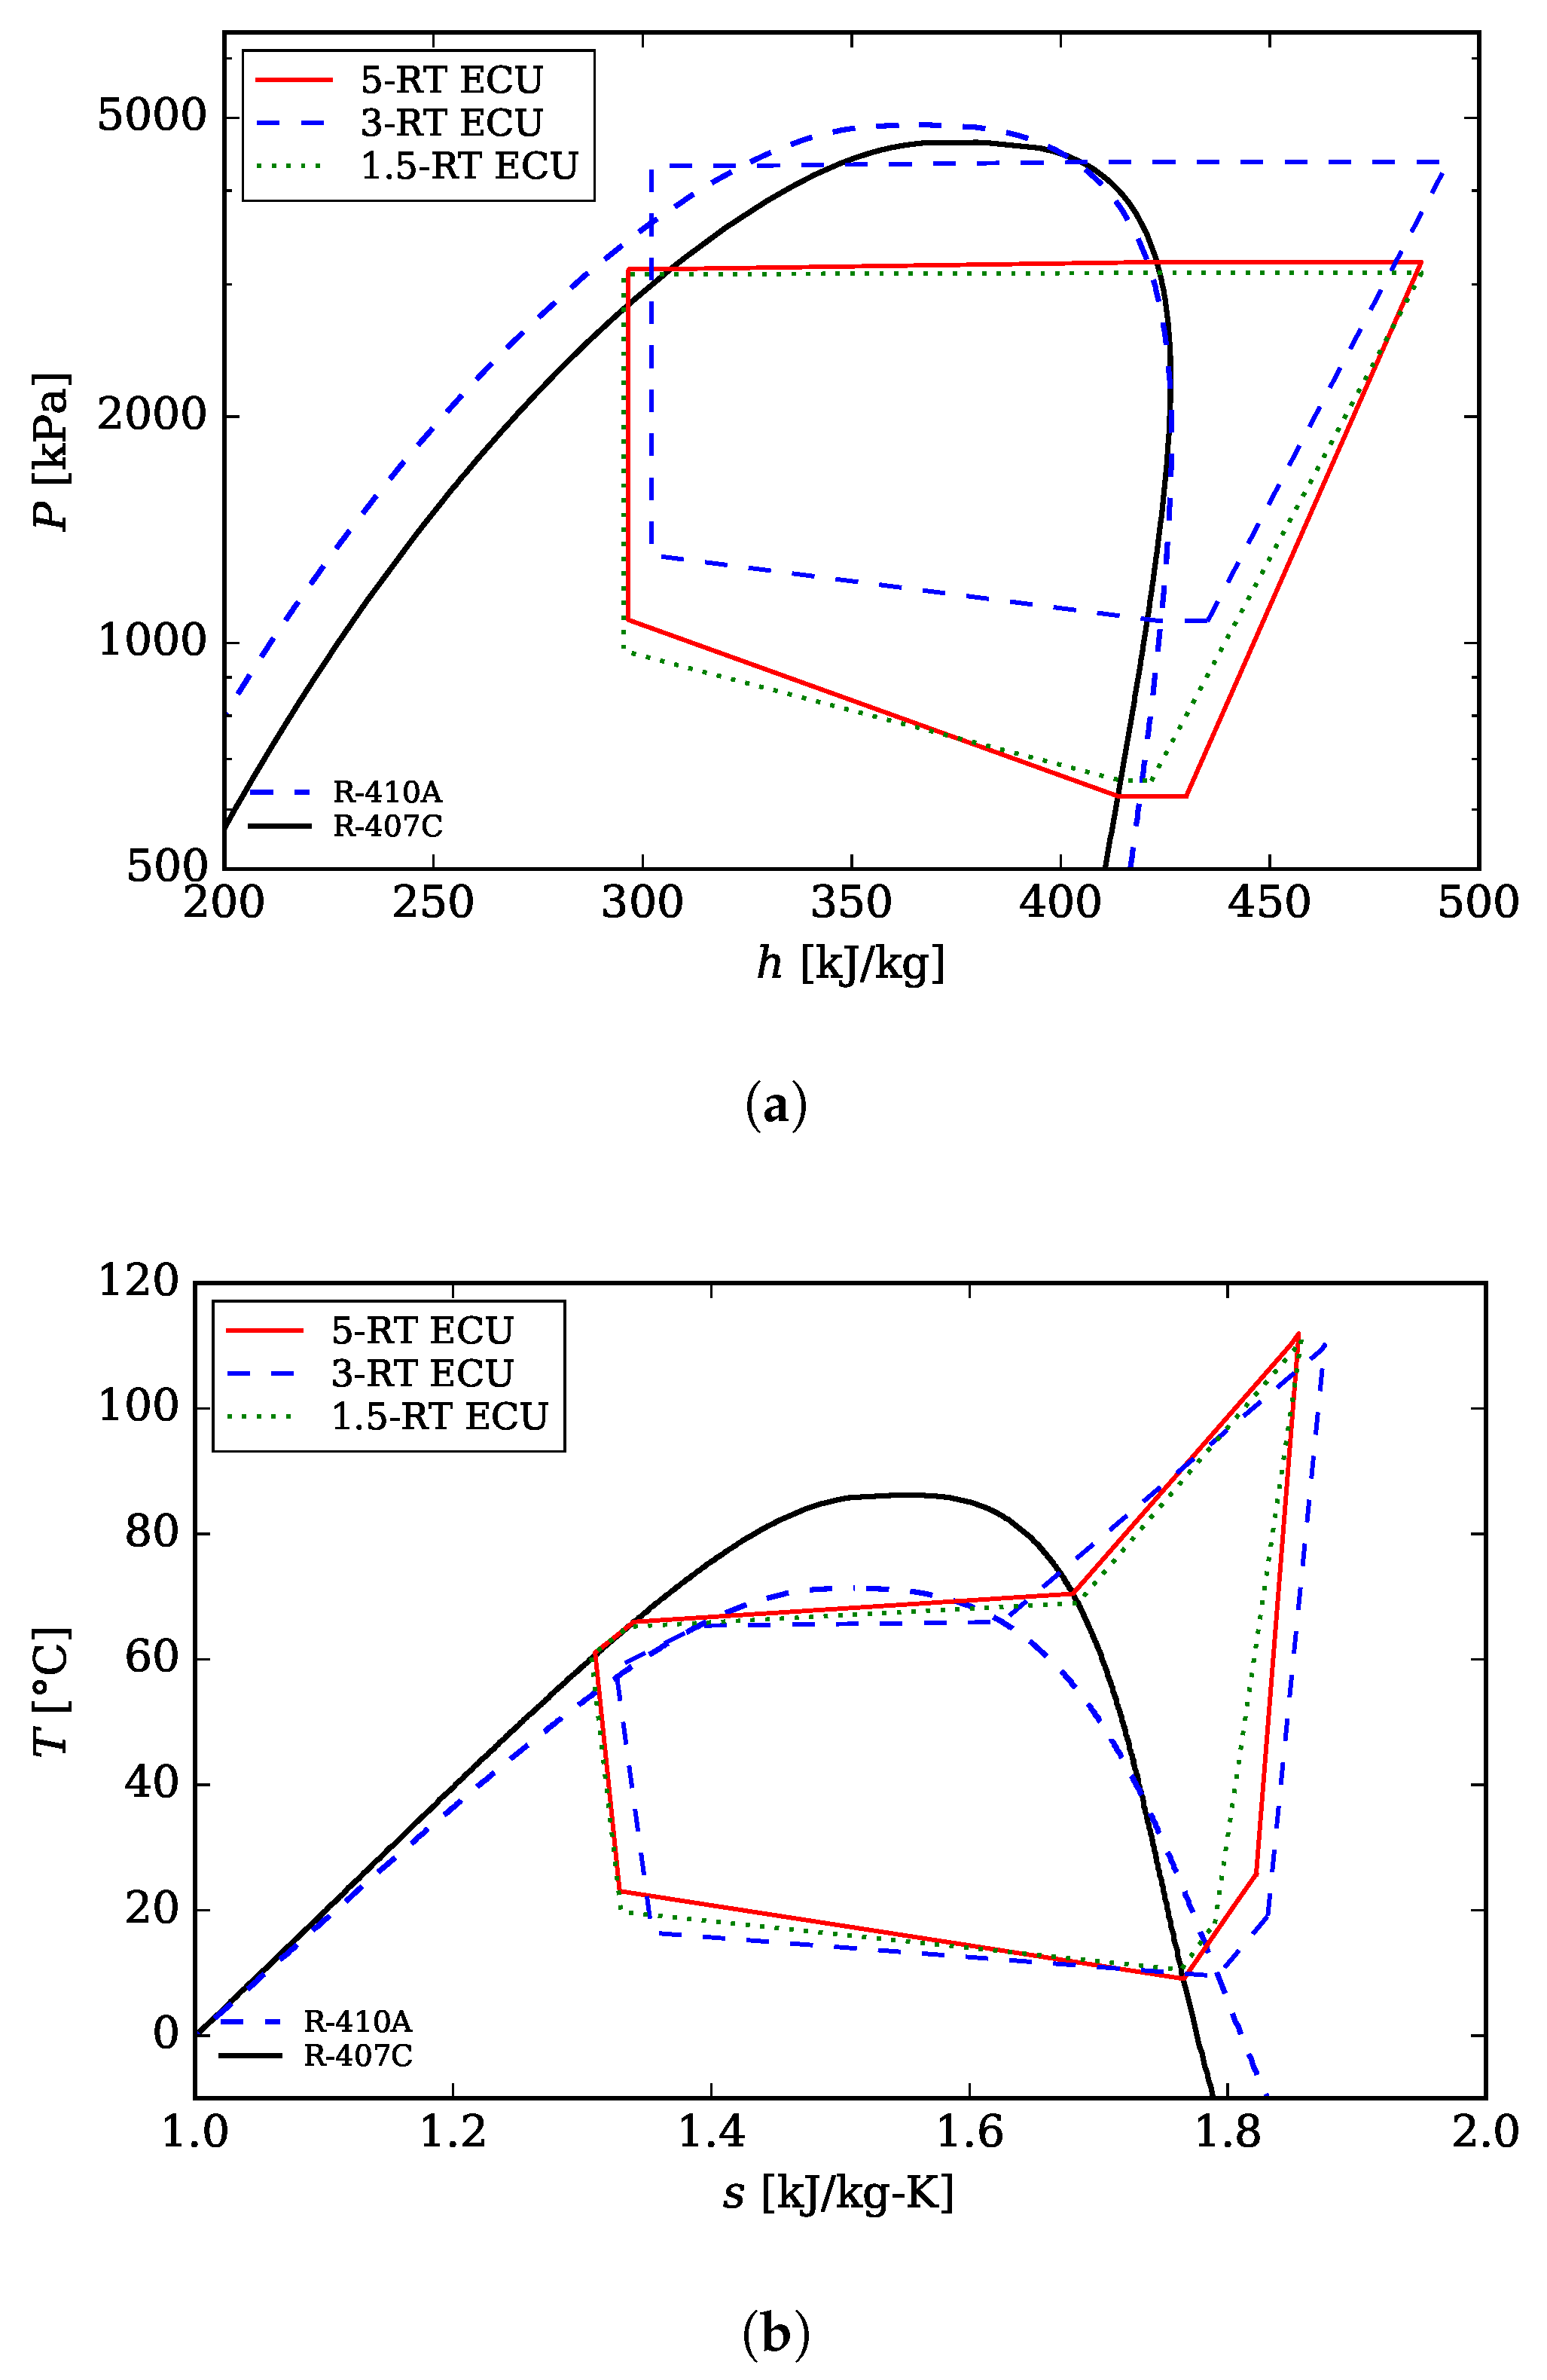
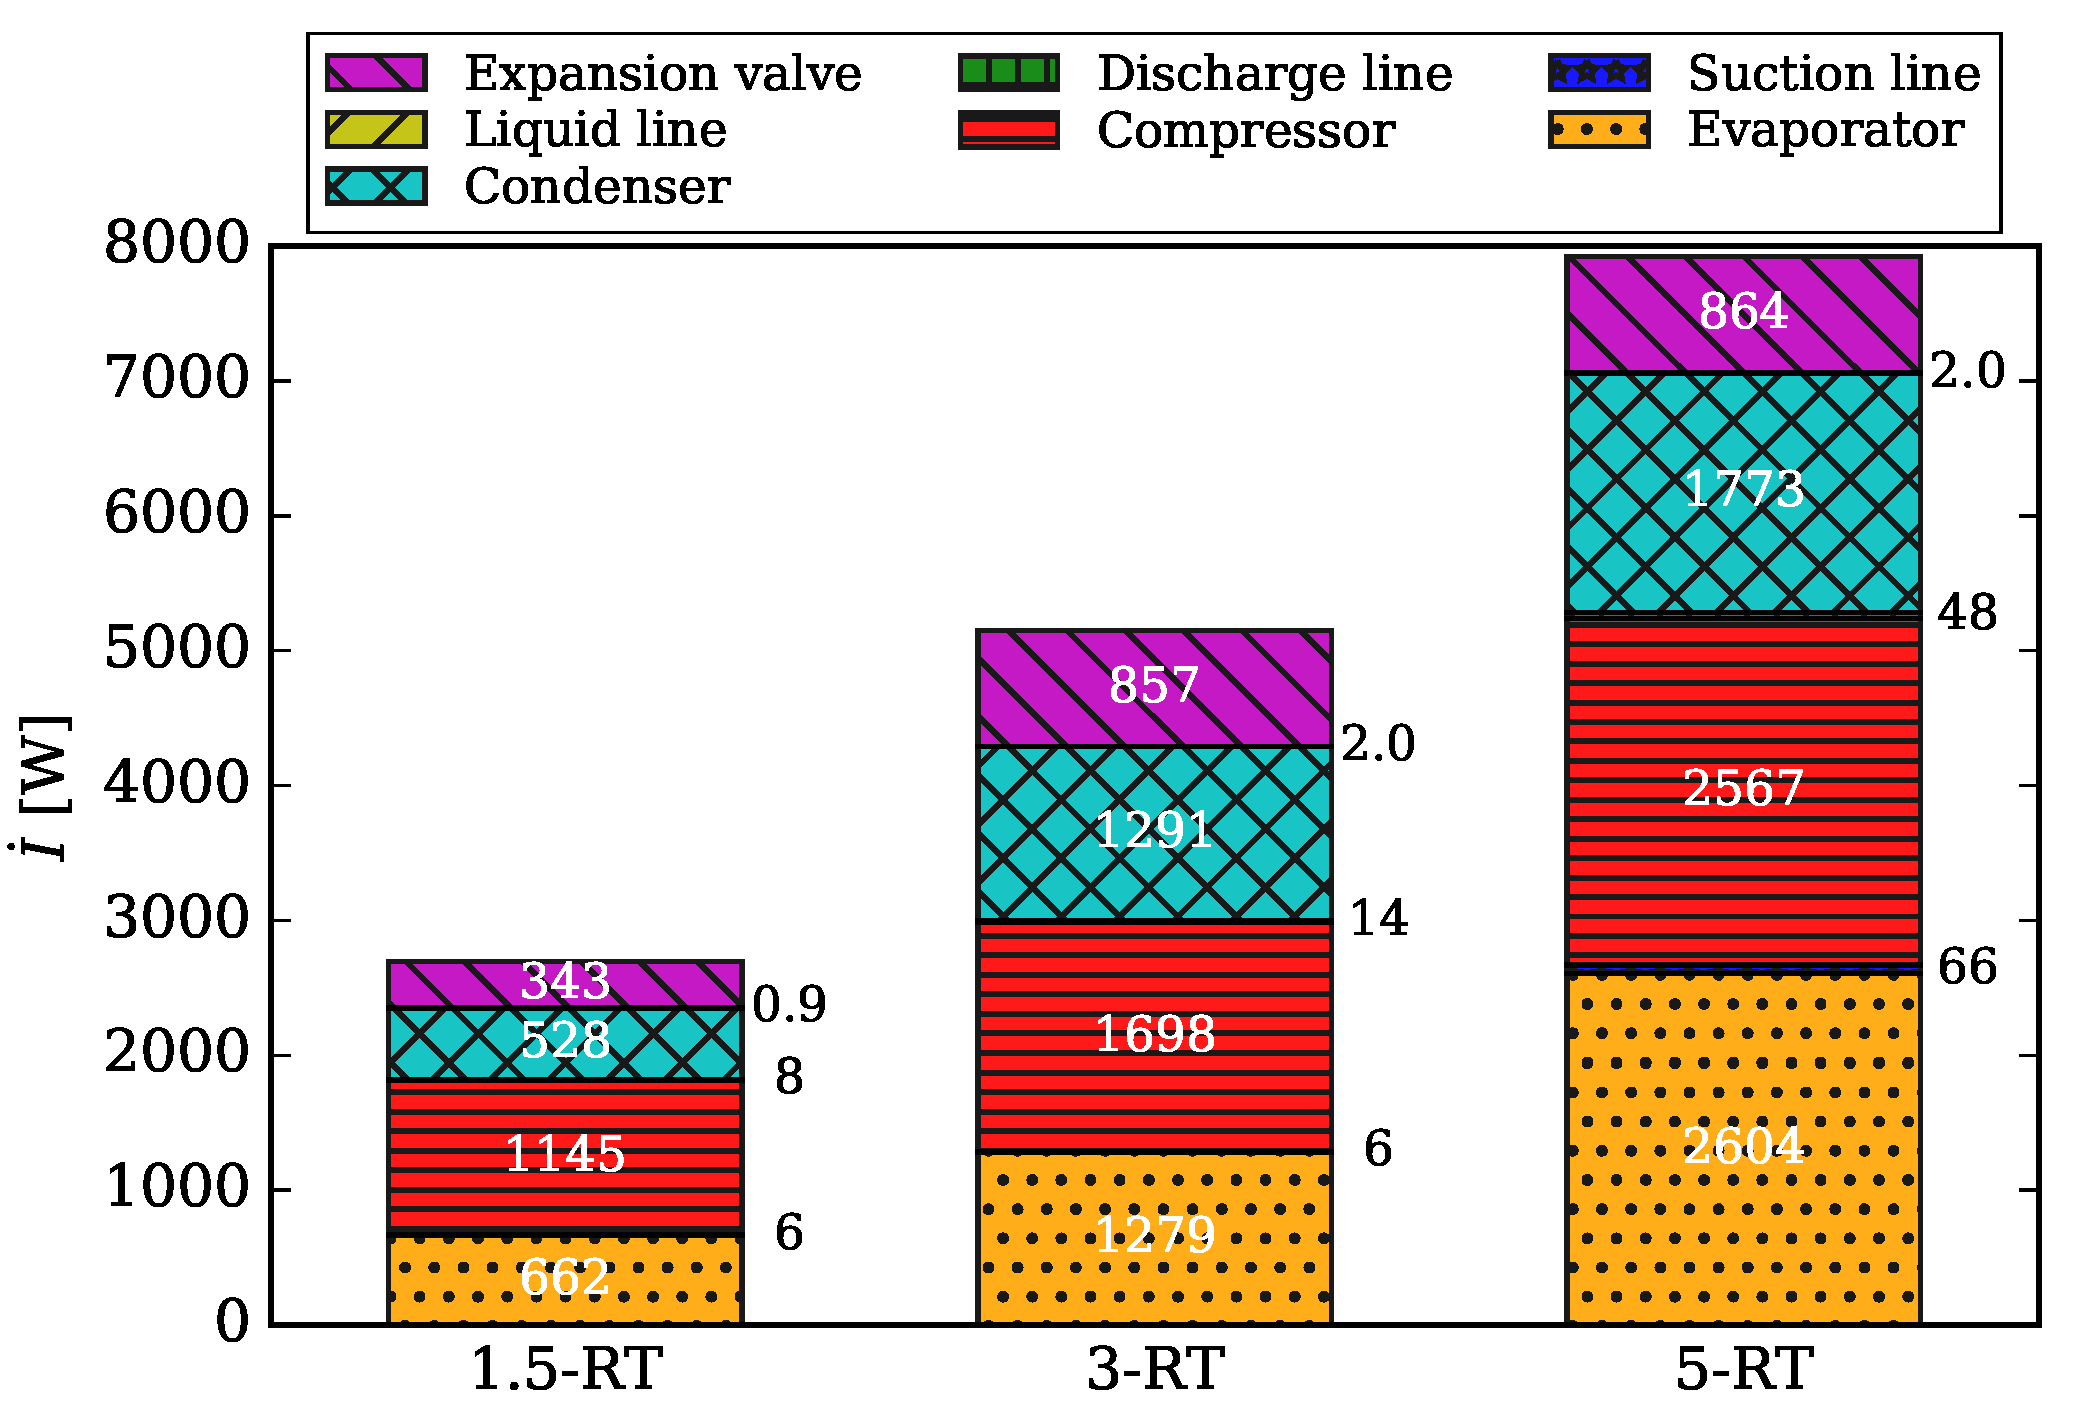
This section investigates the performance of the ECUs for the extreme case of Test Condition 1. Table 3 shows the measured pressure and temperature data at each state point in the three ECUs at the extreme case of Test Condition 1, and therefore, the thermodynamic properties such as enthalpy (h), entropy (s) and specific volume (v) could be estimated at each state. Figure 8 presents the vapor compression refrigeration cycle pressure-enthalpy (P-h) and temperature-entropy (T-s) diagrams for the three ECUs. The irreversibility or second-law analysis was estimated using the experimental data listed in Table 3, and the respective models presented in Section 2. The results of the second-law analysis are summarized in Table 4. Figure 9 shows the exergy destruction of all components for the three ECUs, while Figure 10 illustrates the exergy destruction ratio for the various parts of the three ECUs. The next sections discuss the results for the tested three ECUs that are based on Table 4 and Figure 8, Figure 9 and Figure 10 at Test Condition 1.
4.4.1. 1.5-RT ECU Performance
The result of the first- and second-law analyses of the 1.5-RT ECU are shown in Table 4. The COP is 1.83 at Test Condition 1. The entropy generation rate is highest in the compressor, followed by the evaporator and condenser in that order, with an entropy generation of 3.524 W/K, 2.037 W/K, and 1.626 W/K, respectively. Figure 9 shows the comparison of irreversibility inherent to each component for the 1.5-RT, 3-RT, and 5-RT ECUs. In the case of 1.5-RT ECU, the most substantial rate of irreversibility is present within the compressor (1145 W), followed by the evaporator with 661.7 W and then the condenser with 528 W.
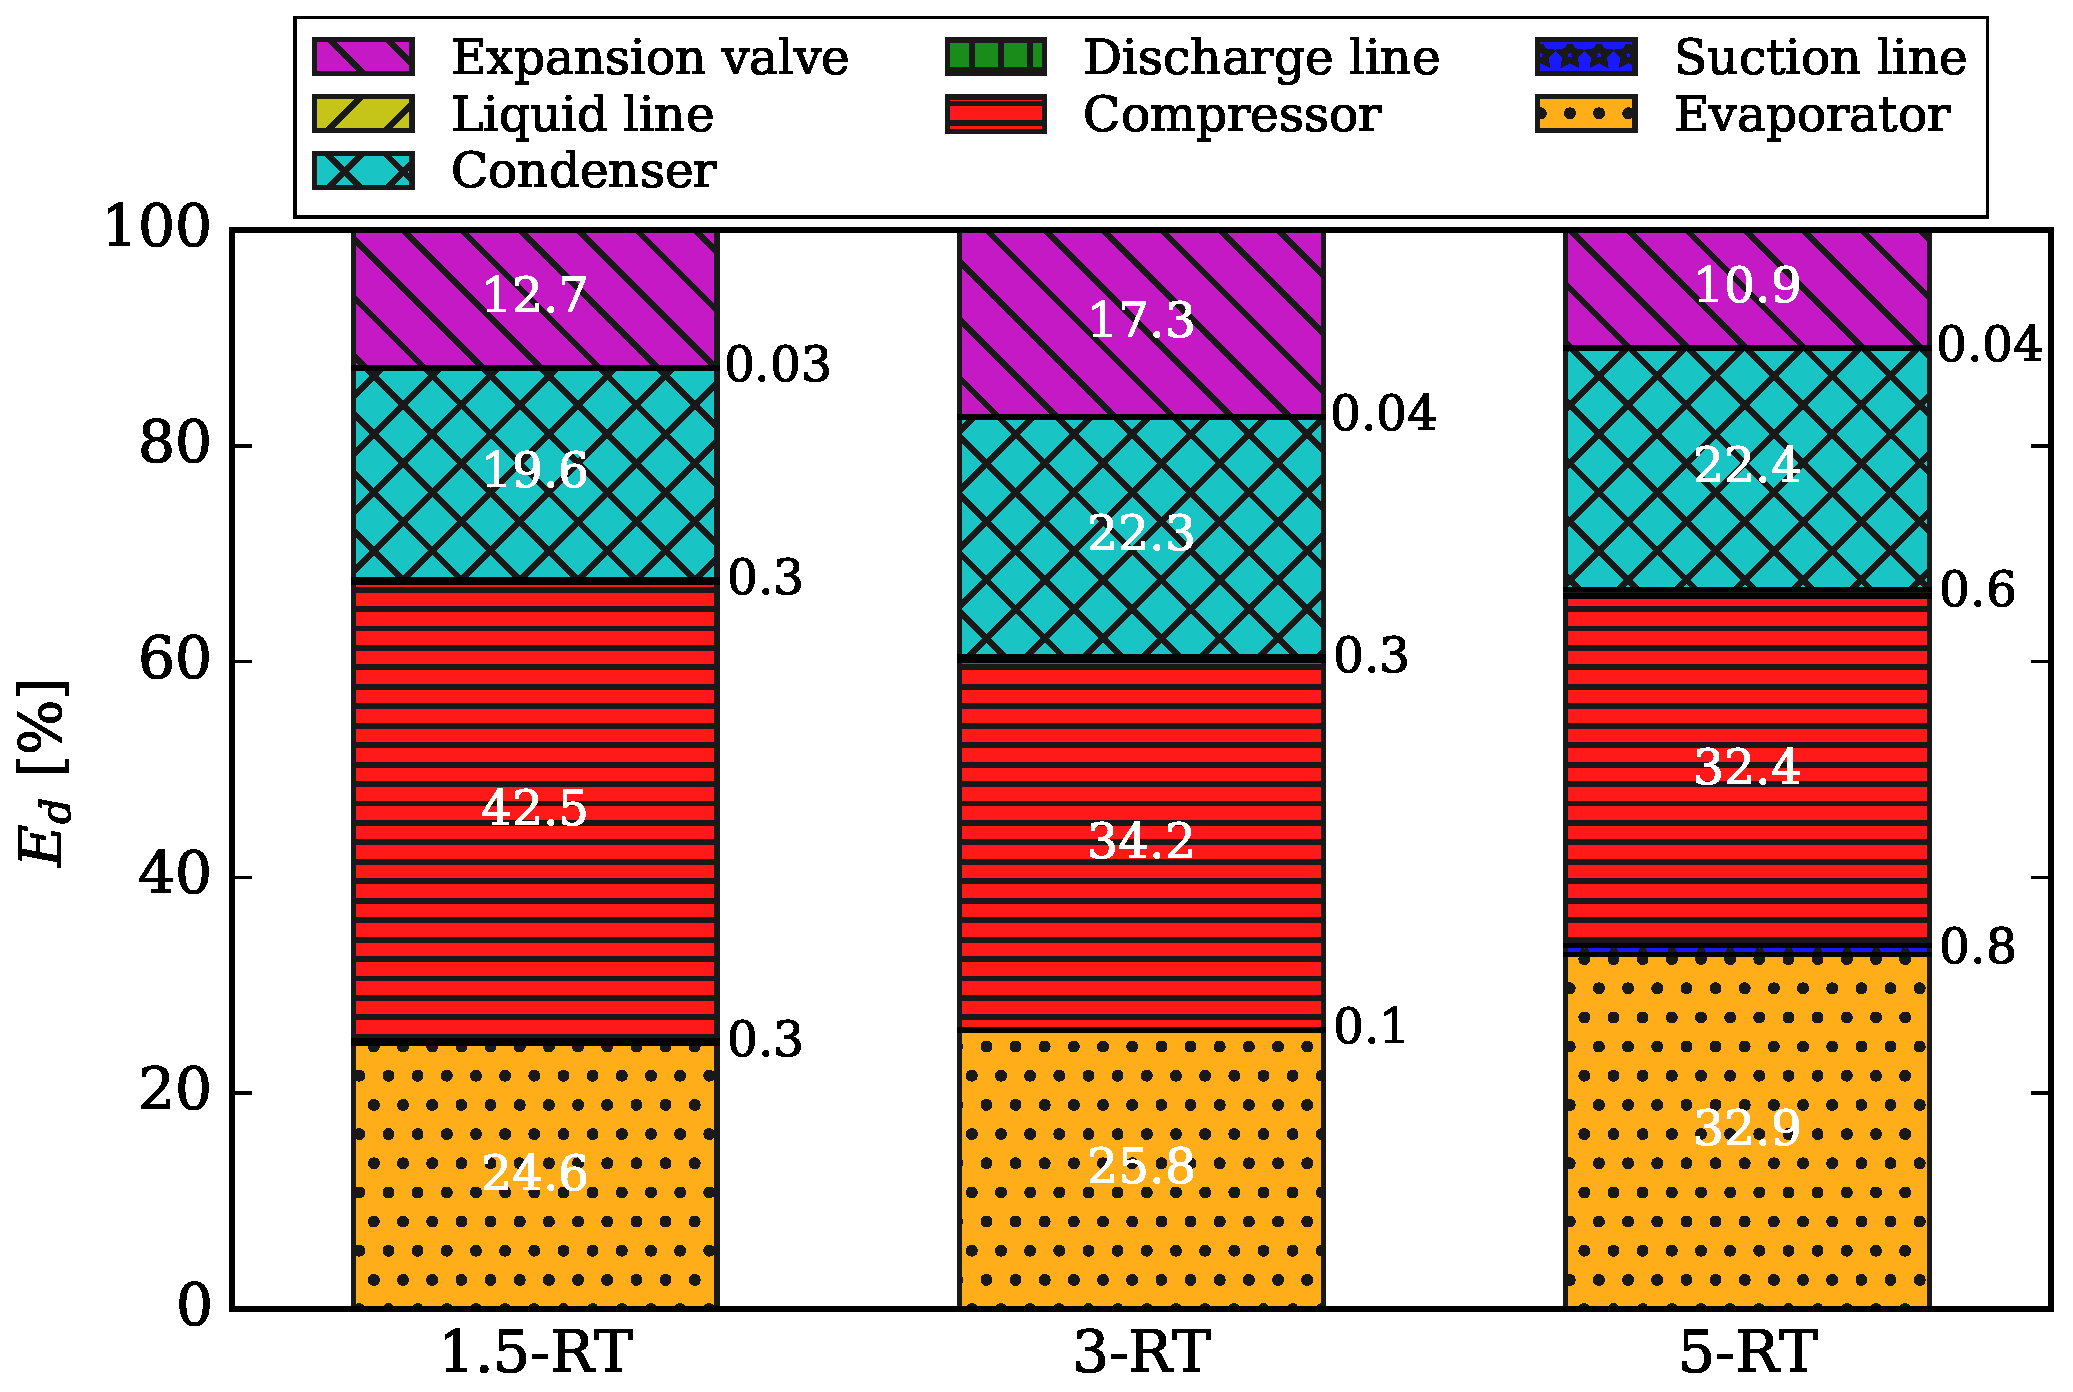
Figure 10 illustrates that the irreversibility ratios for the compressor, the evaporator, and the condenser were 42.5%, 24.6%, and 19.6%, respectively. The total value of the exergy destruction ratios of those three parts approximately equals 87%. Clearly, the compressor should be considered first when improving the exergetic efficiency of the 1.5-RT ECU. The second-law efficiency , at the component level, is lowest for the condenser, followed by the evaporator and compressor with percentages of 9.7%, 48.8%, and 62.5%, respectively. The exergy recovered in the condenser is small because of the high ambient temperature, i.e., 51.7 °C (125 °F), which results in low second-law efficiency. The overall second-law efficiency of the 1.5-RT ECU is 11.7%.
4.4.2. 3-RT ECU Performance
As shown in Table 4, the analytical results for the 3-RT ECU indicate a COP of 2.16 at Test Condition 1. The rate of entropy generated within each component in decreasing order of magnitude is in the compressor, evaporator, condenser and then expansion valve, with values of 5.227 W/K, 3.938 W/K, 4.021 W/K, and 2.64 W/K, respectively.
Figure 8 compares the vapor compression cycles of the three ECUs, where it illustrates that the 3-RT ECU exhibited higher discharge temperature and condensing temperature than that of the other two ECUs. The 3-RT ECU has the same construction as the other ECUs except that it uses R-410A as the refrigerant. Notice from Figure 8a that the pressure measurements were taken before the evaporator distributor, which explains the steep degradation in pressure drop. Likewise, Figure 8a depicts the same trend of the degradation in temperature as the results of the measurement position.
Examining Figure 9 and Figure 10, the highest irreversibility is present within the compressor at 1.689 kW, followed by that in the condenser at 1.291 kW, followed by that in the evaporator at 1.278 kW, and finally that in the expansion valve at 857.4 W. The irreversibility ratios for the individual components are 34.2%, 25.8%, 22.3%, and 17.3%, respectively. The expansion device’s irreversibility in the 3-RT ECU is relatively higher compared to the other units. This is because the working fluid (i.e., R-410A) functions at a higher pressure than other refrigerants, which leads to a higher pressure drop across the expansion device, as shown in Figure 8a. As in 1.5-RT ECU, the compressor should be considered first to improve the unit’s exergetic efficiency.
Similar to the 1.5-RT ECU, the component second-law efficiencies of the 3-RT ECU are relatively low for the condenser, followed by the evaporator, then the compressor, with corresponding values of 21%, 50%, and 70.5%. As in the 1.5-RT ECU, the exergy recovered in the condenser of the 3-RT ECU is small due to the high ambient temperature. Notice that in Figure 9 and Figure 10, the condenser’s irreversibility is relatively smaller because the 3-RT unit has a second condenser fan, which helps to increase the heat rejection. Consequently, the air flow rate across the condenser was enhanced and hence increased the condenser’s second-law efficiency. The overall second-law efficiency of the 3-RT ECU is 13.8%.
4.4.3. 5-RT ECU Performance
Table 4 shows the analytical results of the 5-RT ECU, which has a COP of 2.03 at Test Condition 1. Unlike the 1.5-RT and 3-RT ECUs, the rate of entropy generation within each component of the 5-RT ECU follows the order of the evaporator, the compressor, and then the condenser, with respective values of 8.01 W/K, 7.9 W/K, and 2.65 W/K.
Figure 9 illustrates that the highest component irreversibility of the 5-RT ECU is associated with the evaporator, followed by the compressor, and then the condenser, with corresponding values of 2605 W, 2567 W, and 1773 W. As for the corresponding irreversibility ratios, as shown in Figure 10, the associated ratios for the evaporator, compressor, and condenser are 32.9%, 32.4%, and 22.4%, respectively. The total value of the exergy destruction ratios of those three parts equals approximately 88%. The pressure drop associated with the distributor in the evaporator of 5-RT ECU, as shown in Figure 8, results in relatively higher irreversibility. Unlike the 1.5-RT and 3-RT ECUs, both the evaporator and the compressor of the 5-RT ECU should be considered for component improvement to increase the system’s exergetic efficiency. Furthermore, the evaporator has the highest irreversibility. This is mainly due to the high air maldistribution in the evaporator chamber, which can be compensated by optimizing the evaporator’s circuitry [30]. Whereas, the compressor can be enhanced with a novel design such as vapor injected type compressors [31,32].
As was the case for the 1.5-RT and 3-RT ECUs, the condenser of the 5-RT ECU has the lowest second-law efficiency , followed by the evaporator, and then the compressor with 4.8%, 45.5%, and 71.8%, respectively. Again, the exergy recovered in this unit’s condenser is small due to its high ambient temperature. The overall second-law efficiency of the 5-RT ECU is 12.9%.
5. Conclusions
This paper presented second-law analyses of three military Environmental Control Units (ECUs) to assess the contribution of each component to the overall irreversibilities of the units. This way, the components in the highest need for improvement in energy efficiency can be identified. The three ECUs were experimentally investigated at high ambient conditions, and comparisons between the individual components were made to yield a clear direction of how to enhance the exergetic efficiency of the ECUs. The study yielded the following conclusions:
- The components exergy destruction (or irreversibility) for all the tested ECUs follow the sequence; compressor associated with 32.4% to 42.5%, followed by the evaporator associated with 24.6% to 32.9%, followed by the condenser associated with 19.6% to 22.4% of the total unit irreversibility.
- The analytical results indicate that compressor should be considered first in increasing the exergetic efficiency of all ECUs; whereas in 5-RT ECU, evaporator should also be considered.
- An additional condenser fan helps the 3-RT ECU enhancing the second-law efficiency associated with the condenser, but the working refrigerant increases the irreversibility of the expansion device.
- A second-law analysis helps to identify components with higher exergy destruction (or irreversibility) and clarifying which component modification can enhance the exergetic efficiency of any ECU to operate in high ambient temperature conditions.
In the present study, the fans were excluded from the analysis. Therefore, future work should consider fans and controllers’ power consumption for inclusive analysis. Furthermore, a techno-economic analysis could also be considered to optimize the technical and economic performance of the ECUs.
Author Contributions
Conceptualization, A.M.B.; methodology, A.M.B.; software, A.M.B.; validation, A.M.B.; formal analysis, A.M.B.; investigation, A.M.B.; resources, A.M.B. and E.A.G.; writing–original draft preparation, A.M.B.; writing–review and editing, A.M.B. and E.A.G.; supervision, E.A.G. All authors have read and agreed to the published version of the manuscript.
Funding
This research was funded by Kuwait University Research Grant No. (EM03/19). The APC was funded by Kuwait University.
Acknowledgments
The authors would like to acknowledge the support from Adams Communication & Engineering Technology (ACET).
Conflicts of Interest
The authors declare no conflict of interest.
Abbreviations
The following abbreviations are used in this manuscript:
| COP | coefficient of performance |
| ECU | environmental control unit |
| RT | refrigeration tons |
Nomenclature
| exergy destruction ratio (%) | |
| P | pressure (kPa) |
| T | temperature (°C) |
| V | velocity (m/s) |
| exergy destruction (kW) | |
| heat rate (kW) | |
| entropy rate (kW/K) | |
| power (W) | |
| mass flow rate (kg/s) | |
| exergy (kJ/kg) | |
| second-law efficiency (%) | |
| g | gravitational acceleration (m/s) |
| h | enthalpy (kJ/kg) |
| s | entropy (kJ/kg-K) |
| v | specific volume (m/kg) |
| z | elevation (m) |
Subscripts
| 0 | surrounding |
| 1,2,3,... | components |
| a | air |
| amb | ambient |
| c | cycle |
| comp | compressor |
| cond | condenser |
| dis | discharge |
| evap | evaporator |
| exv | expansion valve |
| gen | generation |
| H | high |
| i | inlet |
| L | low |
| liq | liquid |
| o | outlet |
| r | refrigerant |
| rev | reversible |
| s | suction |
References
- Bejan, A. Advanced Engineering Thermodynamics; John Wiley & Sons: New York, NY, USA, 1988. [Google Scholar]
- Cengel, Y.A.; Boles, M.A. Thermodynamics: An Engineering Approach, 4th ed.; McGraw-Hill: New York, NY, USA, 2002. [Google Scholar]
- Moran, M.J.; Shapiro, H.N.; Boettner, D.D.; Bailey, M.B. Fundamentals of Engineering Thermodynamics; John Wiley & Sons: New York, NY, USA, 2010. [Google Scholar]
- Dincer, I.; Rosen, M.A. Exergy Analysis of Heating, Refrigerating and Air Conditioning; Elsevier: Amsterdam, The Netherlands, 2015; pp. 131–168. [Google Scholar] [CrossRef]
- Fartaj, A.; Ting, D.S.K.; Yang, W.W. Second law analysis of the transcritical CO2 refrigeration cycle. Energy Convers. Manag. 2004, 45, 2269–2281. [Google Scholar] [CrossRef]
- Xu, X.X.; Liu, C.; Fu, X.; Gao, H.; Li, Y. Energy and exergy analyses of a modified combined cooling, heating, and power system using supercritical CO2. Energy 2015, 86, 414–422. [Google Scholar] [CrossRef]
- Meunier, F.; Poyelle, F.; LeVan, M.D. Second-law analysis of adsorptive refrigeration cycles: The role of thermal coupling entropy production. Appl. Therm. Eng. 1997, 17, 43–55. [Google Scholar] [CrossRef]
- Şencan, A.; Yakut, K.A.; Kalogirou, S.A. Exergy analysis of lithium bromide/water absorption systems. Renew. Energy 2005, 30, 645–657. [Google Scholar] [CrossRef]
- Kilicarslan, A.; Hosoz, M. Energy and irreversibility analysis of a cascade refrigeration system for various refrigerant couples. Energy Convers. Manag. 2010, 51, 2947–2954. [Google Scholar] [CrossRef]
- Gill, J.; Singh, J. Component-wise exergy and energy analysis of vapor compression refrigeration system using mixture of R134a and LPG as refrigerant. Heat Mass Transf. 2018, 54, 1367–1380. [Google Scholar] [CrossRef]
- Arora, A.; Kaushik, S.C. Theoretical analysis of a vapour compression refrigeration system with R502, R404A and R507A. Int. J. Refrig. 2008, 31, 998–1005. [Google Scholar] [CrossRef]
- Oruç, V.; Devecioğlu, A.G. Thermodynamic performance of air conditioners working with R417A and R424A as alternatives to R22. Int. J. Refrig. 2015, 55, 120–128. [Google Scholar] [CrossRef]
- Yataganbaba, A.; Kilicarslan, A.; Kurtbas, I. Exergy analysis of R1234yf and R1234ze as R134a replacements in a two evaporator vapour compression refrigeration system. Int. J. Refrig. 2015, 60, 26–37. [Google Scholar] [CrossRef]
- Mota-Babiloni, A.; Belman-Flores, J.M.; Makhnatch, P.; Navarro-Esbrí, J.; Barroso-Maldonado, J.M. Experimental exergy analysis of R513A to replace R134a in a small capacity refrigeration system. Energy 2018, 162, 99–110. [Google Scholar] [CrossRef]
- Babarinde, T.O.; Akinlabi, S.A.; Madyira, D.; Ohunakin, O.; Adelekan, D.; Oyedepo, S.O. Comparative analysis of the exergetic performance of a household refrigerator using R134a and R600a. Int. J. Energy Clean Environ. 2018, 19. [Google Scholar] [CrossRef] [Green Version]
- Gill, J.; Singh, J.; Ohunakin, O.S.; Adelekan, D.S. Exergy analysis of vapor compression refrigeration system using R450A as a replacement of R134a. J. Therm. Anal. Calorim. 2019, 136, 857–872. [Google Scholar] [CrossRef]
- Modi, N.; Pandya, B.; Patel, J.; Mudgal, A. Advanced Exergetic Assessment of a Vapor Compression Cycle With Alternative Refrigerants. J. Energy Resour. Technol. 2019, 141. [Google Scholar] [CrossRef]
- de Paula, C.H.; Duarte, W.M.; Rocha, T.T.M.; de Oliveira, R.N.; Maia, A.A.T. Optimal design and environmental, energy and exergy analysis of a vapor compression refrigeration system using R290, R1234yf, and R744 as alternatives to replace R134a. Int. J. Refrig. 2020, 113, 10–20. [Google Scholar] [CrossRef]
- Ahamed, J.U.; Saidur, R.; Masjuki, H.H. A review on exergy analysis of vapor compression refrigeration system. Renew. Sustain. Energy Rev. 2011, 15, 1593–1600. [Google Scholar] [CrossRef]
- Bridges, B.D.; Harshbarger, D.S.; Bullard, C.W. Second law analysis of refrigerators and air conditioners. ASHRAE Trans. 2001, 107, 644–651. [Google Scholar]
- Yumrutaş, R.; Kunduz, M.; Kanoğlu, M. Exergy analysis of vapor compression refrigeration systems. Exergy Int. J. 2002, 2, 266–272. [Google Scholar] [CrossRef]
- Kabul, A.; Kizilkan, Ö.; Yakut, A.K. Performance and exergetic analysis of vapor compression refrigeration system with an internal heat exchanger using a hydrocarbon, isobutane (R600a). Int. J. Energy Res. 2008, 32, 824–836. [Google Scholar] [CrossRef]
- Lee, T.S. Second-Law analysis to improve the energy efficiency of screw liquid chillers. Entropy 2010, 12, 375–389. [Google Scholar] [CrossRef] [Green Version]
- Byrne, P.; Ghoubali, R. Exergy analysis of heat pumps for simultaneous heating and cooling. Appl. Therm. Eng. 2019, 149, 414–424. [Google Scholar] [CrossRef]
- Voloshchuk, V.; Gullo, P.; Sereda, V. Advanced exergy-based performance enhancement of heat pump space heating system. Energy 2020, 205, 117953. [Google Scholar] [CrossRef]
- Bahman, A.M.; Groll, E.A. Second-law analysis to improve the energy efficiency of environmental control unit. In Proceedings of the 16th International Refrigeration and Air Conditioning Conference at Purdue, West Lafayette, IN, USA, 11–14 July 2016; p. 2328. [Google Scholar]
- AHRI. ANSI/AHRI Standard 210/240 with Addenda 1 and 2. Performance Rating of Unitary Air-Conditioning and Air-Source Heat Pump Equipment. 2008. Available online: http://www.ahrinet.org/App_Content/ahri/files/STANDARDS/ANSI/ANSI_AHRI_Standard_210_240_with_Addenda_1_and_2.pdf (accessed on 1 January 2020).
- Klein, S.; Alvarado, F. Engineering Equation Solver, Academic Commercial Version 10.644; F-Chart Software: Madison, WI, USA, 2019. [Google Scholar]
- Taylor, B.; Kuyatt, C. NIST Technical Note 1279: Guidelines for Evaluating and Expressing the Uncertainty of NIST Measurements Results; National Institute of Standards and Technology: Washington, DC, USA, 1994. [Google Scholar]
- Bahman, A.M.; Groll, E.A. Application of interleaved circuitry to improve evaporator effectiveness and COP of a packaged AC system. Int. J. Refrig. 2017, 79, 114–129. [Google Scholar] [CrossRef]
- Lumpkin, D.R.; Bahman, A.M.; Groll, E.A. Two-phase injected and vapor-injected compression: Experimental results and mapping correlation for a R-407C scroll compressor. Int. J. Refrig. 2018, 86, 449–462. [Google Scholar] [CrossRef]
- Bahman, A.M.; Ziviani, D.; Groll, E.A. Vapor injected compression with economizing in packaged air conditioning systems for high temperature climate. Int. J. Refrig. 2018, 94, 136–150. [Google Scholar] [CrossRef]
Figure 1.
Schematic diagram of the vapor compression system.

Figure 2.
Physical layout of (a) 1.5-RT, (b) 3-RT, and (c) 5-RT ECUs with the installed measurement instruments for experimental testing at the psychrometric chambers.
Figure 2.
Physical layout of (a) 1.5-RT, (b) 3-RT, and (c) 5-RT ECUs with the installed measurement instruments for experimental testing at the psychrometric chambers.

Figure 3.
The measured points of ECUs.

Figure 4.
Parity plots comparing the cooling capacity between the air-side and the refrigerant-side for 1.5-RT, 3-RT, and 5-RT ECUs.
Figure 4.
Parity plots comparing the cooling capacity between the air-side and the refrigerant-side for 1.5-RT, 3-RT, and 5-RT ECUs.

Figure 5.
Comparison of cycle coefficient of performance for 1.5-RT, 3-RT, and 5-RT ECUs.

Figure 6.
Comparison of exergy destruction (or irreversibility) for 1.5-RT, 3-RT, and 5-RT ECUs.

Figure 7.
Comparison of second-law efficiency for 1.5-RT, 3-RT, and 5-RT ECUs.

Figure 8.
(a) P-h and (b) T-s diagrams to compare 1.5-RT, 3-RT, and 5-RT ECUs at Test Condition 1.

Figure 9.
Exergy destruction (or irreversibility) comparison for the components of 1.5-RT, 3-RT, and 5-RT ECUs at Test Condition 1.
Figure 9.
Exergy destruction (or irreversibility) comparison for the components of 1.5-RT, 3-RT, and 5-RT ECUs at Test Condition 1.

Figure 10.
Exergy destruction (or irreversibility) ratio comparison for the components of 1.5-RT, 3-RT, and 5-RT ECUs at Test Condition 1.
Figure 10.
Exergy destruction (or irreversibility) ratio comparison for the components of 1.5-RT, 3-RT, and 5-RT ECUs at Test Condition 1.


Table 1.
Experimental setup measurement instrument and their accuracy.
| Physical Parameter | Instrument | Range | Accuracy |
|---|---|---|---|
| In-line temperature | Thermocouple stainless steel T-type | –350 °C | °C |
| Surface temperature | Thermocouple wire T-type | –350 °C | °C |
| Refrigerant pressure | Pressure transducer | 0–1750 kPa, 0–3500 kPa, 0–7000 kPa | % FS |
| Air humidity | Hygrometer chilled mirror | –85°C, 0–95% | °C |
| Air pressure | Static pressure transducer | 0–5 in HO | % FS |
| Air flow rate | ASHRAE nozzle box | 2188–5107 m/h | m/h |
| Refrigerant flow rate | Coriolis flow meter | 0–2720 kg/h | % kg/h |
| Power consumption | Power transducer | 0–45 kW | % FS |
| Current transformer | CR | % FS |
Table 2.
Experimental testing conditions in psychrometric rooms.
| Test No. | Outdoor Condition | Indoor Condition | Description | ||||||
|---|---|---|---|---|---|---|---|---|---|
| Dry-Bulb | Wet-Bulb | Dry-Bulb | Wet-Bulb | ||||||
| (°C) | (°F) | (°C) | (°F) | (°C) | (°F) | (°C) | (°F) | ||
| 1 | 51.7 | 125 | 29.4 | 85 | 32.2 | 90 | 23.9 | 75 | Steady, wet coil |
| 2 | 46.1 | 115 | 22.2 | 72 | 29.4 | 85 | 17.2 | 63 | Steady, dry coil |
| 3 | 40.6 | 105 | 22.8 | 73 | 29.4 | 85 | 17.2 | 63 | Steady, dry coil |
| 4 | 35 | 95 | 23.9 | 75 | 26.7 | 80 | 19.4 | 67 | Steady, wet coil |
| 5 | 29.4 | 85 | 17.2 | 63 | 23.9 | 75 | 13.9 | 57 | Steady, dry coil |
| 6 | 23.9 | 75 | 17.2 | 63 | 25 | 77 | 13.9 | 57 | Steady, dry coil |
Table 3.
Thermodynamics properties measured and calculated for 1.5-RT, 3-RT, and 5-RT ECUs at all state points for Test Condition 1.
Table 3.
Thermodynamics properties measured and calculated for 1.5-RT, 3-RT, and 5-RT ECUs at all state points for Test Condition 1.
| Unit | State | Pressure | Temperature | Enthalpy | Entropy | Specific volume | Description |
|---|---|---|---|---|---|---|---|
| P (kPa) | T (°C) | h (kJ/kg) | s (J/(kg.K)) | v (m/g) | |||
| 1.5-RT | 1 | Evaporator outlet | |||||
| 2 | Compressor inlet | ||||||
| 3 | Compressor outlet | ||||||
| 4 | Condenser inlet | ||||||
| 5 | Condenser outlet | ||||||
| 6 | Expansion valve inlet | ||||||
| 7 | Evaporator inlet | ||||||
| 3-RT | 1 | Evaporator outlet | |||||
| 2 | Compressor inlet | ||||||
| 3 | Compressor outlet | ||||||
| 4 | Condenser inlet | ||||||
| 5 | Condenser outlet | ||||||
| 6 | Expansion valve inlet | ||||||
| 7 | Evaporator inlet | ||||||
| 5-RT | 1 | Evaporator outlet | |||||
| 2 | Compressor inlet | ||||||
| 3 | Compressor outlet | ||||||
| 4 | Condenser inlet | ||||||
| 5 | Condenser outlet | ||||||
| 6 | Expansion valve inlet | ||||||
| 7 | Evaporator inlet |
Table 4.
First- and second-law analysis results for 1.5-RT, 3-RT, and 5-RT ECUs at Test Condition 1.
Table 4.
First- and second-law analysis results for 1.5-RT, 3-RT, and 5-RT ECUs at Test Condition 1.
| Unit | Component | First-Law Analysis | Second-Law Analysis | ||||||
|---|---|---|---|---|---|---|---|---|---|
| COP | |||||||||
| (W) | (W) | (–) | (W/K) | (W) | (%) | (%) | (%) | ||
| 1.5-RT | Evaporator | 0 | |||||||
| Suction line | 0 | ||||||||
| Compressor | |||||||||
| Discharge line | 0 | ||||||||
| Condenser | 0 | ||||||||
| Liquid line | 0 | ||||||||
| Expansion valve | 0 | ||||||||
| Total | – | ||||||||
| 3-RT | Evaporator | 0 | |||||||
| Suction line | 0 | ||||||||
| Compressor | |||||||||
| Discharge line | 0 | ||||||||
| Condenser | 0 | ||||||||
| Liquid line | 0 | ||||||||
| Expansion valve | 0 | ||||||||
| Total | – | ||||||||
| 5-RT | Evaporator | 0 | |||||||
| Suction line | 0 | ||||||||
| Compressor | |||||||||
| Discharge line | 0 | ||||||||
| Condenser | 0 | ||||||||
| Liquid line | 0 | ||||||||
| Expansion valve | 0 | ||||||||
| Total | – | ||||||||
© 2020 by the authors. Licensee MDPI, Basel, Switzerland. This article is an open access article distributed under the terms and conditions of the Creative Commons Attribution (CC BY) license (http://creativecommons.org/licenses/by/4.0/).
Share and Cite
MDPI and ACS Style
Bahman, A.M.; Groll, E.A. Application of Second-Law Analysis for the Environmental Control Unit at High Ambient Temperature. Energies 2020, 13, 3274. https://doi.org/10.3390/en13123274
AMA Style
Bahman AM, Groll EA. Application of Second-Law Analysis for the Environmental Control Unit at High Ambient Temperature. Energies. 2020; 13(12):3274. https://doi.org/10.3390/en13123274
Chicago/Turabian StyleBahman, Ammar M., and Eckhard A. Groll. 2020. "Application of Second-Law Analysis for the Environmental Control Unit at High Ambient Temperature" Energies 13, no. 12: 3274. https://doi.org/10.3390/en13123274
Note that from the first issue of 2016, this journal uses article numbers instead of page numbers. See further details here.