Parameter Estimation of Inter-Laminar Fault-Region in Laminated Sheets Through Inverse Approach


1
Department of Electrical Engineering and Automation, Aalto University, 02150 Espoo, Finland
2
Electrical Power and Engineering Department, Cairo University, Cairo 12613, Egypt
*
Author to whom correspondence should be addressed.
Energies 2020, 13(12), 3251; https://doi.org/10.3390/en13123251
Submission received: 1 June 2020
/
Revised: 18 June 2020
/
Accepted: 19 June 2020
/
Published: 23 June 2020
(This article belongs to the Special Issue Advances in the Field of Electrical Machines and Drives)
Abstract
:Estimating the additional power losses caused by an inter-laminar short circuit in electromagnetic devices using thermal measurements depends on many parameters such as thermal conductivity, heat capacity, convective heat coefficient, and size of the fault points. This paper presents a method for estimating these parameters using experimental measurement and a numerical model. The surface temperature rise due to inter-laminar short circuit fault was obtained using an infrared camera. Based on the initial temperature rise method, the least square non-linear approximation technique was used to determine the best fitting parameters of the fault region from the numerical model. To validate the results obtained, the fault region temperature rise and the total loss of the experimental sample were compared with the numerical model using the obtained parameters for different current supply conditions. The study shows that surface temperature distribution can be used to estimate the inter-laminar short circuit fault parameters and localized losses.
1. Introduction
The manufacturing process of electrical machines that includes punching/cutting, core assembly, and welding induces mechanical and thermal stresses to the electrical steel sheet. The induced stresses cause degradation of the magnetic properties of the laminated steel sheet around the cutting edge and the welded region [1,2,3,4,5], which has a direct impact on the core losses of the final manufactured electrical machine. Furthermore, the mechanical stress during the punching process inevitably causes burr on the cut edge of the steel, when the sheets are stacked and welded together to form the machine core, can lead to the formation of an inter-laminar short circuit fault between laminations. Since the core is subjected to a time-varying magnetic field during operation, circulating eddy currents are induced around the short circuit region. These currents create an additional localized power loss around the short circuit region and if this electrical shorting covers several laminations, high currents can circulate leading to a significant increase in the power loss and excessive localized heating. In the absence of adequate cooling, this phenomenon might lead to an insulation breakdown of the machine laminations. Thus, it causes the potential of a complete machine failure.
In order to improve the efficiency of the manufacturing process and reduce the losses in the machine, it is important to study and accurately measure the power loss associated with the inter-laminar short circuit fault in electrical machines. Researchers have used analytical, numerical and experimental methods to study the inter-laminar faults and investigate their effects on the core loss of electrical machines in recent years. Wang and Zhang in [6] analyzed the effect of weld bead radius on eddy current distribution in laminated electrical steels and they concluded that the eddy current losses increase as the weld radius increases. The impact of inter-laminar short circuit and fault positions on eddy current losses was also studied using experimental measurements in [7,8]. The results showed that the fault position and the number of shorted laminations significantly affected the total core losses. However, the position, size, and number of short circuit laminations in the core of electrical machines are generally stochastic in nature, this makes modeling and measuring of losses associated with inter-laminar short circuit faults in electrical machines difficult.
Another approach used in [9,10,11,12] to determine power loss in electrical machines, is the initial rate of the temperature rise method. This approach is based on the principle that losses generated in the core of an electrical machine contribute directly to the temperature rise of the core. Hence, by measuring the temperature rise during the instant of heat generation, the core loss distribution can be directly determined. However, to obtain accurate results, the temperature rise must be measured within 5–10 s of the power switch on [10]. In [9], a thermographic imaging technique was used based on the initial temperature rise to directly measure the core losses in electrical steel sheets. Their analysis showed that the material properties also affect the accuracy of the results obtained.
In this paper, a contactless method for estimating the localized losses due to inter-laminar short circuit faults is developed based on inverse approximation techniques. The approach used in this research work is based on both experimental measurements and numerical modeling. First, the initial temperature rise of the hotspot formed by inter-laminar contact is measured using a thermal camera. The detailed explanation of the experimental sample and measurement setup is given in Section 2. To estimate the parameters of the fault region, a 3D finite element model of a coupled electric field and heat transfer is developed using COMSOL Multi-physics in Section 3. Finally, an inverse approach is used to obtain the fault size, thermal conductivity, electrical conductivity, and convective coefficient of the faulty region using the least square non-linear method to minimize the error between the measured and simulated surface temperature rise. Analysis of the results obtained shows that the simulated hotspot temperature rise from the numerical model using the estimated parameters is in agreement with the experimental measurements for different current supply conditions.
2. Experimental Measurement
In this section, the experimental measurement setup used in the study of inter-laminar short circuit fault is described together with the thermal camera measuring procedure.
2.1. Measurement Setup
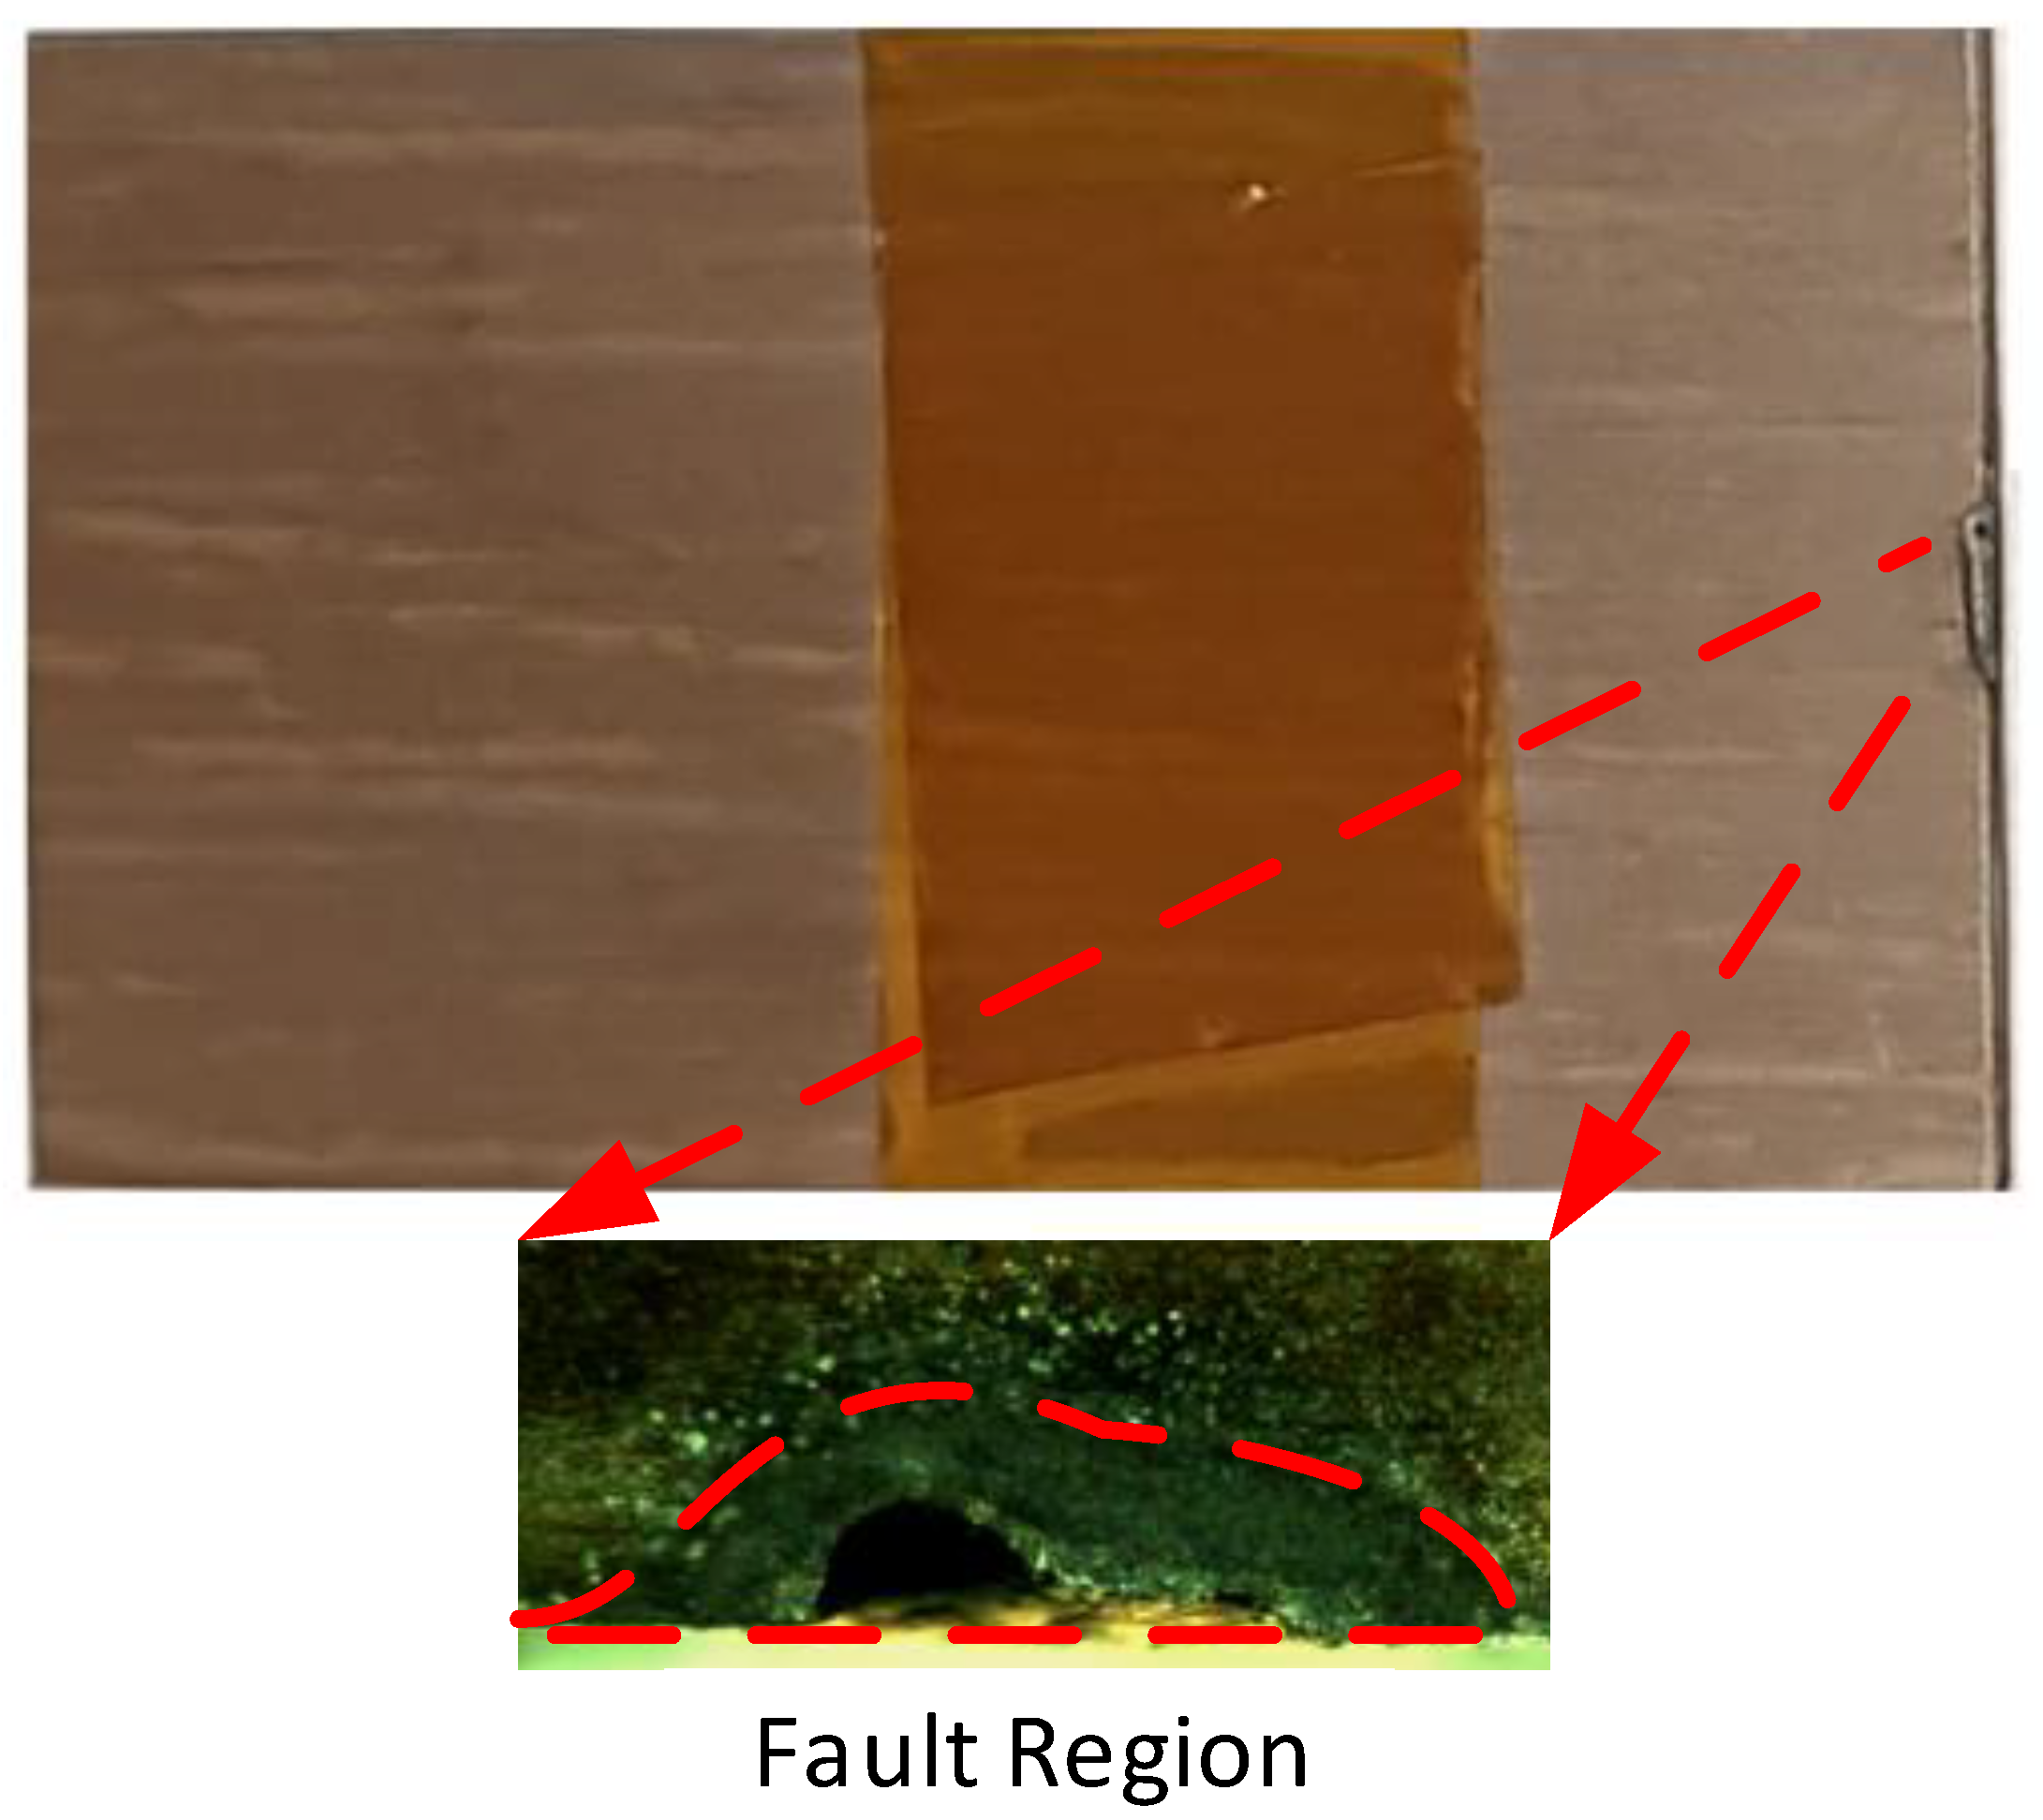
A stack of two (26 × 40 mm) non-oriented laminated electrical sheets were used for the experimental study. The sheet thickness is 0.5 mm and the material grade is M450-50A and it is semi-processed. The sheets are cut to be burr free. Hence, there will be no galvanic contact between them when stacked together. To model inter-laminar faults between the laminations, laser beam spot welding is used to create a force contact on one end of the stacked laminations. The assembly of the 2-sheets is done carefully and without additional forces, so that the only place where the insulation could be damaged is in the proximity of the welding. Figure 1 shows the sample used in the experimental study with a magnified image of the fault region when observed from the top using a magnifying camera IMPERX GEV-B1922C-SC000.
To perform the experimental measurements, the sample is energized with a DC current supplied through copper wires attached to the other end of the sample. The temperature rise distribution of the fault region is recorded during the current switch on, using an infrared thermal camera. The sample total loss was determined from the measured voltage and input current at the supply spot on the sample during the switch on period. The thermal measurements are described in the next subsection.
2.2. Thermal Measurement
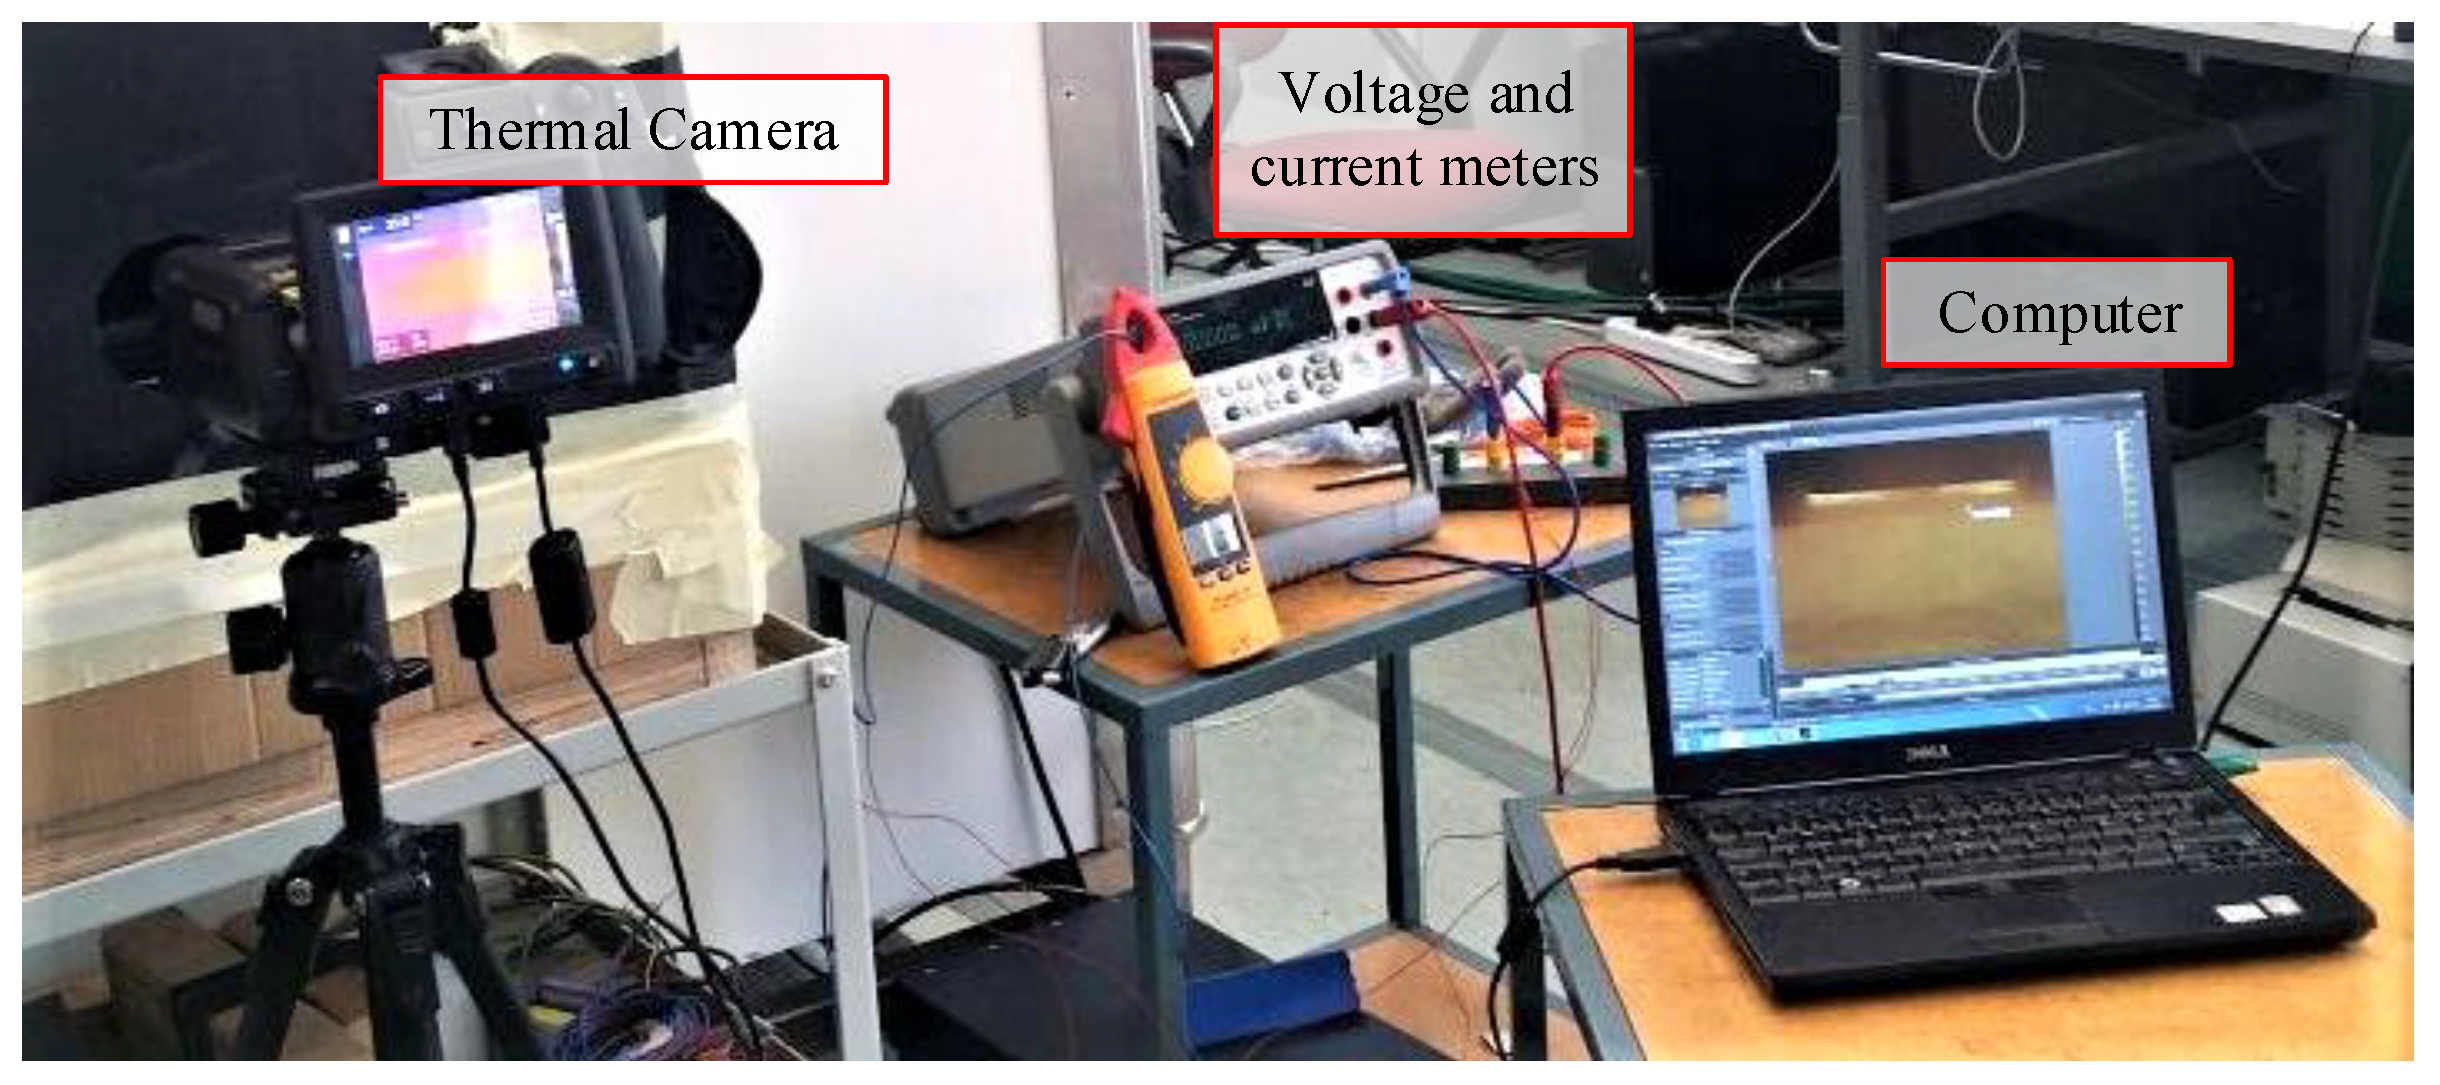
The thermal measurement setup used for the experimental study is shown in Figure 2. The measured sample is placed inside a black cardboard box to reduce the reflective temperature effect from surrounding objects. An infrared camera is used to measure the surface temperature distribution of the fault region at the instant of the power switch. The infrared camera specifications used for the measurements are given in Table 1.
3. Thermal-Electric Finite Element (FE) Model
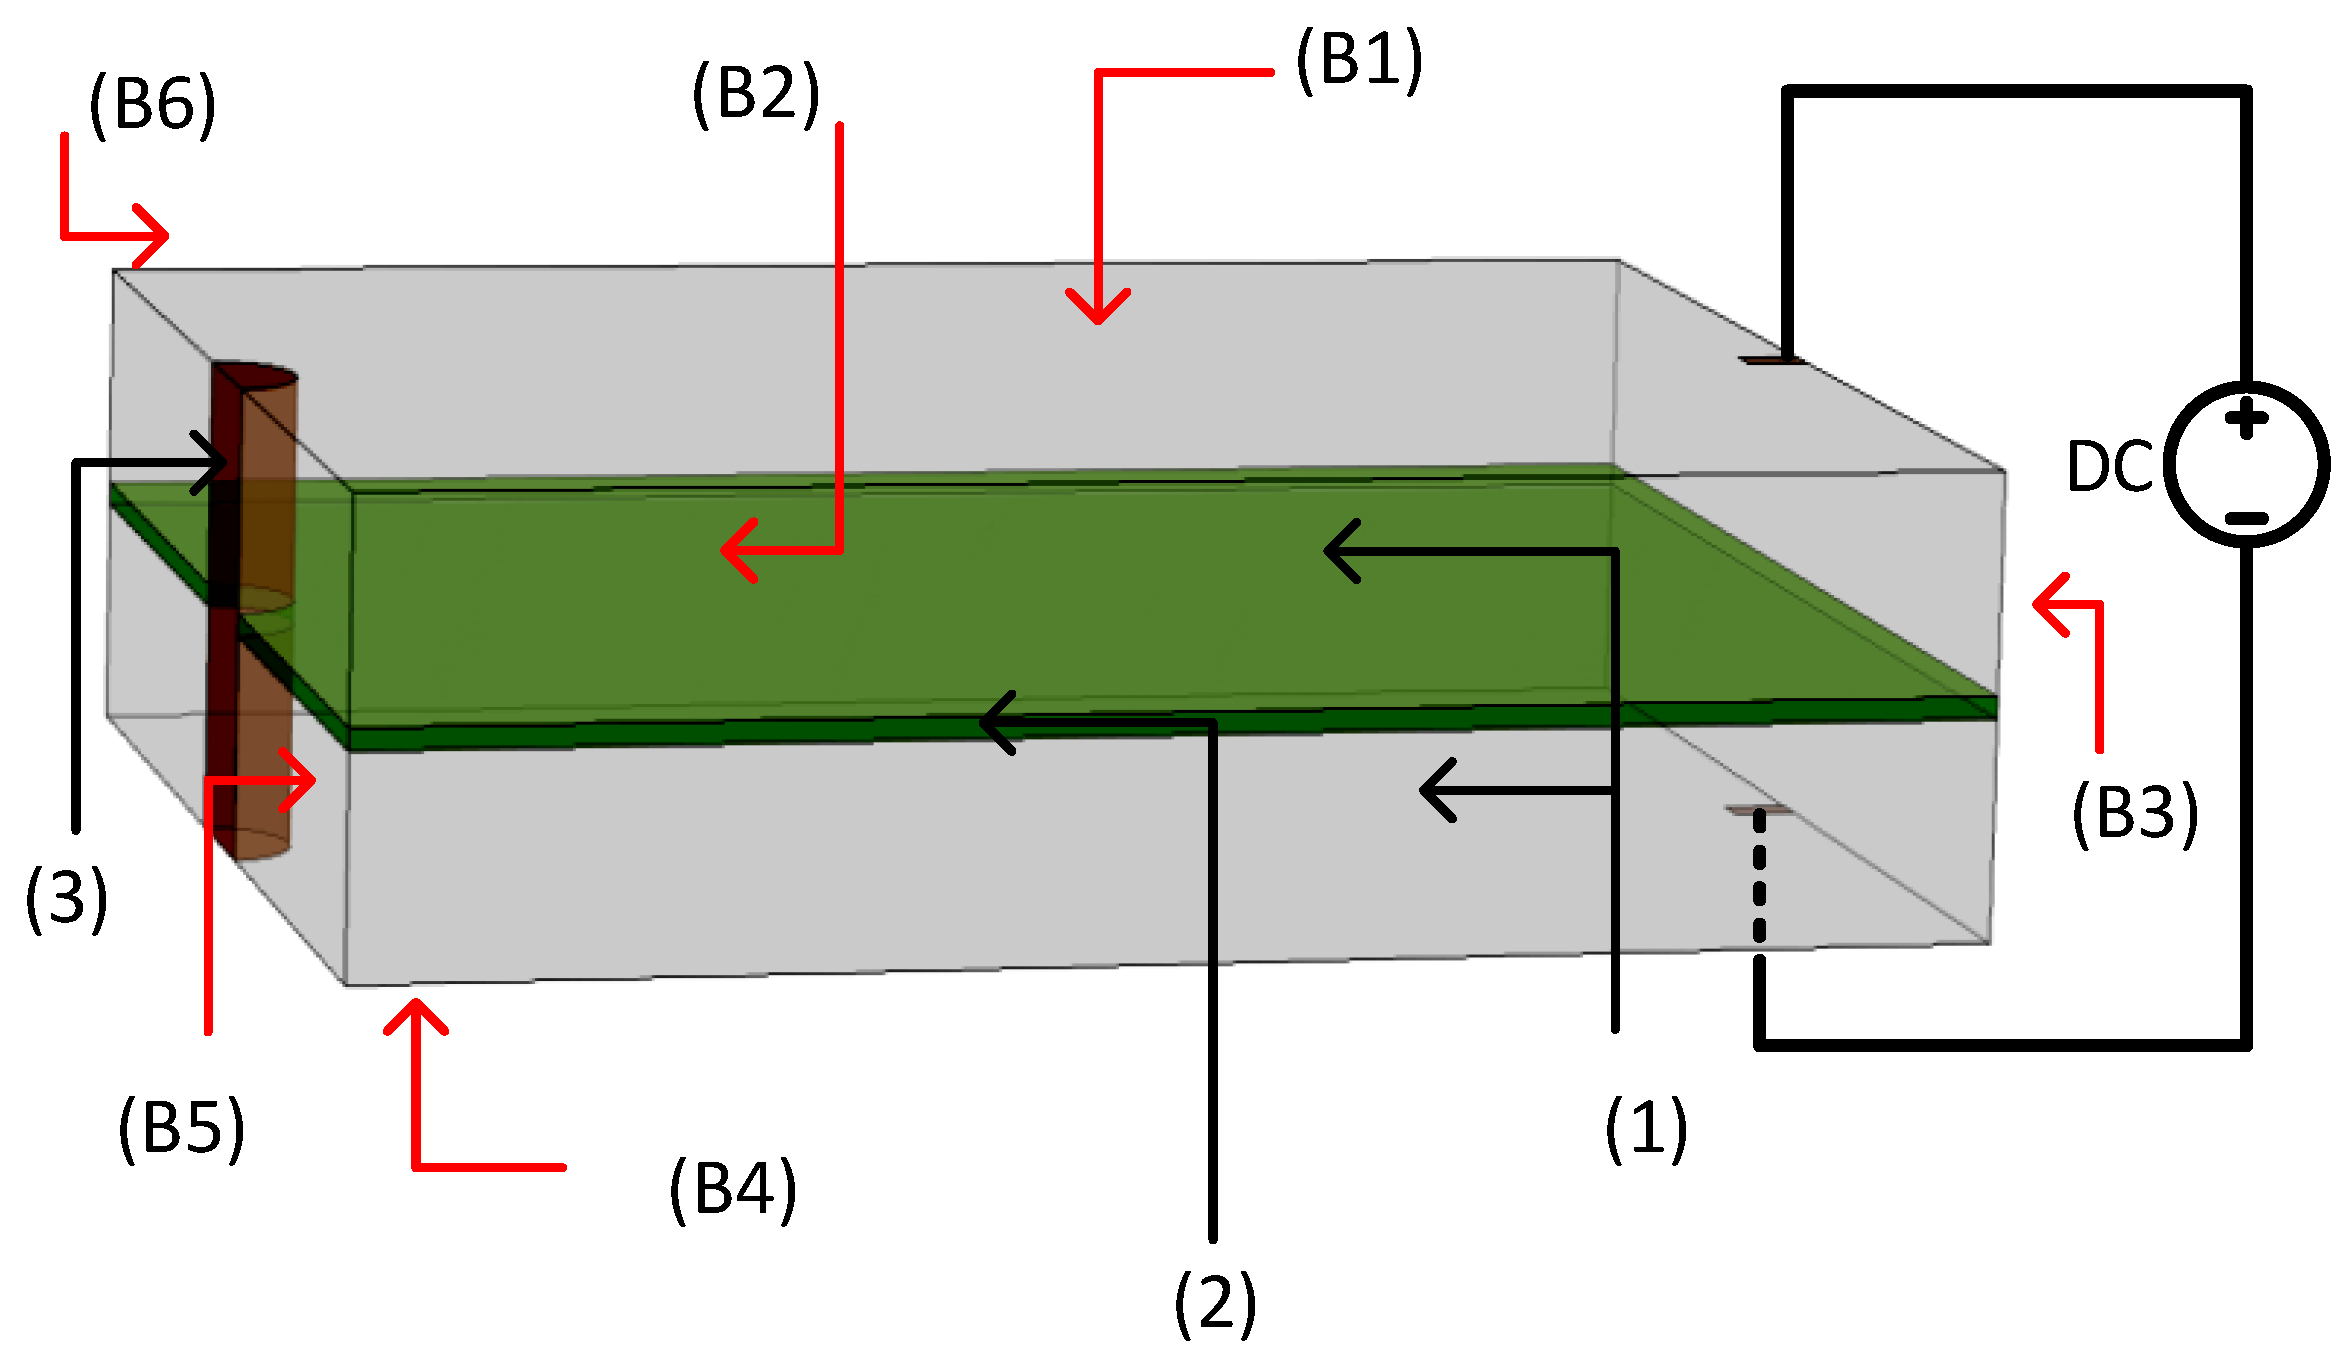
A 3D time-dependent coupled electric and heat transfer simulation was carried out using COMSOL. To simplify the geometry of the fault region in the modeled sample, a semi-cylindrical shape was used to represent the fault region as shown in the model geometry description in Figure 3 and the physics used in the model is derived below.
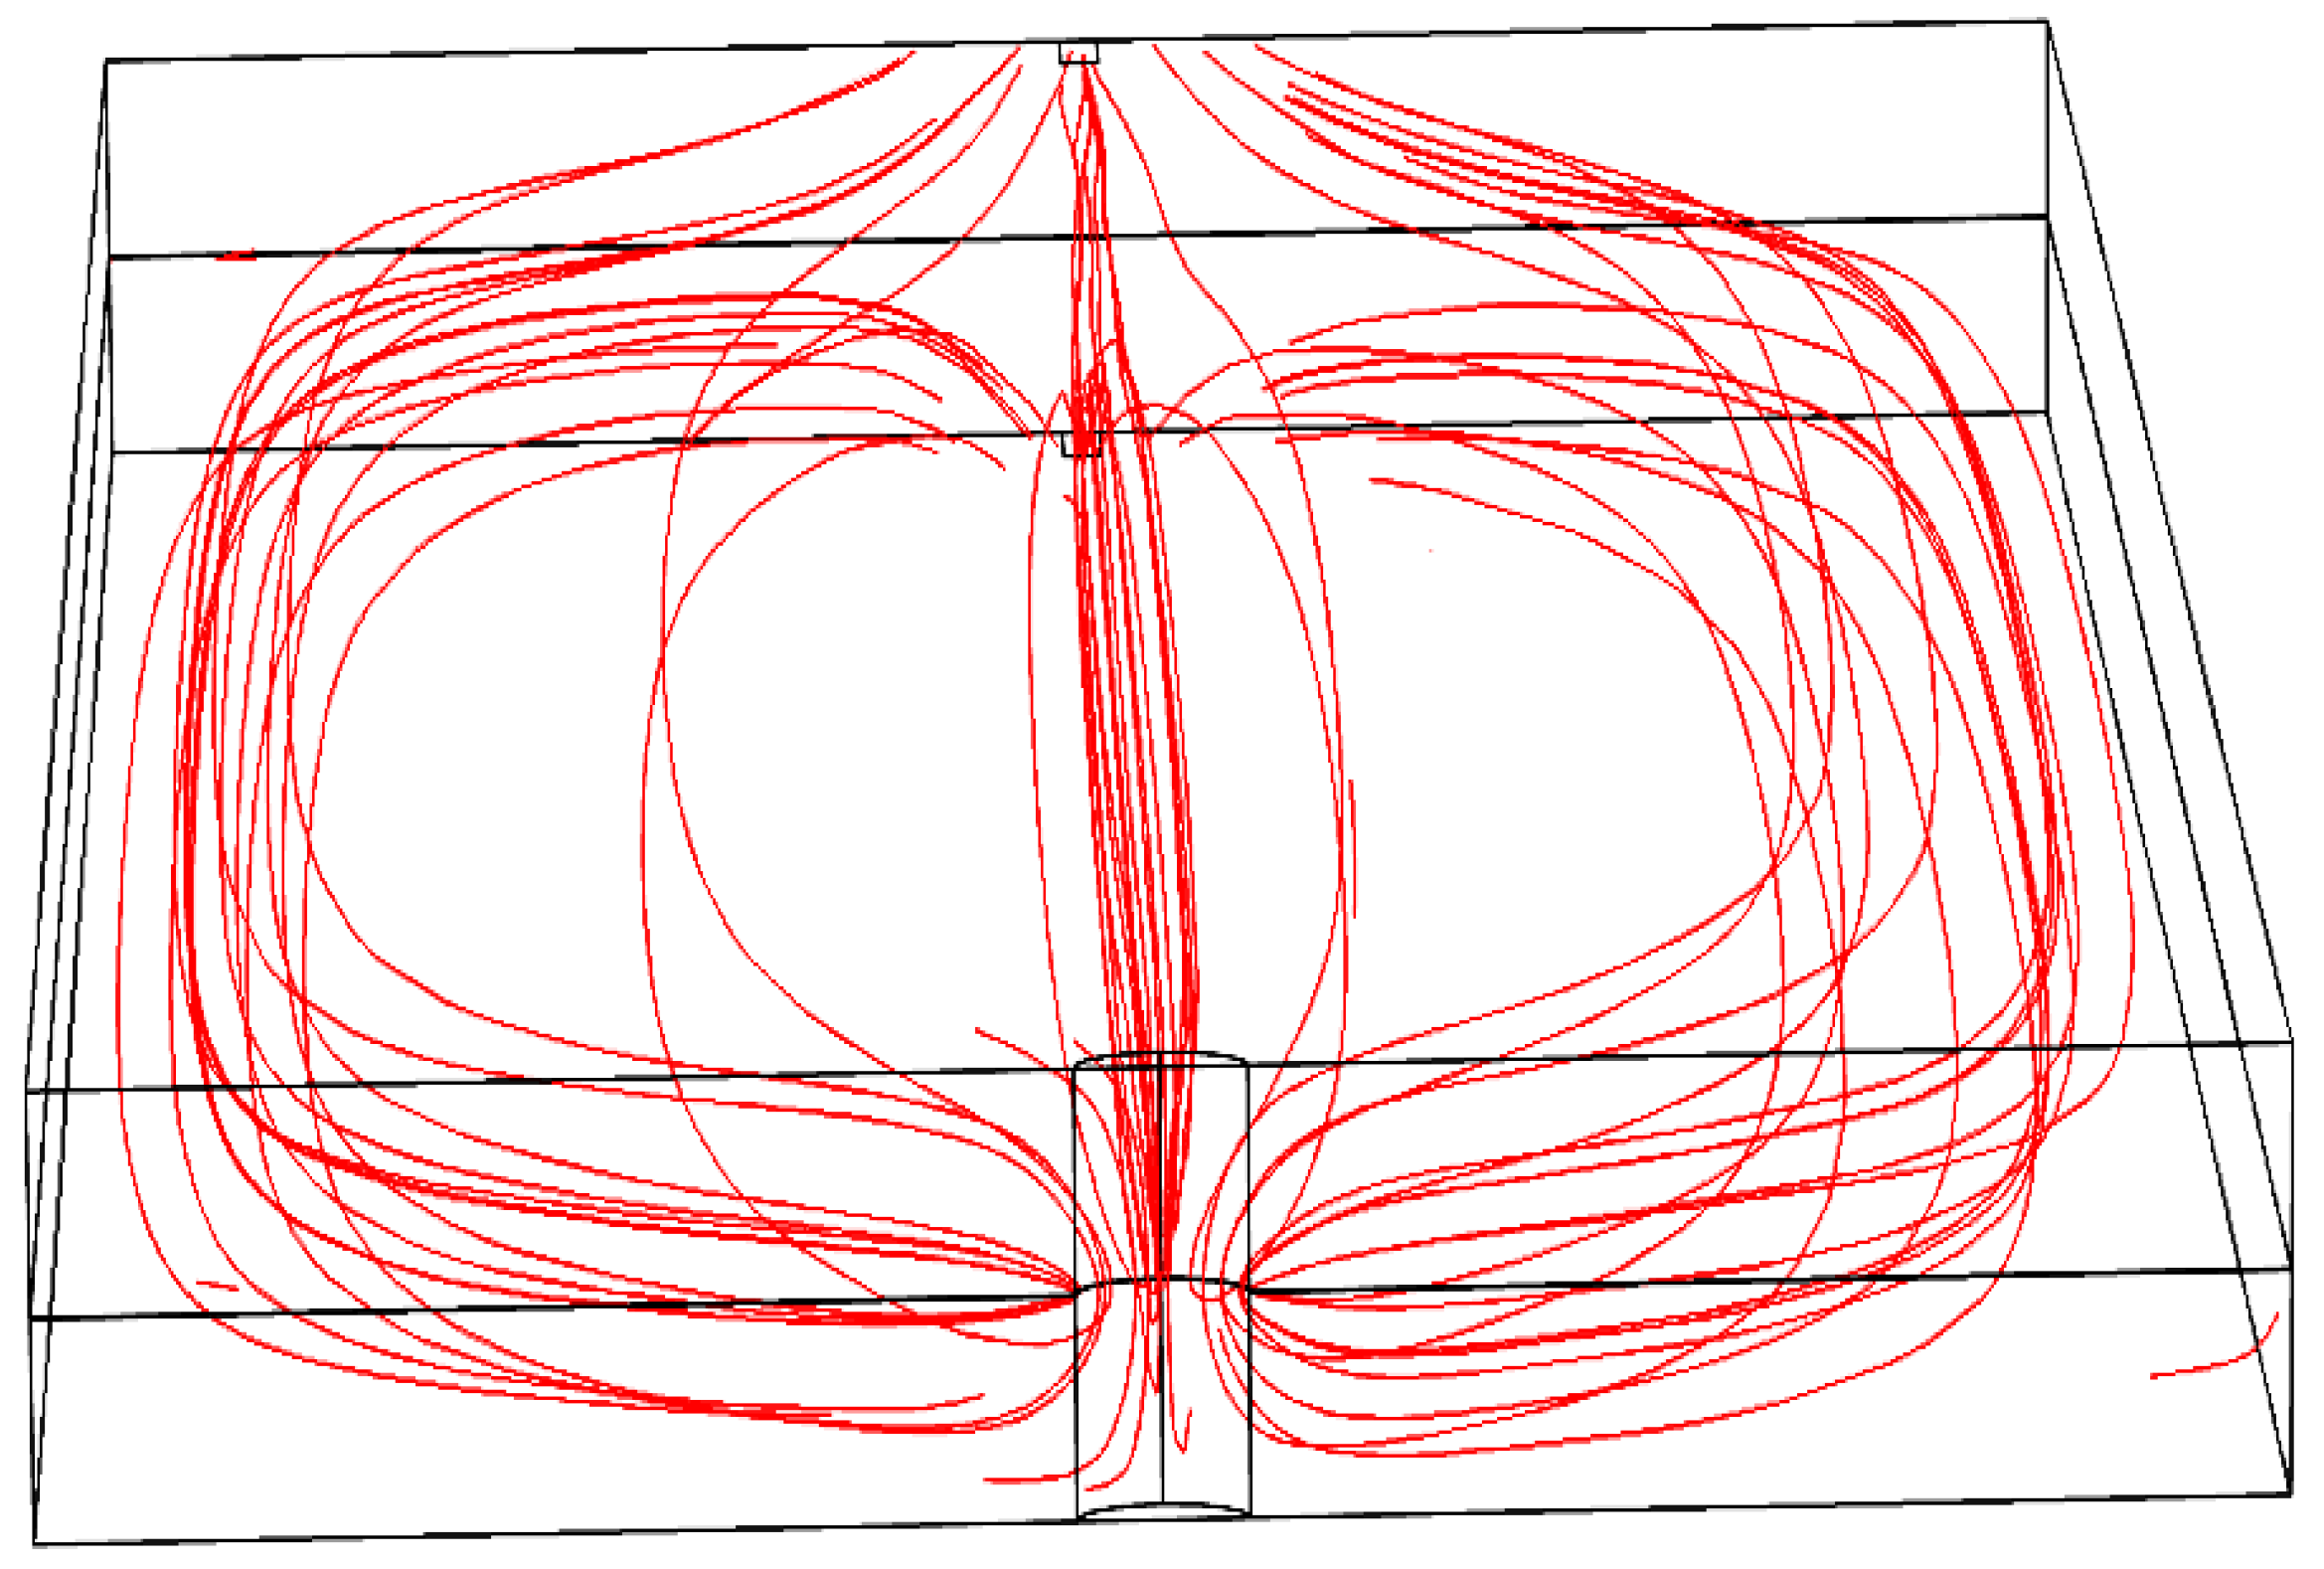
When DC current is applied to the sample, steady current starts to flow inside the lamination and through the short circuit path, as shown in Figure 4.
The resistive loss distribution in (W/m) generated inside the lamination and in the fault region is computed using (1) and coupled with the heat transfer study as the source.
where, is the applied current, is the inter-laminar short circuit fault resistance, R, is the resistance of the remaining part of the sample, is the electrical conductivity of the fault region, is the electrical conductivity of the sample, is the volume of the fault region, v is the volume of the remaining part of the sample, and is the current density. The coupled solution for the temperature distribution is derived from the 3D general heat equation expressed as shown in (2), where is the heat source obtained from the electric field solution in (1).
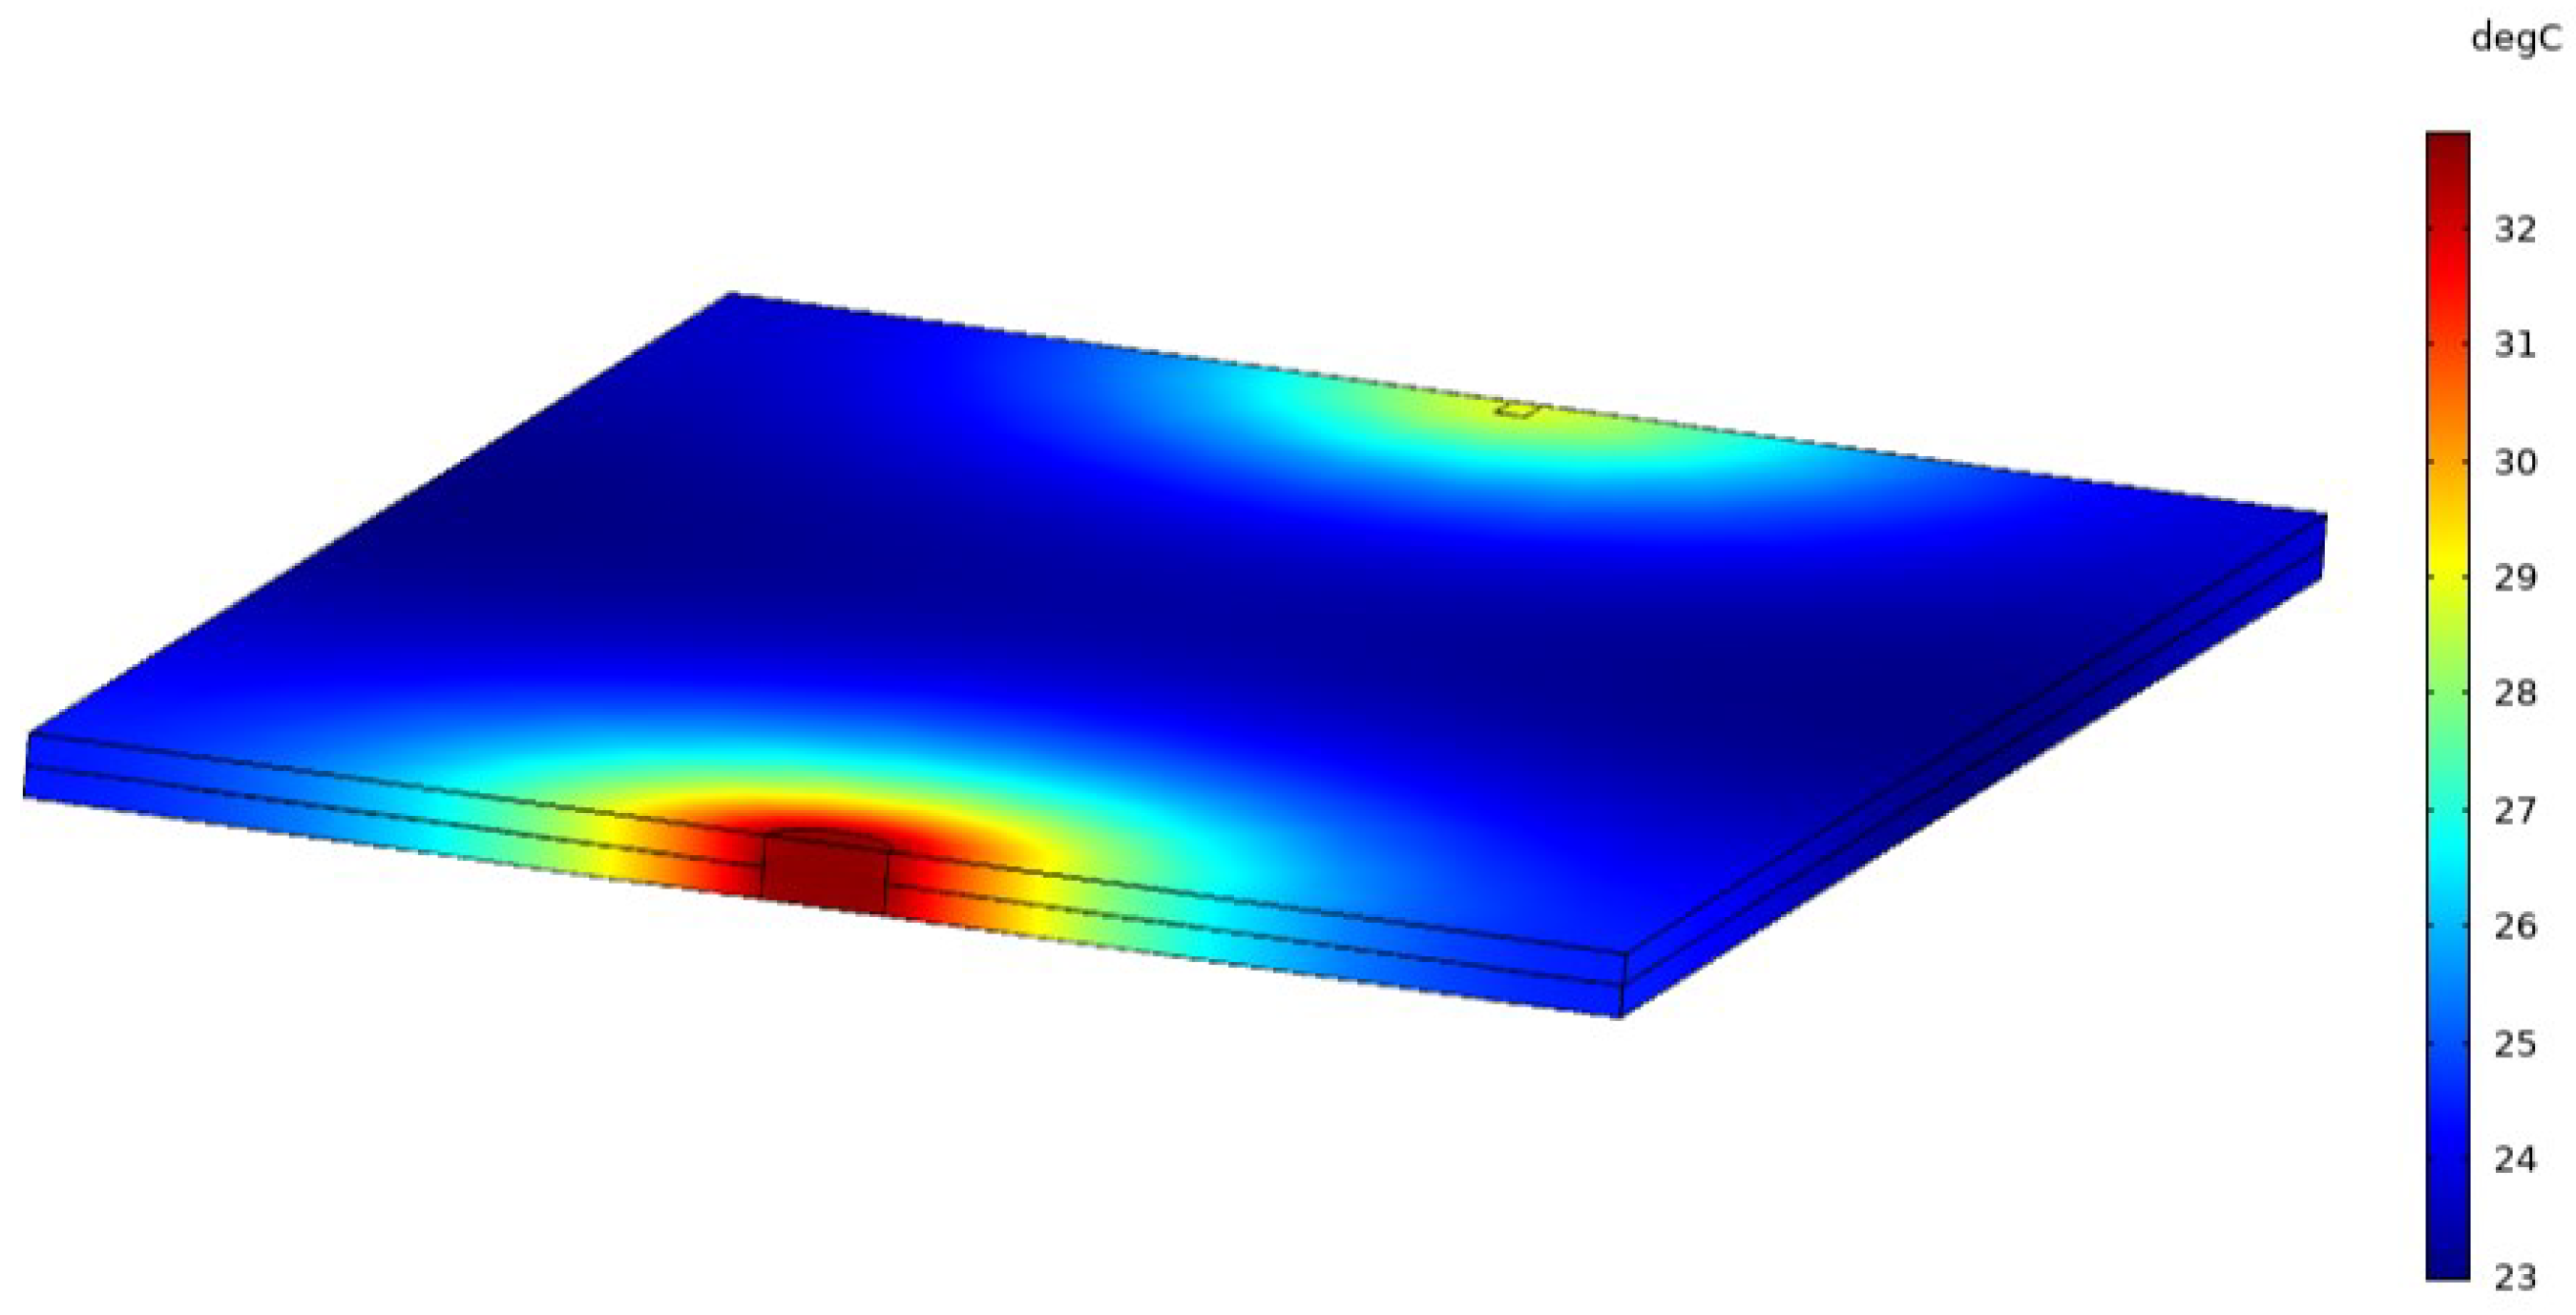
where, , , k, T, , , , and , are the mass density, specific heat capacity, thermal conductivity, temperature, the initial temperature of the sample, convective heat coefficient, the surface normal to the surrounding, and heat flux of the material respectively. Hence, to solve the heat Equation (2) the boundary condition and initial conditions of the model sample must be specified. Convective heat flux defined by (4) is assigned to all open boundaries (B1–B6), as shown in Figure 3. The coupled model is simulated using a 1 mm fault size and known material properties for 10 s. The temperature distribution of the simulated model is shown in Figure 5.
Further analysis of the temperature rise in the fault zone shows that parameters such as thermal conductivity, electrical conductivity, fault size, and convective heat transfer to the surrounding affect the temperature distribution around that region. Therefore, to determine the actual parameters of the experimental sample, an inverse model is developed to fit the simulated temperature rise from the fault region to the measured temperature rise.
4. The Inverse Approach
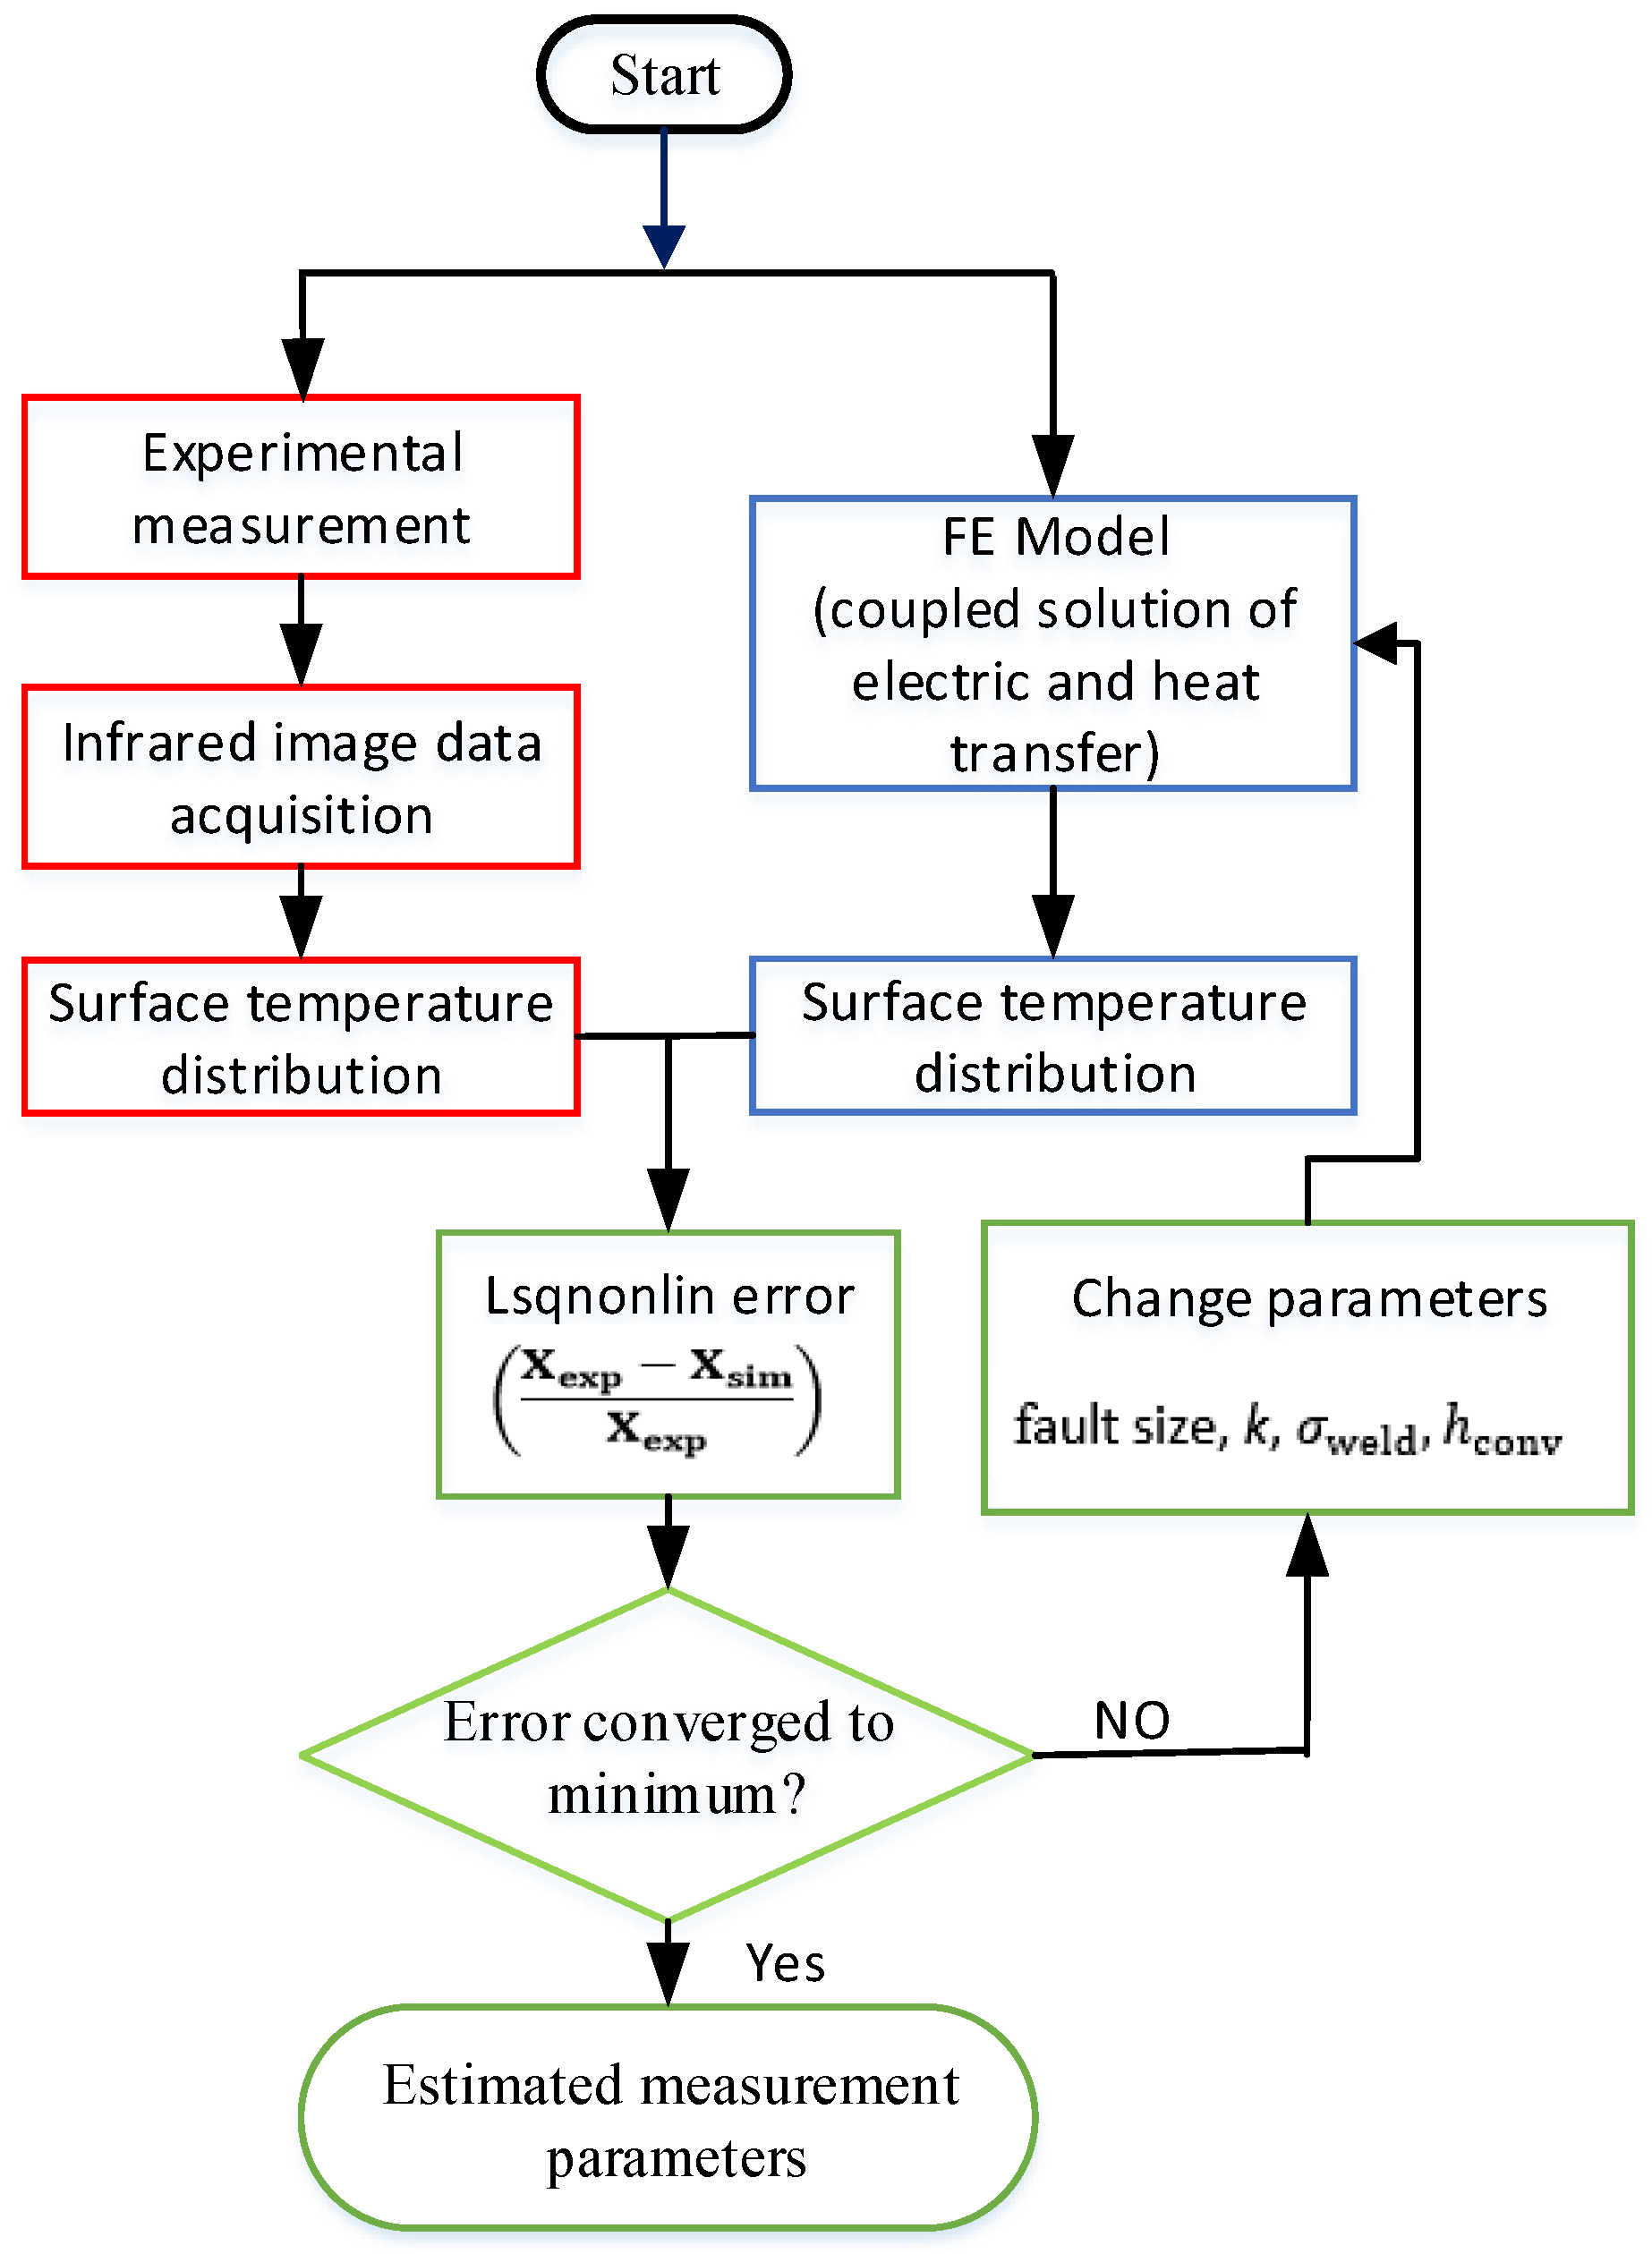
The target of the inverse problem is to predict the size of the fault region and also to determine the material properties such as convective heat coefficient, thermal conductivity and electric conductivity of the faulty region, which are essential for accurate estimation of the localized loss through temperature measurements. The methodology used in this research is presented in the model algorithm flowchart in Figure 6. The model takes as an input the average surface temperature rise on the fault area and the measured voltage from the forward FE model and experimental sample. Using the least square non-linear approximation method, the error between the measured and simulated inputs is minimized iteratively over time until the best fit parameters for the fault region are obtained.
5. Results and Discussion
In this study, two samples of different fault widths were measured. The faults were imposed on the samples by using different laser beam weld widths. The measured sample surface was painted black to improve the accuracy of the measured temperature rise. The infrared camera is calibrated for the measurements, as shown in Table 2. A DC current of 20 A is first supplied to each of the experimental samples at ambient temperature conditions.
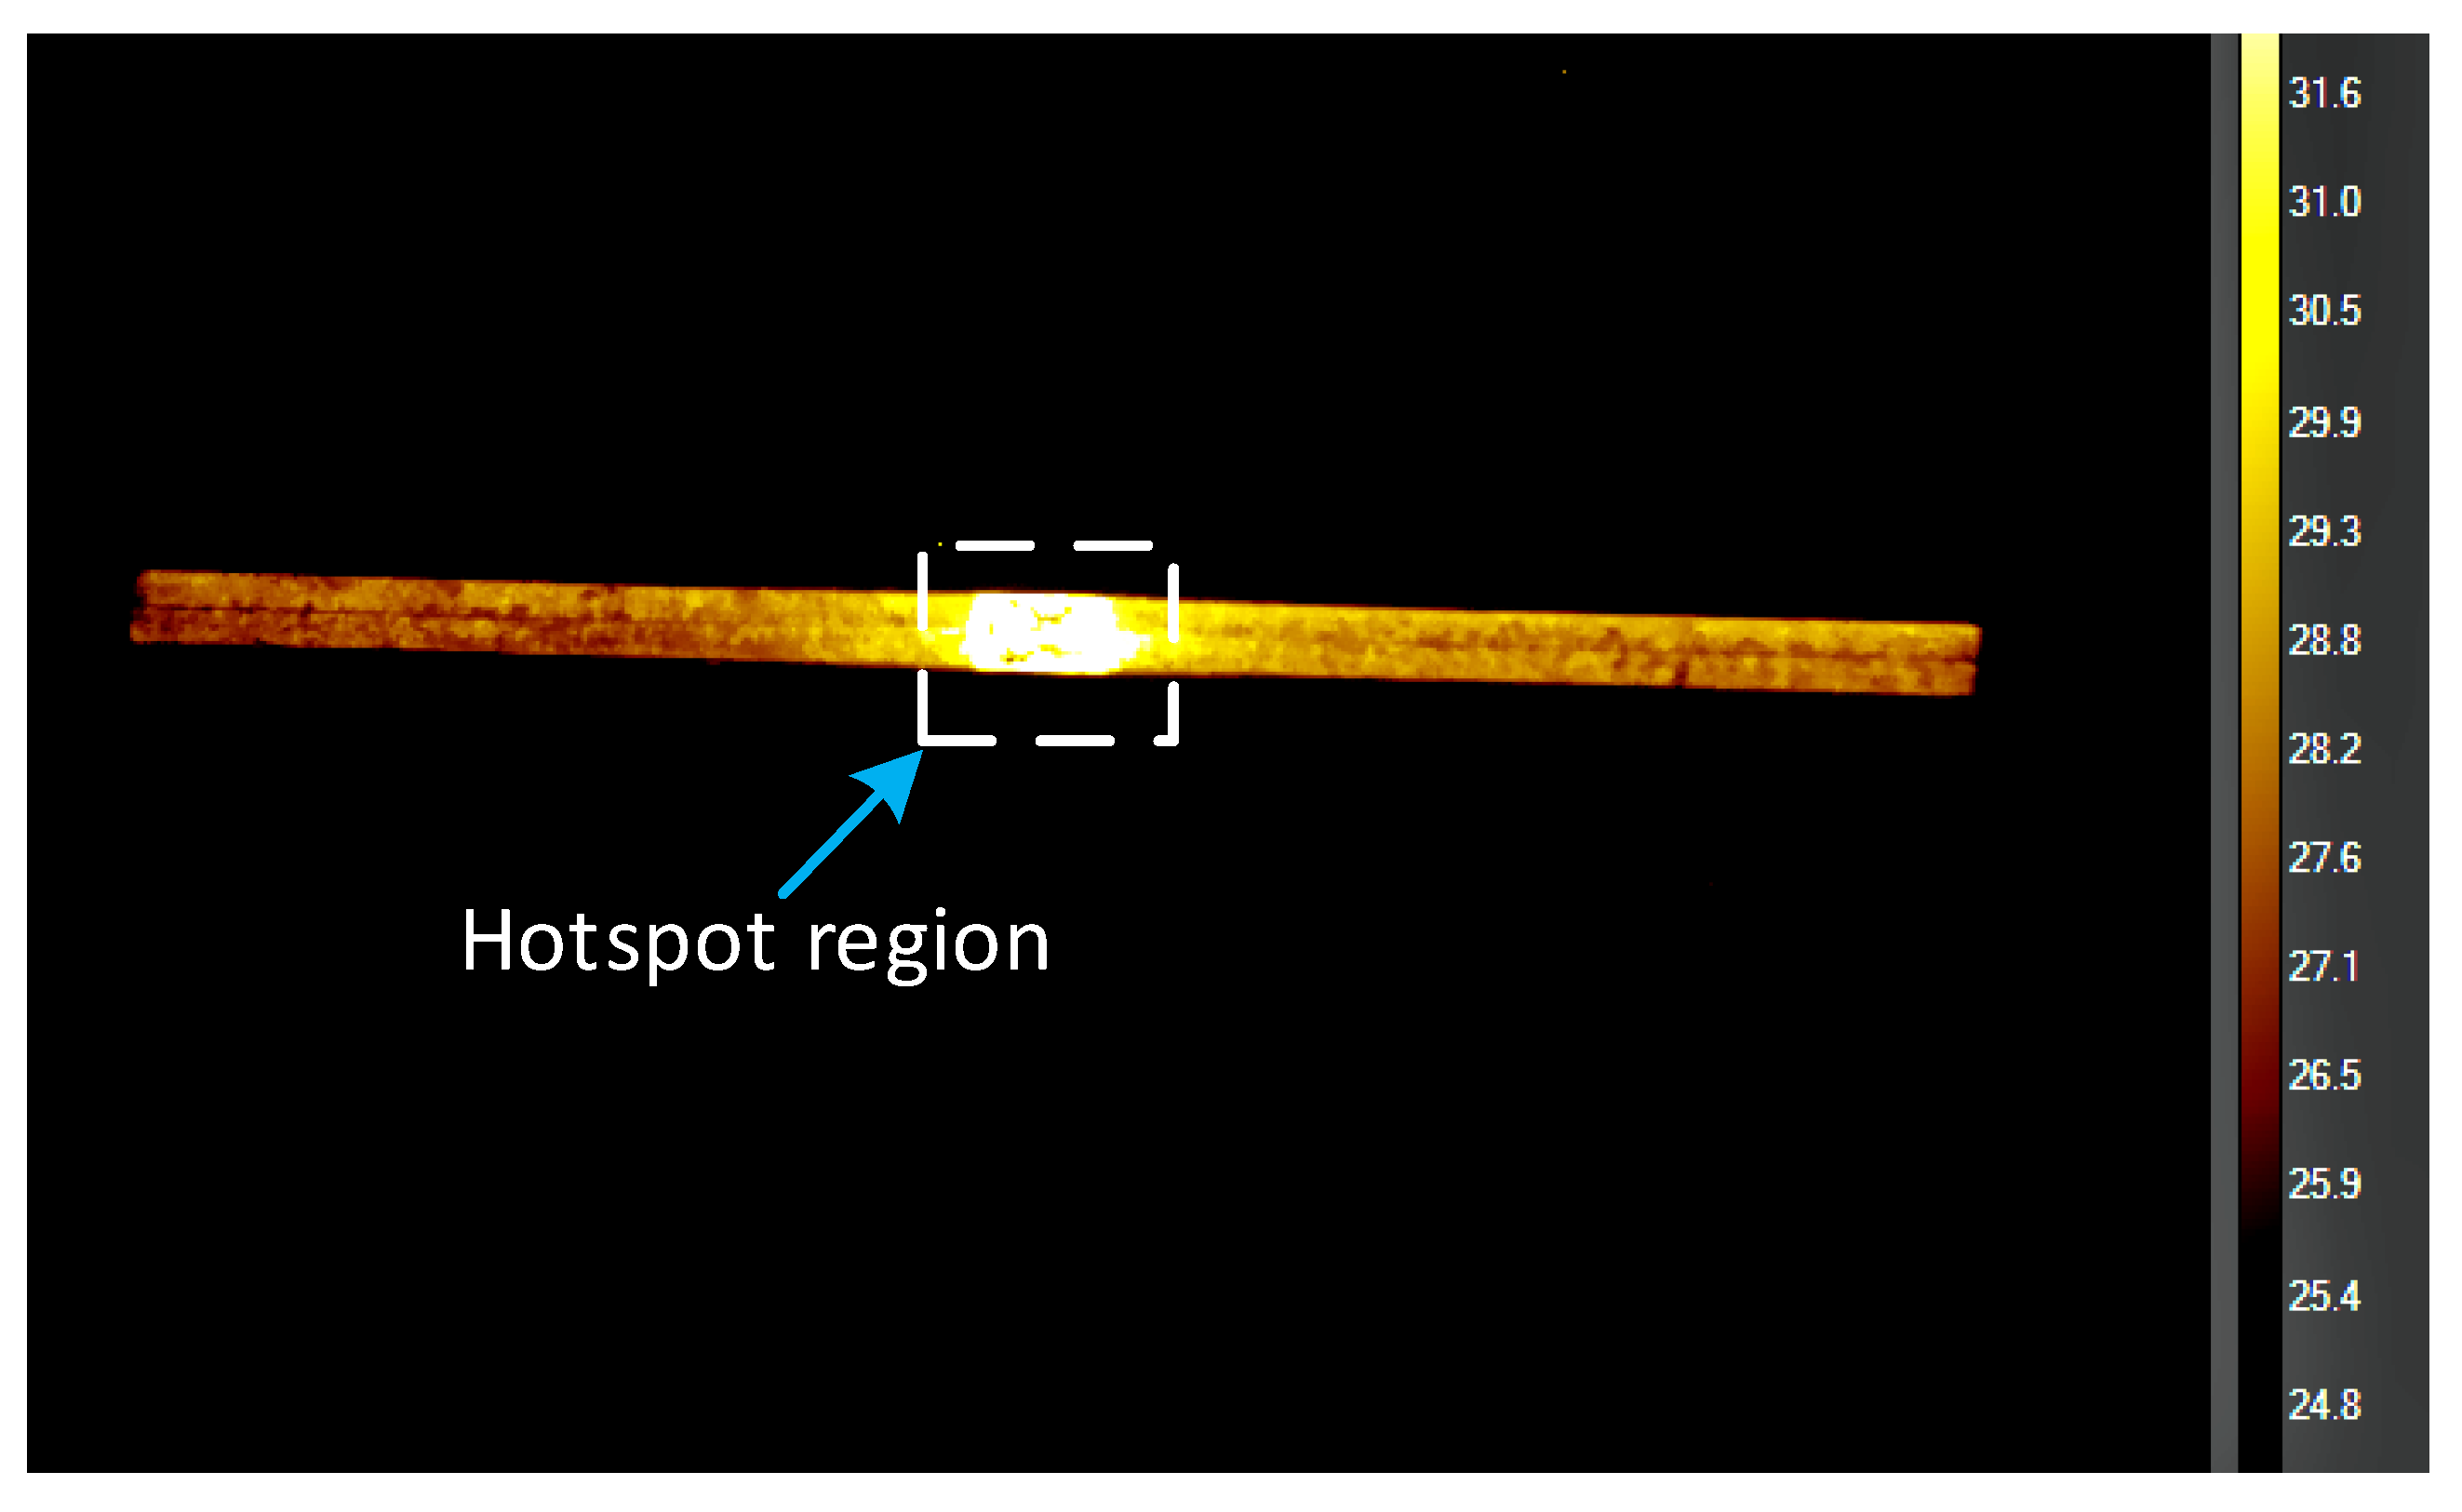
The voltage drop over the sample is measured using a voltmeter and the surface temperature distribution on the fault region is obtained with an infrared camera. The thermal image of the measured sample surface at 8 s after power was switched on is shown in Figure 7. From the image, it was observed that current streaming through the fault region creates high loss density, which results in the formation of a hotspot around the short circuit. Since we are interested in the hotspot region (area enclosed in the white dash box), the rise in temperature of the fault region is obtained and used in the inverse algorithm.
In the parameter search, to reduce the number of iterations, a sensitivity test was carried out and to see the effect of each parameter on the measured voltage and temperature using initial known material properties on the sample. Based on the sensitivity, lower and upper bounds were fixed for each parameter in the final fitting process The best fit parameters for each of the model samples obtained from the approximation are shown in Table 3 below.
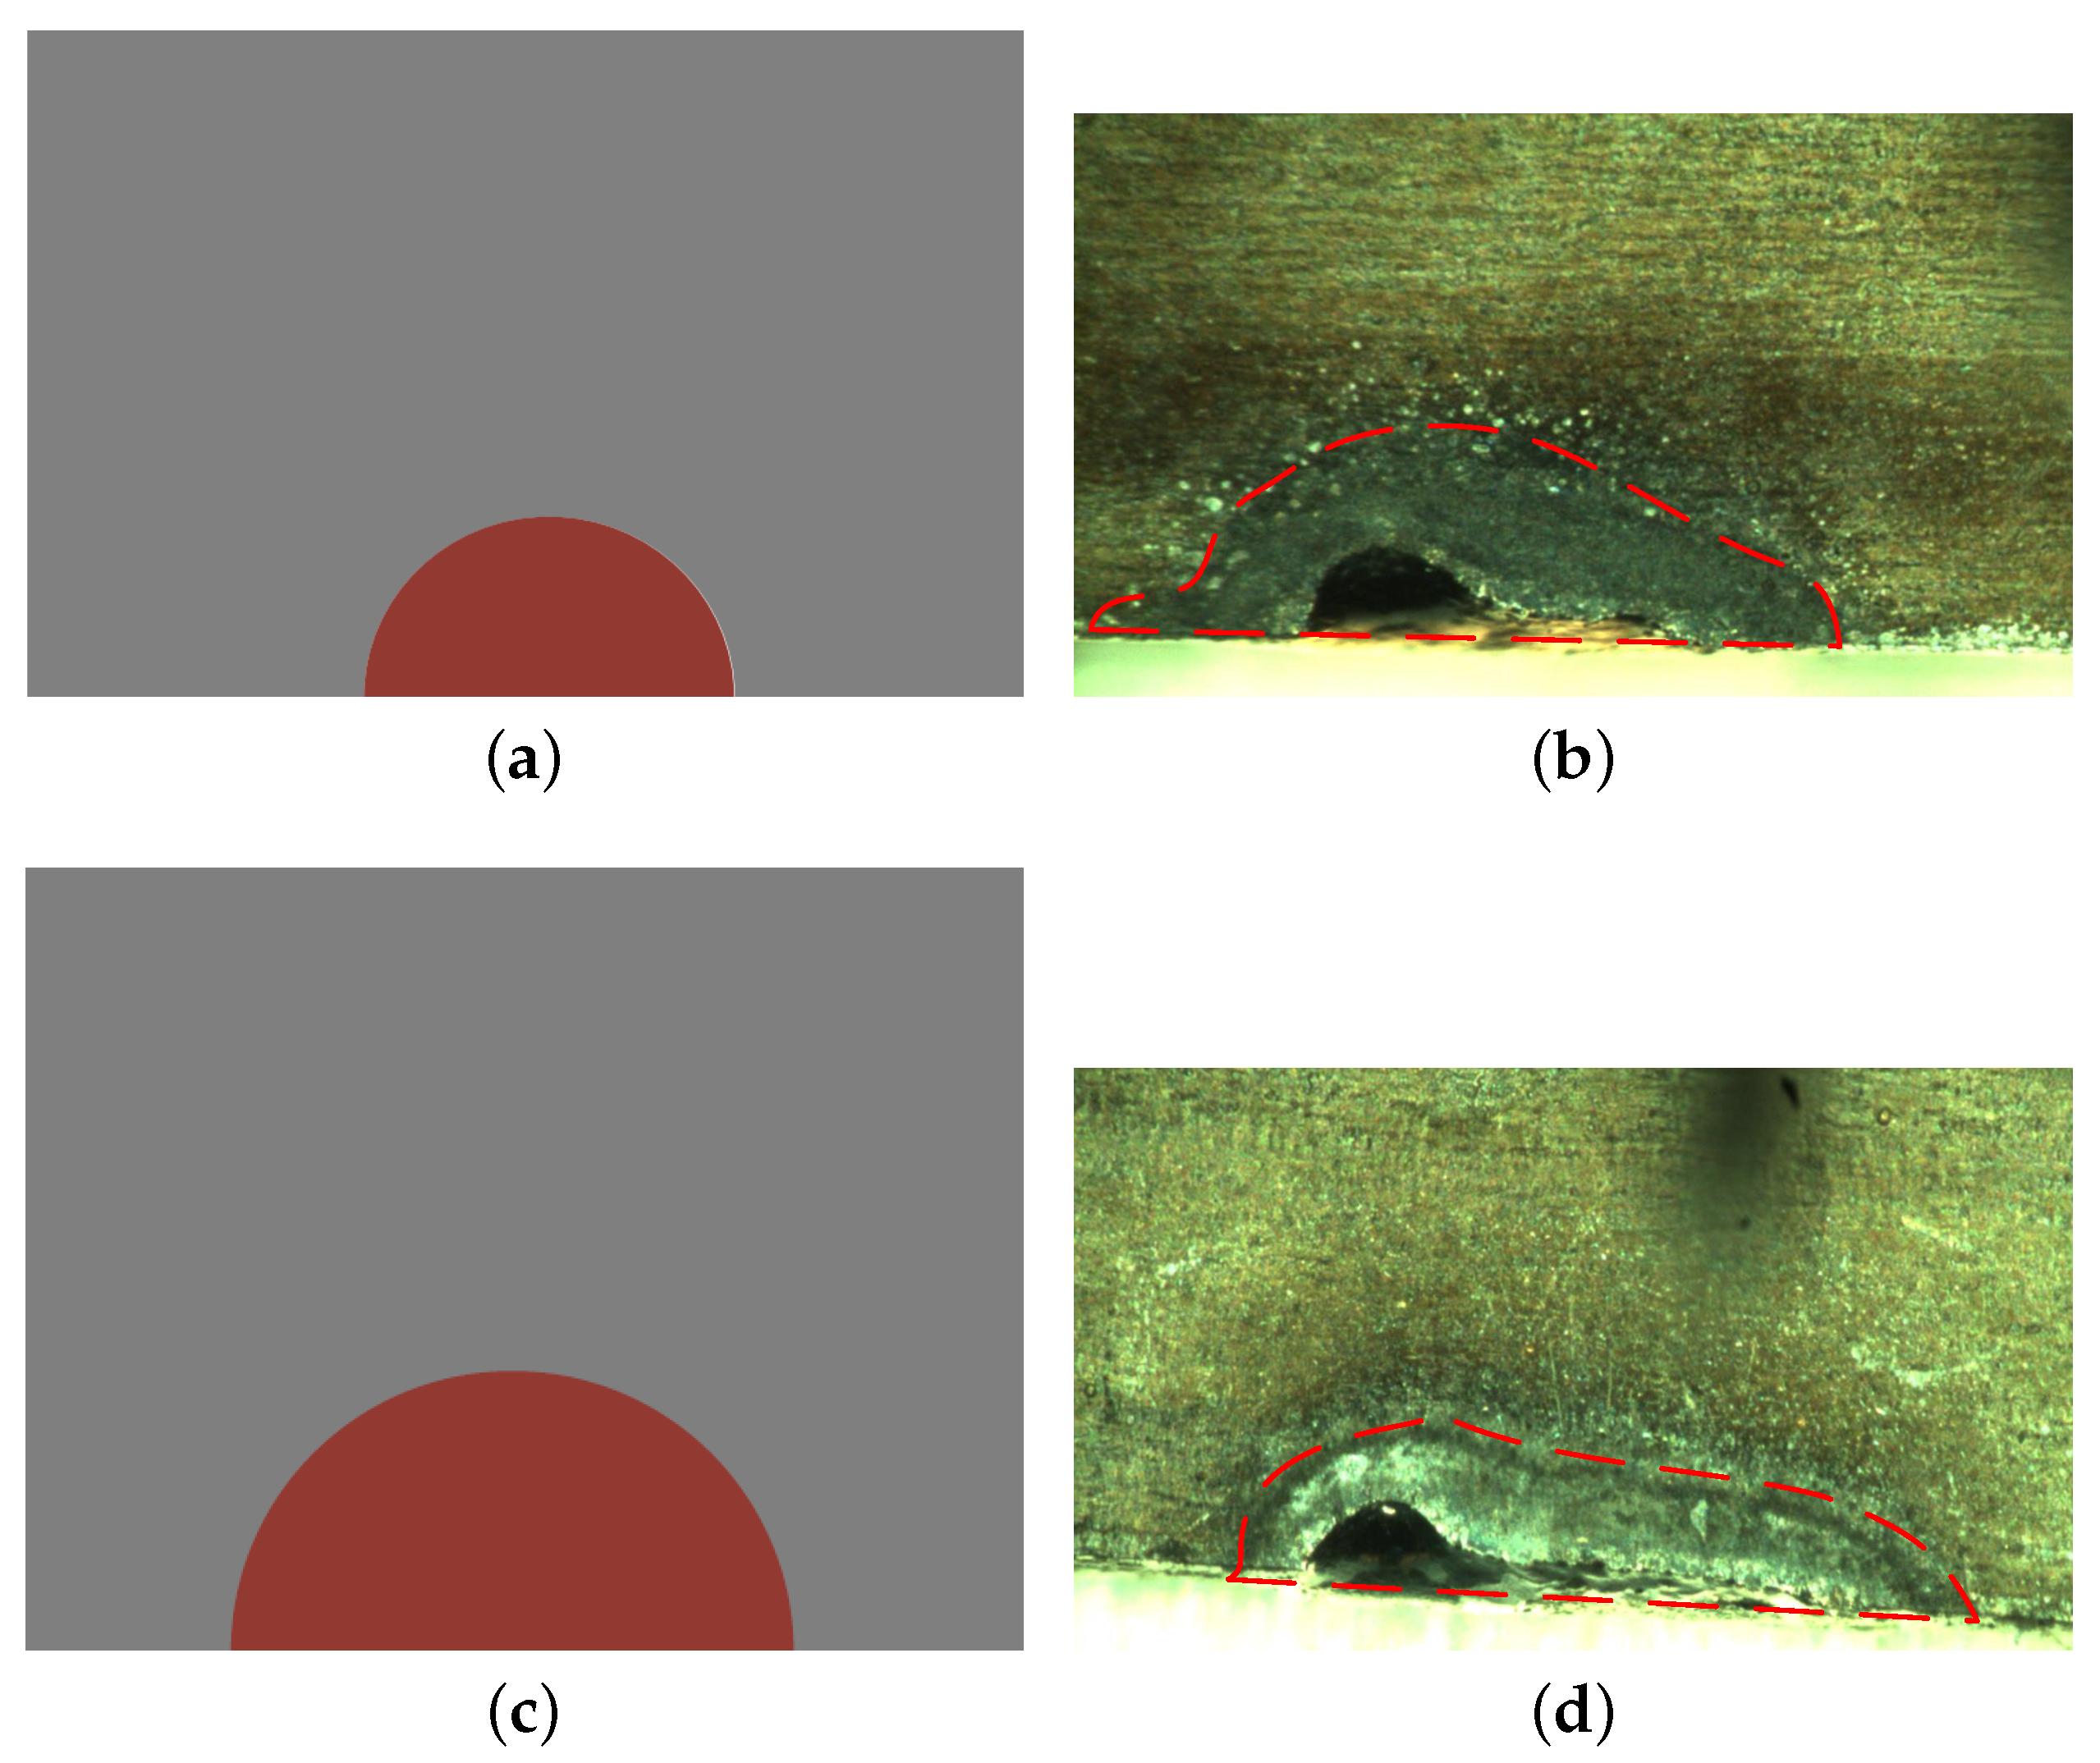
To demonstrate the accuracy of the results obtained from the inverse approximation in Table 3, the size of the predicted fault region was compared to the size of the experimental sample fault area observed with a magnifying camera with a standard measurement scale for each modeled sample. Figure 8 shows the top view image of the experimental sample observed with a magnifying camera and the predicted fault region used in the inverse optimization solution. Comparing the scale measurements of the experimental fault regions represented by the red contour lines as shown in Figure 8a,b with the predicted fault shown in Figure 8c,d, it is observed that the fault width along the surface of the sheet is predicted correctly with a less than seven percent error. However, less accuracy was obtained in predicting the fault depth, but usually for inter-laminar faults, this depth is less than the thickness of the laminated sheet.
Furthermore, two other measurements are performed at 10 and 30 A current supplies to validate the parameters obtained from the least-square non-linear optimization. The voltage drop over the sample, and the surface temperature rise of the fault region were obtained for each supply case and compared with the results from the simulated model. First, the total resistive losses in the measured sample were computed and compared to the total loss from the simulated model for each of the studied samples, as shown in Table 4.
The results obtained show that the predicted total resistive loss closely follows the measured loss, with a maximum deviation of 8.4 percent. The deviation is assumed to be caused by non-uniformity of the actual fault compared to the modeled fault and the fact that the convection coefficient slightly depends on the temperature difference between the sample and the ambient, i.e., it is a slightly non-linear term.
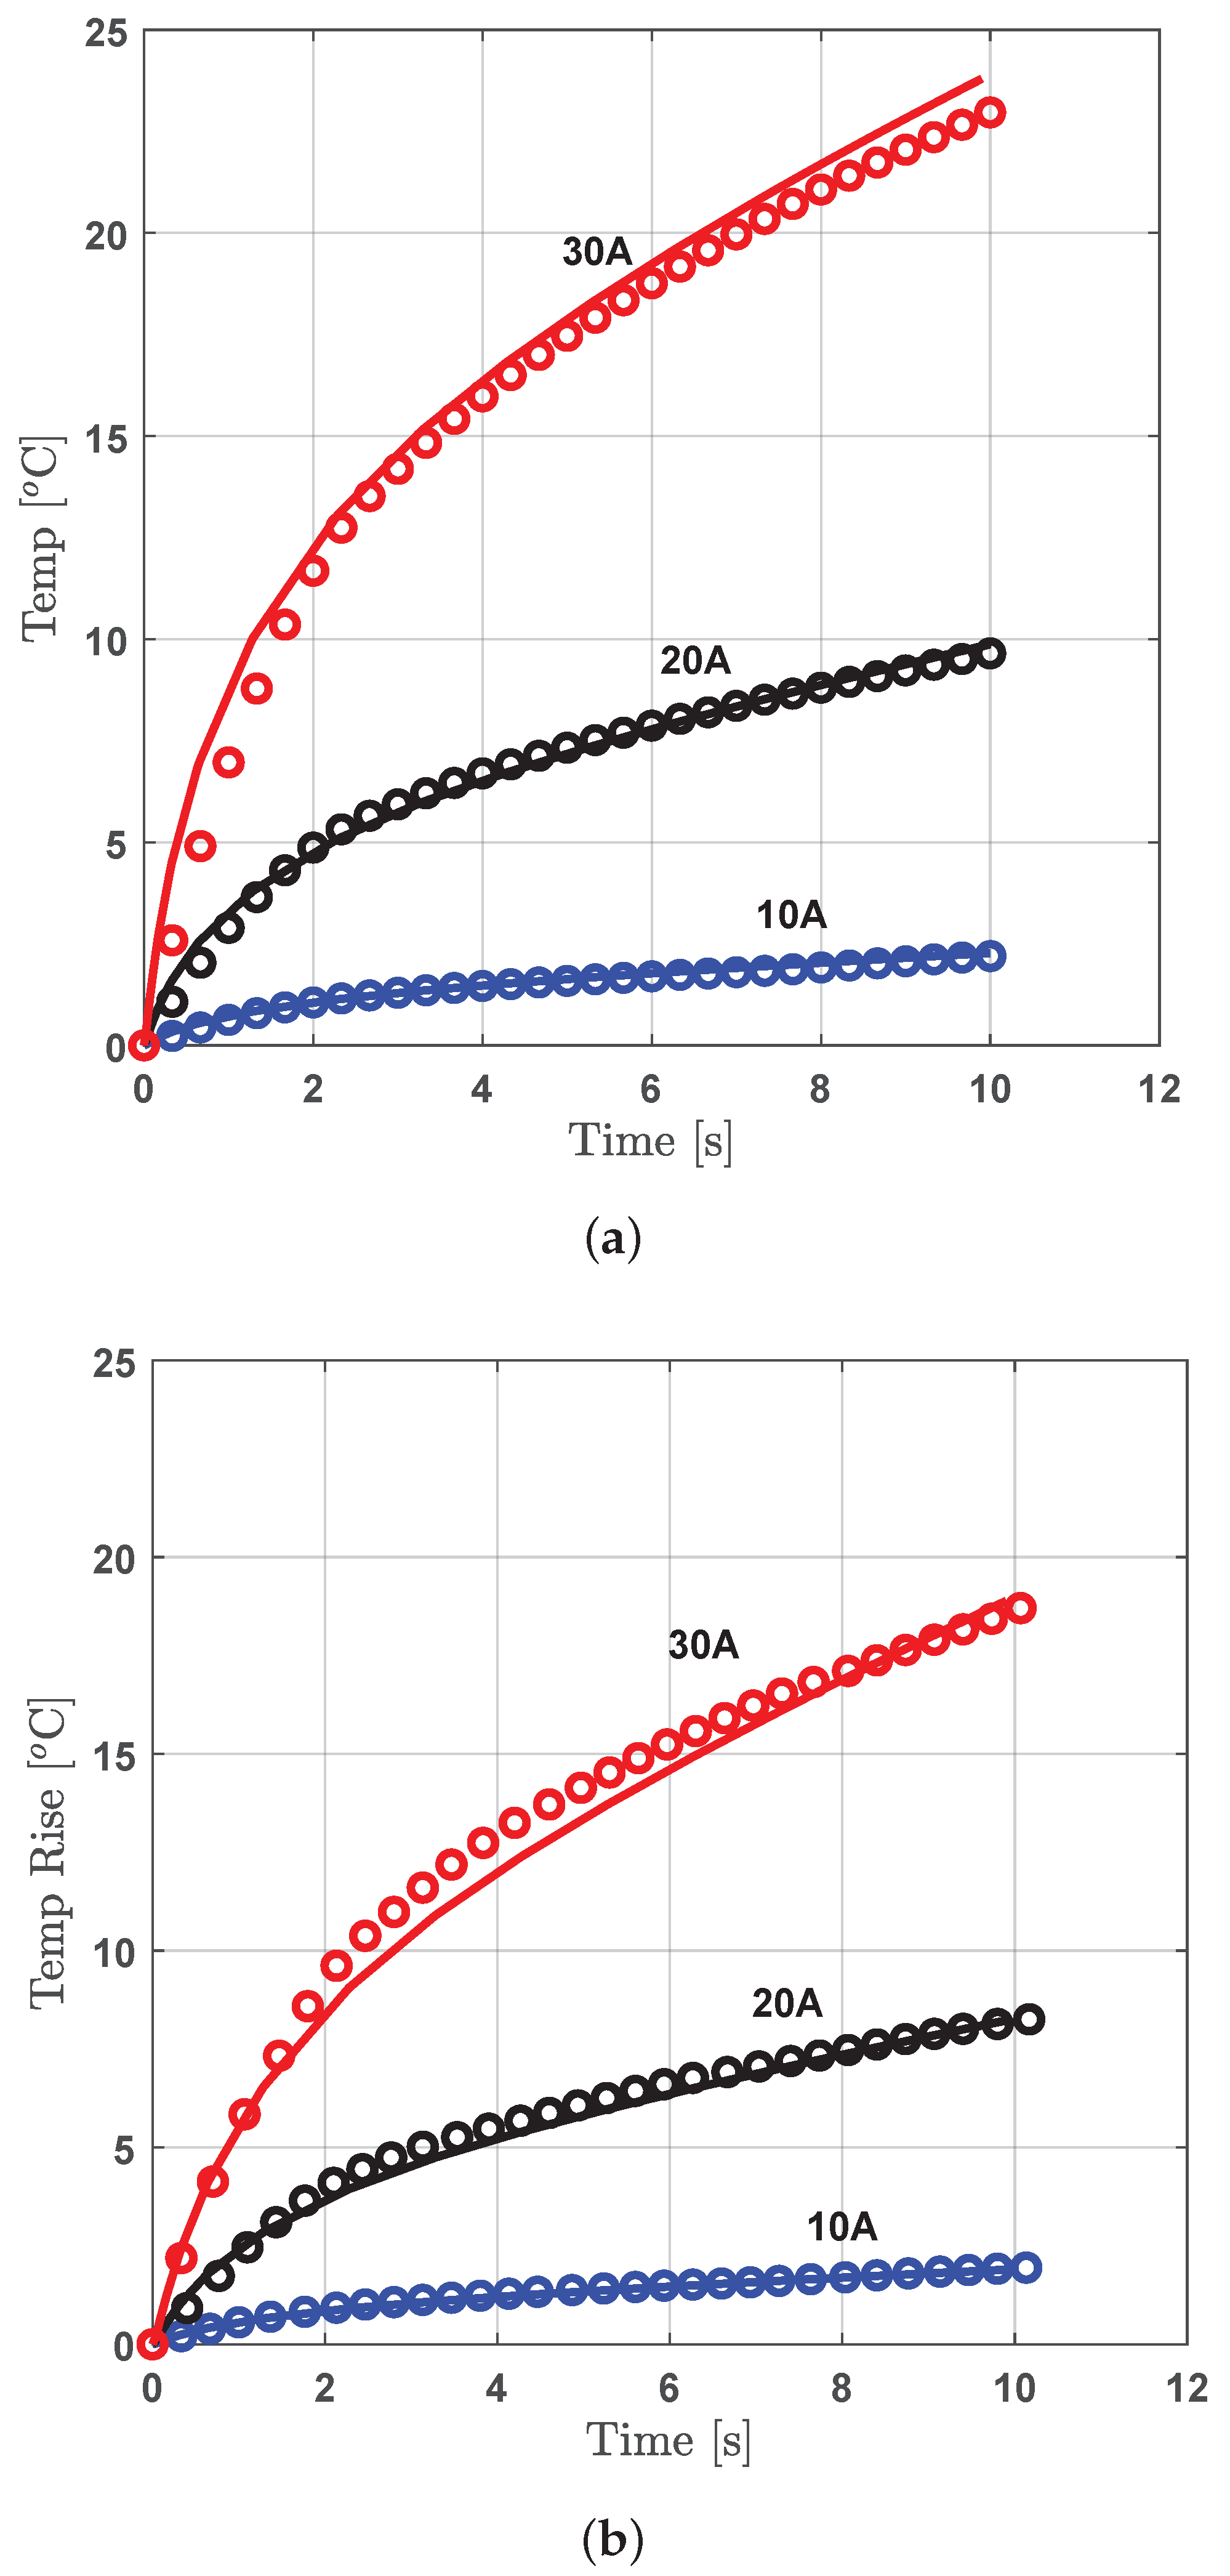
Finally, the measured surface temperature rise from the fault region is compared with the predicted temperature rise for each current supply case in Figure 9. The results show that for each supply case, the predicted temperature rise closely follows the measured temperature rise for the two studied samples.
6. Conclusions
In this paper, a method for estimating the sizes and localized losses due to inter-laminar short faults in laminated steel sheets has been developed based on the surface temperature measurement and numerical modeling. This method has been applied to determine the fault parameters on two stacks of electrical steel sheets with an artificial weld contact to represent inter-laminar short circuit fault. Experimental measurement of surface temperature rise using an infrared camera is conducted on two samples with different fault sizes under a DC power supply condition. An inverse modeling technique is used to obtain the best fitting parameter of the fault region from the coupled numerical model. The parameters obtained from the inverse approximation are validated by comparing the measured temperature rise of the fault region and total loss with the numerical model for different DC current supply conditions. The analysis of the results obtained showed that the material properties of the fault region are closer to prior known material properties of the sample used and the fault size depends on the number of laminations and the length of fault. However, these parameters affect the temperature rise of the fault region. Therefore, the technique developed for obtaining the fault parameters can be generalized for studying inter-laminar short faults in electrical machines. Also, the visual image of the hotspot region can be used for fast detection of inter-laminar short circuit faults in the core of electrical machines.
Author Contributions
Conceptualization, O.O.; funding acquisition, A.A.; investigation, O.O.; methodology, O.O. and A.H.; supervision, A.B.; writing—original draft, O.O.; writing—review and editing, A.H., F.M. and A.B. All authors have read and agreed to the published version of the manuscript.
Funding
The research leading to these results has received funding from the European Research Council under the European Unions Seventh Framework Programme (FP7/2007-2013) ERC grant agreement no 339380.
Conflicts of Interest
The authors declare no conflict of interest.
References
- Harstick, H.M.S.; Ritter, M.; Riehemann, W. Influence of Punching and Tool Wear on the Magnetic Properties of Nonoriented Electrical Steel. IEEE Trans. Magn. 2014, 50, 1–4. [Google Scholar] [CrossRef]
- Siebert, R.; Schneider, J.; Beyer, E. Laser Cutting and Mechanical Cutting of Electrical Steels and its Effect on the Magnetic Properties. IEEE Trans. Magn. 2014, 50, 1–4. [Google Scholar] [CrossRef]
- Kuo, S.; Lee, W.; Lin, S.; Lu, C. The Influence of Cutting Edge Deformations on Magnetic Performance Degradation of Electrical Steel. IEEE Trans. Ind. Appl. 2015, 51, 4357–4363. [Google Scholar] [CrossRef]
- Schoppa, A.; chneider, J.; Wuppermann, C.D. Influence of the manufacturing process on the magnetic properties of non-oriented electrical steels. J. Magn. Magn. Mater. 2000, 215–216, 74–78. [Google Scholar] [CrossRef]
- Dems, M.; Komeza, K.; Kubiak, W.; Szulakowski, J. Impact of Core Sheet Cutting Method on Parameters of Induction Motors. Energies 2020, 13, 1960. [Google Scholar] [CrossRef]
- Wang, H.; Zhang, Y. Modeling of Eddy-Current Losses of Welded Laminated Electrical Steels. IEEE Trans. Ind. Electron. 2017, 64, 2992–3000. [Google Scholar] [CrossRef]
- Eldieb, A.; Anayi, F. Evaluation of Loss Generated by Edge Burrs in Electrical Steels. IEEE Trans. Magn. 2016, 52, 1–4. [Google Scholar] [CrossRef] [Green Version]
- Hamzehbahmani, H.; Anderson, P.; Jenkins, K.; Lindenmo, M. Experimental study on inter-laminar short-circuit faults at random positions in laminated magnetic cores. IET Electric Power Appl. 2016, 10, 604–613. [Google Scholar] [CrossRef] [Green Version]
- Shimoji, H.; Borkowski, B.E.; Todaka, T.; Enokizono, M. Measurement of Core-Loss Distribution Using Thermography. IEEE Trans. Magn. 2011, 47, 4372–4375. [Google Scholar] [CrossRef]
- Gilbert, A.J. A method of measuring loss distribution in electrical machines. Proc. IEE Part A Power Eng. 1961, 108, 239–244. [Google Scholar] [CrossRef]
- Hamzehbahmani, H.; Moses, A.J.; Anayi, F.J. Opportunities and Precautions in Measurement of Power Loss in Electrical Steel Laminations Using the Initial Rate of Rise of Temperature Method. IEEE Trans. Magn. 2013, 49, 1264–1273. [Google Scholar] [CrossRef]
- Bousbaine, A. A thermometric approach to the determination of iron losses in single phase induction motors. IEEE Trans. Energy Convers. 1999, 14, 277–283. [Google Scholar] [CrossRef]
Figure 1.
Experimental sample with the magnified image of the fault region.

Figure 2.
Thermal-electric measurement setup for investigation of inter-laminar short circuit fault.
Figure 2.
Thermal-electric measurement setup for investigation of inter-laminar short circuit fault.

Figure 3.
Geometry description: Lamination (1), insulation (2), fault region (3), thermal boundary condition (B1–B6), and DC supply.
Figure 3.
Geometry description: Lamination (1), insulation (2), fault region (3), thermal boundary condition (B1–B6), and DC supply.

Figure 4.
Current flowing inside the lamination and through the short circuit region.

Figure 5.
Simulated temperature distribution of the sample at 10 s.

Figure 6.
Inverse model algorithm flowchart.

Figure 7.
Surface temperature distribution from infrared camera at 8 s.

Figure 8.
Comparing predicted fault with experimental sample. (a) Model sample with 2.2 mm fault width. (b) Measured sample with 2.06 mm fault width. (c) Model sample with 3.0 mm fault width. (d) Measured sample with 2.82 mm fault width.
Figure 8.
Comparing predicted fault with experimental sample. (a) Model sample with 2.2 mm fault width. (b) Measured sample with 2.06 mm fault width. (c) Model sample with 3.0 mm fault width. (d) Measured sample with 2.82 mm fault width.

Figure 9.
Measured (o) and predicted (-) temperature rise comparison for different current supplies. (a) Sample 1 with fault width of 2.2 mm. (b) Sample 2 with fault width of 3.0 mm.
Figure 9.
Measured (o) and predicted (-) temperature rise comparison for different current supplies. (a) Sample 1 with fault width of 2.2 mm. (b) Sample 2 with fault width of 3.0 mm.


Table 1.
FLIR T640 thermal camera specifications.
| Frame rate | 30 Hz |
| Temperature range | 233.15–2273 K |
| Accuracy | ±2% of reading |
| Field of view | 32 × 24 mm |
| Detector type | uncooled microbolometer (640 × 480 pixels) |
Table 2.
Infrared camera calibration.
| Emissivity | 0.96 |
| Measurement distance | 0.09 m |
| Atmospheric temperature | 20 C |
| Relative humidity | 50 |
Table 3.
Estimated parameters of the fault region obtained from the Lsqnonlin approximation.
| Parameters | Sample 1 | Sample 2 |
|---|---|---|
| Fault Width [mm] | 2.2 | 3.0 |
| Thermal conductivity, k [W/mK] | 27.7 | 27.7 |
| Convective heat coefficient, [W/mK] | 15 | 15 |
| Electric conductivity, [S/m] | 2.994 × | 2.994 × |
Table 4.
Total restive loss comparison for the studied samples. (a) Sample 1 with fault width of 2.2 mm (numbers in bold represent the test measurement used to obtain the fault parameters). (b) Sample 2 with fault width of 3.0 mm.
Table 4.
Total restive loss comparison for the studied samples. (a) Sample 1 with fault width of 2.2 mm (numbers in bold represent the test measurement used to obtain the fault parameters). (b) Sample 2 with fault width of 3.0 mm.
| (a) | |||
| Current | Measured Loss | Predicted Loss | Difference |
| [A] | [W] | [W] | [%] |
| 10 | 0.39 | 0.41 | 5.12 |
| 20 | 1.6 | 1.7 | 6.2 |
| 30 | 3.57 | 3.87 | 8.4 |
| (b) | |||
| Current | Measured Loss | Predicted Loss | Difference |
| [A] | [W] | [W] | [%] |
| 10 | 0.37 | 0.39 | 5.4 |
| 20 | 1.51 | 1.56 | 3.3 |
| 30 | 3.42 | 3.72 | 8.77 |
© 2020 by the authors. Licensee MDPI, Basel, Switzerland. This article is an open access article distributed under the terms and conditions of the Creative Commons Attribution (CC BY) license (http://creativecommons.org/licenses/by/4.0/).
Share and Cite
MDPI and ACS Style
Osemwinyen, O.; Hemeida, A.; Martin, F.; Belahcen, A.; Arkkio, A. Parameter Estimation of Inter-Laminar Fault-Region in Laminated Sheets Through Inverse Approach. Energies 2020, 13, 3251. https://doi.org/10.3390/en13123251
AMA Style
Osemwinyen O, Hemeida A, Martin F, Belahcen A, Arkkio A. Parameter Estimation of Inter-Laminar Fault-Region in Laminated Sheets Through Inverse Approach. Energies. 2020; 13(12):3251. https://doi.org/10.3390/en13123251
Chicago/Turabian StyleOsemwinyen, Osaruyi, Ahmed Hemeida, Floran Martin, Anouar Belahcen, and Antero Arkkio. 2020. "Parameter Estimation of Inter-Laminar Fault-Region in Laminated Sheets Through Inverse Approach" Energies 13, no. 12: 3251. https://doi.org/10.3390/en13123251
Note that from the first issue of 2016, this journal uses article numbers instead of page numbers. See further details here.