Effect of the Particle Size on the Near-Wall Turbulence Characteristics of the Polymer Fluid Flow and the Critical Velocity Required for Particle Removal from the Sand Bed Deposited in Horizontal Wells

Abstract
:
1. Introduction
2. Materials and Methods
2.1. Sand Particles
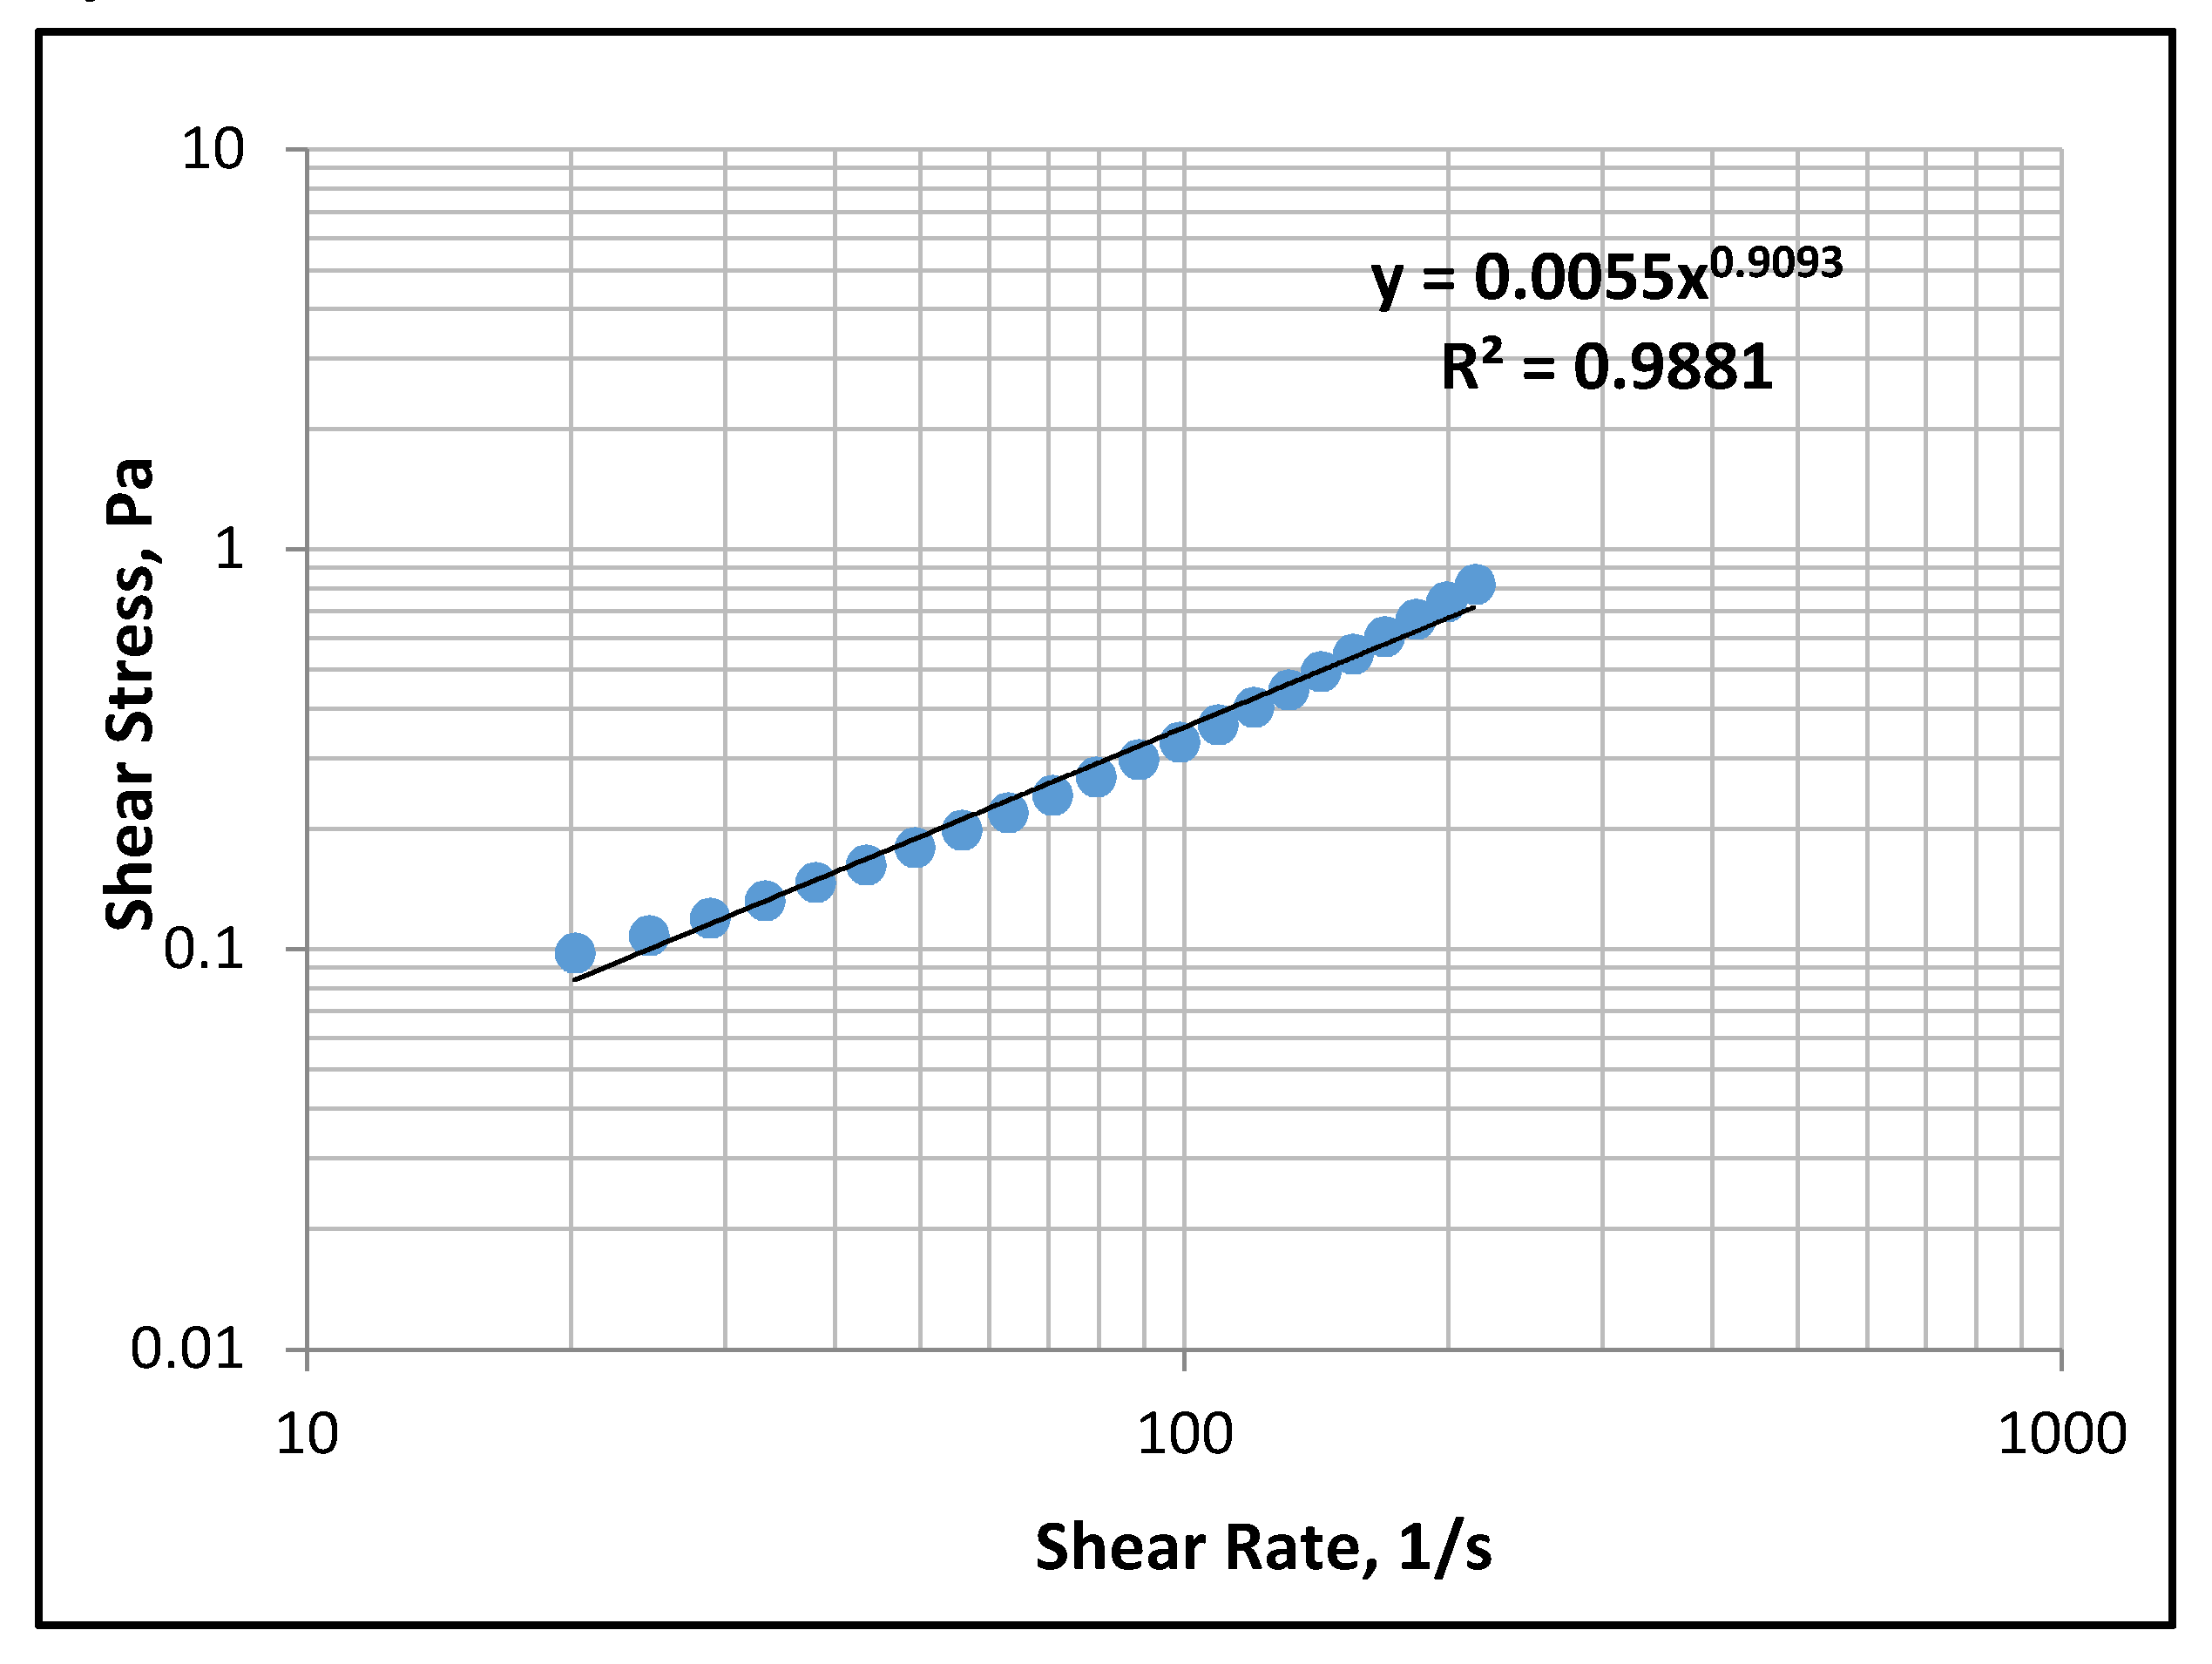
2.2. Fluids
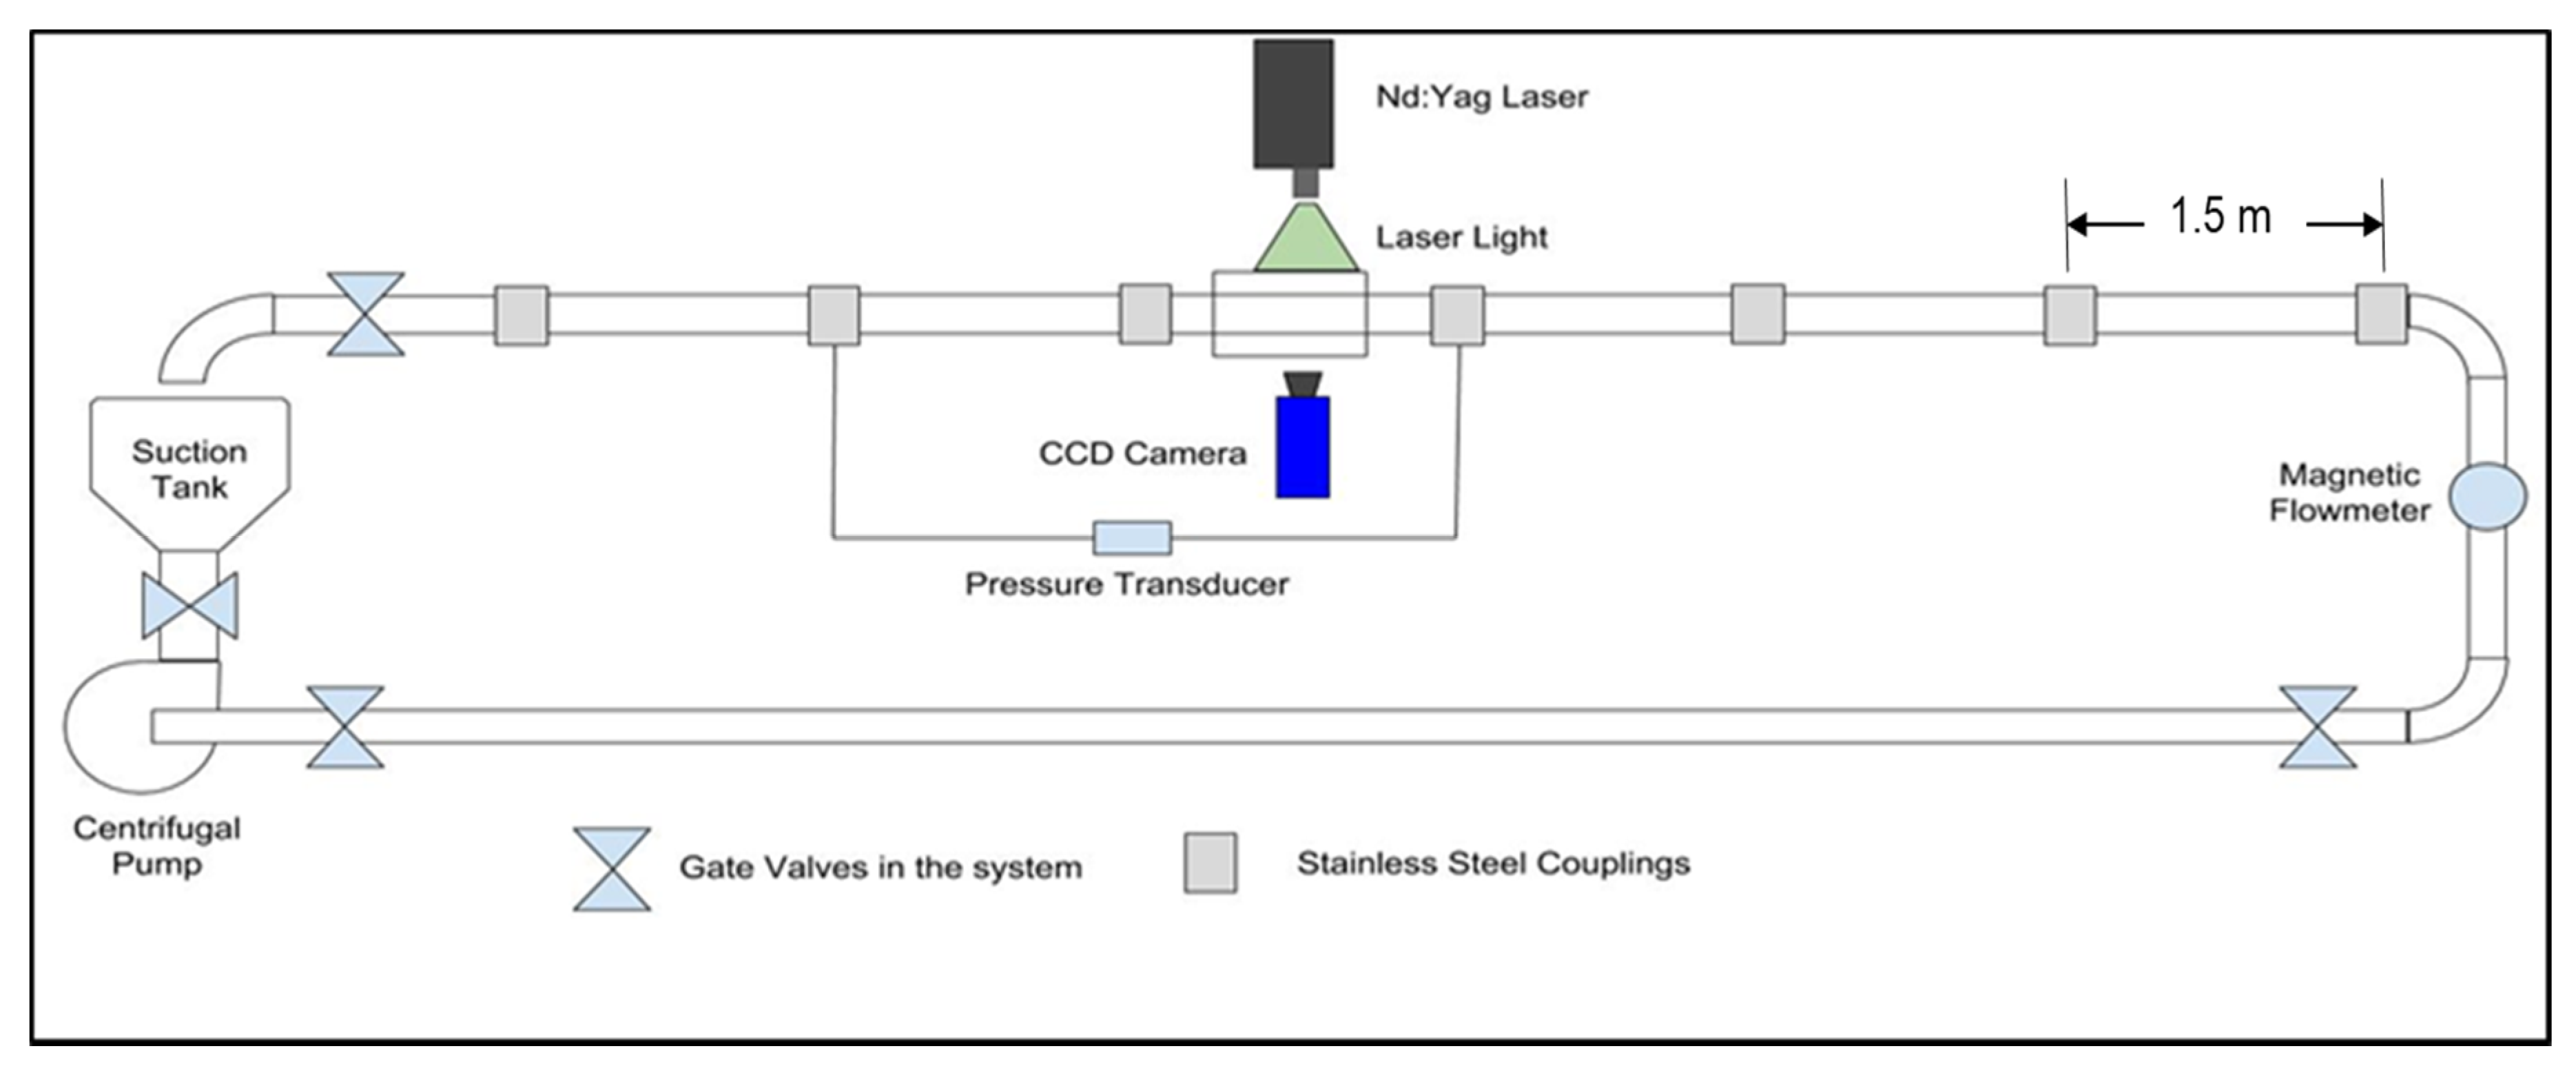
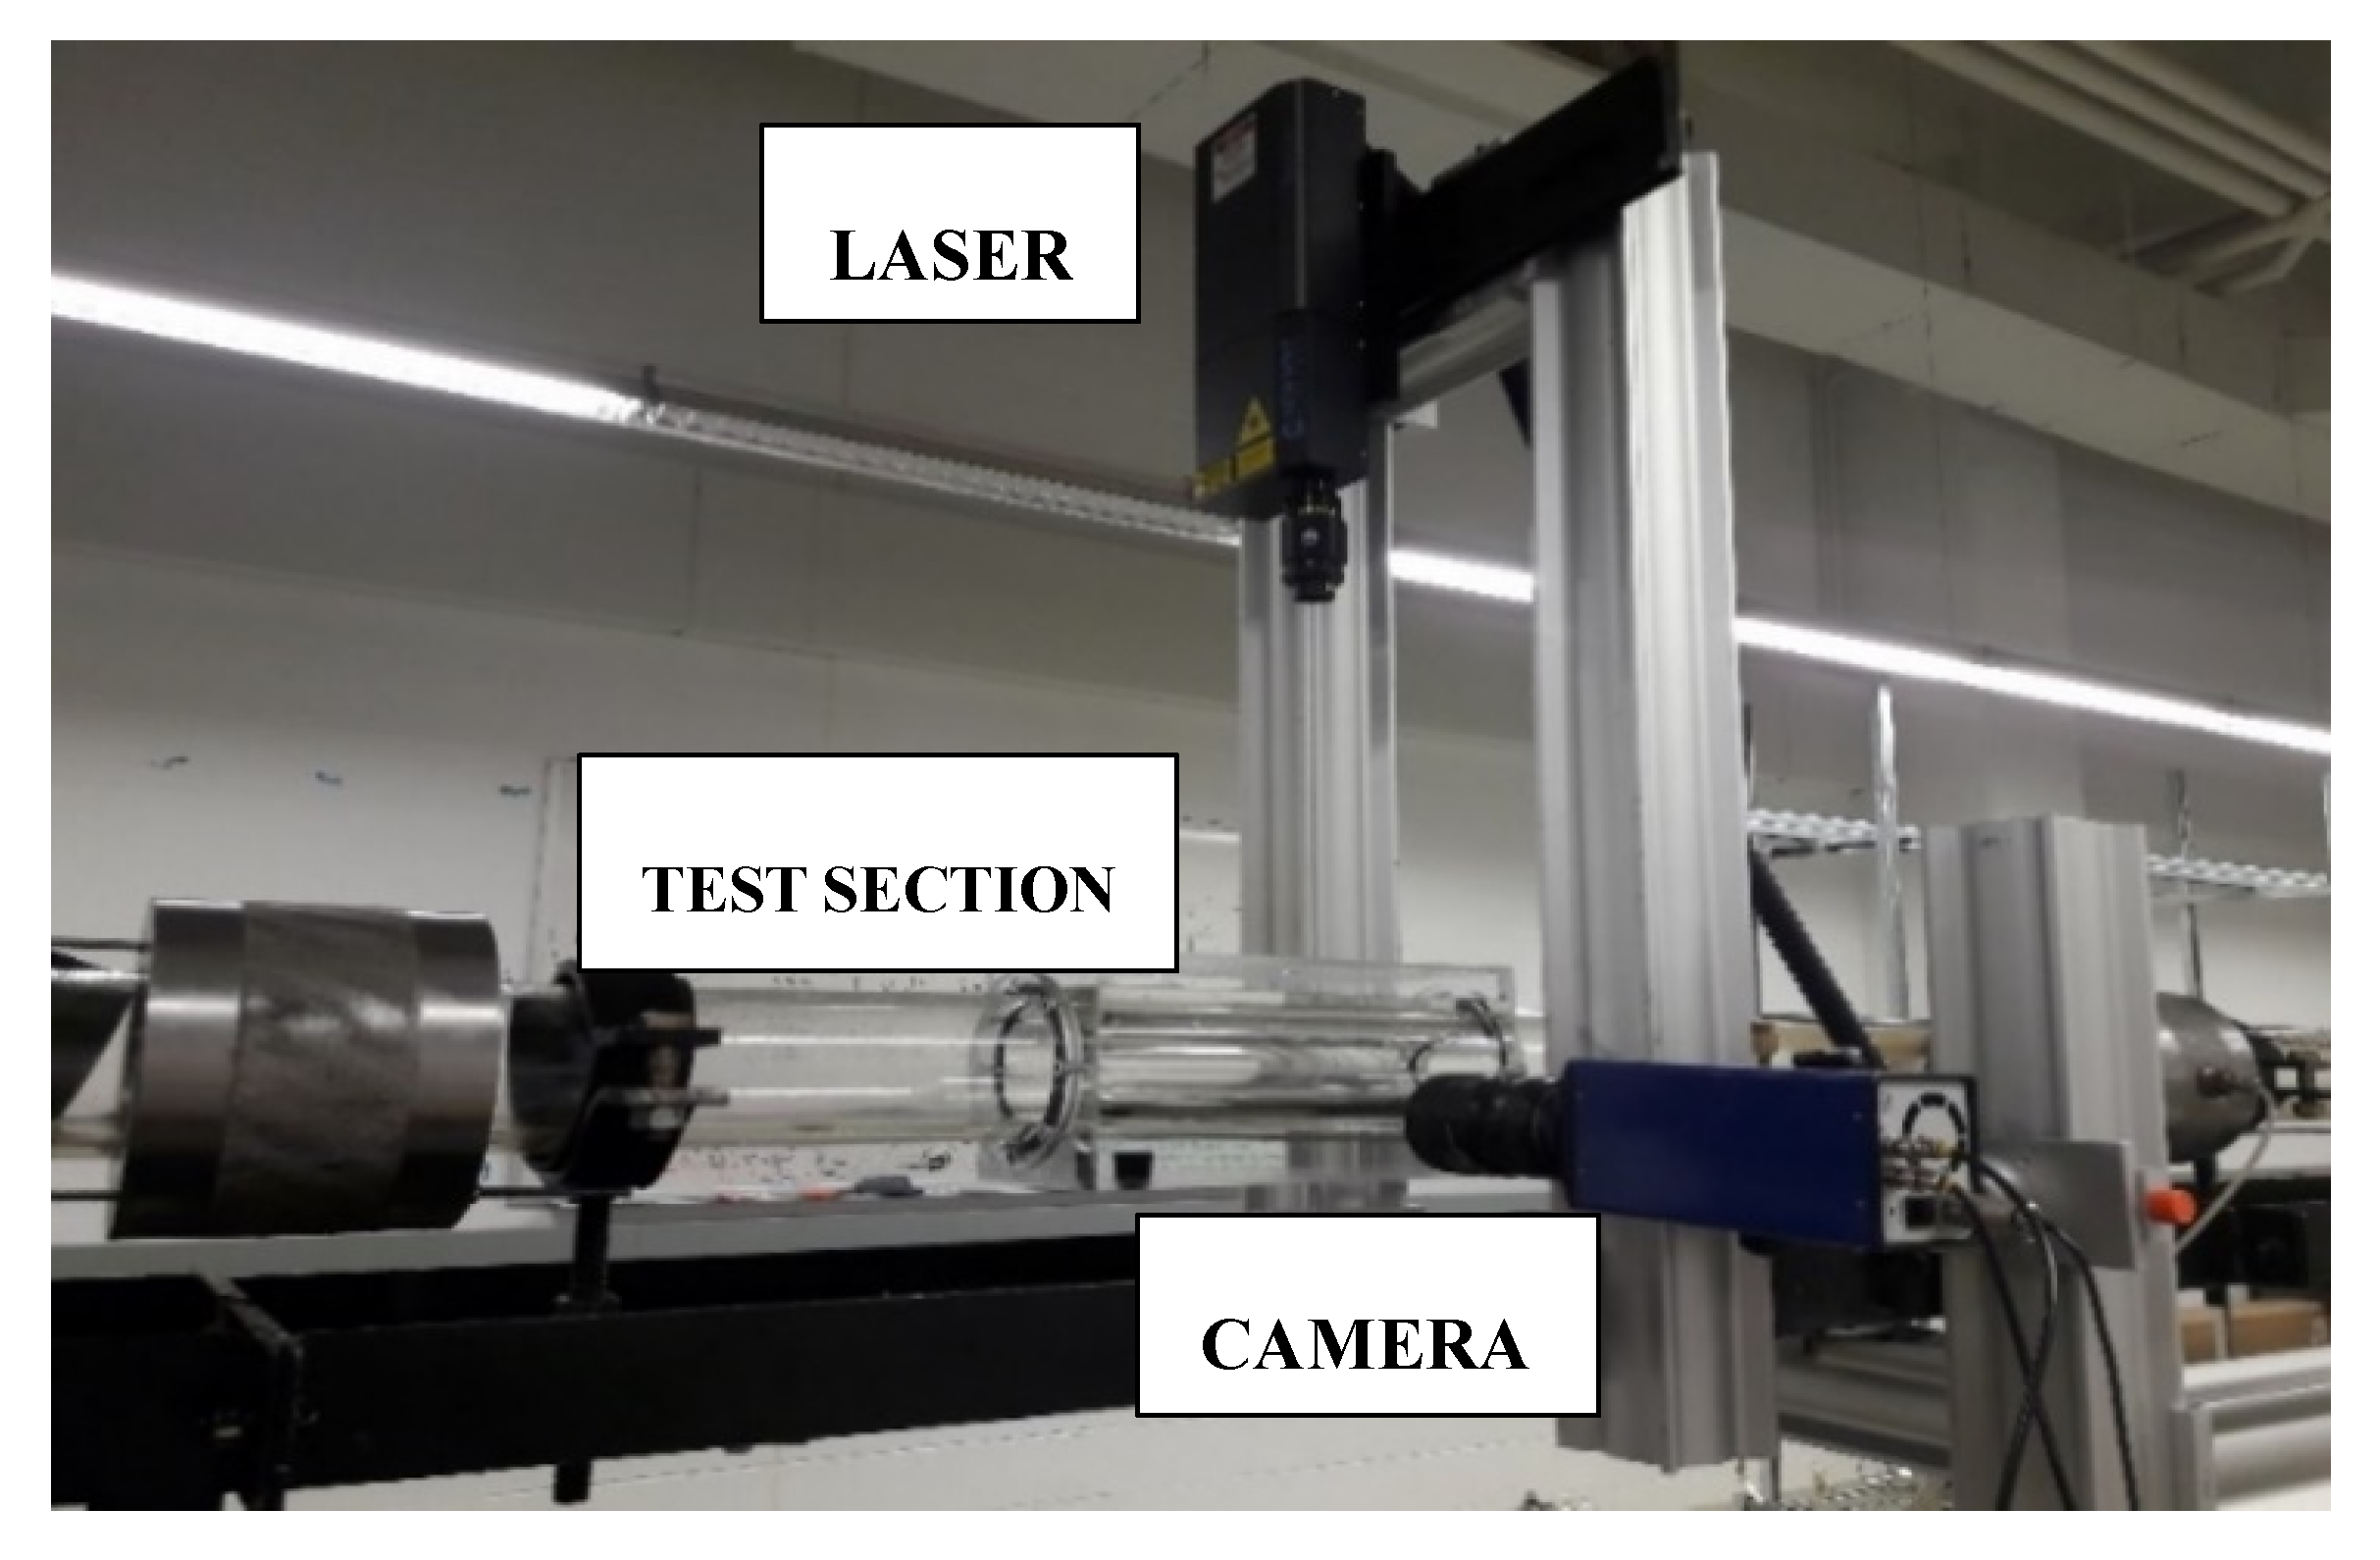
2.3. Experimental Setup
2.4. Experimental Procedure
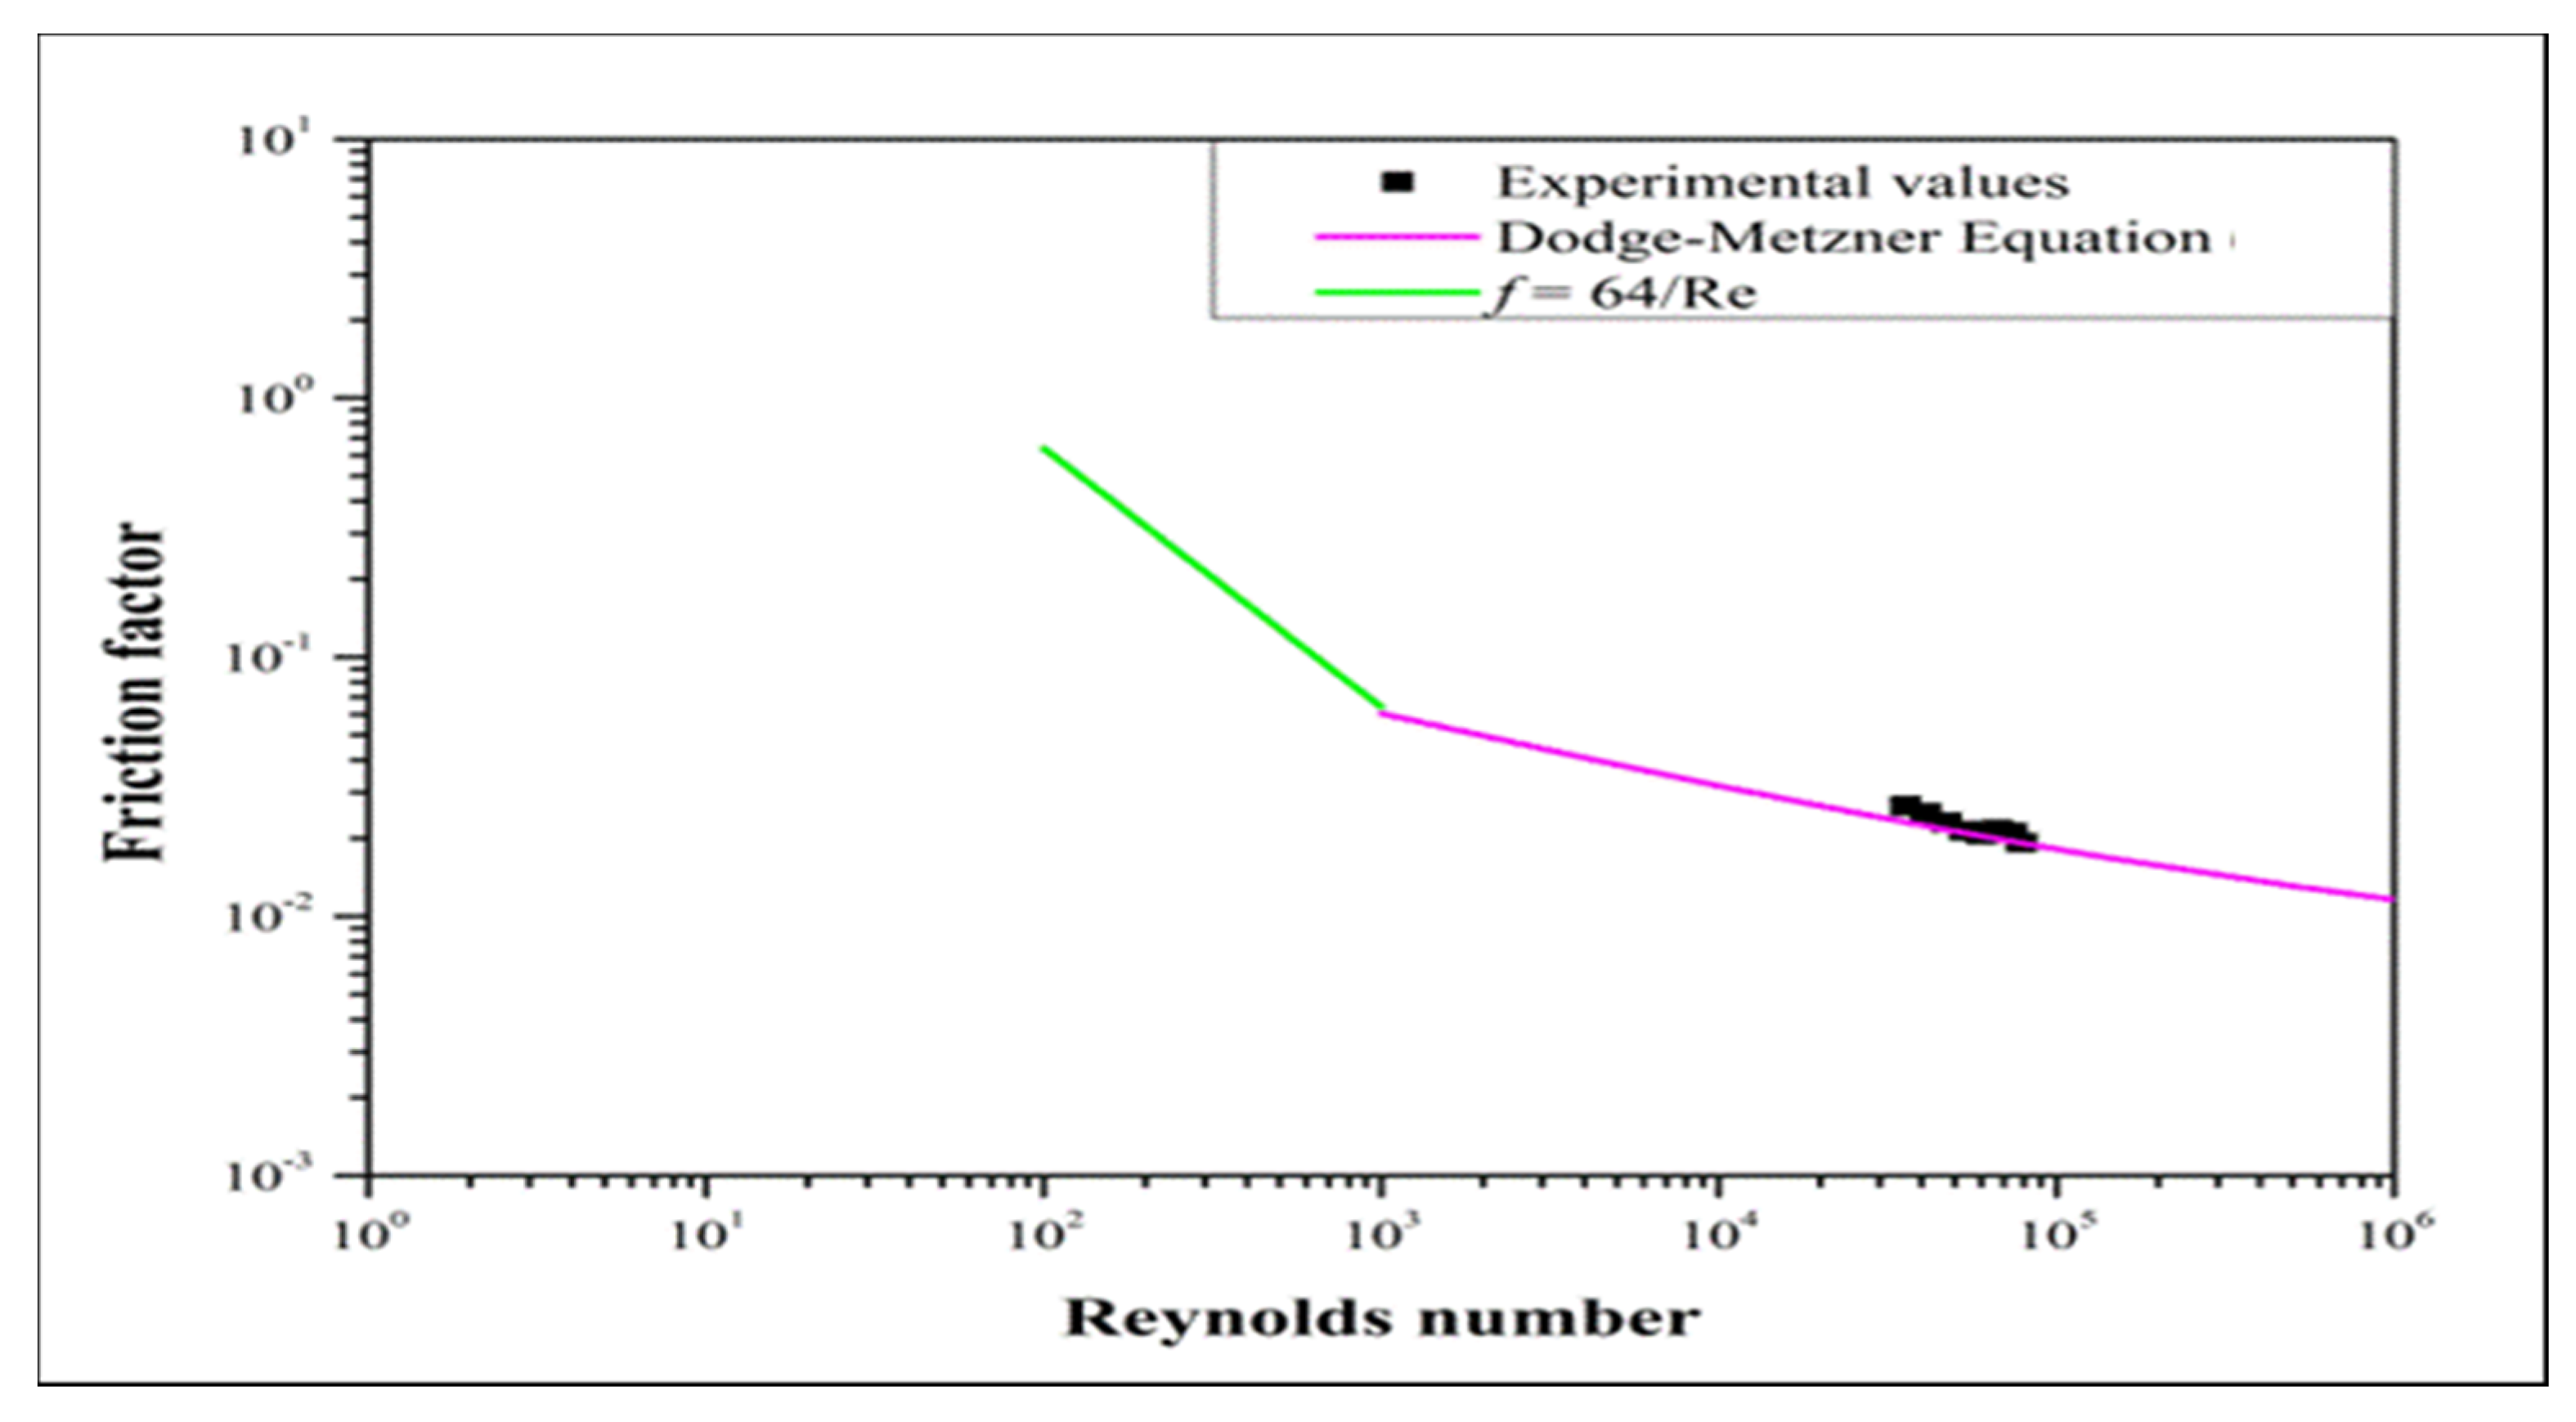
2.4.1. Verification of the Accuracy of the Frictional Pressure Loss Measurements
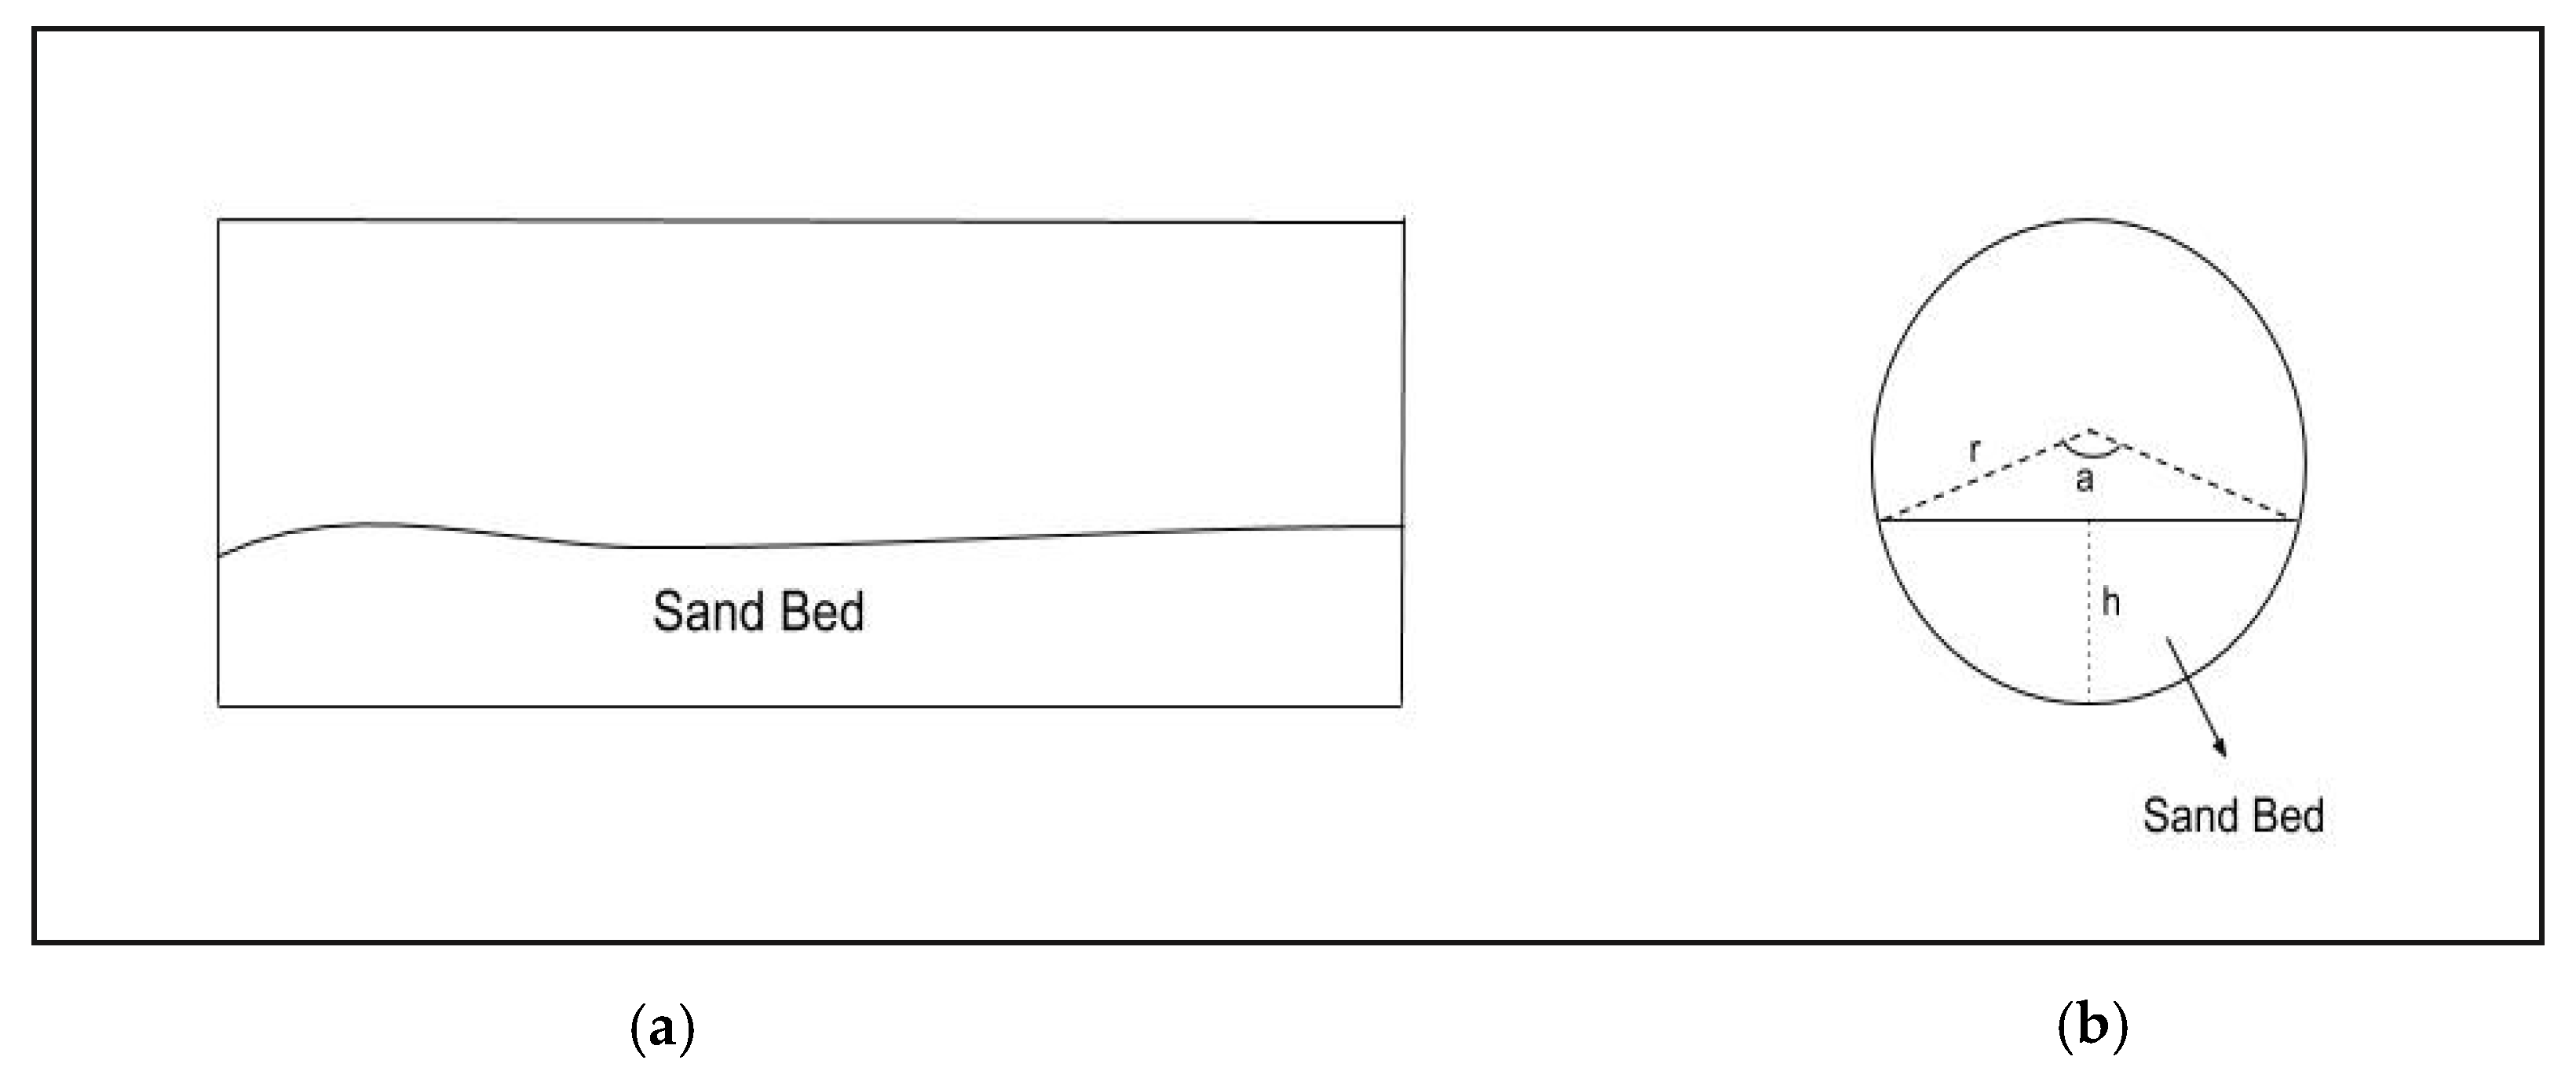
2.4.2. Sand Bed Establishment
2.4.3. Polymer Fluid Circulation and Measurement of Critical Flowrate
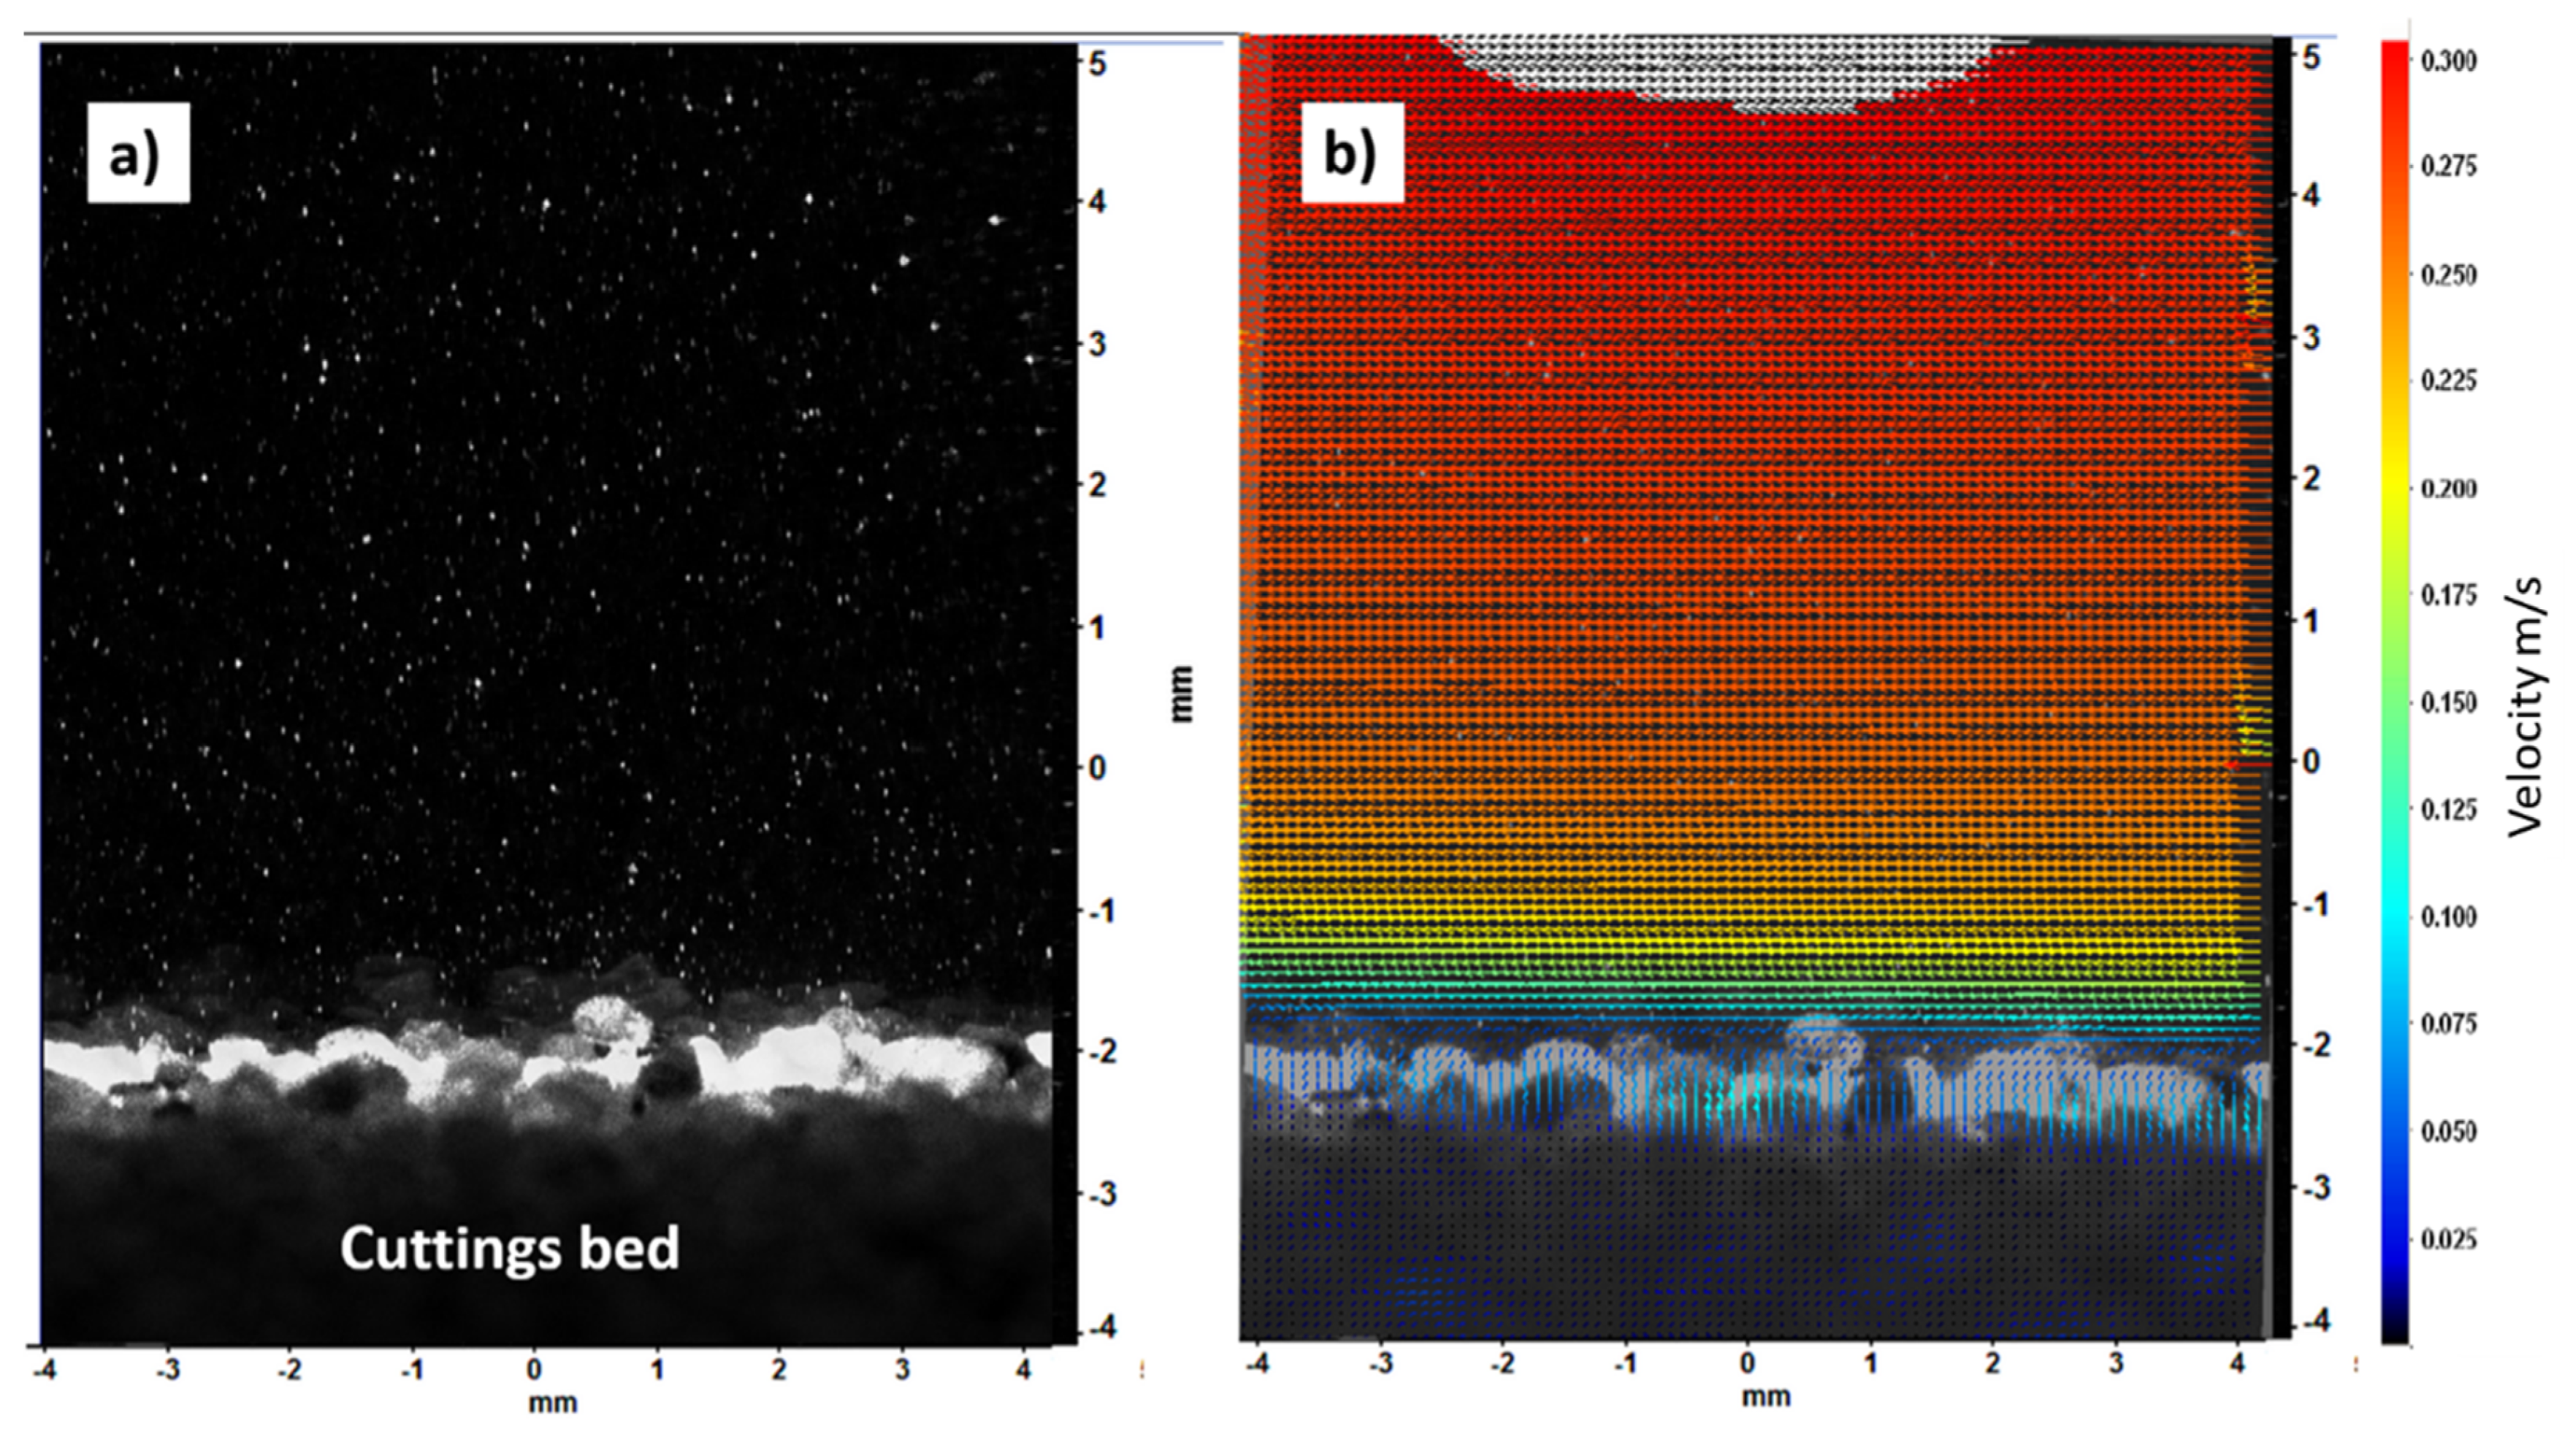
2.4.4. PIV Measurements
2.5. Data Processing and Analysis
3. Results
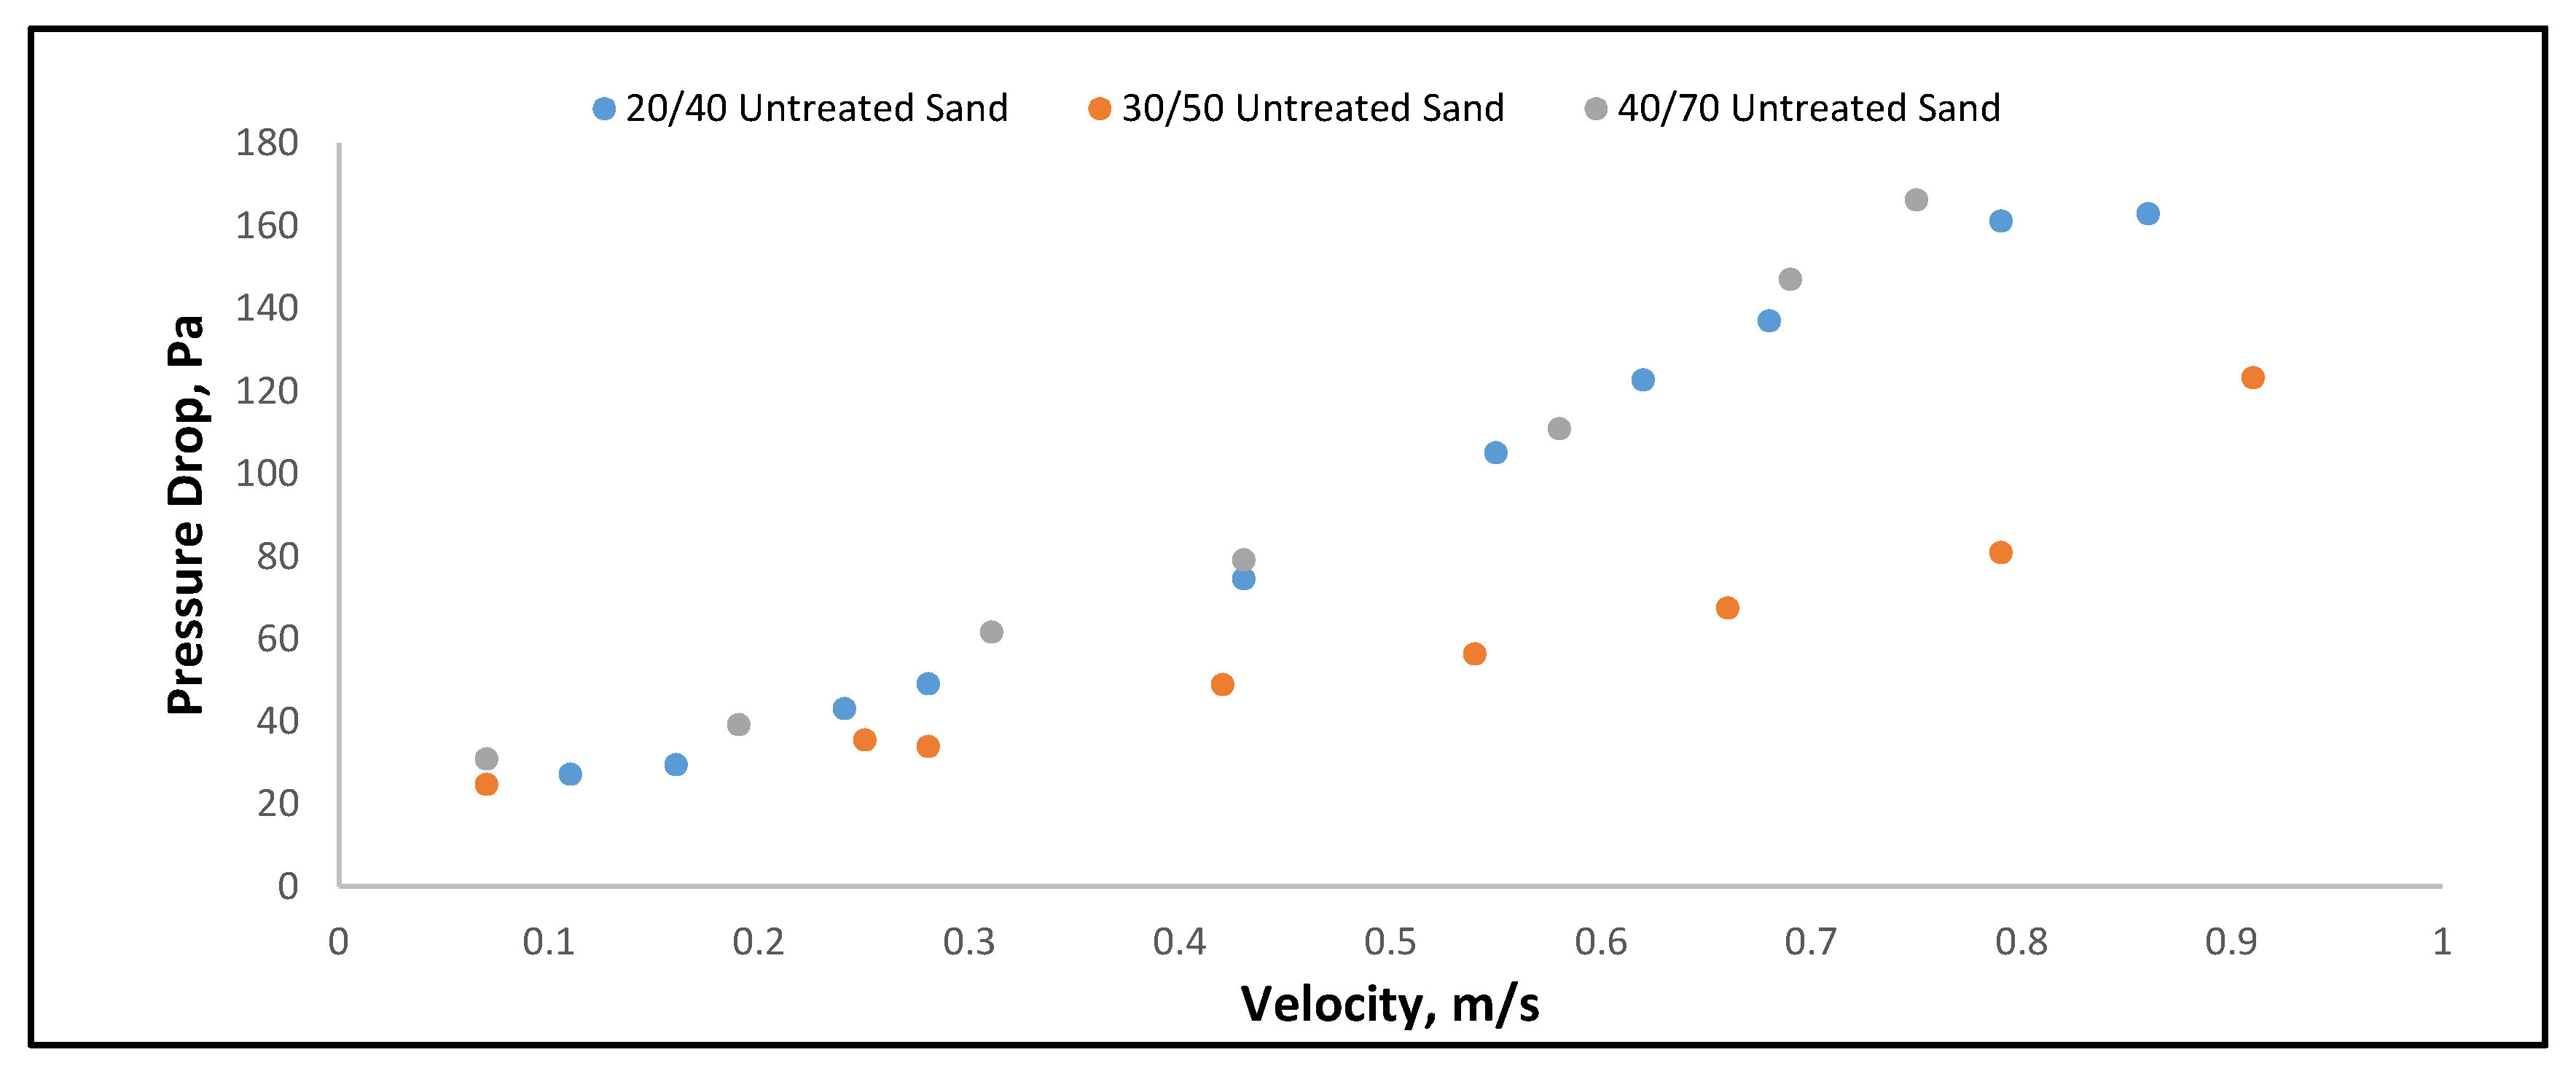
3.1. Frictional Pressure Drop Measured for the Polymer Fluid Flow over the Sand Bed
3.2. Turbulent Flow Characteristics of Polymer Fluid Flow over the Sand Bed
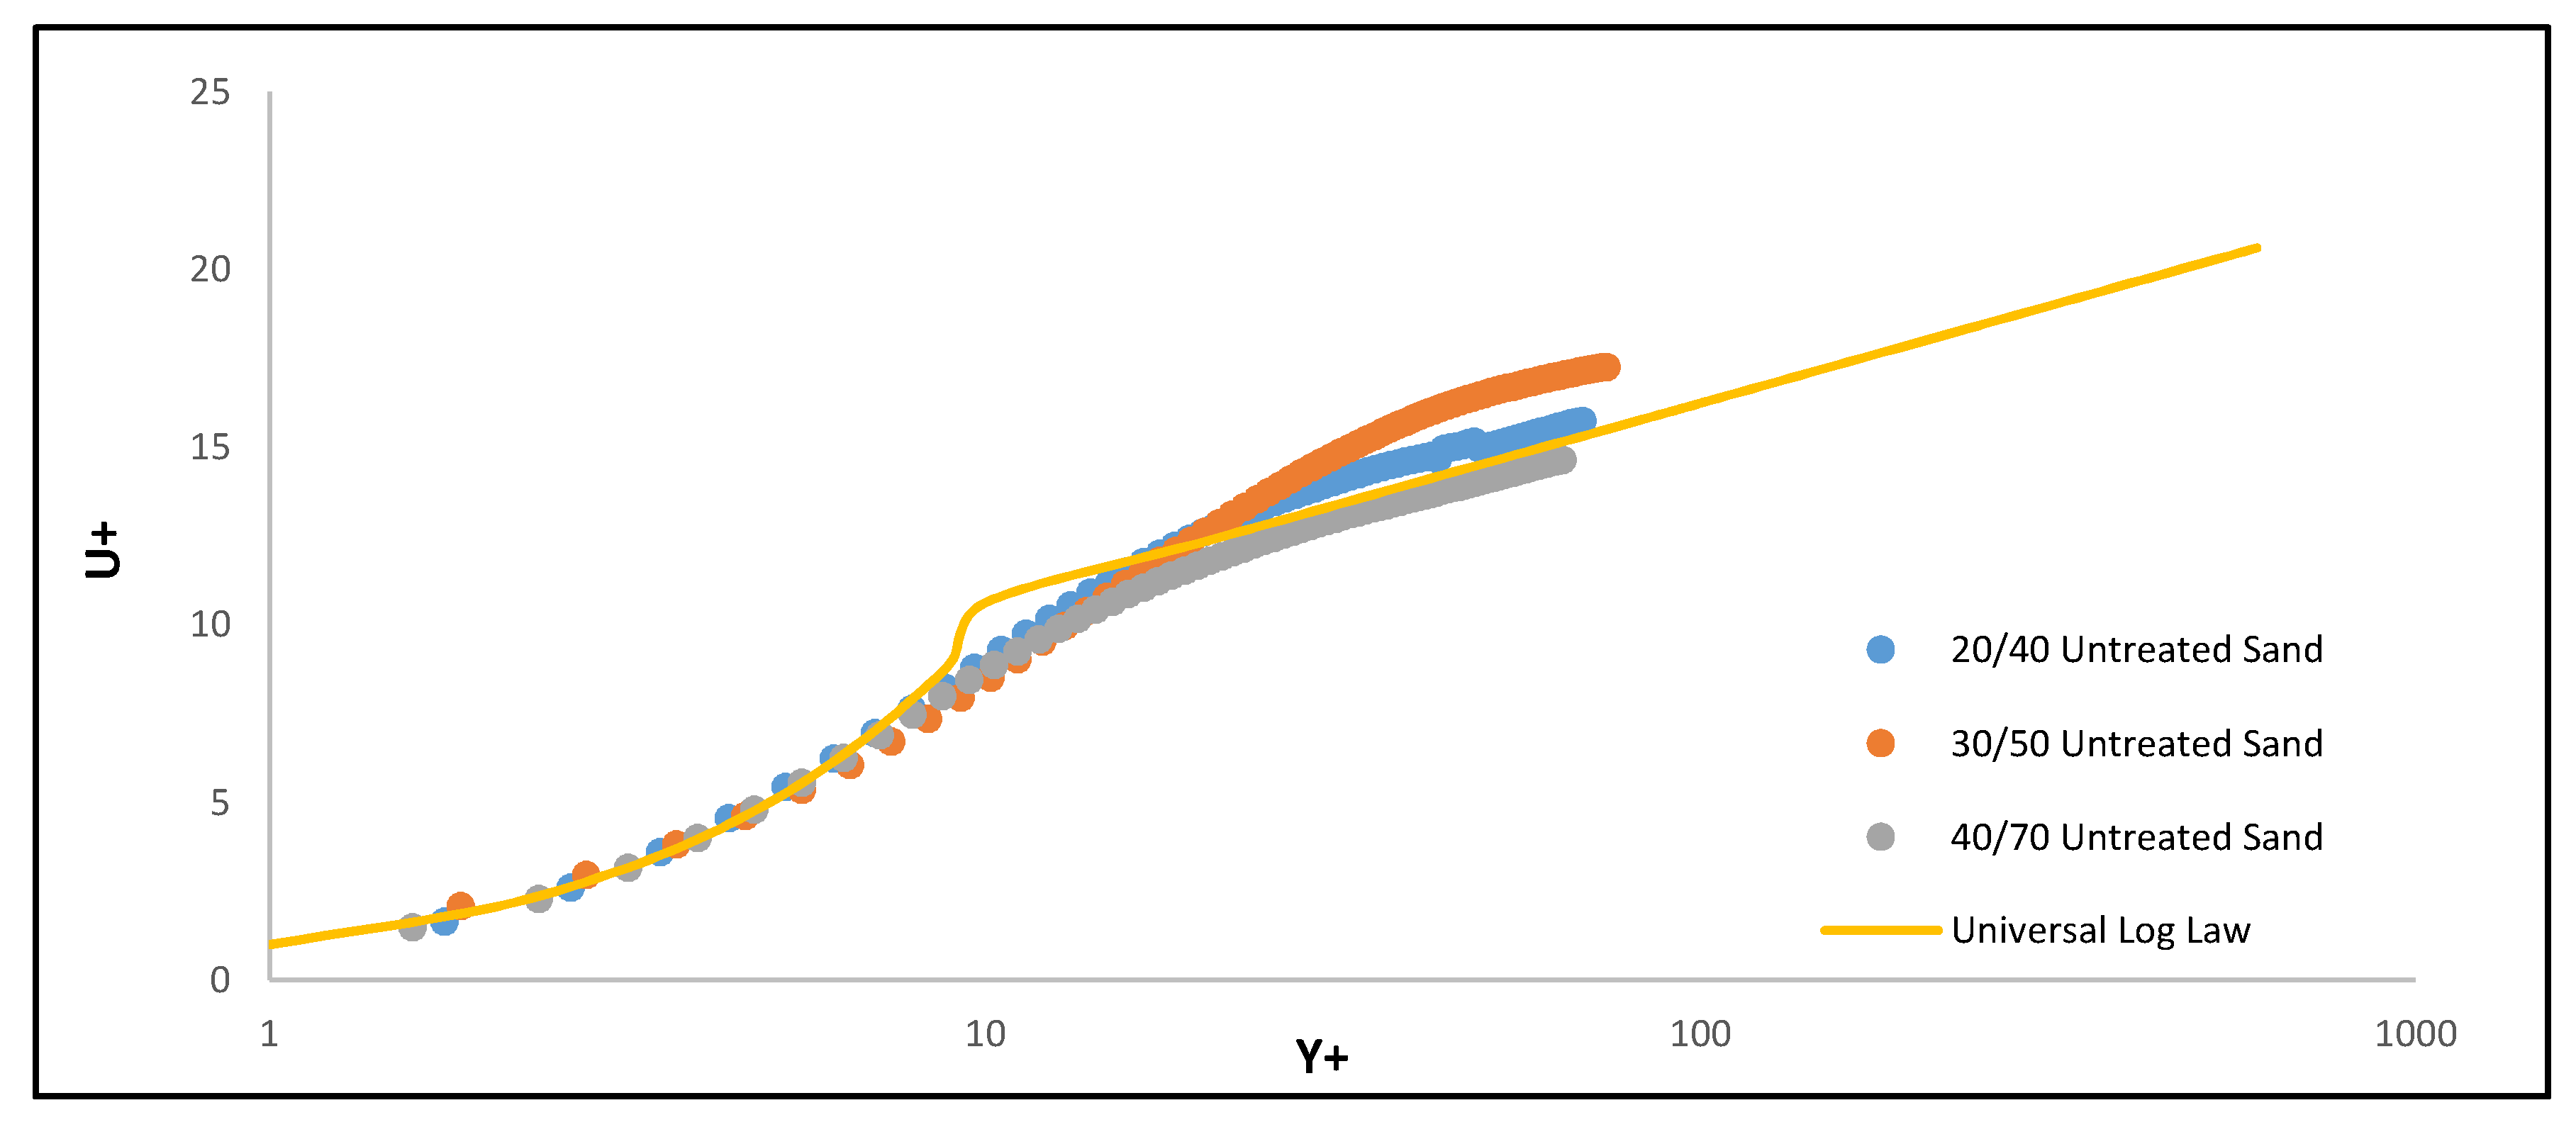
3.2.1. Near-Wall Velocity
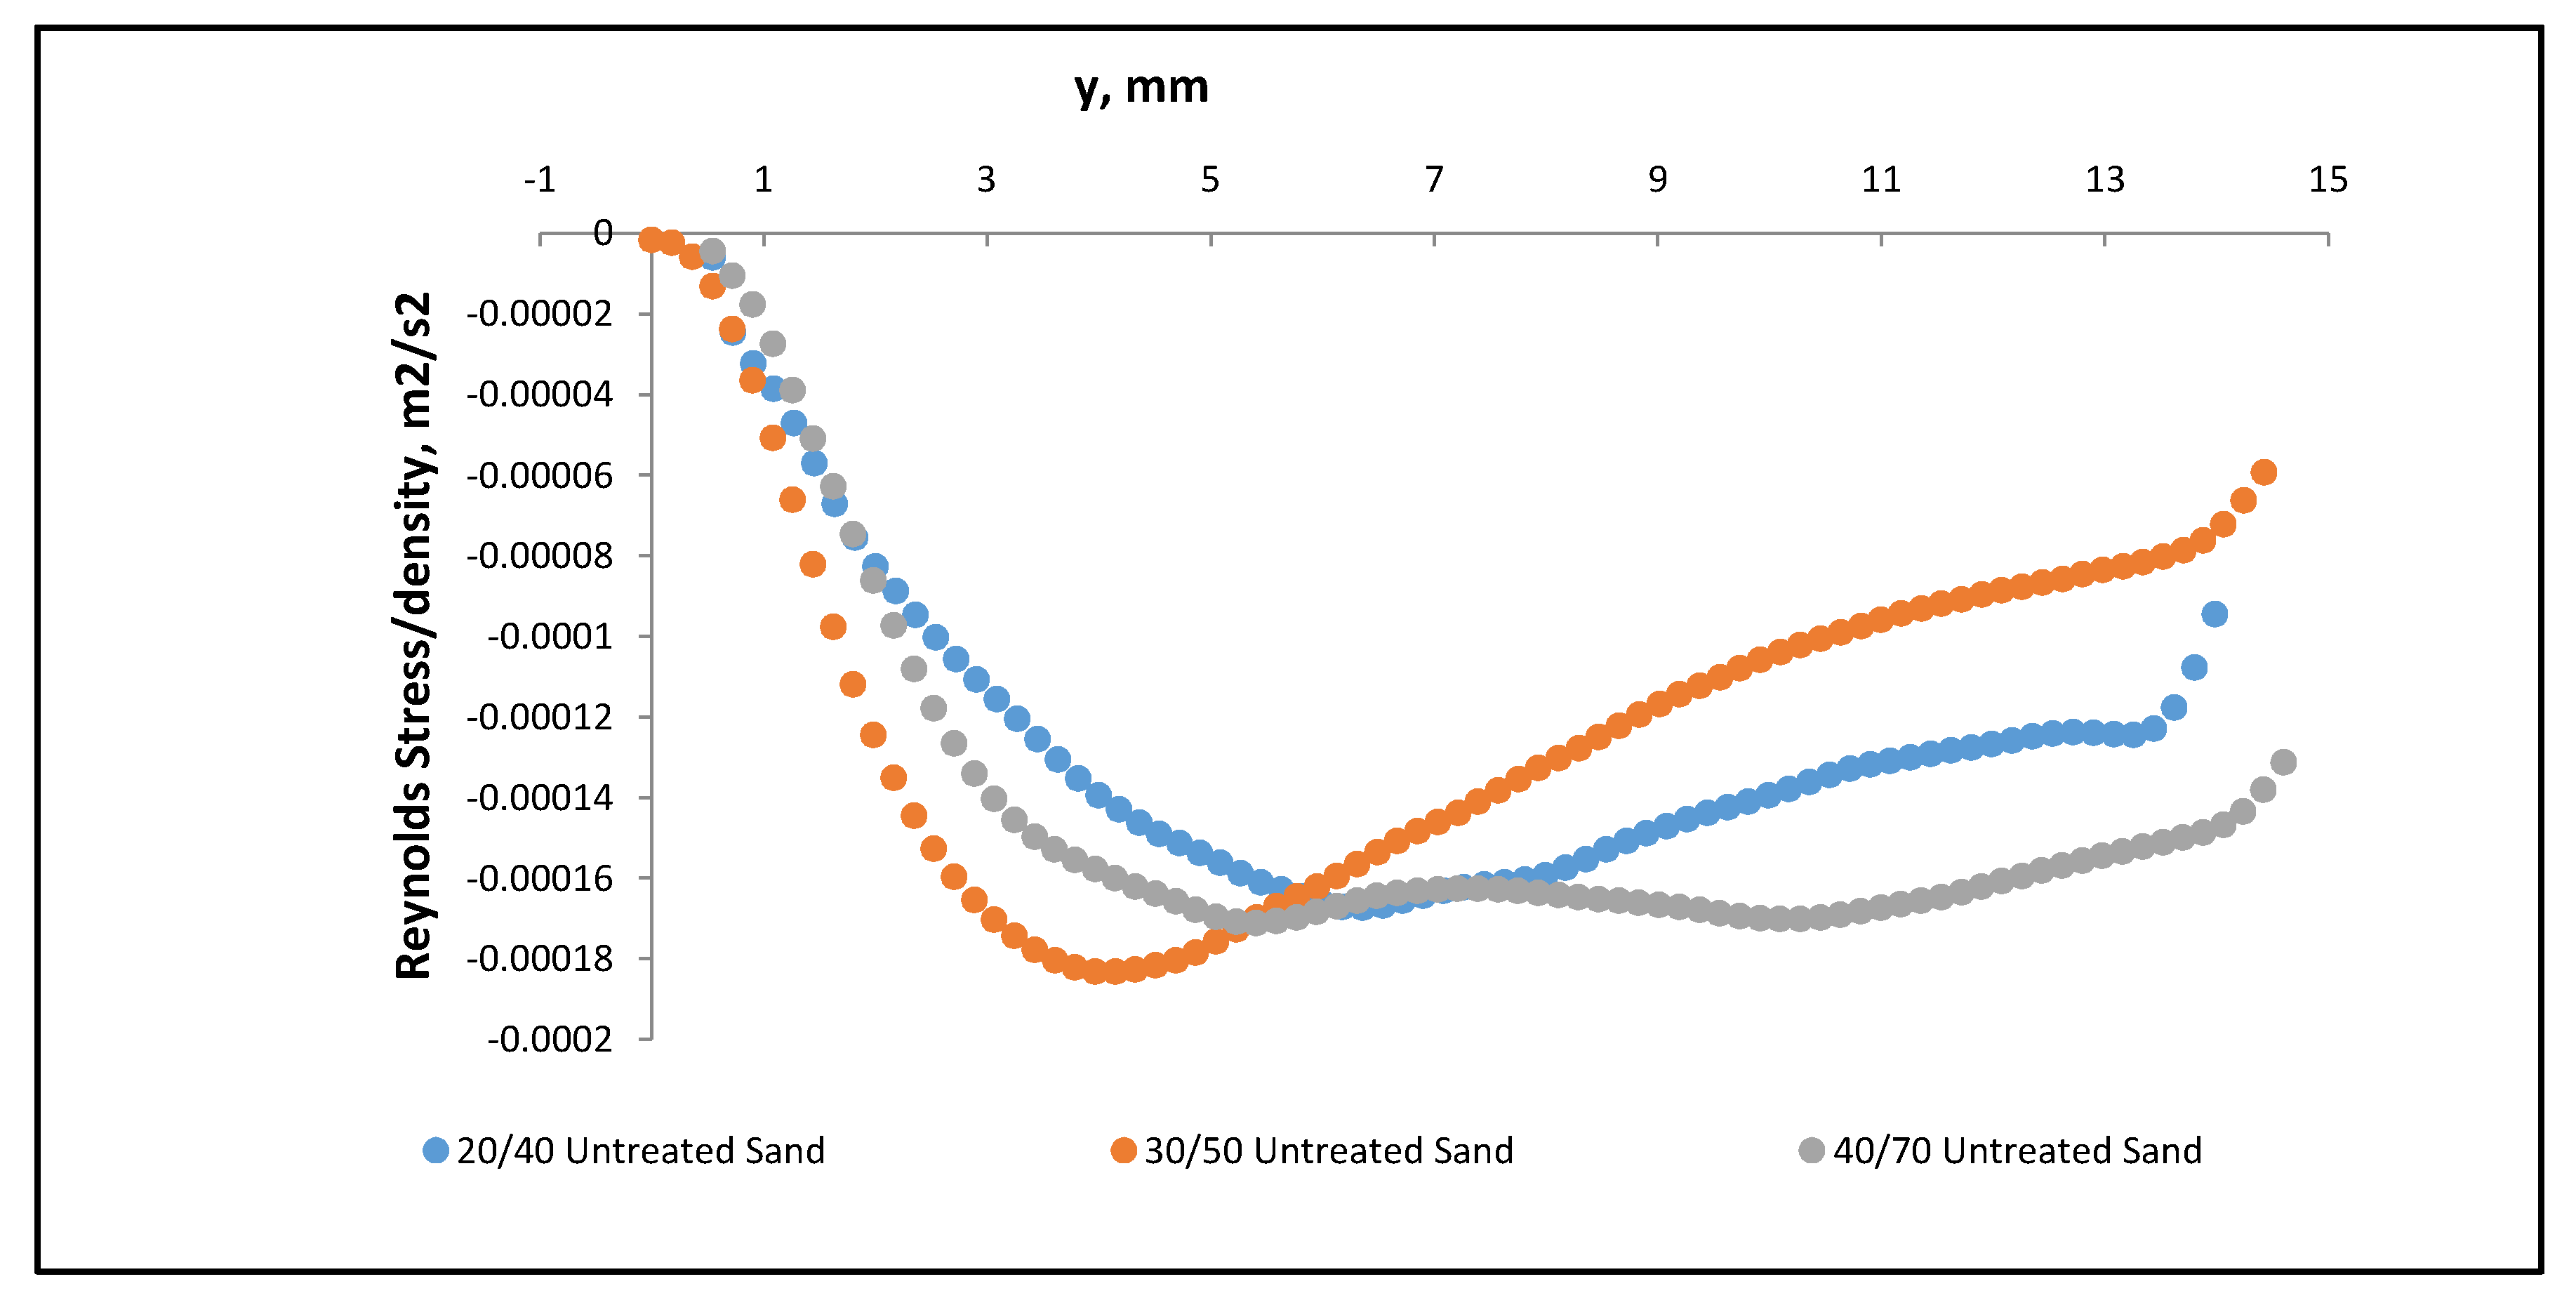
3.2.2. Reynolds Shear Stress
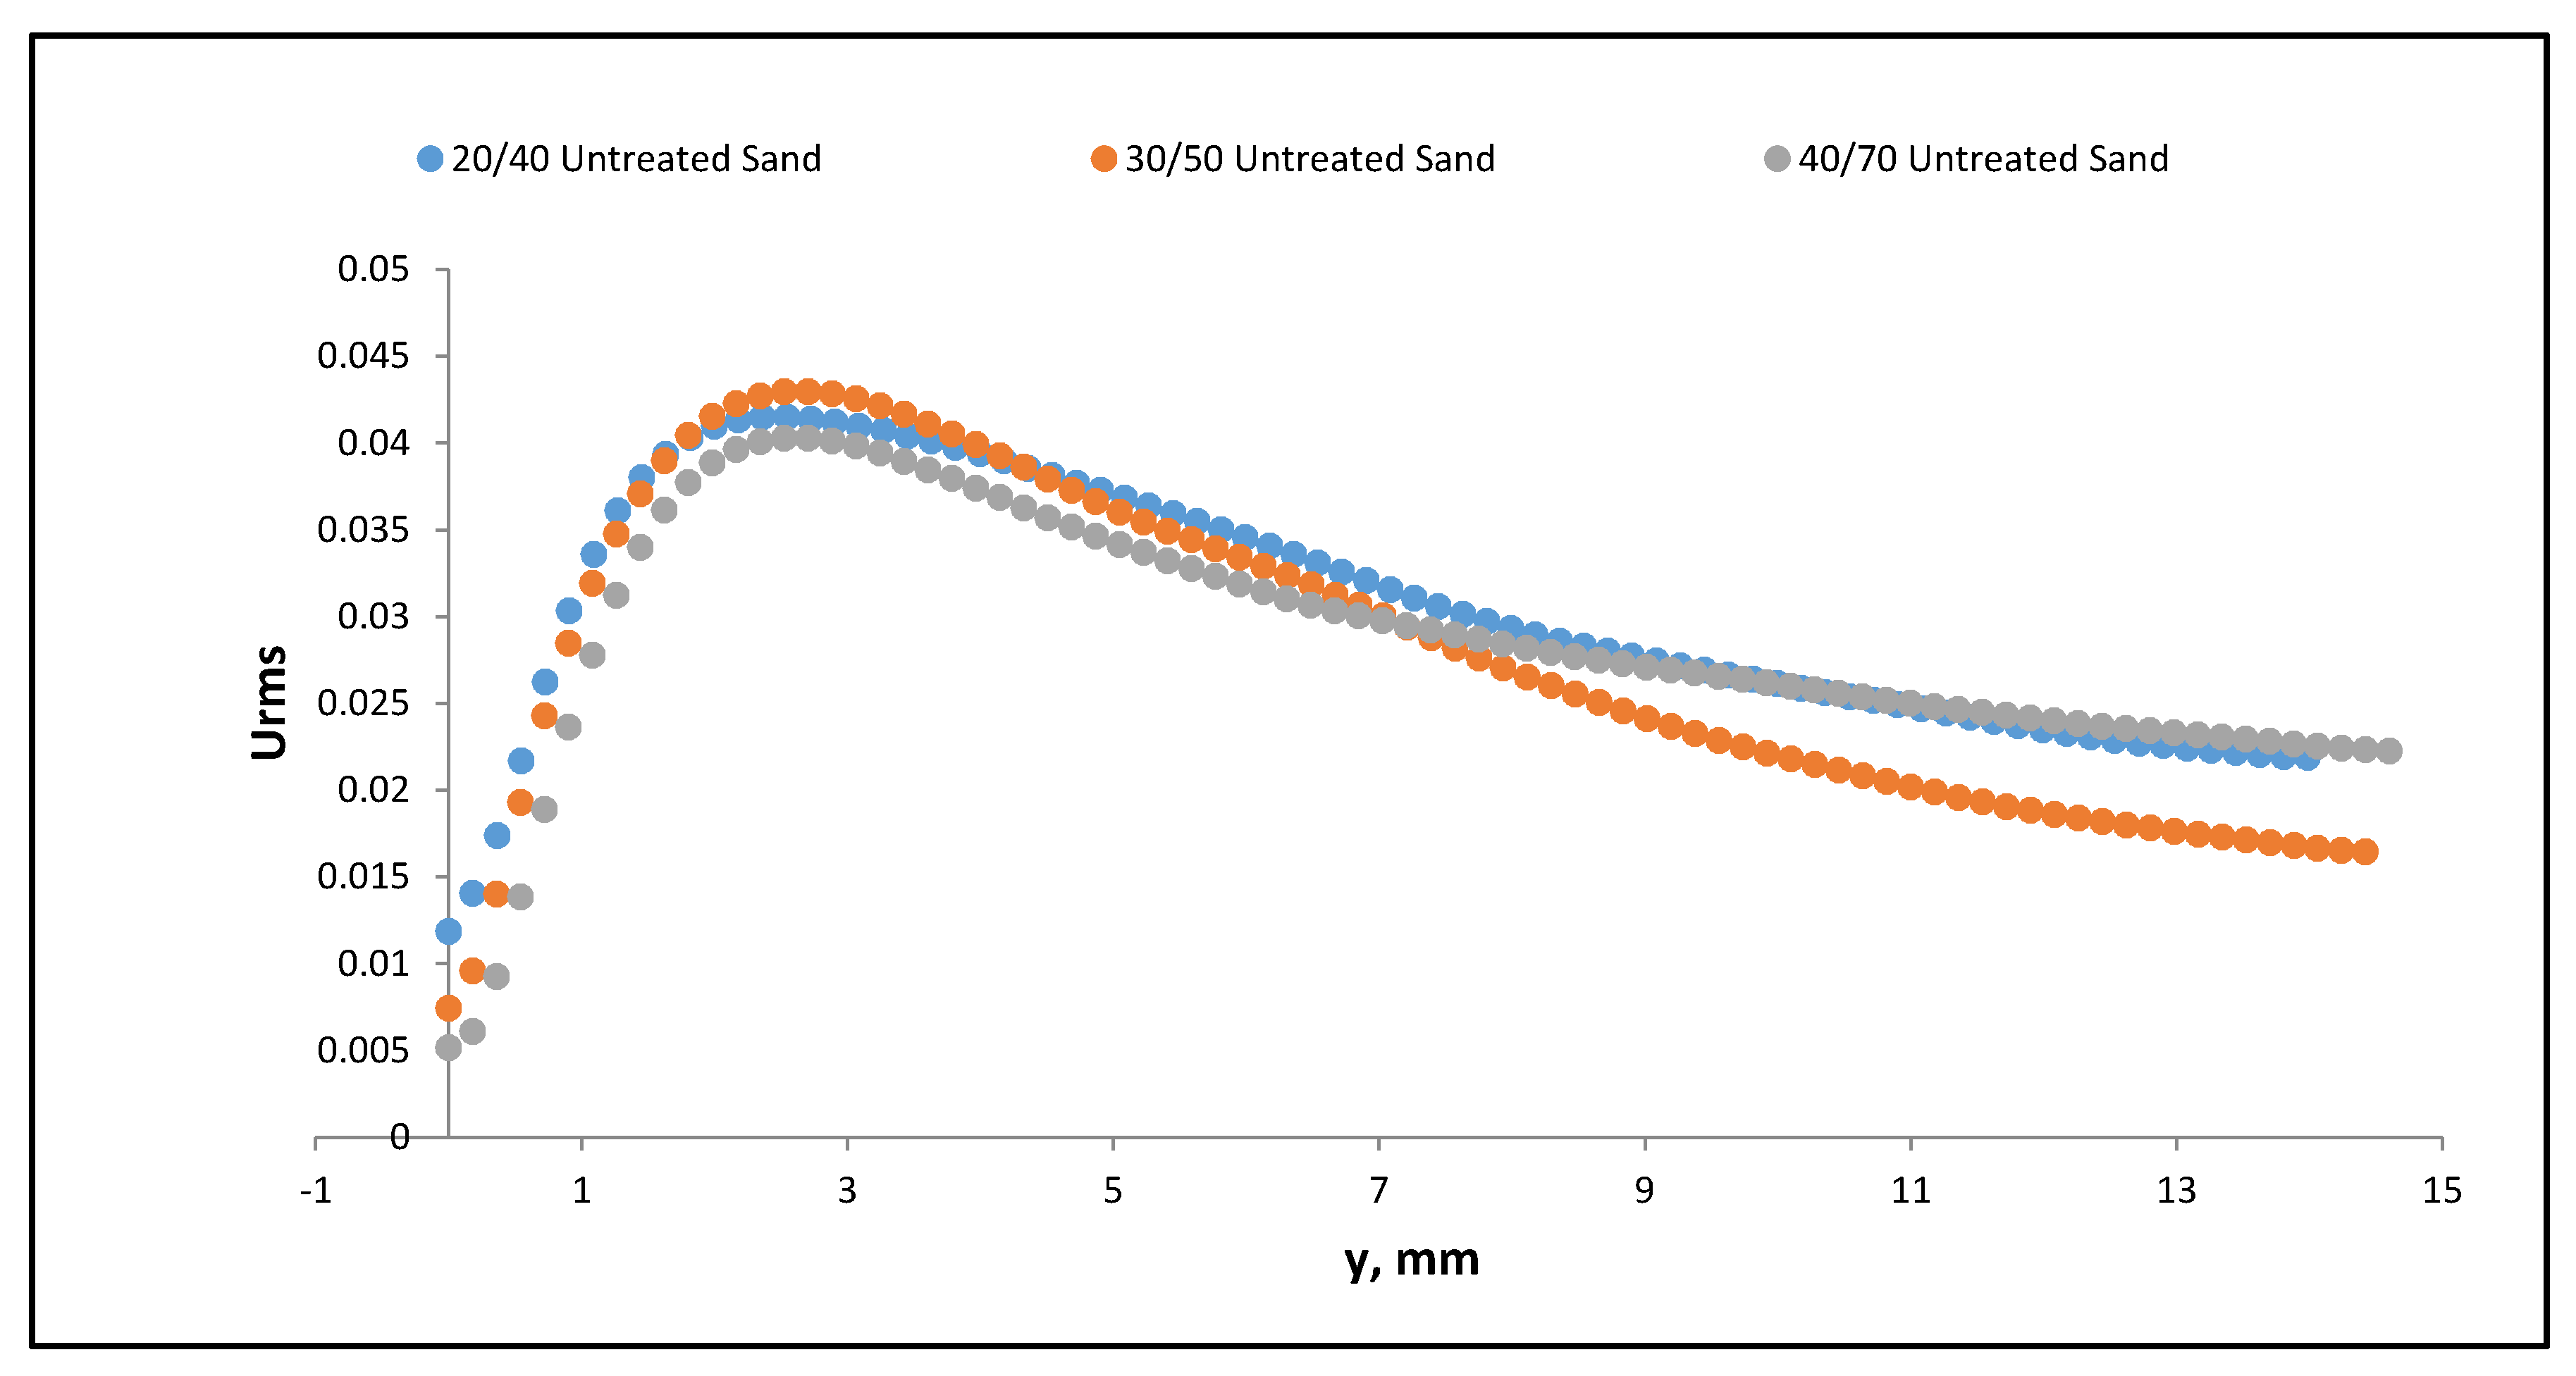
3.2.3. Axial Turbulence Intensity
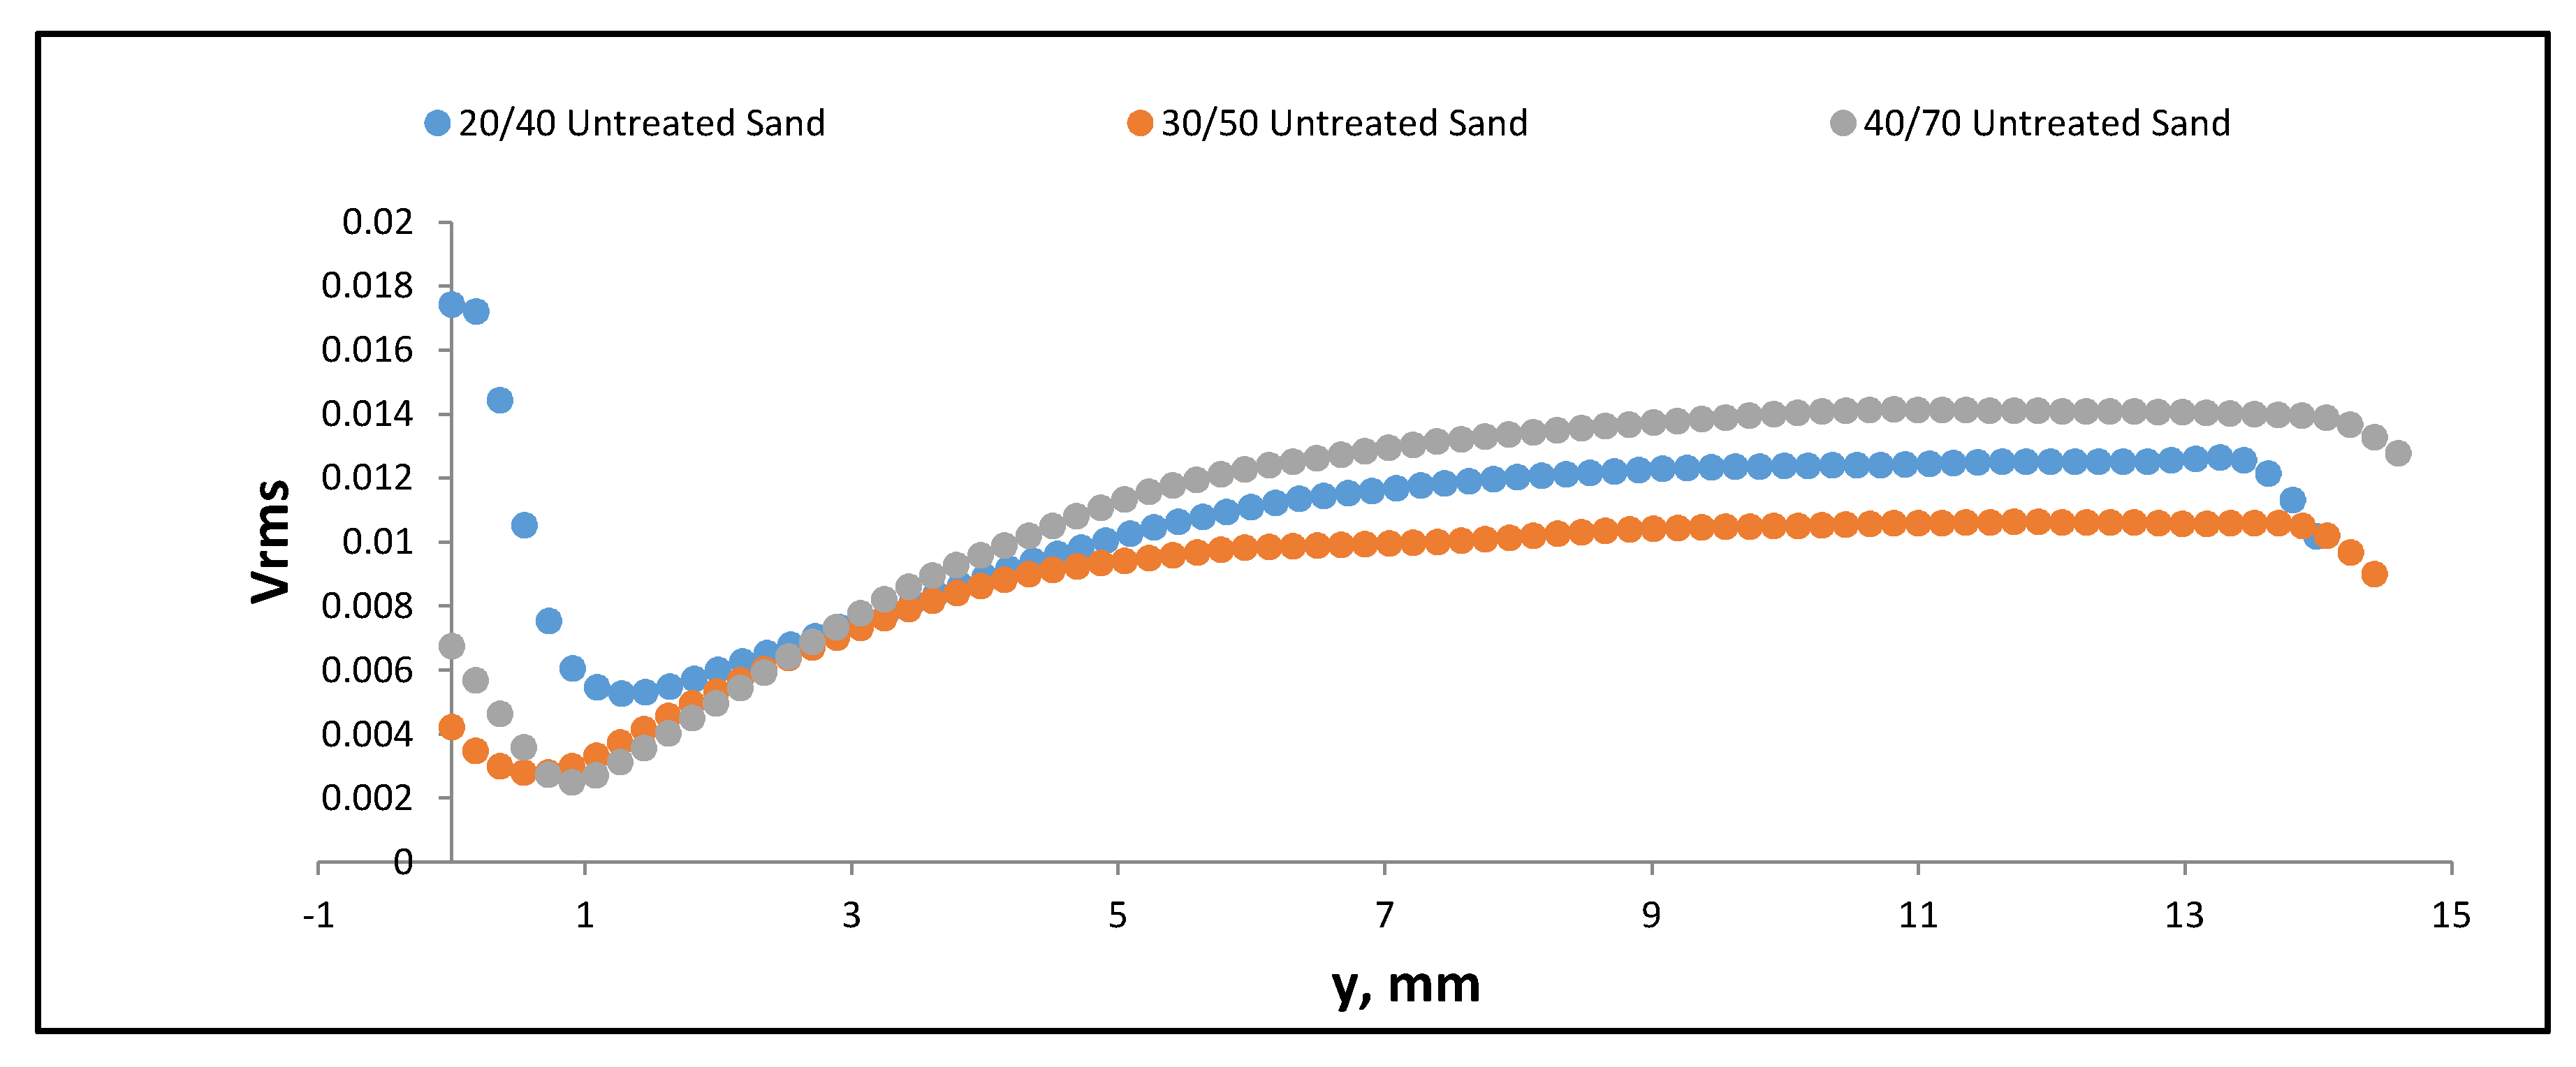
3.2.4. Radial Turbulence Intensity
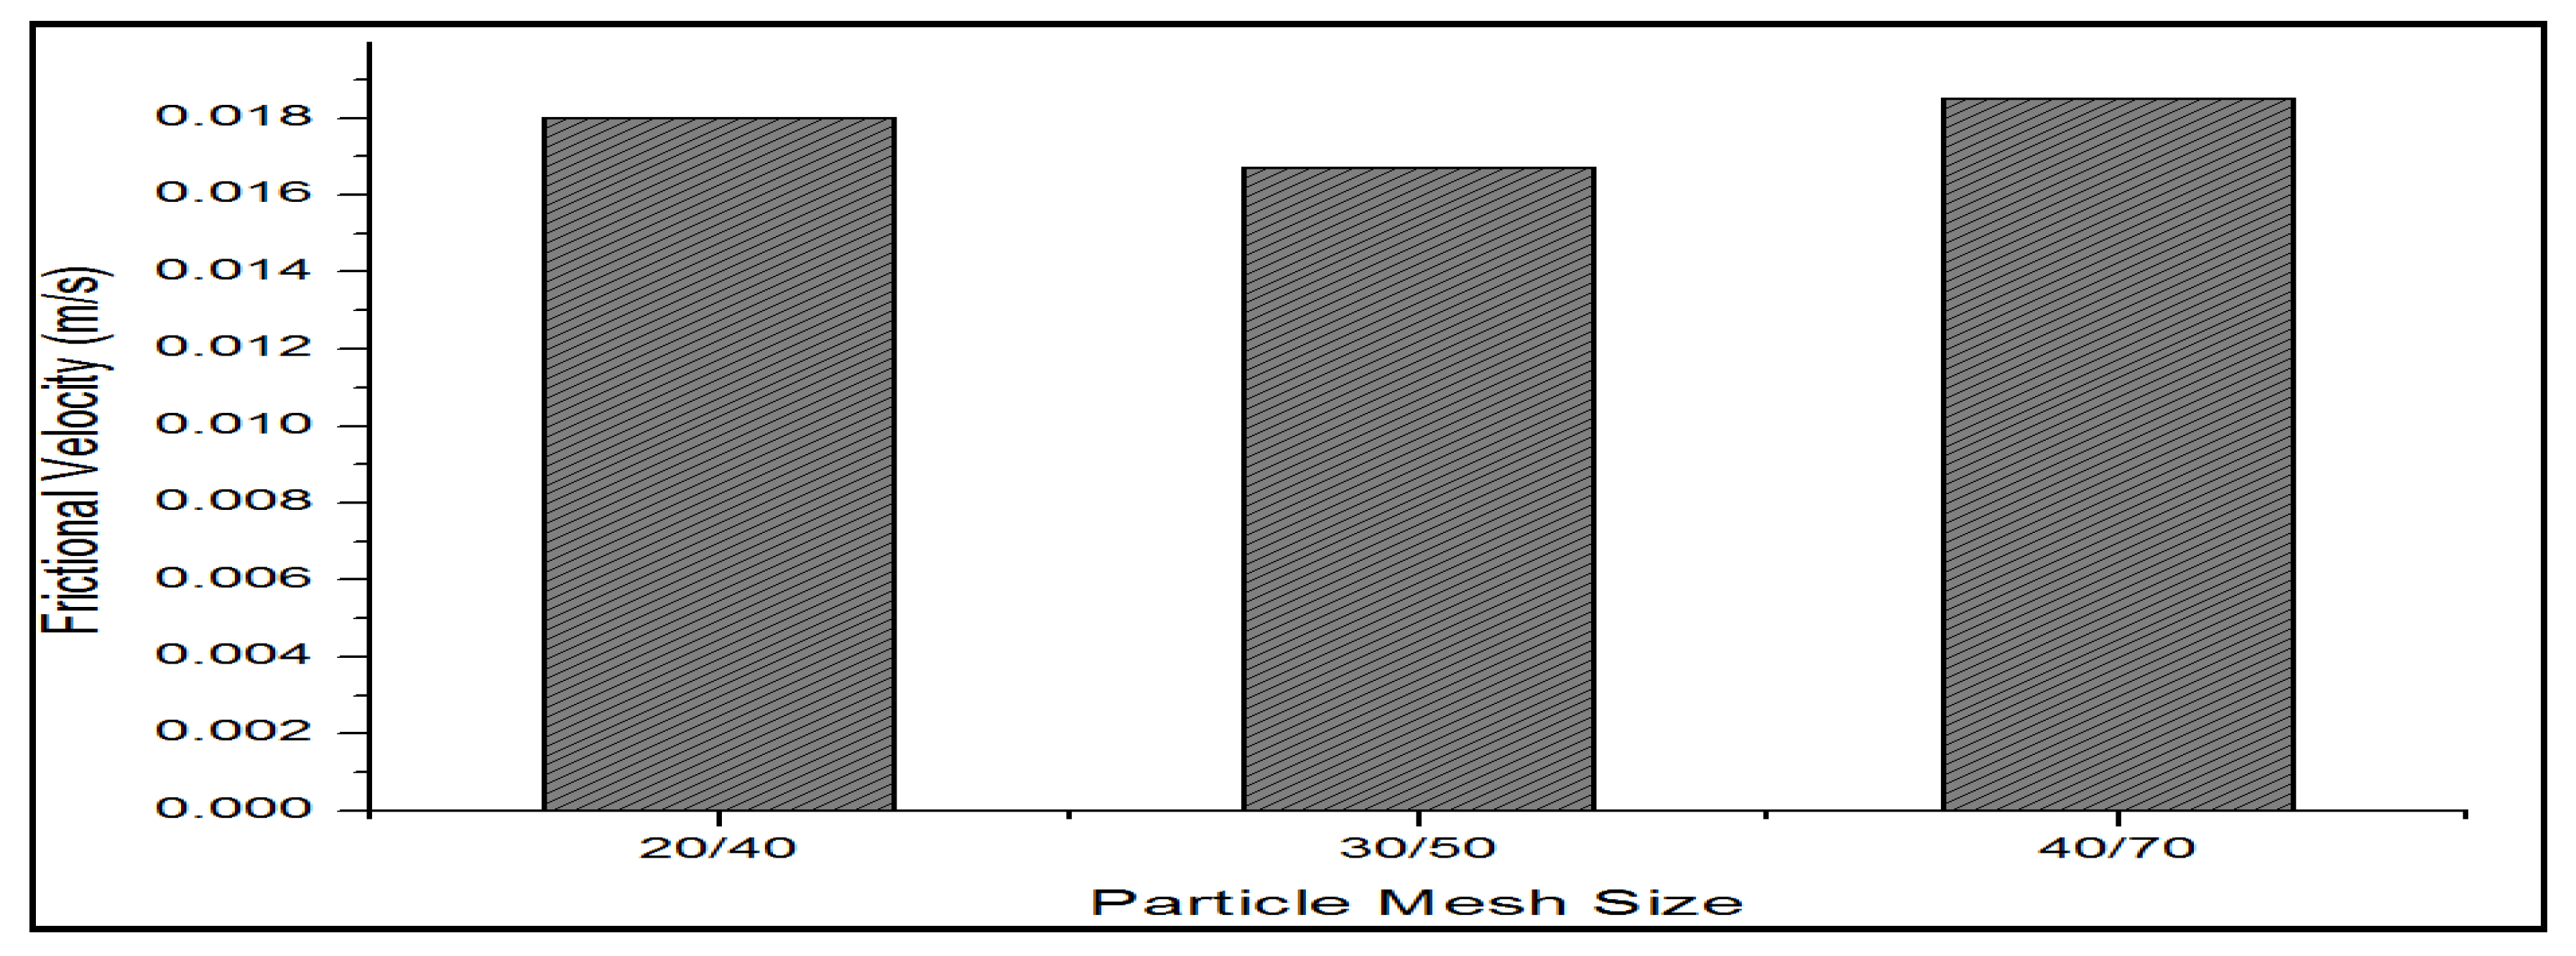
3.2.5. Frictional Velocity
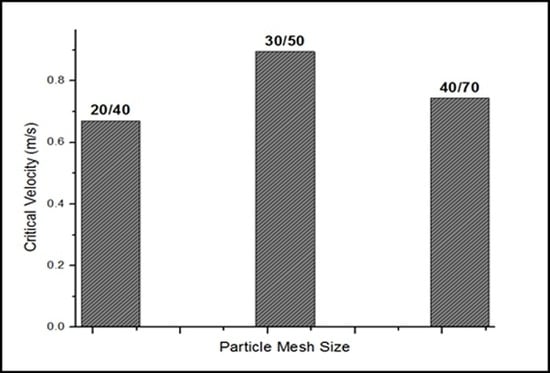
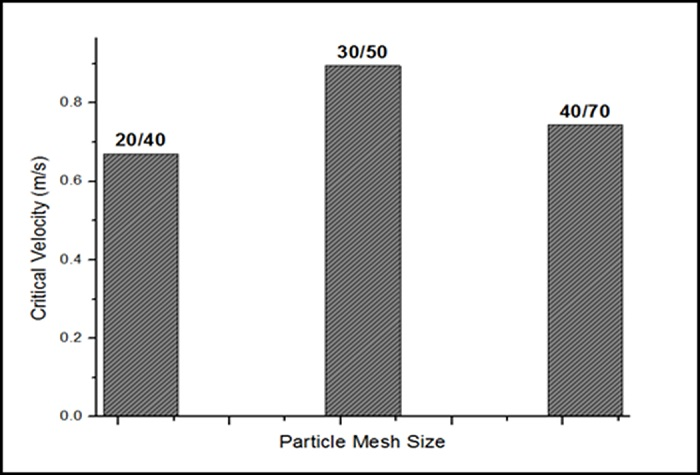
3.3. Critical Velocity Required for the Particle Removal from the Sand Bed Size
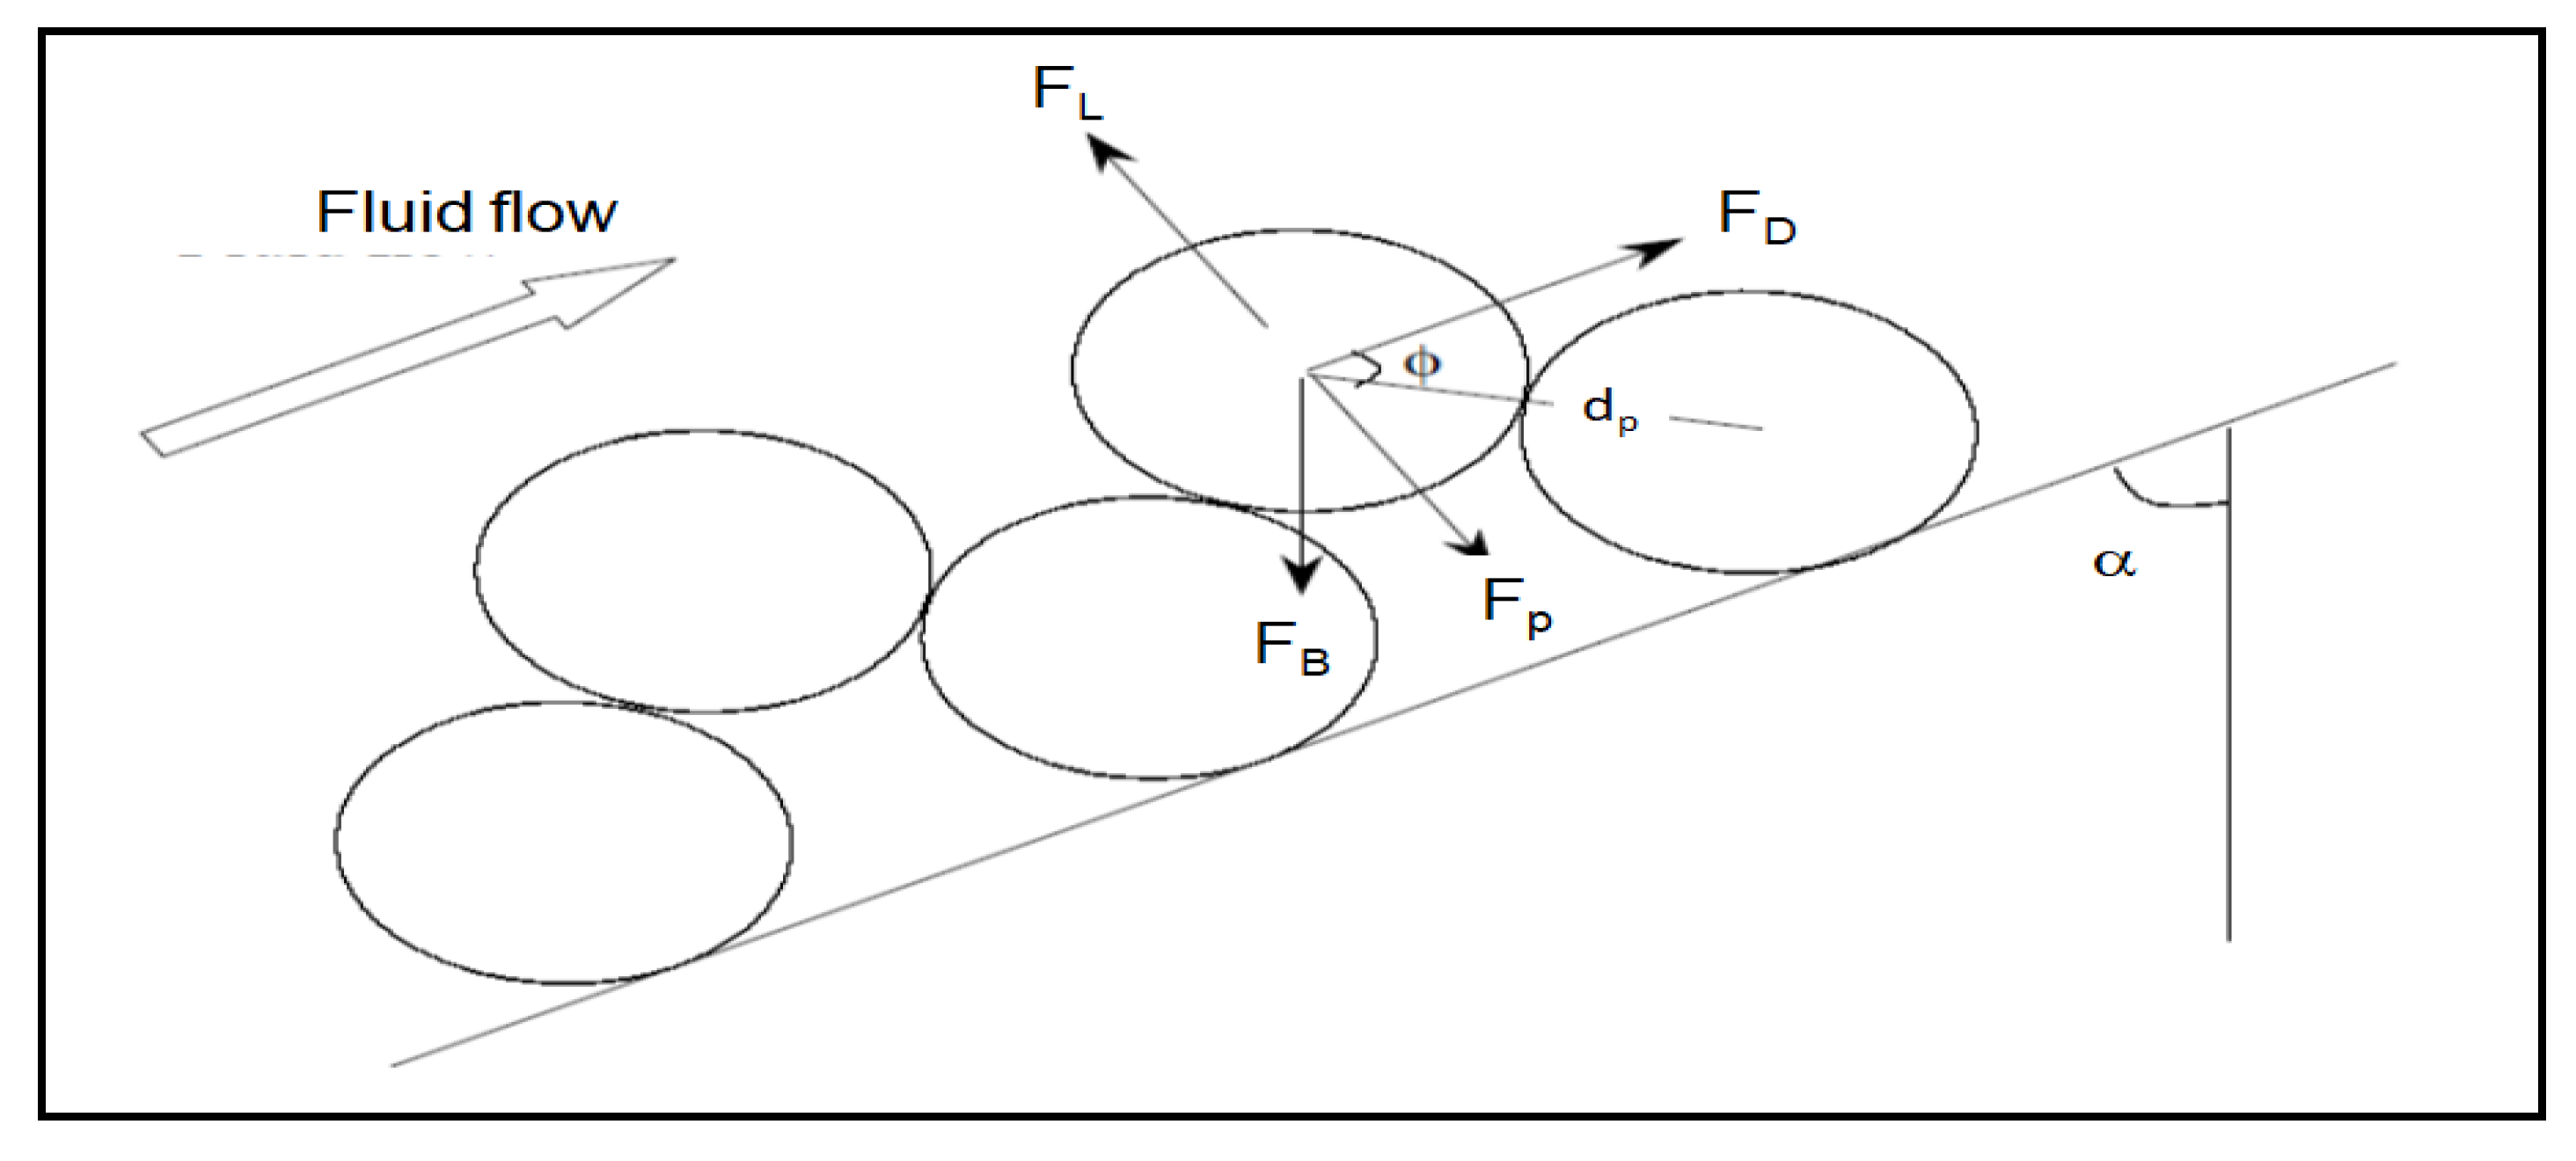
3.3.1. Analyses of Forces Acting on the Particles during the Flow of Polymer Fluid over the Sand Bed
- : rolling torque; dp: particle diameter; FD: drag force; FL: lift force; Fp: plastic force
- FB: weight of particle in the fluid; α: hole inclination; ϕ: angle of repose
3.3.2. Boundary Layer Thickness
4. Conclusions
Author Contributions
Funding
Acknowledgments
Conflicts of Interest
Appendix A. Model for Calculations of Hydraulic Diameter and Annular Area Open for Flow with the Presence of the Cuttings Bed Deposit

References
- Nazari, T.; Hareland, G.; Azar, J.J. Review of Cuttings Transport in Directional Well Drilling: Systematic Approach. In Proceedings of the SPE Western Regional Meeting, Anaheim, CA, USA, 27–29 May 2010. [Google Scholar] [CrossRef]
- Li, J.; Luft, B. Overview of Solids Transport Studies and Applications in Oil and Gas Industry—Experimental Work. In Proceedings of the SPE Russian Oil and Gas Exploration & Production Technical Conference and Exhibition, Moscow, Russia, 14–16 October 2014. [Google Scholar] [CrossRef]
- Li, J.; Luft, B. Overview Solids Transport Study and Application in Oil-Gas Industry-Theoretical Work. In Proceedings of the International Petroleum Technology Conference, Kuala Lumpur, Malaysia, 10–12 December 2014. [Google Scholar] [CrossRef]
- Brown, N.; Bern, P.; Weaver, A. Cleaning Deviated Holes: New Experimental and Theoretical Studies. In Proceedings of the SPE/IADC Drilling Conference, New Orleans, LA, USA, 28 February–3 March 1989. [Google Scholar] [CrossRef]
- Martins, A.; Sa, C.; Lourenço, A.; Freire, L.; Campos, W. Experimental Determination of Interfacial Friction Factor in Horizontal Drilling with a Bed of Cuttings. In Proceedings of the SPE Latin America/Caribbean Petroleum Engineering Conference, Port-of-Spain, Trinidad, 23–26 April 1996. [Google Scholar] [CrossRef]
- Martins, A.; Campos, W.; Liporace, F.; Wei, X.; Van Riet, E. On the Erosion Velocity of a Cuttings Bed During the Circulation of Horizontal and Highly Inclined Wells. In Proceedings of the SPE LACPEC, Rio de Janeiro, Brazil, 30 August–3 September 1997. [Google Scholar]
- Adari, R.; Miska, S.; Kuru, E.; Bern, P.; Saasen, A. Cuttings Bed Erosion Curves Help Predict Optimum Circulation Time for Hole Cleaning. In Proceedings of the ETCE/ OMAE Joint Conference of ASME, New Orleans, LA, USA, 14–17 February 2000. [Google Scholar]
- Cho, H.; Shah, S.N.; Osisanya, S.O. Selection of Optimum Coiled-Tubing Drilling Parameters Through the Cuttings-Bed Characterization. In Proceedings of the SPE/ICoTA Coiled Tubing Roundtable, Houston, TX, USA, 7–8 March 2001. [Google Scholar] [CrossRef]
- Ozbayoglu, M.E.; Ettehadi Osgouei, R.; Ozbayoglu, A.; Yuksel, E. Estimation of Very-Difficult-to-Identify Data for Hole Cleaning, Cuttings Transport and Pressure Drop Estimation in Directional and Horizontal Drilling. In Proceedings of the IADC/SPE Asia Pacific Drilling Technology Conference and Exhibition, Ho Chi Minh City, Vietnam, 1–3 November 2010. [Google Scholar] [CrossRef]
- Petersen, J. Determining the Cuttings Critical Transport Fluid Velocity using Simple Geometrical Approximations. In Proceedings of the SPE Bergen One Day Seminar, Bergen, Norway, 22 April 2015. [Google Scholar] [CrossRef]
- McClure, M. Bed load proppant transport during slick water hydraulic fracturing: Insights from comparisons between published laboratory data and correlations for sediment and pipeline slurry transport. J. Pet. Sci. Eng. 2020, 161, 599–610. [Google Scholar] [CrossRef] [Green Version]
- Brannon, H.D.; Wood, W.D.; Wheeler, R.S. The Quest for Improved Proppant Placement: Investigation of the Effects of Proppant Slurry Component Properties on Transport. In Proceedings of the SPE Annual Technical Conference and Exhibition, Dallas, TX, USA, 9–12 October 2005. [Google Scholar] [CrossRef]
- Patankar, N.A.; Joseph, D.; Wang, J.; Barree, R.; Conway, M.; Asadi, M. Power law correlations for sediment transport in pressure driven channel flows. Int. J. Multiph. Flow 2002, 28, 1269–1292. [Google Scholar] [CrossRef] [Green Version]
- Wang, J.; Joseph, D.; Patankar, N.; Conway, M.; Barree, R. Bi-power law correlations for sediment transport in pressure driven channel flows. Int. J. Multiph. Flow 2003, 29, 475–494. [Google Scholar] [CrossRef]
- Duan, M.; Miska, S.; Yu, M.; Takach, N.; Ahmed, R.; Zettner, C.M. Critical Conditions for Effective Sand-Sized Solids Transport in Horizontal and High-Angle Wells. SPE Drill. Complet. 2009, 24, 229–238. [Google Scholar] [CrossRef]
- Thomas, R.; Azar, J.; Becker, T. Drillpipe Eccentricity Effect on Drilled Cuttings Behavior in Vertical Wellbores. J. Pet. Technol. 1982, 34, 1929–1937. [Google Scholar] [CrossRef]
- Bizhani, M.; Kuru, E. Particle Removal From Sandbed Deposits in Horizontal Annuli Using Viscoelastic Fluids. SPE J. 2018, 23, 256–273. [Google Scholar] [CrossRef]
- Ramadan, A.; Skalle, P.; Johansen, S. A mechanistic model to determine the critical flow velocity required to initiate the movement of spherical bed particles in inclined channels. Chem. Eng. Sci. 2003, 58, 2153–2163. [Google Scholar] [CrossRef]
- Diplas, P.; Dancey, C.L.; Celik, A.O.; Valyrakis, M.; Greer, K.; Akar, T. The Role of Impulse on the Initiation of Particle Movement Under Turbulent Flow Conditions. Science 2008, 322, 717–720. [Google Scholar] [CrossRef] [PubMed] [Green Version]
- Bizhani, M.; Kuru, E. Critical Review of Mechanistic and Empirical (Semimechanistic) Models for Particle Removal From Sandbed Deposits in Horizontal Annuli With Water. SPE J. 2018, 23, 237–255. [Google Scholar] [CrossRef]
- Rabenjafimanantsoa, A.; Time, R.W.; Saasen, A. Simultaneous UVP and PIV Measurements Related to Bed Dunes Dynamics and Turbulence Structures in Circular Pipes. In Proceedings of the 5th International Symposium on Ultrasonic Doppler Methods for Fluid Mechanics and Fluid Engineering, Zurich, Switzerland, 12–14 September 2006. [Google Scholar]
- Hirpa, M.M.; Arnipally, S.K.; Bizhani, M.; Kuru, E.; Gelves, G.; Al-Rafia, I. Effect of Particle Size and Surface Properties on the Sandbed Erosion with Water Flow in a Horizontal Pipe. SPE J. 2020, 25, 1096–1112. [Google Scholar] [CrossRef]
- Cengel, Y.A.; Cimbala, J.M. Fluid Mechanics: Fundamentals and Applications, 1st ed.; McGraw-Hill Higher Education: Boston, MA, USA, 2006; pp. 321–329. ISBN 978-0072472363. [Google Scholar]
- Dodge, D.W.; Metzner, A.B. Turbulent flow of non-newtonian systems. AIChE J. 1959, 5, 189–204. [Google Scholar] [CrossRef]
- Raffel, M.; Willert, C.E.; Kompenhans, J. Particle Image Velocimetry: A Practical Guide, 3rd ed.; Springer: Berlin/Heidelberg, Germany, 2018. [Google Scholar]
- LaVision, Davis 8.3 Product Manual. 2015 Edition. Available online: https://www.lavision.de/en/products/davis-software/ (accessed on 1 April 2020).
- Kundu, P.K.; Cohen, I.M.; Dowling, D.R. Fluid Mechanics, 5th ed.; Elsevier: Amsterdam, The Netherland, 2012. [Google Scholar]
- Kelessidis, V.; Bandelis, G. Flow Patterns and Minimum Suspension Velocity for Efficient Cuttings Transport in Horizontal and Deviated Wells in Coiled-Tubing Drilling. SPE Drill. Complet. 2004, 19, 213–227. [Google Scholar] [CrossRef]
- Davies, J. Calculation of critical velocities to maintain solids in suspension in horizontal pipes. Chem. Eng. Sci. 1987, 42, 1667–1670. [Google Scholar] [CrossRef]
- Bizhani, M. Experimental and Theoretical Investigations of Particle Removal from Sand Bed Deposits in Horizontal Wells Using Turbulent Flow of Water and Polymer Fluids. Ph.D. Thesis, University of Alberta, Edmonton, AB, Canada, 2017. [Google Scholar]
- Hirpa, M.M. Experimental Investigation of the Effects of Fluid Elastic Properties, Sand Particle Size and Surface Properties on the Bed Erosion Dynamics of the Sand Bed Deposited in Horizontal Pipeline. Master’s Thesis, University of Alberta, Edmonton, AB, Canada, 2019. [Google Scholar]


| Sand Particle Mesh Size | Sand Particle Size Range (Microns) |
|---|---|
| 20/40 | 420–840 |
| 30/50 | 297–590 |
| 40/70 | 210–420 |
| Sand Particle Mesh Size | Bed Height cm | Equivalent Diameter m | Flow Rate lpm | Frictional Pressure Loss Pa |
|---|---|---|---|---|
| 20/40 | 3.65 | 0.0767 | 70.3 | 43 |
| 30/50 | 3.10 | 0.0802 | 76.0 | 35 |
| 40/70 | 3.31 | 0.0789 | 74.7 | 49 |
| Sand Mesh Size | Bed Height (cm) | Area Open for Flow (cm2) | Critical Flow Rate (lpm) | Critical Velocity (m/s) | Critical Pressure Drop (Pa) |
|---|---|---|---|---|---|
| 20/40 | 3.65 | 45.8 | 183.5 | 0.67 | 122.61 |
| 30/50 | 3.1 | 50.6 | 271.6 | 0.895 | 123.12 |
| 40/70 | 3.31 | 48.9 | 218.3 | 0.744 | 166.2 |
| Particle Mesh Size | Particle Size Micron | Critical Velocity m/s | Near Bed Velocity m/s | CD | FD N | FB × cosΦ N | Net Force N |
|---|---|---|---|---|---|---|---|
| 20/40 | 840 | 0.670 | 0.038 | 5.331 | 4.10 × 10⁻⁶ | 3.51 × 10⁻⁶ | 5.93 × 10⁻⁷ |
| 30/50 | 590 | 0.895 | 0.036 | 7.065 | 2.57 × 10⁻⁶ | 1.21 × 10⁻⁶ | 1.36 × 10⁻⁶ |
| 40/70 | 420 | 0.744 | - | - | - | 5.07 × 10⁻⁷ | - |
| Particle Mesh Size | Particle Size Micron | Superficial Velocity m/s | Near Bed Velocity m/s | CD | FD N | FB × cosΦ N | Net Force N |
|---|---|---|---|---|---|---|---|
| 20/40 | 840 | 0.6 | 0.02387 | 7.955 | 2.51 × 10⁻⁶ | 3.51 × 10⁻⁶ | −1.00 × 10⁻⁶ |
| 30/50 | 590 | 0.778 | 0.01358 | 18.094 | 9.12 × 10⁻⁷ | 1.21 × 10⁻⁶ | −3.00 × 10⁻⁷ |
| 40/70 | 420 | 0.436 | 0.01026 | 31.578 | 4.60 × 10⁻⁷ | 4.80 × 10⁻⁷ | −2.00 × 10⁻⁸ |
| 20/40 Sand | 30/50 Sand | 40/70 Sand | |
|---|---|---|---|
| Particle Mesh Size (micron) | 840–420 | 590–297 | 420–210 |
| Viscous Sublayer Thickness (micron) | 765 | 811 | 797 |
© 2020 by the authors. Licensee MDPI, Basel, Switzerland. This article is an open access article distributed under the terms and conditions of the Creative Commons Attribution (CC BY) license (http://creativecommons.org/licenses/by/4.0/).
Share and Cite
Hirpa, M.M.; Arnipally, S.K.; Kuru, E. Effect of the Particle Size on the Near-Wall Turbulence Characteristics of the Polymer Fluid Flow and the Critical Velocity Required for Particle Removal from the Sand Bed Deposited in Horizontal Wells. Energies 2020, 13, 3172. https://doi.org/10.3390/en13123172
Hirpa MM, Arnipally SK, Kuru E. Effect of the Particle Size on the Near-Wall Turbulence Characteristics of the Polymer Fluid Flow and the Critical Velocity Required for Particle Removal from the Sand Bed Deposited in Horizontal Wells. Energies. 2020; 13(12):3172. https://doi.org/10.3390/en13123172
Chicago/Turabian StyleHirpa, Mehmet Meric, Sumanth Kumar Arnipally, and Ergun Kuru. 2020. "Effect of the Particle Size on the Near-Wall Turbulence Characteristics of the Polymer Fluid Flow and the Critical Velocity Required for Particle Removal from the Sand Bed Deposited in Horizontal Wells" Energies 13, no. 12: 3172. https://doi.org/10.3390/en13123172