On-Site Identification of the Material Composition of PV Modules with Mobile Spectroscopic Devices


OFI, Austrian Research Institute for Chemistry and Technology, 1030 Vienna, Austria
*
Author to whom correspondence should be addressed.
Energies 2020, 13(8), 1903; https://doi.org/10.3390/en13081903
Submission received: 26 March 2020
/
Revised: 9 April 2020
/
Accepted: 11 April 2020
/
Published: 13 April 2020
(This article belongs to the Special Issue Photovoltaic Modules)
Abstract
:With the increased development of portable and handheld molecular spectrometers within recent years, new fields of applications have opened up, such as their use (i) for material identification of samples contained in large and non-portable components and (ii) the detection of material degradation effects and failures directly in the plant. The usability and transferability of well-established analytical characterization techniques, such as attenuated total reflection (ATR) Infrared (IR)-, Raman, and Near-Infrared (NIR)-spectroscopy as mobile devices for the in-field characterization of Photovoltaic (PV) modules, are described and discussed. Material identification of the polymeric compounds incorporated in the PV modules (encapsulants, backsheets) is often an important task, especially when degradation and failures occur. Whereas the knowledge of the bill of materials is one challenge, the detection of material degradation effects is another important issue. Both tasks can be solved nondestructively by the application of mobile spectrometers. Raman spectroscopy is the best-suited method for the identification of the encapsulant within the module (measurement through 3-mm glass), while NIR measurements allowed for the nondestructive determination of the composition of the multilayer backsheet. Surface degradation effects (e.g., oxidation, hydrolysis) are best detectable with IR-spectroscopy. The application of mobile devices allows for direct material analysis in the field without dismantling PV modules, transporting them to the lab, cutting them in smaller pieces, and analyzing them in conventional bench-top spectrometers.
1. Introduction
The performance, quality, and reliability of photovoltaic (PV) modules are key factors for the advantageous development of emerging photovoltaic markets worldwide. During their lifetime in the field, PV modules have to withstand environmental influences, which vary significantly with the surrounding climate [1,2,3,4,5,6,7]. Consequently, the weathering stability of the protective polymeric materials (backsheets, encapsulates) used in PV modules (which can be seen as multilayer laminates) is decisive for the persistence and reliability of the active PV components of a PV module [8,9,10,11,12].
The task of the backsheet within the multi-material composite of a PV module is (i) to protect the PV active layer (cells and interconnecting system) and the polymeric encapsulation against environmental, mechanical and chemical influences and (ii) to ensure electrical insulation. Thus, it is decisive which type of backsheet (chemical composition, barrier properties, and structure) is used. Especially, the chemical and physical properties of the backsheet (and thus its aging behavior) can have a strong influence on cell corrosion and/or encapsulant degradation, which both are known to be important factors for the reliability of a PV module over its intended service lifetime of up to 25 years [4,5].
Thus, material identification of the polymeric compounds incorporated in the multi-material composite PV module is often an important task, especially when failures or unexpected high-performance degradation are detected. Whereas the knowledge of the bill of materials is one challenge, the detection of material degradation effects—especially at the material interfaces (e.g., solar cell/encapsulant or encapsulant/backsheet)—is another important issue. Both tasks can be solved by the application of spectroscopic methods [13].
In the following, the usability and transferability of well-established analytical characterization techniques, namely:
- Infrared (IR) spectroscopy (mid-infrared),
- Near-Infrared (NIR) spectroscopy, and
- Raman spectroscopy
as mobile devices for in-field characterization of PV modules will be described.
2. Methods
2.1. Spectroscopy
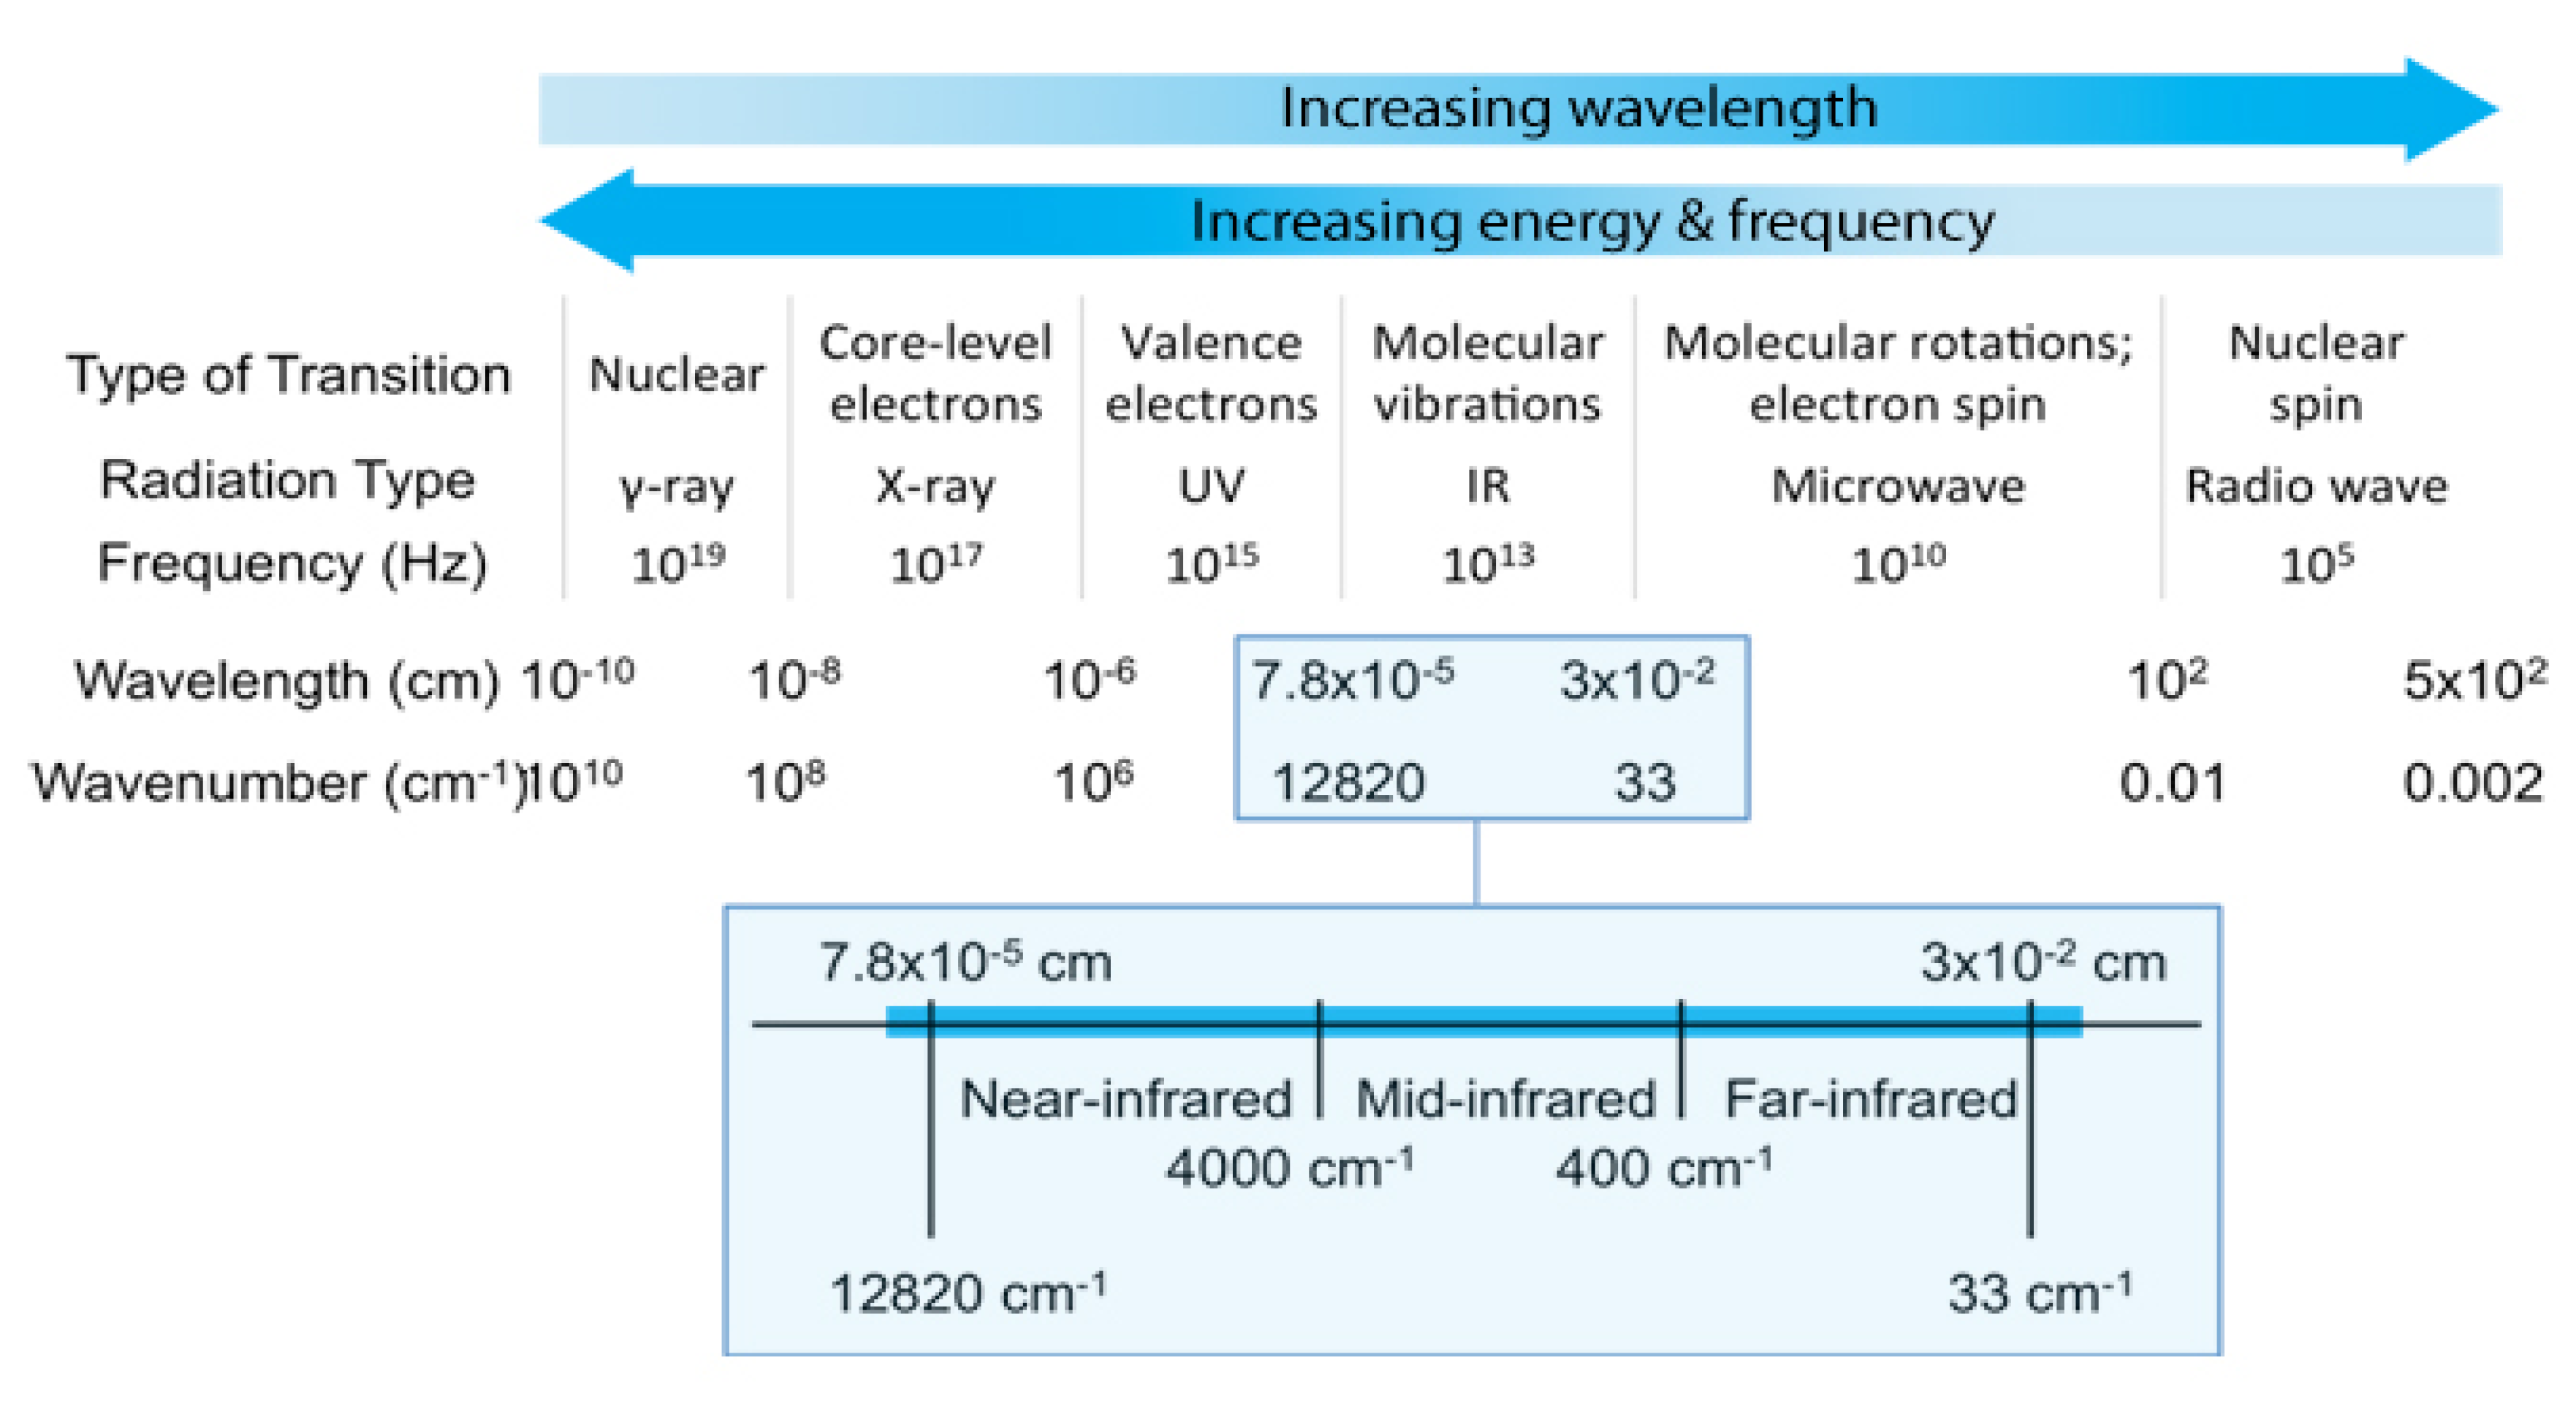
Spectroscopy is defined as the interaction between matter and radiation. The different types of interaction, as well as the affected modes (e.g., molecular vibrations, rotations) or elementary particles (e.g., core-level electrons, valance electrons) of the molecule, are given in Figure 1.
Whereas absorption of Ultraviolet (UV) and Visible (VIS) electromagnetic waves (200–780 nm) excites electrons to higher lying states, mid-IR (MIR) radiation (2.5–25 µm wavelength corresponding to 400–4000 cm−1 wavenumbers) stimulates vibrational motion in molecules. The absorption of energy of specific wavelengths results in a jump from the vibrational ground state to the first excited state (fundamental vibration). Vibrational motions involving hydrogen bound to a heavier atom (e.g., carbon, oxygen, or nitrogen) can also be excited via absorption of a multiple (excitation to second or higher excited states) or combination of the fundamental wavelengths (so-called overtones or combination modes). These higher-energy transitions fall in the near-IR range of the electromagnetic spectrum, with wavelengths of 800–2500 nm (4000–12,500 cm−1) [15].
Vibrational spectroscopy includes several different techniques, the most important of which are mid-infrared and Raman spectroscopy which are mainly used for identification of organic (e.g., polymeric) and inorganic (minerals and semiconductors) materials, respectively.
IR and Raman spectroscopy are based on the excitation (IR: Absorption, Raman: Inelastic scattering) and detection of characteristic fundamental vibrations that can be used to elucidate molecular structures (material identification) [16]. Although some vibrations may be active in both, Raman and IR spectroscopy are complementary techniques as these two forms of vibrational spectroscopy arise from different processes and obey different selection rules [17]:
- IR-spectroscopy is based on the direct absorption of photons
- Raman spectroscopy is based on inelastic scattering of photons
Whereas both methods probe molecular vibrations, in general, Raman spectroscopy, symmetric vibrations of nonpolar groups can be detected with high intensity, while IR spectroscopy is very sensitive to asymmetric vibrations of polar groups [16].
NIR spectroscopy: NIR vibration bands are based on molecular overtone and combination vibrations and are usually very broad and overlapping. Since there are no unique, easily attributable single vibration absorption bands, a multi-wavelength approach is mostly used to reveal the information contained in the overlapping bands of the NIR spectra, and chemometric is one key to it [17]. Based on multivariate statistics, chemometric relies on linear algebra techniques such principle component analysis (PCA) to allow qualitative and quantitative predictions of concentration, identity, and quality [18].
UV-VIS spectroscopy is a spectroscopic technique that relies on the interaction of UV- and/or visible light with matter (in specific with the valence electrons of atoms). When the sample containing species absorbs light in the UV to visible range, the absorption relates to the excitation of the valence electrons from a ground state to an excited state. This method is less useful for material identification, but can be used, e.g., to determine degradation induced color changes, specific absorbance (quantification of additive concentrations), or—when applied in the fluorescence mode with a monochromatic excitation light source—the presence of fluorophores (often precursors to polymer degradation, e.g., the encapsulant).
2.2. Mobile Devices for Onsite Use
Until recently, handheld spectrometers were mainly offered by the major analytical and security instrument companies, which provide turnkey analyzers using spectroscopic techniques such as X-ray fluorescence for elemental analysis (metals) and Raman, MIR, and NIR for molecular analysis (mostly organics) [15]. The introduction of specific fiberoptic probes allows for the separation of the spectrometer and the location of sample measurement (suitable for infield measurements, used for Raman, UV-Vis, and NIR) [19].
Although mobile devices are already in use for fast material identification in safety and security applications (immediate application in emergency response for hazardous materials), nondestructive material analysis of large construction parts (e.g., sealing, coating, or fitting on a huge production machine) or precious samples (e.g., identification of paint on ancient canvas), no application of such spectroscopic devices in PVs has been reported so far. With regard to the term “Spectral Characterization of Photovoltaic Devices”, spectral characterization techniques used to evaluate their efficacy in using the maximum of energy from the sun and artificial sources of light [20] is meant. However, as described in detail in the IEA PVPS Task 13 report on “Assessment of Photovoltaic Module Failures in the Field” [21], many PV module failure modes are related to unfavorable material interactions or material degradations. Thus, recently, several researches active in failure analysis of PV modules, e.g., [7,22,23,24,25,26,27], started transferring the technically mature portable spectrometers (IR, Raman, NIR) to this different field of application and applied them for nondestructively
- determining the chemical identity of polymeric materials incorporated in PV modules,
- validating the bill of materials (BOM) of PV devices, and
- documenting the aging effects of polymeric materials (i.e., encapsulation, backsheet).
This allows for direct material analysis in the field without dismantling PV modules, transporting them to the lab, cutting them in smaller pieces, and analyzing them in conventional bench-top spectrometers.
2.3. Detectable Sample Volume/Penetration Depth
In this respect, it should be emphasized that the nondestructive infield IR measurements are always performed in reflectance mode and direct contact of the measuring head. The Attenuated Total Reflection (ATR) crystal, with the sample surface, is required. Consequently, IR-spectra can only be recorded of accessible materials, e.g., surfaces of backsheets or frontsheets. Whereas reflection measurements in the MIR region only have an analytical depth of 1–2 µm (surface sensitive measurement) [15], NIR has a much higher penetration depth of several millimeters in polymeric materials [18,23]. Thus, the recorded spectra can contain spectroscopic information of several thin layers of a multilayer foil (e.g., a backsheet).
In contrast, Raman measurements can be performed contact-free and, with a suitable probe provided, the polymeric material located behind a transparent frontsheet (glass) can be identified (e.g., the encapsulant in a PV module) [15,25,26,27] or the spectra of the interface solar cell/encapsulant can be recorded (confocal measurement method [25,28]).
3. Results and Discussion
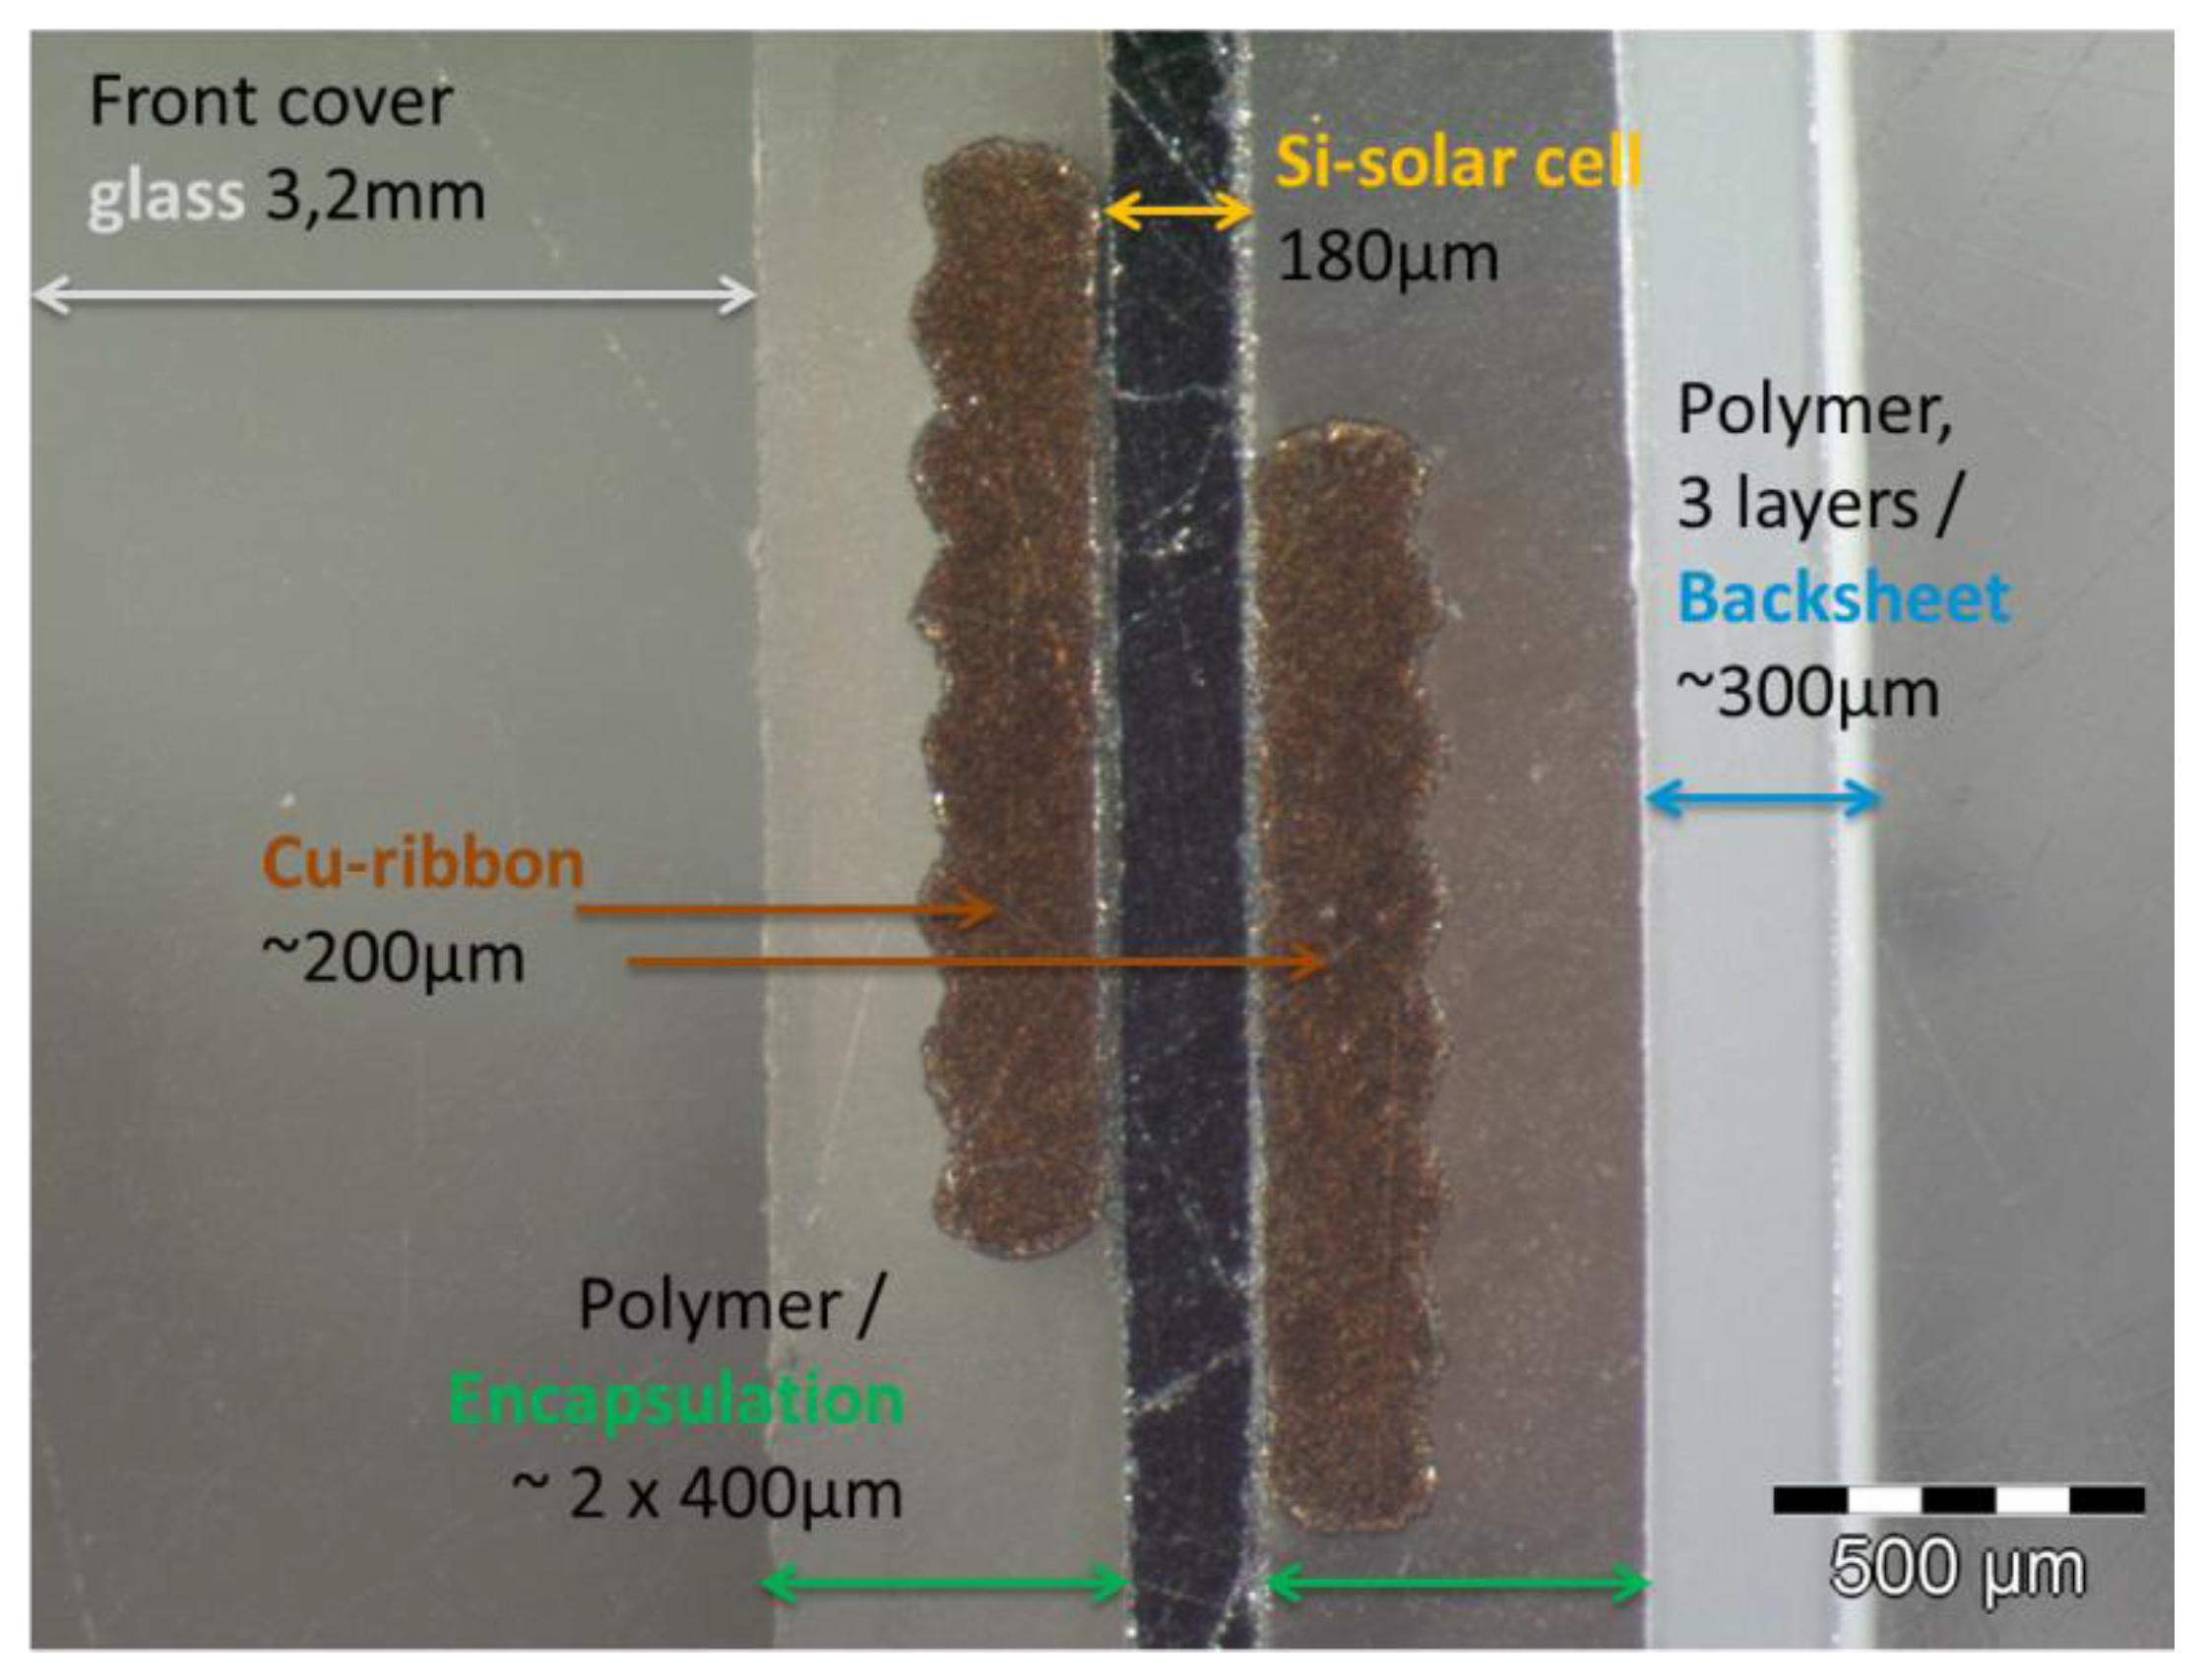
In the following, the first results of the application of mobile MIR, NIR, and Raman spectroscopic devices for the nondestructive identification of the chemical composition of polymeric encapsulants and backsheets within of a PV module are given. As PV modules are multi-material composites (cross-section of a module given in Figure 2), the polymeric encapsulant can only be analyzed nondestructively through the transparent front glass cover, which can be done by Raman spectroscopy. The air side of the multilayer backsheets can be analyzed by IR and/or Raman spectroscopy, and the identification of all polymer layers involved in the multilayer stack of a backsheet can be analyzed in situ by NIR spectroscopy.
In the first step, a database with reference spectra of all available encapsulant and backsheet samples was built up for all three spectroscopic methods (described in Section 3.1). Then, nondestructive spectroscopic measurements were performed on several types of test modules in the laboratory (summarized in Section 3.2). Finally, the mobile devices were tested on field-aged PV modules in PV plants (examples given in Section 3.3).
3.1. Databases of Encapsulants and Backsheets
3.1.1. Encapsulants
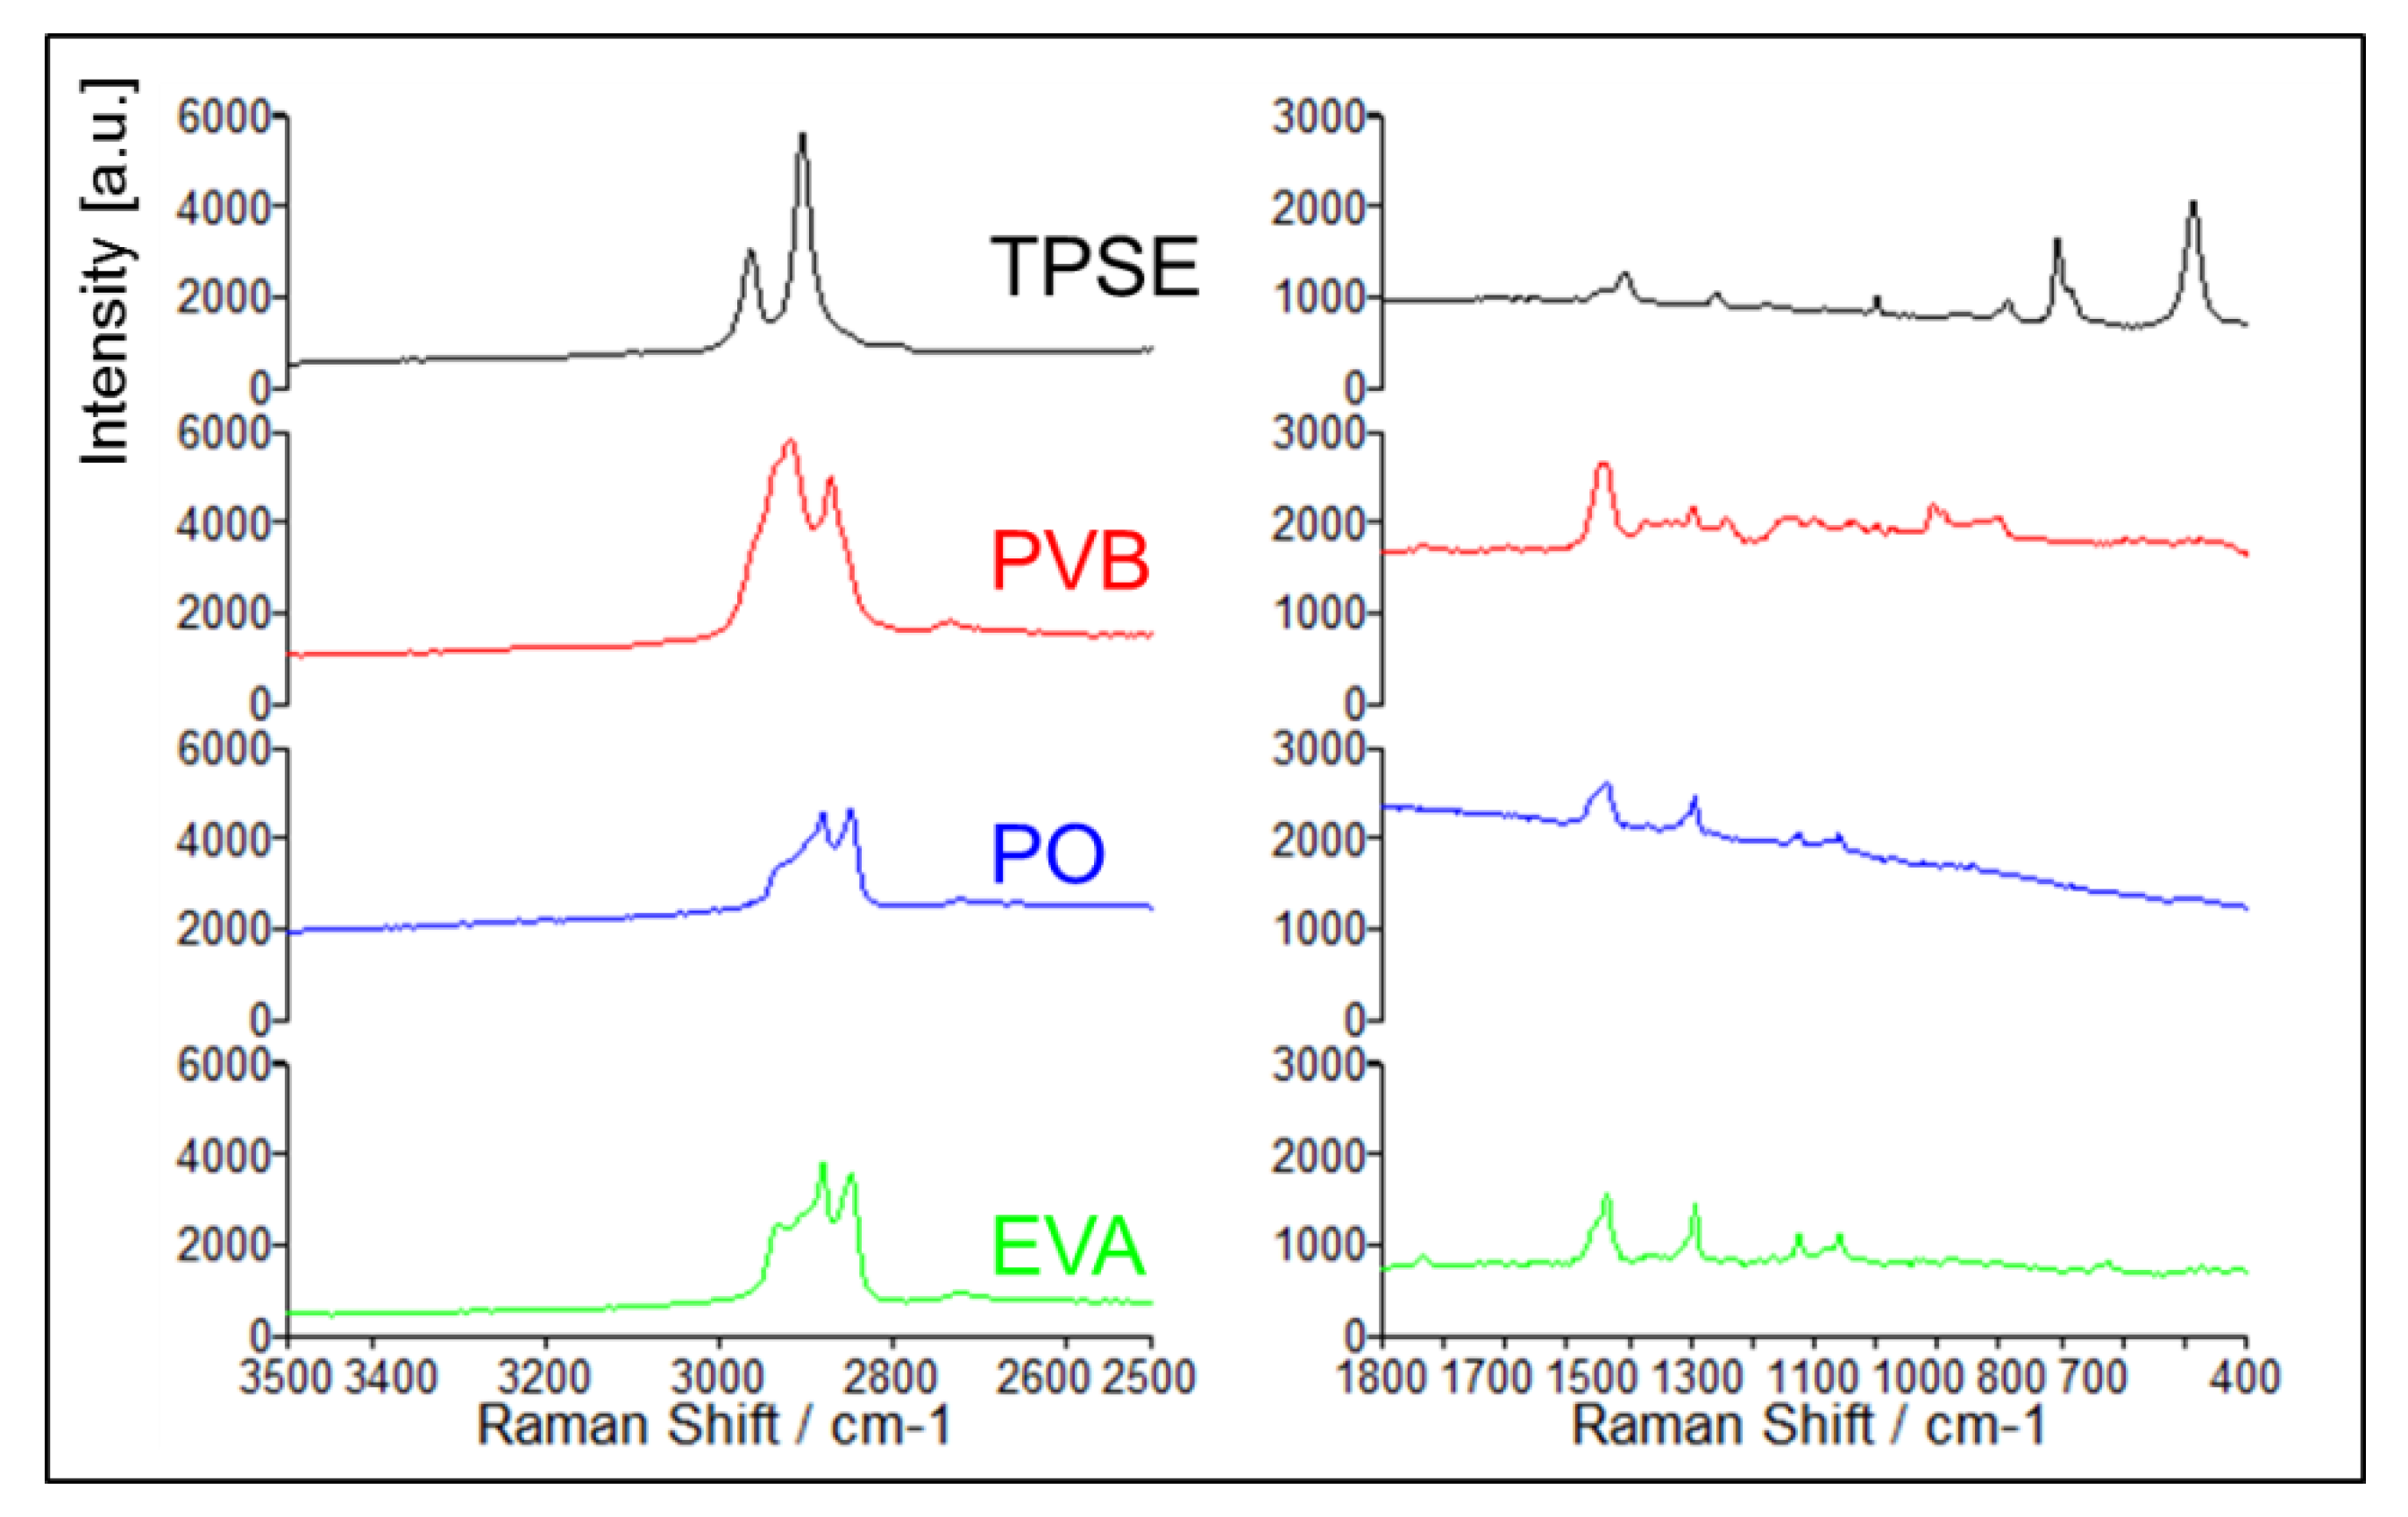
In order to be able to identify the polymeric encapsulants within PV modules no destructively, a Raman database comprising of 60 encapsulants available on the market was generated:
- Ethylene-vinyl-acetate/EVA (18)
- Polyvinyl-butyral/PVB (6)
- Ionomer/ION (5)
- Polyolefin/PO (15)
- Thermoplastic Polyolefin/TPO (14)
- Thermoplastic silicon elastomer/TPSE (2)
Typical Raman spectra are given in Figure 3. For these measurements, a portable Raman spectrometer type I-Raman from B&W Tek [29] with a green laser (532 nm), a fiber optic probe and a specially designed distance sample holder (for distances of 2.5 mm, 3.6 mm, and 5 mm) was used. Additionally, a XYZ positioning stage probe holder was available for the measurements in the laboratory and an optional zoom-adapter lens for larger working distances (20–60 mm), as well as a Li-accumulator as power supply for the measurements in the field. The database was generated within the multivariate analysis and identification software BWID® after acquisition using software BWSpec®, all by B&W Tek.
As can be seen in Figure 3, a clear distinction of the most frequently used types of encapsulants is possible. EVA and Polyolefin spectra were distinguishable by the presence/absence of the carbonyl band of the acetate group of EVA at 1740 cm−1 (which was not very intense in the Raman spectra) and the deformation vibration of the acetate at 640 cm−1 [25]. Polyolefins PO and TPO were not distinguishable by their Raman spectra.
3.1.2. Backsheets
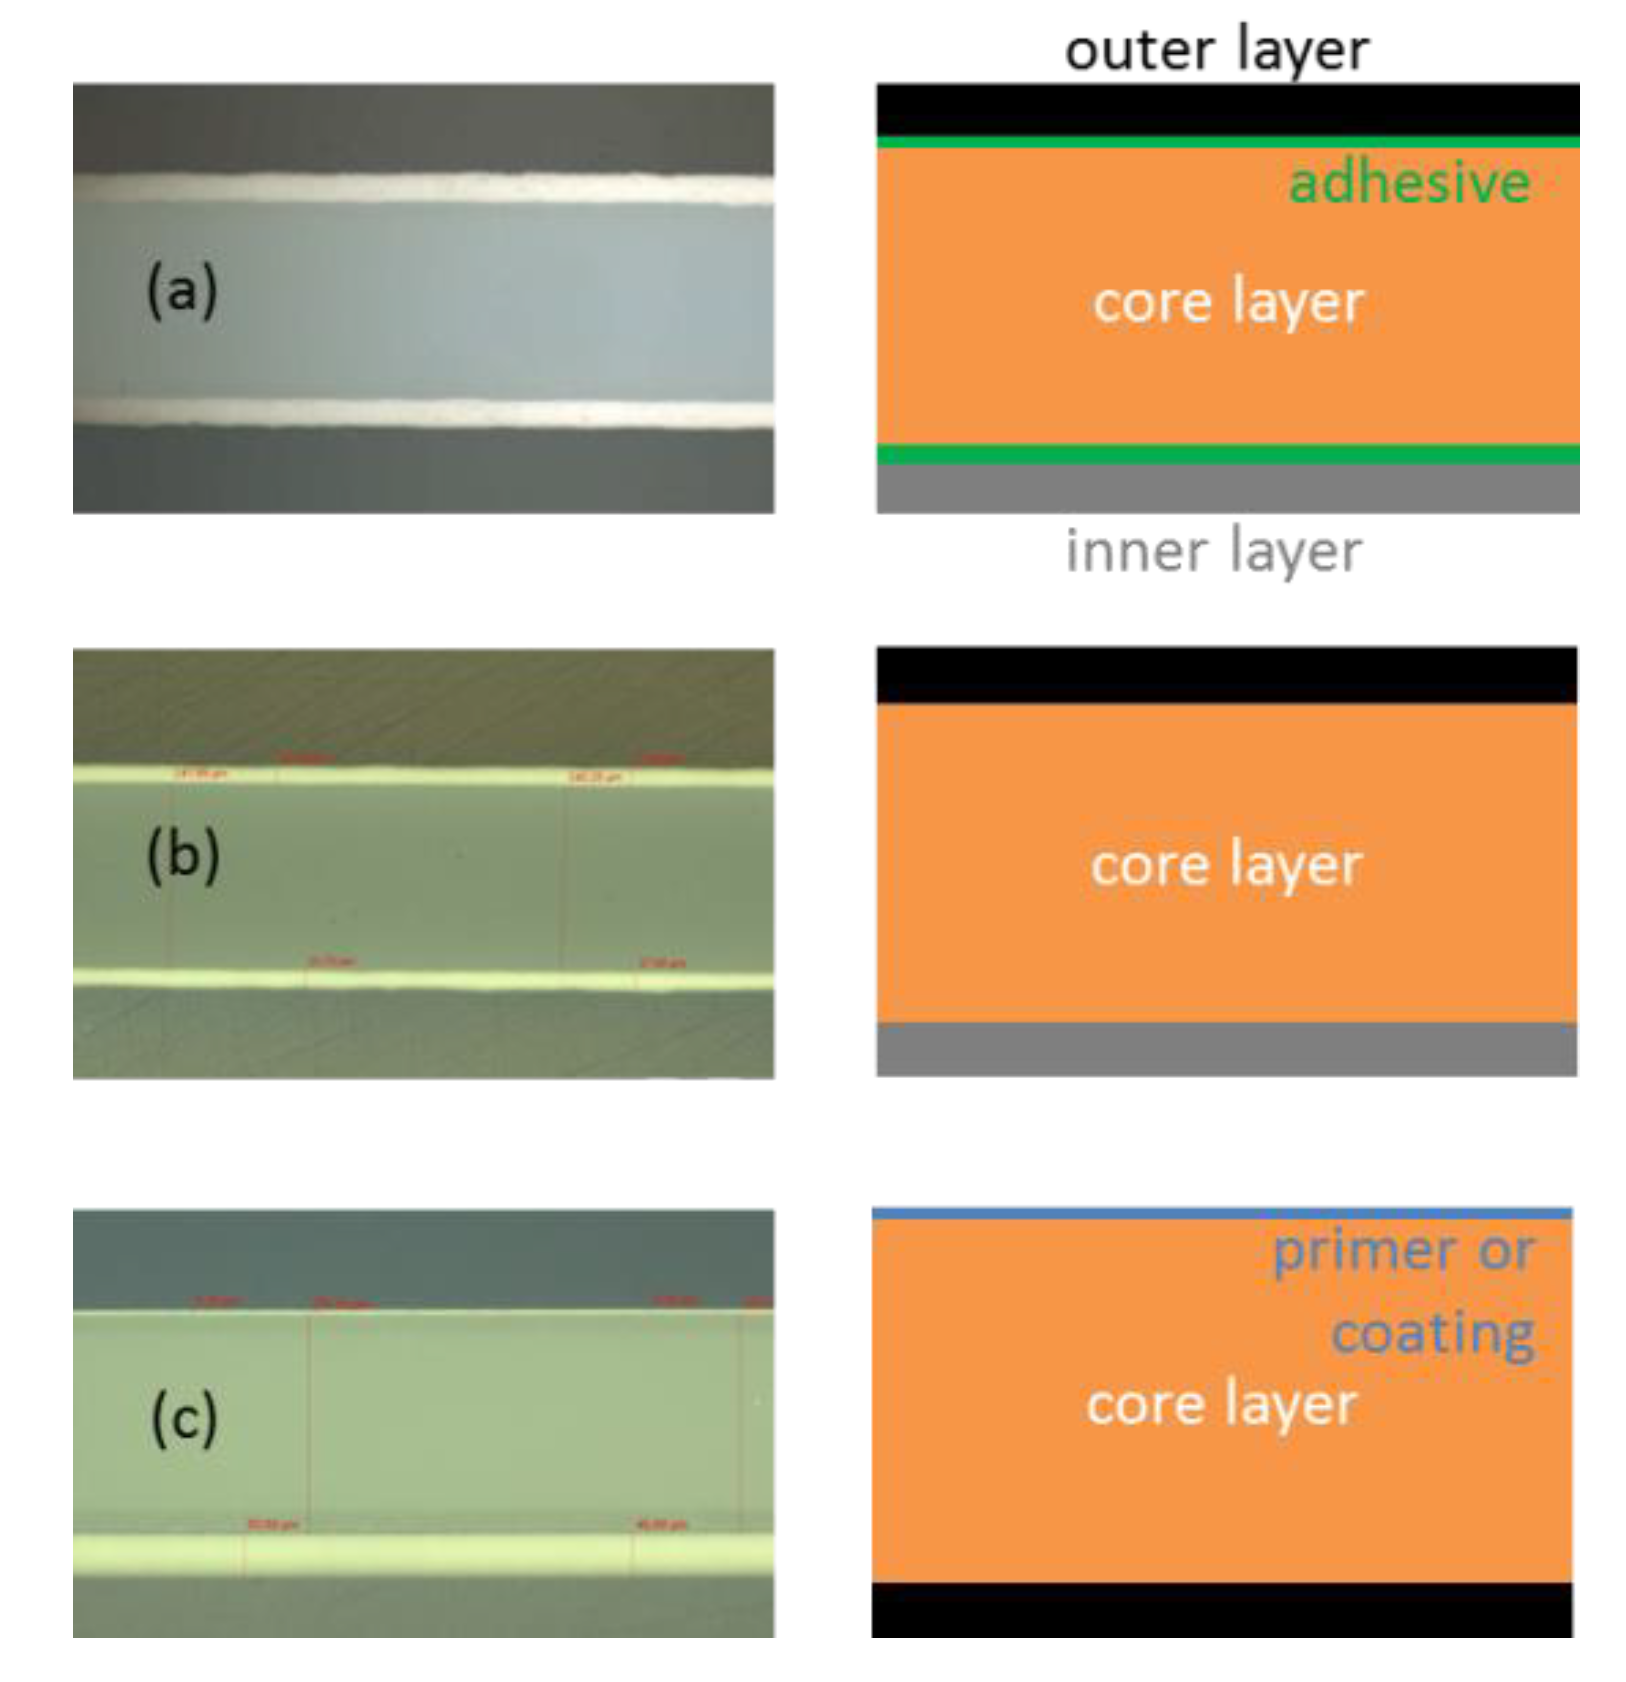
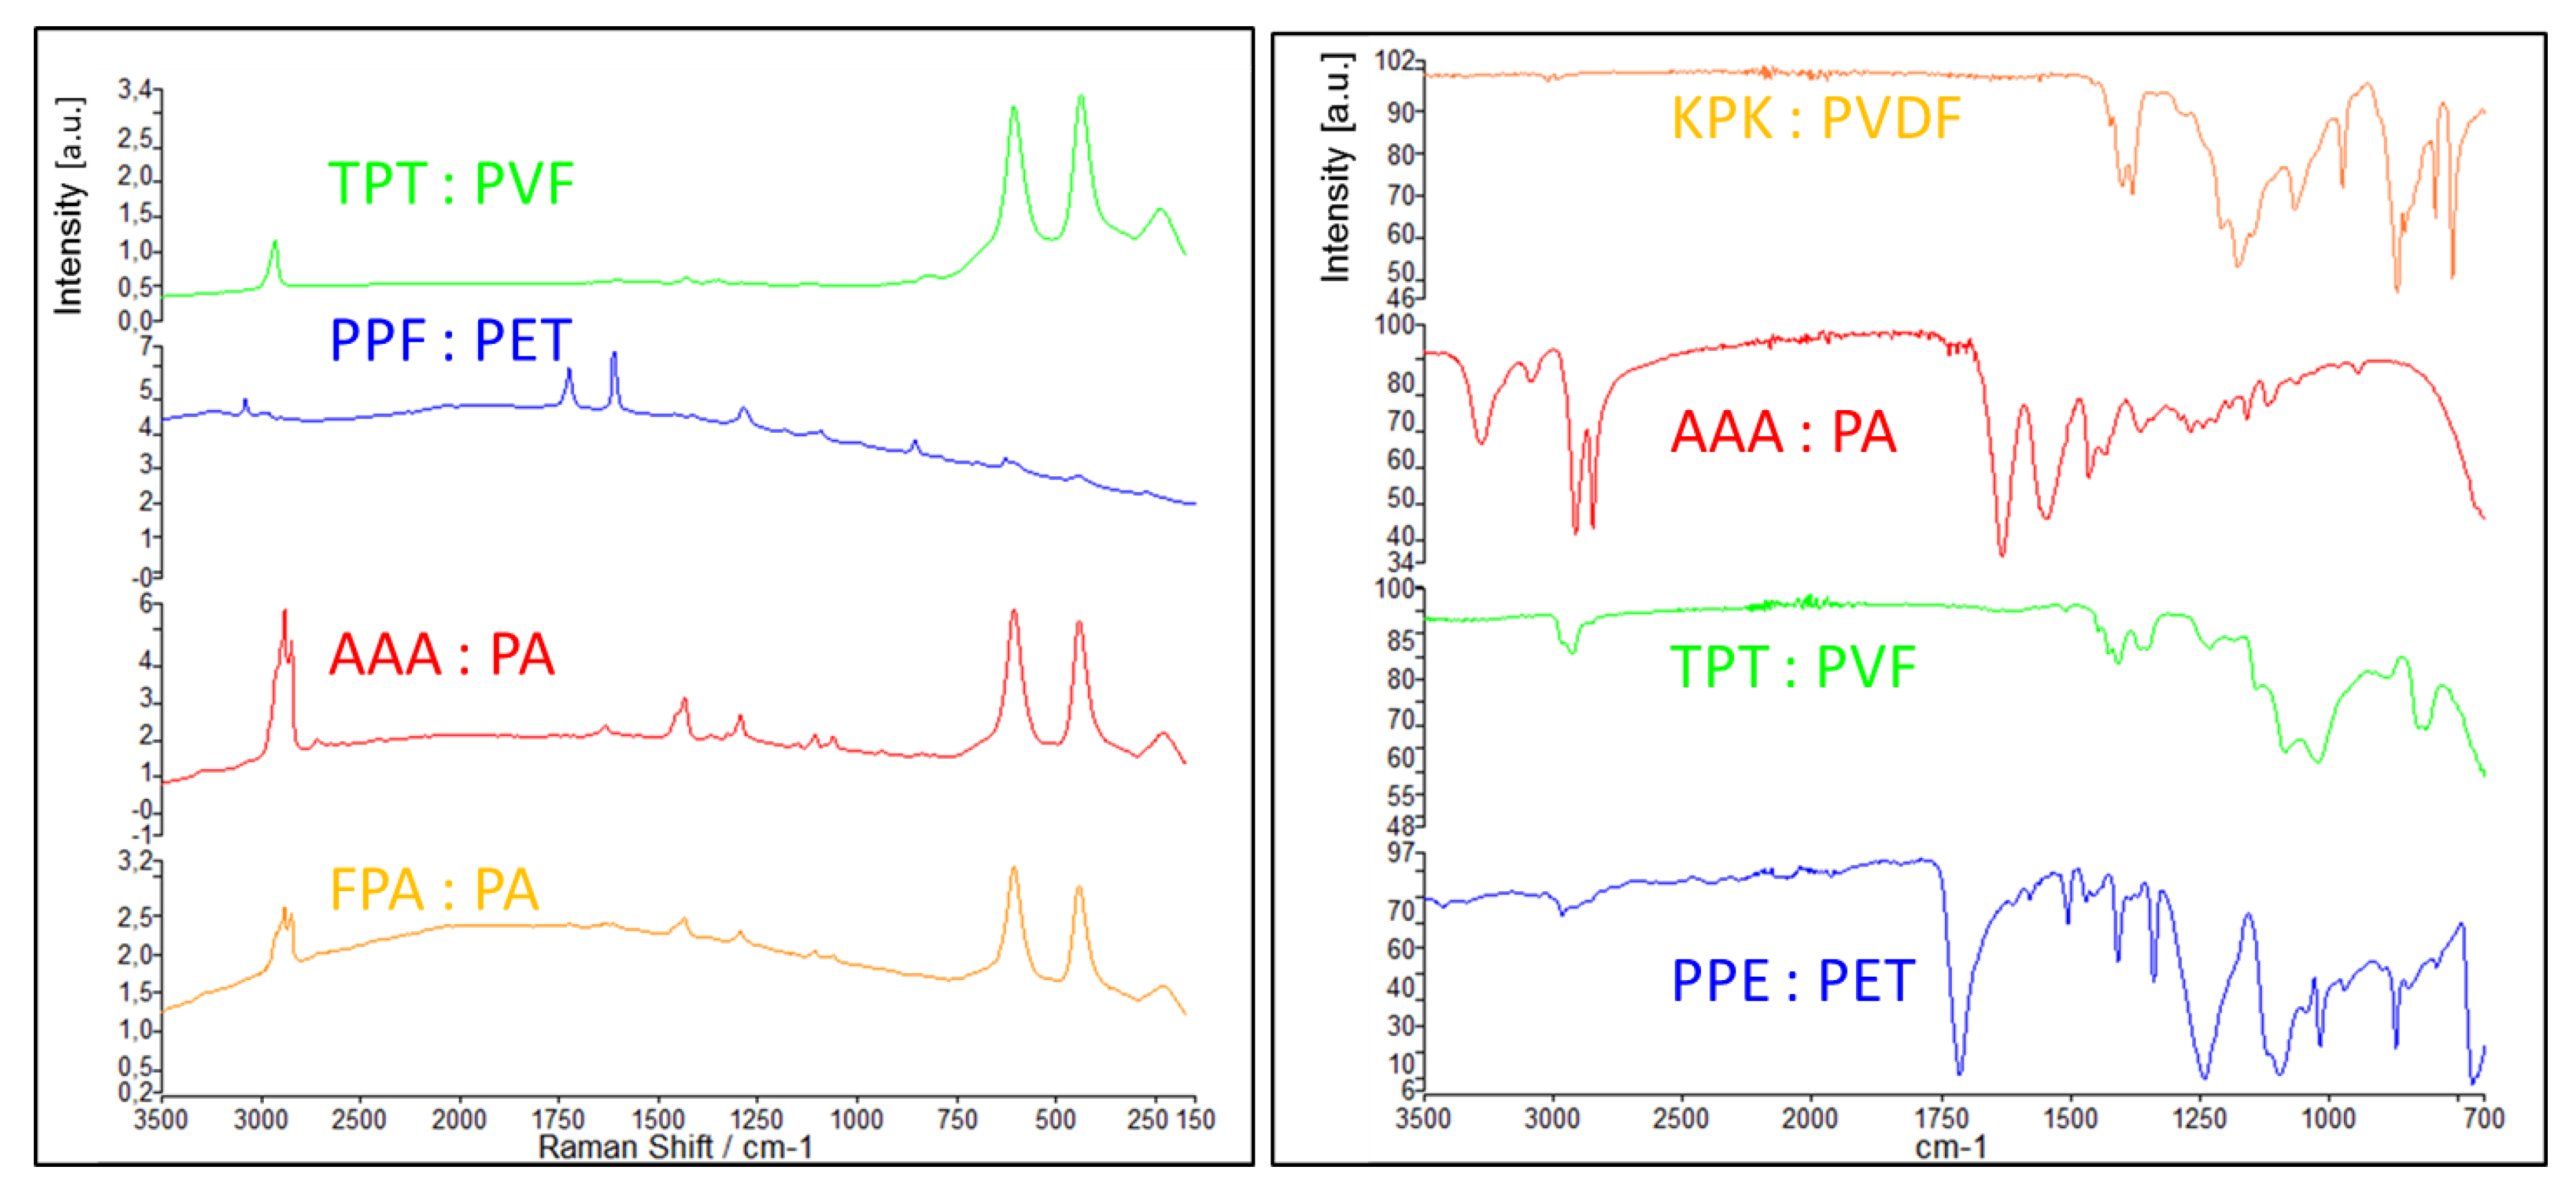
In order to identify the chemical composition of multilayer foils which are used as PV backsheets of PV modules, Raman, IR (outer surface), and NIR (whole stack) spectroscopy were used. Thus, databases with all three spectroscopic methods were built up with more than 50 backsheet types available in the market. Laminates (outer layer/adhesive/core layer/adhesive/inner layer), coextruded backsheets, and coated core layer backsheets (see Figure 4) with varying chemical composition were selected. The following codes were chosen for the individual layers: A = PA, E = PE, K = PVDF, O = Polyolefin, P = PET, T = PVF, V = EVA; R = Primer, C = Coating. For each backsheet, a three-letter code was used, then, e.g., TPT for a PVF-PET-PVF laminate (named Tedlar-backsheet).
The IR spectra were recorded in the attenuated total reflection (ATR) modus using a portable FTIR-System Type EXOSCAN from A2 Technologies (diamond ATR-crystal) [30]. A Li-accumulator was used as power supply for outdoor measurements, and an optional docking station was available for laboratory measurements on small-scale samples. The database was built up within the acquisition software MicroLab®. The Raman spectrometer used is described in Section 3.1.1. Examples for Raman and IR spectra of the air side of typical backsheet types are given in Figure 5. It is evident that with these surface sensitive measurements, only the outer layer is detected, and an additional method is needed to identify the composition of the core and inner layer. This can be done by NIR spectroscopy.
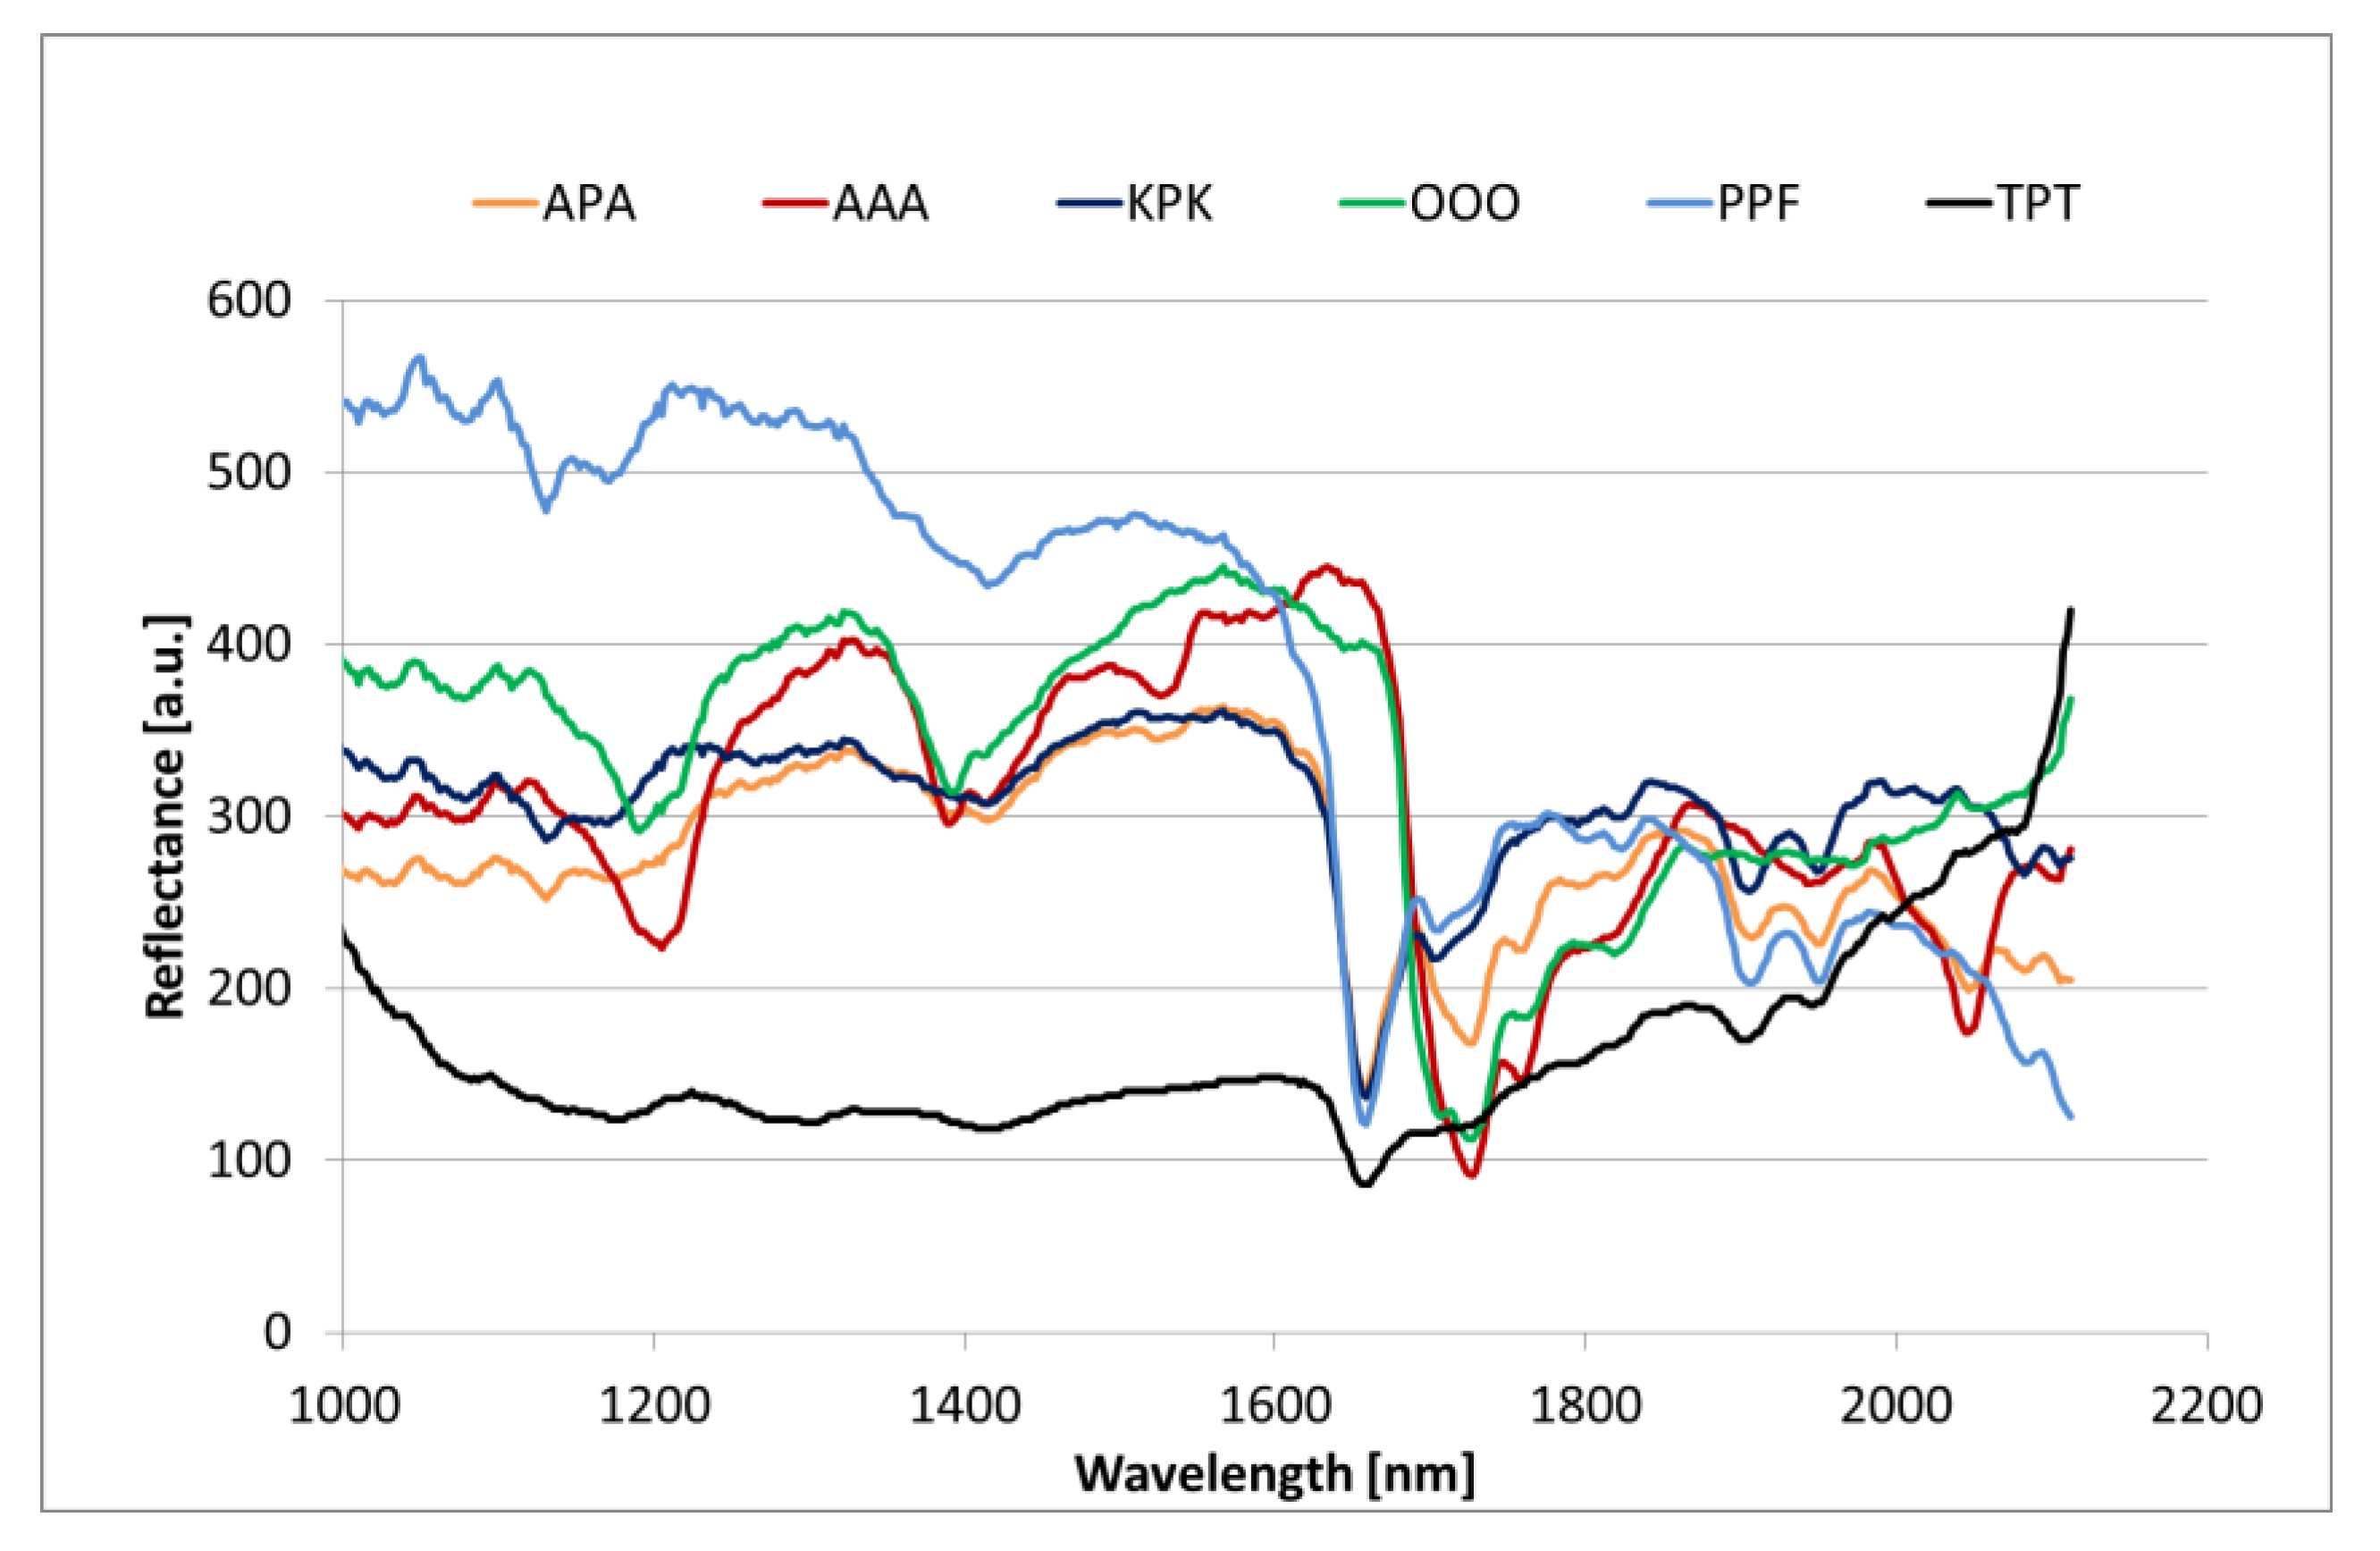
The mobile NIR spectrometer used was a NIRQuest from OceanOptics equipped with a fiberoptic probe (reflection mode) [18,31]. The database was built up with the multivariate analysis software OPUS® (by Bruker). Examples of NIR spectra of backsheets (without lamination) to an encapsulant are given in Figure 6. All backsheet types containing a Polyester (PET) core layer—APA, KPK, TPT, and PPF—showed absorption at 1650 nm, while the coextruded Polyolefin OOO and Polyamide AAA backsheets containing a Polyamide 12 (polyolefin chain with a polyamide function) or a fully polyolefin core layer had the strongest absorption at 1717 nm. The backsheet type APA showed both strong absorptions as it as a PET core layer and Polyamide outer and inner layer (see Figure 6). Thus, it is possible—with the aid of a database search—to identify the complete backsheet layer stack by a nondestructive NIR spectroscopic measurement.
3.2. Nondestructive Measurements on Test PV Modules
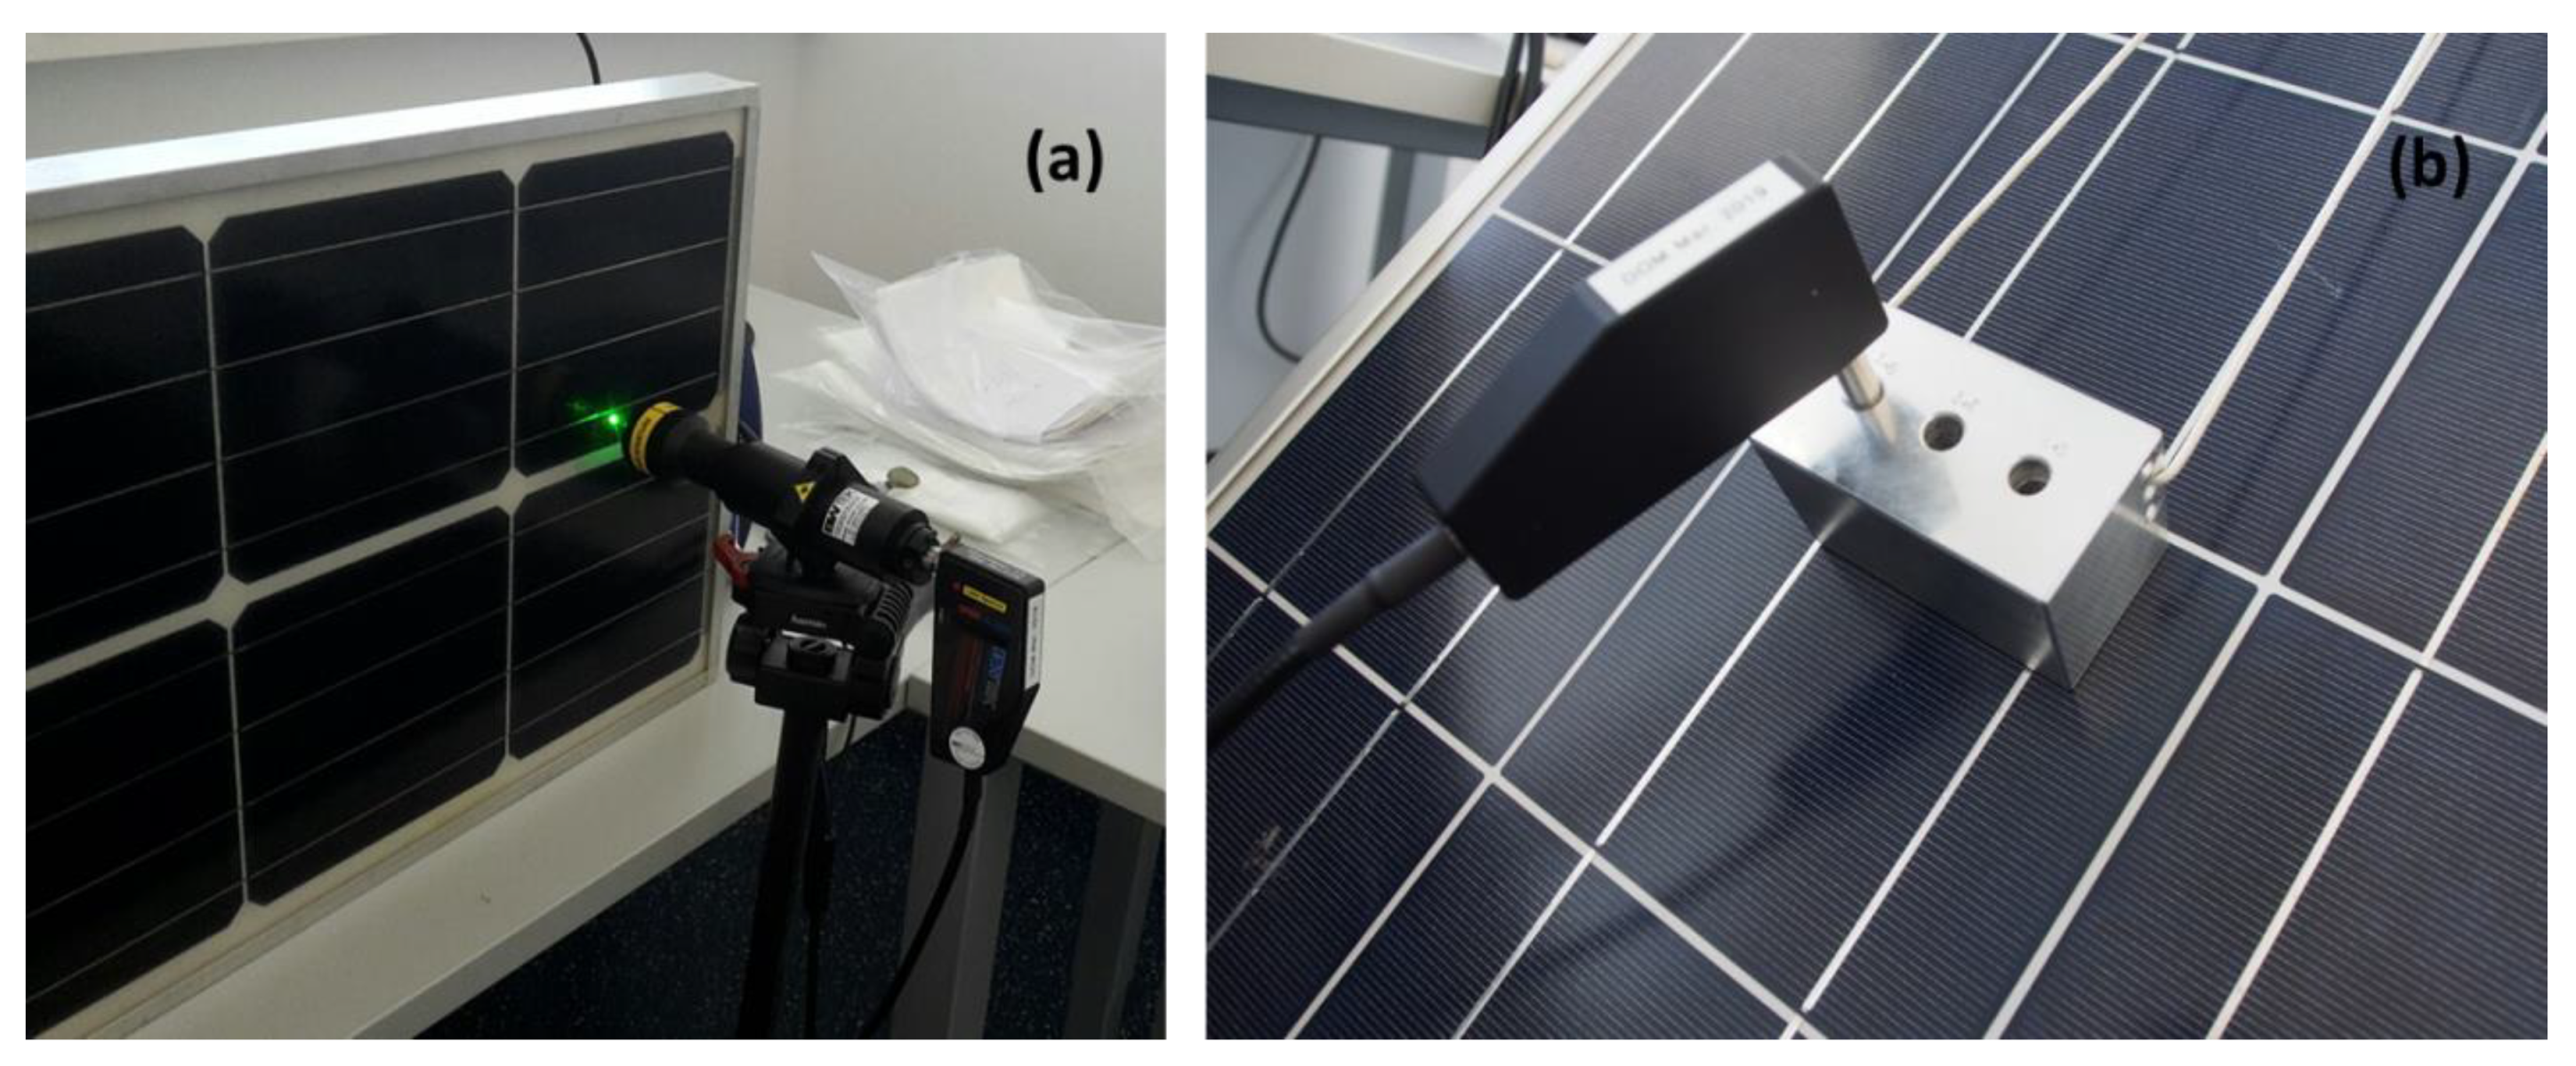
In the next step, the measurements were extended from isolated polymeric components (encapsulant and backsheet films) to multi-material composites of manufactured PV test modules. With the measurement of the backsheets with the handheld ATR-FTIR spectrometer, the Raman Probe and the NIR probe worked very well without additional constructive requirements. However, a special sample holder device had to be constructed for the confocal Raman measurements of the encapsulant through the 3.2-mm glass (see Figure 7) in order to allow for localized measurements within the encapsulant layer. A second possibility to achieve this is the use of a zoom-adapter lens with variable focal length (from 20 mm to 60 mm) for the Raman probe, as different working distances can be used with this advice. Focusing to the layer of interest, however, is a time-consuming process with this device. Consequently, all further measurements were performed using the easy-to-handle sample holder device.
Nondestructive identification of the encapsulant and backsheets of unaged test PV module samples worked very well using the generated databases. Although is always possible to chemically identify the material class of the encapsulant or the backsheets, it was not possible to distinguish by database research between encapsulant films, e.g., EVA of different providers. The spectroscopic differences resulting from varying vinyl acetate content or different additives included were too small to be significant in the lower-quality spectra recorded through the 3.2-mm (mostly structured) glass layer of PV modules.
3.3. Measurements on Field-Aged PV Modules
The ultimate challenge was to nondestructively identify the bill of materials of multiannual field-aged PV modules. One important issue is the fact that the surface layers of polymeric films degrade under the influence of environmental stress impact and, thus, the oxidation, hydrolysis, and/or degradation of the polymer chains might occur and change the spectra obtained. These effects can best be registered with IR spectroscopy, as this method is very sensitive for the detection of polar groups like carbonyl and hydroxyl groups.
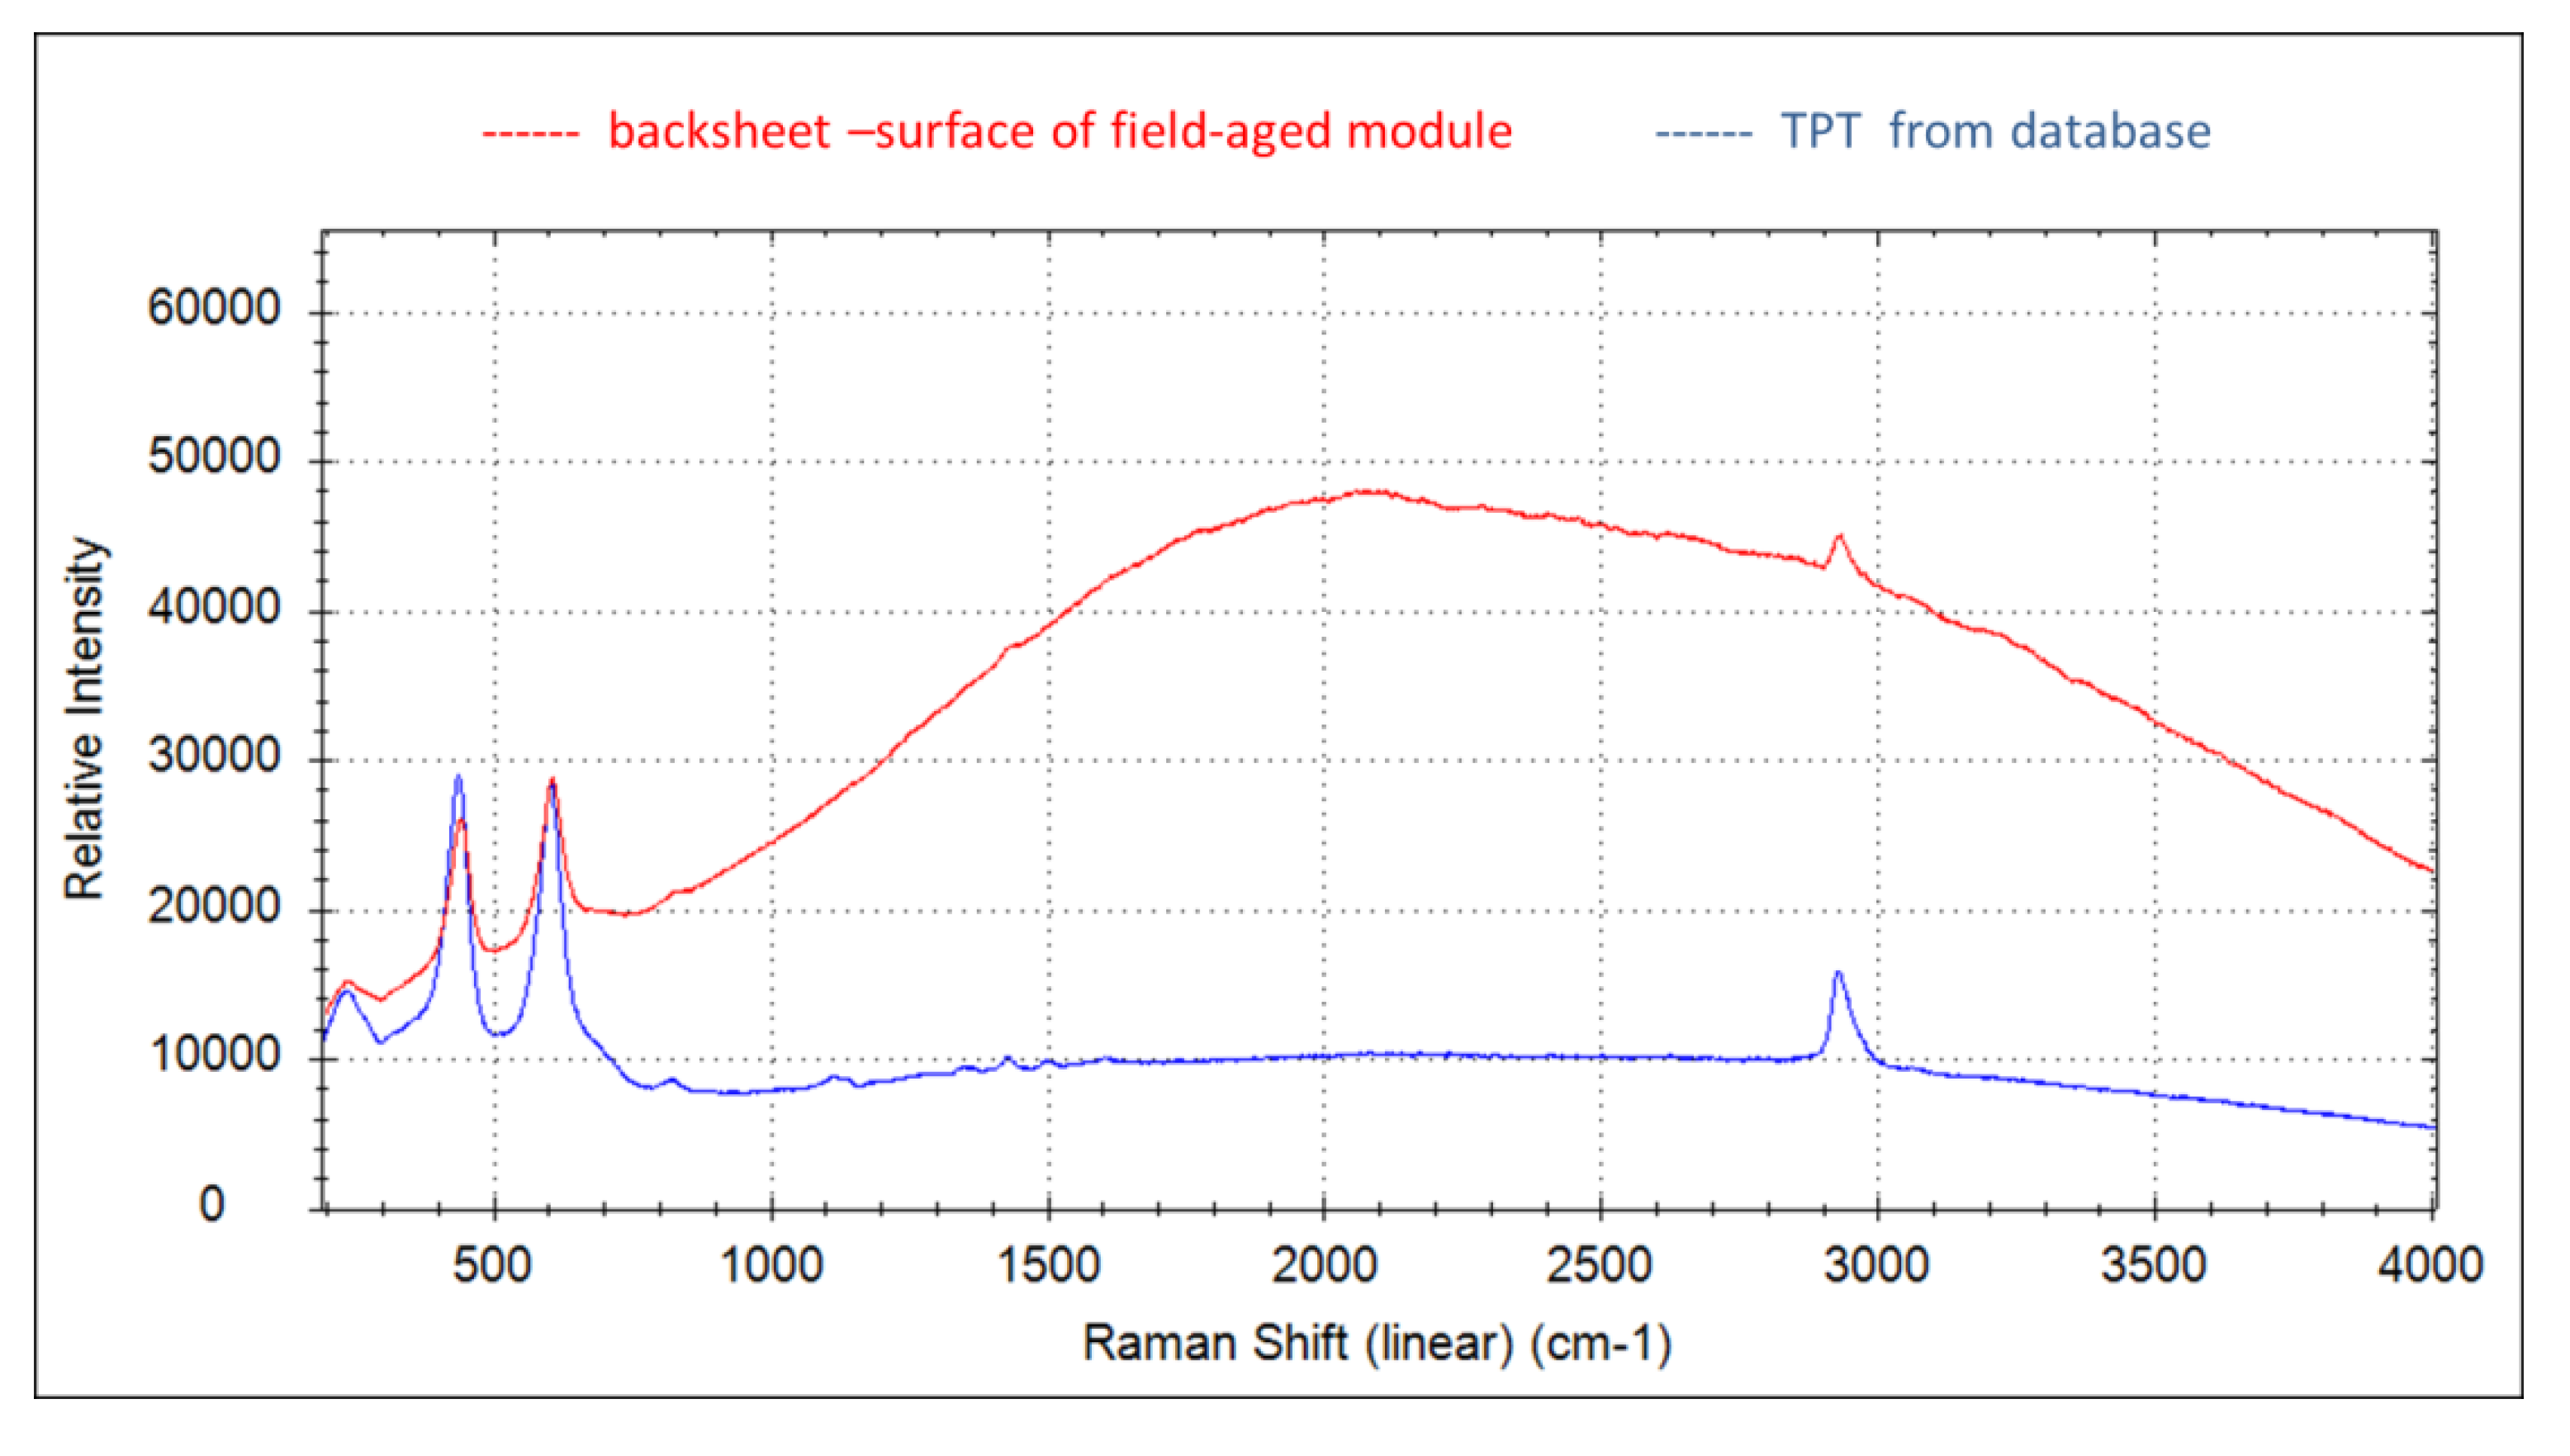
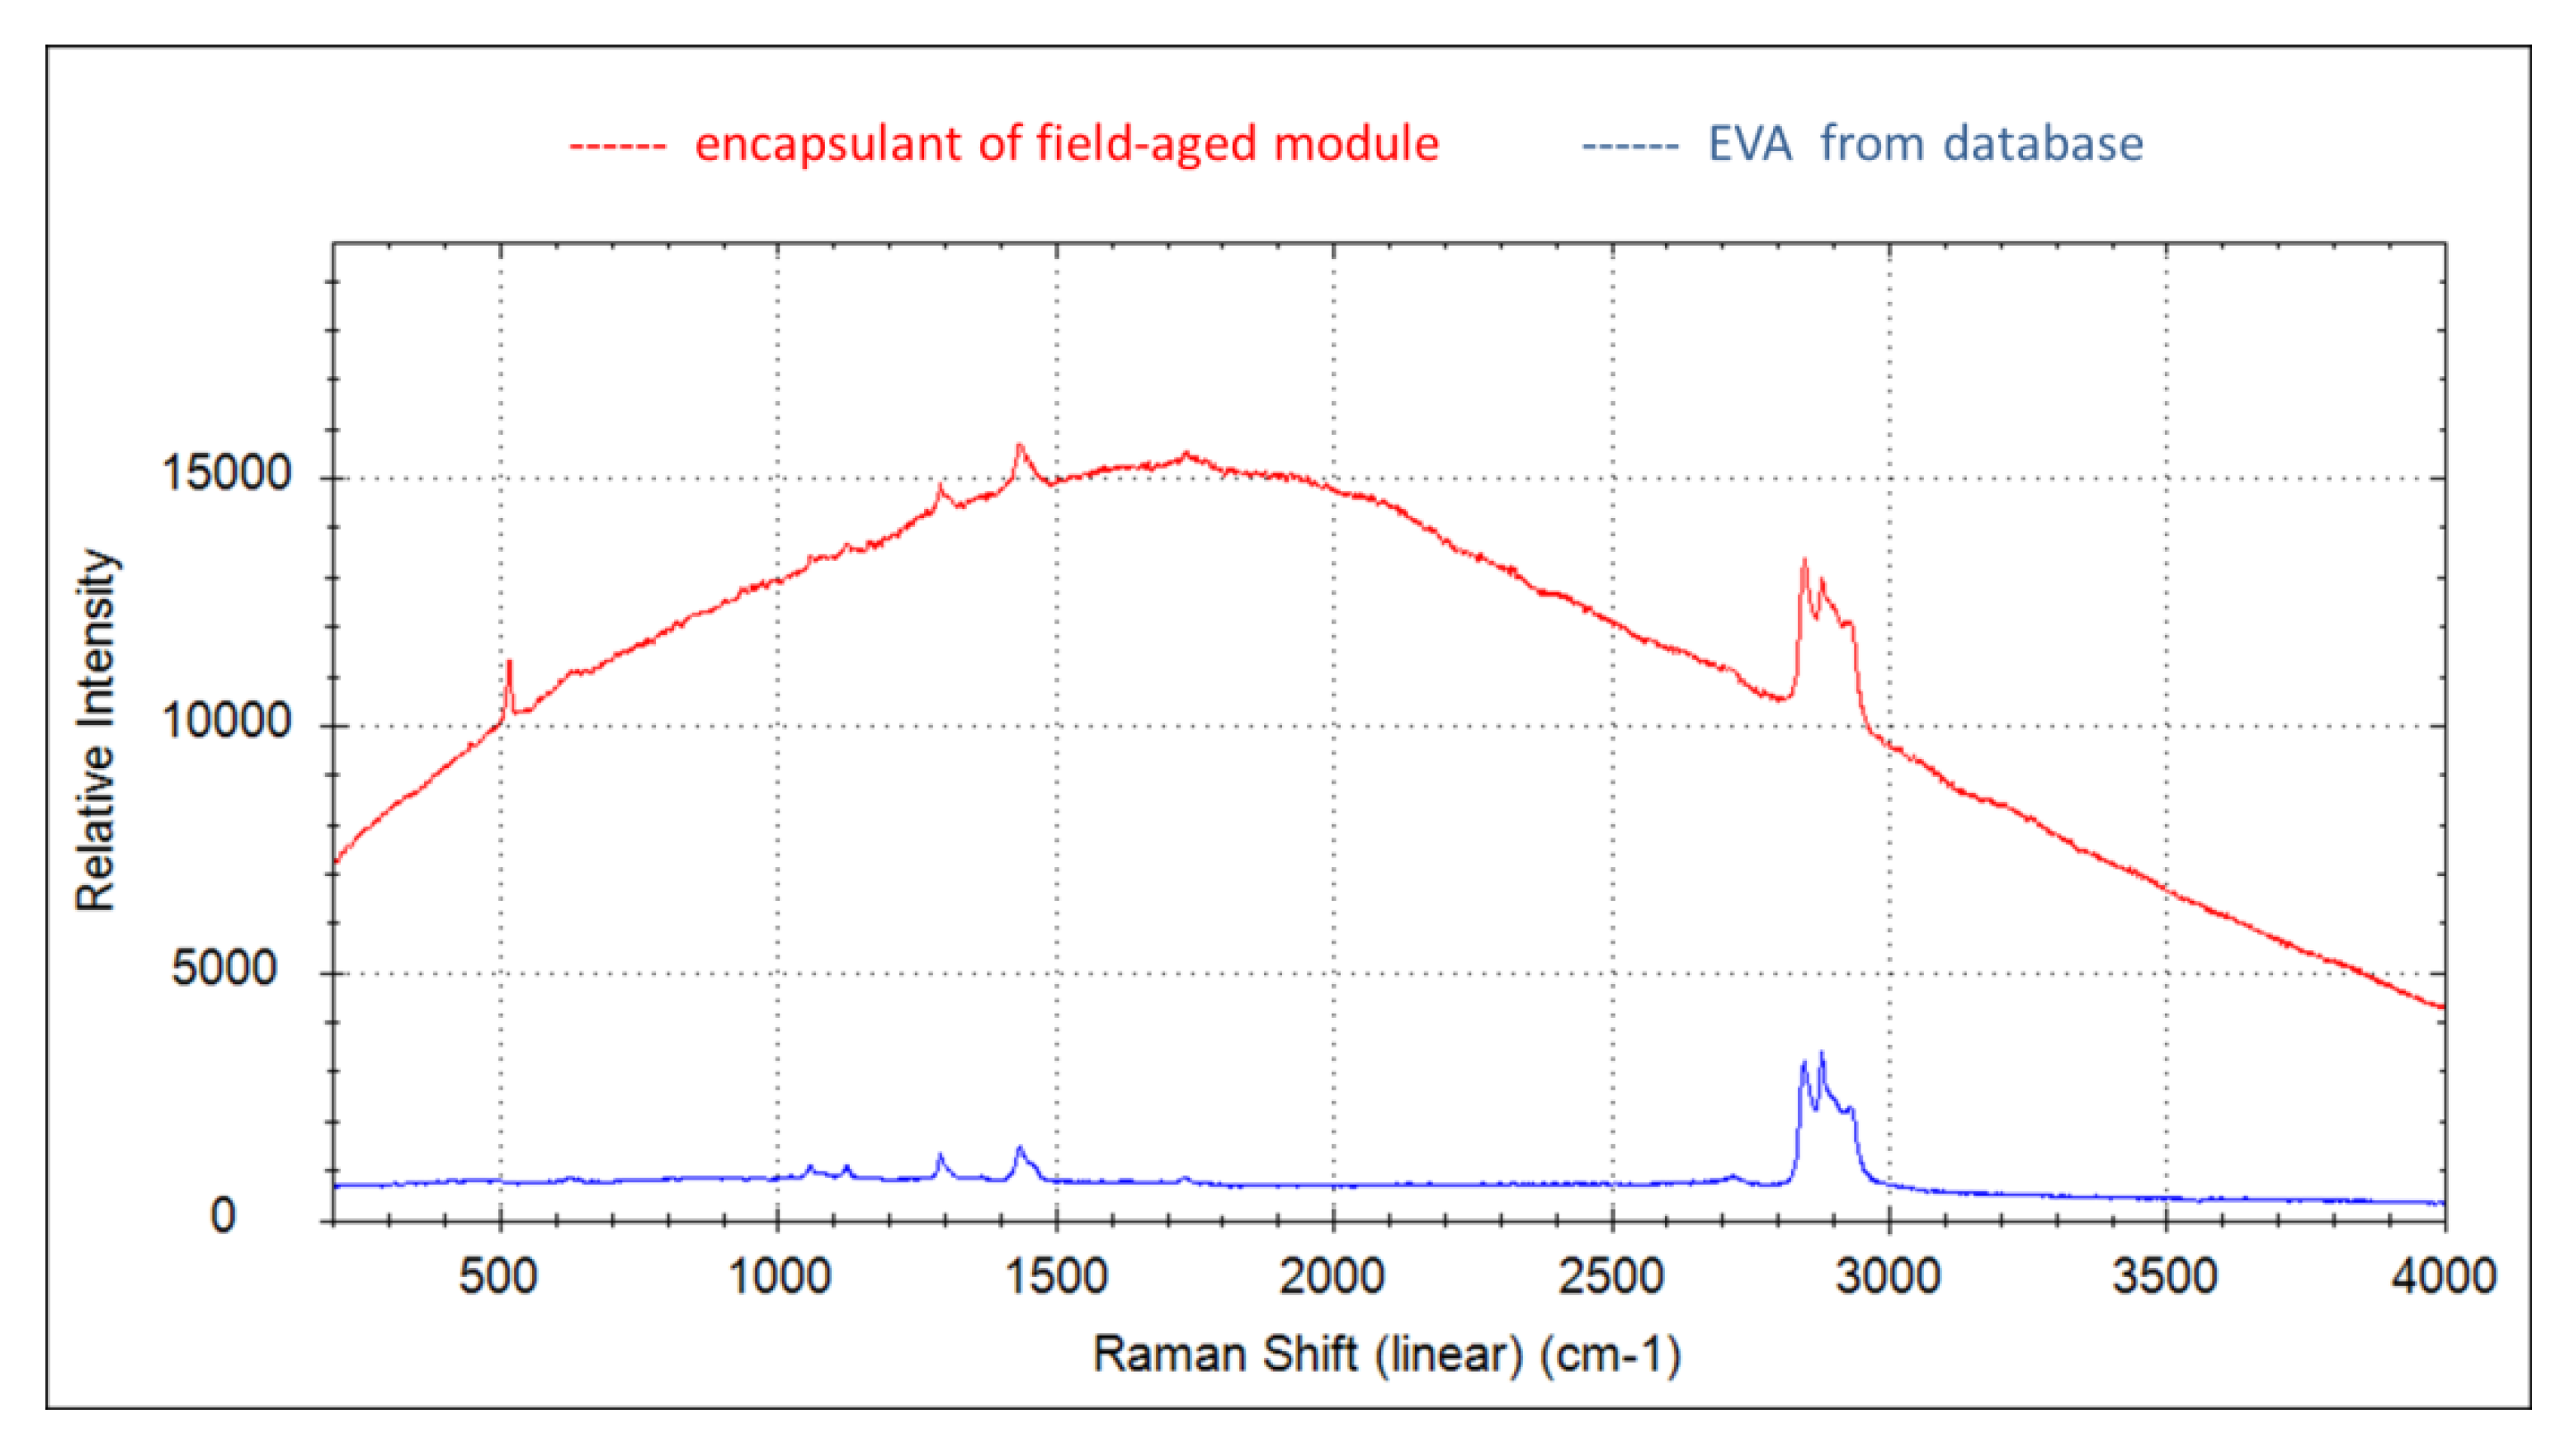
The second problem is the appearance of aging-induced fluorescence of the weathered polymers in the Raman spectra (see Figure 8 and Figure 9). This can strongly affect the detectability of specific absorptions and, thus, impede the assignment of the measured spectrum to the reference spectra stored in the database. As example, the Raman spectra of the backsheet and encapsulant of a 30-year field-aged PV module and the corresponding hit from the database are shown in Figure 8 and Figure 9, respectively. The increasing fluorescence was caused by increasing concentration of fluorophores upon aging and originated from degradation products of the polymer and/or the additives within the polymer. A detailed review on this topic was recently published (see [32] and the references given therein).
A beginning degradation of the environmental side of the backsheet is often only limited to the outer surface 1–10 µm and has no effect on (i) the integrity of the module laminate or (ii) the electrical performance of the PV modules. This is the case in the example of the 30-year field-aged PV module with TPT (Tedlar) backsheets and EVA encapsulants as given in Figure 8 and Figure 9.
On the other side, material degradation effects can also have severe impact on the performance of a PV plant. One well-known example is the formation of different types of cracks in Polyamide (PA)-based backsheets observed in several PV plants within the last years. One type of cracking (micro-cracks) [24] showed beginning material degradation (oxidative degradation) on the environmental side of the PA-backsheet and has not been correlated with a loss in electrical performance so far. Another type of cracking (squared cracks) [24], however, exhibited first material degradation effects at the interface between EVA encapsulant and PA backsheet in the intercellular spaces. This degradation then propagated through the core and outer layer, causing a crack through the whole backsheet, leading to water ingress followed by backsheet delamination and corrosion effects, and, consequently, electrical performance loss and safety problems [24].
Spectroscopic detectable chemical encapsulant degradation, e.g., the raise of carbonyl bonds, hydroxyl absorptions, or changes in the CH absorption pattern, is often paired with polymer chain splitting, leading to stiffening of the polymer, thus facilitating delamination and corrosion effects induced by penetrating substances (water vapor, oxygen) [33]. Also, these material degradation phenomena lead to electrical performance losses in the long term.
4. Conclusions
Material identification of the polymeric compounds incorporated in PV modules is often an important task, especially when degradation and failures occur. Whereas the knowledge of the bill of materials is one challenge, the detection of material degradation effects is another important issue. Both tasks can be solved by the application of molecular spectroscopic methods. Raman spectroscopy is the best-suited method for the identification of the encapsulant (measurement through 3.2-mm glass), while NIR measurements allow for the nondestructive determination of the composition of the multilayer backsheet. Surface degradation effects (e.g., oxidation, hydrolysis) are best detected with FTIR spectroscopy.
In general, spectroscopically detected material degradation effects (especially when only environmentally exposed surfaces are affected) cannot per se be correlated with electrical performance loss of PV modules. However, beginning material degradation effects can often be seen as precursors for upcoming severe damage of polymeric components of the module, which, in the long term, can lead to failures like delamination, loss in the mechanical properties, and consequential cracking and disintegration of the whole multimaterial laminate PV module.
Author Contributions
Conceptualization, G.C.E.; methodology, G.C.E. and Y.V.; software, Y.L.; validation, Y.L. and L.S.-L.; formal analysis and investigation, Y.L., Y.V. and L.S.-L.; project administration, G.C.E. All authors have read and agree to the published version of the manuscript.
Funding
This work was conducted as part of the Austrian R&D project “PV Re2 - Sustainable Photovoltaics” (FFG No. 867267) funded by the Austrian Climate and Energy Fund and the Austrian Research Promotion Agency (FFG) under the “Energy Research Program”. Furthermore, the authors work on the specific topic of Spectroscopic methods for polymeric materials” in the activity 3.2: Characterization of PV Power Plants using Mobile Devices “of the IEA PVPS TASK 13 “Performance, Operation and Reliability of Photovoltaic Systems” (2018–2021). The Austrian contribution is funded by the BMK (Federal administration for Climate Protection, Environment, Energy, Mobility, Innovation and Technology).
Acknowledgments
Gernot Oreski (PCCL/Austria) and Rudolf Frank (KIOTO/Austria) are acknowledged for providing several backsheet and encapsulation materials for the built-up of the data base.
Conflicts of Interest
The authors declare no conflict of interest.
References
- Jordan, D.C.; Wohlgemuth, J.H.; Kurtz, S.R. Technology and Climate Trends in PV Module Degradation. In Proceedings of the 27th European Photovoltaic Solar Energy Conference and Exhibition, Frankfurt, Germany, 24–28 September 2012; pp. 3118–3124. [Google Scholar] [CrossRef]
- Dietrich, S.; Sander, M.; Pander, M.; Ebert, M. Interdependency of mechanical failure rate of encapsulated solar cells and module design parameters. In Proceedings of the SPIE, Reliability of Photovoltaic Cells, Modules, Components, and Systems V 8472, San Diego, CA, USA, 16 October 2012. [Google Scholar] [CrossRef]
- Wang, E.; Yang, H.E.; Yen, J.; Chi, S.; Wang, C. Failure mode evaluation of PV module via materials degradation approach. Energy Procedia 2013, 33, 256–264. [Google Scholar] [CrossRef] [Green Version]
- Omazic, A.; Oreski, G.; Halwachs, M.; Eder, G.C.; Hirschl, C.; Neumaier, L.; Pinter, G.; Erceg, M. Relation between degradation of polymeric components in crystalline silicon PV module and climatic conditions: A literature review. Sol. Energy Mater. Sol. Cells 2019, 192, 123–133. [Google Scholar] [CrossRef]
- Köntges, M.; Kurz, S.; Packard, C.; Jahn, U.; Berger, K.A.; Kato, K.; Friesen, T.; Liu, H.; Iseghem, M.V. Review of Failures Photovoltaic Modules. IEA PVPS Task 13—International Energy Agency—Photovoltaic Power Systems Programme (www.iea-pvps.org). Performance and Reliability of Photovoltaic Systems; Subtask 3.2 2014; IEA PVPS: St. Ursen, Switzerland, 2014; p. 132. ISBN 978-3-906042-16-19. [Google Scholar]
- Herrmann, W.; Bogdanski, N. Outdoor Weathering of PV Modules—Effects of Various Climates and Comparison with Accelerated Laboratory Testing. In Proceedings of the 37th IEEE Photovoltaic Specialists Conference (PVSC), Seattle, WA, USA, 19–24 June 2011; pp. 2305–2311. [Google Scholar] [CrossRef]
- Eder, G.C.; Voronko, Y.; Dimitriadis, S.; Knöbl, K.; Újvári, G.; Berger, K.A.; Halwachs, M.; Neumaier, L.; Hirschl, C. Climate specific accelerated ageing tests & evaluation of ageing induced electrical, physical and chemical changes. Prog. Photovolt. Res. Appl. 2018, 1–16. [Google Scholar] [CrossRef] [Green Version]
- Czanderna, A.W. Encapsulation of PV modules using ethylene vinyl acetate copolymer as a pottant: A critical review. Sol. Energy Mater. Sol. Cells 1996, 43, 101–181. [Google Scholar] [CrossRef]
- Voronko, Y.; Eder, G.C.; Knausz, M.; Oreski, G.; Koch, T.; Berger, K.A. Correlation of the loss in photovoltaic module performance with the aging behaviour of the backsheets used. Prog. Photovol. Res. Appl. 2015, 23, 1501–1515. [Google Scholar] [CrossRef]
- Gambogi, W.; Kurian, S.; Hamzavy, B.; Trout, J.; Fu, O.; Chao, Y. The Role of Backsheet in Photovoltaic Module Performance and Durability. In Proceedings of the 26th European Photovoltaic Solar Energy Conference and Exhibition, Hamburg, Germany, 5–9 September 2011; pp. 3325–3328. [Google Scholar] [CrossRef]
- Jordan, D.C.; Silverman, T.J.; Wohlgemuth, J.H.; Kurtz, S.R.; VanSant, K.T. Photovoltaic failure and degradation modes. Prog. Photovolt. Res. Appl. 2017, 25, 318–326. [Google Scholar] [CrossRef]
- Jordan, D.C.; Silverman, T.J.; Sekulic, B.; Kurtz, S.R. PV degradation curves: Non-linearities and failure modes. Prog. Photovolt. Res. Appl. 2017, 25, 583–591. [Google Scholar] [CrossRef] [Green Version]
- Bokobza, L. Review: Some Applications of Vibrational Spectroscopy for the Analysis of Polymers and Polymer Composites. Polymers 2019, 11, 1159. [Google Scholar] [CrossRef] [PubMed] [Green Version]
- Available online: https://www.chromacademy.com/lms/sco533/images/P1-electromagnetic-spectrum.jpg (accessed on 26 March 2020).
- Crocombe, R.A. Portable Spectroscopy. Appl. Spectrosc. 2018, 72, 1701–1751. [Google Scholar] [CrossRef]
- Larkin, P.J. Infrared and Raman Spectroscopy: Principles and Spectral Interpretation, 1st ed.; Elsevier: Amsterdam, The Netherlands, 2011; ISBN 978-0-12-386984-5. [Google Scholar]
- Siebert, F.; Hildebrandt, P. Vibrational Spectroscopy for Life Science; Wiley-VCH: Weinheim, Germany, 2007; ISBN 978-3-527-40506-0. [Google Scholar]
- Available online: https://oceanoptics.com/nir-spectroscopy-unbound/ (accessed on 1 March 2020).
- Siesler, H.W. Near-infrared spectroscopy of polymers. Makromol. Chem. Macromol. Symp. 1991, 52, 113–129. [Google Scholar] [CrossRef]
- Available online: https://www.bentham.co.uk/knowledge/tools-resources/application-guides/spectral-characterisation-of-photovoltaic-devices-159/_20-9-2019 (accessed on 20 September 2019).
- Köntges, M.; Oreski, G.; Jahn, U.; Herz, M.; Hacke, P.; Weiss, K.-A.; Razongles, G.; Paggi, M.; Parlevliet, D.; Tanahashi, T.; et al. IEA PVPS Task 13, Report IEA-PVPS T13-09:2017 “Assessment of Photovoltaic Module Failures in the Field”; IEA PVPS: St. Ursen, Switzerland, 2017; ISBN 978-3-906042-54-1. [Google Scholar]
- Eder, G.C.; Voronko, Y.; Kubitschek, B.; Knöbl, K. Fluorescence Spectroscopy and Imaging on aged polymeric PV Encapsulantes. In Proceedings of the 20th ESOPS, Dresden, Germany, 13 September 2016. [Google Scholar] [CrossRef]
- Li, H.; Kikuchi, R.; Kumagai, M.; Amano, T.; Tang, H.; Lin, J.-M.; Fujiwara, K.; Ogawa, N. Nondestructive estimation of strength deterioration in photovoltaic backsheets using a portable near infrared spectrometer. Sol. Energy Mater. Sol. Cells 2012, 101, 166–169. [Google Scholar] [CrossRef]
- Eder, G.C.; Voronko, Y.; Oreski, G.; Mühleisen, W.; Knausz, M.; Omazic, A.; Rainer, A.; Hirschl, C.; Sonnleitner, H. Error analysis of aged modules with cracked polyamide backsheets. Sol. Energy Mater. Sol. Cells 2019, 203, 110194. [Google Scholar] [CrossRef]
- Chernev, B.S.; Hirschl, C.; Eder, G.C. Non-destructive determination of ethylene vinyl acetate crosslinking in PV modules by Raman Spectroscopy. Appl. Spectrosc. 2013, 67, 1296–1301. [Google Scholar] [CrossRef] [PubMed]
- Peike, C.; Kaltenbach, T.; Weiß, K.A.; Koehl, M. Non-destructive degradation analysis of encapsulants in PV modules by Raman Spectroscopy. Sol. Energy Mater. Sol. Cells 2011, 95, 1686–1693. [Google Scholar] [CrossRef]
- Peike, C.; Kaltenbach, T.; Weiß, K.A.; Koehl, M. Indoor vs. outdoor aging: Polymer degradation in PV modules investigated by Raman spectroscopy. Proc. SPIE 2012, 8472, 84720V. [Google Scholar]
- Chalmers, J.M.; Everall, N.J. Qualitative and Quantitative Analysis of Plastics, Polymers and Rubbers by Vibrational Spectroscopy. In Handbook of Vibrational Spectroscopy; John Wiley & Sons, Ltd.: Hoboken, NJ, USA, 2006. [Google Scholar] [CrossRef]
- Available online: http://bwtek.com/technology/handheld-raman/ (accessed on 26 March 2020).
- Available online: https://www.labcompare.com/116-Infrared-Spectrophotometer-IR-FTIR-Spectrometer/57752-4100-ExoScan-Series-Handheld-FTIR/ (accessed on 26 March 2020).
- Available online: https://oceanoptics.com/application/polymer-analysis/ (accessed on 26 March 2020).
- Köntges, M.; Morlier, A.; Eder, G.; Fleis, E.; Kubicek, B.; Lin, J. Review: Ultraviolet Fluorescence as Assessment Tool for Photovoltaic Modules. IEEE J. Photovolt. 2020, 10, 616–633. [Google Scholar] [CrossRef]
- Oreski, G. Durability and Reliability of Polymers and Other Materials in Photovoltaic Modules; Yang, H.E., French, R., Bruckman, L., Eds.; Elsevier: Amsterdam, The Netherlands, 2019; pp. 135–140. ISBN 978-0-12-811545-9. [Google Scholar]
Figure 1.
Electromagnetic spectrum, Infrared (IR) region enlarged [14].
Figure 1.
Electromagnetic spectrum, Infrared (IR) region enlarged [14].

Figure 2.
Light microscopic image of the cross section through a standard Photovoltaic (PV) module.

Figure 3.
Raman spectra of typical PV encapsulants Ethylene-vinyl-acetate (EVA), Polyolefin (PO), Polyvinyl-butyral (PVB), and Thermoplastic silicon elastomer (TPSE).
Figure 3.
Raman spectra of typical PV encapsulants Ethylene-vinyl-acetate (EVA), Polyolefin (PO), Polyvinyl-butyral (PVB), and Thermoplastic silicon elastomer (TPSE).

Figure 4.
Light microscopic images (left) and schematic representations (right) of three backsheet types: (a) Laminate, (b) coextruded backsheet, and (c) coated core layer.
Figure 4.
Light microscopic images (left) and schematic representations (right) of three backsheet types: (a) Laminate, (b) coextruded backsheet, and (c) coated core layer.

Figure 5.
Raman spectra (left) and IR spectra (right) of typical PV backsheets (outer surfaces): TPT (PVF surface), PPF (PET surface), AAA (Polyamide surface), FPA (Polyamide), KPK (PVDF surface).
Figure 5.
Raman spectra (left) and IR spectra (right) of typical PV backsheets (outer surfaces): TPT (PVF surface), PPF (PET surface), AAA (Polyamide surface), FPA (Polyamide), KPK (PVDF surface).

Figure 6.
NIR spectra of the typical PV backsheets: APA, AAA, KPK, OOO, PPF, TPT.

Figure 7.
Mobile Raman spectroscopic system for confocal measurements with (a) zoom-adapter lens (for larger working distances) and (b) probe in sample holder device with defined distances.
Figure 7.
Mobile Raman spectroscopic system for confocal measurements with (a) zoom-adapter lens (for larger working distances) and (b) probe in sample holder device with defined distances.

Figure 8.
Raman spectra of the backsheet-surface of a field-aged PV module and best hit from database.
Figure 8.
Raman spectra of the backsheet-surface of a field-aged PV module and best hit from database.

Figure 9.
Raman spectra of the encapsulant of a field-aged PV module and best hit from database.

© 2020 by the authors. Licensee MDPI, Basel, Switzerland. This article is an open access article distributed under the terms and conditions of the Creative Commons Attribution (CC BY) license (http://creativecommons.org/licenses/by/4.0/).
Share and Cite
MDPI and ACS Style
Eder, G.C.; Lin, Y.; Voronko, Y.; Spoljaric-Lukacic, L. On-Site Identification of the Material Composition of PV Modules with Mobile Spectroscopic Devices. Energies 2020, 13, 1903. https://doi.org/10.3390/en13081903
AMA Style
Eder GC, Lin Y, Voronko Y, Spoljaric-Lukacic L. On-Site Identification of the Material Composition of PV Modules with Mobile Spectroscopic Devices. Energies. 2020; 13(8):1903. https://doi.org/10.3390/en13081903
Chicago/Turabian StyleEder, Gabriele C., Yiji Lin, Yuliya Voronko, and Lidija Spoljaric-Lukacic. 2020. "On-Site Identification of the Material Composition of PV Modules with Mobile Spectroscopic Devices" Energies 13, no. 8: 1903. https://doi.org/10.3390/en13081903
Note that from the first issue of 2016, this journal uses article numbers instead of page numbers. See further details here.