A Method for Efficiency Determination of Permanent Magnet Synchronous Motor

Department of Power Systems, Kaunas University of Technology, LT51367 Kaunas, Lithuania
*
Author to whom correspondence should be addressed.
Energies 2020, 13(4), 1004; https://doi.org/10.3390/en13041004
Submission received: 11 January 2020
/
Revised: 20 February 2020
/
Accepted: 21 February 2020
/
Published: 24 February 2020
Abstract
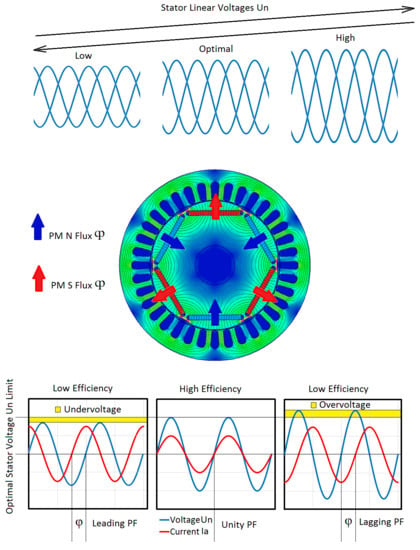
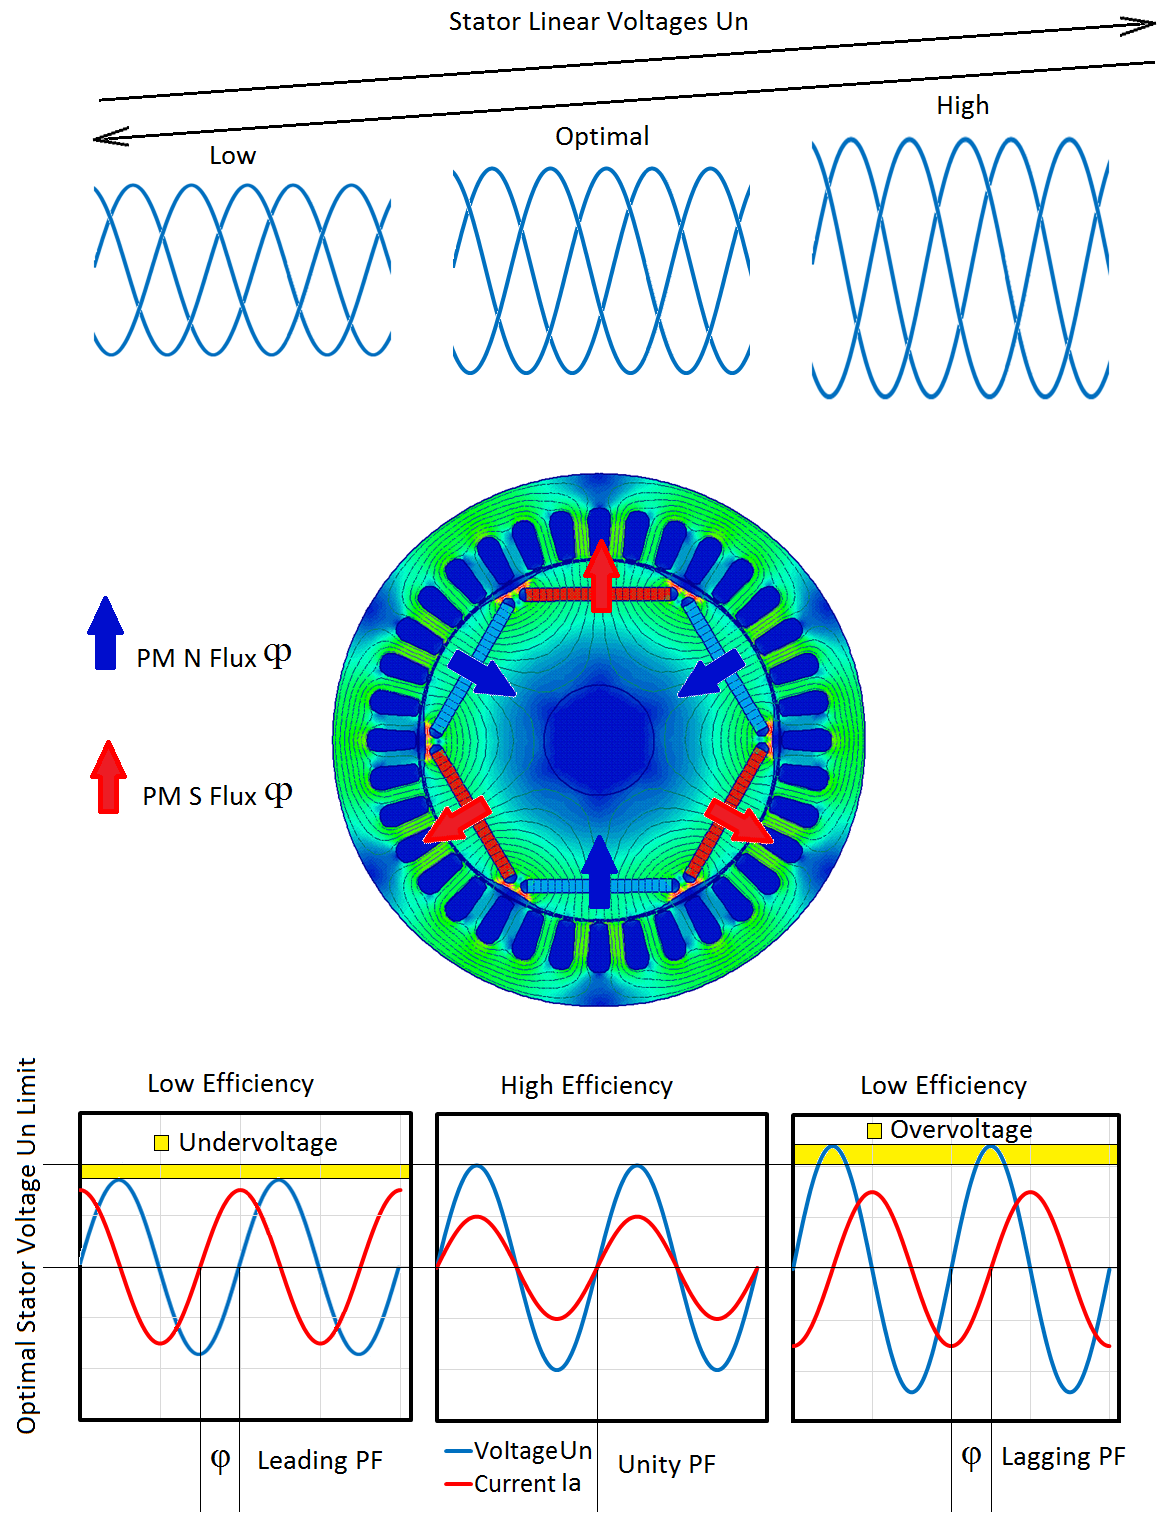
:The utilization rate of permanent magnet synchronous motors (PMSM) is increasing in the industry today. Due to this fact, the high efficiency ratio of PMSMs has reached IE5 premium class efficiency. Therefore, the efficiency coefficient of the PMSM varies from 92% to 97%. As a result, this type of motor is replacing traditional asynchronous motor by falling into efficiency classes of IE1, IE2, IE3, and IE4, which range from 75% to 92% in the industry. Thus, the object of the research was to develop a method to determine the efficiency of permanent magnet synchronous motor applications in order to identify and verify the variating parameters. In this study, an innovative and safe method of PMSM testing when the nominal parameters of the motor are unknown was presented through research. Also, the comparison of PMSM oscillograms with different types of load types and phase shift oscillograms, generated using operation amplifier, were analyzed and is scrutinized. During the design process, the PMSM was projected for the IE5 premium efficiency class. However, after production, the PMSM sometimes does not match the nameplate parameters, which are declared by the factory. As a result, during the testing procedures, the PMSM nameplate parameters did not match the projected parameters. Facing the problem of the projected and tested efficiency mismatch, the PMSM highest efficiency determination experiments were performed in a laboratory in order to prove the highest efficiency of the PMSM. The results showed different PMSM input parameters. Furthermore, the experimental results of the PMSM testing were confirmed with electrical machines theory, and simulation results were performed with electrical circuits. The theory of PMSM operating in different values of input voltage is represented in graphical abstract.
1. Introduction
Today, as a result of industrial progress, energy consumption is being optimized. Electrical motors are the most common electricity consumption assets in the industry, with about 66% of electricity consumed by electrical motors. As a result, the adaptation of higher efficiency motors is one of the most important issues in the industry today. The comparison of different types of motors by efficiency rating was described by the authors of Reference [1].
Furthermore, in more and more applications, PMSMs are appearing due to their higher efficiency class. As a result, the typical induction motors are being replaced with PMSMs. The vision of future trends has been more deeply discussed by the authors of Reference [2]. The sustainability of permanent magnets in electrical motors was reviewed by the authors of Reference [3].
In most applications, PMSMs are utilized with variable speed drives, as PMSM cannot be started directly from the network. With optimal control of the PMSM, the variable speed drive system is more efficient as the same system with typical induction motor. The deeper analysis of PMSM and the benefits of variable speed drive systems have been described previously [4,5]. PMSMs are not only used with variable speed drives, but also for robotic applications. The application efficiency is the similar to the application with a brushless DC motor. The analysis of PMSM robotic applications was reviewed by the authors of Reference [6].
For obtaining the highest possible efficiency of the PMSM, the projecting and prototype testing phase of production is the most important for manufacturers. During the projecting phase, the permanent magnet and other constructional materials characteristics must be evaluated and calculated correctly to ensure that the testing results correspond to the calculations.
Experimental model testing is one of the main tasks when designing PMSMs. During the test procedures of the PMSM, the calculated parameters are compared to the tested parameters. The main aim of this task is to determine if the chosen theoretical model, design methodology, and parameters of materials were chosen correctly. In other words, during the testing procedure, the nameplate parameters of experimental PMSM model are determined. The importance of induction motor’s nameplate parameters has been described previously [7,8,9]. To determine the PMSM’s nameplate parameters, many different tests and experiments are executed [10,11]. The most important experiment of PMSMs is the nominal voltage determination experiment. The nominal parameters determination by artificial neural networks has been described previously [12,13].
PMSM nominal voltage determination experiments are based on the experiment of synchronous machine with field winding when the synchronous machine is in generator mode with a fixed load and generates maximum active power. As a result, the generator’s armature is loaded with a resistive load, which is adjusted by the field winding’s current and resistive load until the generator starts to generate the maximum active power. At this moment, the generator’s armature voltage is nominal of the synchronous machine in motor mode.
The next method for synchronous machines testing is when the synchronous machine armature is loaded with the autotransformer. The field winding current and autotransformer voltage is adjusted until the generator stars to generate the maximal active power. The measured voltage corresponds to the nominal voltage of the PMSM in motor mode. In addition, the characteristics for generated power PMSM can be generated [14,15].
There are different methodologies for designing synchronous machines with field winding, which can be designed precisely. Test results can vary with result up to 1% error.
In a different situation with PMSMs, field winding is replaced with permanent magnets which generate a constant and not adjustable flux. Another problem with projecting the PMSM is that different manufactures produce permanent magnets (PM) with different characteristics, and the generated flux of the PMSMs vary per manufacturer. The PM characteristics have been described previously [16,17,18]. It is mandatory to examine if the nameplate parameters of the projected PMSM correspond to nameplate parameters of the experimental PMSM.
The advantages of PMSMs compared to induction motors have been discussed previously [19,20,21,22,23].
Based on the IEEE 112 standard test procedure for polyphase induction motors and generators and standard IEC-60034-2-1, two methodologies for PMSM efficiency testing could be applied for PMSM efficiency determination. Under the first methodology, the efficiency of PMSM is the result of the output power divided by the input power. In this case, the output power of the PMSM is assumed as the mechanical power, which is calculated from the torque of the PMSM. The second methodology for efficiency determination involves the evaluation of PMSM losses as efficiency, which is calculated in the same way as in the first case, but the output power is replaced with subtraction of input power and calculated PMSM losses. As a result, for more precise calculations of PMSM efficiency, the first methodology of the IEEE 112 standard was chosen. IEEE 112 and IEC-60034-2-1 standards have been described previously [24].
There are also efficiency measurement technologies, which differ from IEEE 112 and IEC-60034-2-1, where motor efficiency is determined from d and q axes inductances measurements. The mentioned methodology provides less accuracy compared to standardized methodologies due to indirect measurements of values that have a direct correlation with torque, which is proportional with the mechanical power of motor. The inductance measurement-based motor efficiency determination was discussed in detail by the authors of Reference [25]. The efficiency can also be determined with usage of artificial neural networks [26]. As a result, artificial neural networks can be used for motor efficiency control in variable speed drives for achieving optimal motor performances. The utilization of artificial neural networks in variable speed drives has been described previously [27,28].
2. Materials and Methods
First, for the determination of the PMSM efficiency, the equivalent circuit diagram of the PMSM must be analyzed, which is represented in Figure 1.
From Figure 1, it is seen that the PMSM equivalent circuit diagram consisted of two main components: The stator on the left side and the rotor on the left side. As the result, the inductance (Xs) and active resistances (Ra), back electromotive force (Eb), input voltage (UN), and armature current (Ia) must be evaluated for efficiency calculation during the PMSM design stage. The main parameter, which must be evaluated before the determination of the PMSM construction, is the PMSM input, voltage which influences the efficiency of the PMSM. The vector diagrams of PMSM with different input voltages are represented in Figure 2.
From the PMSM vector/phasor diagrams represented in Figure 2, it is seen that three situations were analyzed when reduced input voltage was applied to the PMSM, when nominal voltage was applied to the PMSM input, and when increased voltage was applied. From the vector diagrams, it is seen that the PMSM power factor (cos φ), which best illustrates the efficiency of the PMSM, reached highest values when nominal voltage was applied to the PMSM input and the cos φ value was near 1. In other cases, when the PMSM voltage was reduced or increased, the cos φ value was between 0 and 1, leading to energy losses. Also, other parameters, including the resulting electromotive force (Er), load angle (α), and the angle between current and the resulting electromotive force (θ) must be evaluated.
For calculation of φ, which is the angle between the current and voltage, the values of the impedance of stator (Zs), resulting electromotive force (Er), and armature current (Ia) must be calculated as shown in Equations (1)–(3).
From the calculated parameters the, expressed Equations (4)–(7), and vector diagram of the PMSM, it was possible to calculate the angle φ:
From the Equation (7), it is seen that back electromotive force and input voltage of PMSM influenced the result of the power factor.
As a result of formulas, which were provided before for experimentation with an already-assembled PMSM, the nominal voltage determination experiment was executed first, when motor was utilized as generator by applying coupled motor which rotated the PMSM. The PMSM generated voltage which was equal to the electromotive force of the PMSM. It was assumed that the electromotive force of the PMSM was equal to the PMSM’s nominal voltage.
To prove the that motor nominal efficiency reached its peak value at the nominal voltage, PMSM testing with load experiments was be performed and compared with obtained results. For load simulation, the coupled motor was rotated to a different direction than the PMSM.
During the efficiency determination with different voltages applied to PMSM, the load simulated induction motor increased speed until the PMSM lost synchronism. The induction motor speed adjustment was obtained using a variable voltage source. In this case, an autotransformer was used.
The overall view of the test bench of the experiments and PMSM with a separated rotor and stator are represented in Figure 3.
In Figure 3a, the overall view of the test bench of experiments and the two main components, the PMSM and asynchronous motor, are shown. The nominal parameters of the PMSM, which were declared by manufacturer, are 1.5 kW power, 400-V voltage, 3.3-A current, 0.92-power factor, 9.6-N·m torque, 1500-rpm speed, 88.1% efficiency, and 7.5-kW asynchronous motor. For load simulation, the nominal parameters are 400-V voltage, 8.17-A current, 0.87 power factor, 1488-rpm speed, and 86% efficiency. The over equipment, which was essential for testing for obtaining measuring electrical and mechanical parameters, was chosen: Grid analyzer for PMSM electrical parameters registration, laser tachometer for PMSM speed verification, and torque meter for PMSM mechanical power determination. The torque meter was chosen for a more accurate evaluation of the motor efficiency. The other test bench circuit elements were the synchronization panel for PMSM synchronization with the grid and autotransformers for PMSM efficiency values.
To perform an experiment to determine the efficiency, the PMSM motor must be used for startup and braking, torque meter, synchronization panel, energy meter, and tachometer. Measuring the torque of the motor is done in the startup and braking states. As it is known, it is possible to check and determine the PMSM nominal voltage by rotor spinning of PMSM, which was coupled with an asynchronous motor to measure the generation of voltage on the PMSM motor’s inputs.
In other words, the determination of PMSM nominal voltage was done using the motor as a generator, which was rotated at its nominal speed.
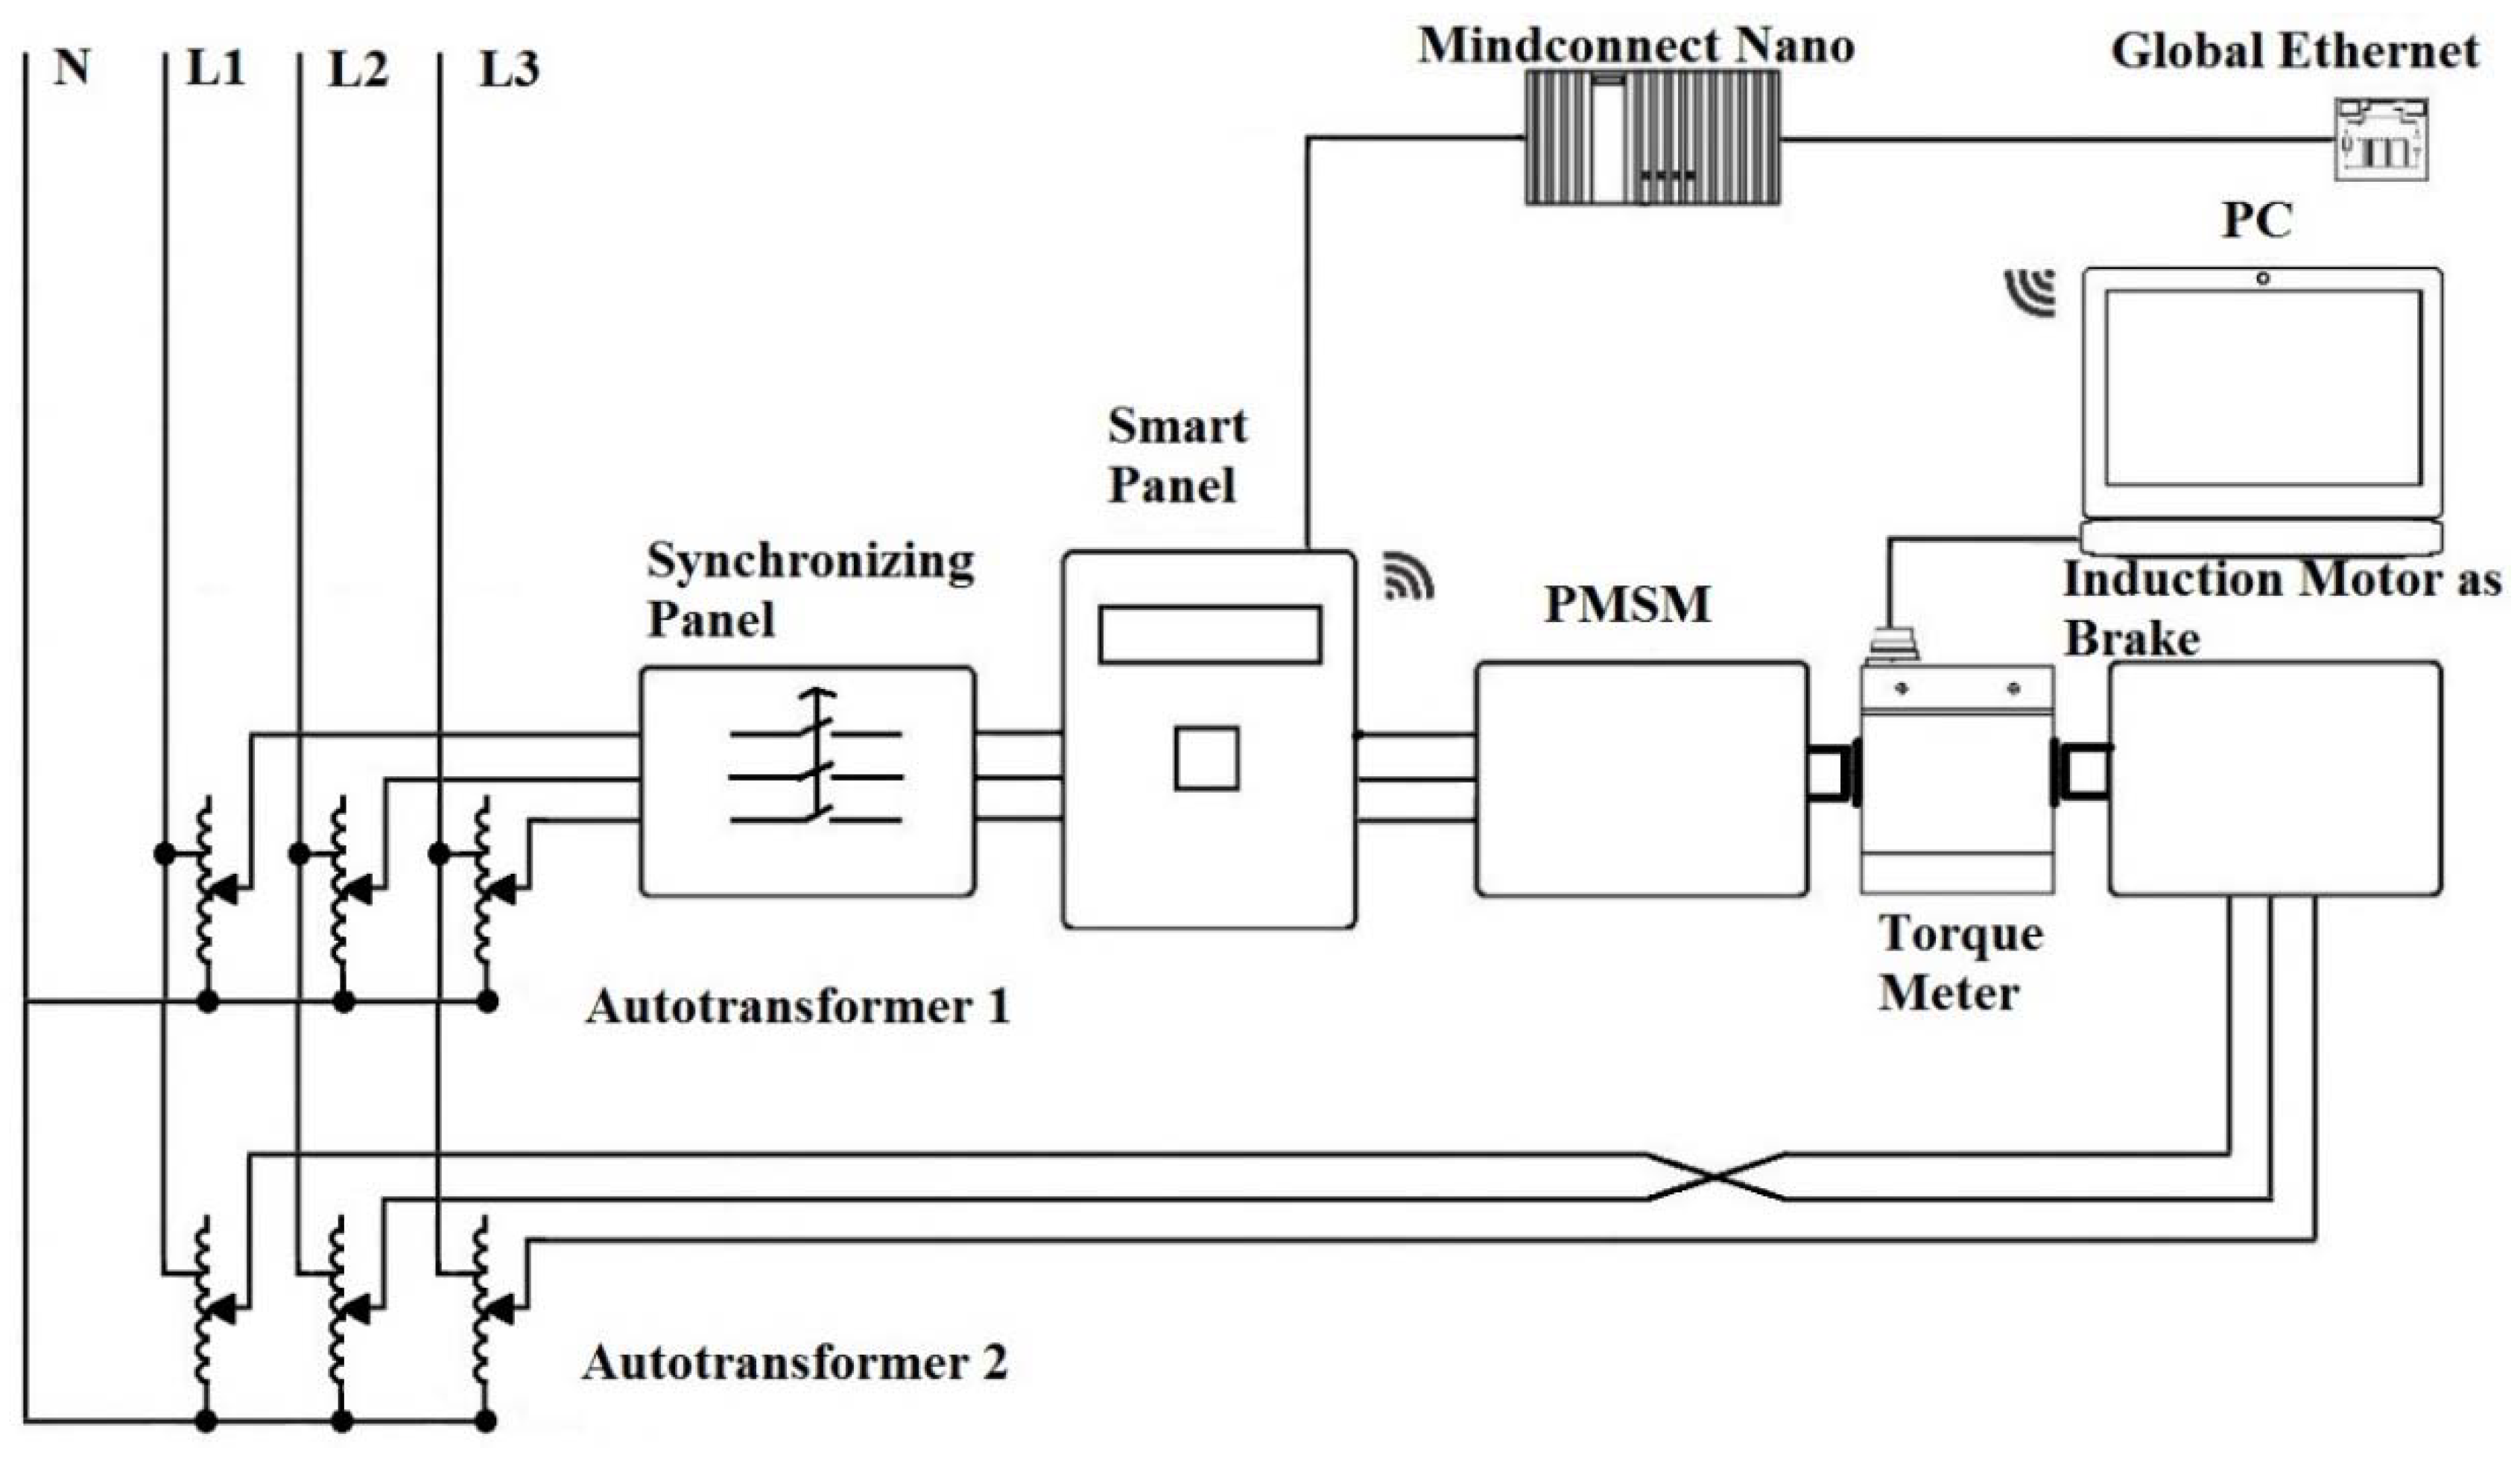
The PMSM motor was tested and the asynchronous motor was used as a load. More equipment was used for experiments. For the PMSM input electrical parameters, apparent power, active power reactive power, voltage, and current analysis—grid analyzer, synchronization panel for connection of PMSM, tachometer for verification of motor speed, autotransformers for voltage adjustment of PMSM, and speed adjustment of the induction motor and Lorenz messtechnik (type DR-2512) torque meter for torque determination were used. The torque meter was used for a more accurate evaluation of the motor efficiency. The overall circuit diagram of the test bench is represented in Figure 4.
For PMSM torque conversion to PMSM mechanical power, Equation (8) was applied:
where T—torque (N·m) and V—speed (rpm).
As the PMSM mechanical power was calculated from the PMSM torque value, the motor efficiency was calculated by Equation (9):
where P—active power of PMSM input (W).
To prove the peak PMSM efficiency was obtained by applying the nominal voltage to the input, the Tektronix TDS 204B oscilloscope was used during testing experiments. The same phase voltage and current signals of PMSM input were monitored with oscilloscope. It was assumed that the motor peak efficiency was obtained when the voltage (scale 100 mV/V) and current (scale 100 mV/A) signals coincidence. As a motor, the PMSM had noncapacitive and noninductive character.
To prove the experiments and conclusions that were made, the simulation model was designed using the National Instruments Multisim application. The simulation model from the Multisim application and an explanation with simulation results are reviewed in the results section.
3. Results
To clarify the experimental results and the course of the experiments, the results section is divided into three subsections: The PMSM nominal voltage determination experiment, PMSM efficiency determination experiments, and PMSM stator’s current and voltage signals simulation.
3.1. PMSM Nominal Voltage Determination Experiment
First, the nominal voltage of the PMSM was determined, as the PMSM was not connected to grid, but only rotated with coupled motor at constant synchronous speed of 1500 rpm, which was supervised with a laser tachometer. As the PMSM was operating in generator mode, the generated voltage on the PMSM output was measured equal to 302 V. As previously mentioned, the PMSM voltage in generator mode was equal to the electromotive force of the PMSM. As a result, the estimated PMSM nominal voltage was equal to electromotive force of 302 V. The results of PMSM nominal voltage determination experiment are represented in Figure 5.
3.2. PMSM Efficiency Determination Experimets
For determination of the PMSM nominal efficiency, the different PMSM’s input voltages were applied and efficiency was calculated using Equations (8) and (9). The different PMSM calculated efficiency values were compared and nominal parameters were determined. At first, the PMSM was tested with an assumed nominal voltage of 302 V. Later, the PMSM was tested with reduced voltages of 280 V, 260 V, and 240 V.
Also, the increased voltage experiments were executed with voltages of 320 V, 340 V, and 360 V. The experiment results are presented in Table 1. The PMSM experimental data, including the PMSM input electrical parameter, efficiency curve during experiments, and voltage and current oscillograms, were analyzed in subsections.
3.2.1. PMSM Efficiency Determination Experiment with 302-V Voltage
The PMSM nominal voltage of 302 V was determined and was then applied for efficiency determination. The PMSM efficiency was determined when the coupled motor loaded PMSM by rotating to a different direction. The rotation of the load motor was controlled with a variable voltage, which was slowly increased by autotransformer. The load was increased until the PMSM lost its synchronism. At the moment the PMSM lost its synchronism, the peak torque of PMSM was registered with the torque meter.
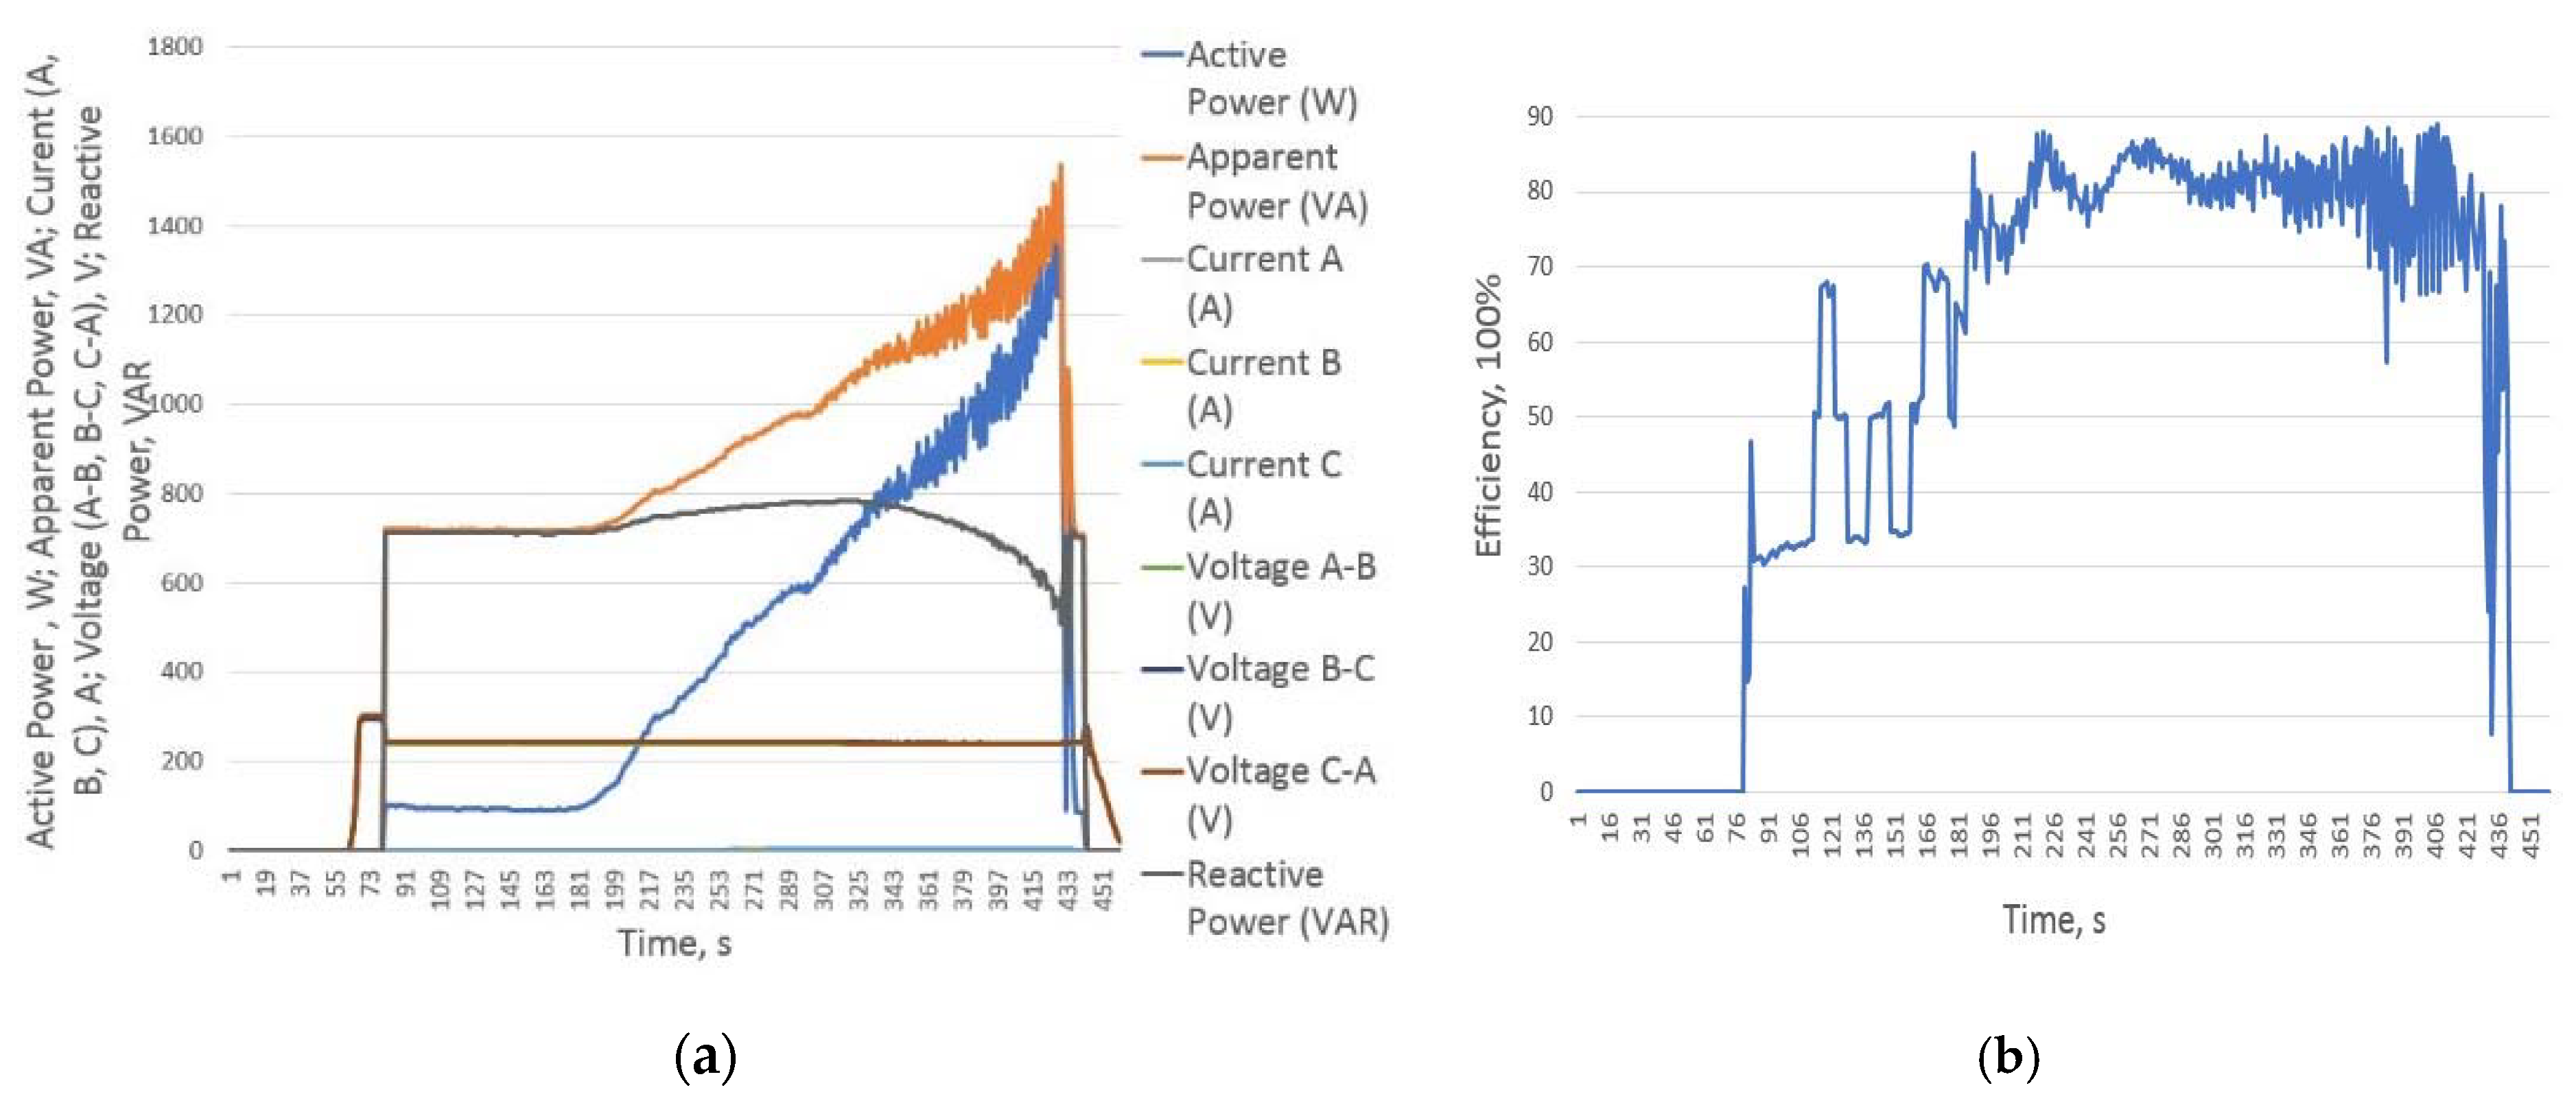
The results of the experiment are represented in Figure 6.
From Figure 6a, it is seen that apparent power almost corresponded to active power, and the reactive power value only increased up to 200 VAR. As the apparent and active power of the PMSM corresponded to each other and the reactive power was at its minimal value, it can be estimated that nominal voltage was determined correctly.
From Figure 6b, it can be seen that the PMSM efficiency reached its peak and it was almost 100%. To validate that the 302-V voltage was nominal and that 98.7% efficiency was the highest efficiency that PMSM was able to reach, the PMSM stator voltage and current oscillograms were gathered and represented in Figure 7.
From Figure 7, it is visible that blue PMSM voltage curve corresponded by period to the yellow PMSM current. It can be stated that the PMSM operated at its maximum efficiency when the 302 V voltage was applied. Next, to prove that the nominal voltage was selected correctly, the experimental results with reduced and increased voltages were analyzed.
3.2.2. PMSM Efficiency Determination Experiment with Reduced 240 V
As in previous experiment, the PMSM was tested with 240 V applied to the input. The peak value of efficiency reached 88.39%. The results of PMSM input measured parameters and efficiency curve are represented in Figure 8.
From Figure 8a, it is visible that reactive power increased up to 600–800 VAR. As a result, the apparent power did not coincide with active power, but during the reach of peak load where the efficiency curve in Figure 8b reached the highest values, the apparent power almost coincided with active power.
Next, the oscillogram of the PMSM stator’s input voltage and current is shown with the voltage of 240 V applied to the PMSM input experiment.
From Figure 9, it is visible that stator’s current (yellow curve) overcame the stator’s voltage (blue curve). As a result, it can be assumed that PMSM with 240 V applied to the input reacted as a reactive load with capacitive character.
3.2.3. PMSM Efficiency Determination Experiment with Increased Voltage of 360 V
As in previous experiments, the PMSM was tested with an increased voltage of 360 V applied to the input. The peak value of efficiency reached 85.7%. The results of PMSM input measured parameters and efficiency curve are represented in Figure 10.
From Figure 10a, it is visible that the PMSM reactive power increased even more with the increased voltage input of 360 V when compared to reduced input voltage of 240 V. Also, it was noticed from Figure 10b that the efficiency curve reached lower values than with reduced voltage. It was measured that the values of the reactive power decreased from −1500 VAR to −1000 VAR, which leads to conclusion that PMSM with increased voltage acted as a reactive load with inductive character. It can be seen that the apparent power did not coincide with the active power. It was only when the efficiency curve reached the maximum values that the difference between the apparent and active powers decreased.
Next, the PMSM stator’s voltage and current oscillogram were captured and represented in Figure 11 as an increased voltage of 360 V was applied.
From Figure 11, it is visible that the stator’s current (yellow curve) stayed behind the stator’s voltage (blue curve). As a result, it can be proved that the PMSM with an increased voltage of 360 V when applied to the input reacts as an inductive load.
3.3. PMSM Stator’s Current and Voltage Singnals Simulation
For the verification of the PMSM experimental results with nominal, reduced, and increased voltages, the simulation model was created with National Instruments software. The main aim of the simulation was to prove that different load characters are acquired by changing the value inductance and capacity of the circuit. In Figure 12, the simulation model of the PMSM stator is represented.
In simulation model of the PMSM stator, which is represented in Figure 12, the stator voltage signal measurement was green PR1 and stator current signal was blue PR2. The variable load elements were the C1 capacitor, L1 inductance, and R3 resistor. To simulate the stator input voltage, the V3 AC voltage generator was incorporated. Stator’s windings were represented as an analogue comparator. The aim of simulation was to obtain similar voltage and current curves results to the oscillograms represented in Figure 7, Figure 9 and Figure 11.
To obtain corresponding results to the oscillogram in Figure 7, the voltage and current signal of the capacitor C1 value was set to 9 μF and inductance L1 value was set to 100 mH. The amplification of PMSM’s stator current signal was also achieved, and resistances R1 and R2 were set to 500 Ω and 1 kΩ, respectively.
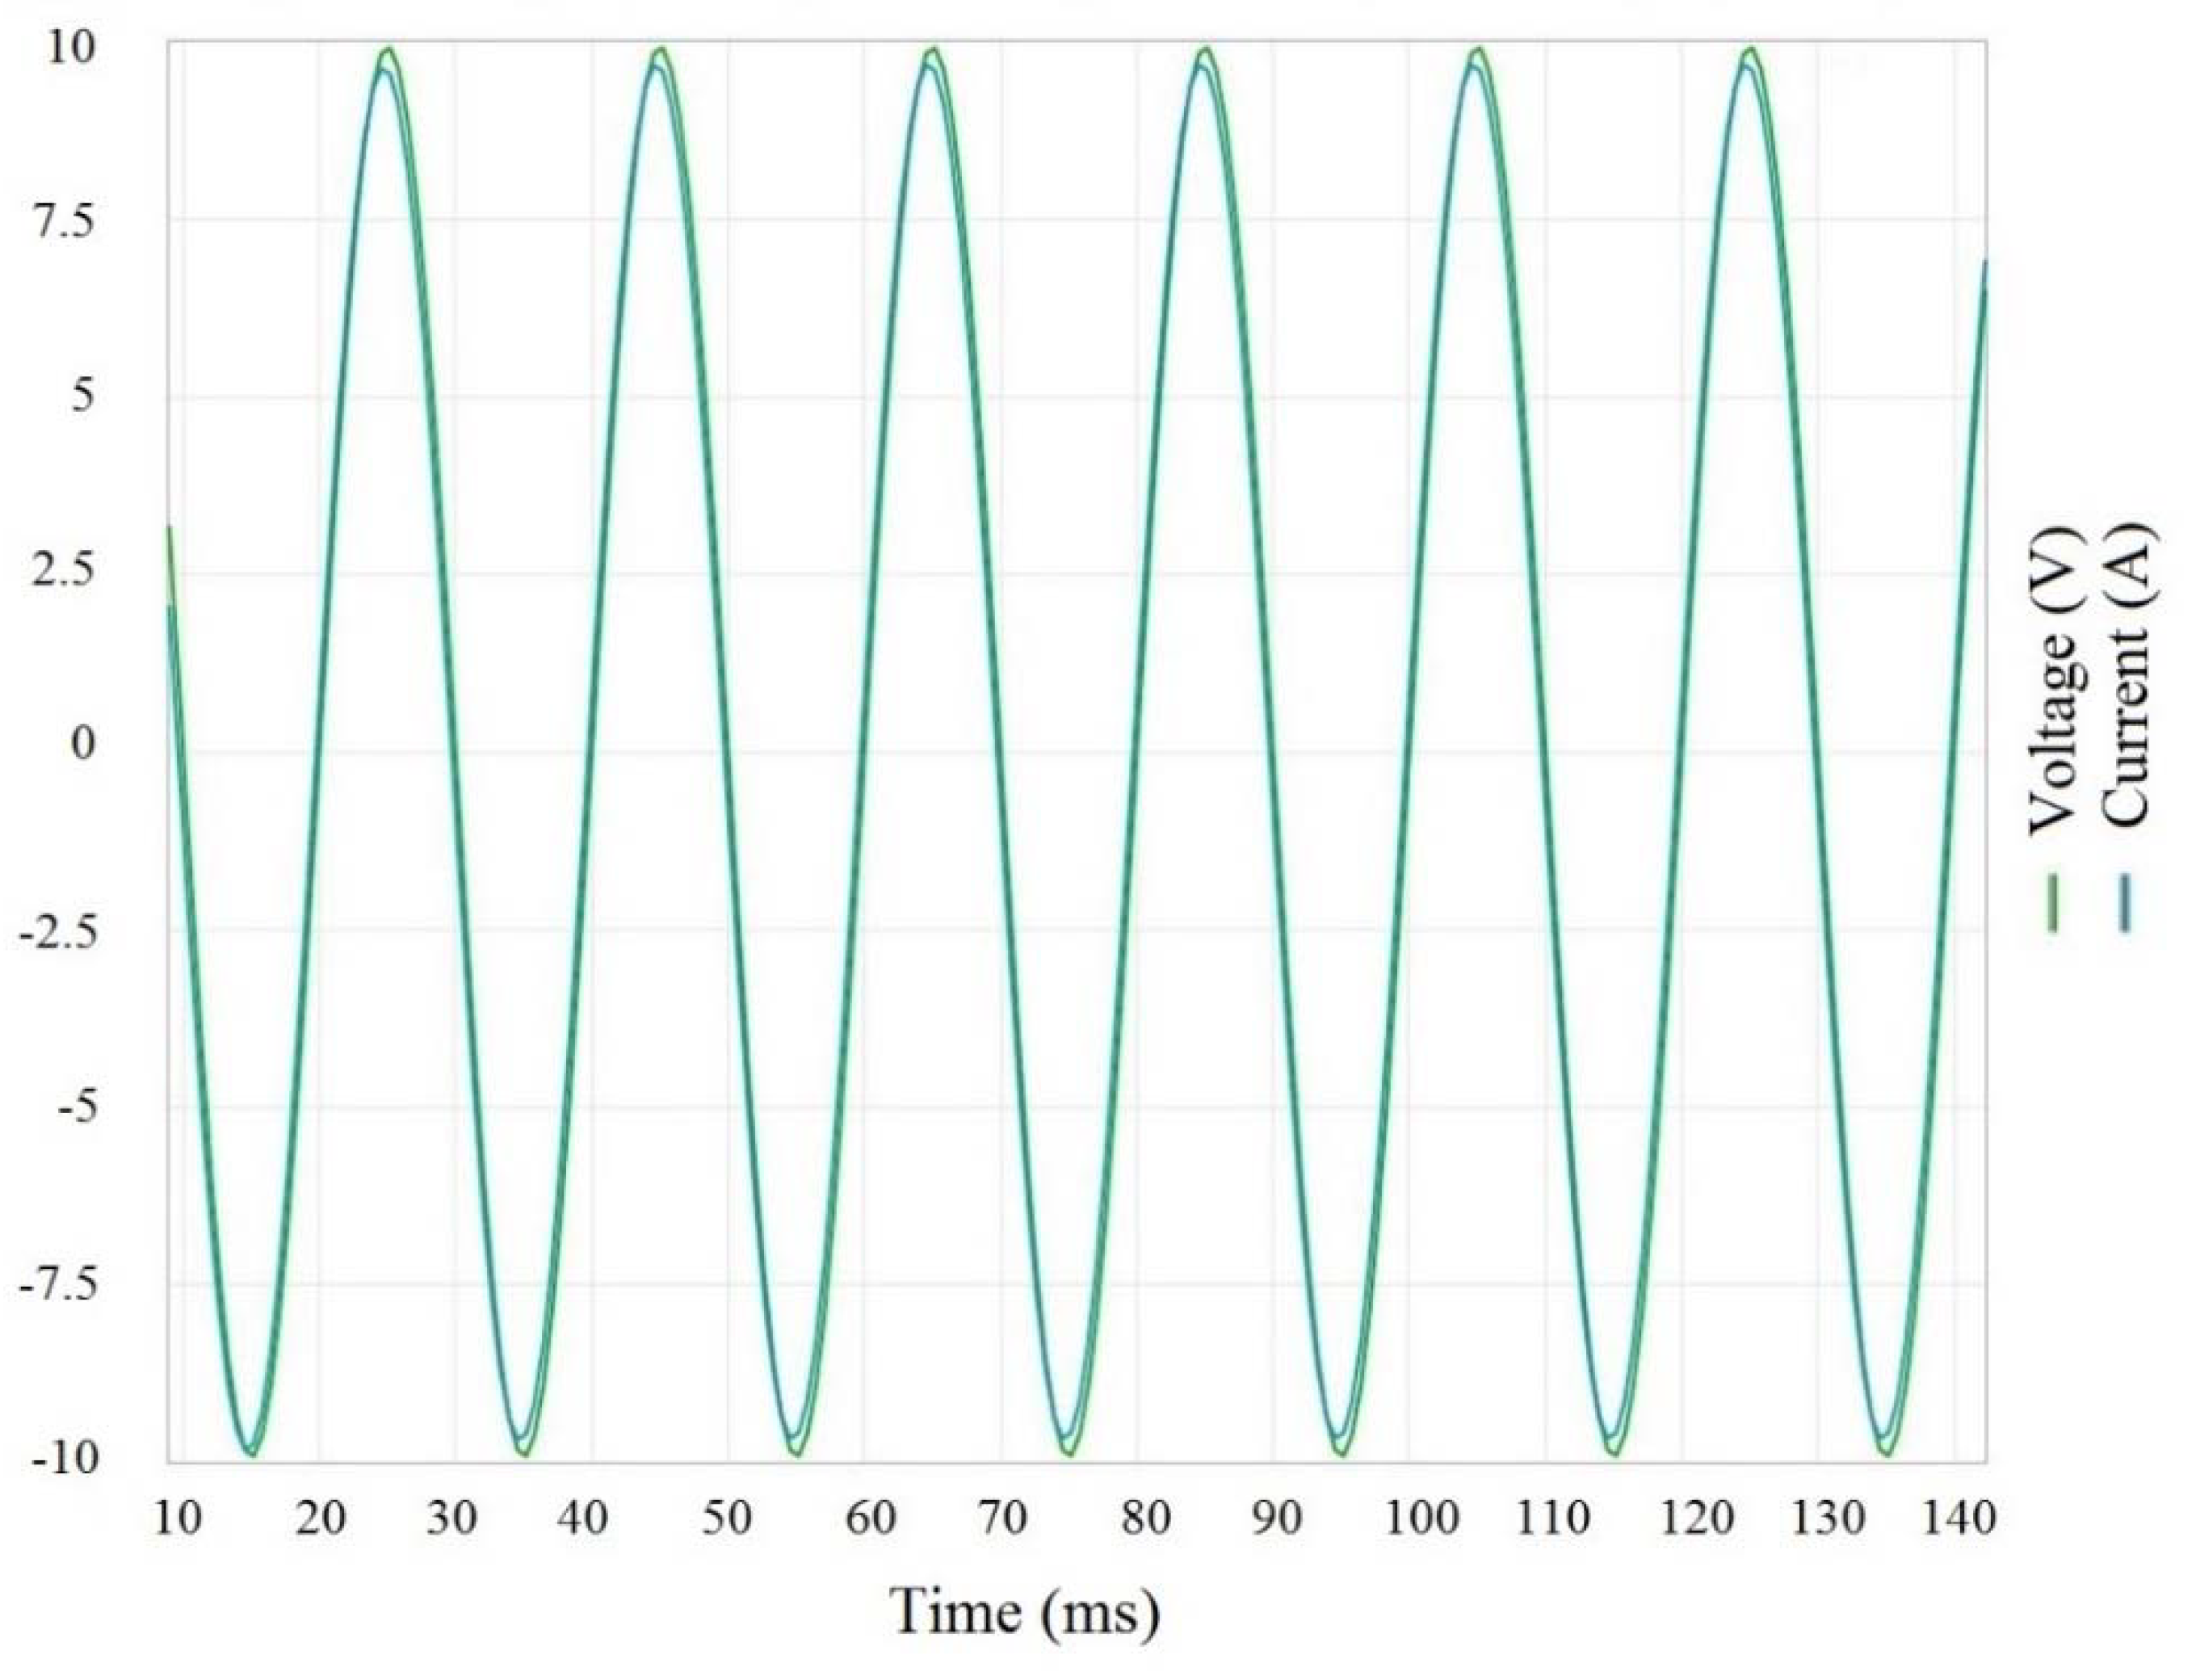
The result of the simulation where the stator voltage (green curve) and current (blue curve) signals coincidence are represented in Figure 13. The simulation results are scaled. The voltage scale is 75:1 and the current scale is 1:5.
During next simulation, the capacitor C1 value was increased 100 μF, representing a load with the capacitive character of PMSM. As a result, the current signal (blue curve) overcame the voltage signal (green curve). The results of PMSM with the capacitive load simulation are represented in Figure 14. The simulation results in Figure 14 are scaled the same as in Figure 13.
The last simulation with the PMSM stator model was executed when capacitor C1 was decreased to 9 μF and inductance L1 was increased to 10 H. As a result, the PMSM current signal (blue curve) stayed behind the voltage signal (green curve). The results of PMSM with inductive load simulation are represented in Figure 15. The simulation results in Figure 15 are scaled the same as in Figure 13 and Figure 15.
4. Conclusions
To sum up the research results of PMSM efficiency determination method, testing, and simulation, several conclusions were structured:
- During the nominal voltage determination of the permanent magnet synchronous motor (PMSM) experiment, a 302-V electromotive force was measured, which is equal to PMSM nominal voltage.
- During the efficiency determination experiment of permanent magnet synchronous motor (PMSM), the highest efficiency of 98.7% was reached with 302-V nominal voltage. The PMSM nominal voltage and current curve coincidence in Figure 7 was proved to be an active load with nominal voltage.
- As PMSM was tested with reduced voltage and the efficiency decreased to 88.39%, it was seen from the voltage and current oscillogram (Figure 9) that the current overcame the voltage and the motor acted as a reactive load with capacitive character.
- The PMSM increased above the nominal voltage, which reached 85.7% efficiency, and current stayed behind from the voltage in the oscillogram (Figure 11), which occurred because the motor acted as an inductive reactive load.
- The increase of active power of the PMSM was noticed as the input voltage was increased, but the value of torque reached its peak of 7.2 N·m when nominal 302-V voltage was applied, which influenced the peak efficiency result.
- Simulation model results in the National Instruments environment corresponded to the experimental results and PMSM input oscillograms. This simulation model is applicable for further PMSM research.
- From the experimental results, it can be concluded that rotor’s permanent magnets did not produce enough magnetic field and that is why they were not able to create a nominal 400-V electro motive force.
Author Contributions
Conceptualization, J.V. and K.D.; methodology, J.V.; software, J.V..; validation, J.V., T.Z. and A.K.; formal analysis, K.D.; investigation, K.D.; resources, J.V.; data curation, T.Z.; writing—original draft preparation, K.D.; writing—review and editing, T.Z.; visualization, K.D.; supervision, J.V., A.K. and M.A.; project administration, J.V. All authors have read and agreed to the published version of the manuscript.
Funding
This research received no external funding.
Conflicts of Interest
The authors declare no conflict of interest.
References
- Rassolkin, A.; Heidari, H.; Kallaste, A.; Vaimann, T.; Acedo, J.P.; Romero-Cadaval, E. Efficiency Map Comparison of Induction and Synchronous Reluctance Motors. In Proceedings of the 26th International Workshop on Electric Drives: Improvement in Efficiency of Electric Drives (IWED), Moscow, Russia, 30 January–2 February 2019. [Google Scholar]
- De Almeida, A.T.; Ferreira, F.J.; Baoming, G. Beyond Induction Motors—Technology Trends to Move Up Efficiency. IEEE Trans. Ind. Appl. 2013, 50, 2103–2114. [Google Scholar] [CrossRef]
- Ferreira, F.J.; Baoming, G.; de Almeida, A.T. Reliability and Operation of High-Efficiency Induction Motors. In Proceedings of the IEEE Transactions on Industry Applications, Calgary, AB, Canada, 5–8 May 2015; Volume 52, pp. 4628–4637. [Google Scholar]
- Zhang, S.; Zhou, X.; Gao, D. Strategy of efficiency optimization of PMSM-DTC system used for EVs. In Proceedings of the 2014 IEEE Conference and Expo Transportation Electrification Asia-Pacific (ITEC Asia-Pacific), Bejing, China, 31 August–3 September 2014. [Google Scholar]
- Sakunthala, S.; Kiranmayi, R.; Mandadi, P.N. A study on industrial motor drives: Comparison and applications of PMSM and BLDC motor drives. In Proceedings of the 2017 International Conference on Energy, Communication, Data Analytics and Soft Computing (ICECDS), Chennai, India, 1–2 August 2017. [Google Scholar]
- Staszak, J.; Ludwinek, K.; Gawęcki, Z.; Kurkiewicz, J.; Bekier, T.; Jaśkiewicz, M. Utilization of permanent magnet synchronous motors in industrial robots. In Proceedings of the 2015 International Conference on Information and Digital Technologies, Zilina, Slovakia, 7–9 July 2015. [Google Scholar]
- Daut, I.; Abdullah, M.; Gomesh, N.; Yanawati, Y.; Shafiqin, S.N.; Pungut, I. The impacts of stator materials on induction motor nameplate parameters for high performance. In Proceedings of the 2010 IEEE Student Conference on Research and Development (SCOReD), Putrajaya, Malaysia, 13–14 December 2010. [Google Scholar]
- Lee, K.; Frank, S.; Sen, P.K.; Polese, L.G.; Alahmad, M.; Waters, C. Estimation of induction motor equivalent circuit parameters from nameplate data. In Proceedings of the 2012 North American Power Symposium (NAPS), Champaign, IL, USA, 9–11 September 2012. [Google Scholar]
- Ukil, A.; Bloch, R.; Andenna, A. Estimation of Induction Motor Operating Power Factor from Measured Current and Manufacturer Data. IEEE Trans. Energy 2011, 26, 699–706. [Google Scholar] [CrossRef]
- Deda, S.; De Kock, J.A. Induction Motor Efficiency Test Methods: A Comparison of Standards. In Proceedings of the 2017 International Conference on the Industrial and Commercial Use of Energy (ICUE), Cape Town, South Africa, 15–16 August 2017. [Google Scholar]
- Guo, F.; Liu, M.; Jia, P.; Liu, J.H.; Dong, P.; Shen, Y. Application Research of Small and Medium-sized Three-phase Asynchronous Motor Energy Efficiency Testing System. In Proceedings of the 2018 2nd IEEE Conference on Energy Internet and Energy System Integration (EI2), Beijing, China, 20–22 October 2018. [Google Scholar]
- Karanayil, B.; Rahman, M.F.; Grantham, C. Induction motor parameter determination technique using artificial neural networks. In Proceedings of the 2008 International Conference on Electrical Machines and Systems, Wuhan, China, 17–20 October 2008. [Google Scholar]
- Wlas, M.; Krzeminski, Z.; Toliyat, H.A. Toliyat. Neural-Network-Based Parameter Estimations of Induction Motors. IEEE Trans. Ind. Electron. 2008, 55, 1783–1794. [Google Scholar] [CrossRef]
- Lee, H.K.; Shin, K.H.; Bang, T.K.; Choi, J.Y.; Cho, S.K. Characteristic Analysis of a V-Shape Interior Permanent Magnet Synchronous Motor According to Design Parameter. In Proceedings of the 2018 21st International Conference on Electrical Machines and Systems (ICEMS), Jeju, South Korea, 7–10 October 2018. [Google Scholar]
- Zhao, W.; Zhao, F.; Lipo, T.A.; Kwon, B.I. Optimal Design of a Novel V-Type Interior Permanent Magnet Motor with Assisted Barriers for the Improvement of Torque Characteristics. IEEE Trans. Magn. 2014, 50, 1–4. [Google Scholar] [CrossRef]
- Wang, X.; Zhang, H.; Zhou, W.; Dou, R. The study of influence on the performance of PMSM with space between permanent magnet pieces. In Proceedings of the 2011 International Conference on Electrical Machines and Systems, Beijing, China, 20–23 August 2011. [Google Scholar]
- Sorgdrager, A.J.; Grobler, A.J. Influence of magnet size and rotor topology on the air-gap flux density of a radial flux PMSM. In Proceedings of the 2013 IEEE International Conference on Industrial Technology (ICIT), Cape Town, South Africa, 25–28 February 2013. [Google Scholar]
- He, C.; Wu, T. Analysis and design of surface permanent magnet synchronous motor and generator. CES Trans. Electr. Mach. Syst. 2019, 3, 94–100. [Google Scholar] [CrossRef]
- Nur, T.; Haroen, Y. Investigation the influence of magnet slots with fixed slot opening width on the cogging torque of Inset-PMSM. In Proceedings of the 2nd IEEE Conference on Power Engineering and Renewable Energy (ICPERE) 2014, Bali, Indonesia, 9–11 December 2014. [Google Scholar]
- Feng, G.; Qi, W.; Zhang, B.; Li, C. Analysis and comparison of three-phase variable frequency PMSM with single-phase induction motor in household appliances. In Proceedings of the 2011 International Conference on Electrical Machines and Systems, Beijing, China, 20–23 August 2011. [Google Scholar]
- Spina, I.; del Pizzo, A.; Beneduce, L.; Cascone, B.; Fratelli, L. Comparative analysis of performance and energy losses in light railways vehicles equipped with IM or PMSM drive. In Proceedings of the 2014 International Symposium on Power Electronics, Electrical Drives, Automation and Motion, Ischia, Italy, 18–20 June 2014. [Google Scholar]
- Kim, K.; Bae, J.; Kim, W.H.; Ham, S.H.; Cho, S.; Lee, J. Design and comparison between IM and PMSM for hybrid electrical vehicles. In Proceedings of the 2010 14th Biennial IEEE Conference on Electromagnetic Field Computation, Chicago, IL, USA, 9–12 May 2010. [Google Scholar]
- Petrov, I.; Niemelä, M.; Ponomarev, P.; Pyrhönen, J. Rotor Surface Ferrite Permanent Magnets in Electrical Machines: Advantages and Limitations. IEEE Trans. Ind. Electron. 2017, 64, 5314–5322. [Google Scholar] [CrossRef]
- De Almeida, A.T.; Ferreira, F.J.; Quintino, A. Technical and Economical Considerations on Super High-Efficiency Three-Phase Motors. In Proceedings of the IEEE Transactions on Industry Applications, Louisville, KY, USA, 20–24 May 2012; Volume 50, pp. 1274–1285. [Google Scholar] [CrossRef]
- Popescu, M.; Dorrell, D. A method for determining ipm motor parameters from simple torque test data. In Proceedings of the IECON 2013—39th Annual Conference of the IEEE Industrial Electronics Society, Vienna, Austria, 10–13 November 2013. [Google Scholar]
- Puron, L.D.; Neto, J.E.; Fernández, I.A. Neural networks based estimator for efficiency in VSI to PWM of induction motors drives. In Proceedings of the 2016 IEEE International Conference on Automatica (ICA-ACCA), Curico, Chile, 19–21 October 2016. [Google Scholar]
- Al-Taee, M.A.; Al-Din, M.S.; AlZu’bi, H.S. Real-time efficiency optimisation of open-loop controlled synchronous PM motor drive using Adaptive Neural Networks. In Proceedings of the 2011 IEEE EUROCON-International Conference on Computer as a Tool, Lisbon, Portugal, 27–29 April 2011. [Google Scholar]
- Mosaad, M.I.; Banakher, F.A. Direct Torque Control of Synchronous Motors Using Artificial Neural Network. In Proceedings of the 2019 IEEE International Conference on Electro Information Technology (EIT), Brookings, SD, USA, 20–22 May 2019. [Google Scholar]
Figure 1.
The equivalent circuit diagram of the permanent magnet synchronous motors (PMSM).

Figure 2.
PMSM vector diagrams with different input voltages applied.

Figure 3.
(a) The overall view of test bench of experiments with PMSM; (b) tested PMSM with rotor and stator separated.
Figure 3.
(a) The overall view of test bench of experiments with PMSM; (b) tested PMSM with rotor and stator separated.

Figure 4.
Circuit diagram of the test bench.

Figure 5.
The results of voltage PMSM voltage determination experiment.

Figure 6.
The results of PMSM efficiency determination experiment with nominal 302-V voltage applied during the experiment. (a) Electrical PMSM input parameters; (b) efficiency curve.
Figure 6.
The results of PMSM efficiency determination experiment with nominal 302-V voltage applied during the experiment. (a) Electrical PMSM input parameters; (b) efficiency curve.

Figure 7.
PMSM stator’s voltage and current oscillograms with 302 V applied to the PMSM input.

Figure 8.
The results of the PMSM efficiency determination experiment with a reduced voltage of 240 V applied during the experiment. (a) Electrical PMSM input parameters; (b) efficiency curve.
Figure 8.
The results of the PMSM efficiency determination experiment with a reduced voltage of 240 V applied during the experiment. (a) Electrical PMSM input parameters; (b) efficiency curve.

Figure 9.
PMSM stator’s voltage and current oscillograms with applied 240 V to the PMSM input.

Figure 10.
The results of the PMSM efficiency determination experiment with an increased voltage of 360 V applied during the experiment. (a) Electrical PMSM input parameters; (b) efficiency curve.
Figure 10.
The results of the PMSM efficiency determination experiment with an increased voltage of 360 V applied during the experiment. (a) Electrical PMSM input parameters; (b) efficiency curve.

Figure 11.
PMSM stator’s voltage and current oscillograms with 360 V to PMSM input applied.

Figure 12.
PMSM stator simulation model.

Figure 13.
The PMSM stator voltage and current signals achieved in simulation model (where the voltage and the current signals coincidence).
Figure 13.
The PMSM stator voltage and current signals achieved in simulation model (where the voltage and the current signals coincidence).

Figure 14.
The PMSM stator voltage and current signals achieved in the simulation model (where the current signal overcame the voltage signal).
Figure 14.
The PMSM stator voltage and current signals achieved in the simulation model (where the current signal overcame the voltage signal).

Figure 15.
The PMSM stator voltage and current signals achieved in the simulation model (where the current signal stayed behind the voltage signal).
Figure 15.
The PMSM stator voltage and current signals achieved in the simulation model (where the current signal stayed behind the voltage signal).


Table 1.
PMSM efficiency determination results.
| Experiment | T [N·m] | V [rpm] | P [W] | Pmech [W] | I [A] | cos ф | η [%] |
|---|---|---|---|---|---|---|---|
| 240 V input | 6.2 | 1500 | 1101.8 | 973.9 | 3.66 | 0.853 | 88.39 |
| 260 V input | 6.7 | 1500 | 1163.4 | 1052.5 | 2.96 | 0.879 | 90.5 |
| 280 V input | 6.7 | 1500 | 1156.9 | 1052.5 | 2.64 | 0.929 | 91.0 |
| 302 V input | 7.2 | 1500 | 1156.3 | 1142.8 | 2.81 | 0.997 | 98.7 |
| 320 V input | 6.2 | 1500 | 1067.4 | 983.2 | 1.89 | 0.949 | 92.1 |
| 340 V input | 6.0 | 1500 | 1060.2 | 951.5 | 1.80 | 0.887 | 89.7 |
| 360 V input | 6.3 | 1500 | 1165.6 | 999.1 | 2.20 | 0.763 | 85.7 |
© 2020 by the authors. Licensee MDPI, Basel, Switzerland. This article is an open access article distributed under the terms and conditions of the Creative Commons Attribution (CC BY) license (http://creativecommons.org/licenses/by/4.0/).
Share and Cite
MDPI and ACS Style
Dambrauskas, K.; Vanagas, J.; Zimnickas, T.; Kalvaitis, A.; Ažubalis, M. A Method for Efficiency Determination of Permanent Magnet Synchronous Motor. Energies 2020, 13, 1004. https://doi.org/10.3390/en13041004
AMA Style
Dambrauskas K, Vanagas J, Zimnickas T, Kalvaitis A, Ažubalis M. A Method for Efficiency Determination of Permanent Magnet Synchronous Motor. Energies. 2020; 13(4):1004. https://doi.org/10.3390/en13041004
Chicago/Turabian StyleDambrauskas, Karolis, Jonas Vanagas, Tomas Zimnickas, Artūras Kalvaitis, and Mindaugas Ažubalis. 2020. "A Method for Efficiency Determination of Permanent Magnet Synchronous Motor" Energies 13, no. 4: 1004. https://doi.org/10.3390/en13041004
Note that from the first issue of 2016, this journal uses article numbers instead of page numbers. See further details here.