Performance Evaluation of a Gravity-Assisted Heat Pipe-Based Indirect Evaporative Cooler


1
Faculty of Environmental Engineering, Wroclaw University of Science and Technology, Wybrzeze Wyspianskiego 27, 50-370 Wroclaw, Poland
2
Department of Animal Products Technology and Quality Management, Wroclaw University of Environmental and Life Sciences, C. K. Norwida 25, 50-375 Wroclaw, Poland
*
Author to whom correspondence should be addressed.
Energies 2020, 13(1), 200; https://doi.org/10.3390/en13010200
Submission received: 28 November 2019
/
Revised: 22 December 2019
/
Accepted: 24 December 2019
/
Published: 1 January 2020
Abstract
:In the present work, the effects of different operating parameters on the performance of a gravity-assisted heat pipe-based indirect evaporative cooler (GAHP-based IEC) were investigated. The aim of the theoretical study is to evaluate accurately the cooling performance indicators, such as the coefficient of performance (COP), wet bulb effectiveness, and cooling capacity. To predict the effectiveness of the air cooler under a variety of conditions, the comprehensive calculation method was adopted. A mathematical model was developed to simulate numerically the heat and mass transfer processes. The mathematical model was validated adequately using experimental data from the literature. Based on the conducted numerical simulations, the most favorable ranges of operating conditions for the GAHP-based IEC were established. Moreover, the conducted studies could contribute to the further development of novel evaporative cooling systems employing gravity-assisted heat pipes as efficient equipment for transferring heat.
1. Introduction
According to the Energy Information Administration (EIA), energy from fossil fuels will be responsible for 78% of the total energy consumption in 2040, despite the still growing use of non-fossil fuels (e.g., renewable and nuclear energy). The predicted world energy consumption will rise by 48% in 2040 [1]. Hence, sustainable development based on renewable energy sources is an essential part of rational energy policy. In addition, the building sector significantly affects the world’s total energy consumption. Energy consumed in the building sector accounts for 20.1% of the total energy consumed worldwide [1]. Moreover, large portion of this energy is used by HVAC (Heating, Ventilation, and Air Conditioning) systems [2]. Thus far, several research efforts have been made on reducing the energy consumption in a variety of HVAC systems [3,4,5,6]. Furthermore, due to the significant electricity consumption in traditional air-conditioning systems, the need for novel solutions for maintaining thermal comfort in indoor environments is increasing [7,8,9].
Energy-saving air-conditioning systems have an enormous potential to benefit from evaporative cooling [2,10,11]. Evaporative cooling is able to generate cooling energy through water evaporation. It can be divided into direct evaporative cooling (DEC) and indirect evaporative cooling (IEC). The main drawback of the DEC systems is the increase of moisture content in the product air due to direct contact with water. In typical IEC systems, product air in the dry section of the air cooler is cooled with constant moisture content. In the wet section of the air cooler, working air absorbs a large amount of latent heat by water evaporation. Therefore, an IEC system is more applicable due to the reduction of the air temperature while its moisture content remains constant. As a result, IEC systems can reduce electricity demand significantly compared to mechanical vapor compression refrigeration systems.
Nowadays, the development of IEC systems technology has gained much attention among researchers. Hence, experimental and numerical studies on evaporative coolers are reported in a number of research papers. Tariq et al. carried out numerical studies of a regenerative counter flow evaporative cooler [12] and cross-flow-type Maisotsenko evaporative cooler [13]. The thermal performance enhancement was obtained by the addition of nanoparticles in the wet channel. The improvement of the cooling effectiveness, cooling capacity, and energy efficiency ratio was achieved due to the enhanced heat and mass transfer characteristics of nanofluids compared to the water. A low concentration of nanofluid was recommended for the optimal design of an IEC system. Liu et al. [14] conducted an experimental and numerical study of a high-efficiency IEC system approaching ambient air dew point temperature. Due to an optimized air and water flow arrangement, the wet-bulb efficiency of the proposed evaporative cooler was increased by 29.3% and the coefficient of performance (COP) was increased by 34.6%, compared to the commercial unit of the same capacity. Al-Abbasi and Al-Alawi [15] analyzed numerically the performance of the IEC system with regeneration. In order to obtain higher accuracy, the CFD technique was applied. The developed model was validated against existing experimental data, and the simulations were in close agreement. An IEC system with selected design parameters was evaluated in real condition for two hot climates in the Middle East: dry and humid, respectively. The IEC system for the arid climate was more efficient and was able to reduce the temperature by 18 to 22 °C. However, a temperature drop of around 13 °C was obtained on average for humid conditions. Wang et al. [16] presented a comparative study of the cross-flow regenerative IEC cooler and the conventional cross-flow IEC cooler. The applicability of the two coolers was studied numerically. The impact of the main operating parameters on the cooling performance of the IEC coolers was analyzed, and it was revealed that the regenerative IEC cooler is more favorable than the conventional IEC cooler under a low-supply air flow rate for a standalone mode.
The incorporation of IEC devices and conventional HVAC systems into hybrid HVAC systems is a promising application method for evaporative cooling. In moderate and humid climates, it allows reducing the peak electricity demand. The possibilities of IEC implementation in conventional air-conditioning systems were introduced in previous studies [17,18,19,20]. Moreover, Belusko et al. [21] studied the performance of the CO2 refrigeration system coupled with an IEC system. The performance of the CO2 refrigeration system was improved by reducing the periods during which it operates in transcritical mode.
There is a research gap dealing with the durability of evaporative coolers and the microbiological quality of supply air in the IEC systems. Adverse health effects related to the microbiological quality of air in air-conditioned spaces are increasing. Moreover, indoor air quality is becoming an important issue for public health [22,23,24]. The typical heat and mass exchanger for evaporative cooling comprises a stack of thin plastic sheets that are densely packed. It is worthy to note that the typical design of the evaporative cooler can cause difficulties in cleaning, which can lead to bacterial growth on the wet surface of a heat exchanger. As a result, there is a possible supply air contamination due to air leakage. One way to avoid these obstacles is an application of cheap and replaceable materials [10,25]. However, it may lead to the production of a lot of waste. According to a review study of the membrane processes for HVAC systems [26], the application of membranes has the potential to solve issues related to biological growth in the evaporative cooler core. The structure of the membrane is able to prevent the transmission of microorganisms due to the small pores. As a result, a sanitary evaporative cooler may be designed. Englart [27] revealed the use of a hollow fiber membrane module for semi-direct air evaporative cooling. It should be noted that a relatively high air pressure drop was observed. However, satisfactory energy efficiency ratio (EER) indicators were achieved.
In order to address the aforementioned essential concerns, this paper proposes a comprehensive analysis of the gravity-assisted heat pipe-based indirect evaporative cooler (GAHP-based IEC). Nowadays, the development of heat pipe-based heat exchangers technology is continuously increasing due to the strong potential for energy savings. In addition, the significant reduction in the manufacturing costs of heat pipes in recent years was reported [28,29,30]. The study related to the use of heat pipes for indirect evaporative cooling was presented by Riffat and Zhu [31]. They evaluated the performance of the heat pipe-based heat and mass exchanger for building cooling. System properties such as the cooling capacity and temperature drop under steady operating conditions were investigated. Fins were used in order to increase the convective heat transfer in the evaporator section of the heat pipes. Moreover, a porous ceramic water container was adopted around the condenser section. As a result, a high cooling efficiency could be achieved under proper operating conditions such as dry and windy weather and a reasonable inlet air velocity of 0.6 m/s. More recent research studies in the area of heat pipes implementation for indirect evaporative cooling were reported by Boukhanouf et al. [32] and Alharbi et al. [33]. Boukhanouf et al. proposed an approach that combines finned heat pipes in a dry channel and porous ceramic tube modules in a wet channel. Alharbi et al. disclosed a prototype made of integrated finned heat pipes and water-filled hollow porous ceramic cuboids. The design, mathematical modeling, and experimental work were presented. It was concluded that the concept of the implementation of heat pipes as an alternative to plate heat exchangers offers low maintenance cost, a durability of core components, and no environmentally harmful plastics materials in core components, and they can be manufactured and assembled easily. However, the investment cost should be considered, too.
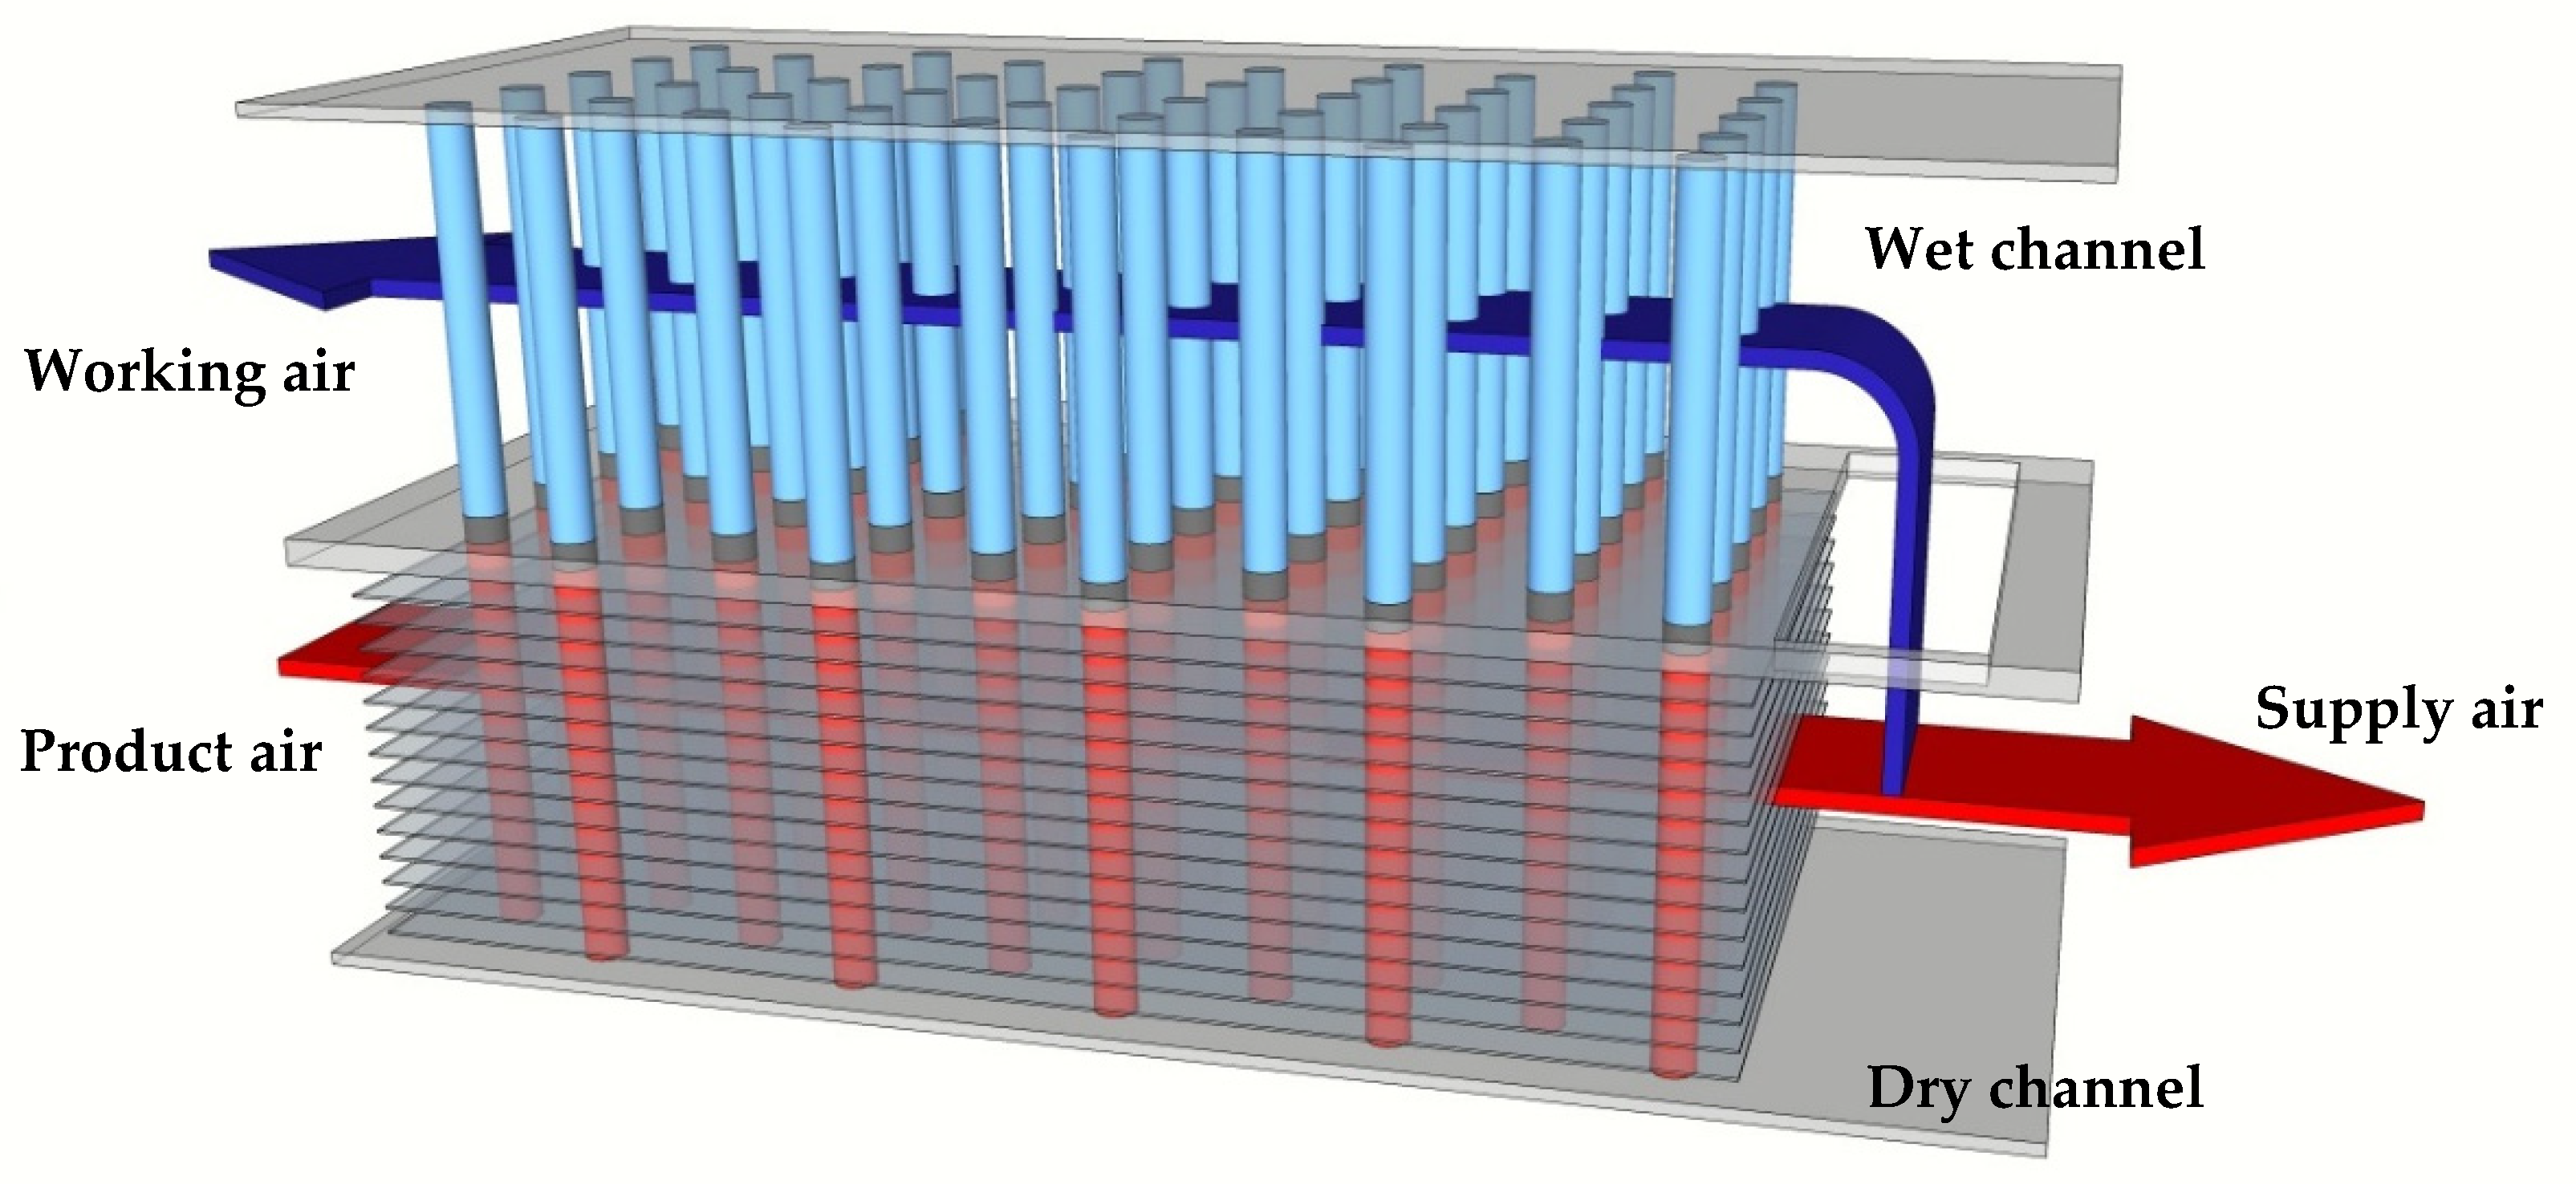
In this context, this work intends to discuss a novel design of heat and mass exchangers. Figure 1 presents the schematic of the GAHP-based IEC with a staggered tube arrangement. Its working principle lies in the implementation of a gravity-assisted heat pipe (GAHP) as a heat transfer device. A GAHP, also known as a two-phase closed thermosiphon or wickless heat pipe, is a special type of heat pipe where working fluid circulation happens inside it due to gravity [34]. There are three characteristic regions including the evaporator, adiabatic section, and condenser. The condenser of a GAHP always has to be placed above the evaporator. In addition, a continuous flat-plate fin was applied for the heat transfer enhancement in the dry channel. As far as the authors know, no research work has been presented on the usage of a wickless heat pipe in evaporative cooling technology.
The main objective of the present study is to evaluate the cooling performance indicators of the novel GAHP-based IEC, such as the coefficient of performance (COP), wet bulb effectiveness, and cooling capacity. The effects of the chosen operating parameters are analyzed based on their impact on the cooling performance indicators. In order to establish the most favorable ranges of operating conditions for the GAHP-based IEC, comprehensive numerical simulations will be performed.
2. Methods
To enhance the cooling performance of the GAHP-based IEC, the regenerative configuration of an IEC was applied (see Figure 1). In general, in the regenerative operating mode, a certain fraction of the product air leaving the dry channel is diverted to the wet channel. Since the working air is indirectly pre-cooled and has a lower wet bulb temperature in comparison with the intake product air, a lower supply air temperature can be achieved.
During operation, the product air flows along the dry channel, transferring its sensible heat to the wet channel. As a result, the product air temperature decreases without a humidity ratio change. Then, part of the air is branched from the product air and flows in countercurrent arrangement along the wet channel. The working air absorbs sensible heat from the product air in the dry channel. The gathered heat in the GAHP condenser is removed due to the water evaporation from the condenser external surface. In this context, the wet channel should be made of specially designed materials with high water retention and wick ability, which allow for an even water distribution around the condensation section of GAHPs. For this purpose, a porous plastic layer was implemented. Finally, the moist working air is rejected from the cooler, while the supply air can be provided to the conditioned room.
2.1. Mathematical Modeling
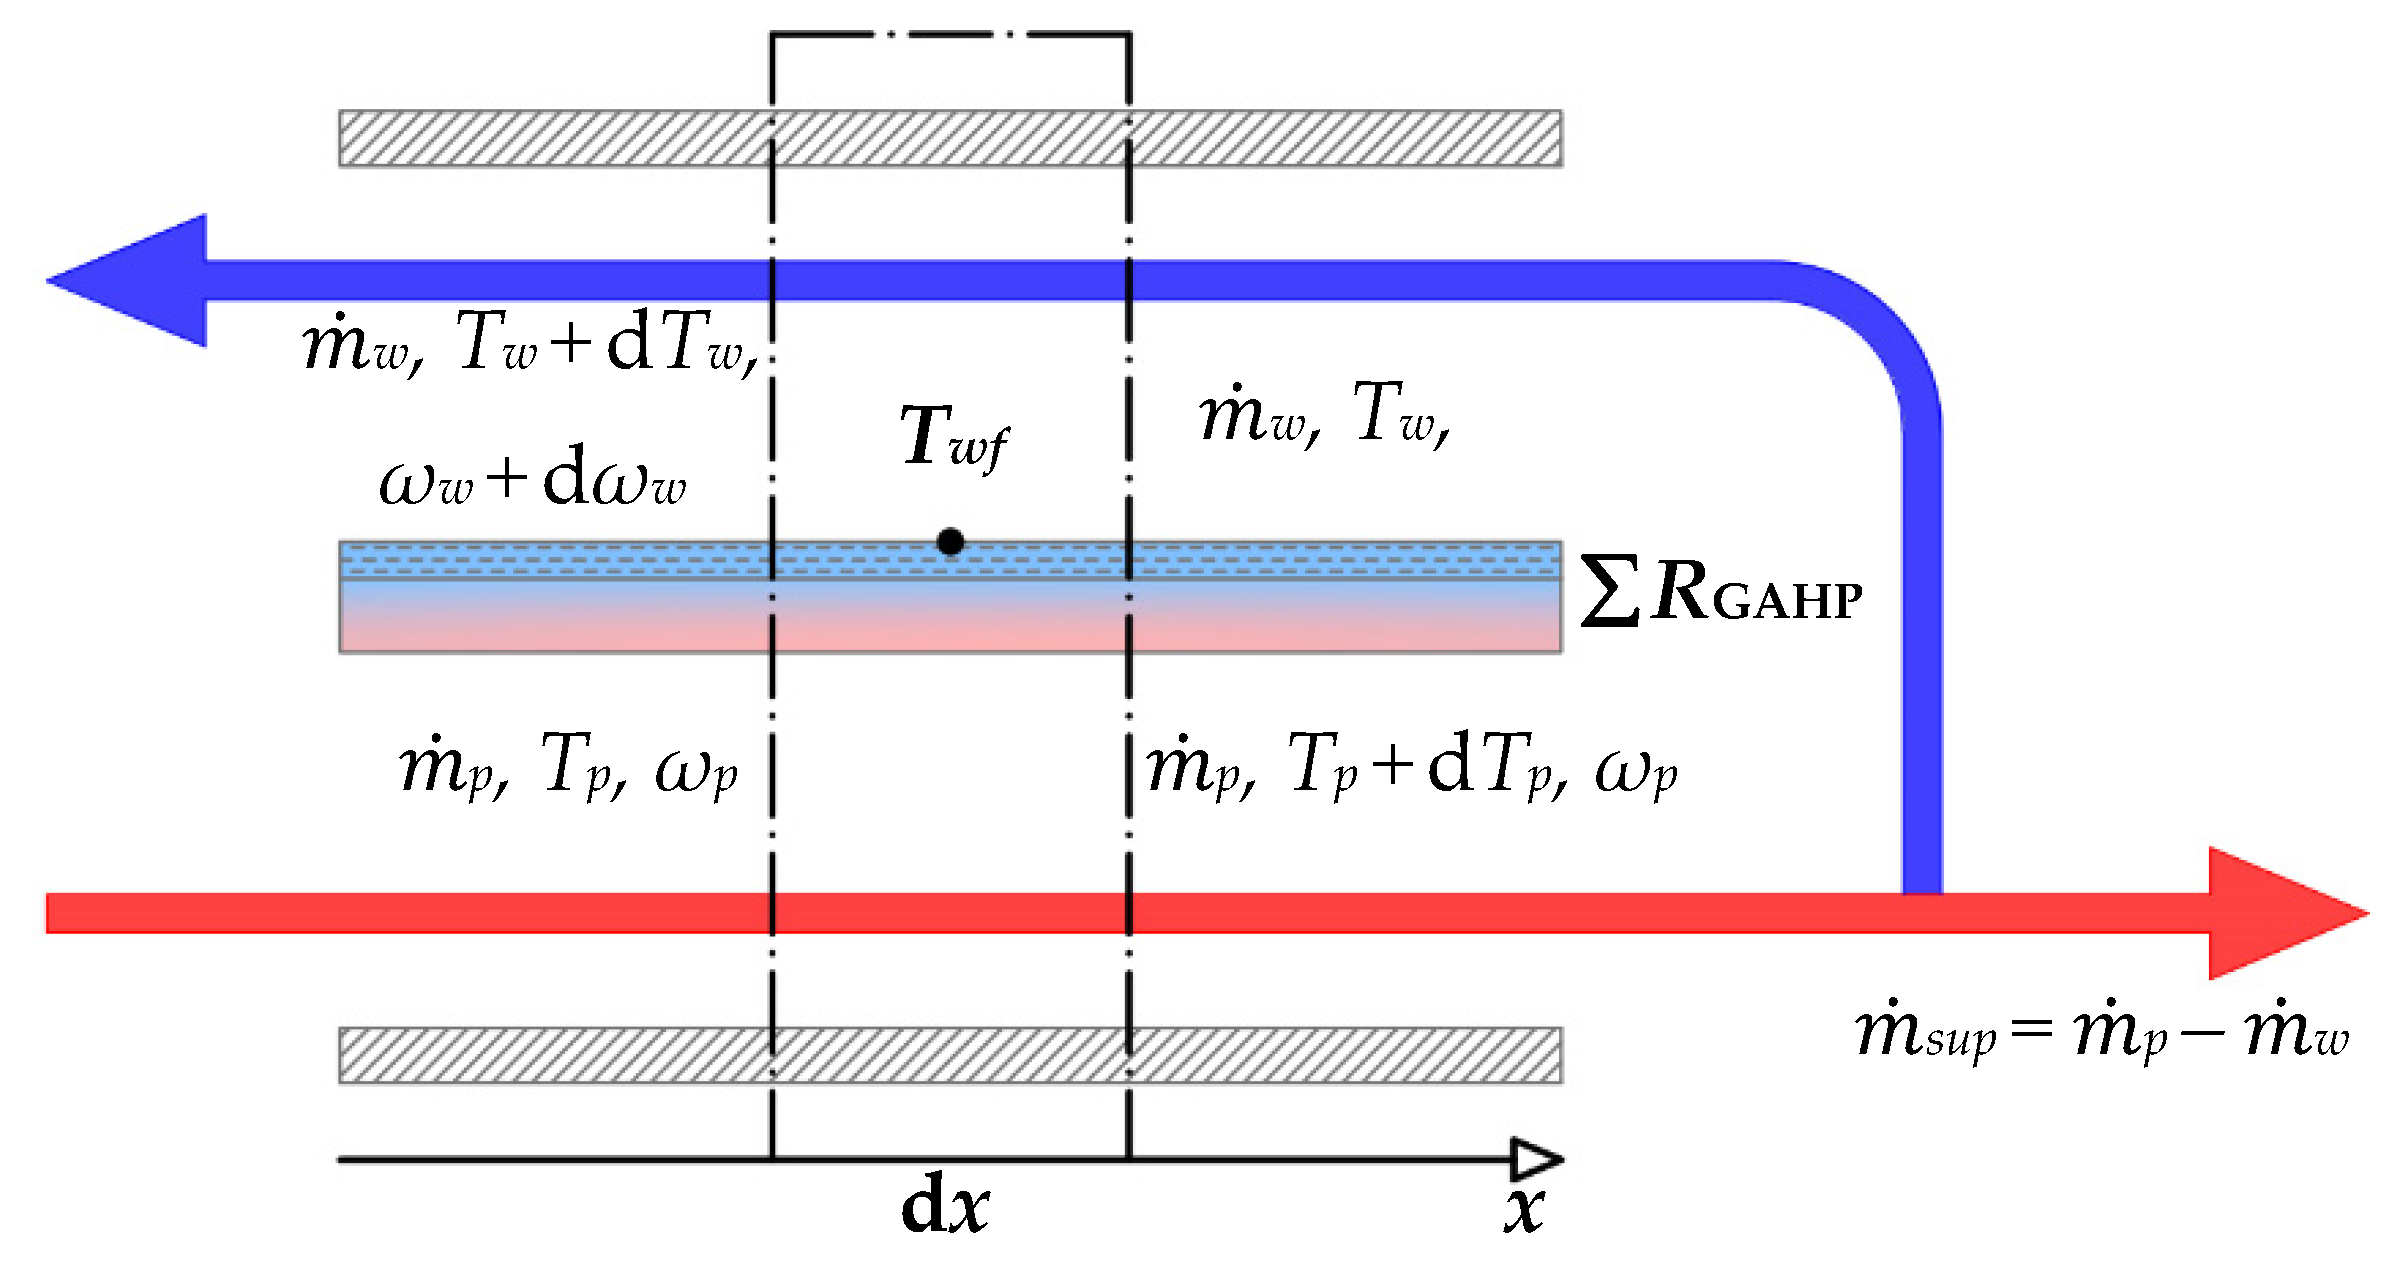
A mathematical model describing the simultaneous heat and mass transfer in the GAHP-based IEC was derived on the basis of principles of heat and mass conservation. Consequently, the impact of key parameters on the GAHP-based IEC cooling performance can be studied. In addition, the thermal resistances of vaporization and the condensation of working fluid inside GAHPs were taken into account [35]. The heat transfer limitations of GAHPs were adopted from the studies of Khandekar et al. [36]. Dryout limitation was omitted due to the assumed filling ratio of GAHPs greater than 40%. It should be highlighted that both the boiling limitation and the flooding limitation were estimated to be greater than the heat fluxes transported by the applied GAHP. Moreover, a one-dimensional model was employed to simplify the calculations in which each GAHP was abstracted into two flat channels consisting of a dry channel and a wet channel [37,38]. To predict the air temperature distributions along the x direction, the cooler is divided into identical computational elements with an equal length dx, as shown in Figure 2.
The following assumptions were made to simplify the mathematical model: the conditions are steady state and adiabatic; the air properties and heat transfer coefficients remain constant; the airflows are considered to be fully developed; the mass of water added to the working air is negligible; the water film is stationary, uniform, and thin. For the computational element presented in Figure 2, using the stated assumptions, the following system governing Equations (1)–(4) was obtained.
Since only sensible heat transfer occurs in the dry channel, the product air temperature decreases due to heat transfer to the finned GAHP wall at a constant humidity ratio. As a result, the sensible heat flux is provided to the wet porous layer where, due to the water evaporation, it is exchanged for latent heat. After simplifying and rearranging, the energy balance of a computational element on the product air side yields the following equation:
As the heat and mass transfer processes take place simultaneously in the working air channel, the mathematical modeling is more complicated. Due to sensible heat transfer to the water film on a wet porous layer, the temperature variation for the working air in the wet channel is observed. Similarly to the heat transfer in a dry channel, the sensible heat of working air is released as the latent heat of water evaporation. After simplifying and rearranging, the energy balance of a computational element on the working air side can be expressed as follows:
The vapor mass transfer occurs only at the wet porous layer under the driving force of the water vapor partial pressure difference. As a result, the humidity ratio of the working airflow increases along the wet channel. The analogy between heat transfer and mass transfer in the wet channel of a GAHP-based IEC was adopted according to the Lewis factor, and to simplify the model, it was assumed to be unity for air–water mixtures [10,32,33]. Therefore, the mass transfer coefficient was obtained from the heat transfer coefficient in the wet channel. After simplifying and rearranging, the mass balance of a computational element on the working air side gives the following equation:
Finally, in order to find the wet porous layer temperature, the overall energy balance of a computational element was verified. This can be expressed by Equation (4).
Based on the assumption that the moist air in contact with the wet porous layer is saturated, the humidity ratio is a function of the water film temperature. In order to determine the humidity ratio of the saturated air under a certain temperature at the water film and working air interface, the following equation was used [39]:
The saturated vapor pressure at the water film temperature was evaluated from empirical Equation (6) [39].
where C1 = −5.8002206 × 10³, C2 = 1.3914993, C3 = −4.8640239 × 10⁻², C4 = 4.1764768 × 10⁻⁵, C5 =−1.4452093 × 10⁻⁸, C6 = 6.5459673, and Twf should be expressed in degrees Kelvin.
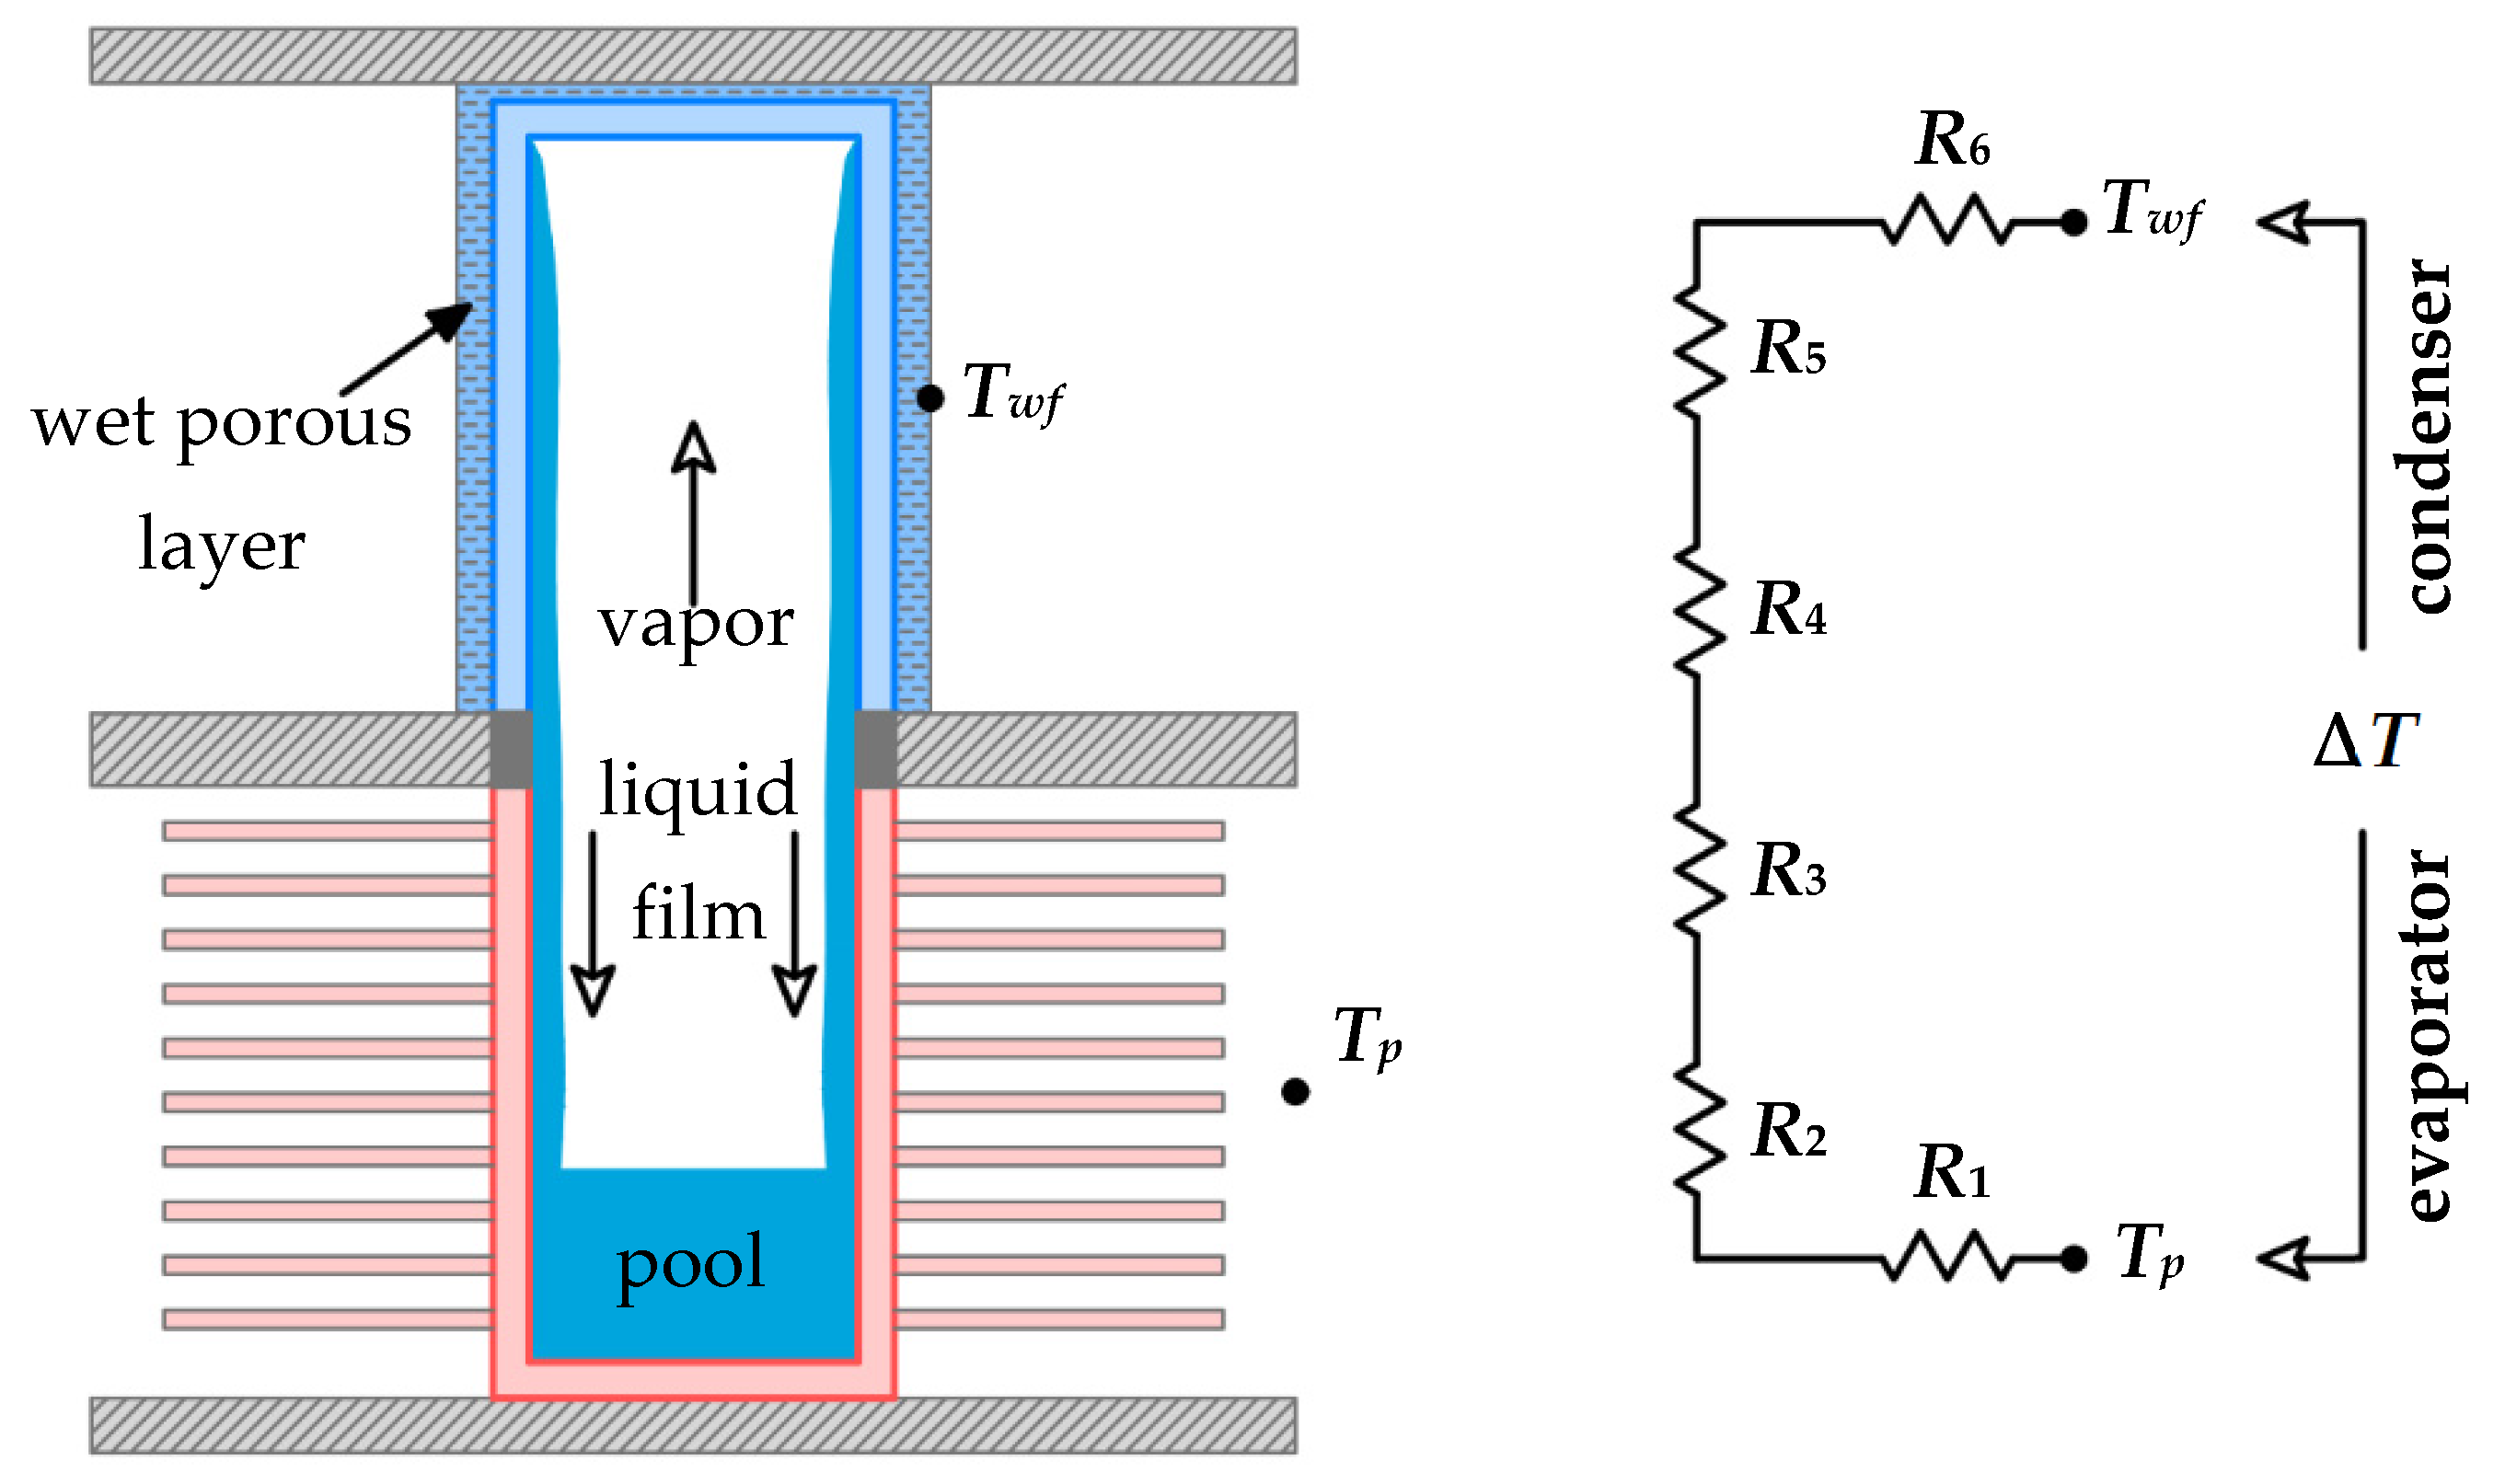
Figure 3 presents the applied GAHP, which is partially filled with deionized water as a working fluid. In addition, a simplified diagram of a thermal resistance network was presented. The heat transfer due to convection and conduction leads to a reduced temperature of the product air. On the other hand, it can be seen that the thermal resistance of each component decreases the heat transfer between the product air and the working air. It is worth mentioning that the thermal resistance network approach is a robust engineering method that is suitable to achieve results with reasonable accuracy [28].
The overall heat transfer coefficient between the product airflow in the dry channel and the wet porous layer in the wet channel can be expressed by Equation (7). This equation was derived from thermal resistances that were connected in series between the product airflow and the water film on the surface of the porous layer. The thermal resistances of liquid–vapor interfaces and axial conduction resistance through GAHPs were neglected. Therefore, the overall heat transfer resistance consists of six components, i.e., R1, R2, R3, R4, R5, and R6. The thermal resistance R1 is related to the interface between the product air in the dry channel and the finned GAHP wall. Additionally, the thermal resistances related to the evaporator include the radial conduction (R2) and the evaporation of the working fluid (R3). The thermal resistances R4, R5, and R6 are related to the condenser section and stand for the condensation of the working fluid, the radial conduction in the GAHP wall, and the radial conduction through the wet porous layer, respectively.
Equation (7) can be expressed in a more detailed manner. This can be written as:
The developed simulation model including the associated initial and boundary conditions was solved to predict the air temperature distributions along the product and the working channels. In this study, the software of MATLAB was employed to solve the governing equations. The system of first-order ordinary differential Equations (1)–(3) was discretized and solved by using the ode45 procedure. An iterative method was adopted to meet the initial and boundary conditions. The suitable conditions applied for the solution of the mathematical model were listed in Table 1.
2.2. Calculation of Heat Transfer Parameters of the GAHP-Based IEC
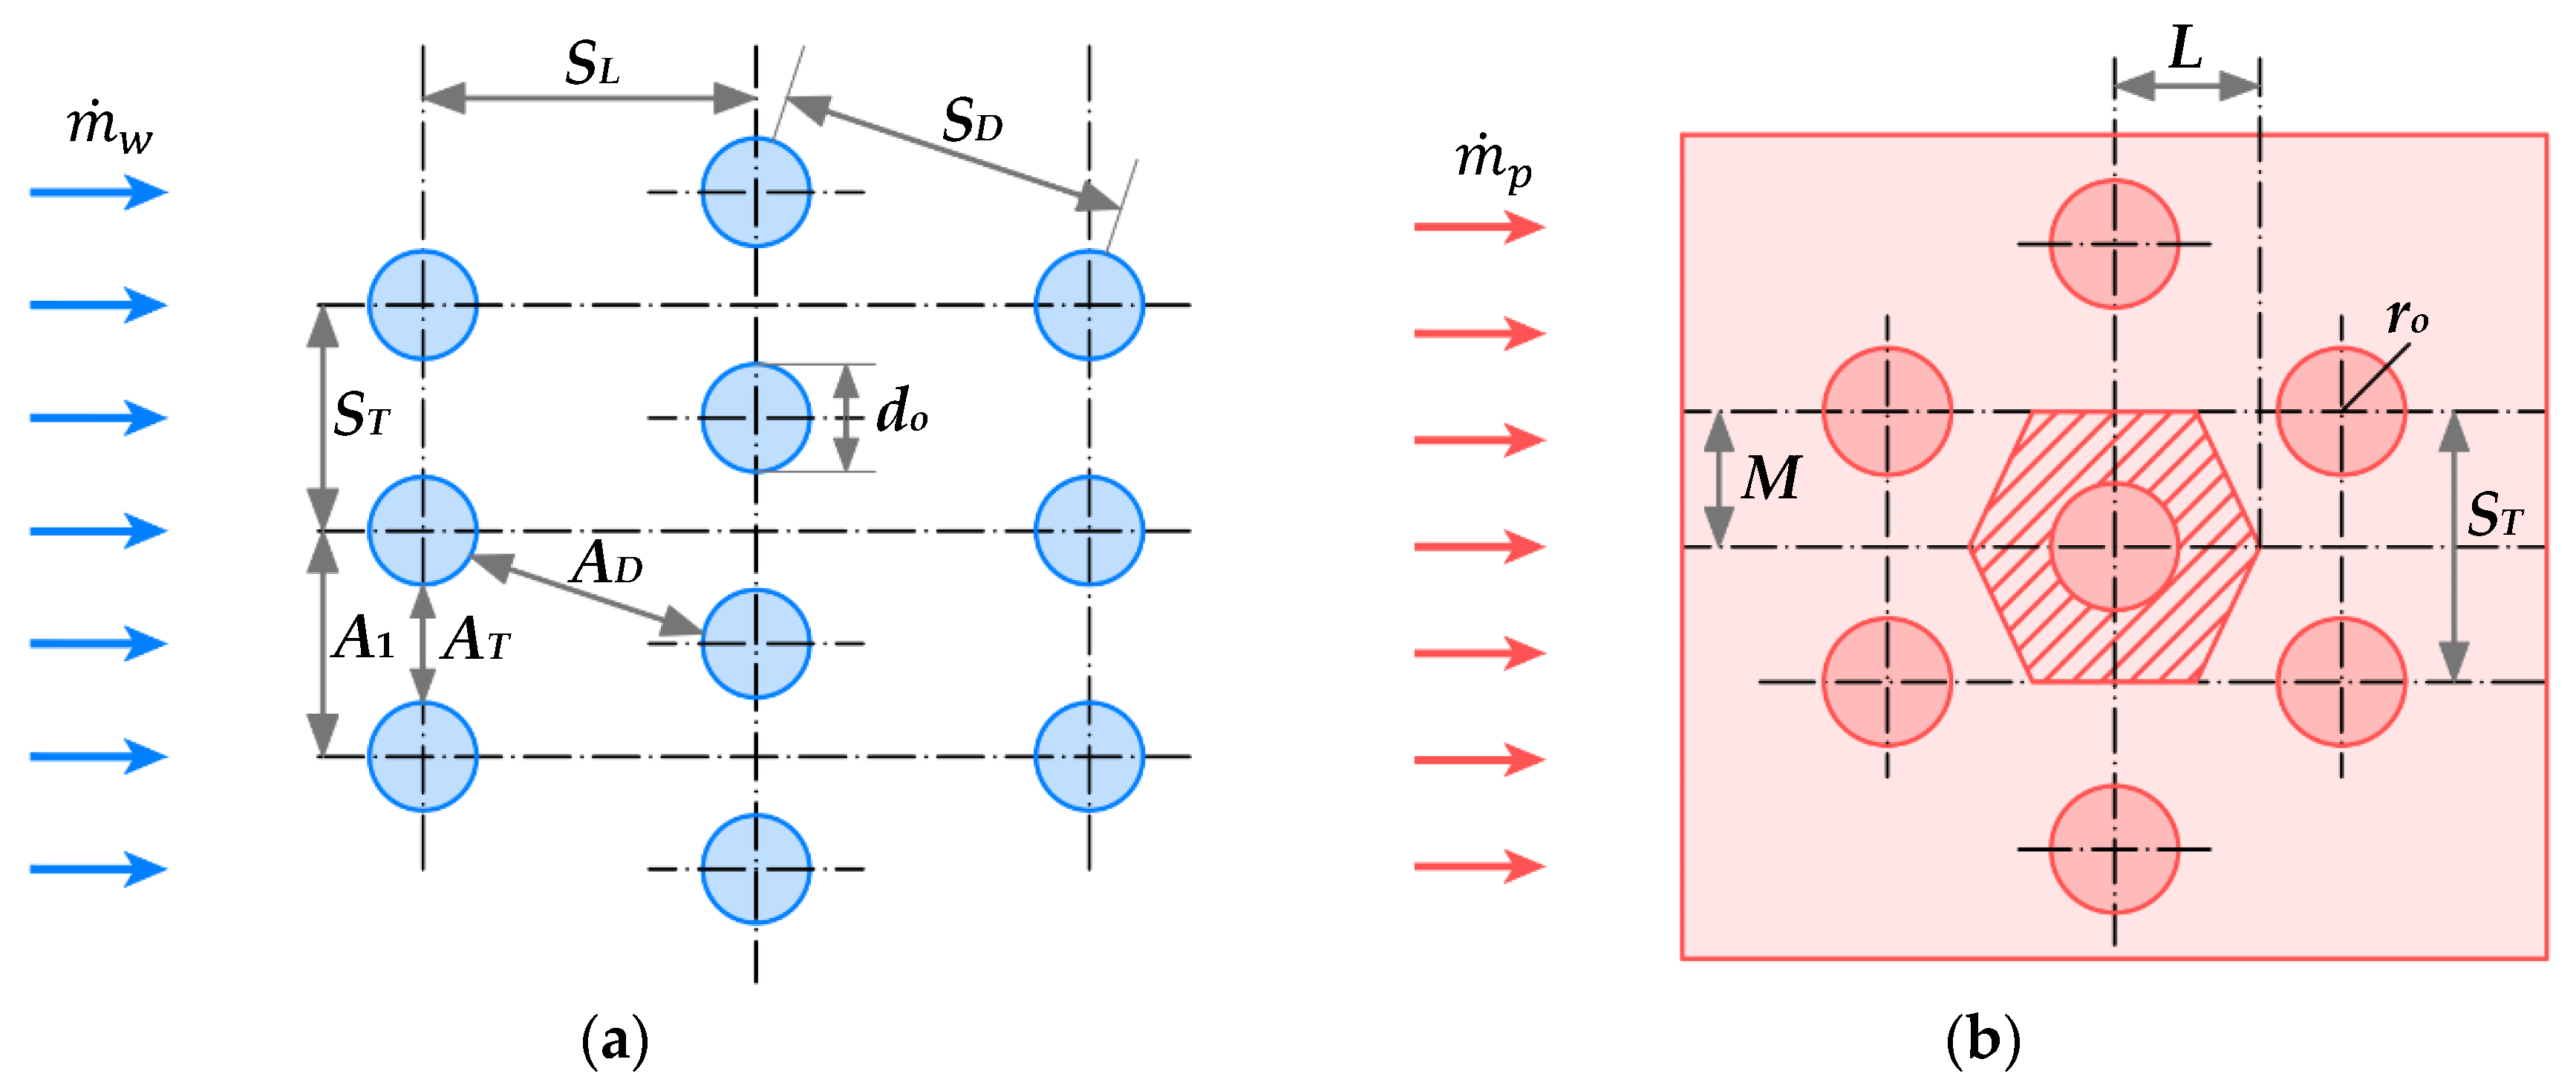
The GAHPs in a tube bank were arranged staggered in the direction of airflow, as shown in Figure 4. The outer GAHP diameter do was assumed as the characteristic length. The transverse pitch ST, longitudinal pitch SL, and diagonal pitch SD were defined between the GAHPs’ centers. In addition, the Reynolds number was determined on the basis of the maximum air velocity.
The relations for the calculation of heat transfer coefficients were shown in Table 2. To predict the average Nusselt number in the working air channel of the GAHP-based IEC, Equation (9) was applied for GAHP banks with more than 16 rows. In other cases, the correction factor should be used, which is given in [40]. In the product air channel, the Colburn j factor was adopted to calculate the convection heat transfer of staggered GAHP banks with continuous flat-plate fins, and it can be expressed by Equation (10) [41]. All the fluid properties were evaluated at the arithmetic mean temperature of the fluid.
It should be emphasized that the thermal resistances of the vaporization and condensation of the working fluid inside the GAHP were analyzed. In order to calculate the vaporization heat transfer for the GAHP evaporator section, Imura’s correlation with a pressure correction factor was employed in the current study, as depicted as Equation (11) [35]. The Nusselt’s theory for film-wise condensation can be considered for estimation of the heat transfer coefficient in the GAHP condenser section. However, at low heat fluxes, it leads to overestimate the condensation heat transfer coefficient in comparison with the experimental data. In this regard, the correlation proposed by Jouhara and Robinson was adopted to improve the prediction of the condensation heat transfer coefficient, depicted as shown in Equation (12) [35].
In order to obtain the overall surface efficiency for the air side of the finned product, it is required to determine the performance of a single fin. According to Schmidt’s approximation method, the continuous flat plates can be evenly divided into hexagonal-shaped fins in the case of the staggered GAHPs arrangement, as shown in Figure 4b [42]. The efficiency of hexagonal fins may be determined based on an equivalent outer radius of a circular fin with an efficiency corresponding to the efficiency of a hexagonal fin. The equivalent radius was defined by Equation (15). Further details of the overall product air-side surface efficiency calculation are shown in Table 3.
2.3. Performance Evaluation of GAHP-Based IEC
The cooling performance of an IEC system can be evaluated by several characteristic indicators [10]. The wet bulb effectiveness is commonly applied to evaluate the cooling effectiveness. It is the indicator representing the extent to which the outlet product air temperature approaches the wet bulb temperature of the inlet air. The mathematical expression for wet bulb effectiveness can be written as:
In addition, the supply cooling capacity was evaluated as the cooling effect provided by the supply airflow. The supply cooling capacity can be referred to the product air temperature difference, since the air is cooled at the constant moisture content. For this reason, this is expressed as follows:
The coefficient of performance (COP) for an IEC system can be defined as the ratio of the supply cooling capacity to fan power consumption, which is expressed by Equation (20). It should be emphasized that the power consumption of a water distribution system was neglected owing to its minor value compared to the fan power consumption [12,13,32]. The COP can be easily converted into the energy efficiency ratio (EER) by multiplying by the unit conversion factor of 3.413 [10].
The power required to transport an airflow through the GAHP-based IEC is proportional to the pressure drop. Therefore, the fan power demand can be expressed by Equation (21). The pressure drops were calculated for the product airflow and working airflow, taking into account fan efficiency. Further details of the pressure drop calculation procedure are shown in Table 4.
3. Validation of the Model Accuracy
In order to estimate the accuracy and applicability of the established simulation method, the results from the numerical simulation were compared with the existing experimental data [32,33,43,44]. The acquired experimental data were provided for the heat pipe-based counter flow regenerative IECs, similar to the analyzed GAHP-based IEC, as shown in Figure 1. Experimental conditions were precisely reproduced in the conducted numerical calculations. The main design and operating parameters for the experimental studies are listed in Table 5. The temperature distribution inside the heat and mass exchanger, cooling capacity, and wet bulb effectiveness estimated by the model were compared with the measurement data.
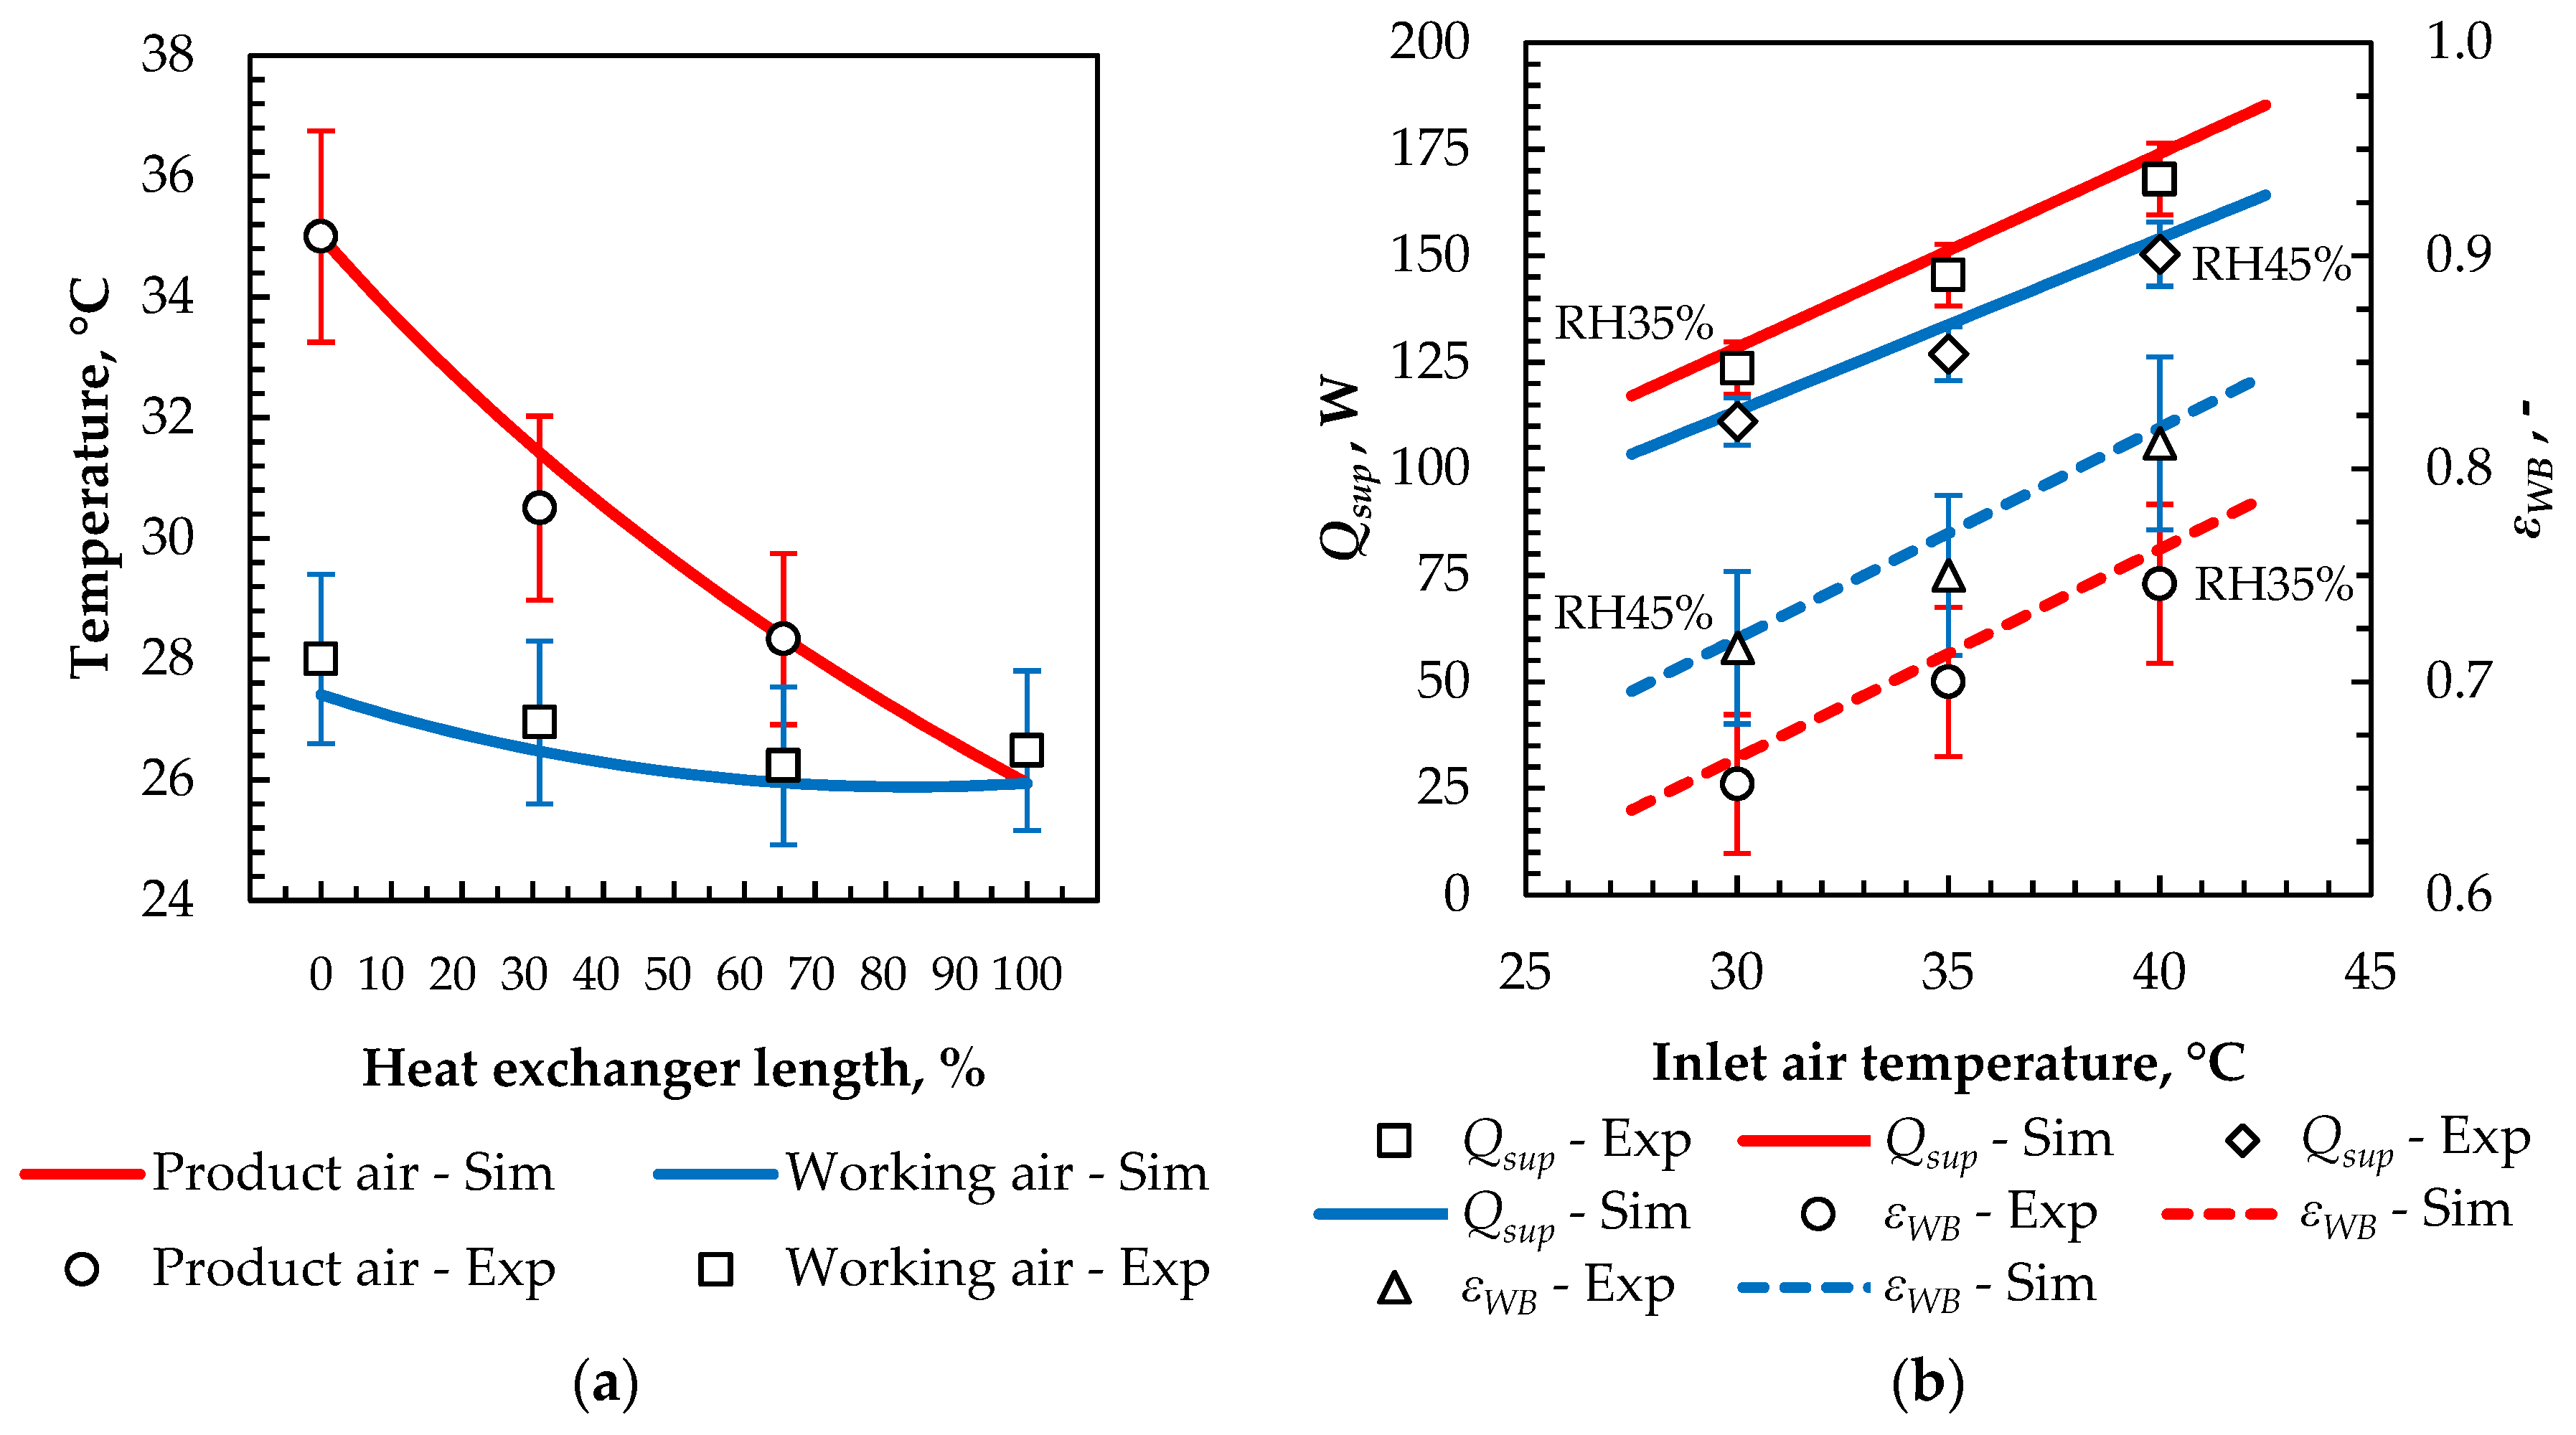
The experimental data provided by Amer [43] were applied to check the model accuracy for the proposed GAHP-based IEC. The experimental studies were carried out on a heat pipe and porous ceramic-based sub wet-bulb temperature evaporative cooler (IEC1). One set of experiments was conducted to determine the air temperature distribution along the dry and wet channel. Figure 5a compares the calculated air temperature distribution with the measurement data. It should be noticed that the simulation is able to predict accurately the temperature distribution inside a channel with an average discrepancy up to 3.2%. In addition, the inlet temperature of product air was varied, and its influence on the cooling capacity and wet bulb effectiveness was observed for two different relative humidity conditions, as shown in Figure 5b. It was observed that both the cooling capacity and wet bulb effectiveness were predicted with a maximum discrepancy of about 5%, proving the accuracy and reliability of the developed simulation method.
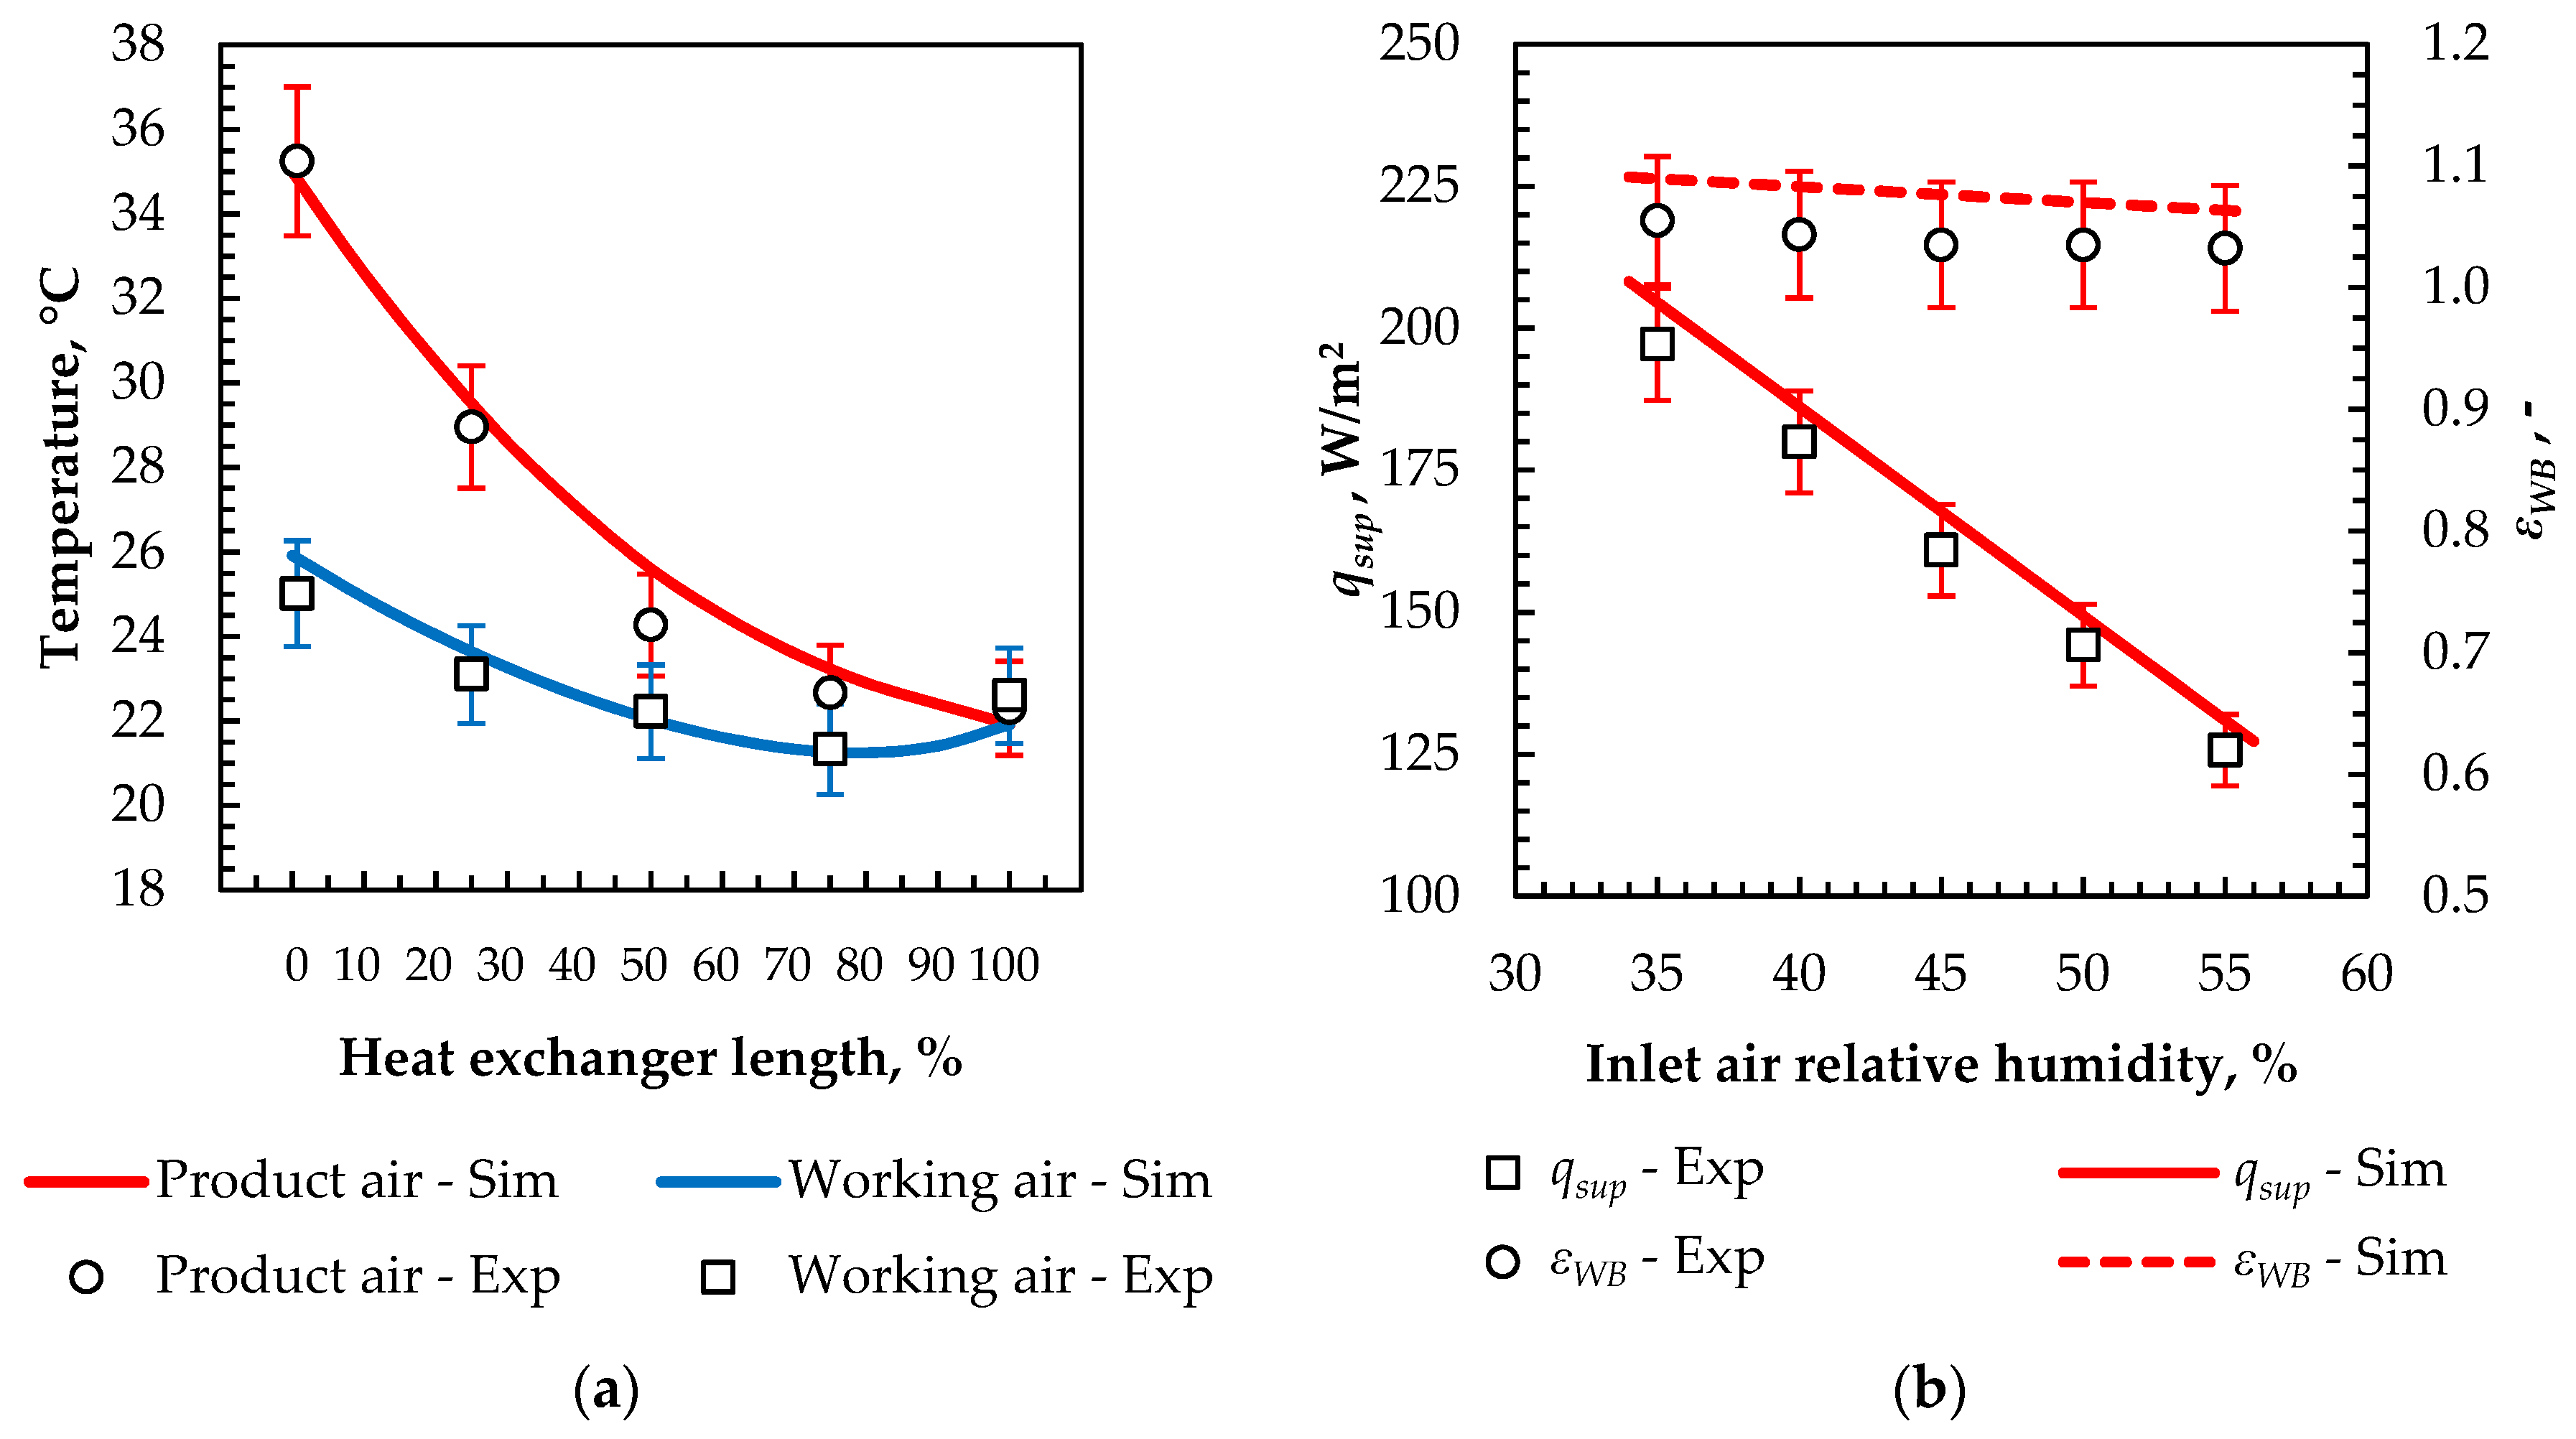
Alharbi et al. [33] carried out an experimental study on an integrated heat pipe and porous ceramic cuboid-based indirect evaporative cooler (IEC2). The experimental data were employed to perform the second validation by a comparison with the simulation results. The measurement data and simulation results were presented in Figure 6. The simulated air temperature distribution inside of IEC2 follows the measurement points, although some insignificant discrepancy can be observed (Figure 6a). The largest error in terms of the product air temperature drop is 1.3 °C, and the corresponding discrepancy is 5.2%. Figure 6b compares the simulation results with the experimental data and presents the cooling capacity and wet bulb effectiveness under variable inlet air relative humidity. The deviation of the obtained results within 5% indicates that the model is able to evaluate the cooling performance precisely. However, it can be observed that the calculated performance indicators of the IEC2 were overestimated. It is due to the mathematical model assumptions, i.e., uniform air and water distribution, and no heat exchange with surroundings.
4. Results and Discussion
The mathematical model was adequately validated by using the data of two empirical studies available in the literature. It should be emphasized that the mathematical model indicates a satisfactory accuracy; hence, it can be applied to predict the performance of the GAHP-based IEC. The following section is focused on cooling performance evaluation of the proposed indirect evaporative cooler in terms of several performance parameters such as the COP coefficient, wet bulb effectiveness, supply cooling capacity, and product air temperature drop. A parametric study was carried out to investigate the influences due to the inlet air condition, inlet air velocity, number of GAHP rows, fin spacing, and working-to-product airflow ratio. In addition, the recommended operating conditions were provided to achieve a better cooling performance.
The numerical simulations were performed based on the pre-set operating conditions as listed in Table 6 and Table 7.
4.1. Impact of Inlet Air Temperature and Inlet Air Relative Humidity
In this section, the impacts of inlet air temperature and inlet air relative humidity on cooling performance were discussed. After validation of the proposed performance evaluation methodology at different conditions, a numerical study was carried out for the operating parameters depicted in Table 6. Numerical simulations were conducted to evaluate the COP coefficient, wet bulb effectiveness, product air temperature difference, and supply cooling capacity, respectively. The main performance indicators were defined by Equations (18)–(20).
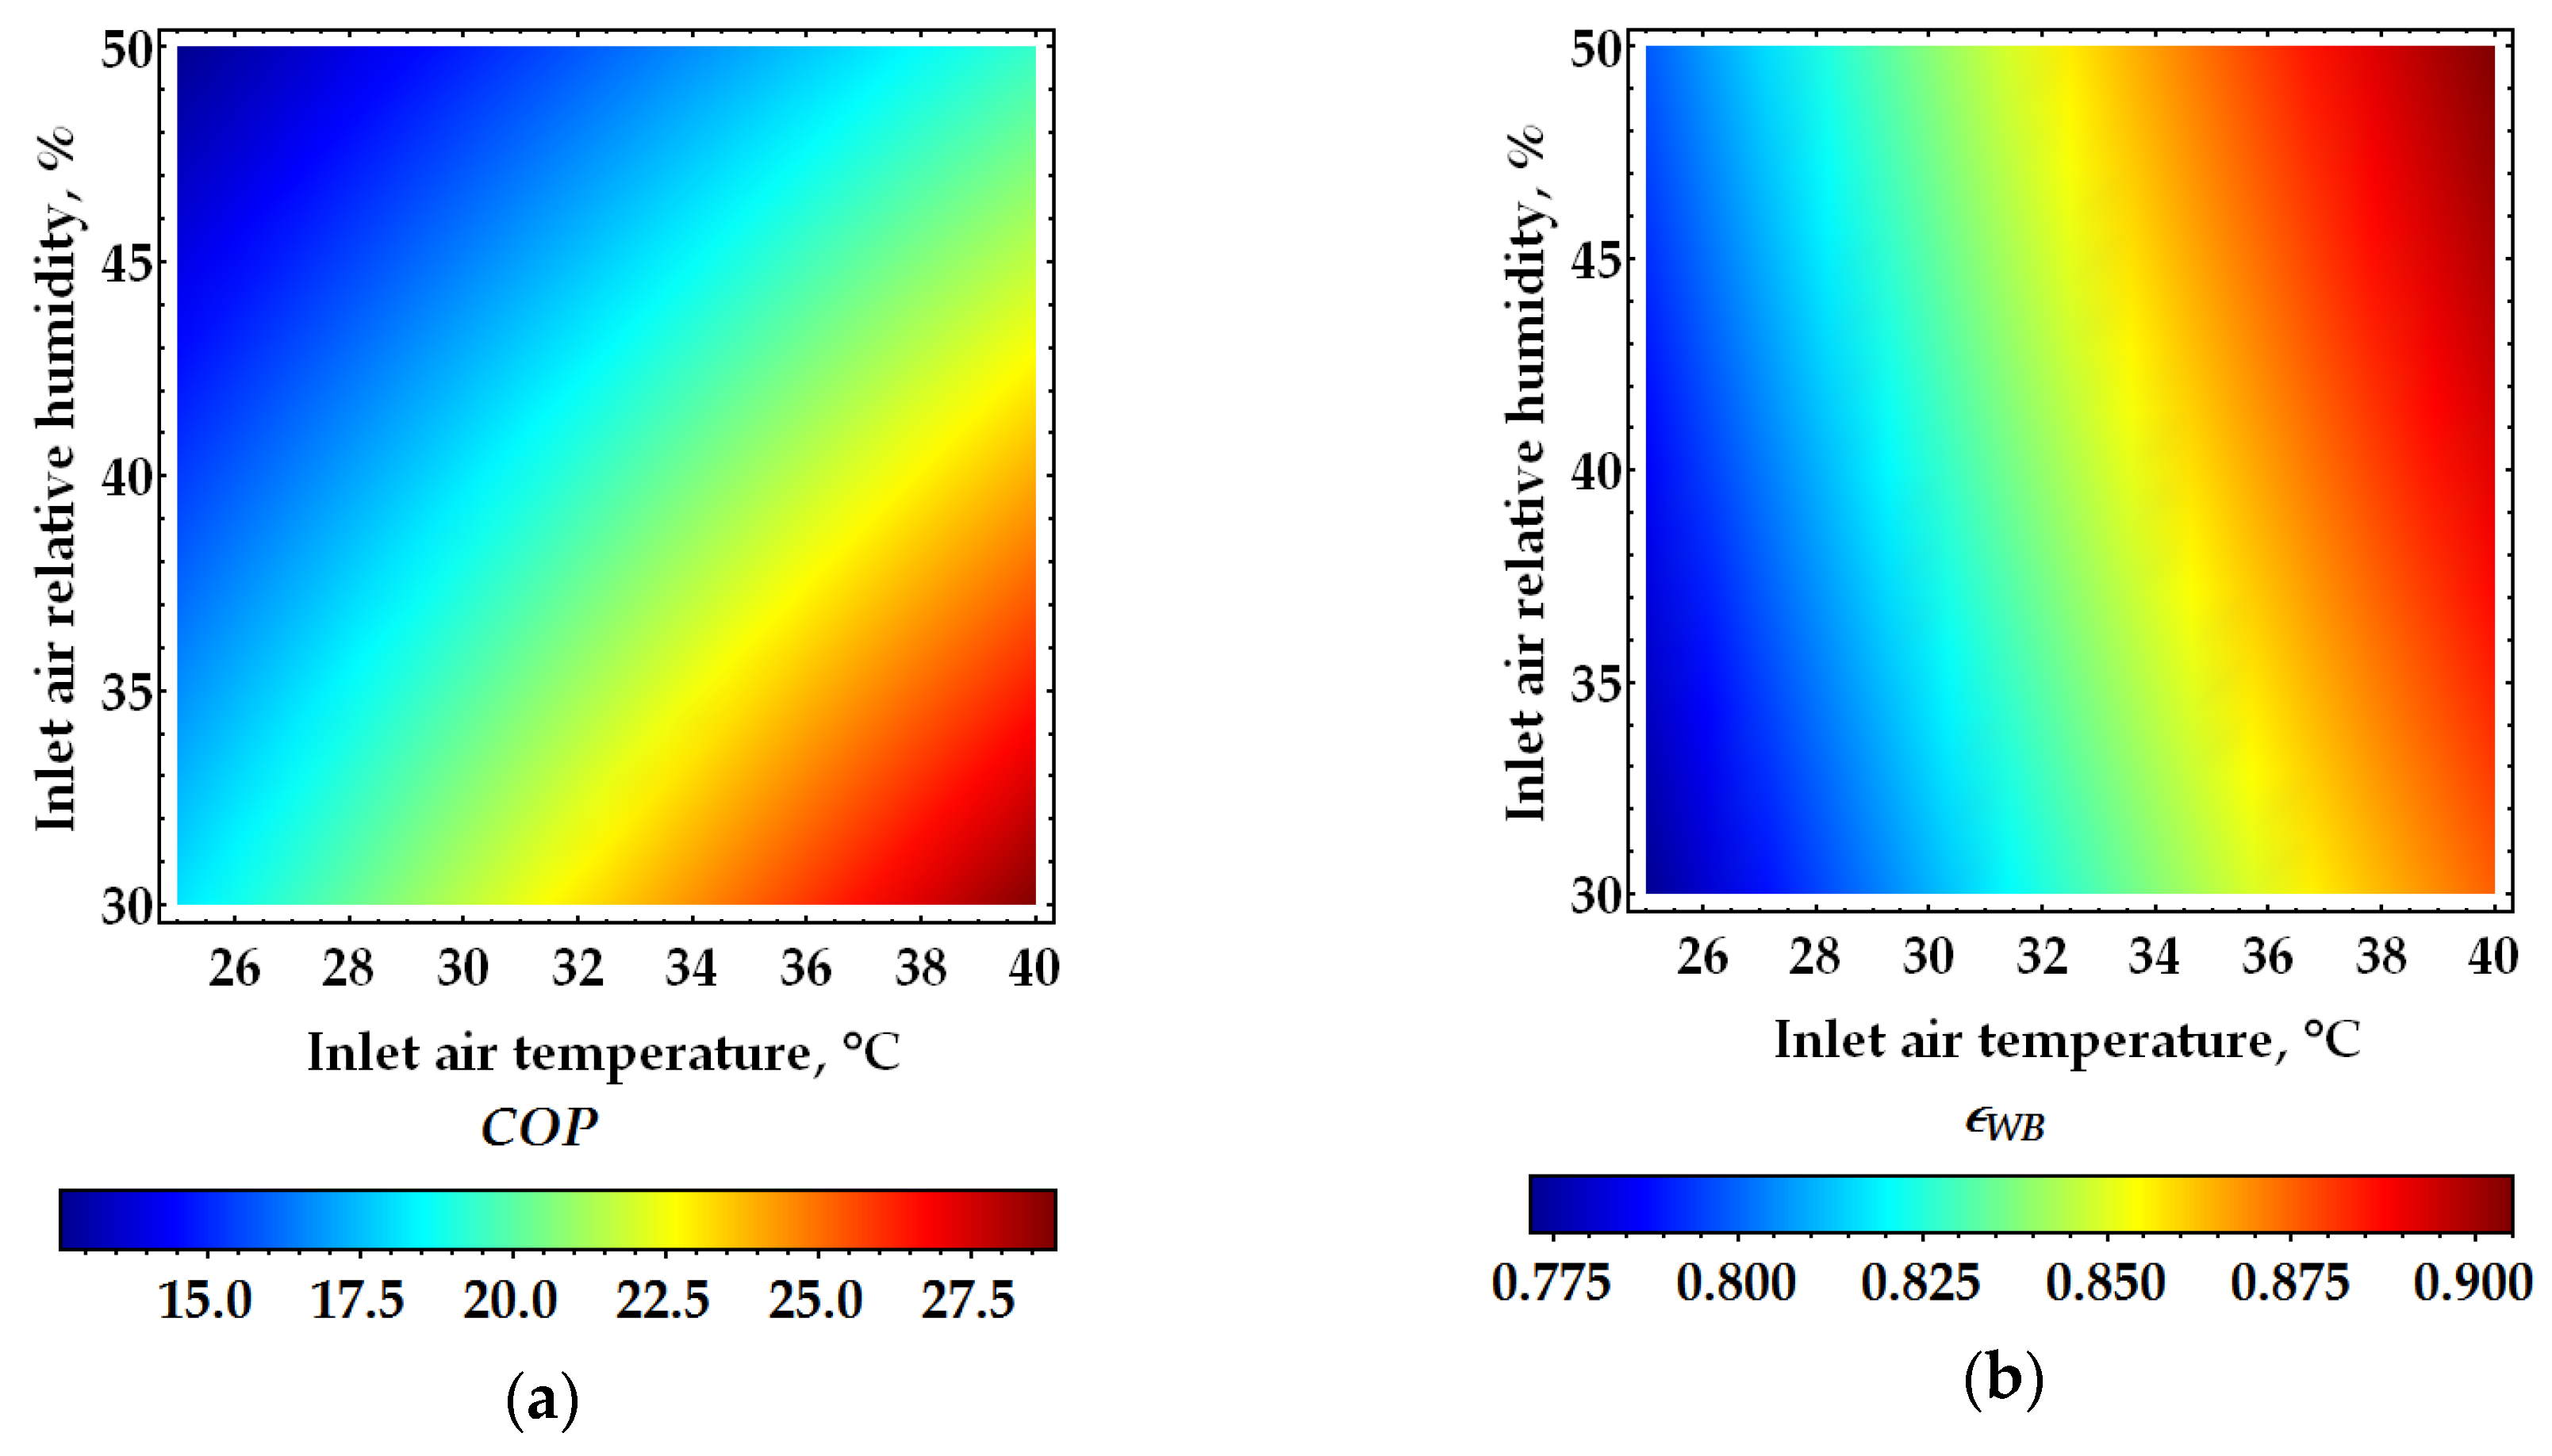
At first, the inlet air temperature was varied from 25 °C to 40 °C, and the inlet air relative humidity was varied from 30% to 50%. These sets of simulated results allowed contour plots to be obtained, as a way to show a three-dimensional surface on a two-dimensional plane. Figure 7 shows the performance of the GAHP-based IEC under varying inlet air conditions. It is apparent that the cooling performance was significantly affected by the inlet air conditions. It can be noticed that the COP coefficient increases with the increase of inlet air temperature (Figure 7a). However, the highest values were achieved for the lowest inlet air relative humidity with a COP maximum value of 28.7. The reason is that the COP coefficient increases proportionally to the increasing product air temperature difference. On the other hand, it can be seen that the COP decreases as the inlet air relative humidity increases. Figure 7b shows the contour plot of wet bulb effectiveness. It can be observed that the wet bulb effectiveness increases with increasing inlet air temperature and relative humidity. The increase in wet bulb effectiveness may lead to erroneous conclusions, as higher inlet air humidity causes the lower COP coefficients. As a result, the increase in wet bulb effectiveness may not necessarily mean an improvement in cooling performance. The reason is that the product air temperature may be reduced close to the wet bulb temperature when the moisture content is high. It is obvious that the higher moisture content leads to smaller wet bulb depression. Therefore, the evaluation of cooling performance needs to be supplemented with other indicators, e.g., COP coefficient or cooling capacity.
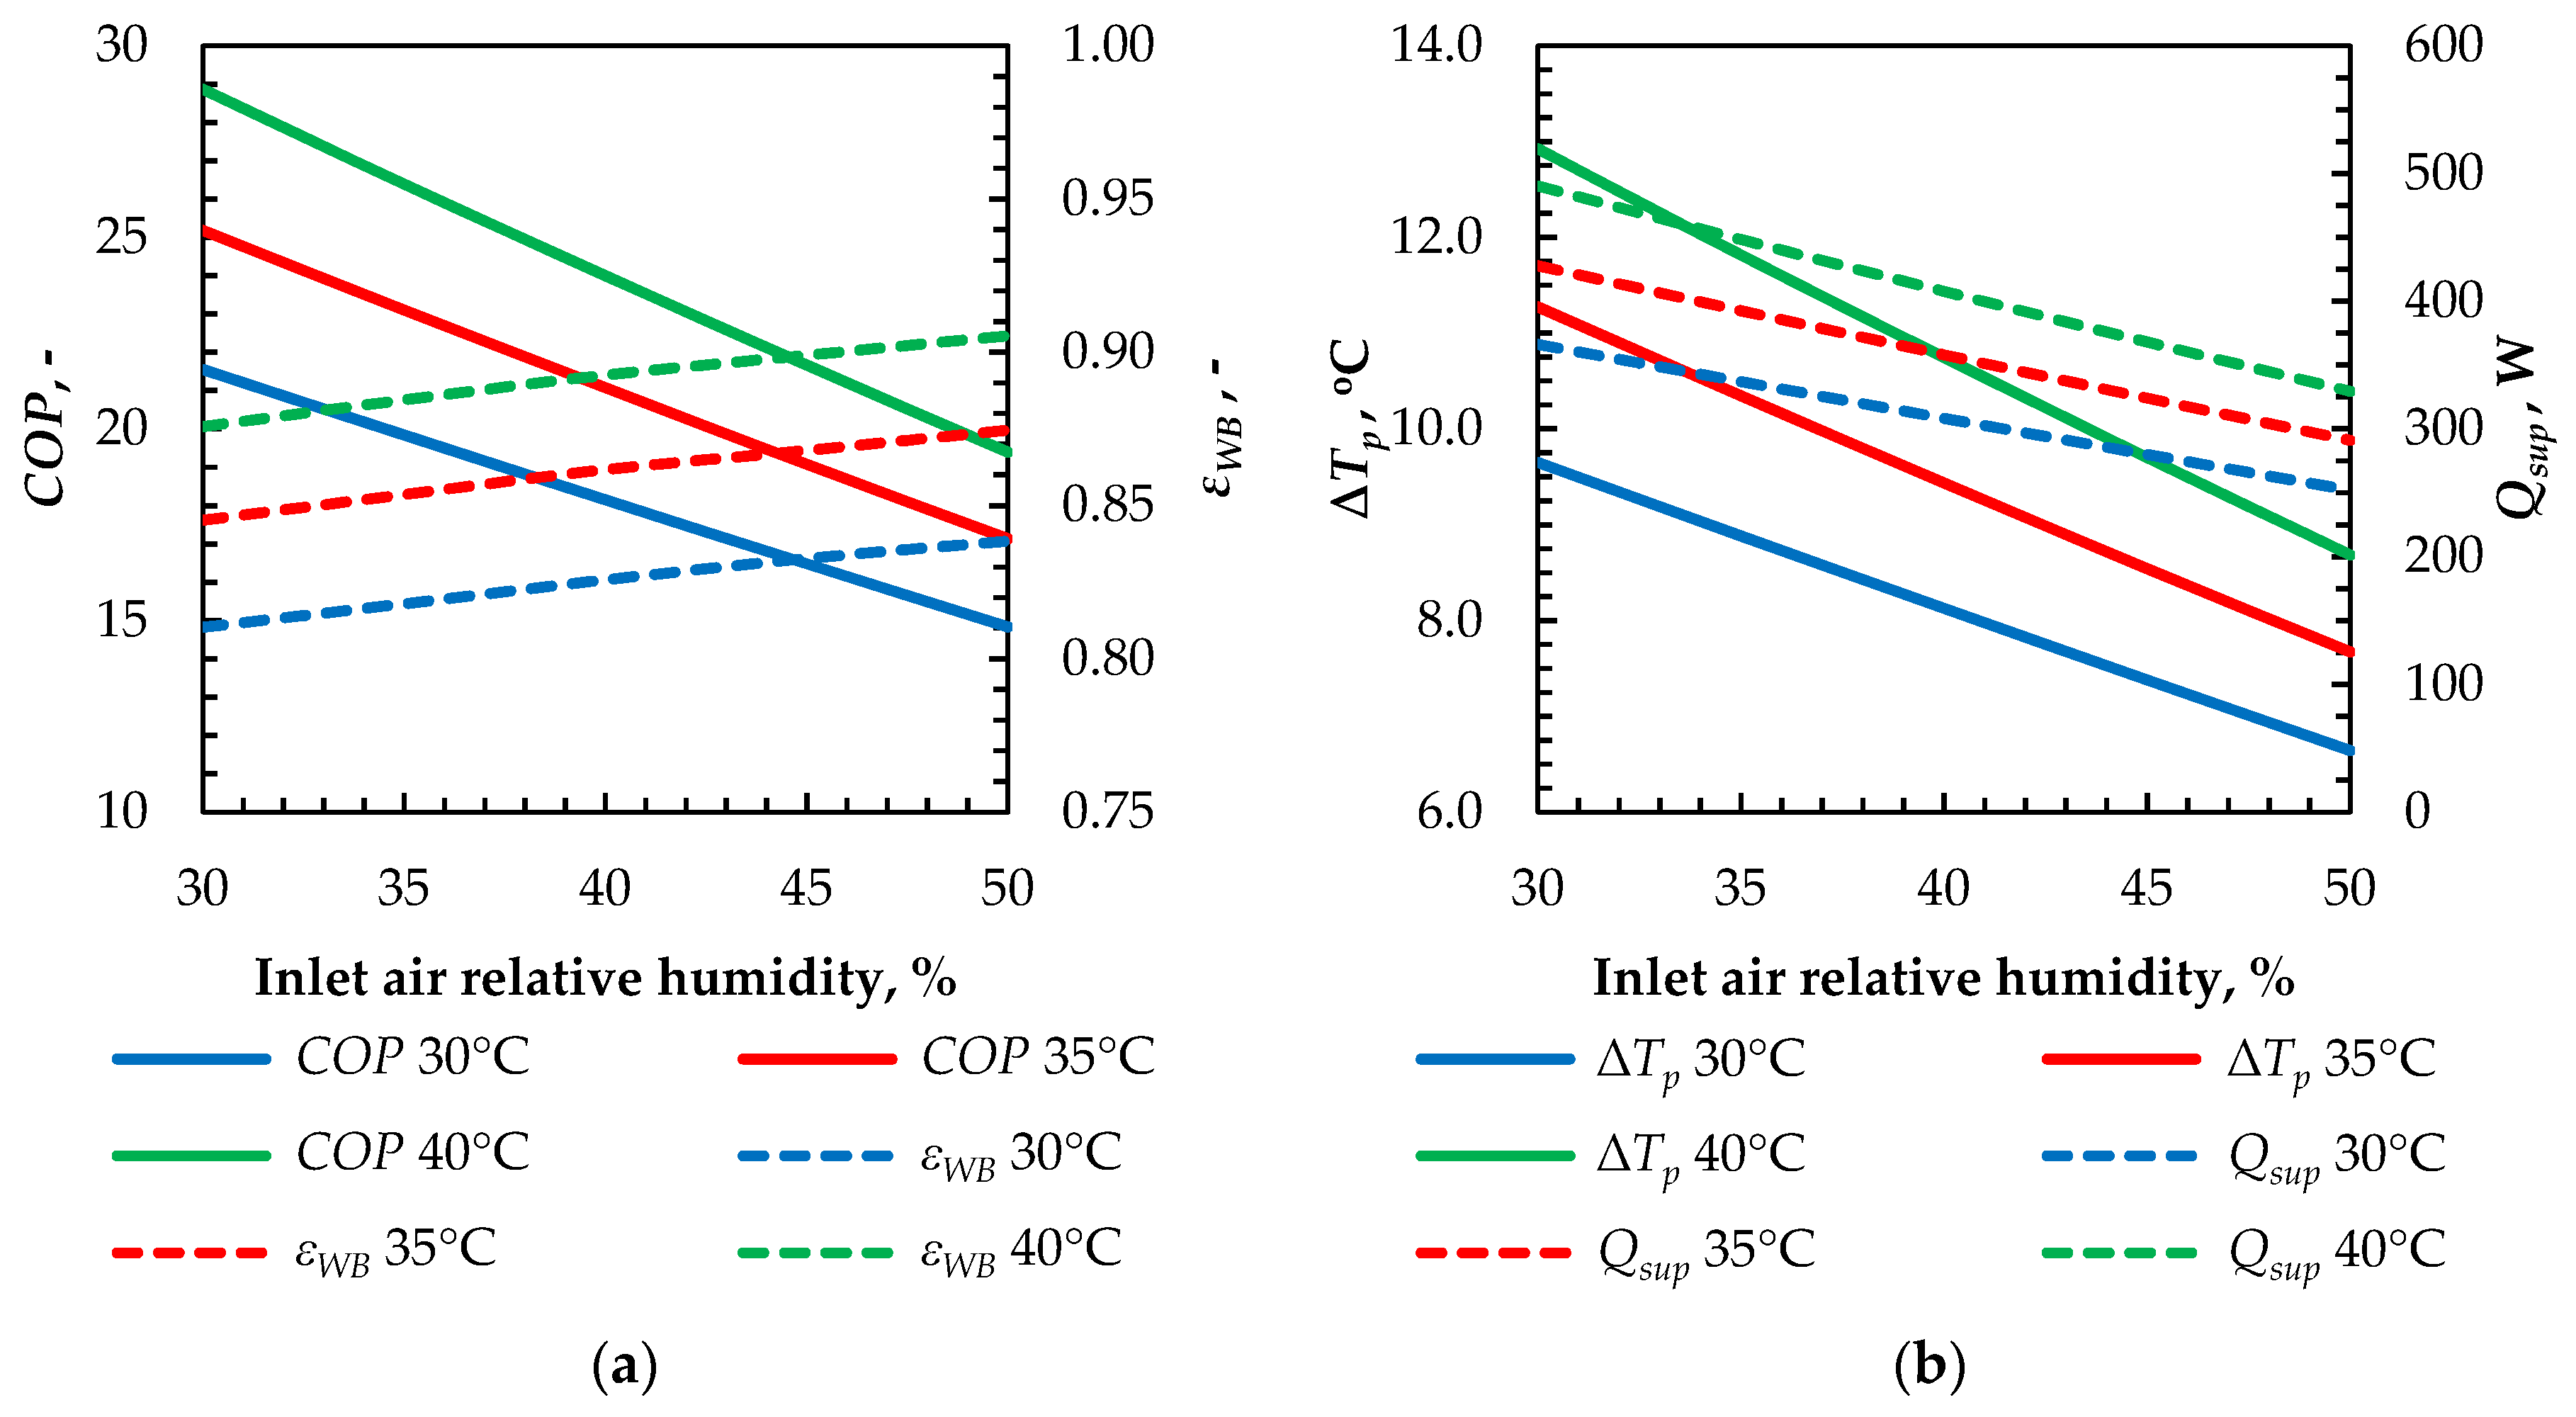
In addition, simulation results were obtained by varying the relative humidity from 30% to 50%, while keeping the inlet air temperature constant, as shown in Figure 8. The inlet air temperature was set at three defined values, namely, 30 °C, 35 °C, and 40 °C. It can be seen that both the product air temperature difference and supply cooling capacity decrease with increasing inlet air relative humidity (Figure 8b). Moreover, the COP coefficient revealed a similar trend (Figure 8a). It can be noticed that the cooler is able to cool the air to temperature close to its inlet wet bulb temperature under specific inlet air conditions. In general, by reducing the inlet air humidity, a higher cooling effectiveness of the cooler may be achieved. This is because drier air can absorb more water vapor in the wet section. In other words, the increasing driving force of the moisture transfer leads to an increase in the heat transfer from the dry channel.
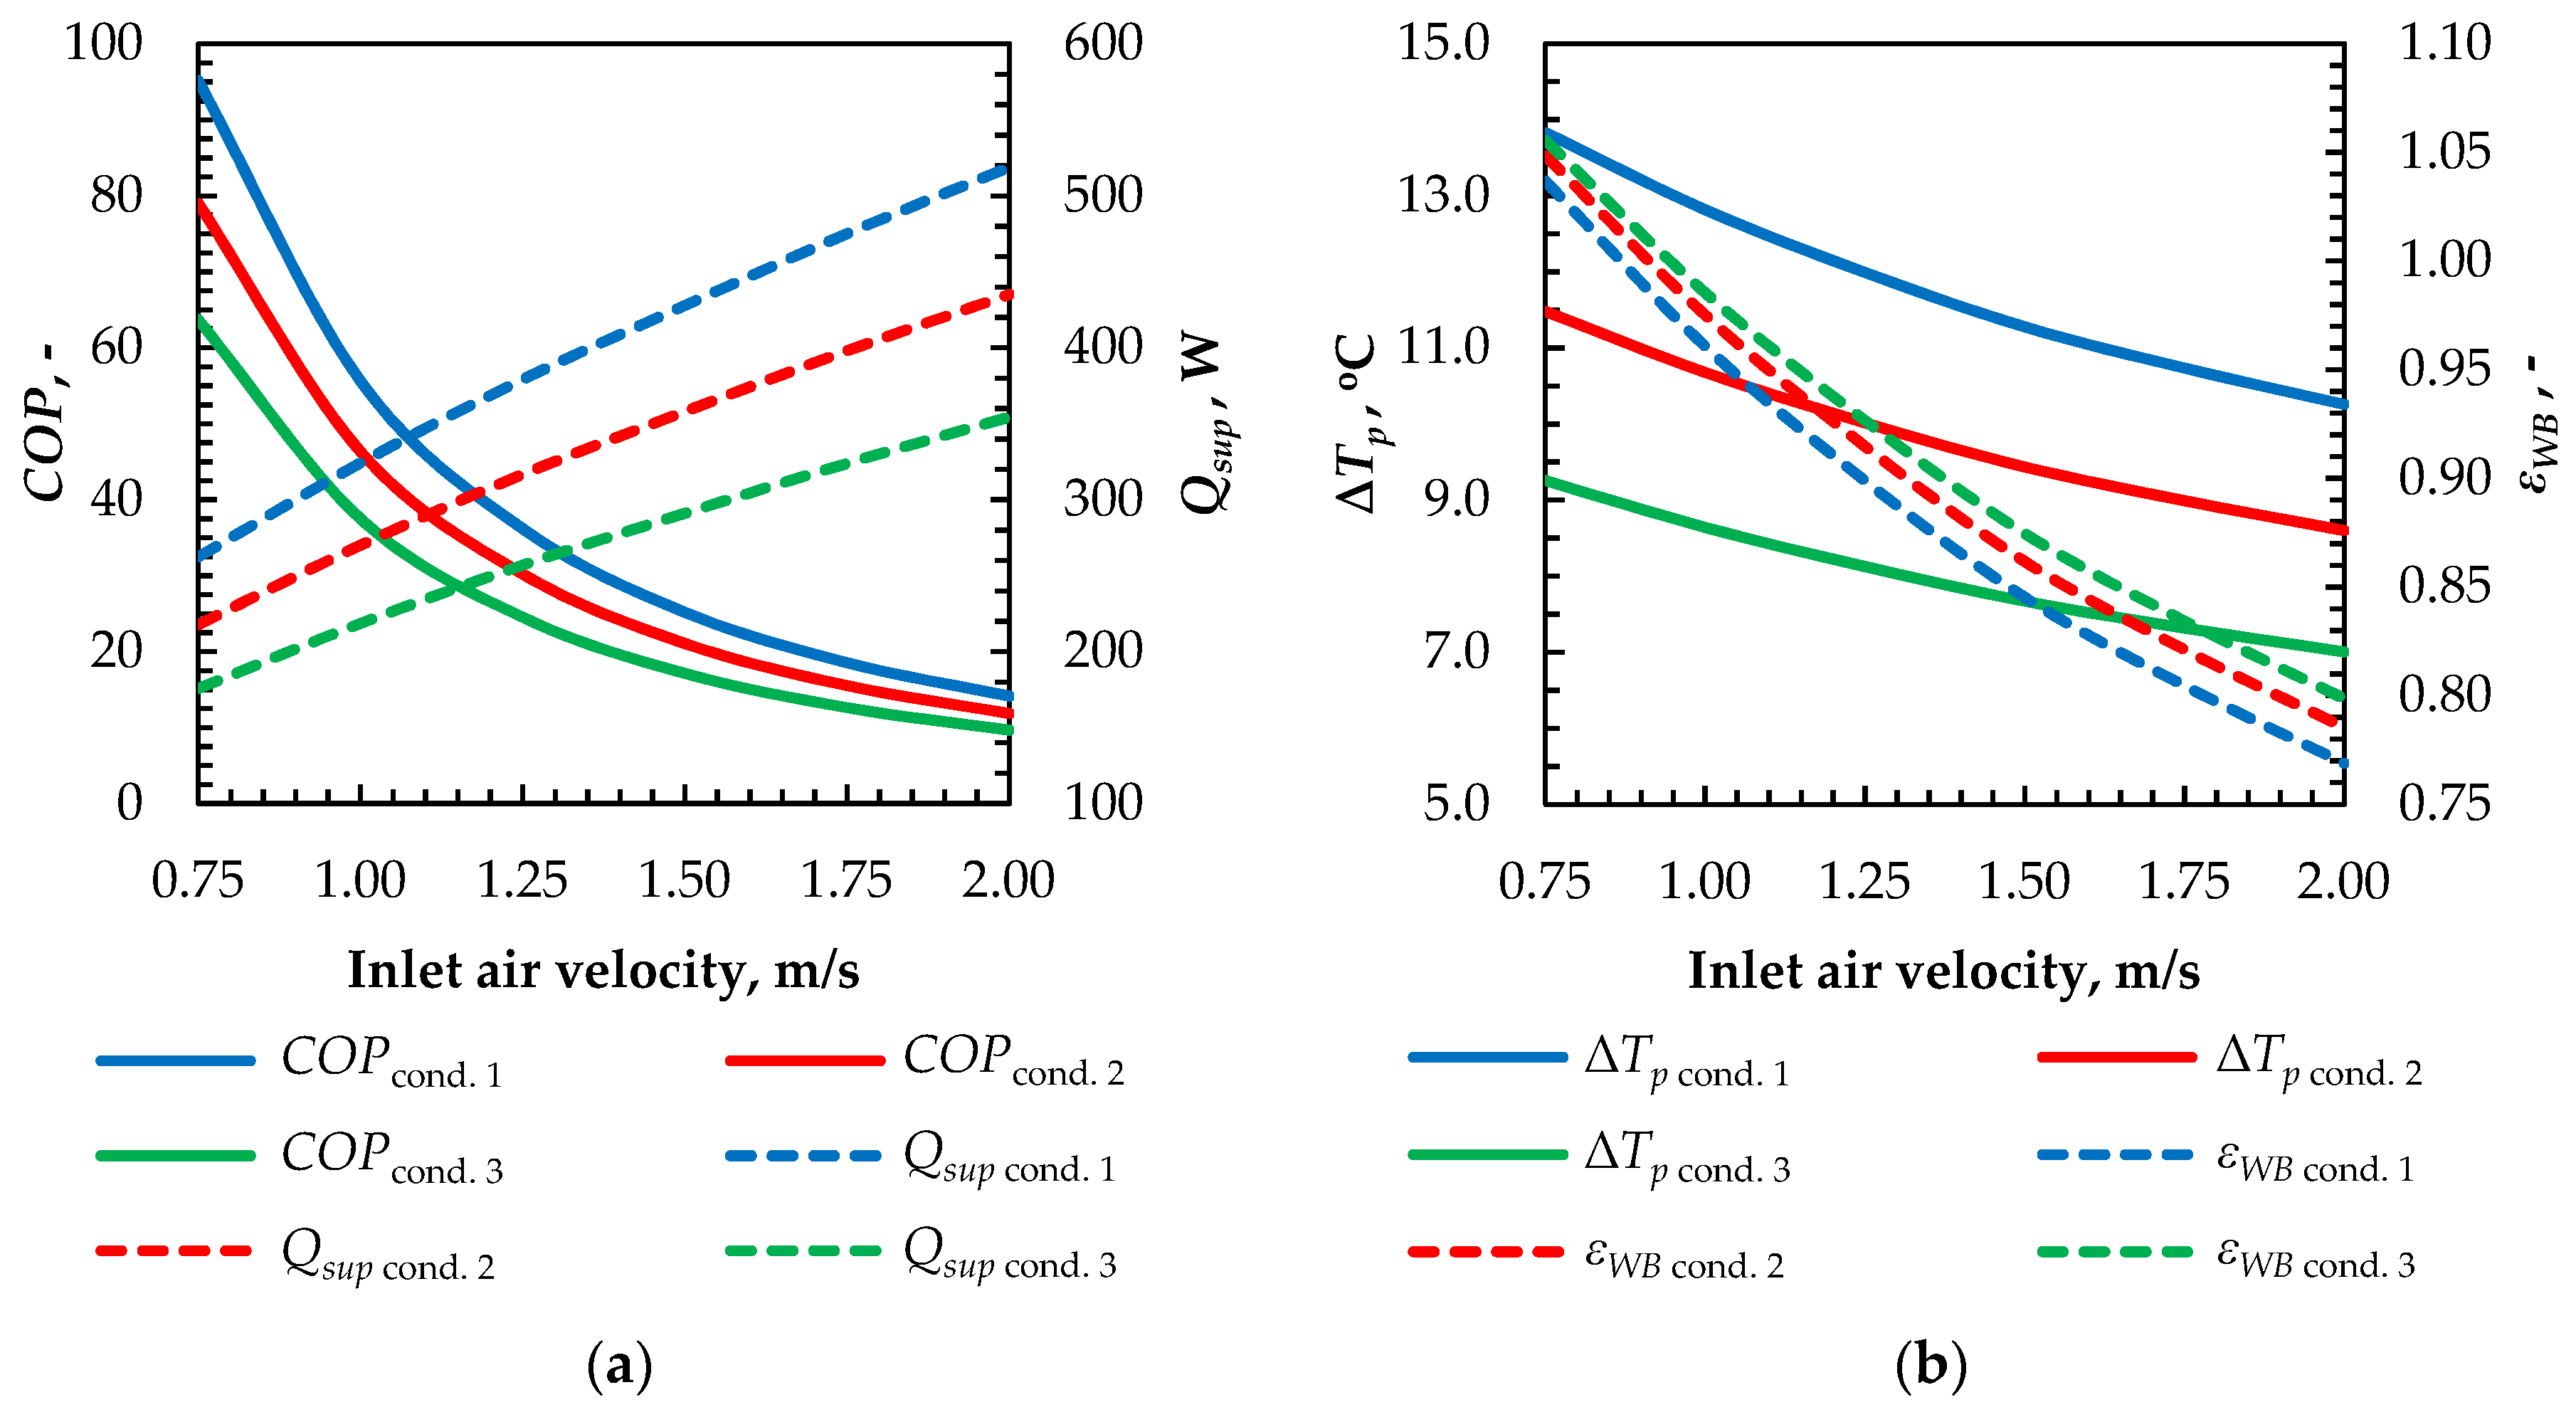
4.2. Impact of Inlet Air Velocity
Numerical simulations were carried out to investigate the impact of the inlet air velocity on the COP coefficient, supply cooling capacity, product air temperature difference, and wet bulb effectiveness. Calculations were performed by varying the inlet air velocity of the product air, while the working-to-product air flow ratio was kept as 0.5. As a result, when the product inlet air velocity increases, the working air velocity increases proportionally, and so does the air mass flow rate in the dry and wet sections. The other operating parameters were determined according to Table 6 and Table 7.
The conducted analysis provided the correlations between the performance effectiveness and the product inlet air velocity, as shown in Figure 9. The increase of the inlet air velocity enabled the increase of the supply cooling capacity due to the increasing supply air mass flow rate, but on the other hand, it lowered the COP coefficient (Figure 9a). The obtained results illustrate that the lower inlet air velocity delivers a lower supply air temperature (Figure 9b). As it can be seen in Figure 9b, the highest wet bulb effectiveness was achieved for the lowest inlet air velocities. It is worth mentioning that the highest heat transfer coefficients were obtained with an increase of inlet air velocity. However, simulation results indicated that their improvement may have a lower effect on the overall cooling performance. When the inlet air velocity is more than 1.5 m/s, both the COP coefficient and wet bulb effectiveness decrease to an insufficient level. As a result, to provide a high cooling performance, it is recommended that the inlet air velocity should be 1.5 m/s or less due to the increasing pressure loss. It should be emphasized as the product airflow enters the GAHP bank that the flow area decreases from an inlet area to an area between the GAHPs, and thus the flow velocity increases to 3.0 m/s.
4.3. Impact of Number of GAHP Rows
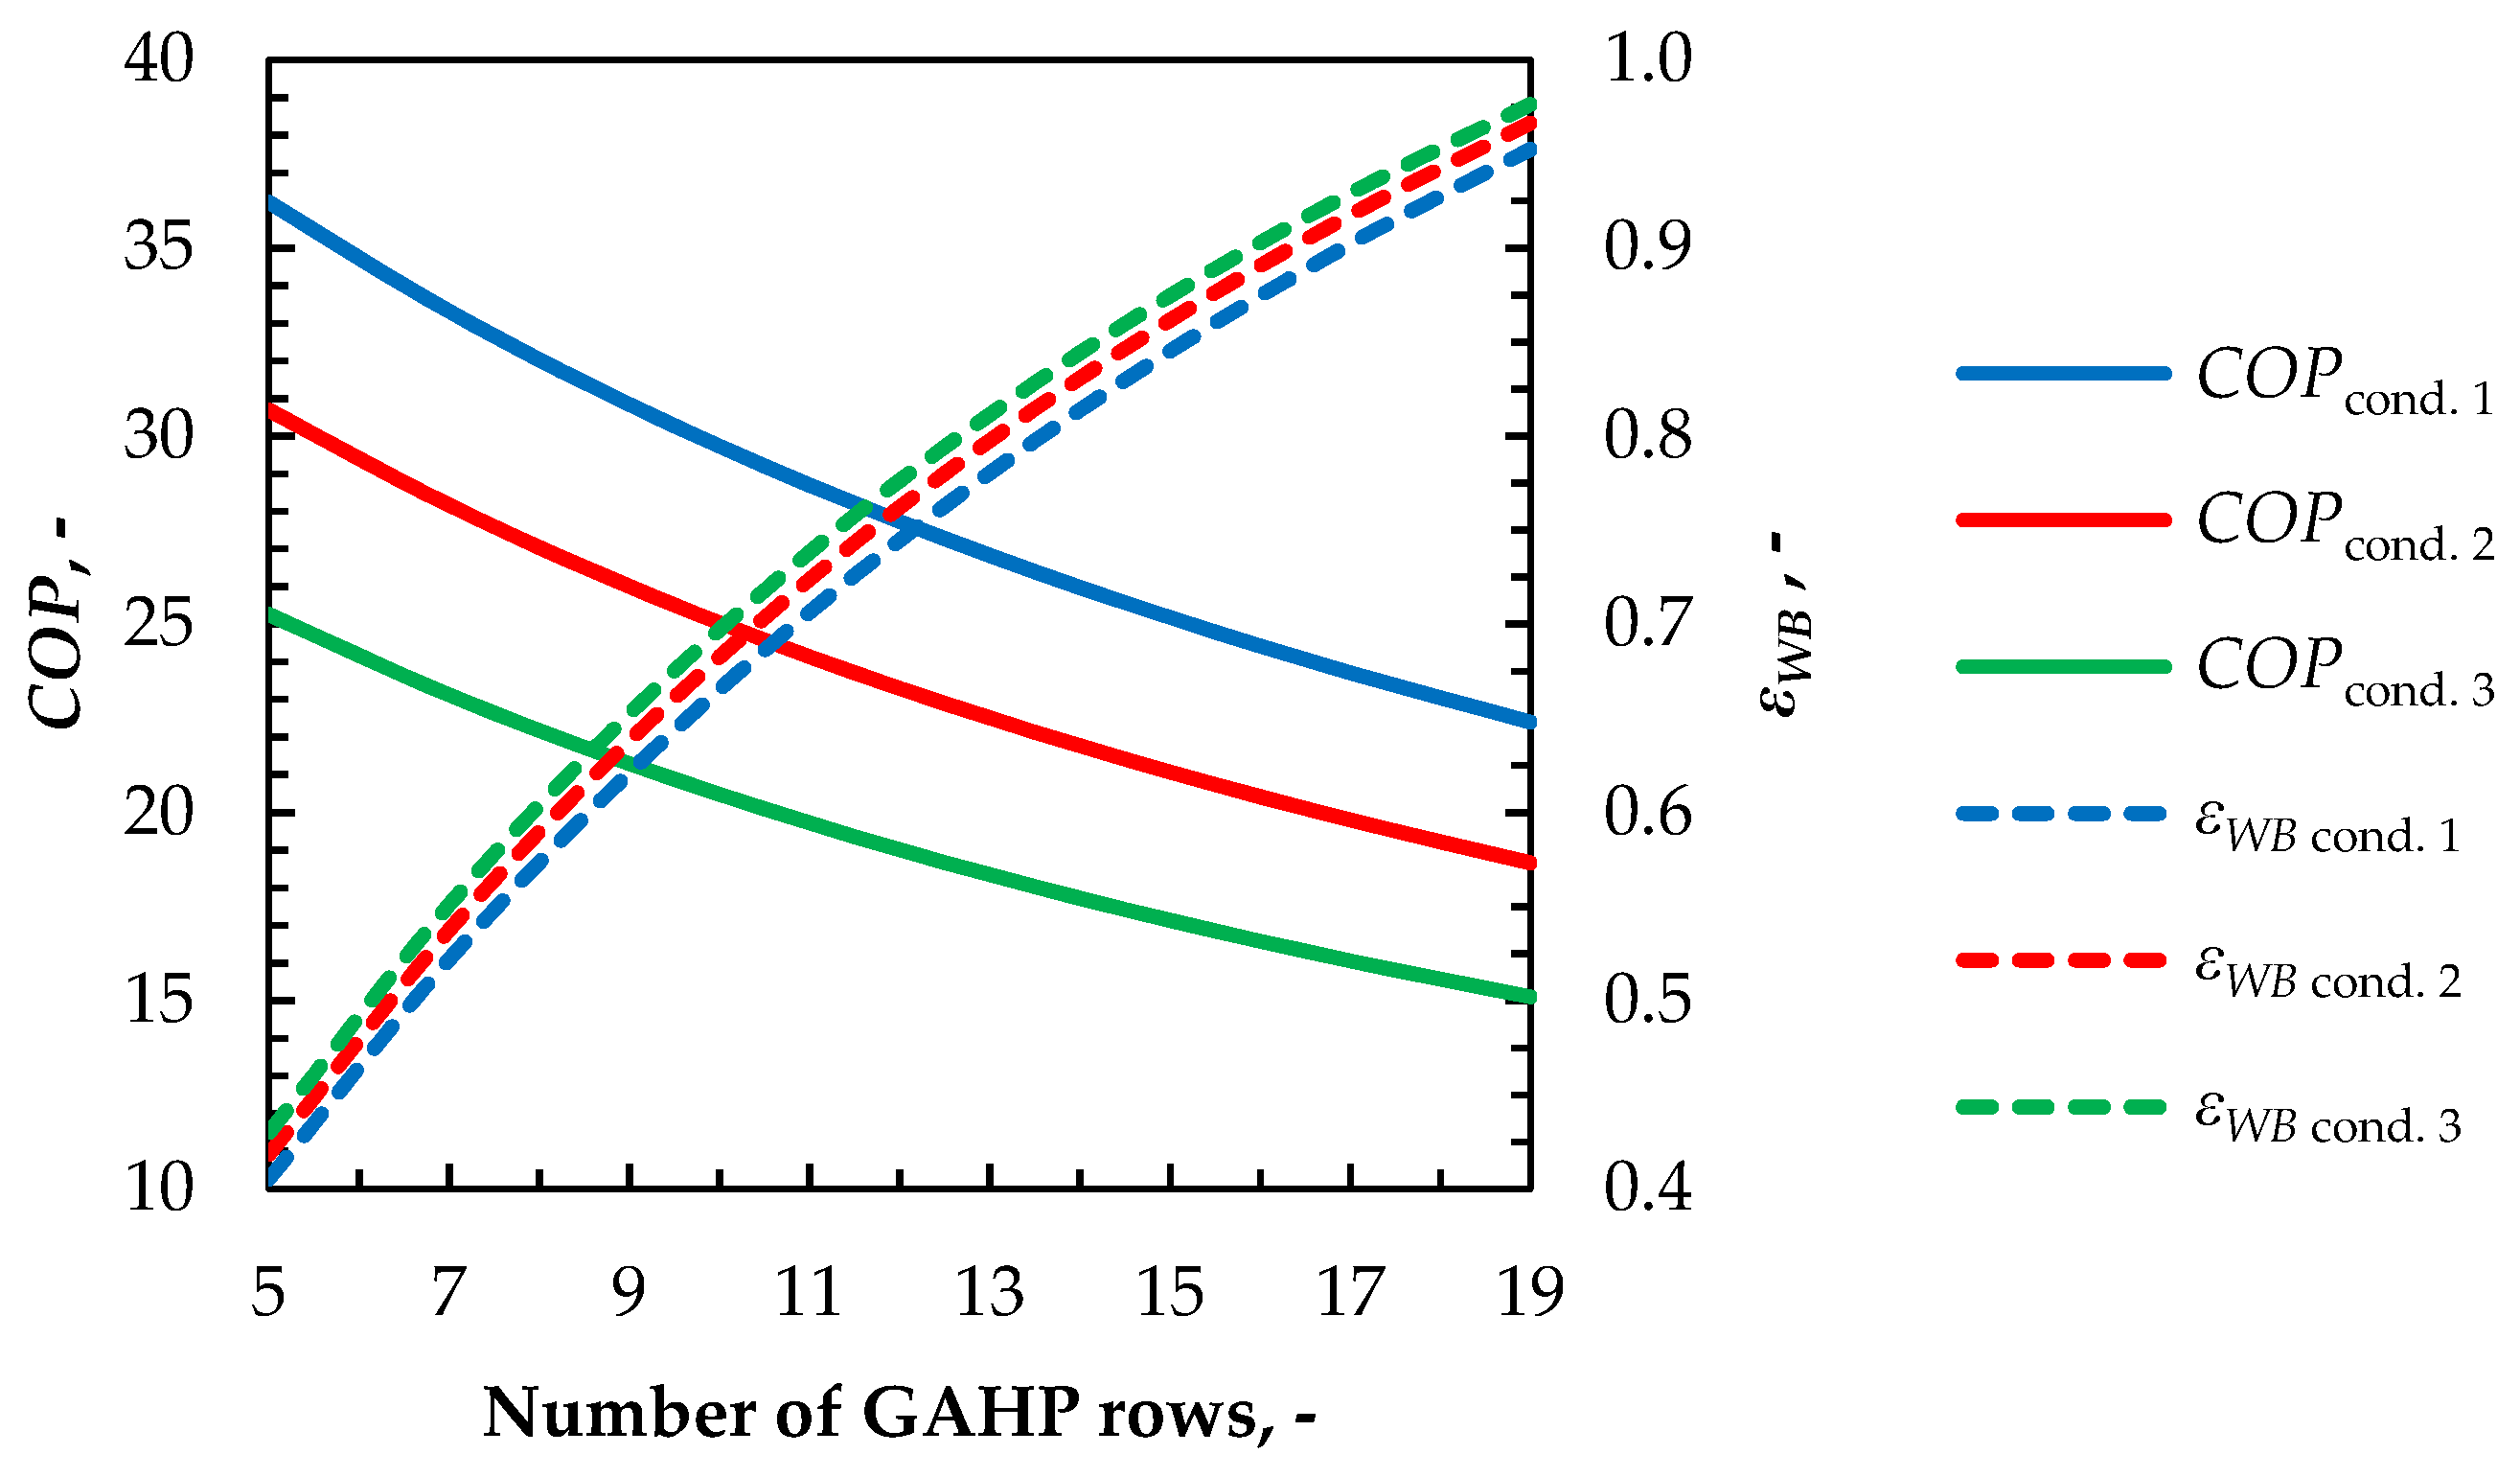
The influence of a number of GAHP rows was investigated. Simulation results were obtained by varying the number of GAHP rows between 5 and 19, while setting the other operating parameters according to Table 6 and Table 7. The cooling performance of the GAHP-based IEC was evaluated by the COP coefficient and the wet bulb effectiveness.
It can be observed from Figure 10 that the wet bulb effectiveness increases steadily with the increasing number of GAHP rows. The reason is that the heat and mass transfer surface increases by adding the numbers of GAHP rows. After approaching the wet bulb temperature of the inlet airflow by supply airflow, the effect of the number of GAHP rows on the heat transfer enhancement was less significant. In other words, as the number of GAHP rows increases, the cooling performance improvement becomes flatter and cannot be justified from an economic point of view. In contrast, the COP coefficient indicates an opposite trend due to the increasing pressure loss by each additional row. It is apparent that it causes greater power consumption by fans. However, the increased supply cooling capacity can offset the fan power consumption, which leads to maintaining the COP coefficients on a reasonable level. In conclusion, to achieve a high cooling effectiveness, it is recommended that the number of rows should be at least 15. However, considering the associated costs, it should be less than 20.
4.4. Impact of Spacing between Adjacent Fins in Dry Channel
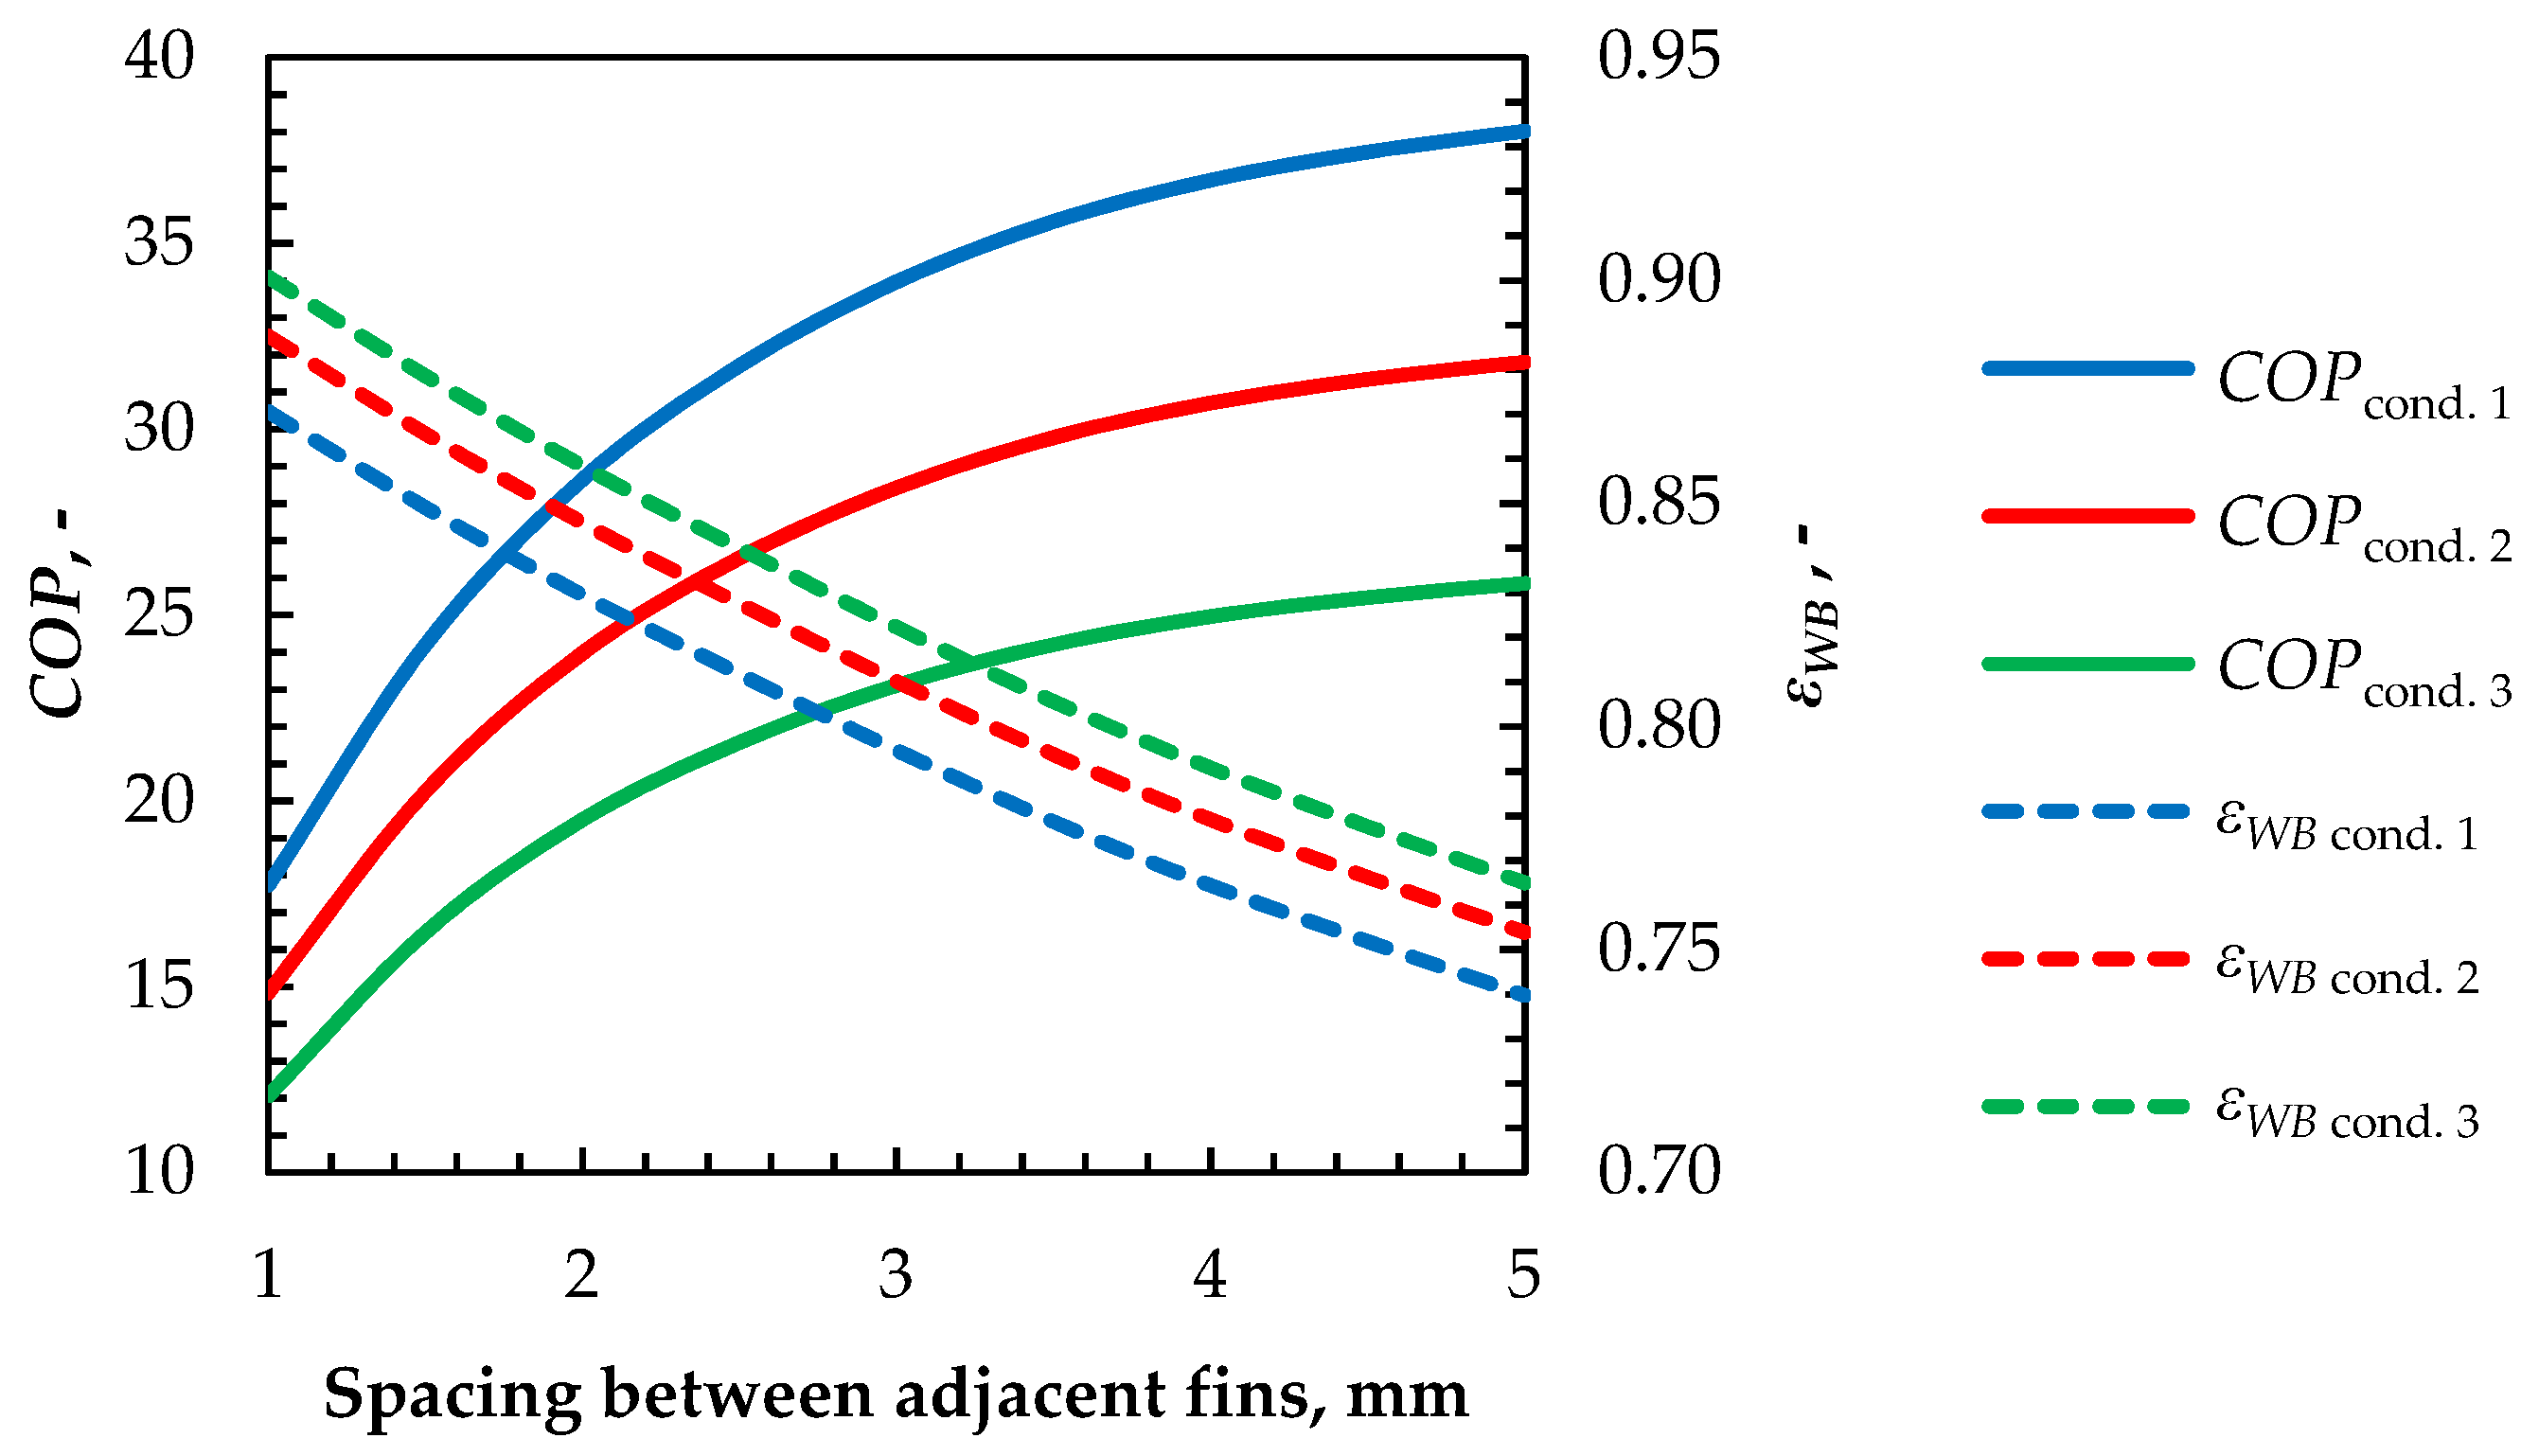
The performance of the cooler is influenced by the spacing between adjacent plain fins on a staggered array of GAHPs in a dry channel. Its effect on the COP coefficient and wet bulb effectiveness was investigated. Simulations were carried out for the fin spacing ranging from 1 mm to 5 mm and for the inlet air conditions according to Table 7. The additional operating parameters were established according to Table 6.
Figure 11 shows the simulation results for the cooling effectiveness parameters under different spacing parameters between adjacent fins. The COP coefficient is largely affected by fin spacing. This is because an increasing pressure drop with an increase of the fin density is observed. It can be seen that the COP achieves maximum values at a fin spacing of 5 mm and increases from the initial value of 17.7 to 38 (Condition 1). Moreover, the wet bulb effectiveness decreases from 0.87 to 0.74 (Condition 1) when the considered fin spacing rises from 1 mm to 5 mm. Thus, the wet bulb effectiveness may be higher when the fins spacing decreases. The reason is that the heat transfer surface increases as the fin spacing decreases. As a consequence, more sensible heat can be transferred by GAHPs from the dry channel to the wet channel. It should be noted that the optimal fin spacing results from the issues of energy savings and fan power consumption. A compromise among the COP coefficient and wet bulb effectiveness suggests that the fin spacing should range from 1.5 mm to 3 mm.
4.5. Impact of Working-to-Product Airflow Ratio
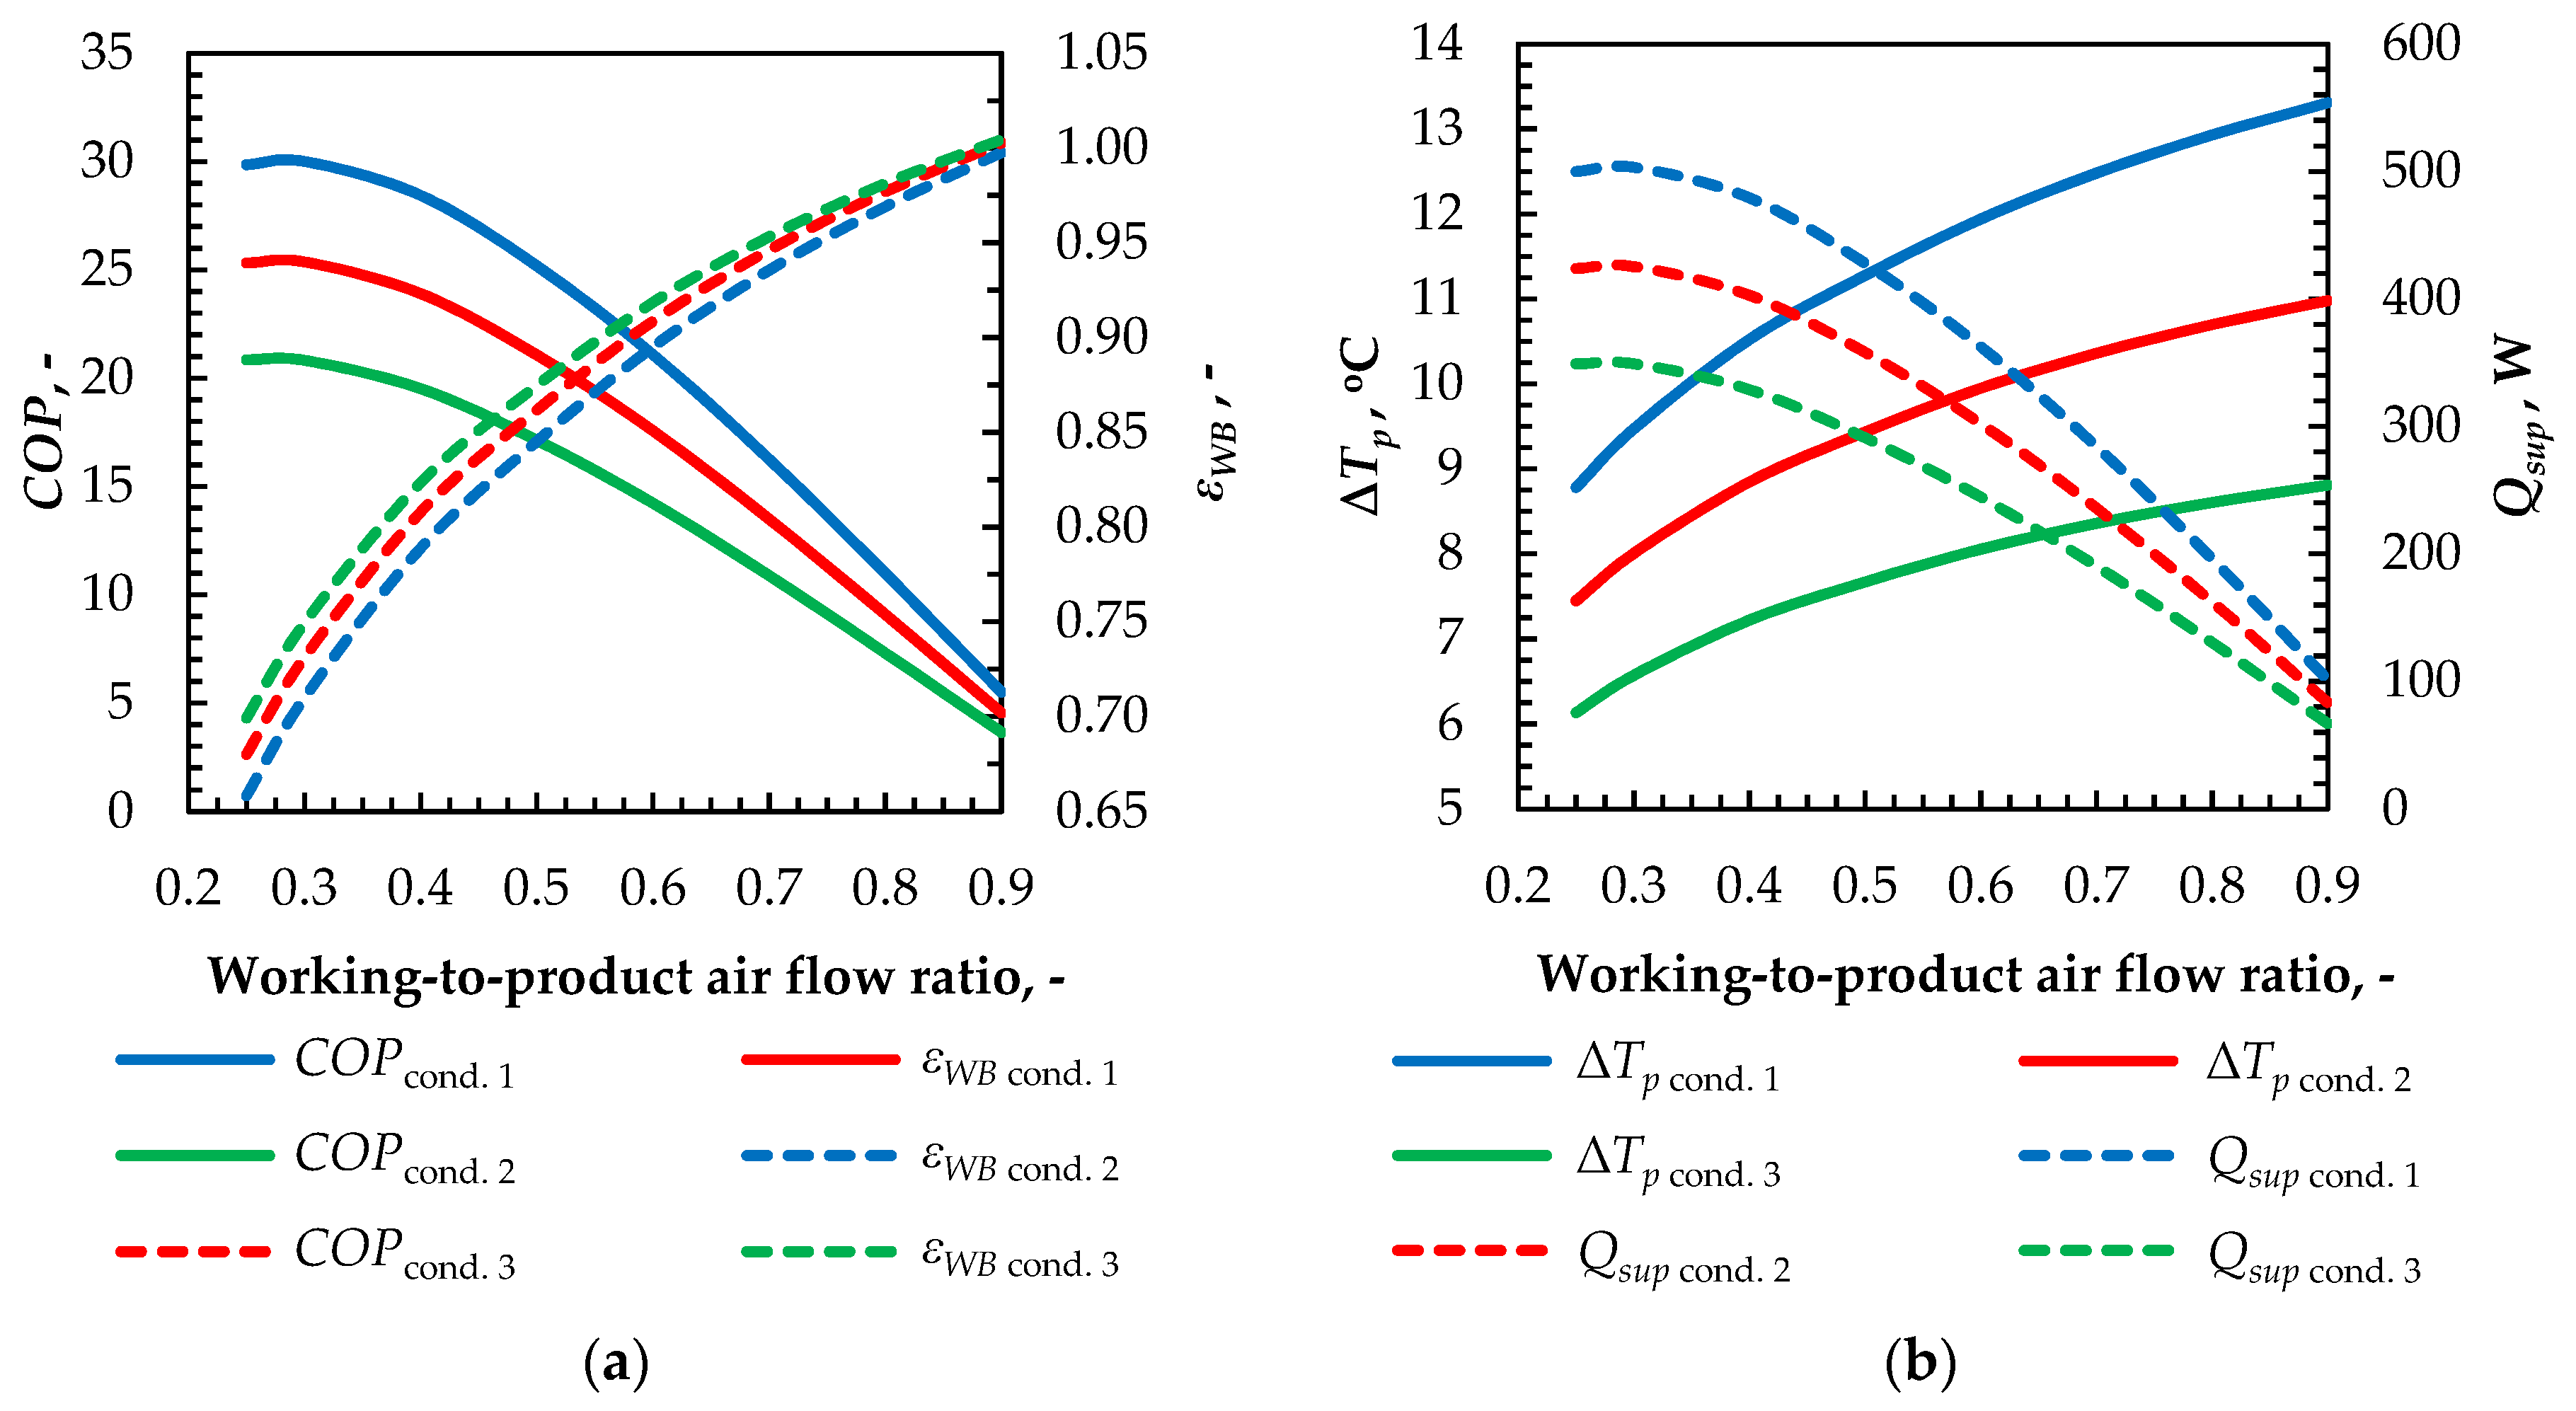
The last analyzed operating parameter was the working-to-product airflow ratio (the ratio between the working airflow rate and the product airflow rate). Numerical simulations were conducted to investigate the impact of working-to-product airflow ratio onto the COP coefficient, wet bulb effectiveness, product air temperature difference, and supply cooling capacity. Varying the ratio from 0.25 to 0.9 while keeping the other parameters constant allowed different trends of calculation results to be observed. Simulations were performed by varying the inlet air velocity of the working air, while the inlet air velocity of the product air was kept as 1.5 m/s. The other operating parameters were set according to Table 6 and Table 7.
It is apparent that the wet bulb effectiveness increases with the increasing working-to-product airflow ratio (Figure 12a). In contrast, both the COP coefficient and the supply cooling capacity show an opposite trend (Figure 12b), which results from an increasing air flow ratio leading to a decrease of the supply airflow to the conditioned space. Figure 12 indicates that both the COP and supply cooling capacity reach their maximum when the airflow ratio is around 0.3. However, it corresponds with low wet bulb effectiveness and a small product air temperature difference. On the other hand, since the supply air is delivered to the conditioned space, therefore, the rejected working air should be reduced to a useful minimum. Considering the aforementioned parameters, it is suggested that the airflow ratio should range from 0.3 to 0.5 in order to obtain a supply air temperature around the wet bulb temperature.
5. Conclusions
In the present work, the performance evaluation of a gravity-assisted heat pipe-based indirect evaporative cooler was studied. A mathematical model to simulate heat and mass transfer was developed to investigate the impact of key parameters on the GAHP-based IEC performance. The comprehensive calculation method was applied to evaluate accurately the cooling performance indicators. In addition, the thermal resistances of vaporization and condensation of working fluid inside a GAHP were taken into consideration. The mathematical model was adequately validated using the data from experimental studies available in the literature. A good agreement with experimental results was obtained.
Based on the conducted numerical simulations, the most favorable ranges of operating conditions for the GAHP-based IEC were established. The following conclusions can be listed from this investigation:
- The cooling effectiveness is strongly dependent on the inlet air conditions.
- The inlet air velocity should be 1.5 m/s or less due to increasing pressure loss.
- The number of rows should be at least 15. However, considering the associated investment costs, it should be less than 20.
- A compromise among the COP coefficient and wet bulb effectiveness suggests that the spacing between adjacent plain fins should range from 1.5 mm to 3 mm.
- The working-to-product airflow ratio should range from 0.3 to 0.5 in order to obtain a supply air temperature around the wet bulb temperature.
The proposed GAHP-based IEC can be a complementary device to the conventional HVAC systems. Its implementation could allow reducing the peak electricity demand and offers significant energy-saving potential. However, in the case of an efficient alternative to conventional systems, it should be emphasized that there are some implementation issues, which are mainly due to limitations in the wet surface enhancing. The solution to overcome this obstacle could be the application of specific fins in the wet channel, especially axial fins on the GAHP condenser surface instead of plate or circular fins. As a result, the effectiveness of the cooler can be improved due to an increasing area of heat and mass transfer between the condenser and the working air.
Author Contributions
Conceptualization, methodology, validation, formal analysis, writing—original draft preparation, K.R.; manuscript revision and editing, E.B.; supervision, manuscript revision, J.D. All authors have read and agreed to the published version of the manuscript.
Funding
The corresponding author gratefully acknowledges the funding from the Faculty of Environmental Engineering at Wroclaw University of Science and Technology (grant number 0402/0096/18).
Conflicts of Interest
The authors declare no conflict of interest.
Nomenclature
| A | surface area, m2 |
| Af | surface area of fins, m2 |
| Amin | flow cross-sectional area in minimum flow area, m2 |
| Ap.tot | total heat transfer area on the product air side, m2 |
| Aw | total heat transfer area on the working air side, m2 |
| COP | coefficient of performance |
| cp | specific heat capacity, J/kgK |
| do | GAHP outer diameter, m |
| f | fanning friction factor |
| ff | friction factor associated with fin area |
| ft | friction factor associated with tube area |
| g | gravitational acceleration, m/s2 |
| GAHP | gravity-assisted heat pipe |
| convective heat transfer coefficient, W/m2K | |
| heat transfer coefficient in the Nusselt’s theory for film-wise condensation, W/m2K | |
| evaporation heat of water at reference temperature (0 °C), kJ/kg | |
| convective mass transfer coefficient, kg/m2s | |
| HP | heat pipe |
| IEC | indirect evaporative cooling, indirect evaporative cooler |
| j | Colburn factor |
| k | thermal conductivity, W/mK |
| Le | Lewis factor, defined as |
| mass flow rate, kg/s | |
| NL | number of tube rows |
| NTU | number of heat transfer units |
| Nu | Nusselt number |
| P | pressure, Pa |
| ∆P | pressure drop, Pa |
| Pr | Prandtl number |
| Q | cooling capacity, W |
| q | heat flux, W/m2 |
| R | thermal resistance, K/W |
| Redo | Reynolds number based on do |
| Ref | refers to the Re number of condensed film in GAHP |
| RH | relative humidity, % |
| s | spacing between adjacent fins, m |
| SL | tube spacing in air flow direction, m |
| ST | tube spacing normal to flow, m |
| T | temperature, °C |
| t | thickness, m |
| umax | maximum velocity based on Amin, m/s |
| W | required fan power, W |
| non-dimensional x coordinate, defined as | |
| Greek Letters | |
| ε | effectiveness |
| η | efficiency |
| μ | dynamic viscosity, kg/ms |
| ρ | density, kg/m3 |
| χ | correction factor in Equation (22) |
| ω | humidity ratio, kg/kg |
| Subscripts | |
| atm | atmospheric |
| c | condenser section |
| e | evaporator section |
| Exp | experimental |
| f | fin |
| inl | inlet |
| int | internal |
| l | liquid |
| ln | associated with logarithmic mean tube diameter |
| out | outlet |
| p | product air |
| Sim | numerically simulated |
| sup | supply |
| v | vapor |
| w | working air |
| WB | wet bulb |
| wf | water film and working air interface |
| wpl | wet porous layer |
References
- Conti, J.; Holtberg, P.; Diefenderfer, J.; LaRose, A.; Turnure, J.T.; Westfall, L. International Energy Outlook 2016 with Projections to 2040; Energy Information Administration: Washington DC, USA, 2016.
- Chua, K.J.; Chou, S.K.; Yang, W.M.; Yan, J. Achieving better energy-efficient air conditioning—A review of technologies and strategies. Appl. Energy 2013, 104, 87–104. [Google Scholar] [CrossRef]
- Jedlikowski, A.; Anisimov, S. Analysis of the frost formation and freeze protection with bypass for cross-flow recuperators. Appl. Therm. Eng. 2017, 116, 731–765. [Google Scholar] [CrossRef]
- Dudkiewicz, E.; Fidorów, N.; Jezowiecki, J. The influence of infrared heaters efficiency on the energy consumption cost. Rocz. Ochr. Sr. 2013, 15, 1804–1817. [Google Scholar]
- Cepiński, W.; Szałański, P. Increasing the efficiency of split type air conditioners/heat pumps by using ventilating exhaust air. E3S Web Conf. 2019, 100. [Google Scholar] [CrossRef] [Green Version]
- Przydróżny, E.; Przydróżna, A.; Szczęśniak, S. Energy efficient setting of supply air temperature in dual-duct dual-fan ventilation systems with extract air recirculation. Therm. Sci. Eng. Prog. 2018, 5, 69–85. [Google Scholar] [CrossRef]
- International Energy Agency (IEA). The Future of Cooling: Opportunities for Energy-Efficient Air Conditioning; International Energy Agency: Paris, France, 2018. [Google Scholar]
- Kassai, M.; Poleczky, L.; Al-Hyari, L.; Kajtar, L.; Nyers, J. Investigation of the energy recovery potentials in ventilation systems in different climates. Facta Univ. Ser. Mech. Eng. 2018, 16, 203–217. [Google Scholar] [CrossRef] [Green Version]
- Chang, X.; Watanabe, N.; Nagano, H. Visualization study of a loop heat pipe with two evaporators and one condenser under gravity-assisted condition. Int. J. Heat Mass Transf. 2019, 135, 378–391. [Google Scholar] [CrossRef]
- Duan, Z.; Zhan, C.; Zhang, X.; Mustafa, M.; Zhao, X.; Alimohammadisagvand, B.; Hasan, A. Indirect evaporative cooling: Past, present and future potentials. Renew. Sustain. Energy Rev. 2012, 16, 6823–6850. [Google Scholar] [CrossRef]
- Cuce, P.M.; Riffat, S. A state of the art review of evaporative cooling systems for building applications. Renew. Sustain. Energy Rev. 2016, 54, 1240–1249. [Google Scholar] [CrossRef]
- Tariq, R.; Zhan, C.; Zhao, X.; Sheikh, N.A. Numerical study of a regenerative counter flow evaporative cooler using alumina nanoparticles in wet channel. Energy Build. 2018, 169, 430–443. [Google Scholar] [CrossRef]
- Tariq, R.; Zhan, C.; Sheikh, N.A.; Zhao, X. Thermal performance enhancement of a cross-flow-type Maisotsenko heat and mass exchanger using various nanofluids. Energies 2018, 11, 2656. [Google Scholar] [CrossRef] [Green Version]
- Liu, Y.; Akhlaghi, Y.G.; Zhao, X.; Li, J. Experimental and numerical investigation of a high-efficiency dew-point evaporative cooler. Energy Build. 2019, 197, 120–130. [Google Scholar] [CrossRef] [Green Version]
- Al-Abbasi, O.; Al-Alawi, Y. Modeling of indirect evaporative cooling and its performance analysis in harsh environments. Heat Mass Transf. 2019, 55, 3165–3178. [Google Scholar] [CrossRef]
- Wang, Y.; Huang, X.; Li, L. Comparative study of the cross-flow heat and mass exchangers for indirect evaporative cooling using numerical methods. Energies 2018, 11, 3374. [Google Scholar] [CrossRef] [Green Version]
- Kim, M.H.; Jeong, J.W. Cooling performance of a 100% outdoor air system integrated with indirect and direct evaporative coolers. Energy 2013, 52, 245–257. [Google Scholar] [CrossRef]
- Cui, X.; Chua, K.J.; Islam, M.R.; Ng, K.C. Performance evaluation of an indirect pre-cooling evaporative heat exchanger operating in hot and humid climate. Energy Convers. Manag. 2015, 102, 140–150. [Google Scholar] [CrossRef]
- Chauhan, S.S.; Rajput, S.P.S. Parametric analysis of a combined dew point evaporative-vapour compression based air conditioning system. Alex. Eng. J. 2016, 55, 2333–2344. [Google Scholar] [CrossRef] [Green Version]
- Cui, X.; Islam, M.R.; Chua, K.J. An experimental and analytical study of a hybrid air-conditioning system in buildings residing in tropics. Energy Build. 2019, 201, 216–226. [Google Scholar] [CrossRef]
- Belusko, M.; Liddle, R.; Alemu, A.; Halawa, E.; Bruno, F. Performance evaluation of a CO2 refrigeration system enhanced with a dew point cooler. Energies 2019, 12, 1079. [Google Scholar] [CrossRef] [Green Version]
- Yu, B.F.; Hu, Z.B.; Liu, M.; Yang, H.L.; Kong, Q.X.; Liu, Y.H. Review of research on air-conditioning systems and indoor air quality control for human health. Int. J. Refrig. 2009, 32, 3–20. [Google Scholar] [CrossRef]
- Bonetta, S.; Bonetta, S.; Mosso, S.; Sampò, S.; Carraro, E. Assessment of microbiological indoor air quality in an Italian office building equipped with an HVAC system. Environ. Monit. Assess. 2010, 161, 473–483. [Google Scholar] [CrossRef] [PubMed]
- Piekarska, K.; Trusz, A.; Szczęśniak, S. Bacteria and fungi in two air handling units with air recirculating module. Energy Build. 2018, 178, 154–164. [Google Scholar] [CrossRef]
- Xu, P.; Ma, X.; Zhao, X.; Fancey, K. Experimental investigation of a super performance dew point air cooler. Appl. Energy 2017, 203, 761–777. [Google Scholar] [CrossRef]
- Woods, J. Membrane processes for heating, ventilation, and air conditioning. Renew. Sustain. Energy Rev. 2014, 33, 290–304. [Google Scholar] [CrossRef]
- Englart, S. Use of a membrane module for semi-direct air evaporative cooling. Indoor Built Environ. 2019, 13. [Google Scholar] [CrossRef]
- Shabgard, H.; Allen, M.J.; Sharifi, N.; Benn, S.P.; Faghri, A.; Bergman, T.L. Heat pipe heat exchangers and heat sinks: Opportunities, challenges, applications, analysis, and state of the art. Int. J. Heat Mass Transf. 2015, 89, 138–158. [Google Scholar] [CrossRef]
- Wadowski, T.; Akbarzadeh, A.; Johnson, P. Characteristics of a gravity-assisted heat pipe-based heat exchanger. Heat Recover. Syst. CHP 1991, 11, 69–77. [Google Scholar] [CrossRef]
- Kassai, M.; Ge, G.; Simonson, C.J. Dehumidification performance investigation of run-around membrane energy exchanger system. Therm. Sci. 2016, 20, 1927–1938. [Google Scholar] [CrossRef]
- Riffat, S.B.; Zhu, J. Mathematical model of indirect evaporative cooler using porous ceramic and heat pipe. Appl. Therm. Eng. 2004, 24, 457–470. [Google Scholar] [CrossRef]
- Boukhanouf, R.; Amer, O.; Ibrahim, H.; Calautit, J. Design and performance analysis of a regenerative evaporative cooler for cooling of buildings in arid climates. Build. Environ. 2018, 142, 1–10. [Google Scholar] [CrossRef]
- Alharbi, A.; Almaneea, A.; Boukhanouf, R. Integrated hollow porous ceramic cuboids-finned heat pipes evaporative cooling system: Numerical modelling and experimental validation. Energy Build. 2019, 196, 61–70. [Google Scholar] [CrossRef]
- Danielewicz, J.; Sayegh, M.A.; Śniechowska, B.; Szulgowska-Zgrzywa, M.; Jouhara, H. Experimental and analytical performance investigation of air to air two phase closed thermosyphon based heat exchangers. Energy 2014, 77, 82–87. [Google Scholar] [CrossRef] [Green Version]
- Jouhara, H.; Robinson, A.J. Experimental investigation of small diameter two-phase closed thermosyphons charged with water, FC-84, FC-77 and FC-3283. Appl. Therm. Eng. 2010, 30, 201–211. [Google Scholar] [CrossRef] [Green Version]
- Khandekar, S.; Joshi, Y.M.; Mehta, B. Thermal performance of closed two-phase thermosyphon using nanofluids. Int. J. Therm. Sci. 2008, 47, 659–667. [Google Scholar] [CrossRef]
- Zhang, L.; Huang, S. Coupled heat and mass transfer in a counter flow hollow fiber membrane module for air humidification. Int. J. Heat Mass Transf. 2011, 54, 1055–1063. [Google Scholar] [CrossRef]
- Li, G.-P.; Qi, R.; Zhang, L.-Z. Performance study of a solar-assisted hollow-fiber-membrane-based air humidification-dehumidification desalination system: Effects of membrane properties. Chem. Eng. Sci. 2019, 206, 164–179. [Google Scholar] [CrossRef]
- Chen, Y.; Luo, Y.; Yang, H. A simplified analytical model for indirect evaporative cooling considering condensation from fresh air: Development and application. Energy Build. 2015, 108, 387–400. [Google Scholar] [CrossRef]
- Žukauskas, A.; Ulinskas, R. Efficiency parameters for heat transfer in tube banks. Heat Transf. Eng. 1985, 6, 19–25. [Google Scholar] [CrossRef]
- Kim, N.H.; Youn, B.; Webb, R.L. Air-side heat transfer and friction correlations for plain fin-and-tube heat exchangers with staggered tube arrangements. J. Heat Transf. 1999, 121, 662–667. [Google Scholar] [CrossRef]
- Tarrad, A.H.; Khudor, D.S. A correlation for the air-side heat transfer coefficient assessment in continuous flat-plate finned heat exchangers. J. Therm. Sci. Eng. Appl. 2015, 7, 1–9. [Google Scholar] [CrossRef]
- Amer, O. A Heat Pipe and Porous Ceramic Based Sub Wet-Bulb Temperature Evaporative Cooler: A Theoretical and Experimental Study. Ph.D. Thesis, University of Nottingham, Nottingham, UK, 2017. [Google Scholar]
- Alharbi, A. Investigation of Sub-Wet Bulb Temperature Evaporative Cooling System for Cooling in Buildings. Ph.D. Thesis, University of Nottingham, Nottingham, UK, 2014. [Google Scholar]
Figure 1.
Schematic of the gravity-assisted heat pipe-based indirect evaporative cooler (GAHP-based IEC) with staggered tube arrangement.
Figure 1.
Schematic of the gravity-assisted heat pipe-based indirect evaporative cooler (GAHP-based IEC) with staggered tube arrangement.

Figure 2.
Computational element applied for development of the mathematical model.

Figure 3.
Schematic of a GAHP and its thermal resistance network.

Figure 4.
Schematic of a staggered GAHP bank illustrating nomenclature: (a) Working air wet channel; (b) Product air channel with continuous flat-plate fin.
Figure 4.
Schematic of a staggered GAHP bank illustrating nomenclature: (a) Working air wet channel; (b) Product air channel with continuous flat-plate fin.

Figure 5.
Comparison of the simulation output with the experimental data for a heat pipe and porous ceramic-based sub wet-bulb temperature evaporative cooler (IEC1) (Appendix D [43]): (a) Product and working air temperature distribution for inlet conditions 35 °C and RH 35%; (b) Impact of inlet air temperature on the cooling capacity and wet bulb effectiveness.

Figure 6.
Comparison of the simulation output with the experimental data for an integrated heat pipe and porous ceramic cuboid-based indirect evaporative cooler (IEC2) [33]: (a) Product and working air temperature distribution for inlet conditions 35 °C and RH 35%; (b) Impact of inlet air relative humidity on cooling capacity and wet bulb effectiveness (35 °C).

Figure 7.
Contour plot of impact of inlet air temperature and relative humidity: (a) Coefficient of performance (COP) coefficient; (b) Wet bulb effectiveness.
Figure 7.
Contour plot of impact of inlet air temperature and relative humidity: (a) Coefficient of performance (COP) coefficient; (b) Wet bulb effectiveness.

Figure 8.
Impact of inlet air relative humidity for constant inlet air temperatures: (a) COP coefficient and wet bulb effectiveness; (b) Product air temperature difference and supply cooling capacity.
Figure 8.
Impact of inlet air relative humidity for constant inlet air temperatures: (a) COP coefficient and wet bulb effectiveness; (b) Product air temperature difference and supply cooling capacity.

Figure 9.
Impact of inlet air velocity: (a) COP coefficient and supply cooling capacity; (b) Product air temperature difference and wet bulb effectiveness.
Figure 9.
Impact of inlet air velocity: (a) COP coefficient and supply cooling capacity; (b) Product air temperature difference and wet bulb effectiveness.

Figure 10.
Impact of number of GAHP rows on the COP coefficient and wet bulb effectiveness.

Figure 11.
Impact of spacing between adjacent fins in a dry channel on the COP coefficient and wet bulb effectiveness.
Figure 11.
Impact of spacing between adjacent fins in a dry channel on the COP coefficient and wet bulb effectiveness.

Figure 12.
Impact of working-to-product airflow ratio: (a) COP coefficient and wet bulb effectiveness; (b) Product air temperature difference and supply cooling capacity.
Figure 12.
Impact of working-to-product airflow ratio: (a) COP coefficient and wet bulb effectiveness; (b) Product air temperature difference and supply cooling capacity.


Table 1.
Initial and boundary conditions applied to solve the mathematical model.
| Parameter | Initial and Boundary Condition |
|---|---|
| Product air inlet temperature | |
| Product air inlet humidity ratio | |
| Working air inlet temperature | |
| Working air inlet humidity ratio |
Table 2.
Details of the calculated heat transfer coefficients.
| Parameter | Equation | No. |
|---|---|---|
| Nusselt number for GAHP bank in wet channel [40] | (9) | |
| Colburn j factor for plain-finned GAHP bank in dry channel [41] | (10) | |
| Vaporization heat transfer for GAHP evaporator section [35] | (11) | |
| Condensation heat transfer for GAHP condenser section [35] | (12) |
Table 3.
Overall product air-side surface efficiency [42].
Table 3.
Overall product air-side surface efficiency [42].
| Parameter | Equation | No. |
|---|---|---|
| Overall surface efficiency | (13) | |
| Fin efficiency | , where | (14) |
| Equivalent radius of a hexagonal tube array | (15) | |
| Coefficients ψ and β | and | (16) |
| φ factor | (17) |
Table 4.
Details of the calculated pressure drops.
| Parameter | Equation | No. |
|---|---|---|
| Total pressure drop in the wet channel [40] | (22) | |
| Total pressure drop in the dry channel [41] | (23) | |
| Overall friction factor in the dry channel [41] | (24) | |
| Friction factor associated with fin area in the dry channel [41] | (25) | |
| Friction factor associated with GAHP area in the dry channel [41] | (26) |
| Parameter | IEC1 [32,43] | IEC2 [33,44] |
|---|---|---|
| Length × width × height | 700 × 227 × 300 mm | 820 × 52 × 380 mm |
| Height of dry channel | 140 mm | 130 mm |
| Height of wet channel | 140 mm | 220 mm |
| Wet channel material | porous ceramic tubes | porous ceramic cuboids |
| Number of heat pipes | 15 | 12 |
| HP working fluid | deionized water | deionized water |
| Ambient air temperature, °C | 30–40 | 35 |
| Ambient air relative humidity, % | 35, 45 | 35–55 |
| Working-to-product air flow ratio, − | 0.5 | 0.5 |
| Mass flow rate in the dry channel, kg/s | 0.03 | 0.003 |
Table 6.
Input operating conditions for the simulation.
| Parameter | Value/type | Unit |
|---|---|---|
| Height of dry channel | 250 | mm |
| Height of wet channel | 250 | mm |
| GAHP outer diameter | 12 | mm |
| Number of GAHP rows | 15 | – |
| GAHP working fluid | deionized water | – |
| GAHP material | copper | – |
| GAHP arrangement | staggered | – |
| Longitudinal/transverse pitch | 14 | mm |
| Working-to-product airflow ratio | 0.5 | – |
| Inlet product airflow velocity | 1.5 | m/s |
| Fin spacing | 1.6 | mm |
| Fin material | aluminum | – |
Table 7.
Nominal inlet air conditions for the simulation.
| Parameter | Inlet Air Temperature, °C | Inlet Air Relative Humidity, % |
|---|---|---|
| Conditions 1 (cond. 1) | 35 | 30 |
| Conditions 2 (cond. 2) | 35 | 40 |
| Conditions 3 (cond. 3) | 35 | 50 |
© 2020 by the authors. Licensee MDPI, Basel, Switzerland. This article is an open access article distributed under the terms and conditions of the Creative Commons Attribution (CC BY) license (http://creativecommons.org/licenses/by/4.0/).
Share and Cite
MDPI and ACS Style
Rajski, K.; Danielewicz, J.; Brychcy, E. Performance Evaluation of a Gravity-Assisted Heat Pipe-Based Indirect Evaporative Cooler. Energies 2020, 13, 200. https://doi.org/10.3390/en13010200
AMA Style
Rajski K, Danielewicz J, Brychcy E. Performance Evaluation of a Gravity-Assisted Heat Pipe-Based Indirect Evaporative Cooler. Energies. 2020; 13(1):200. https://doi.org/10.3390/en13010200
Chicago/Turabian StyleRajski, Krzysztof, Jan Danielewicz, and Ewa Brychcy. 2020. "Performance Evaluation of a Gravity-Assisted Heat Pipe-Based Indirect Evaporative Cooler" Energies 13, no. 1: 200. https://doi.org/10.3390/en13010200
Note that from the first issue of 2016, this journal uses article numbers instead of page numbers. See further details here.