Investigating Agglomeration Tendency of Co-Gasification between High Alkali Biomass and Woody Biomass in a Bubbling Fluidized Bed System

The Joint Graduate School of Energy and Environment, Center of Excellence on Energy Technology and Environment, King Mongkut’s University of Technology Thonburi, Bangkok 10140, Thailand
*
Author to whom correspondence should be addressed.
Energies 2020, 13(1), 56; https://doi.org/10.3390/en13010056
Submission received: 17 October 2019
/
Revised: 30 November 2019
/
Accepted: 18 December 2019
/
Published: 20 December 2019
(This article belongs to the Section A4: Bio-Energy)
Abstract
:Palm empty fruit bunches (EFB) is known as problematic biomass due to its high alkali content, i.e., more than half of inorganic matter is potassium (K). EFB when used as a fuel in fluidized beds with silica sand as bed material could form the sticky compound K2O·nSiO2 starting at around 750 °C and adhere bed particles together, resulting in bed agglomeration. Blending EFB with rubber wood sawdust (RWS) could improve the chemical properties and consequent ash composition of the blended fuel. In this study, RWS was blended with EFB at three ratios: RWS:EFB = 25:75, RWS:EFB = 50:50, and RWS:EFB = 75:25. Adding RWS to the fuel prolonged de-fluidization time. The high content of CaO in the RWS ash acted as an inhibitor to prevent the formation of K2O·nSiO2 and, instead, enhanced the formation of K2CO3, a higher melting point compound, which reduced bed agglomeration. During the experiment using RWS:EFB = 75:25, no bed agglomeration was found.
1. Introduction
Fluidized bed gasification is a promising technology in energy production, as it has many advantages over other types of gasification technologies, e.g., high efficiency due to good heat distribution. To operate a fluidized bed reactor, small inert solid particles, such as silica sand, are commonly used as a ‘bed material’, which acts as a heat transfer and storage medium and is moved by gas flowing through it [1,2]. By limiting the amount of air under the stoichiometric air to fuel ratio or equivalence ratio (ER), the gasification process occurs and converts solid fuel to combustible gases (CO, H2, and light hydrocarbon gases) called ‘producer gases’ [3].
Unfortunately, using fluidized beds with rich-alkali biomasses can cause bed agglomeration issues because sodium (Na) and potassium (K), which are present in biomasses, form low melting point potassium-silicate compounds (K2O·nSiO2) [4,5,6]. These compounds start to melt at around 750 °C, and later coat and adhere the bed particles together, which is the main cause of bed agglomeration and de-fluidization [7,8,9].
From the problem mentioned above, high alkali biomasses could not be used as fuel in fluidized beds for continuous operation, especially when using silica sand as bed material. To eliminate this issue, using bed additives and catalysts (i.e., kaolin [10], lime [11] CaO [12], and MgO [12,13]), and alternative bed material (i.e., alumina sand [14,15,16], dolomite [15,16], olivine [17], limestone [18], sepiolite [19] and mullite [20]) for bed agglomeration minimization have been widely researched in recent years but each study conducted the experiment using specific conditions and biomass. Lin et al. [12] and Liu et al. [13] studied the effects of alkali earth metals (i.e., Ca and Mg) on the bed agglomeration in fluidized beds. They revealed that Ca and Mg possibly act as catalysts and could inhibit the bed agglomeration during the combustion process. A previous study by the authors [16] about bed agglomeration minimization using dolomite as bed material also revealed that CaO, which was generated via a calcination reaction, during gasification plays a key role by inhibiting the formation of K2O·nSiO2 and form K2CO3, which has a higher melting point, instead of K2O·4SiO2.
Recently, George et al. [21] investigated the effect of co-gasification on bed agglomeration tendency by using coffee husks, which have high K in their ashes (57% by weight, dry ash basis) with sawdust in a muffle furnace. The results revealed that adding sawdust could reduce the agglomeration tendency. However, their study presented the effects of only one blending ratio of fuel, and the experiment was performed in a small muffle furnace, which did not represent conditions in fluidized beds. Regarding the studies above [12,13,16,21], woody biomass which has a low ash content but has rich alkali earth metals (Ca and Mg) could be used as a co-gasification fuel to minimize the bed agglomeration as well as reducing the operational cost due to the use of bed additives, catalysts, and alternative bed materials.
In this study, palm empty fruit bunch (EFB) was selected as a representative of high alkali biomass because of its huge potential in Thailand [22]. EFB is generated from palm oil mill processing (the amount of EFB is about 30% of raw material), and the remaining potential of EFB is approximately 2.5 Mt/year [23]. So far, EFB is not utilized at its full potential and after being stored for long could decay and generate unwanted gas such as CH4. To utilize the EFB, using it as a fuel in combustion boilers for processing energy in palm oil mills has been attempted, but, due to the high alkali content of EFB, ash-related issues, such as fouling depositions, are encountered which cause more frequent shutdowns.
Currently, there are few studies on EFB gasification in fluidized beds using silica sand as bed material, most of which have focused only on the effects of bed temperature on producer gas quality [24,25]. A previous study of EFB gasification and occurrence of de-fluidization when using sand as bed material by the authors revealed that under the conditions studied, the optimal air to fuel ratio or ER that give the best HHV was 0.35 [26]. However, bed agglomeration was found in every ER in the range of 0.31 to 0.43, where the bed temperature was always higher than 750 °C. However, those studies only focused on the temperature criteria and no bed agglomeration behavior and mechanism were investigated.
There are other studies focusing on the agglomeration mechanism but under combustion condition. Chaivatamaset et al. investigated the bed agglomeration characteristic of EFB but under a combustion environment in a fluidized bed [27]. They illustrated that apart from bed temperature, other factors, i.e., bed particle size, alkali level in fuel, and air velocity could affect the bed agglomeration behavior. They also found that there were two major bed agglomeration mechanisms related to their study, e.g., the coated induced mechanism (the bed particles were adhered by the coated layer of K2O·nSiO2) and the melted induced mechanism (the bed particles were adhered by the melted spot of K2O·nSiO2) [6]. These similar agglomeration mechanisms were also found in other fluidized bed combustion studies but using different high alkali biomass, i.e., rice straw [27], corncob [28], and eucalyptus bark [29]. However, in gasification, the lower surrounding O2 and operable temperature could result in the different de-fluidization temperatures and bed agglomeration behaviors compared to fluidized bed combustion. Also, the solution of using EFB as fuel in fluidized bed gasification via a co-gasification method needs to be established before use on a commercial scale.
Therefore, this study further investigated the solutions that can be used to overcome bed agglomeration when using high alkali biomass like EFB as fuel in bubbling fluidized bed gasification via the co-gasification method. Rubber wood sawdust (RWS) was selected as a representative of woody biomass for co-gasification with EFB because it is available in the same geographical area to where EFB is generated. More importantly, RWS is a potential fuel for co-gasification, due to its low ash [30] and alkali content [31], and hence is unlikely to cause bed agglomeration. It also contains a high amount of alkali earth metals that possibly inhibit bed agglomeration, e.g., CaO and MgO. Blending RWS to EFB is likely to reduce the total ash content and improve the properties of the blended fuel, and could prevent the bed agglomeration occurring during the gasification process. The results from this study could provide useful information for the design and operation of industrial-scale gasification processes using high alkali biomass, especially EFB.
The ultimate goal of this study is to discuss the effects of co-gasification by investigating bed agglomeration tendency, including bed agglomeration minimization and agglomeration mechanisms, while using various blending ratios of RWS to EFB as fuel in co-gasification. Experiments were conducted using a 5 kWth air blown bubbling fluidized bed reactor at the selected ER of 0.35.
2. Methodology
2.1. Biomass Preparation
Palm empty fruit bunch (EFB) and rubber wood sawdust (RWS) were used as fuel for co-gasification experiments. Since the as-received EFB was naturally wet, it was left under direct sunlight until completely dry. The size of the EFB was reduced from long fibers to approximately 1–4 mm by an agricultural hammer mill machine. The RWS was originally dry, small, and uniform in size, ranging from 1–3 mm, so it was sieved to a size of about 1 mm before being blended with the EFB to ensure a uniform mixing. To eliminate the effect of moisture content in the experiments, the feedstocks were dried in an oven at 110 °C overnight before use. Later, the prepared samples were kept in an airtight container before use in the experiment.
Small portions of EFB and RWS were powdered and subjected to property analysis. Ultimate and proximate analyzes were conducted using an Elemental Analyzer (Thermo Scientific—Flash EA 1112, Waltham, USA) and a Thermogravimetric Analyzer (PerkinElmer—Pyris 1 TGA, Waltham, USA), respectively. The properties of EFB, RWS, and blended fuels are given in Table 1.
To analyze oxide composition in the ashes, EFB and RWS samples were burned in a muffle furnace, following the American Society for Testing and Materials (ASTM) D-1102 standard, at 575 °C overnight. At 575 °C, the carbon in the fuel was removed, but most of the minerals remained in the ashes. These ashes were analyzed using the X-ray fluorescence technique (Bruker—S8 tiger, Billerica, USA).
According to the fuel elemental analysis, RWS has superior chemical properties (i.e., higher C, H, VM, and lower ash content) compared to EFB. Moreover, RWS has better physical properties than EFB as it has uniform size and round shape, resulting in the better fluidizing experience. From the superior properties of RWS mentioned above, the better gasification experience and performance were expected when adding RWS in the blended fuel.
2.2. Bench Scale Fluidized Bed Gasification System
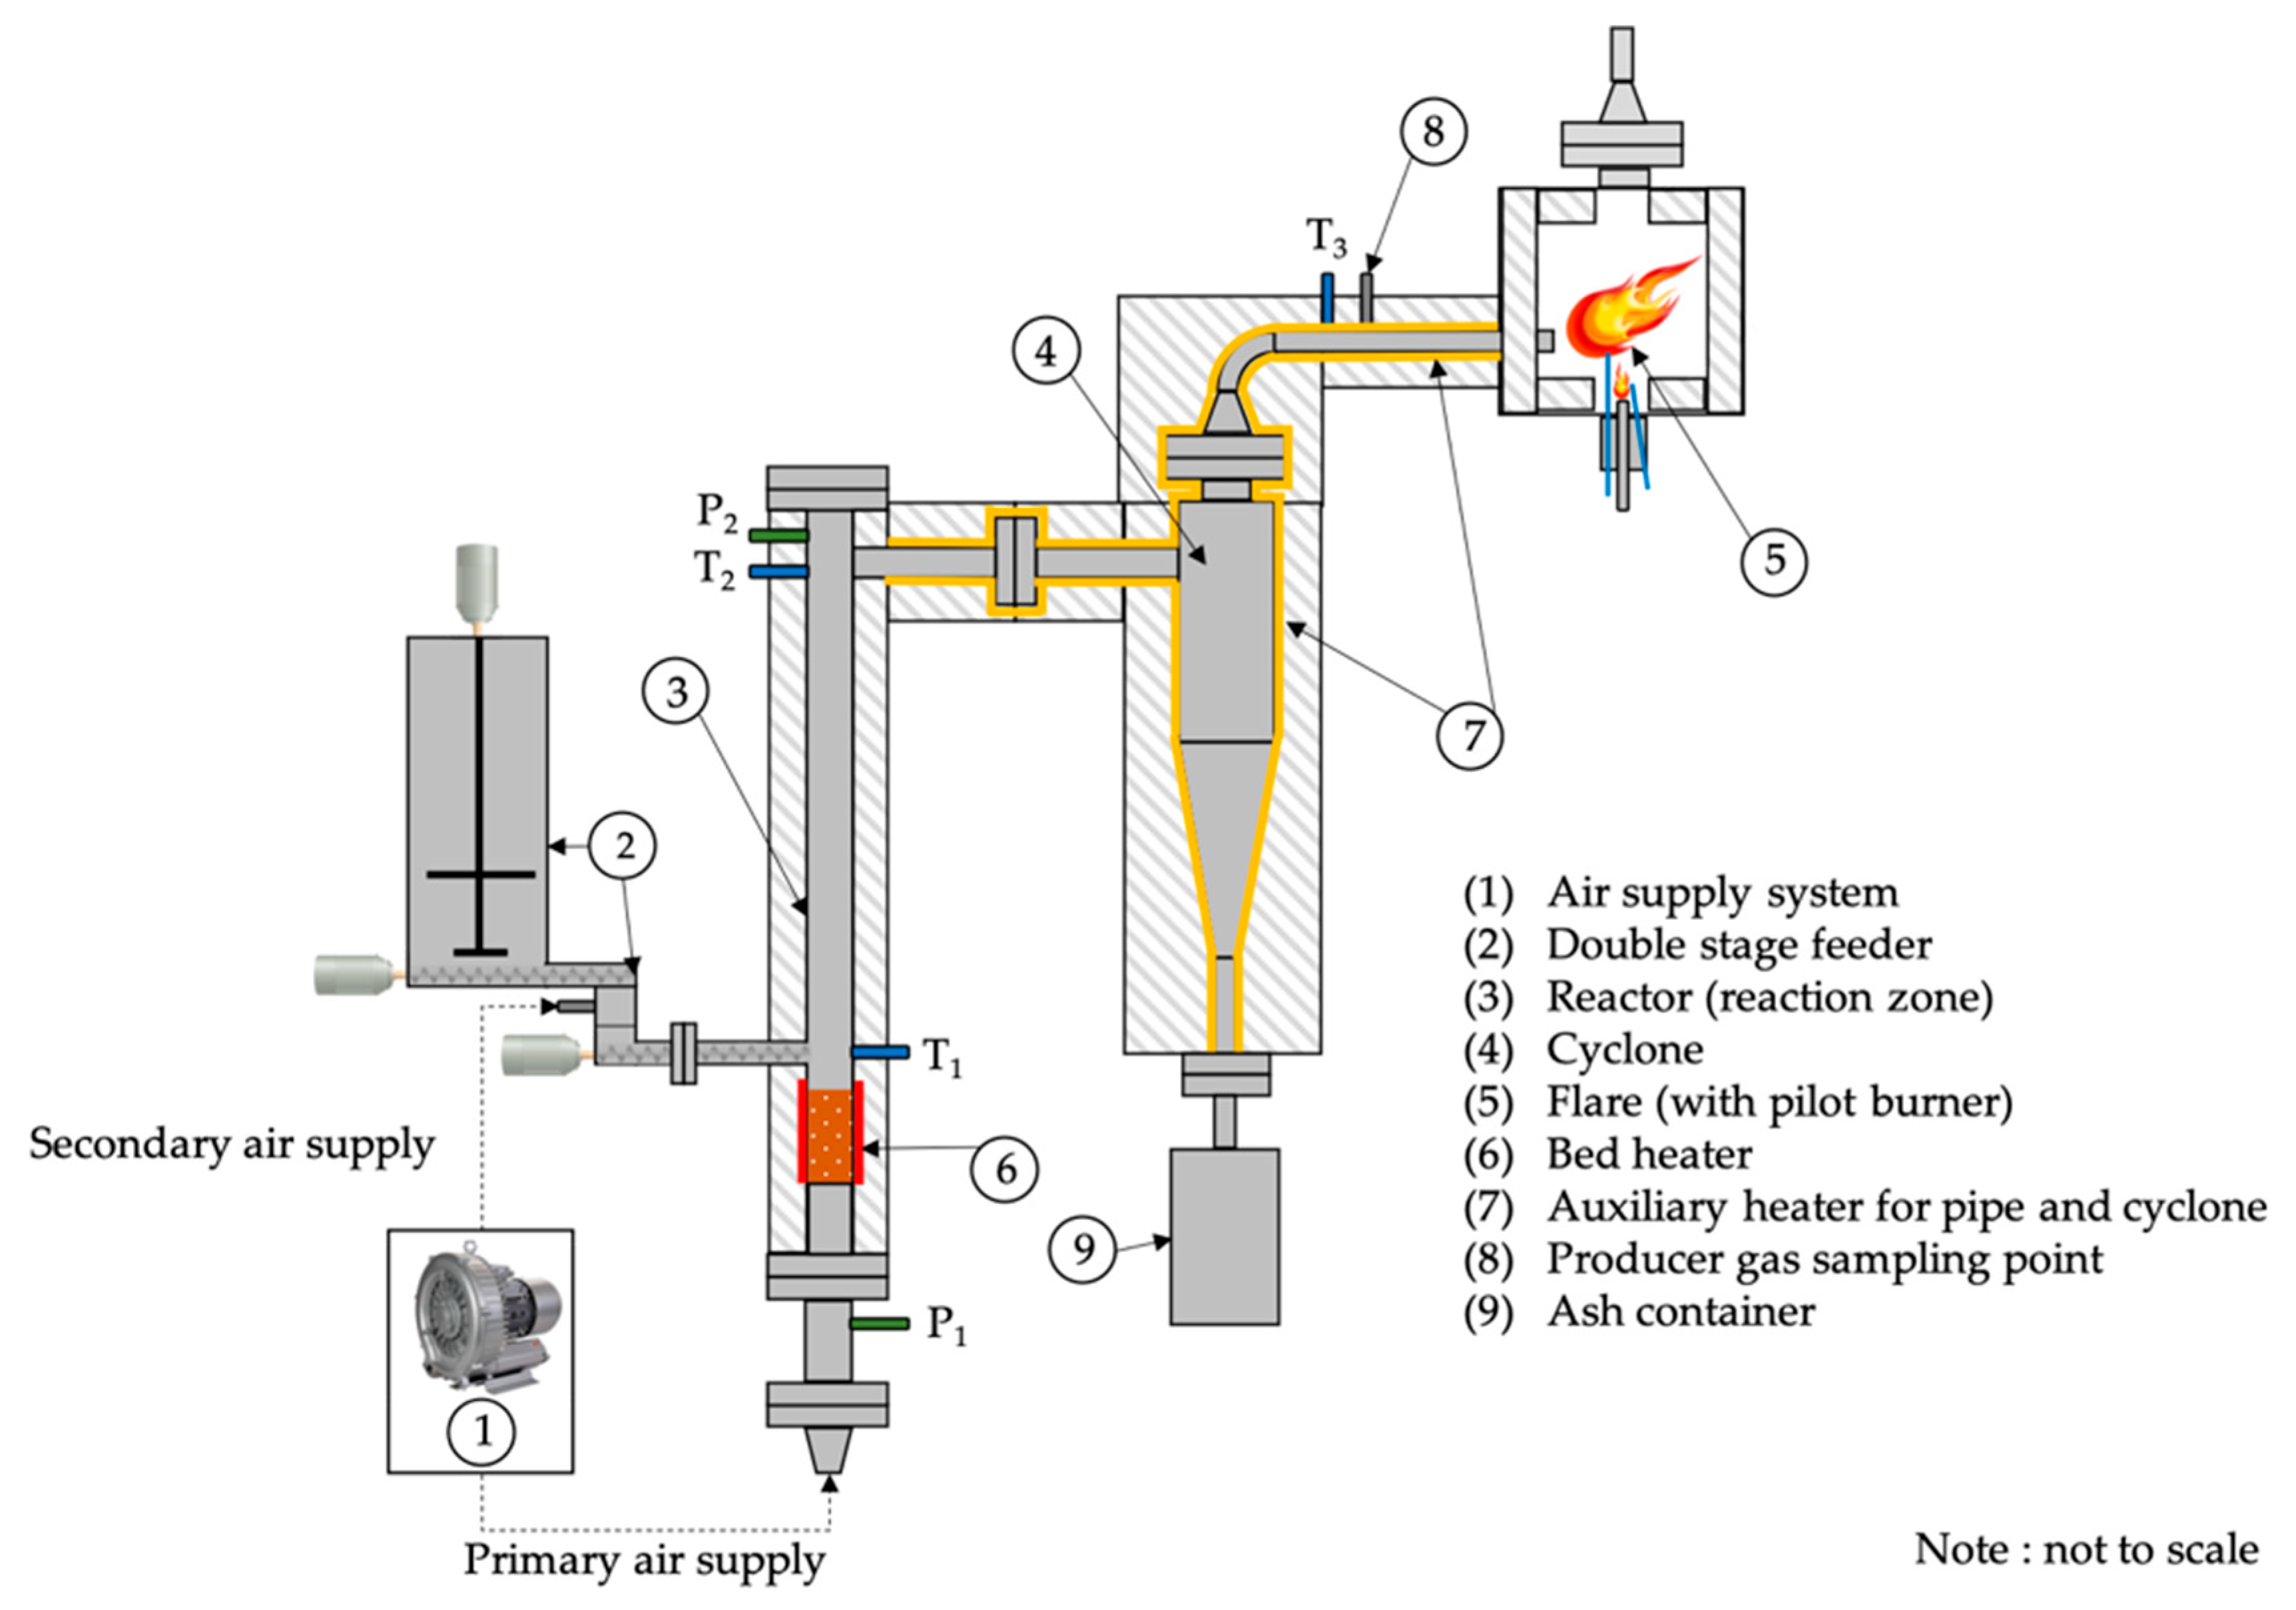
The gasification experiments in this study used a 5 kWth autothermal bench-scale air blown bubbling fluidized bed gasification system. As shown in Figure 1, this system consists of five main parts: (1) air supply unit, (2) fuel feeder, (3) reactor, (4) cyclone, and (5) flare.
The feeder system was designed for solid fuel with less than 2 mm in diameter and 10 mm in length. The system was a two-stage screw feeder. The primary screw feeder was installed in the primary hopper (large hopper) and was used to control the feed rate of biomass. The biomass transferred from the primary screw feeder dropped onto the secondary screw feeder, which was operated at high speed to immediately feed the biomass into the reactor. To eliminate the problems of discontinuous biomass feeding and a subsequent unsteady bed temperature during gasification operation caused by the difficulty in feeding low density and fibrous biomass, a stirring shaft was installed inside the primary hopper to untangle and evenly distribute the biomass into the primary screw feeder.
A bed heater was placed at the bed zone to heat up the reactor. The cyclone and downstream pipeline were also covered by an auxiliary heater (fixed temperature at 350 °C) to prevent tar condensation and subsequent fly ash deposition on the tar. Two thermocouples were installed at 125 mm above the air distributor and at the top of the reactor. Two pressure transducers were also installed at the position below the air distributor and at the top of the reactor to monitor the pressure drop across the bed.
2.3. Experiment Procedure
This series of gasification experiment was designed to study the effects of co-gasification between EFB and RWS on bed agglomeration tendency in bubbling fluidized bed. Three different blending ratios (RWS:EFB = 25:75, RWS:EFB = 50:50 and RWS:EFB = 75:25) were selected. Gasification procedures using only RWS and only EFB were also conducted for reference.
Before each experiment, about 200 g of silica sand, with an average size of 250 µm, was placed into the reactor as bed material. Later, the feedstock was filled in the primary hopper. Then the air was supplied through the primary air inlet (located at the bottom of the reactor) and the secondary air inlet (located at, and introduced through, the feeder to assist fuel feeding). The primary air flow rate was fixed at 0.78 m3/h to minimize the effect of gas residence time, while the secondary air flow rate was fixed at 0.12 m3/h. The superficial air velocity inside the reactor equaled 0.1 m/s, which was approximately 1.86 times the minimum fluidization velocity (Umf).
To warm up the system, the bed and auxiliary heaters were turned on until the bed temperature reached a stable condition at around 585 °C. Then, the bed heater was turned off, and fuel feeding was started and adjusted to ER 0.35. The auxiliary heaters continued to the heat cyclone and pipeline at 350 °C throughout the experiment to prevent tar condensation and heat losses. However, some experiments in this study resulted in bed agglomeration and de-fluidization. In such cases, the bed temperature would rapidly rise above 950 °C. To prevent that damage, air and fuel supplies were stopped.
2.4. Producer Gas Sampling and Analysis Method
The gas sampling point was located next to the cyclone. Producer gas was drawn from the main gas line by a vacuum pump at a flow rate of 2 L/h, after gasification reached a steady-state condition. The sampled gas then passed through a series of two salt-ice cooled impinger bottles; each was filled with isopropanol (IPA). IPA was used as a solvent to separate unwanted tar from the producer gas. In cases for the run which de-fluidization was expected, the producer gas was collected as soon as the bed temperature reached 700 °C so that the gas collection duration would be the same for all conditions and was not affected by de-fluidization.
For producer gas composition analysis, producer gas was collected in a 5-L gas bag and diluted by helium (He) at a ratio of 1:10 before analysis using micro GC (Agilent—490 Micro GC, Santa Clara, USA) with two columns installed in parallel. The MS-5A column detected O2, N2, CO, and CH4, whereas the Porapak U column detected CO2, C2H6, C2H2, and C2H4. For hydrocarbon gases larger than C3, the concentration was measured by GC-FID. The analysis found that the concentration of Cn>3 gases from gasification was less than 0.1% dry gas basis, thus, the Cn>3 gases were neglected.
2.5. Agglomeration Analysis
When the gasification experiment ended, the spent bed was taken from the bottom of the reactor after the system had cooled to room temperature. A small portion of the bed sample was molded in a 25 mm diameter cylinder using clear resin (e.g., Stuers Epo-fix kits). Later, the molded bed sample was cross-sectioned horizontally with a diamond cutting disc and the cut-surface was polished with a diamond polisher before being coated by 99.99% gold (Au) at a thickness of 20 nm using gold sputtering coater (Cressington—180Auto, Watford, UK). The finished workpiece was analyzed using scanning electron microscope (SEM) technique. SEM model JSM/6610LV (Jeol—JSM6610LV, Akishima, Japan) was used to study changes in the physical structure of the bed samples. The SEM was operated at high vacuum and a high voltage (22 kV) mode. The magnification using in this study varied between 40× to 200× whereas the spot size is 50. An Energy Dispersive X-ray Spectroscopy (SEM) (Oxford Instruments—INCA-xart, Abingdon, UK) technique was also used to analyze how the element compositions localized in the bed sample. The EDS was operated in single spot mode.
2.6. Error and Uncertainty
Six experiments of RWS gasification at ER 0.35 were conducted to determine the systematic error of the gasification experiments and product analysis. The bed temperature was found to vary within ±15 °C. For producer gas concentration analysis, the error of producer gas concentration was below 1%.
3. Results and Discussion
3.1. Gasification Characteristic
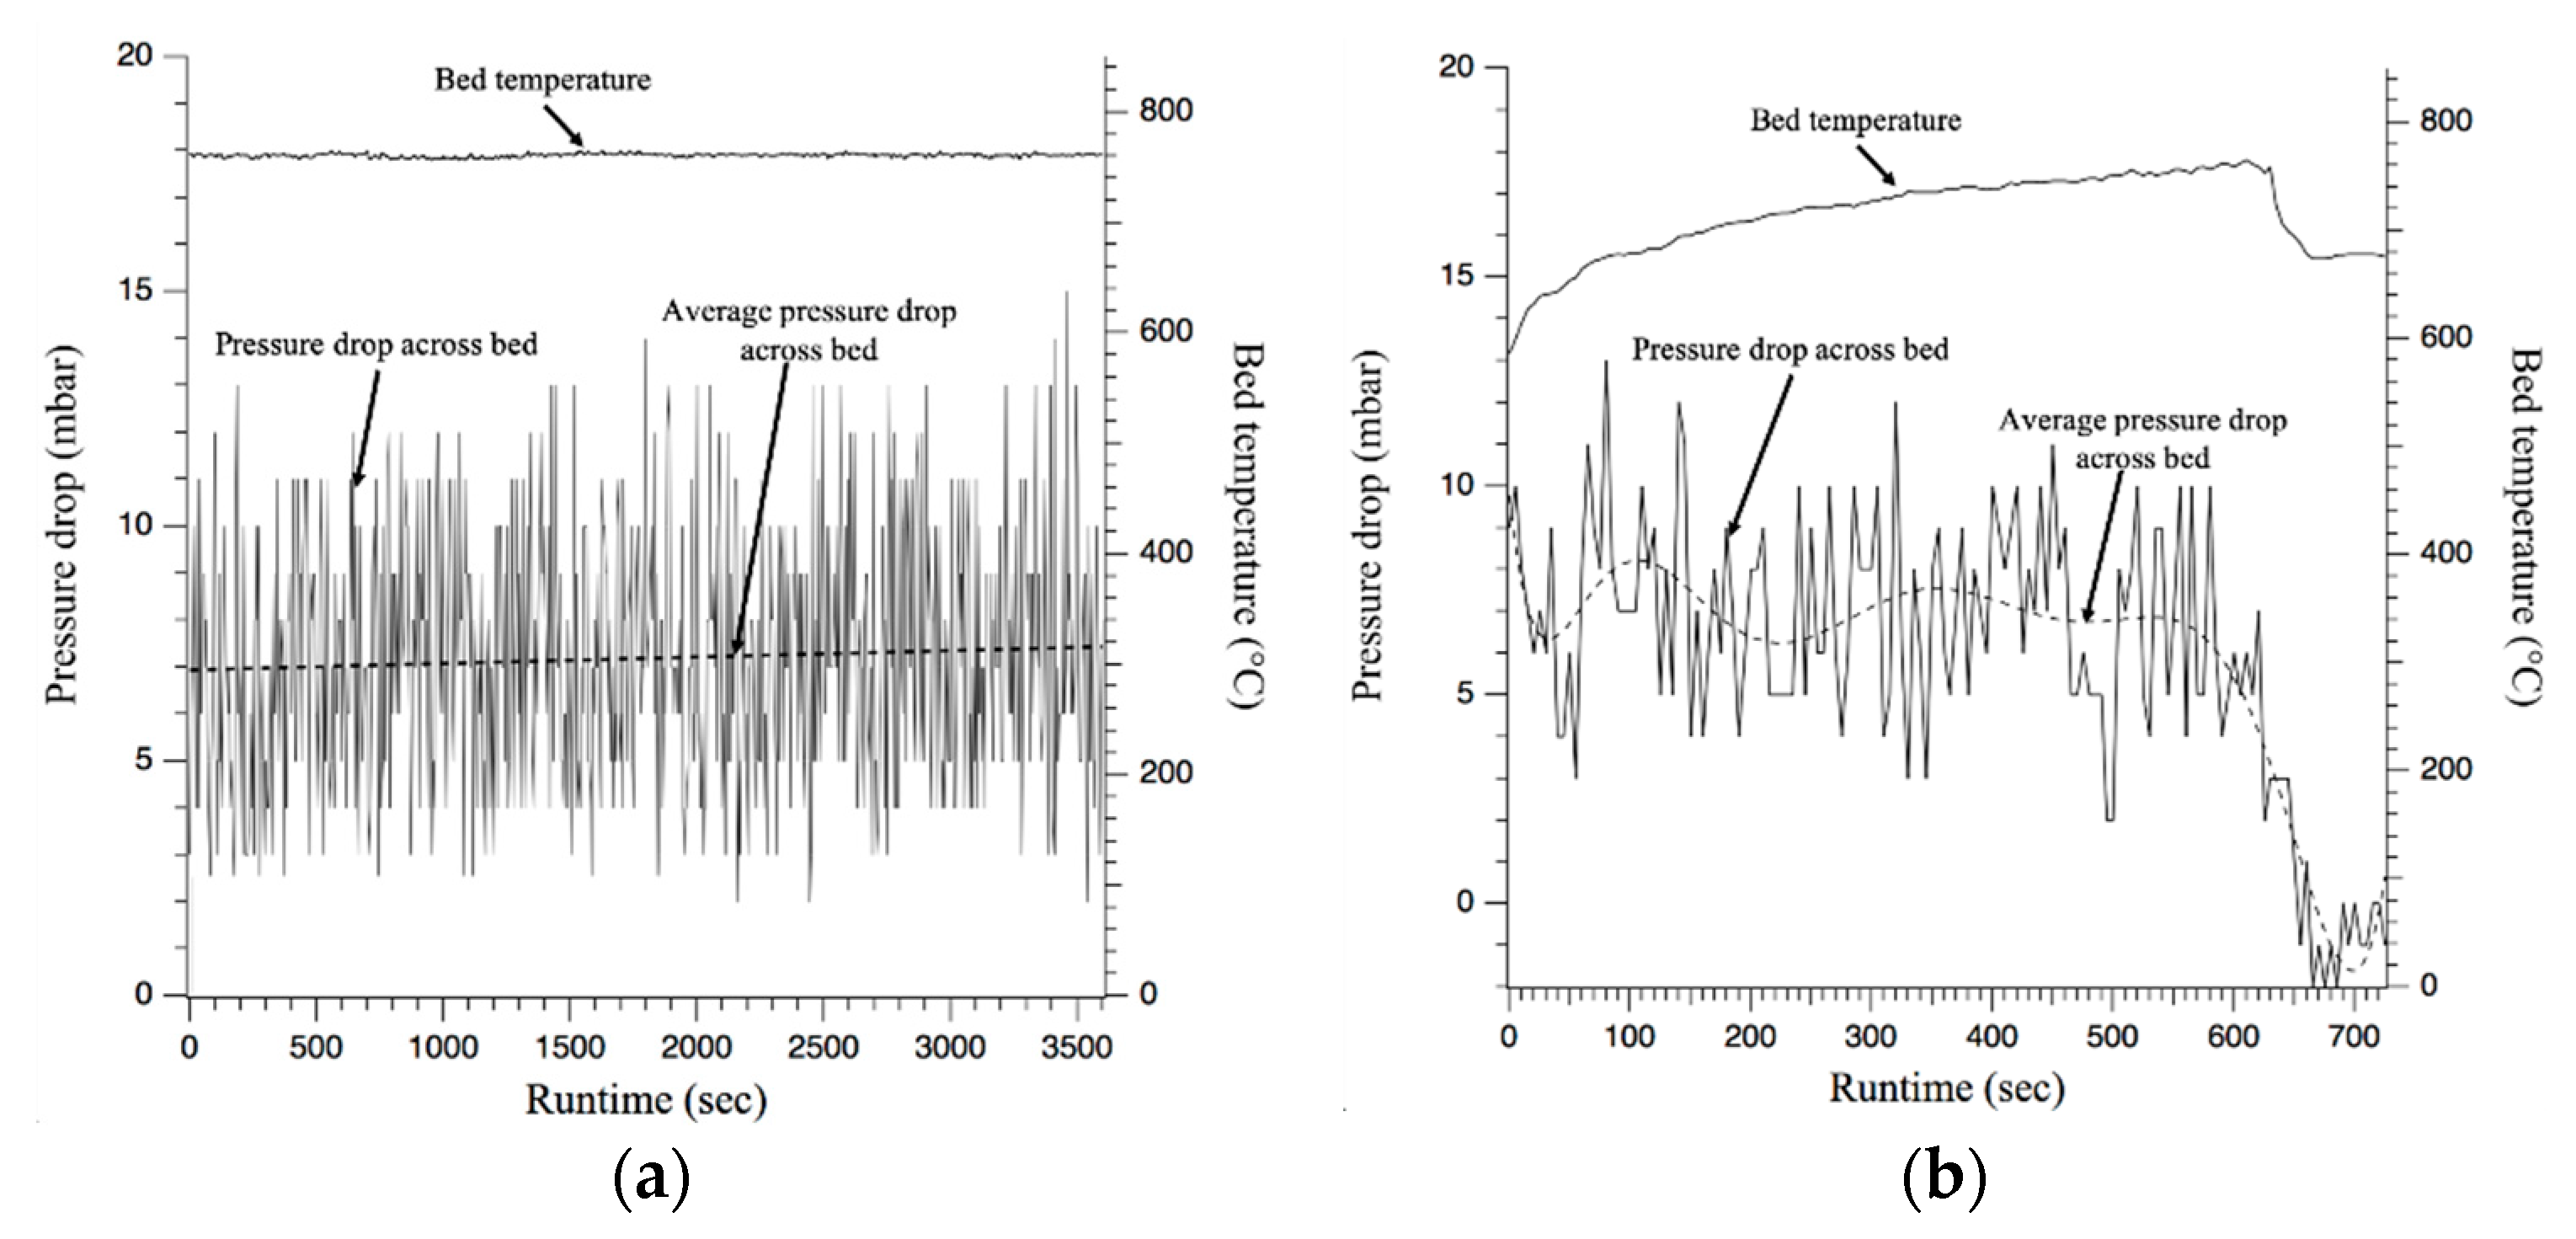
In the experiments, bed temperature and pressure drop across the bed were continuously monitored. The experiment using RWS = 100 as fuel provided an example of a normal gasification operation, in which no agglomeration occurred. The bed temperature and pressure drop during gasification could be sustained in the gasification operation, even though there were some fluctuations, as shown in Figure 2a.
In contrast, the experiment using EFB = 100 as fuel was an example of gasification behavior in which bed agglomeration occurred. As EFB are rich-alkali fuel, containing enormous amount of potassium and silicon in their ashes, they formed a low melting point temperature, sticky, potassium-silicate compound (K2O·nSiO2). This sticky compound glued the bed particles together and caused bed agglomeration, which resulted in increased pressure drop across the bed (ΔPbed), as shown in Figure 2b. ΔPbed continuously developed due to the intensity of bed agglomeration until ΔPbed suddenly dropped to zero due to loss of fluidization. This point was indicated as the de-fluidization point.
The average bed temperatures of the experiments were calculated from the point the bed temperature reached 700 °C to the end of the experiment. The summary of average bed temperatures and de-fluidization time are shown in Table 2.
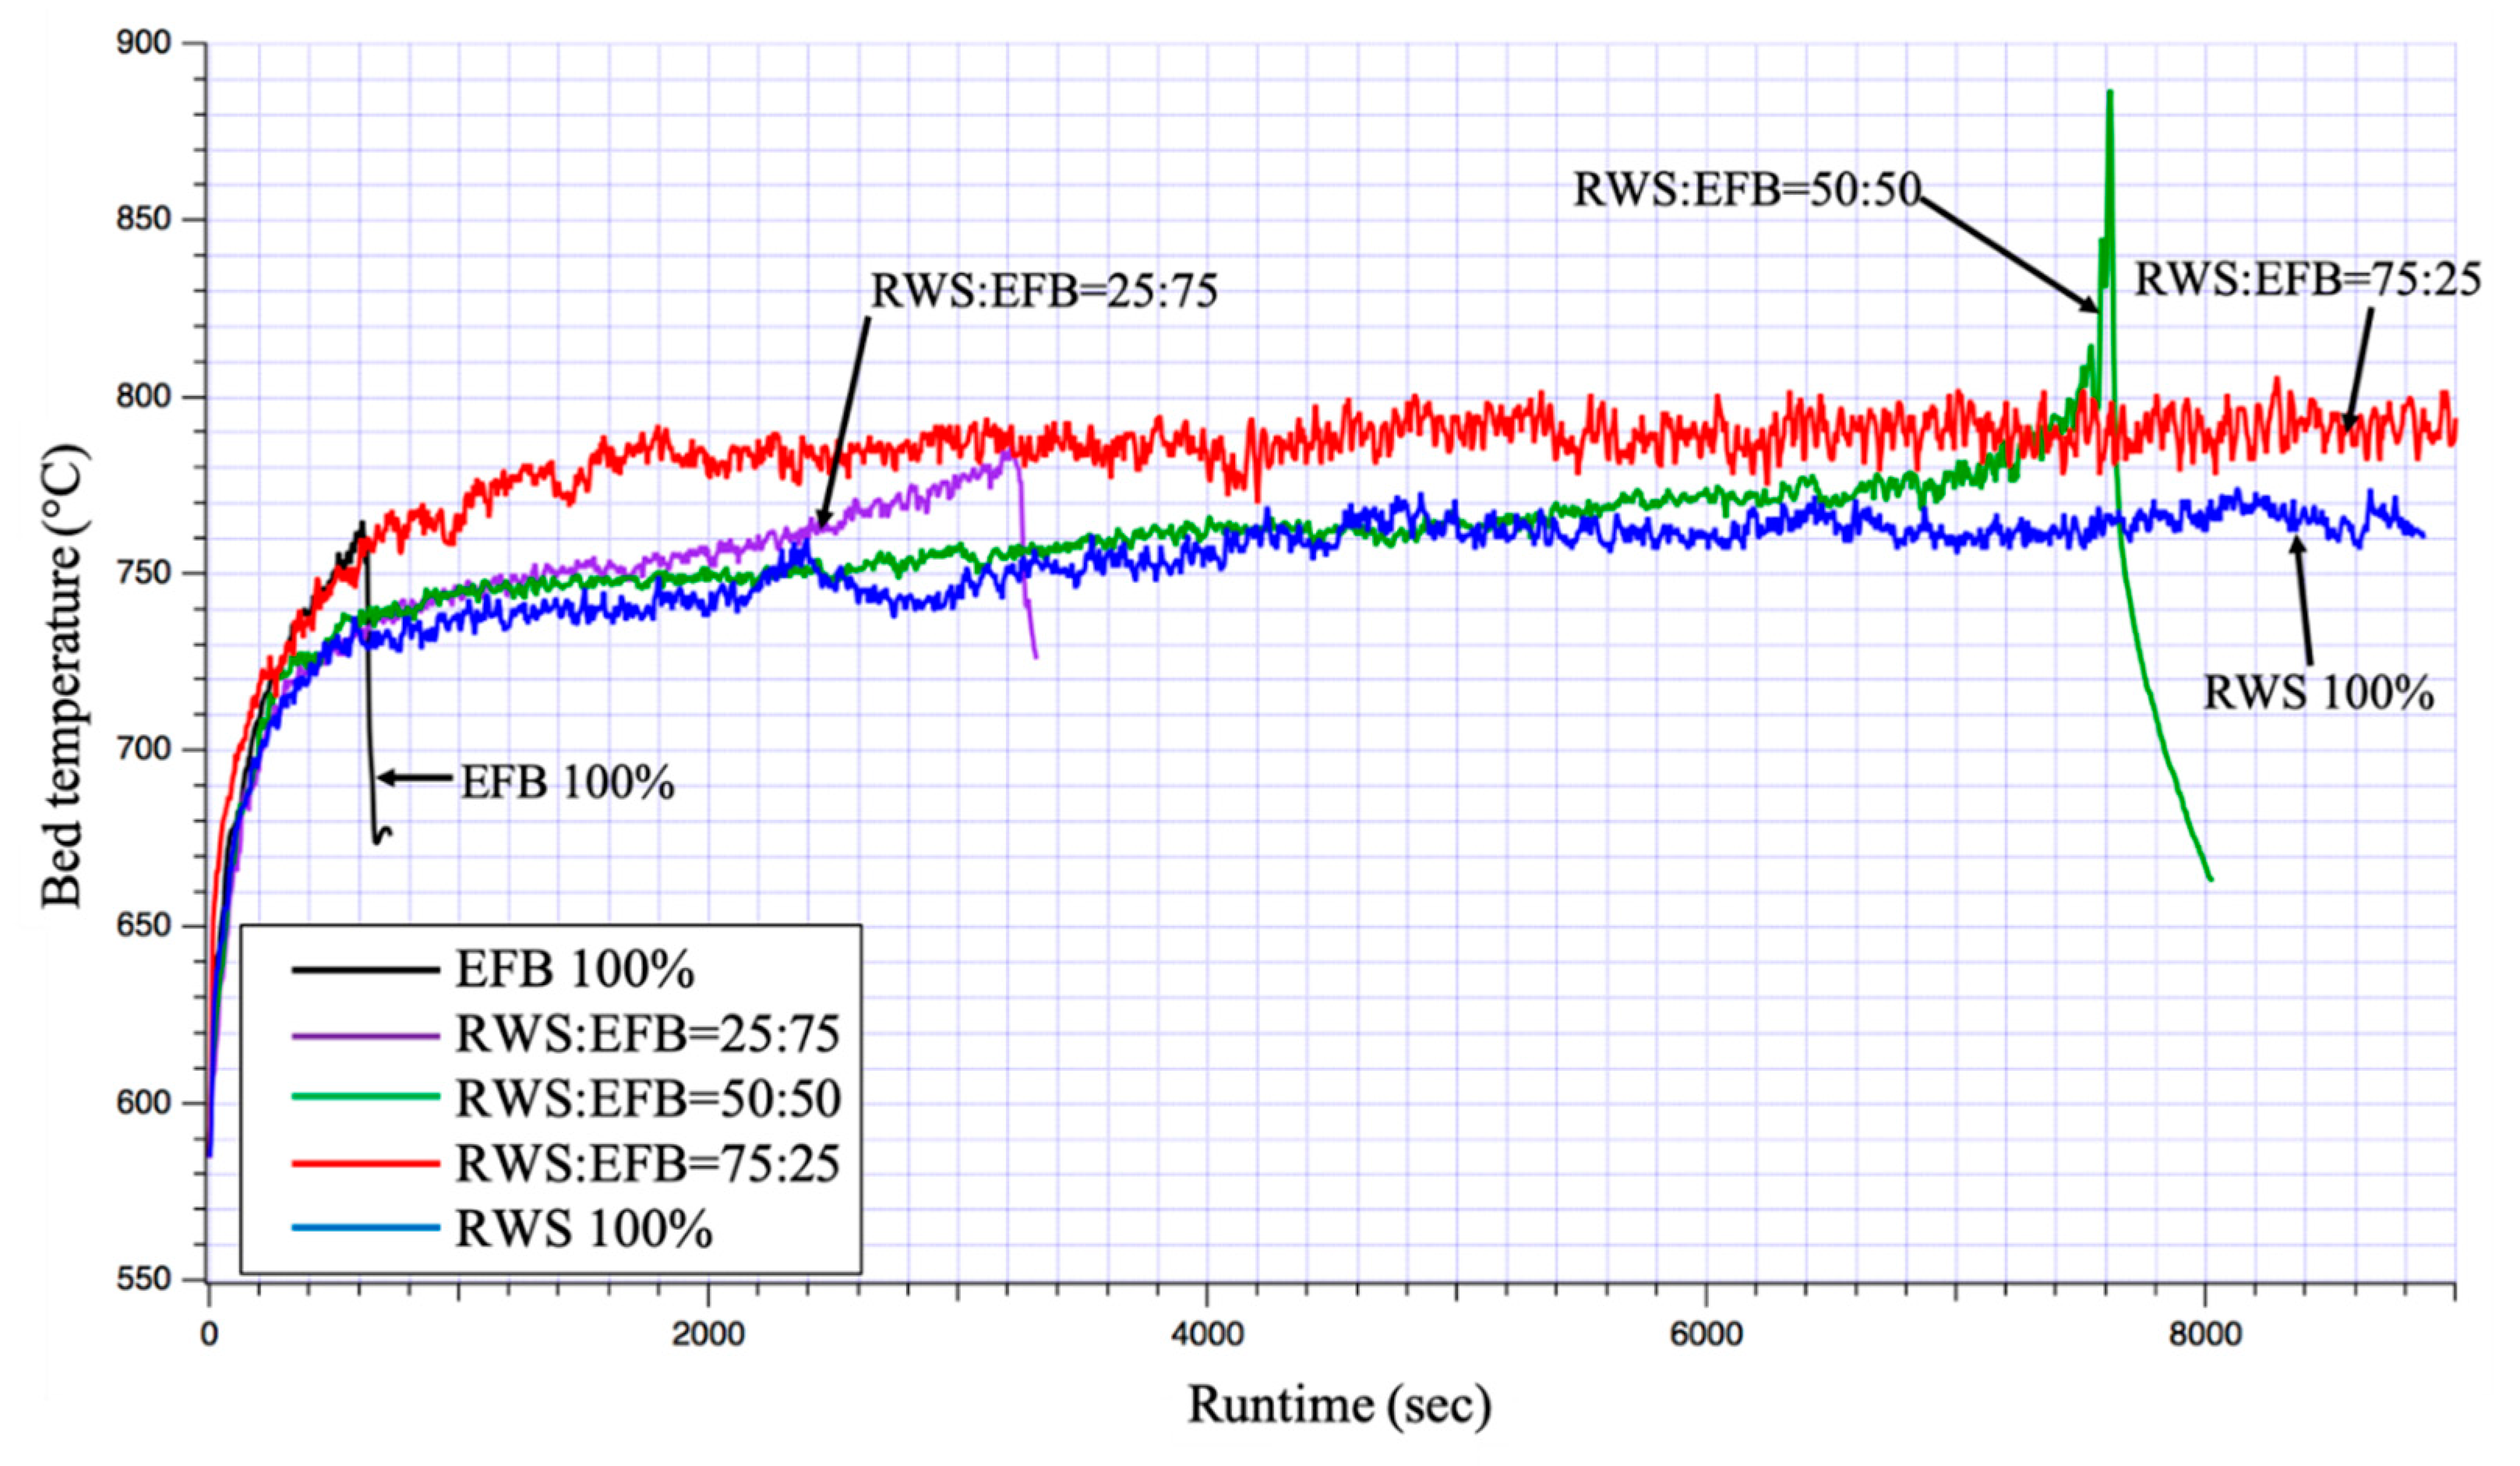
Comparison of bed temperature profiles during gasification is shown in Figure 3. The operable runtime of the experiment using EFB = 100 was the shortest due to the occurrence of agglomeration and de-fluidization.
Experiments using RWS:EFB = 25:75 and RWS:EFB = 50:50 achieved significantly longer runtimes than the experiment using EFB = 100. This was because adding the higher ratio of RWS to the EFB decreased the total ash content in the mixing fuel, as mentioned earlier in Table 1 and consequently lowered the average K, agglomeration inducing element, in the fuel. The oxide composition in the ashes of fuel from XRF analysis is shown in Table 3.
Another reason was that adding RWS increased the net amount of CaO in ashes of blended fuel. CaO likely acted as a catalyst to enhance shift reactions, which generated more CO2 in producer gases. CO2 continuously reacted with K2O; this resulted in the formation of K2CO3, instead of K2O·nSiO2. K2CO3 had a higher melting point (891 °C), which is above the average bed temperature found in this study (referred to Table 2). Other studies on waste incineration also similarly found that CaO is useful for inhibiting bed agglomeration [12,13]. However, de-fluidization and bed agglomeration, were observed during gasification, and resulted in increasing bed temperature in the temperature profiles as shown in Figure 3.
The experiment using RWS:EFB = 75:25 achieved the longest runtime between blended fuels, until the experiment was deliberately stopped by the operator at 9000 s. The average bed temperature of RWS:EFB = 75:25, i.e., 780 °C, was the highest among the co-gasification experiments, and even compared to RWS = 100.
3.2. Producer Gas Yield and Gasification Efficiency
3.2.1. Producer Gas Composition and Higher Heating Value (HHV)
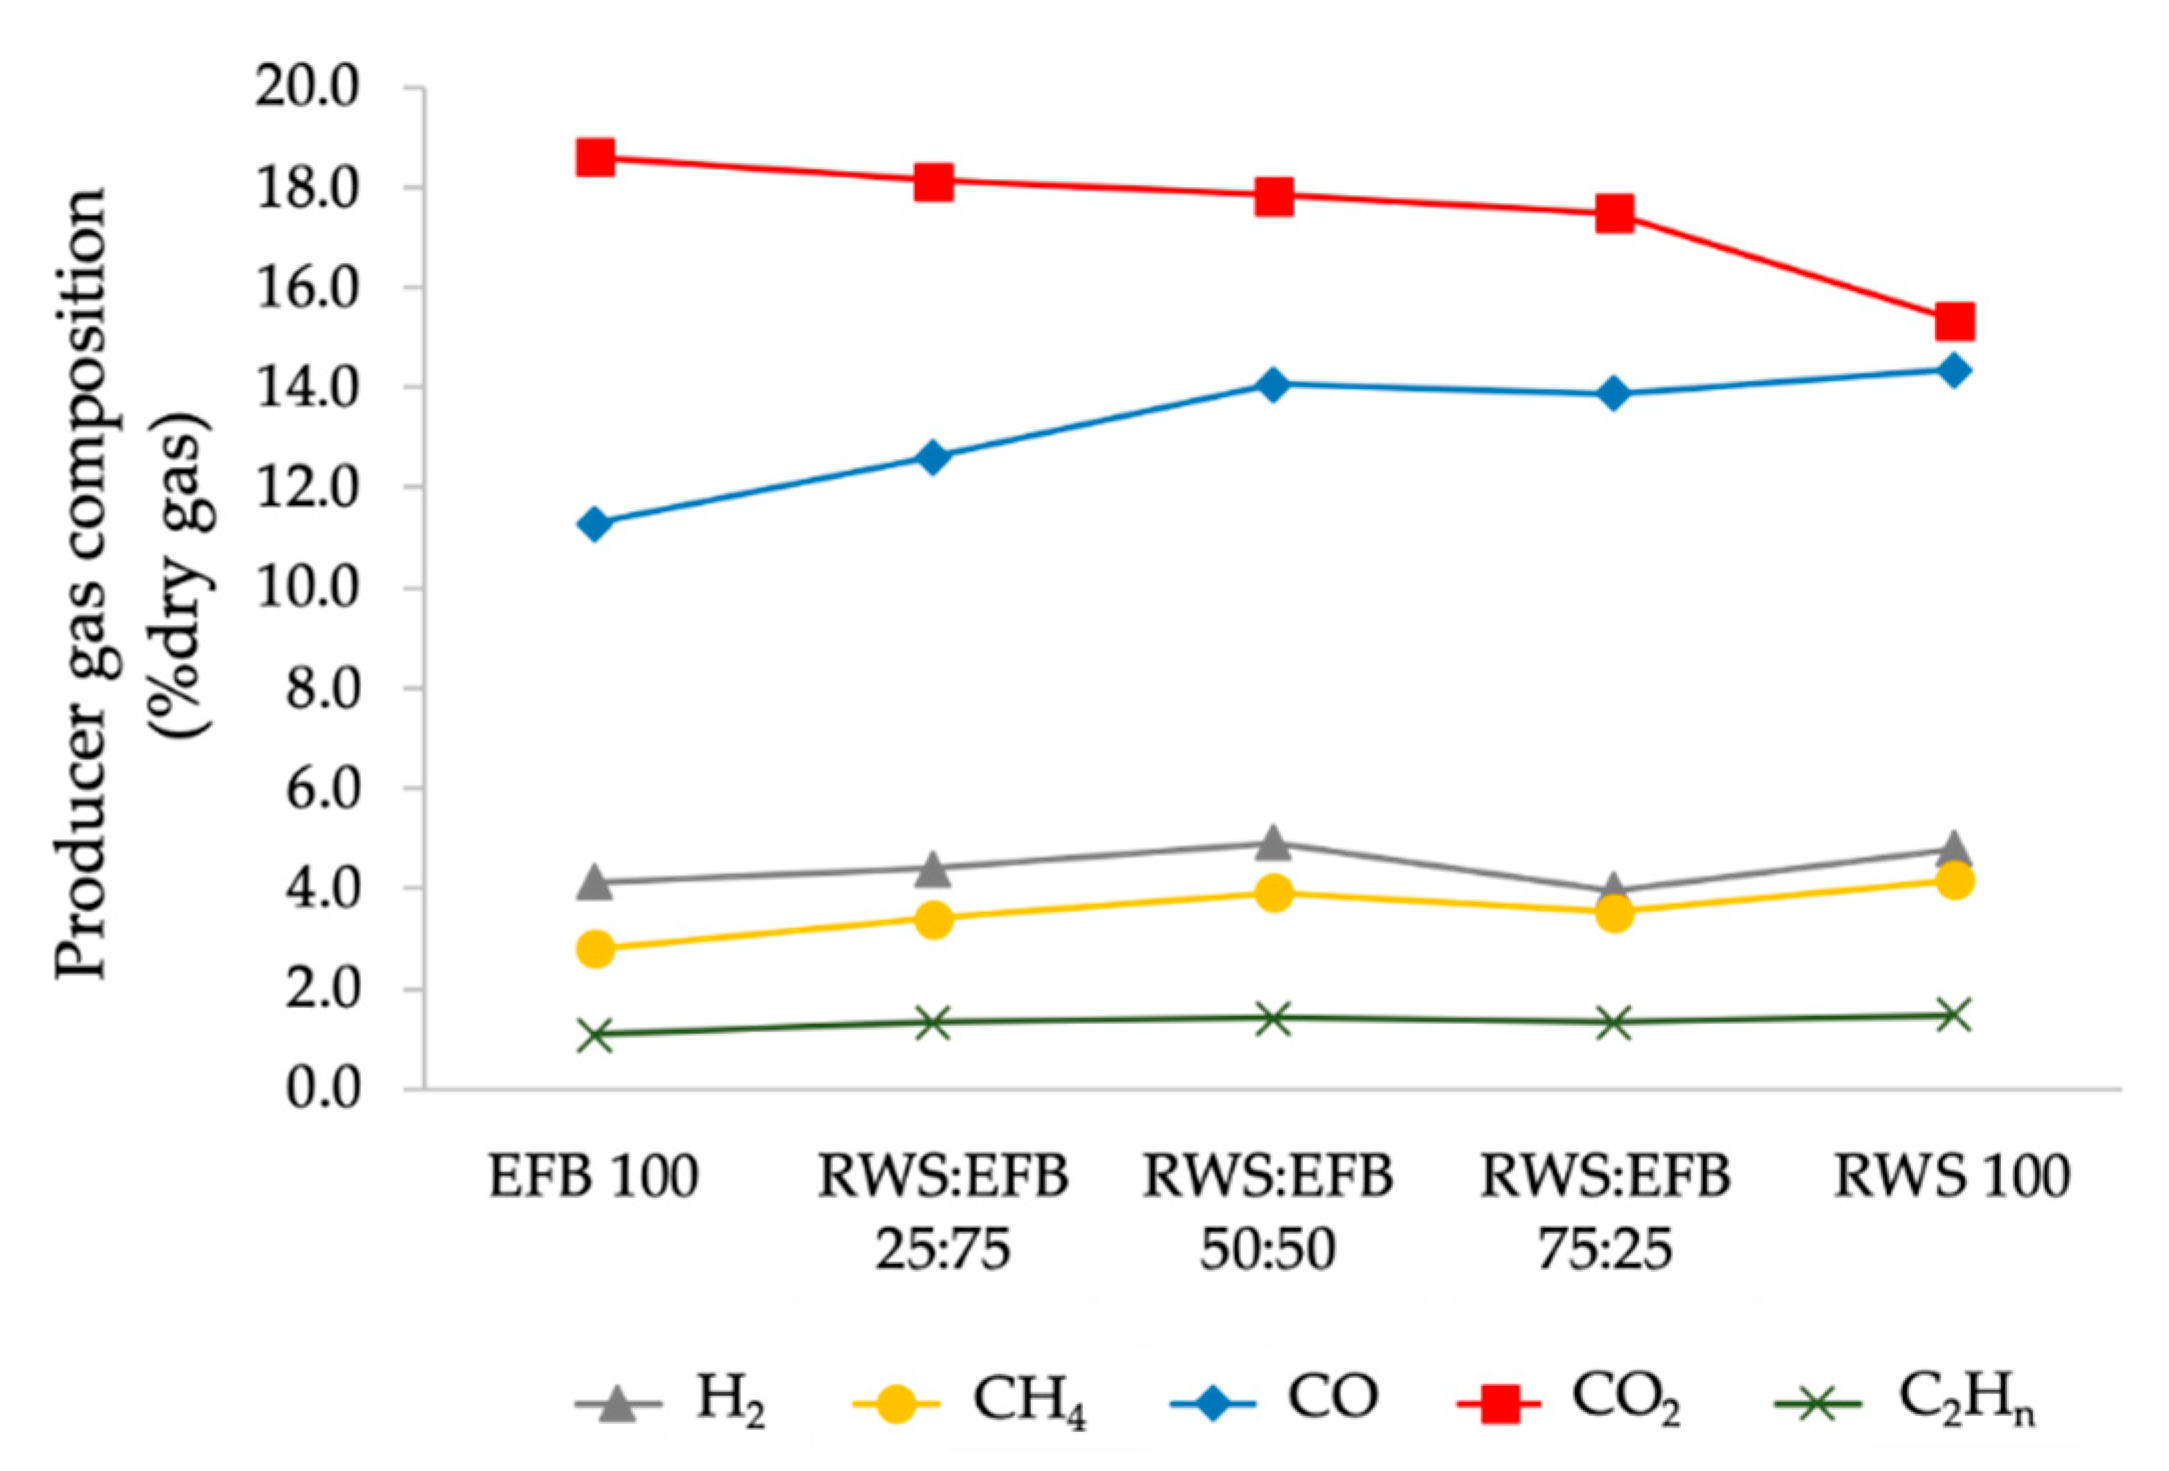
As expected, the yield of CO, CH4, and H2 increased when more RWS was added to the blended fuel. In contrast, CO2 decreased at higher ratios of RWS:EFB. This change of producer gas composition means that mixing RWS with EFB could bring the reaction toward gasification due to the superior physical and chemical properties of RWS (as mentioned earlier in Section 2.1) and the change of feed rate of the blended fuel. The yield of producer gas concentrations is shown in Figure 4.
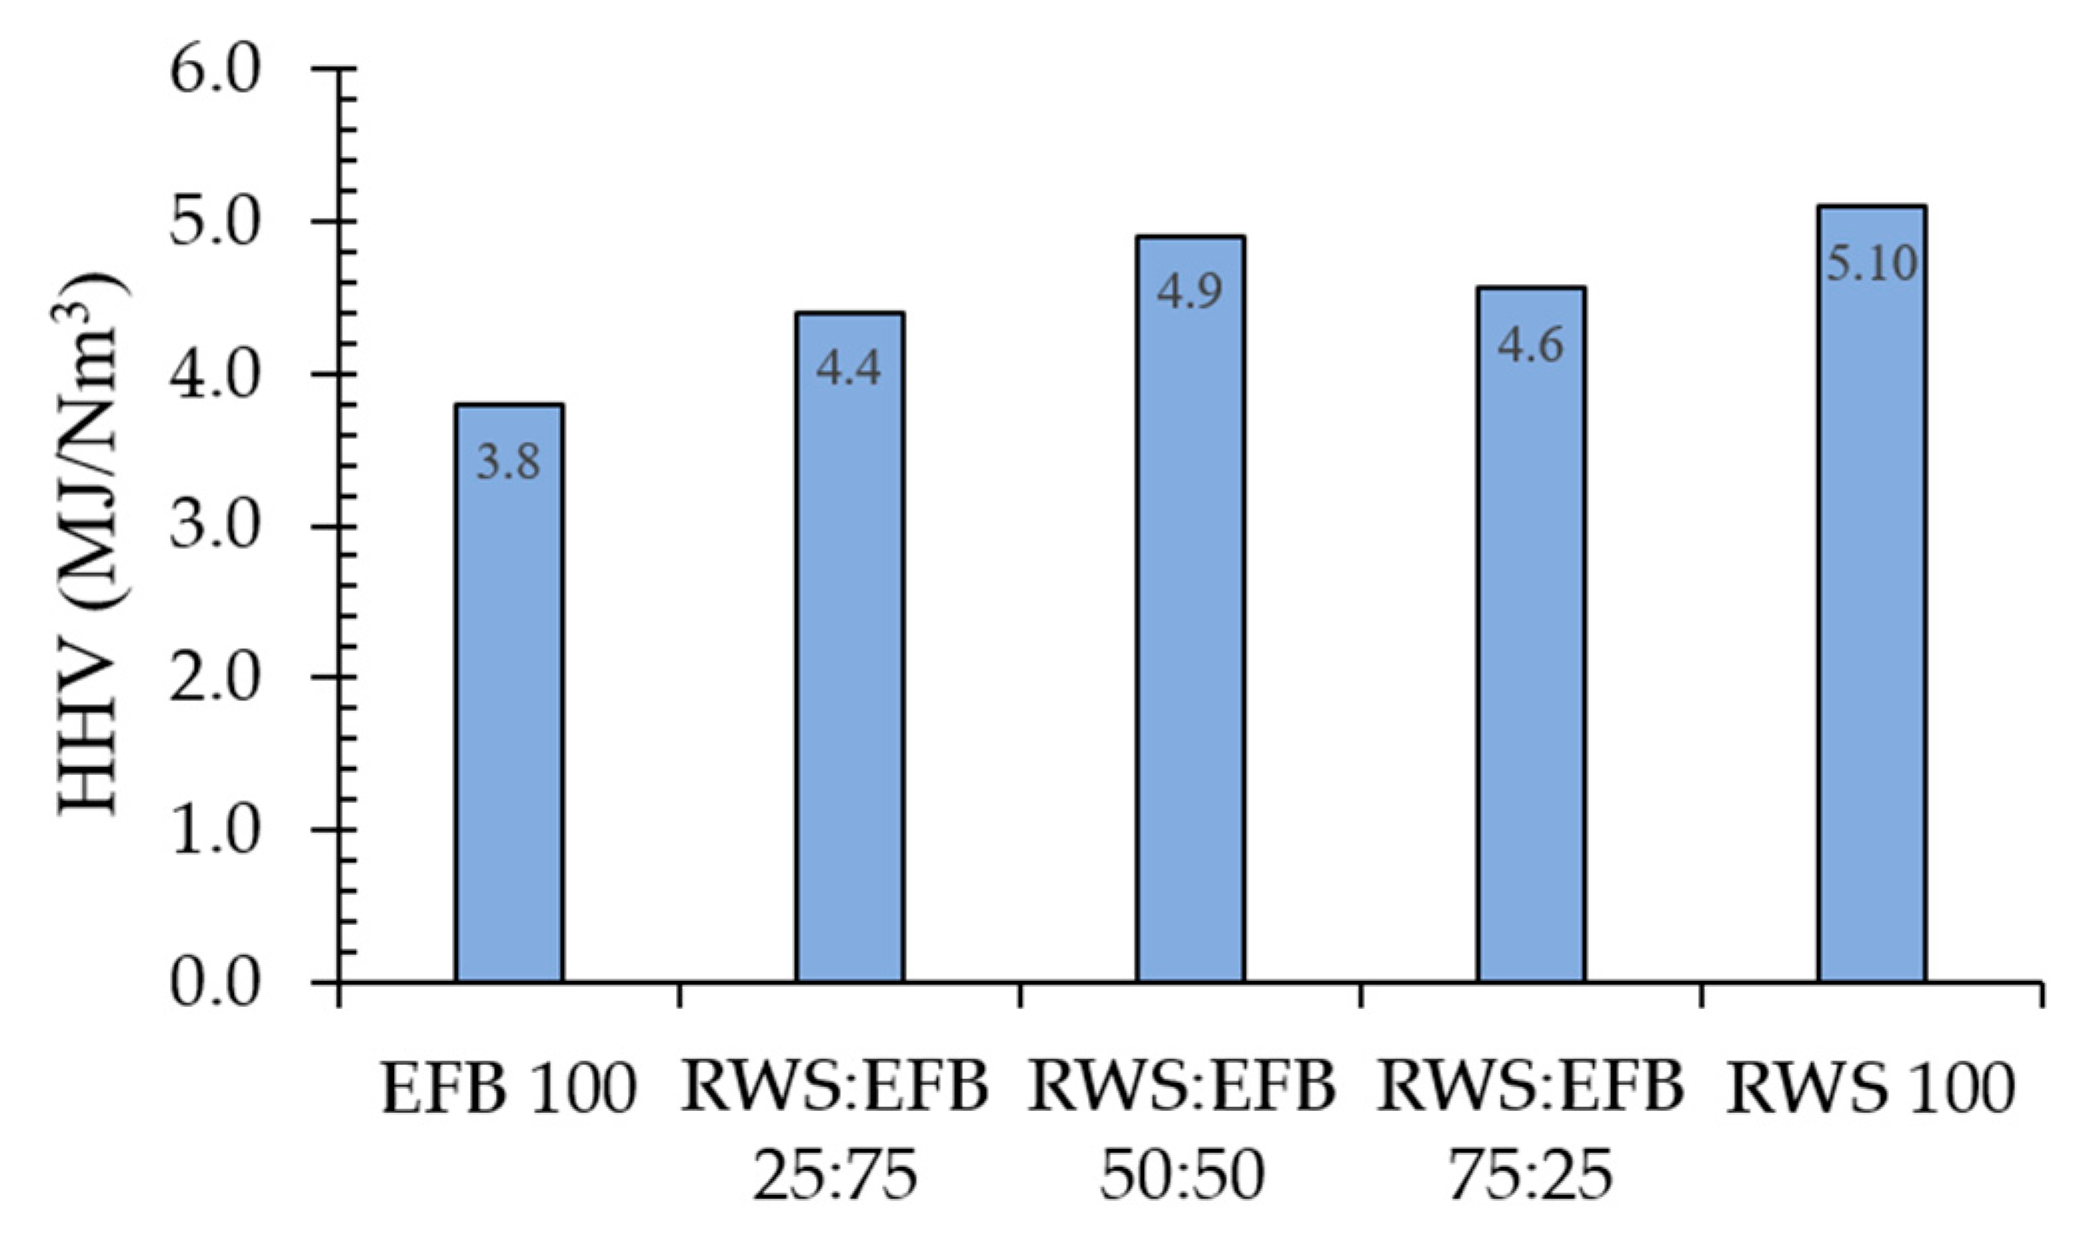
The comparison of producer gas HHV is shown in Figure 5. According to the results, the lowest HHV at 3.8 MJ/Nm3 was obtained when using EFB = 100. The highest HHV at 5.1 MJ/Nm3 was obtained when using RWS = 100. Higher concentrations of CO, H2 and CH4 found in producer gas at higher ratios of RWS to EFB resulted in a slight increase in HHV. The HHV of RWS:EFB = 25:75, RWS:EFB = 50:50 and RWS:EFB = 75:25 fell between those of EFB and RWS i.e., in the range of 4.4–4.9 MJ/Nm3.
3.2.2. Carbon Conversion Efficiency (ηc) and Cold Gasification Efficiency (ηg)
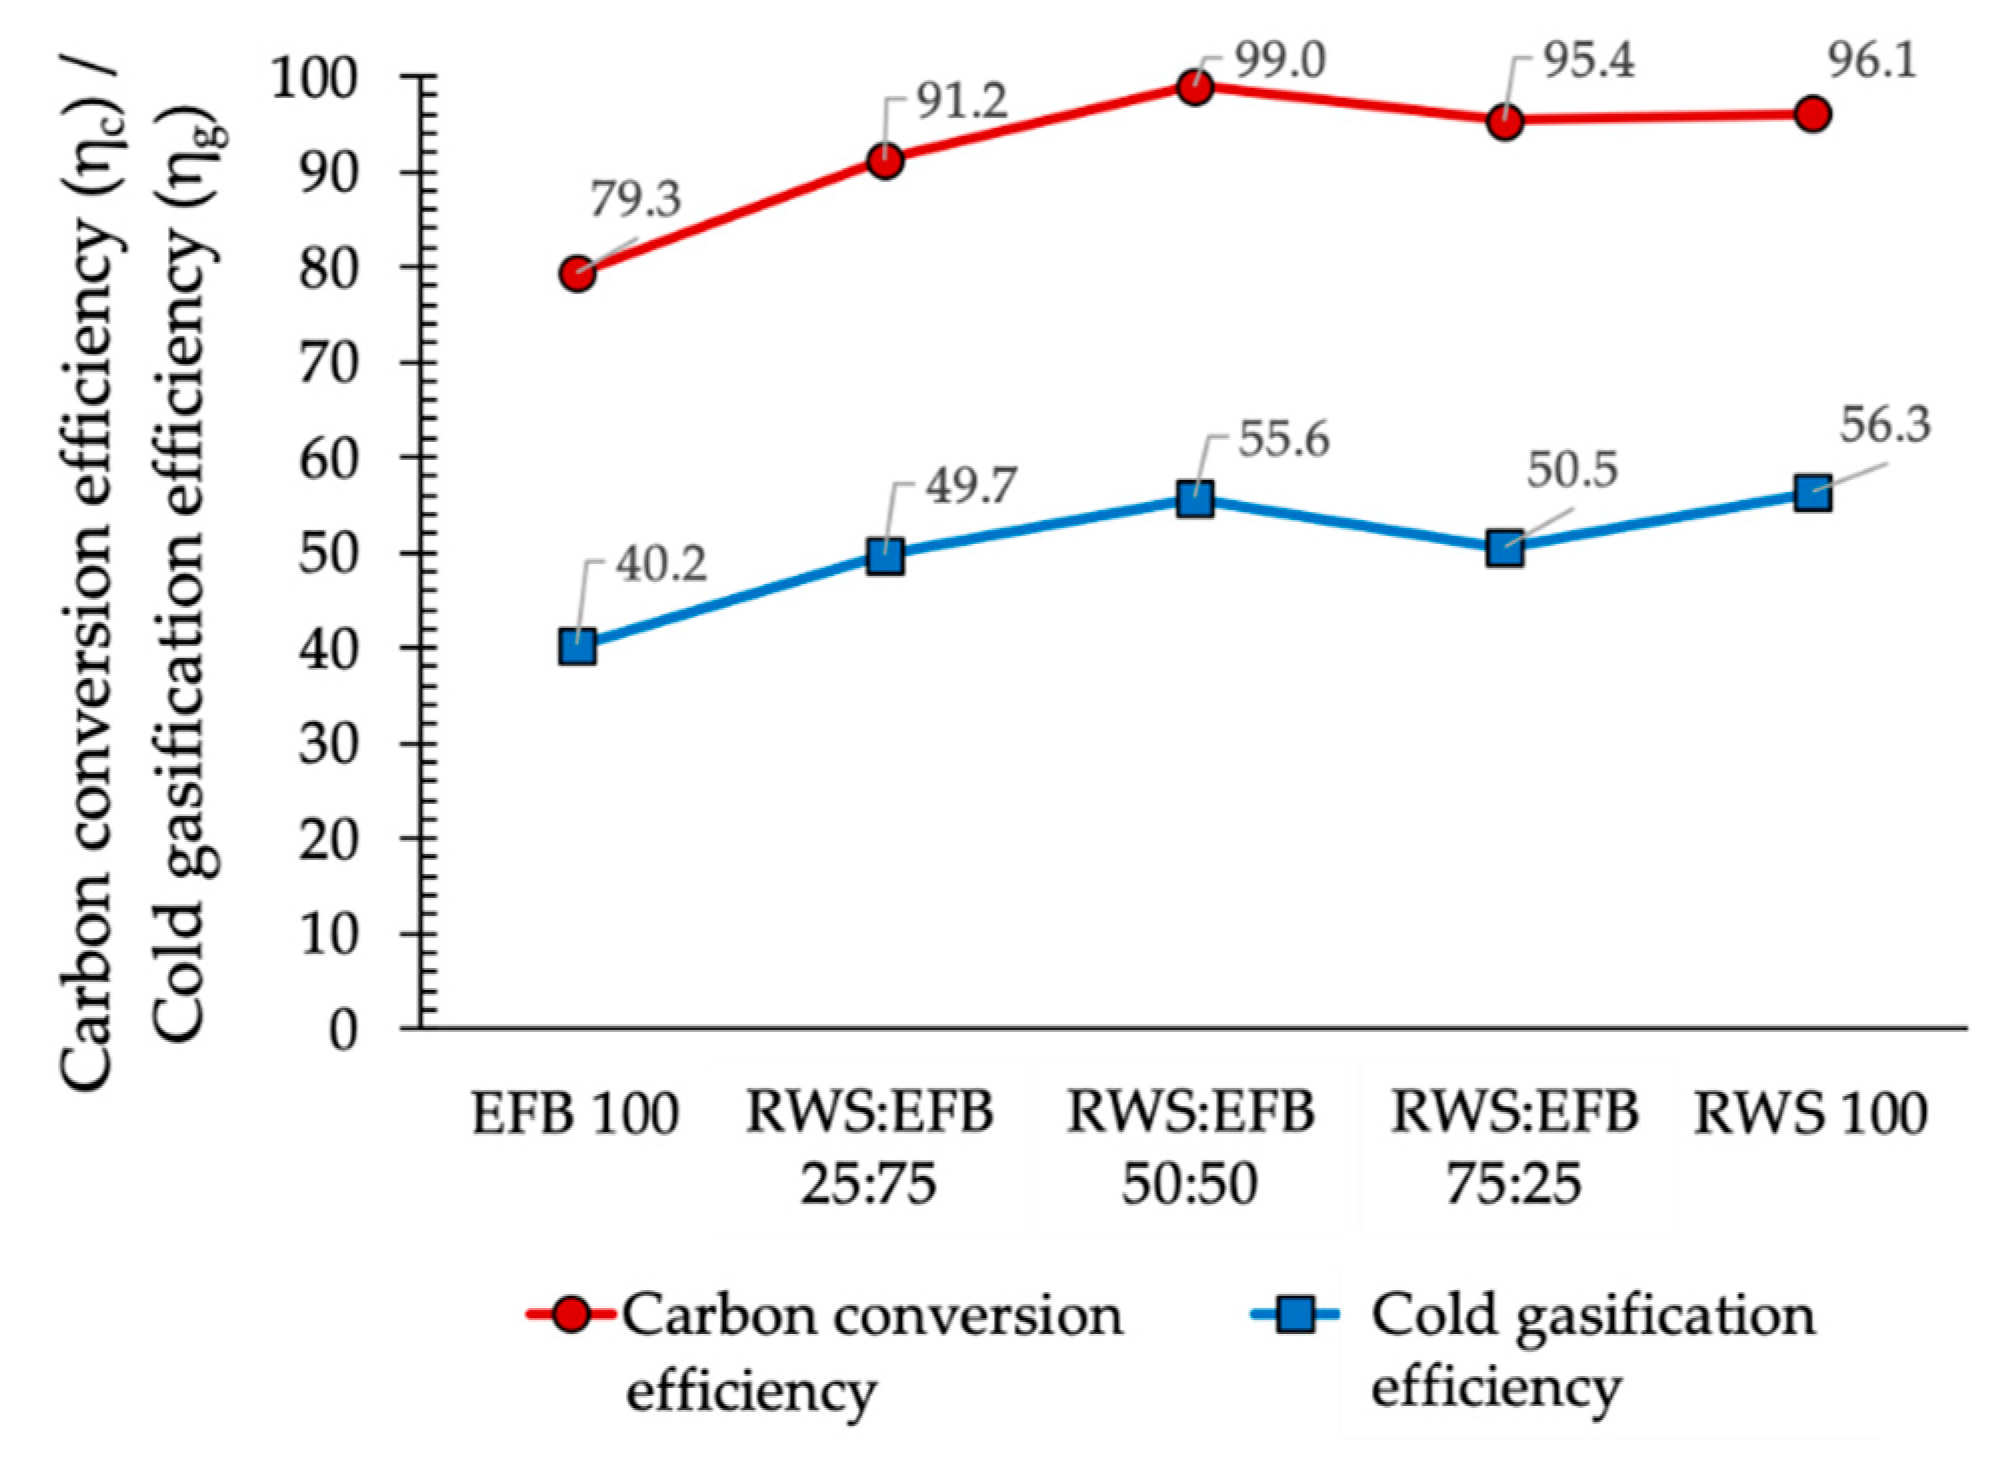
Carbon conversion efficiency (ηc) and cold gasification efficiency (ηg) are shown in Figure 6. Overall, at higher blending ratios of RWS to EFB, the ηc and ηg increased due to higher degrees of reaction because of the higher bed temperature. However, the unusual high ηc and ηg occurred at RWS:EFB = 50:50 (ratio 1:1) at 99% and 55.6%, respectively, which they might be the systematic error of the experiment. Thus, ηc and ηg of blending ratio of RWS:EFB = 50:50, RWS:EFB = 75:25, and RWS = 100 could be considered in the same range—95–99% and 50–56%, respectively.
3.3. Bed Agglomeration and Agglomeration Mechanisms
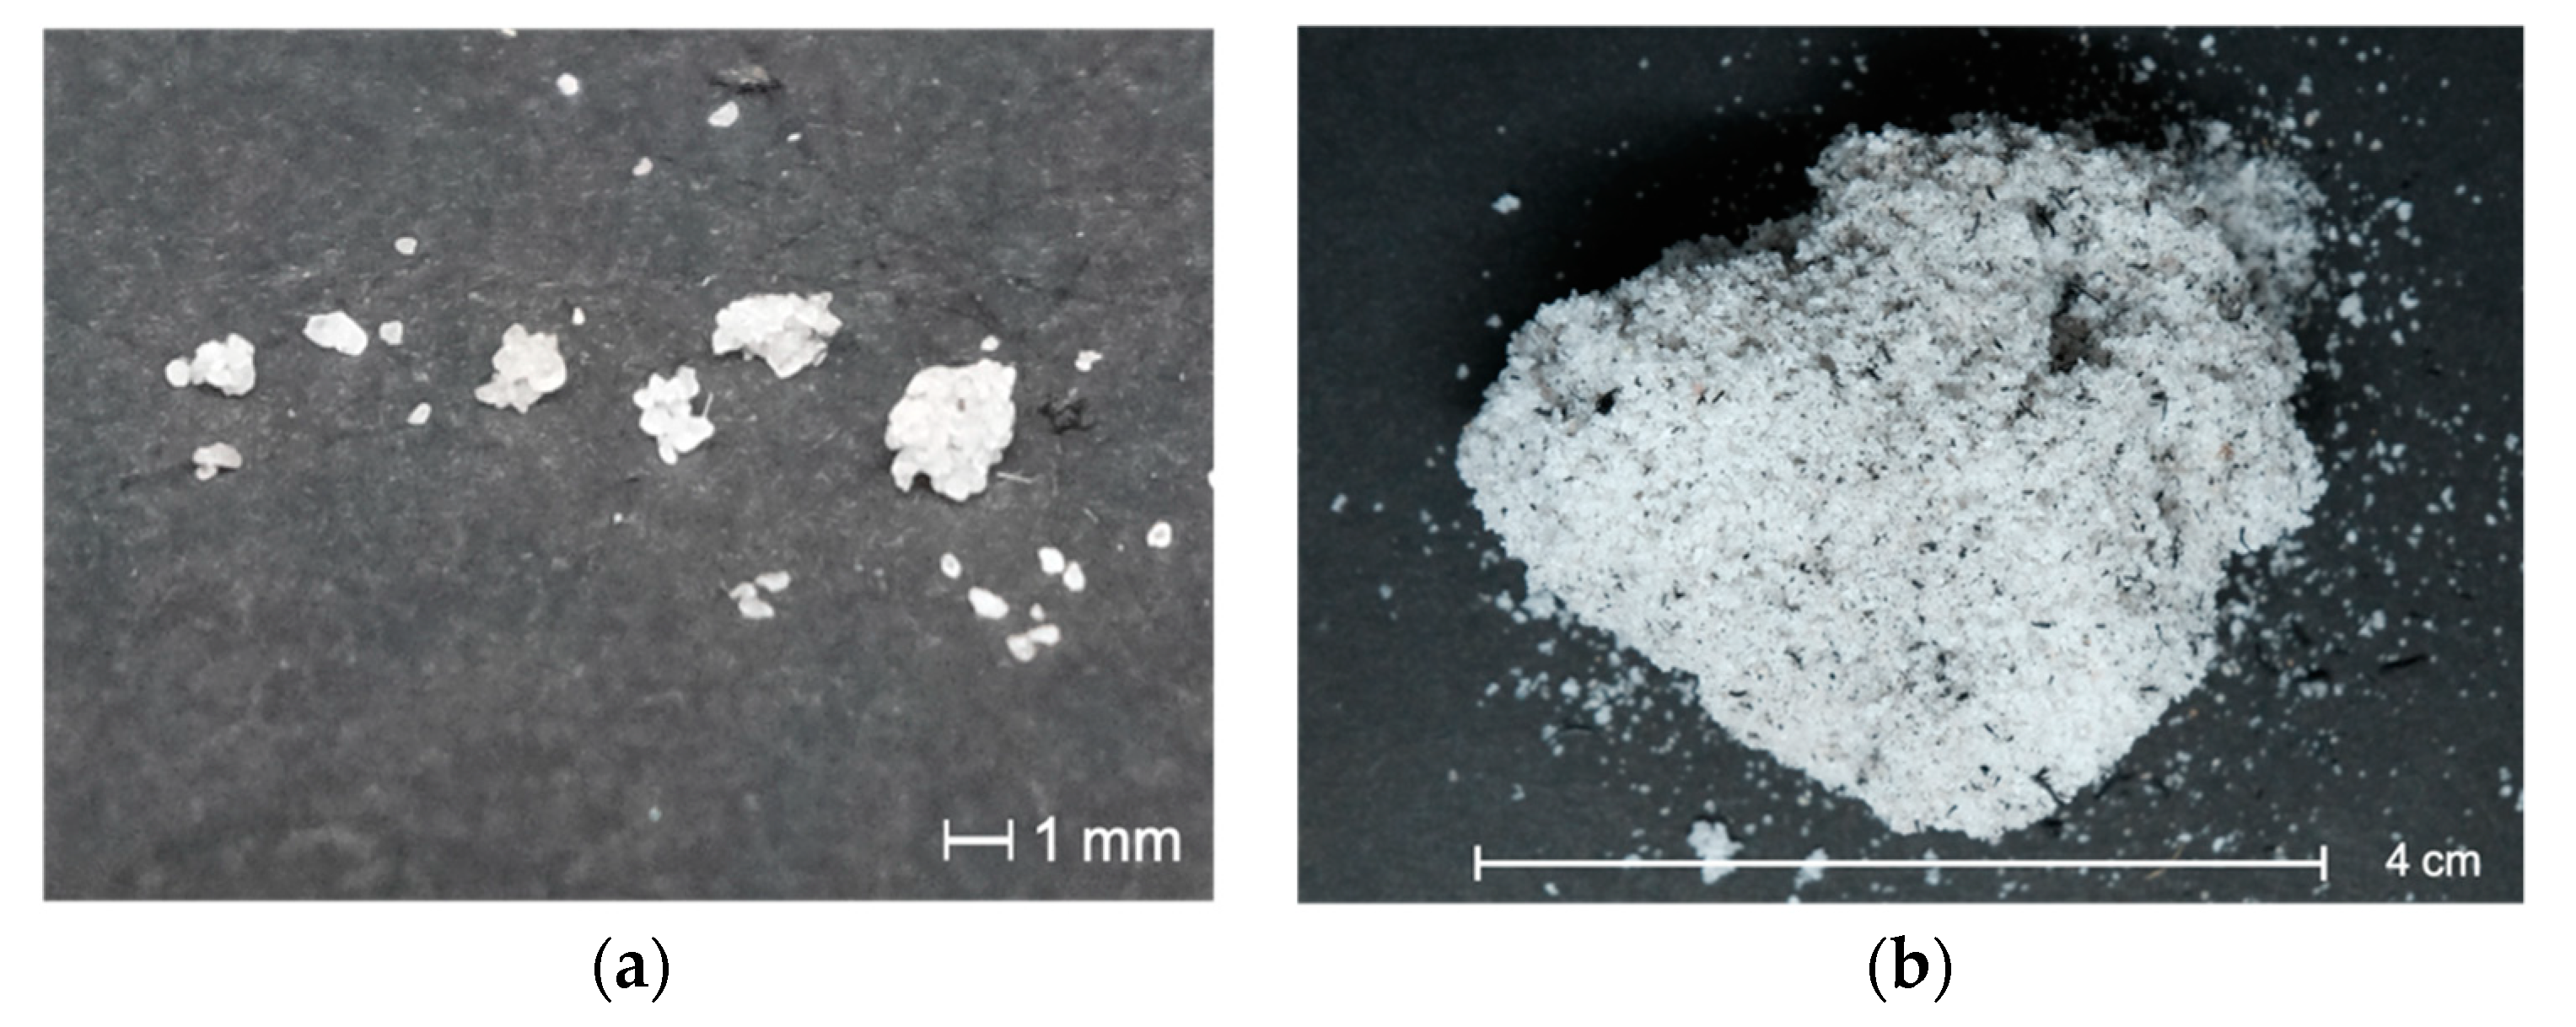
In this study, bed agglomeration was found in experiments using EFB = 100, RWS:EFB = 25:50 and RWS:EFB = 50:50. These bed agglomeration particles were easily seen by visual observation of the significant changes in the physical properties. The color of agglomerated particles changed to a white-gray and formed a small group of bed particles (i.e., ranging in size from 500 to 2000 µm), which adhered to each other by a sticky compound, as shown in Figure 7a. Also, these small groups of agglomerated bed particles later formed large, porous particles, approximately 20–40 mm in diameter, as shown in Figure 7b. These bed agglomeration particles were also analyzed by the SEM technique, as shown in Figure 8.
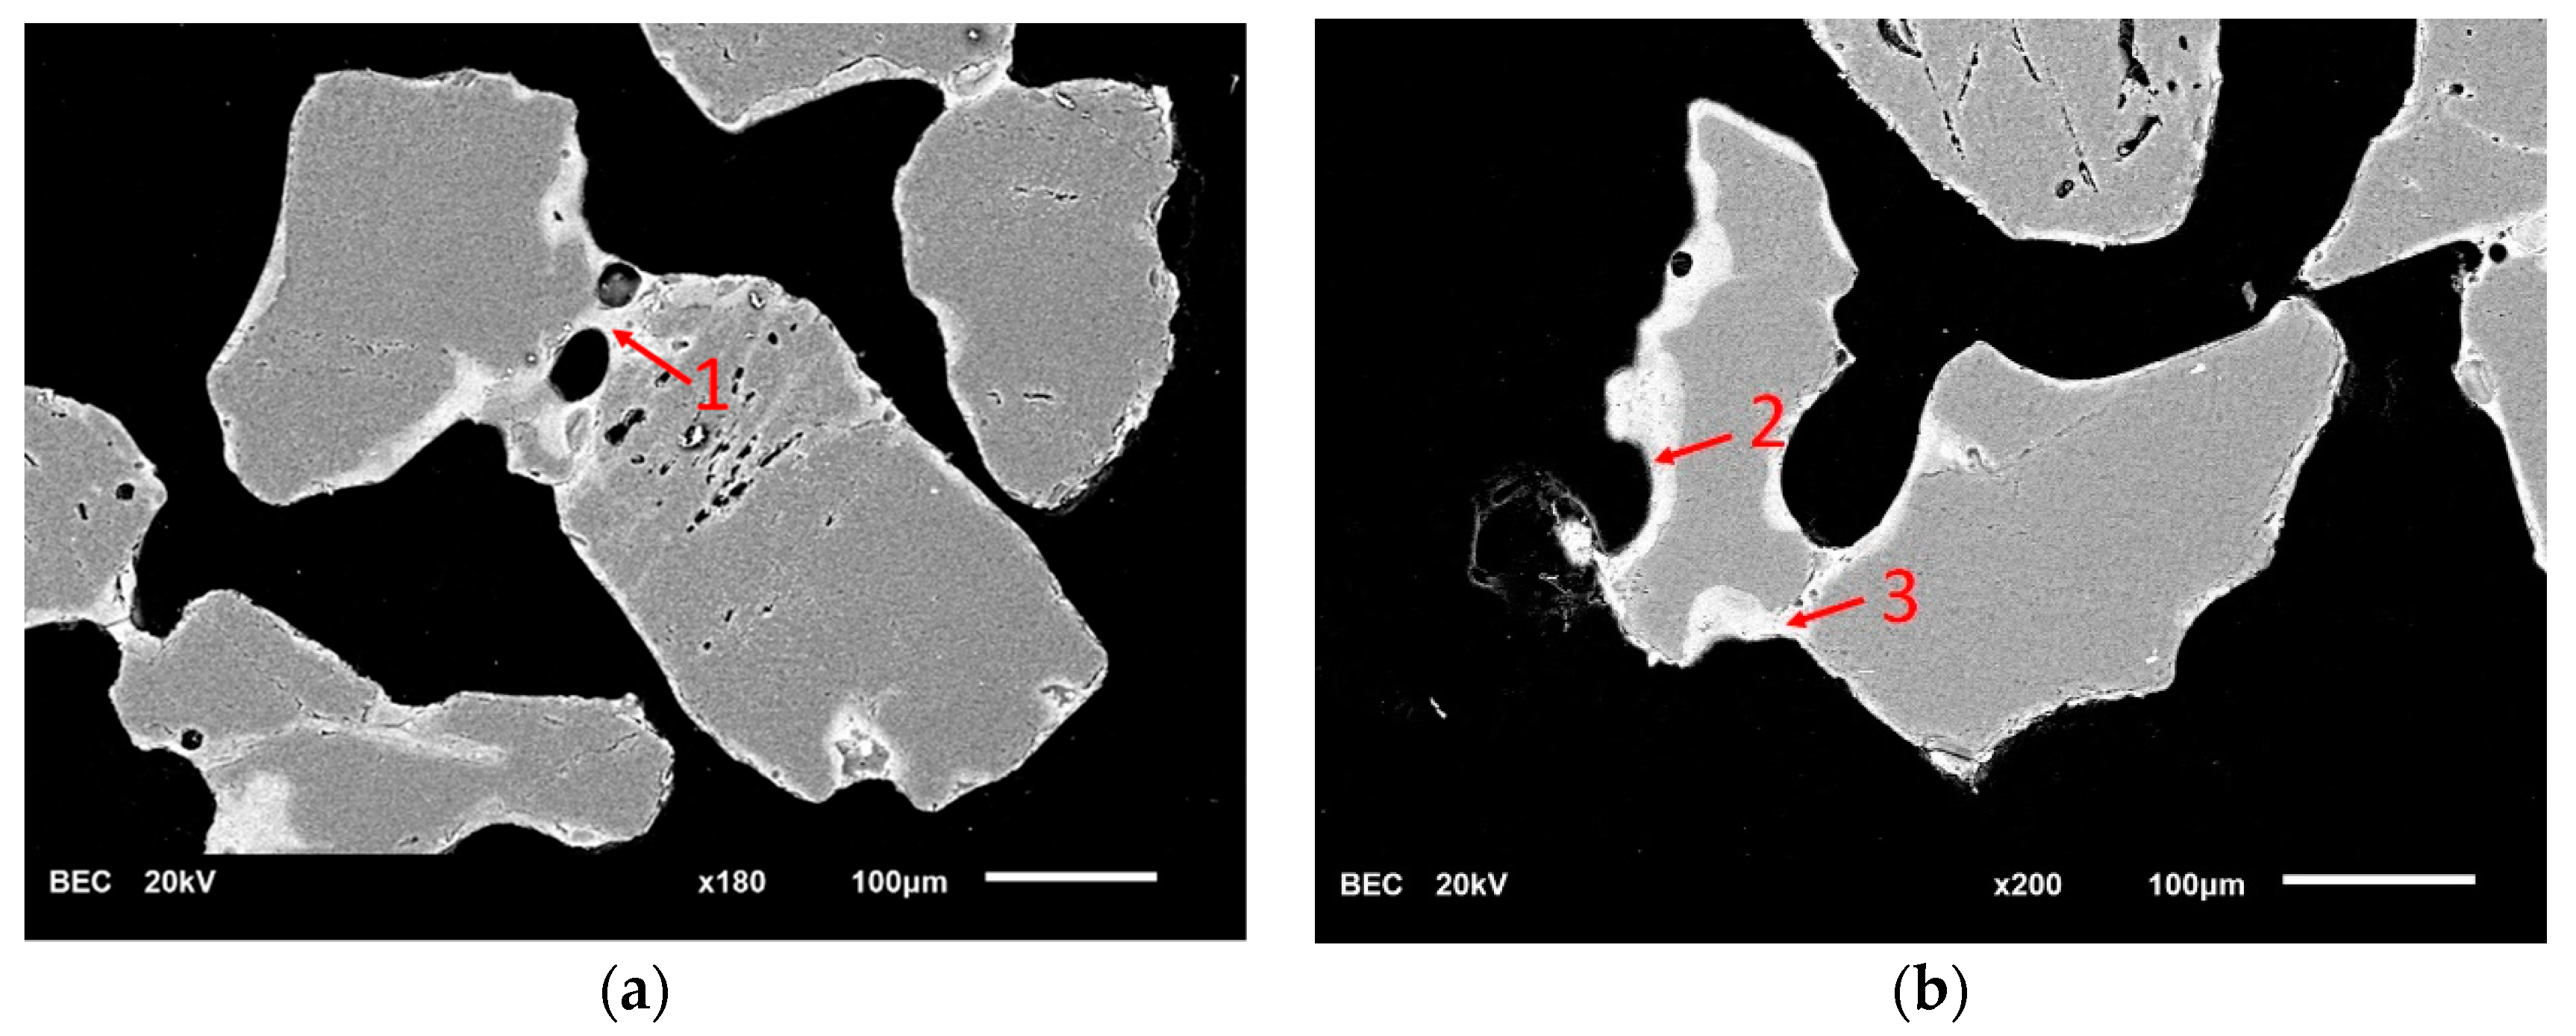
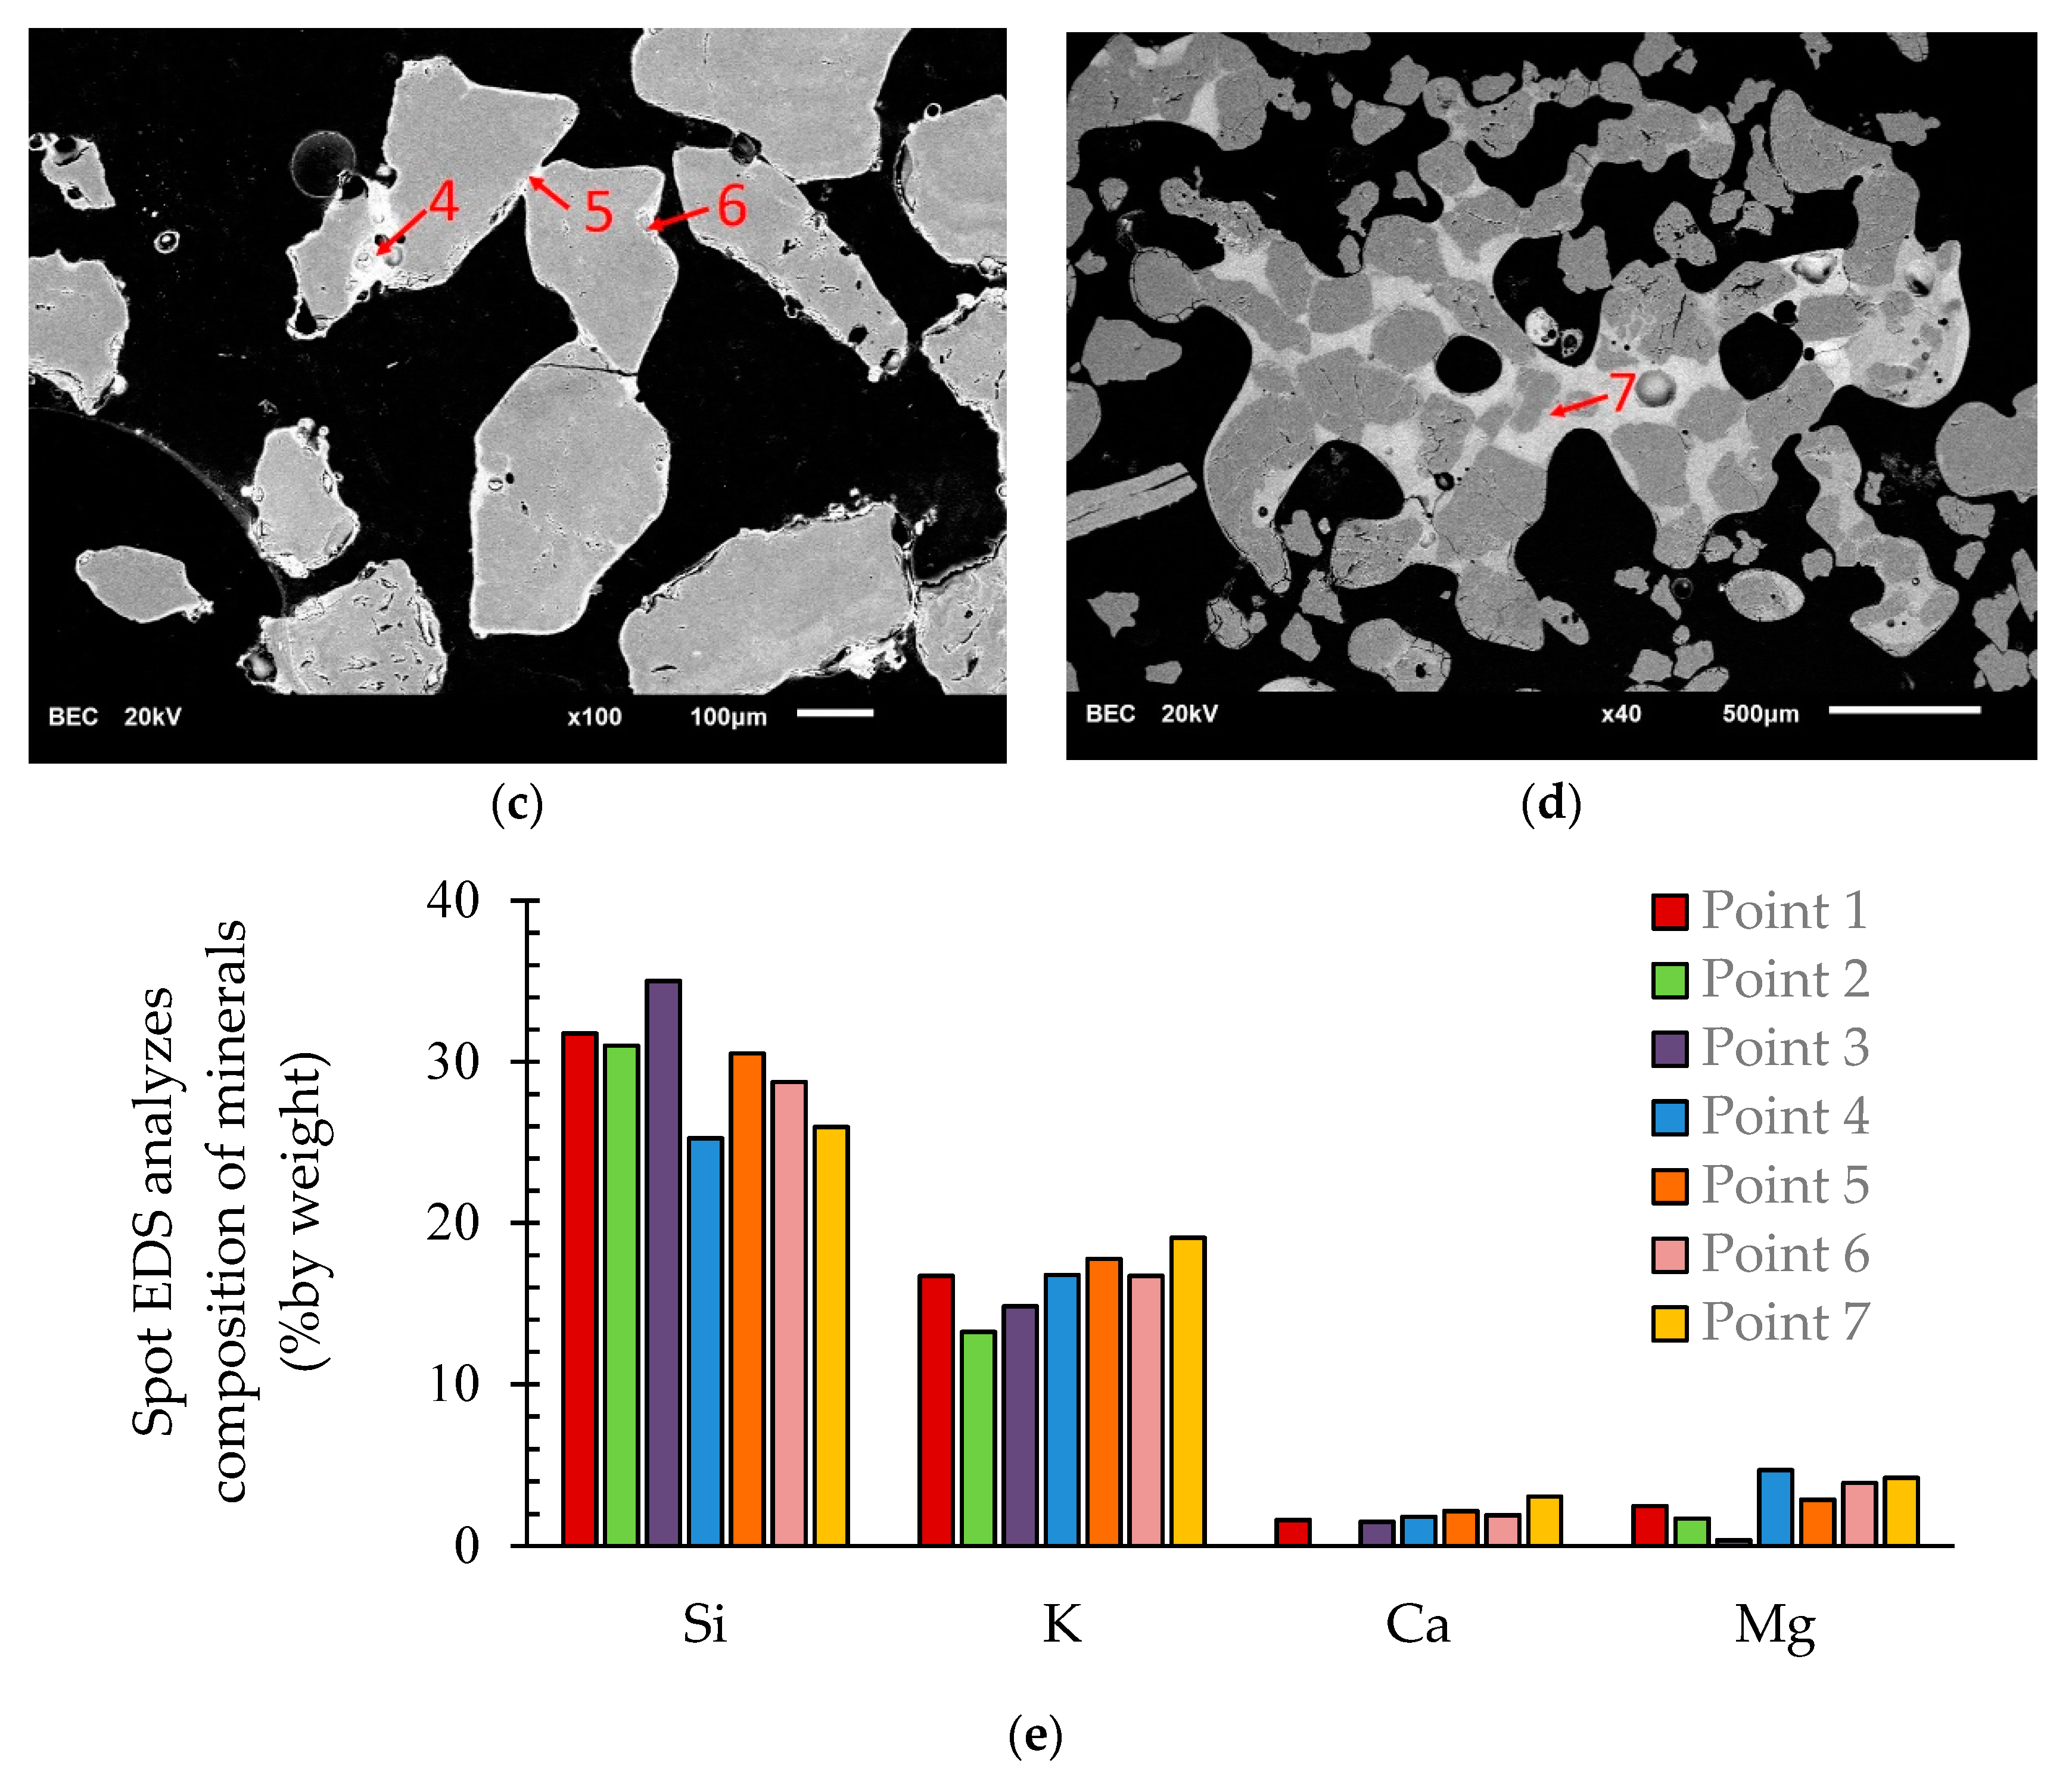
The SEM micrographs illustrate cross-sections of agglomerate samples from experiments using EFB = 100 (Figure 8a), RWS:EFB = 25:50 (Figure 8b) and RWS:EFB = 50:50 (Figure 8c). The contrast of the SEM micrographs revealed different elements in the samples. According to the agglomerated samples found in this study, two main areas of the potassium-silicate compound embedded in the agglomerated bed particles were identified. The first area was at the boundary of each particle, indicated by the luminous contour around the bed particle (see Points 2, 3, 6, and 7). The second area was at the connection point between the bed particles, called the ‘neck’, as shown in Points 1, 4, and 5.
EDS was used to analyze the elemental composition at the circumference and the neck of agglomerated particles, as indicated in Points 1 to 7 of Figure 8a–d. The results revealed that the bright area (e.g., white-gray color) contained the sticky compound K2O·nSiO2, while the dark gray area contained only SiO2. As shown in Figure 8e, the average content of major elements, by weight, at Points 1 to 7 were: potassium (K), 14–19%; silicon (Si), 30–35%; calcium (Ca), 0–3%; and magnesium (Mg), 3–5%.
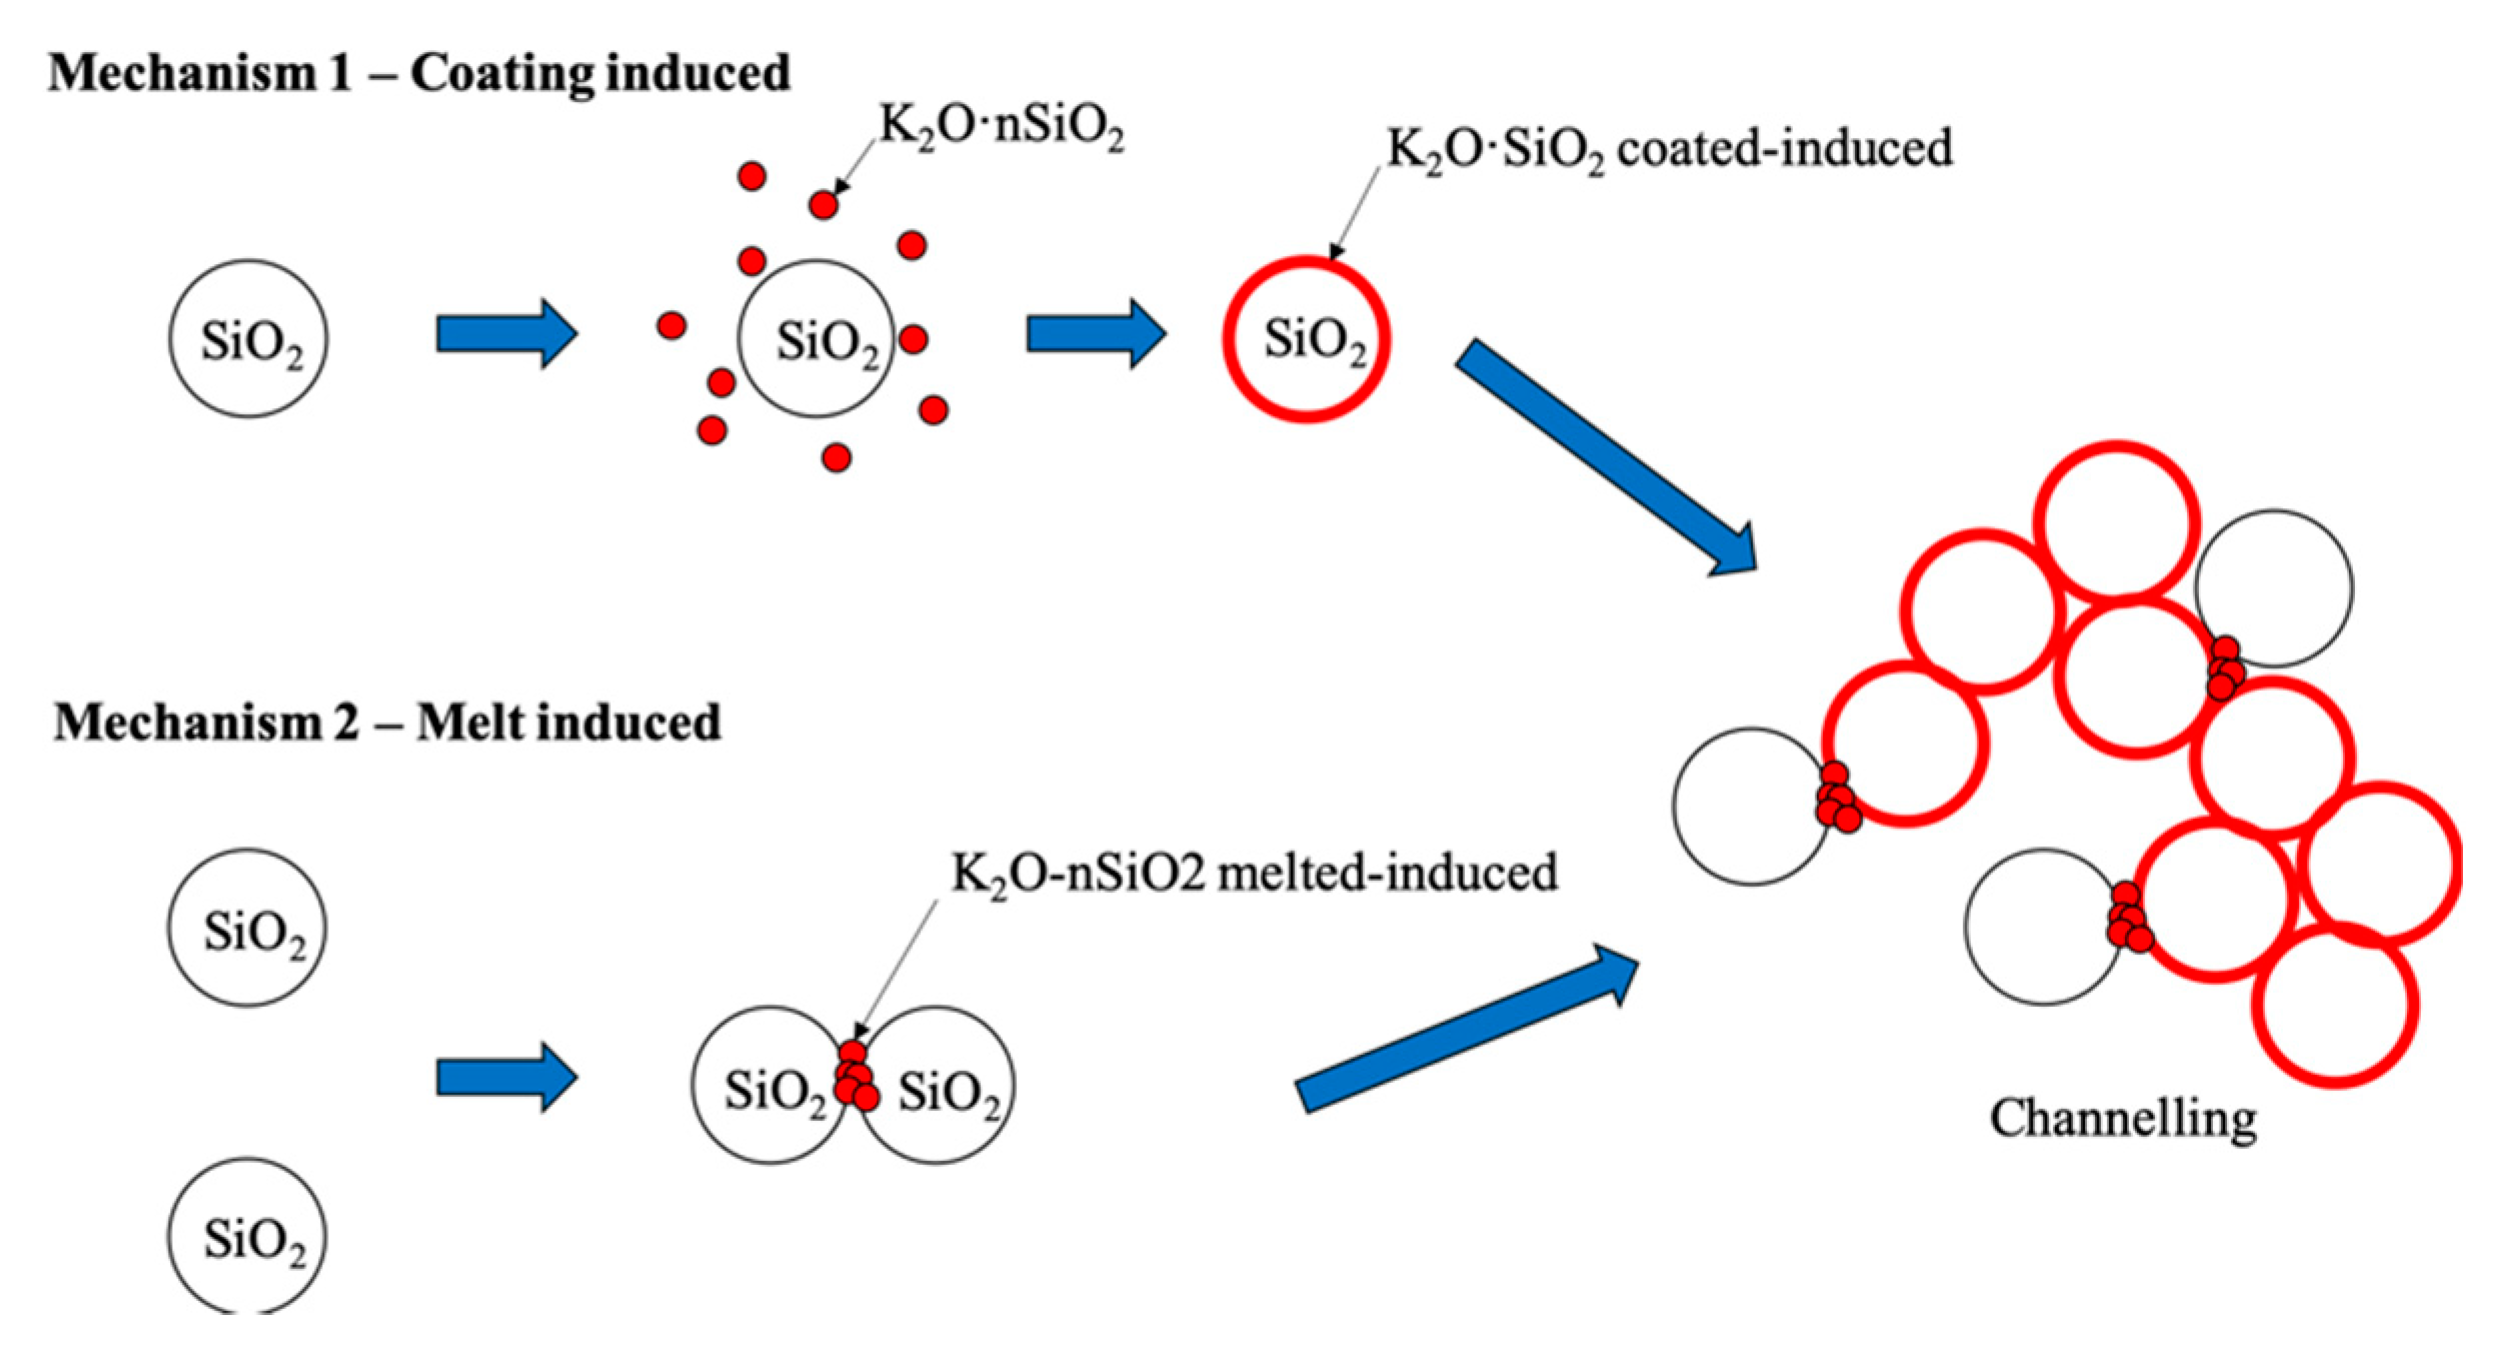
The bed agglomeration mechanisms found in this study were matched with the agglomeration mechanism proposed by Visser et al. [6]. The first mechanism was the agglomerated bed caused by the coated potassium-silicate compound (K2O·nSiO2) or called “coated induced” as indicated by Points 2, 3, 5, 6, and 7 in Figure 8. The second mechanism was the agglomerated bed glued by a spot of melted potassium-silicate compound or called “melted induced” as indicated point 1 and 4 in Figure 8. The summary of agglomeration mechanisms related to this experiment is illustrated as Figure 9.
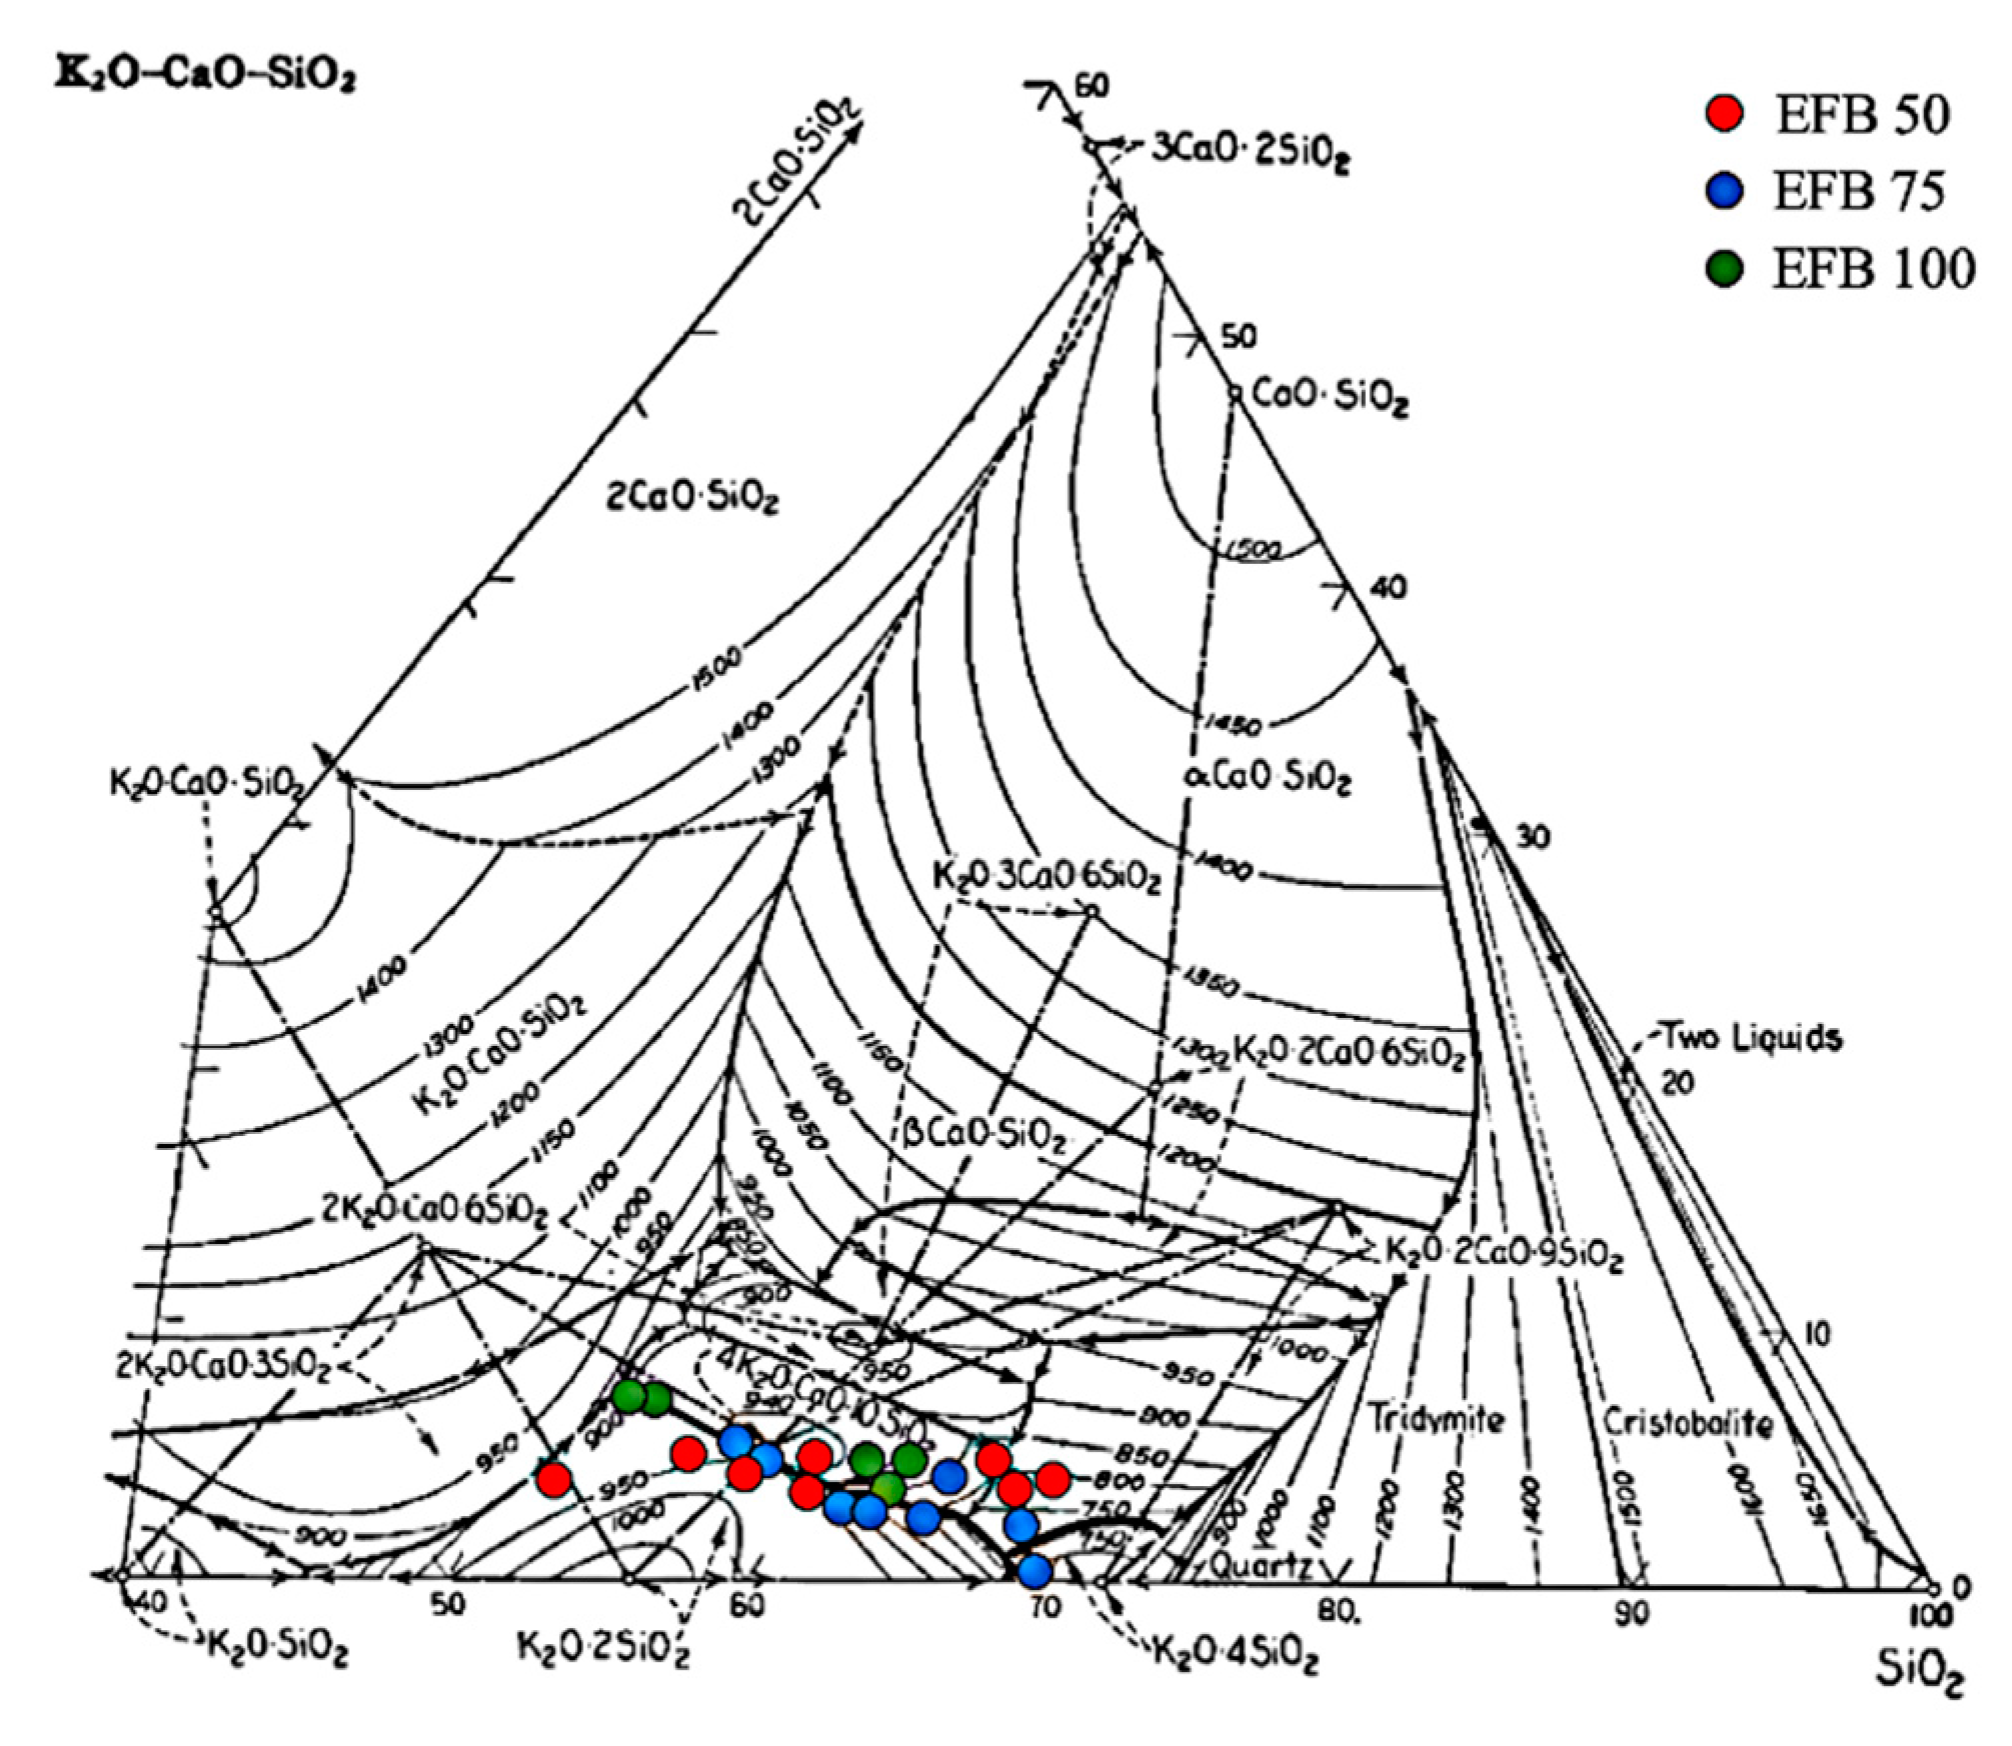
The elemental compositions from the EDS spot analyses were also plotted, as circles, in the CaO-K2O·SiO2 ternary phase diagram (Figure 10) to predict the possible potassium-calcium-silicate compound formation and their melting points. The lowest melting temperature compound was found to be K2O·4SiO2 at 750 °C, which was also found in other studies concerning fluidized bed combustion [27,28,29].
Comparisons were made with the EDS spot results of EFB combustion in a fluidized bed [27], in which K2O·4SiO2 was the key compound causing bed agglomeration. However, in this study, the compound contained a high ratio of K, e.g., K2O·2SiO2 (melting at 900 °C) and 4K2O·CaO·10SiO2 (melting at 940 °C) were also formed, as indicated in Figure 10.
3.4. Ash Melting Behavior Using Thermochemical Simulation (FactSage)
FactSage is thermochemical simulation software developed by the Massachusetts Institute of Technology (MIT) [34]. FactSage contains many modules for various thermochemical calculations (e.g., phase diagrams and chemical reactions) based on equilibrium. In this study, FactSage was used to simulate and predict the formation of (ash) mineral compounds and their fusion temperatures in order to explain the ash behavior under a specified condition. FactSage Equilibs module was selected to simulate the ash melting behavior in the temperature range of 600 °C to 1000 °C under oxygen-free environment. The C, H, O, N of the fuel (Table 1) and the oxides in the ashes from XRF analysis (Table 3) were used as input parameters.
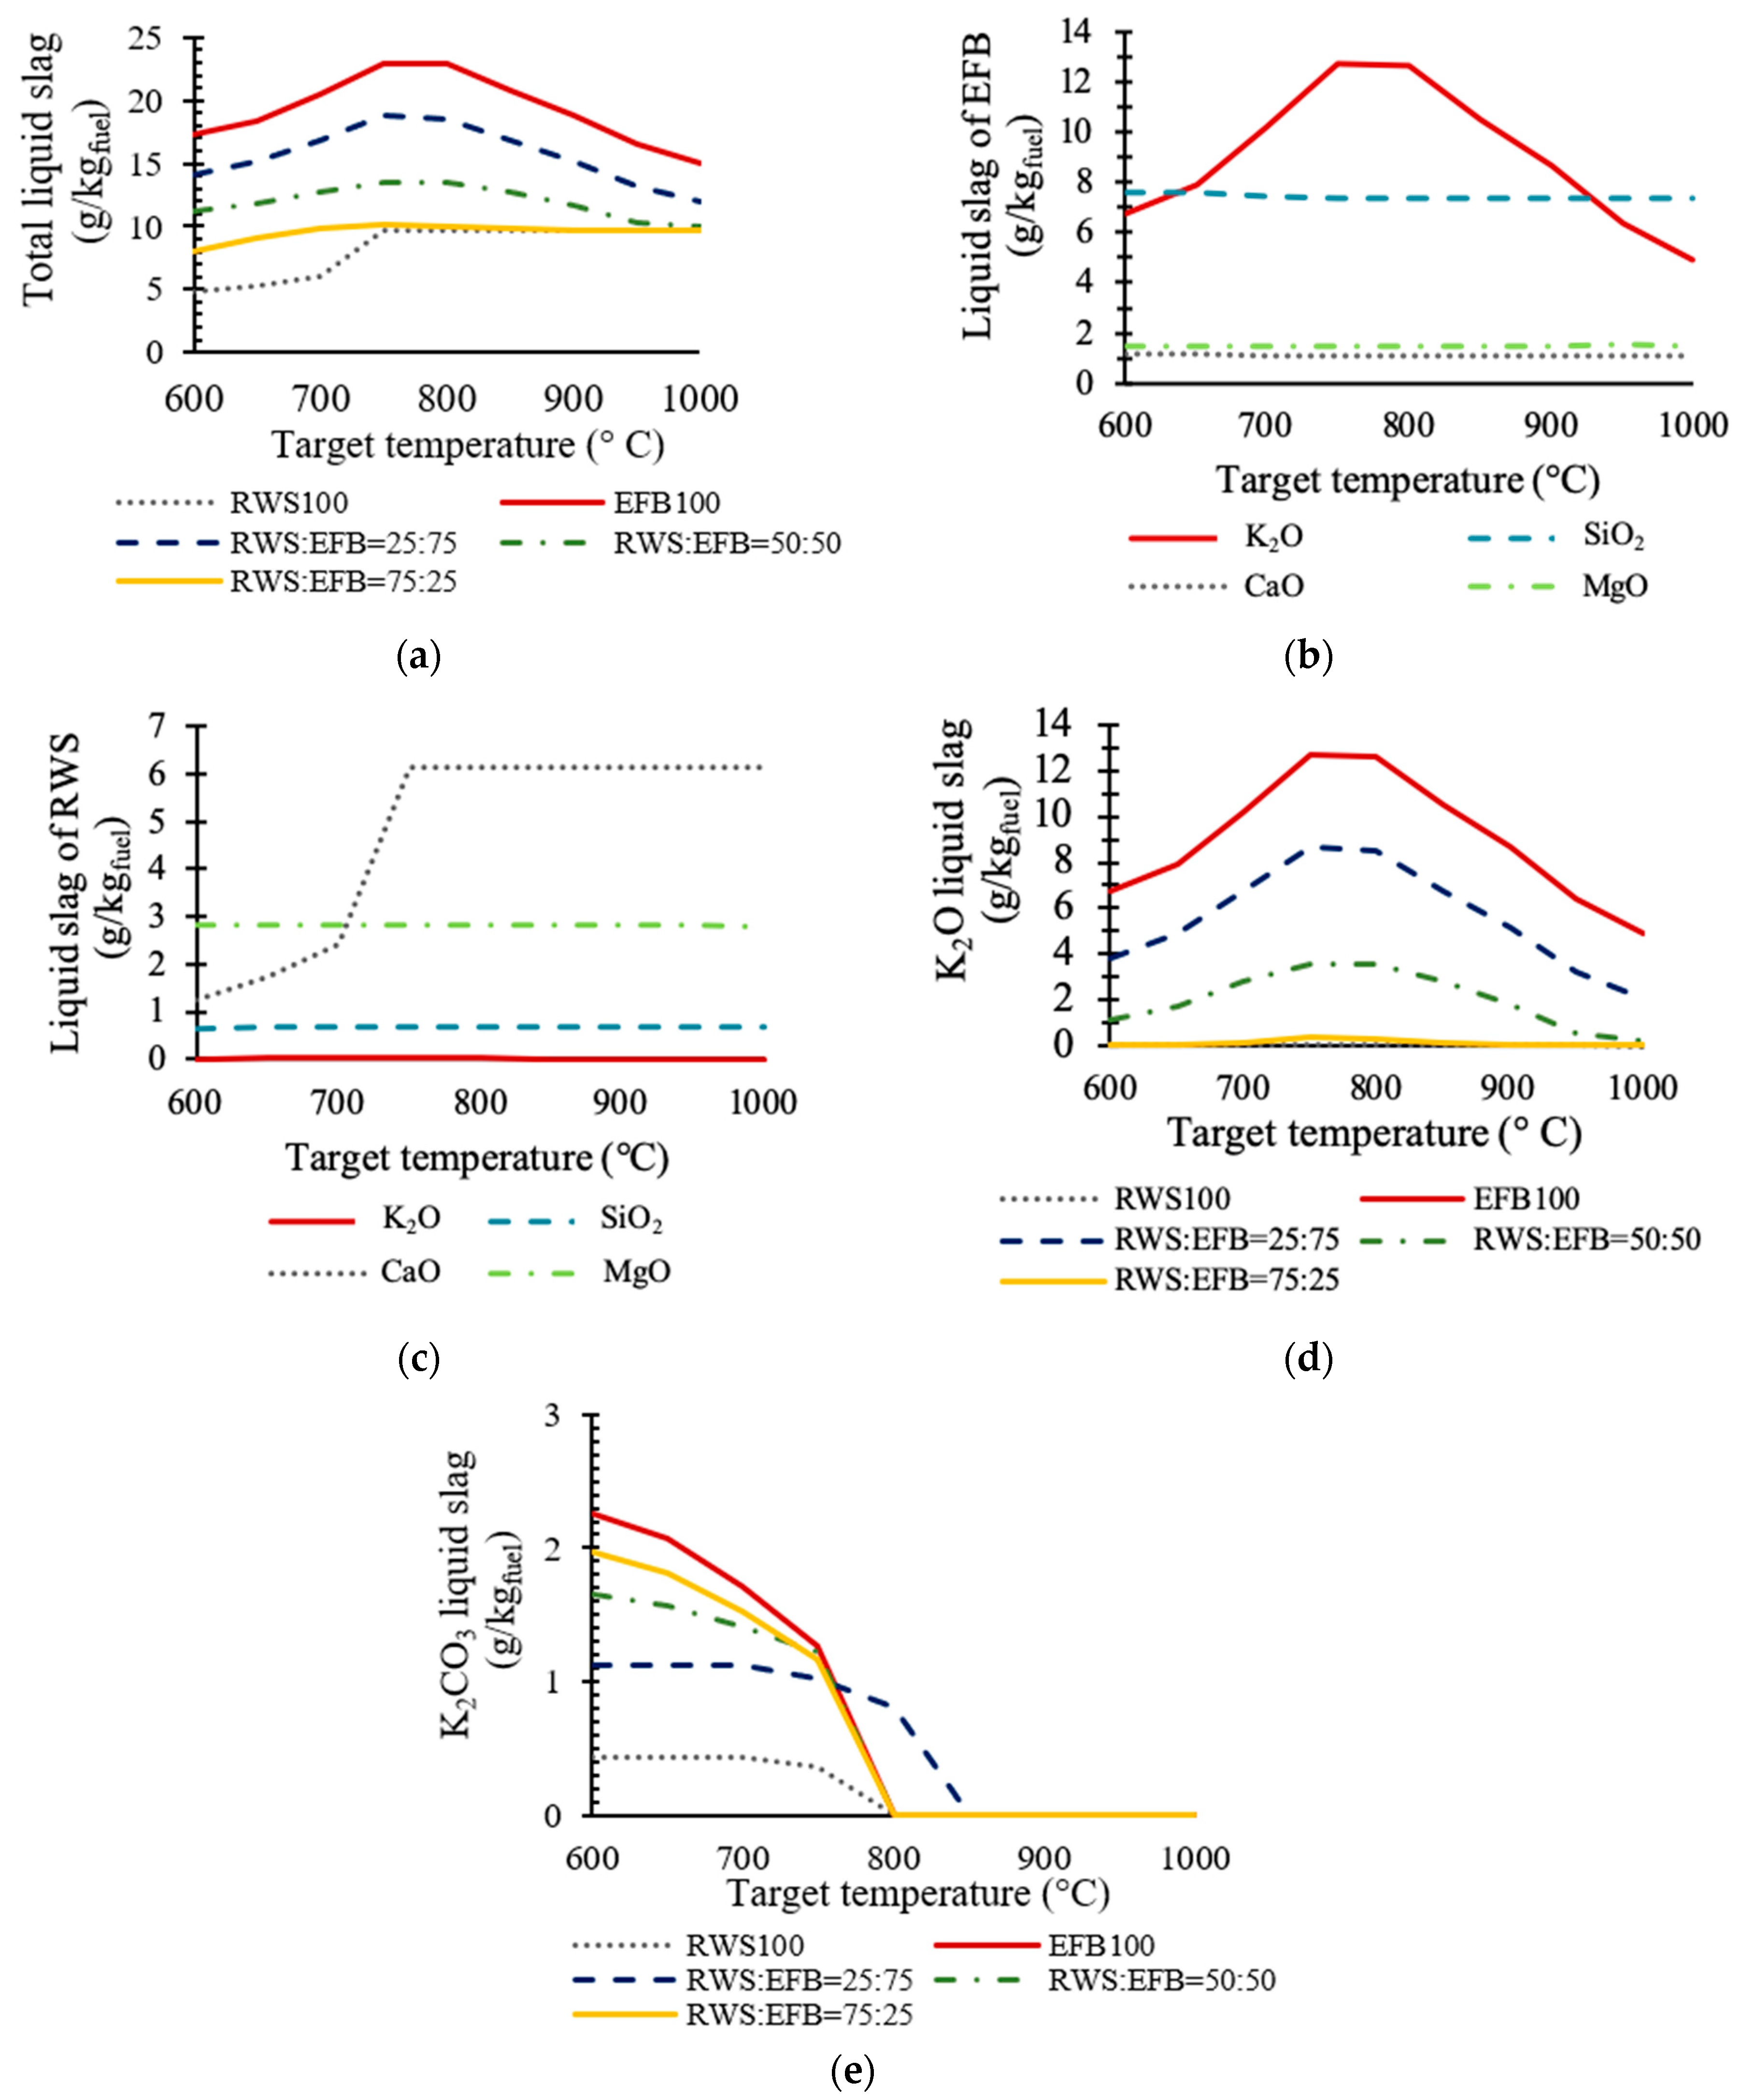
The calculation was set to simulate the melting phase of fuel at 50 °C increments. The results of these calculations illustrated melting phase and gas phase compounds formed. The total amount of melting phases and the melting phase of selected elemental species when using various fuel blending ratios are shown as the yield of total liquid slag in g/kg of fuel, as shown in Figure 11a. According to the simulation results, EFB has a relatively high liquid slag compared to RWS because EFB initially has a high ash content compared to RWS.
In this study, K2O, SiO2, CaO, MgO, and K2CO3 were the compounds of interest. As mentioned earlier, the main compound causing bed agglomeration was K2O·nSiO2. Extremely high amounts of K and Si compounds were found in EFB liquid slag, as shown in Figure 11b. The yield of K2O in EFB liquid slag increased over the temperature range of 600–750 °C because the potassium compound started to melt until the temperature reached 800 °C. The yield of SiO2 liquid slag in EFB ash was also extremely high—eight times that of RWS ash.
In contrast, K2O and SiO2 present in the liquid slag of RWS ash as shown in Figure 11c were extremely low at almost 0 and 0.6 gslag/kgfuel, respectively. Moreover, the yield of CaO in the liquid slag of RWS showed a significant increase from 600–750 °C and stayed as melted phase.
The comparison of K2O in liquid slag from different fuel blending ratios is shown in Figure 11d. The highest K2O in liquid slag was found when using EFB = 100 because of the high potassium in EFB ashes. At the higher ratio of RWS:EFB, the K2O liquid slag decreased because the potassium in EFB ashes was diluted when adding RWS, since RWS has low levels of potassium in its ashes.
Another interesting compound found in the simulation was K2CO3, as shown in Figure 11e. At higher ratio of RWS:EFB, the yield of K2O (Figure 11d) and total liquid slag (Figure 11a) were lower and dropped to almost at nearly 0 gslag/kgfuel at RWS:EFB = 75:25 (i.e., similar to when using RWS = 100), whereas the yield of K2CO3 in the liquid slag was formed and evident in temperatures range 600–800 °C, as shown in Figure 11e. The possible reason for this was that the higher CaO (from the RWS ash) present in the environment could act as a catalyst to enhance the shift reaction and generate CO2. Later, CO2 could react with K2O to form K2CO3 instead of K2O·nSiO2. The highest yield of K2CO3 liquid slag between blended fuel was found when using fuel blending ratio at RWS:EFB = 75:25. The yield of liquid slag calculated from FactSage also correlated with the results from SEM-EDS, in which no bed agglomeration was found in experiments using RWS:EFB = 75:25 as fuel, since K2CO3 has a higher melting point (891 °C).
4. Conclusions
As EFB has high K in its ashes, using EFB as a fuel in fluidized bed gasification caused the formation of a sticky compound, K2O·nSiO2, at low temperatures (750 °C). This sticky potassium-silica compound adhered bed materials together and resulted in bed agglomeration. However, the bed agglomeration tendency could be reduced by blending RWS with EFB. In this study, RWS was blended with EFB at three ratios: RWS:EFB = 25:75, RWS:EFB = 50:50, and RWS:EFB = 75:25. Adding RWS to the fuel could prolong de-fluidization time.
Using the RWS to EFB ratio at 75:25 yielded the most satisfactory method of preventing bed agglomeration. No bed agglomeration was found within the time limit of the experiment (9000 s) because of the lower total K and the adequate Ca in the blended fuel. It is possible that the high content of CaO in RWS ash enhanced the formation of K2CO3 instead of K2O·nSiO2. The results also correlated with the FactSage simulation in which K2CO3, a higher melting point compound, appeared in the slag phase in temperature range 600–800 °C.
The results from this study have confirmed the possibility of bed agglomeration reduction by adding woody biomass to high alkali biomass. Although the optimum operation range and other influencing factors still need further investigation, the clear agglomeration tendency and gasification performance can be used as a guideline for commercial operation as well as for using other types of biomass mixtures.
Author Contributions
T.K. designed and conducted the experiments; S.F. supervised the research; T.K. wrote the manuscript; S.F. revised the manuscript. All authors have read and agreed to the published version of the manuscript.
Funding
This research received no external funding.
Conflicts of Interest
The authors declare no conflict of interest.
References
- Zainal, Z.; Lahijani, P.; Mohammadi, M.; Mohamed, A.R. Gasification of lignocellulosic biomass in fluidized beds for renewable energy development: A review. Renew. Sustain. Energy Rev. 2019, 14, 2852–2862. [Google Scholar]
- Matas, G.B.; Sandquist, J.; Sørum, L. Gasification of Biomass to Second Generation Biofuels: A Review. ASME J. Energy Resour. Technol. 2012, 135. [Google Scholar] [CrossRef]
- Basu, P. Chapter 1: Introduction. In Biomass Gasification and Pyrolysis: Practical Design and Theory; Academic Press: Cambridge, MA, USA; Elsevier: Amsterdam, The Netherlands, 2010; pp. 1–25. [Google Scholar]
- Morris, J.; Daood, S.; Chiton, S.; Nimmo, W. Mechanisms and mitigation of agglomeration during fluidized bed combustion of biomass: A review. Fuel 2018, 230, 452–473. [Google Scholar] [CrossRef]
- Narayan, V.; Jensen, P.A.; Henriksen, U.B.; Glarborg, P.; Lin, W.; Nielsen, R.G. Defluidization in fluidized bed gasifiers using high-alkali content fuels. Biomass Bioenergy 2019, 91, 160–174. [Google Scholar] [CrossRef] [Green Version]
- Visser, H.; Van, L.S.; Kiel, J. Biomass Ash-Bed Material Interactions Leading to Agglomeration in FBC. ASME J. Energy Resour. Technol. 2008, 130. [Google Scholar] [CrossRef]
- Anthony, E.; Preto, F.; Jia, L.; Iribarne, J. Agglomeration and Fouling in Petroleum Coke-Fired FBC Boilers. ASME J. Energy Resour. Technol. 1998, 120, 285–292. [Google Scholar] [CrossRef]
- Öhman, M.; Pommer, L.; Nordin, A. Bed Agglomeration Characteristics and Mechanisms during Gasification and Combustion of Biomass Fuels. Energy Fuels 2005, 19, 1742–1748. [Google Scholar] [CrossRef]
- Mettanat, V.; Basu, P.; Butler, J. Agglomeration of biomass fired fluidized bed gasifier and combustor. Can. Soc. Chem. Eng. 2009, 87, 656–684. [Google Scholar] [CrossRef]
- Öhman, M.; Nordin, A. The Role of Kaolin in Prevention of Bed Agglomeration during Fluidized Bed Combustion of Biomass Fuels. Energy Fuel 2000, 14, 618–624. [Google Scholar] [CrossRef]
- Chi, H.; Pans, M.A.; Sun, C.; Liu, H. An investigation of lime addition to fuel as a countermeasure to bed agglomeration for the combustion of non-woody biomass fuel in a 20 kWth bubbling fluidised bed combustor. Fuel 2019, 240, 349–361. [Google Scholar] [CrossRef]
- Liu, Z.; Peng, T.; Lin, C. Impact of CaO and CaCO3 addition on agglomeration/defluidization and heavy metal emission during waste combustion in fluidized bed. Fuel Process. Technol. 2014, 118, 171–179. [Google Scholar] [CrossRef]
- Lin, C.; Kou, J.; Wey, M.; Chang, S.; Wang, K. Inhibition and promotion: The effect of earth alkali metals and operating temperature on particle agglomeration/defluidization during incineration in fluidized bed. Power Technol. 2009, 189, 57–63. [Google Scholar] [CrossRef]
- Kuprianov, V.; Ninduangdee, P.; Suheri, P. Co-firing of oil palm residues in a fuel staged fluidized-bed combustor using mixtures of alumina and silica sand as the bed material. Appl. Therm. Eng. 2018, 144, 371–382. [Google Scholar] [CrossRef]
- Ninduangdee, P.; Kuprianov, V. Combustion of an oil palm residue with elevated potassium content in a fluidized-bed combustor using alternative bed materials for preventing bed agglomeration. Bioresour. Technol. 2015, 182, 272–281. [Google Scholar] [CrossRef]
- Kittivech, T.; Fukuda, S. Effect of bed material on bed agglomeration for palm empty fruit bunch (EFB) gasification in a bubbling fluidized bed system. Energies 2019, 12, 4336. [Google Scholar] [CrossRef] [Green Version]
- Fryda, L.E.; Panopoulos, K.D.; Kakaras, E. Agglomeration in fluidised bed gasification of biomass. Powder Technol. 2008, 181, 307–320. [Google Scholar] [CrossRef]
- Llorente, M.F.; Cuadrado, R.E.; Laplaza, J.M.; García, J.C. Combustion in bubbling fluidised bed with bed material of limestone to reduce the biomass ash agglomeration and sintering. Fuel 2006, 85, 2081–2092. [Google Scholar] [CrossRef]
- Serrano, D.; Sánchez-Delgado, S.; Sobrino, C.; Marugán-Cruz, C. Defluidization and agglomeration of a fluidized bed reactor during Cynara cardunculus L. gasification using sepiolite as a bed material. Fuel Process. Technol. 2015, 131, 338–347. [Google Scholar] [CrossRef] [Green Version]
- Mac an Bhaird, S.T.; Walsh, E.; Hemmingway, P.; Maglinao, A.L.; Capareda, S.C.; McDonnell, K.P. Analysis of bed agglomeration during gasification of wheat straw in a bubbling fluidised bed gasifier using mullite as bed material. Power Technol. 2014, 254, 448–459. [Google Scholar] [CrossRef] [Green Version]
- George, J.; Arun, P.; Muraleedharan, C. Experimental investigation on co-gasification of coffee husk and sawdust in a bubbling fluidized bed gasifier. J. Energy Inst. 2018, 92, 1977–1986. [Google Scholar] [CrossRef]
- Visvanathan, C.; Chiemchaisri, C. Management of Agricultural Wastes and Residue in Thailand: Wastes to Energy Approach. Available online: http://faculty.ait.ac.th/visu/wp-content/uploads/sites/7/2019/01/Agri-waste2energy-Thai.pdf (accessed on 15 October 2019).
- Department of Alternative Energy Development and Efficiency. Potential of Palm Empty Fruit Bunch. Available online: http://webkc.dede.go.th/testmax/node/2529 (accessed on 15 October 2019).
- Lahijani, P.; Zainal, Z. Gasification of palm empty fruit bunch in a bubbling fluidized bed: A performance and agglomeration study. Bioresour. Technol. 2011, 102, 2068–2076. [Google Scholar] [CrossRef] [PubMed]
- Lahijani, P.; Njafpour, G.; Zainal, Z.; Mohammadi, M. Air gasification of palm empty fruit bunch in a fluidized bed gasifier using various bed materials. In Proceedings of the World Renewable Energy Congress, Linkoping, Sweden, 8–13 May 2011; pp. 3269–3275. [Google Scholar]
- Kittivech, T.; Fukuda, S. Characteristic of Palm empty fruit bunch (EFB) gasification in a bubbling fluidized bed reactor. In Proceedings of the 5th International Conference on Engineering, Energy and Environment, Bangkok, Thailand, 1–3 November 2017; pp. 307–312. [Google Scholar]
- Chaivatamaset, P.; Sricharoon, P.; Tia, S.; Bilitewski, B. The characteristics of bed agglomeration/defluidization in fluidized bed firing palm empty fruit bunch and rice straw. Appl. Therm. Eng. 2014, 70, 737–747. [Google Scholar] [CrossRef]
- Chaivatamaset, P.; Sricharoon, P.; Tia, S. Bed agglomeration characteristics of palm shell and corncob combustion in fluidized bed. Appl. Therm. Eng. 2011, 31, 2916–2927. [Google Scholar] [CrossRef]
- Chaivatamaset, P.; Tia, S. The characteristics of bed agglomeration during fluidized bed combustion of eucalyptus bark. Appl. Therm. Eng. 2015, 75, 1134–1146. [Google Scholar] [CrossRef]
- Kaewluan, S.; Pipatmanomai, S. Gasification of high moisture rubber woodchip with rubber waste in a bubbling fluidized bed. Fuel Process. Technol. 2011, 92, 671–677. [Google Scholar] [CrossRef]
- Rattanaya, T.; Sawasdisan, P.; Srichuay, P.; Samanwiwat, A.; Kongjan, P.; Yuso, P.; Waehamak, M.; Jariyaboon, R.; Reungsand, A. Application of Waste Rubberwood Ash in Carbon Dioxide Absorption. Int. J. Environ. Sci. Educ. 2017, 12, 2275–2287. [Google Scholar]
- Channiwala, S.A.; Parikh, P.P. A unified correlation for estimating HHV of solid, liquid and gaseous fuels. Fuel 2002, 81, 1051–1063. [Google Scholar] [CrossRef]
- Roedder, E. Silicate melt systems. Phys. Chem. Earth 1959, 3, 224–297. [Google Scholar] [CrossRef]
- Bale, C.W.; Bélislea, E.; Chartrand, P.; Decterov, S.A.; Eriksson, G.; Gheribi, A.E.; Hack, K.; Jung, I.-H.; Kang, Y.-B.; Melançona, J.; et al. FactSage thermochemical software and database, 2010-2016. Calphad 2016, 54, 35–53. [Google Scholar] [CrossRef] [Green Version]
Figure 1.
Bench-scale bubbling fluidized bed gasification system.

Figure 2.
Temperature and pressure profiles monitored during gasification of (a) RWS = 100 at ER = 0.35 and (b) EFB = 100 at ER = 0.35.
Figure 2.
Temperature and pressure profiles monitored during gasification of (a) RWS = 100 at ER = 0.35 and (b) EFB = 100 at ER = 0.35.

Figure 3.
Comparison of bed temperature from experiments using different fuel blending ratios.

Figure 4.
Producer gas composition at various blending fuel ratios.

Figure 5.
Producer gas Higher Heating Value (HHV) at various fuel blending ratios.

Figure 6.
Carbon conversion efficiency and cold gasification efficiency of co-gasification using various ratios of blended fuel.
Figure 6.
Carbon conversion efficiency and cold gasification efficiency of co-gasification using various ratios of blended fuel.

Figure 7.
Example of (a) a small agglomerate of bed particles (size range from 500–2000 µm), (b) a large, porous agglomerate of bed particles (size 4 cm diameter) from visual observation.
Figure 7.
Example of (a) a small agglomerate of bed particles (size range from 500–2000 µm), (b) a large, porous agglomerate of bed particles (size 4 cm diameter) from visual observation.

Figure 8.
(a) SEM micrograph of bed agglomeration samples from EFB = 100 experiment, (b) SEM micrograph of bed agglomeration samples from RWS:EFB = 25:75 experiment, (c) SEM micrograph of bed agglomeration samples from RWS:EFB = 50:50 experiment, (d) SEM micrograph of large porous agglomeration and (e) EDS spot analysis composition.


Figure 9.
Summary of agglomeration mechanisms found in this study, adapted from ref. [6].
Figure 9.
Summary of agglomeration mechanisms found in this study, adapted from ref. [6].

Figure 10.
EDS spot composition of bed agglomeration sample plots on the ternary phase diagram of the K2O-CaO-SiO2 system. Adapted from reference [33].
Figure 10.
EDS spot composition of bed agglomeration sample plots on the ternary phase diagram of the K2O-CaO-SiO2 system. Adapted from reference [33].

Figure 11.
Amount of liquid slag simulated at various temperatures using FactSage, (a) total liquid slag, (b) major liquid slag of EFB, (c) major liquid slag of RWS, (d) K2O liquid slag and (e) K2CO3 liquid slag of various blending fuel ratios.
Figure 11.
Amount of liquid slag simulated at various temperatures using FactSage, (a) total liquid slag, (b) major liquid slag of EFB, (c) major liquid slag of RWS, (d) K2O liquid slag and (e) K2CO3 liquid slag of various blending fuel ratios.


Table 1.
Properties of biomasses.
| EFB = 100 | RWS:EFB = 25:75 b | RWS:EFB = 50:50 b | RWS:EFB = 75:25 b | RWS = 100 | |
|---|---|---|---|---|---|
| Proximate analysis (dry basis) | |||||
| Volatile matter (VM) | 74.2 | 76.3 | 78.5 | 80.6 | 82.8 |
| Fix carbon (FC) | 20.6 | 19.4 | 18.2 | 17.0 | 15.8 |
| Ash | 5.2 | 4.3 | 3.3 | 2.4 | 1.4 |
| Ultimate analysis (dry basis) | |||||
| C | 43.8 | 44.5 | 45.3 | 46.1 | 46.8 |
| H | 6.2 | 6.5 | 6.9 | 7.2 | 7.6 |
| O | 44.4 | 44.3 | 44.1 | 44.0 | 43.9 |
| N | 0.4 | 0.4 | 0.4 | 0.3 | 0.3 |
| HHVcal (MJ/kg) a | 17.5 | 18.3 | 19.1 | 19.9 | 20.7 |
a—calculated from elemental contents based on the formula , where X = % dry basis of each component [32]. b—calculated from interpolation between RWS = 100 and EFB = 100.
Table 2.
De-fluidization time and average bed temperature of the experiments using various blending ratios of RWS and EFB.
Table 2.
De-fluidization time and average bed temperature of the experiments using various blending ratios of RWS and EFB.
| RWS:EFB Ratio | De-Fluidization Time (s) | Average Bed Temperature (°C) |
|---|---|---|
| 0:100 | 600 | 725 |
| 25:75 | 3600 | 740 |
| 50:50 | 7800 | 750 |
| 75:25 | n.d. | 780 |
| 100:0 | n.d. | 760 |
n.d. = no de-fluidization found.
Table 3.
Oxide composition in ashes of biomasses.
| Oxide Composition (% by Weight, Dry Ash Basis) | |||||
|---|---|---|---|---|---|
| EFB = 100 | RWS:EFB = 25:75 a | RWS:EFB = 50:50 a | RWS:EFB = 75:25 a | RWS = 100 | |
| SiO2 | 14.6 | 13.8 | 12.6 | 10.3 | 4.8 |
| Al2O3 | - | 0.1 | 0.3 | 0.7 | 1.6 |
| CaO | 2.2 | 5.6 | 10.9 | 20.6 | 43.8 |
| MgO | 2.9 | 4.3 | 6.5 | 10.6 | 20.2 |
| Fe2O3 | 0.5 | 0.6 | 0.7 | 0.9 | 1.3 |
| K2O | 61.2 | 57.9 | 52.8 | 43.4 | 21.2 |
| SO3 | 2.0 | 1.9 | 1.6 | 1.1 | - |
| Na2O | 0.5 | 0.5 | 0.5 | 0.5 | 0.4 |
| MnO | - | - | 0.1 | 0.2 | 0.5 |
| P2O5 | 2.0 | 2.3 | 2.9 | 3.8 | 6.2 |
| Cl | 14.1 | 13.0 | 11.1 | 7.9 | - |
a—calculated from interpolation between RWS = 100 and EFB = 100.
© 2019 by the authors. Licensee MDPI, Basel, Switzerland. This article is an open access article distributed under the terms and conditions of the Creative Commons Attribution (CC BY) license (http://creativecommons.org/licenses/by/4.0/).
Share and Cite
MDPI and ACS Style
Kittivech, T.; Fukuda, S. Investigating Agglomeration Tendency of Co-Gasification between High Alkali Biomass and Woody Biomass in a Bubbling Fluidized Bed System. Energies 2020, 13, 56. https://doi.org/10.3390/en13010056
AMA Style
Kittivech T, Fukuda S. Investigating Agglomeration Tendency of Co-Gasification between High Alkali Biomass and Woody Biomass in a Bubbling Fluidized Bed System. Energies. 2020; 13(1):56. https://doi.org/10.3390/en13010056
Chicago/Turabian StyleKittivech, Tanakorn, and Suneerat Fukuda. 2020. "Investigating Agglomeration Tendency of Co-Gasification between High Alkali Biomass and Woody Biomass in a Bubbling Fluidized Bed System" Energies 13, no. 1: 56. https://doi.org/10.3390/en13010056
Note that from the first issue of 2016, this journal uses article numbers instead of page numbers. See further details here.