Energy Use in Residential Buildings: Characterisation for Identifying Flexible Loads by Means of a Questionnaire Survey


1
Department of Planning, Design and Technology of Architecture, Sapienza University of Rome, 00197 Rome, Italy
2
Department of Astronautics, Electrical Energy Engineering, Sapienza University of Rome, 00184 Rome, Italy
*
Author to whom correspondence should be addressed.
Energies 2019, 12(11), 2055; https://doi.org/10.3390/en12112055
Submission received: 14 May 2019
/
Revised: 24 May 2019
/
Accepted: 25 May 2019
/
Published: 29 May 2019
(This article belongs to the Section G: Energy and Buildings)
Abstract
:This work shows the outcomes of a research activity aimed at the energy characterization of residential users. Specifically, by data analysis related to the real energy consumption of sample buildings, the flexible loads amount has been identified so as to investigate on the opportunity to implement a demand/response (DR) program. The most meaningful input data have been collected by an on-line questionnaire created within an Excel spreadsheet allowing one to simulate and compare the calculations with the actual dwellings’ consumption; 412 questionnaires have been used as statistical sample and simulations have been performed based on single-zone dynamic model. Additionally, once the energy consumptions have been sorted by the different services, reference key performance indicators (KPIs) have been also calculated normalising those ones by people and house floor surface. From data analysis, it emerges how the Italian residential users are not very electrified. Furthermore, the flexible loads are low and, implementing minor maintenance interventions, the potential of flexibility can decrease up to 20%. For that reason, the current research can be further developed by investigating on suitable flexibility extensions as well as on the automation system requirements which is needed managing the flexible loads.
1. Introduction
It is well known how renewable energy sources (RES) are playing a key role in getting better energy and environmental performance out of existing electrical infrastructures. Even though they are characterized by high intermittency, they have low marginal costs [1] and for that reason they can be also considered as one of the main pillars for the energy transition [2].
In the last decade, several research projects were focused on the assessment of technical and safety issues associated to a growing RES share in current energy systems. To implement the different potential strategies, the comparisons are made very often between historical data and future scenarios [3,4].
Extending the forecasting horizon to 2050 and increasing the targets value, the wider RES integration become crucial for all those countries that really want to head towards a total decarbonization of their energy consumptions [5,6]. To do so, significant changes in national grids monitoring and managing, have to be accounted for and have to be funded as well [7]. Referring to the recent IEA/Irena scenario, it is possible to note that the two third of world’s energy consumption will be met by renewables by 2050, where 70% of electricity production will hail from RES [8].
Thus, the European Commission call for achieving a RES share equal to 32% of the whole final energy consumption by 2030. In detail, looking at the electric sector, that ambitious target entails that 50% of EU members electricity demand will be met by renewables, at least. In so doing, new national energy and environmental policies are basically mandatory and have to be effectively implemented by each member state [9].
With the deployment of distributed energy generation and introduction of variable energy sources in the supply mix, it is necessary to be focused on the demand management (DSM) and flexible electrical loads to improve efficiency and to stabilize the grid [10,11]. Demand management includes all activities aimed at influencing consumer electricity demand, in order to match it better with the offer [12]. Among those, the demand/response (DR) activity offers good opportunities; it is defined as “changes in electric usage by demand-side resources from their normal consumption patterns in response to changes in the price of electricity over time, or to incentive payments designed to induce lower electricity use at times of high wholesale market prices or when system reliability is jeopardized” [13].
The main goal of a DR program is to improve the grid efficiency and security by shifting some peak loads in off-peak hours. The interest in DR program application to dwellings is quite recent and it is a consequence of the high value of energy consumption in the building sector. Indeed, in Europe, the real estate consumption accounted for 41.7% of total consumption; more specifically, consumption in the residential sector alone accounted for 27.2% of total consumption, based on data from 2017 [14].
It is important to point out that part of residential consumption is electrical, and only a fraction of it can be considered flexible. A great potential for flexibility can be found in buildings equipped with electric heating systems; the impact on overall consumption depends on the climatic zone (i.e., outdoor temperature and relative humidity), on the buildings’ characteristics and on the occupancy rate [15]. Likewise, a great potential for flexibility can be noted in buildings equipped with domestic hot water preparation systems; in that case the impact on overall consumption essentially depends on the intended use and the number of occupants [16]. In addition to those consumptions, there are further deferrable loads owing to the use of washing machines, dishwashers or dryers, whose incidence is correlated to the users’ number [17].
In this framework, the present work has been focused on the energy needs of Italian residential sector, assessing what are the potential flexible loads, so as to identify the criticalities and to highlight the main tools and strategies for fostering the energy transition as well. Referring to 2017, the Italian residential sector is responsible of 29.0% of national energy consumptions, therefore it represents a significant fraction [14]. As a consequence, searching for the flexibility potential there, is strongly suggested.
By the literature survey on those topics, in [18,19] the intervention options to improve energy demand flexibility in buildings have been reviewed, including heating, ventilation, and air conditioning (HVAC) systems, energy storage, building heat capacity, appliances, and occupants behaviour. Then, Shakouri et al. [20] prosed in their study a multi-objective optimization procedure for demand side management of a residential area; under different scenarios, the advantages of using centralized energy management systems in residential buildings were demonstrated, showing the potential benefits for both consumers and service companies.
The energy consumption status and trends of the European Union (EU) residential sector was analysed in [21], paying great attention to the impact and effectiveness of implemented energy efficiency policies for this sector.
Gaglia et al. [22], Vogiatzi et al. [23] and Chang et al. [24] provided in their works different methods and analyses of energy consumption in residential buildings, aimed at identifying energy saving interventions and at reducing pollutants emissions. The authors of [25,26,27,28] were focused only on residential electricity consumptions, so as to provide a model for loads profiling, while the optimal load scheduling, when RES are installed, was the main target for the research projects reported in [29,30,31].
Finally, the energy consumptions trend, in terms of time series and frequency, hailing from different occupants’ habits along with the definition of potential strategy for improving the building energy performance, was the object of several works published in the last two years [32,33,34,35,36,37].
Having said, on the basis of the aforementioned research projects, this work presents an energy needs analysis in the residential sector, carried out by the dissemination of a data collection questionnaire, designed to be user-friendly as much as possible, even by non-expert users. The research results can be used as a benchmark for similar evaluations. Additionally, the methodological approach could be useful for further investigations aimed at implementing new tools and strategies to foster the flexibility in the electric demand-side.
2. Materials and Methods
Acquiring the basic data to perform calculations is very often a difficult process. Indeed, their accuracy and reliability are crucial for the research outcomes quality. Statistical databases provided by public or private organizations [38,39,40] very often organize information in aggregate form (i.e., energy consumption, building properties, household characteristics, etc.) [41,42,43]. Unfortunately, the needed data are sometimes not retrievable easily and their elaboration for specific applications can be a very demanding assignment.
In this paper, the data collection to investigate on the energy consumptions in residential buildings [44,45] have been done by means of a questionnaire surveys.
By the gathered data, the most common statistical approach [7,46,47,48] based on the multivariate linear regressive analysis has been used in order to establish the on-line simulation tool reliability, in terms of error on data forecasting.
In order to identify and quantify the main characteristics of dwellings consumptions, the aforementioned statistical analysis has been carried out by the Excel Data Analysis Tool. To do so, floor surface and the occupants’ number have been assumed as the main variables for the regression. Thereafter, the linear model outputs have been compared to those hailing from the online questionnaire/simulation tool.
The questionnaire structure has been optimized to facilitate the compiling by non-expert users as well, in order to assure the results accuracy; in a preliminary test phase the questionnaire was submitted to both common users and to a selection of expert users, to understand their different availability in providing the requested data; in its final form the questionnaire has the structure reported in Table 1. It is possible to note how some questions are “open questions” and the others are “closed questions”, where the participants have to choose among fixed options. Moreover, for some input values, suggestions for compiling have been indicated [46,49].
From a technical point of view, the questionnaire is created in the Excel environment implementing macros and functions written in Visual Basic for Applications (VBA) for a real-time simulation of energy consumptions based on the entered inputs. It is noteworthy how simulations are performed by means of an in-house developed code [50], which was used in other works [51,52,53] and was validated by comparison with the outcomes deriving from leading software such as TRNSYS and EnergyPlus.
With the aim of creating a simpler but still accurate tool, the code allows to run hourly single-zone dynamic simulations. The use of a self-developed code guarantees a high flexibility and allows the implementation of new tools and options if required.
The energy consumptions resulting from simulations are immediately compared with the actual ones entered by the user [54,55] and with the elaborated benchmarks. Those ones were computed on the basis of the Italian TSO report [39] and of the ISTAT survey on household energy consumption [56].
When a discrepancy between the simulation data and the actual ones occurs, warnings and potential solutions for data correction are prompted. That comparison is basically required owing to the lack of awareness that users have of their own consumption habits [57,58].
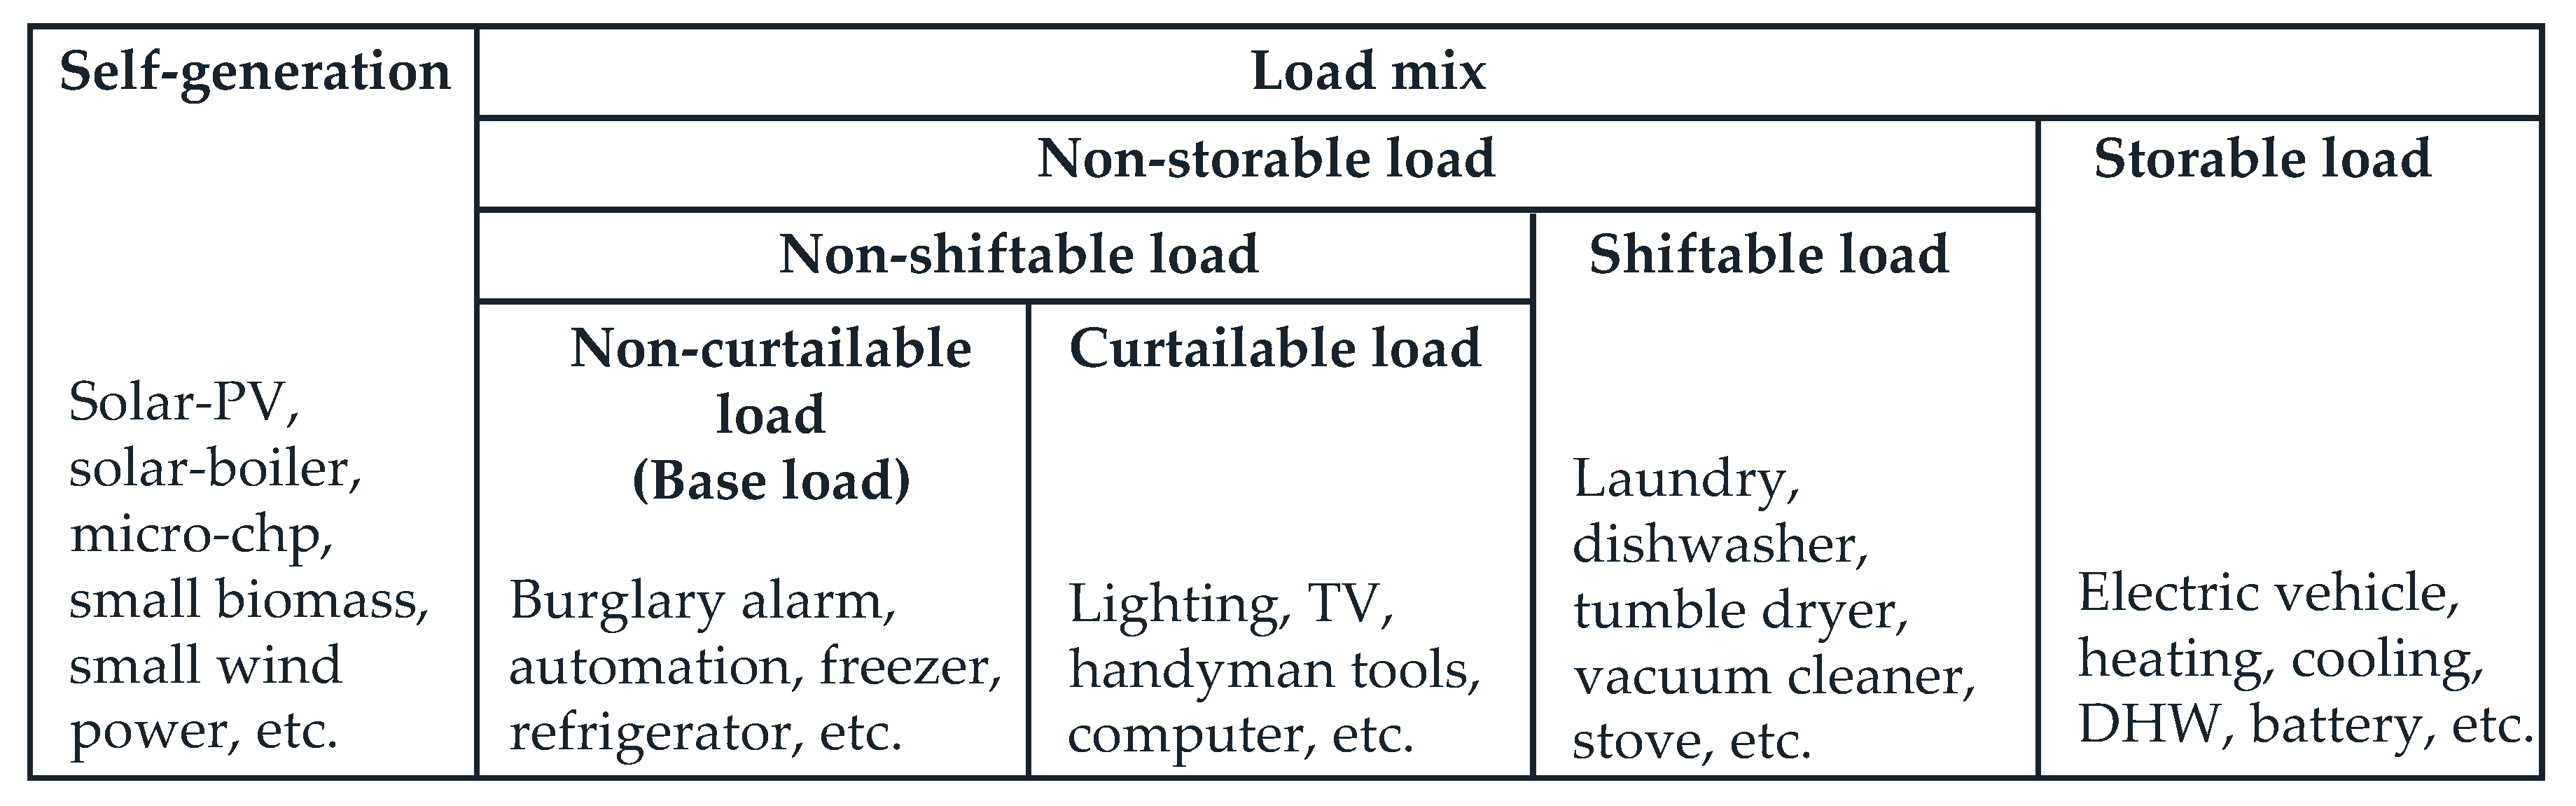
To provide a complete energy characterization of domestic users, the electrical and thermal users’ analysis has been carried out, assessing their peculiarities in terms of management flexibility, specific energy consumptions, power commitments and time. Thus, for that purpose, a preliminary classification has been drawn up (see Figure 1) according to [59], distinguishing four load typologies and the self-generation, which are defined as follows:
- (1)
- Storable load: the power consumption and the end-use service are decoupled by storage devices such as batteries (electrochemical) or thermal inertia.
- (2)
- Shiftable load: power consumption can be moved over the time period unaffecting the end-use service. Shiftable load often involves non-interruptible processes such as the laundry cycle and thus involves some planning.
- (3)
- Curtailable load: power consumption cannot be shifted unaffecting the end-use service, but that service can be interrupted instantly.
- (4)
- Non-curtailable load (Base load): the end-use service needs instant power and cannot be interrupted or shifted over the time period.
- (5)
- Self-generation: on-site power generation at consumer residence, reducing the net electric load. Dispatchable self-generation can be used as back-up power system.
According to that classification, the users’ characterization for the domestic sector has been developed to evaluate the potentially storable loads, potentially shiftable loads and the remaining ones. The outcomes of this work derive from gathered data which have been collected by the online questionnaire starting from September 2018. The statistic sample consists of 412 houseolds which fully compiled the online questionnaire by means of students attending the Faculty of Architecture of Sapienza University of Rome (Italy).
3. Results and Discussion
3.1. Dwellings Description and General Anlysis on Consumptions Typology
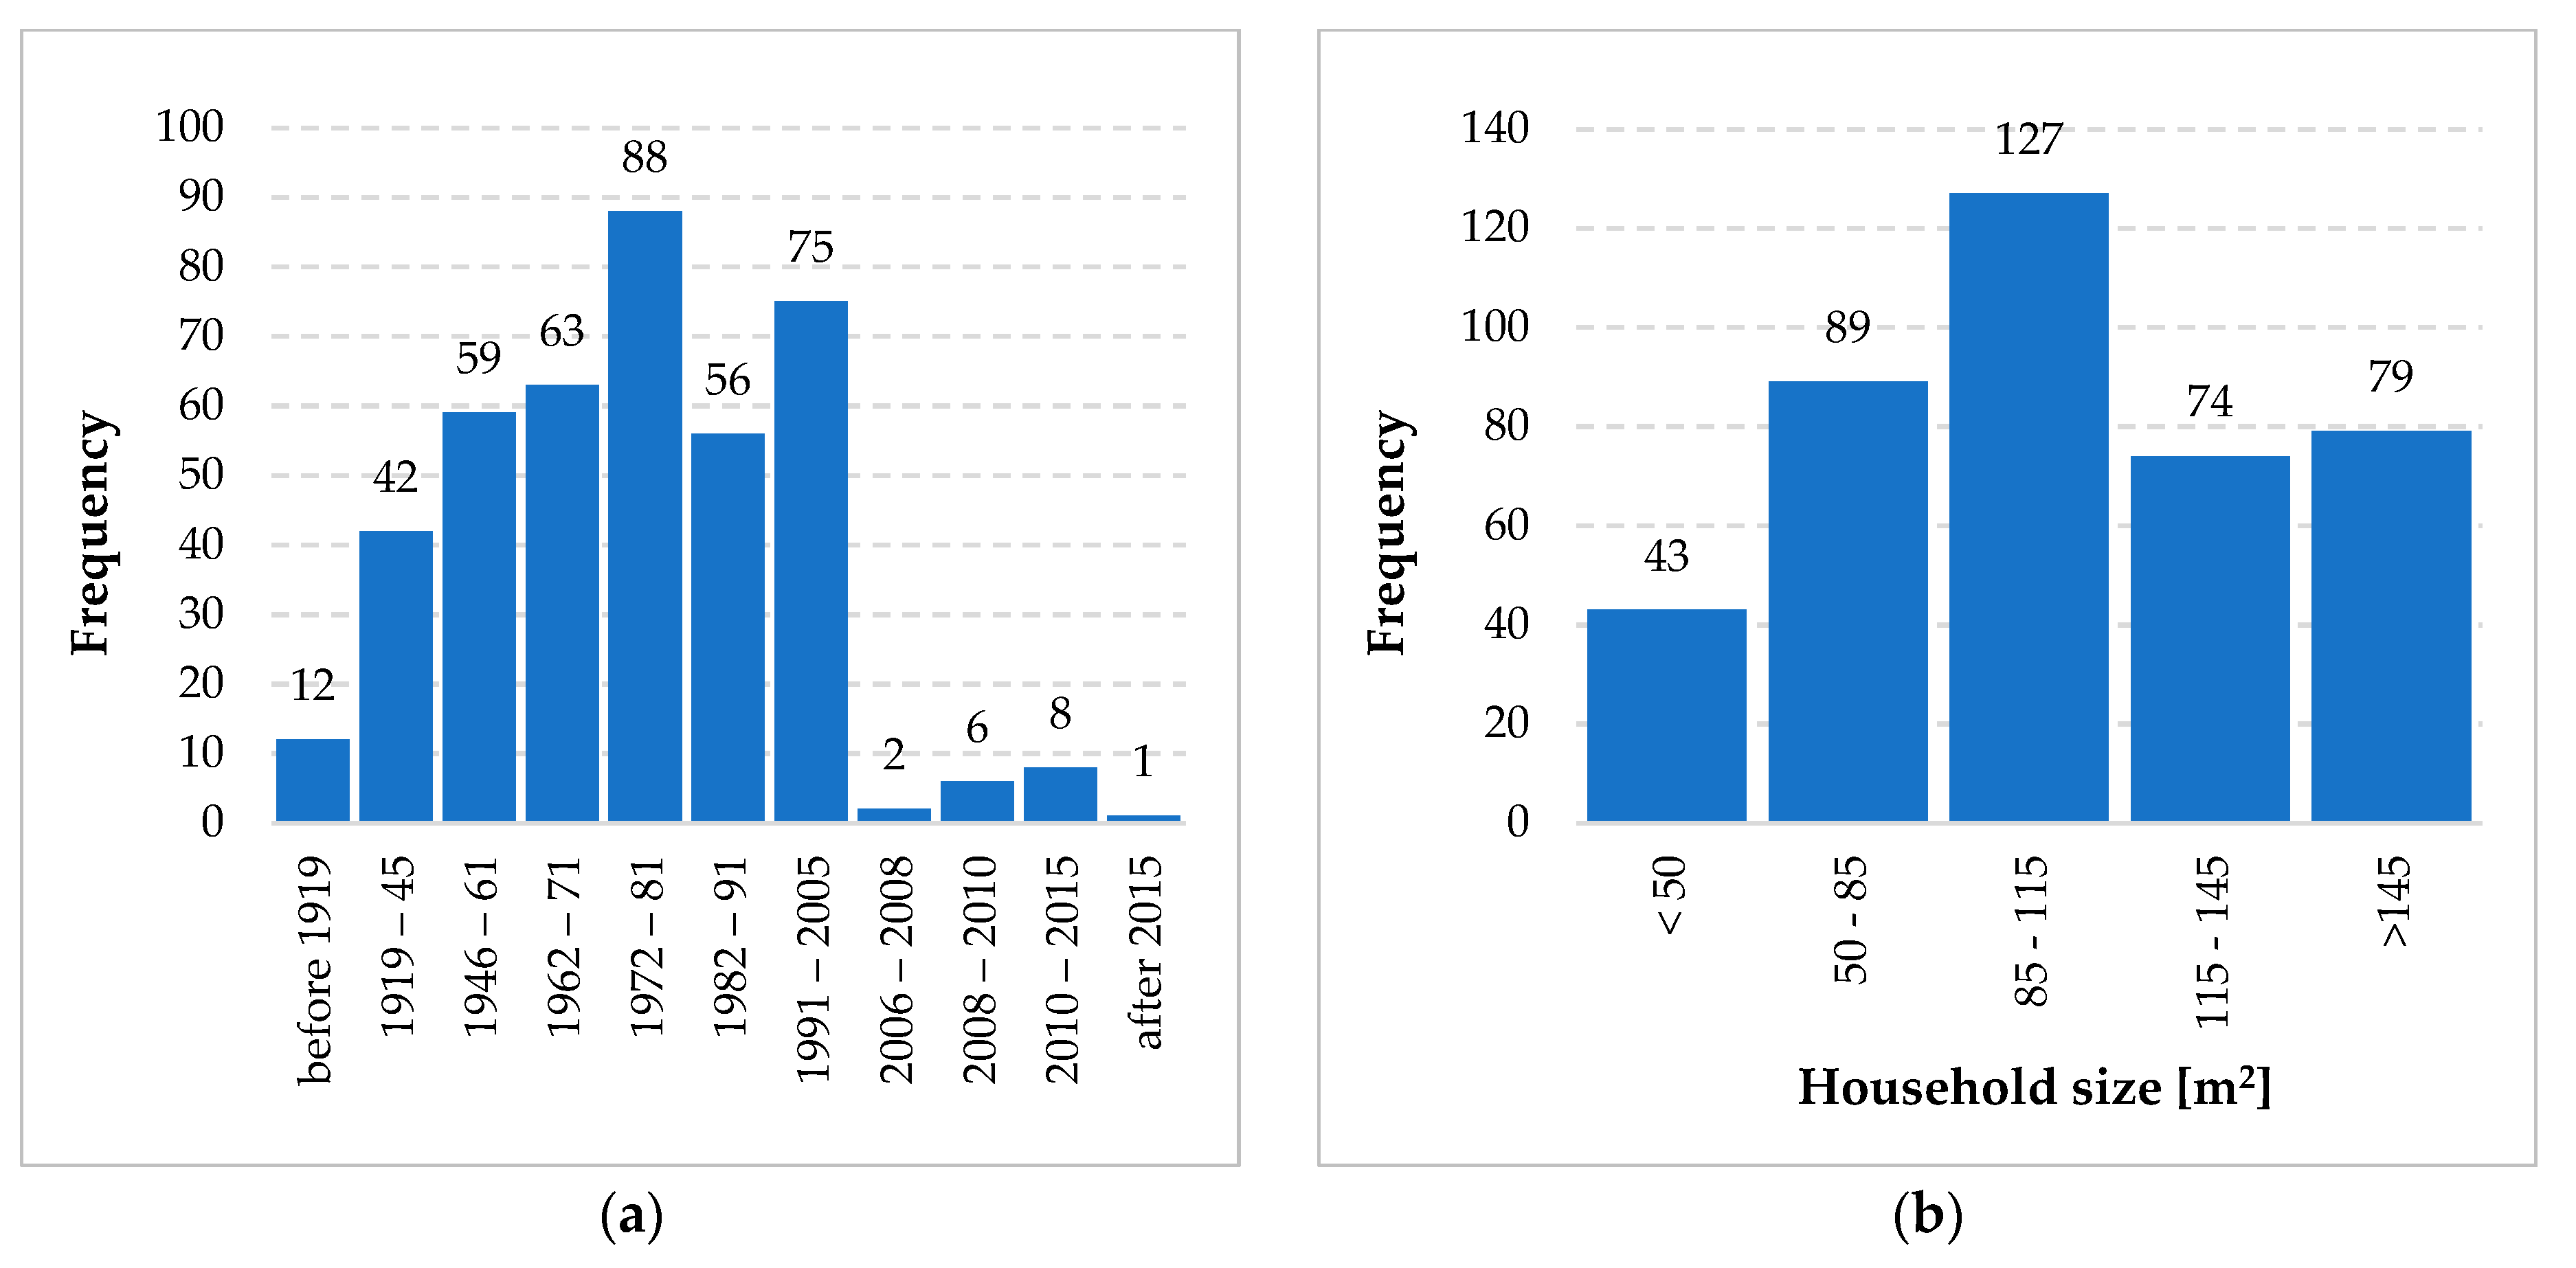
In this section the frequency analysis related to the building characteristics is presented. Specifically, Figure 2a shows the buildings subdivision according to the construction year, following the official classification used in the Italian population censuses [38]. From data it emerges that a large part of the sample buildings was built before 1976, the year in which the first Italian law on energy saving was issued. In addition, Figure 2b depicts the buildings frequency as a function of their size once five different dimensional classes have been identified (i.e., small < 50 m2; small-medium 50–85 m2; medium 85–115 m2; medium-large 115–145 m2; large > 145 m2). The apartments’ average size is equal to 112.4 m2 and the most common class is the middle one.
Table 2 outlines in a systemic overview the homes number that undergone refurbishments, sorted by the construction year and type of intervention; the most frequent measure is the windows replacement with a share equal to 46.6% (i.e., 192 sample apartments).
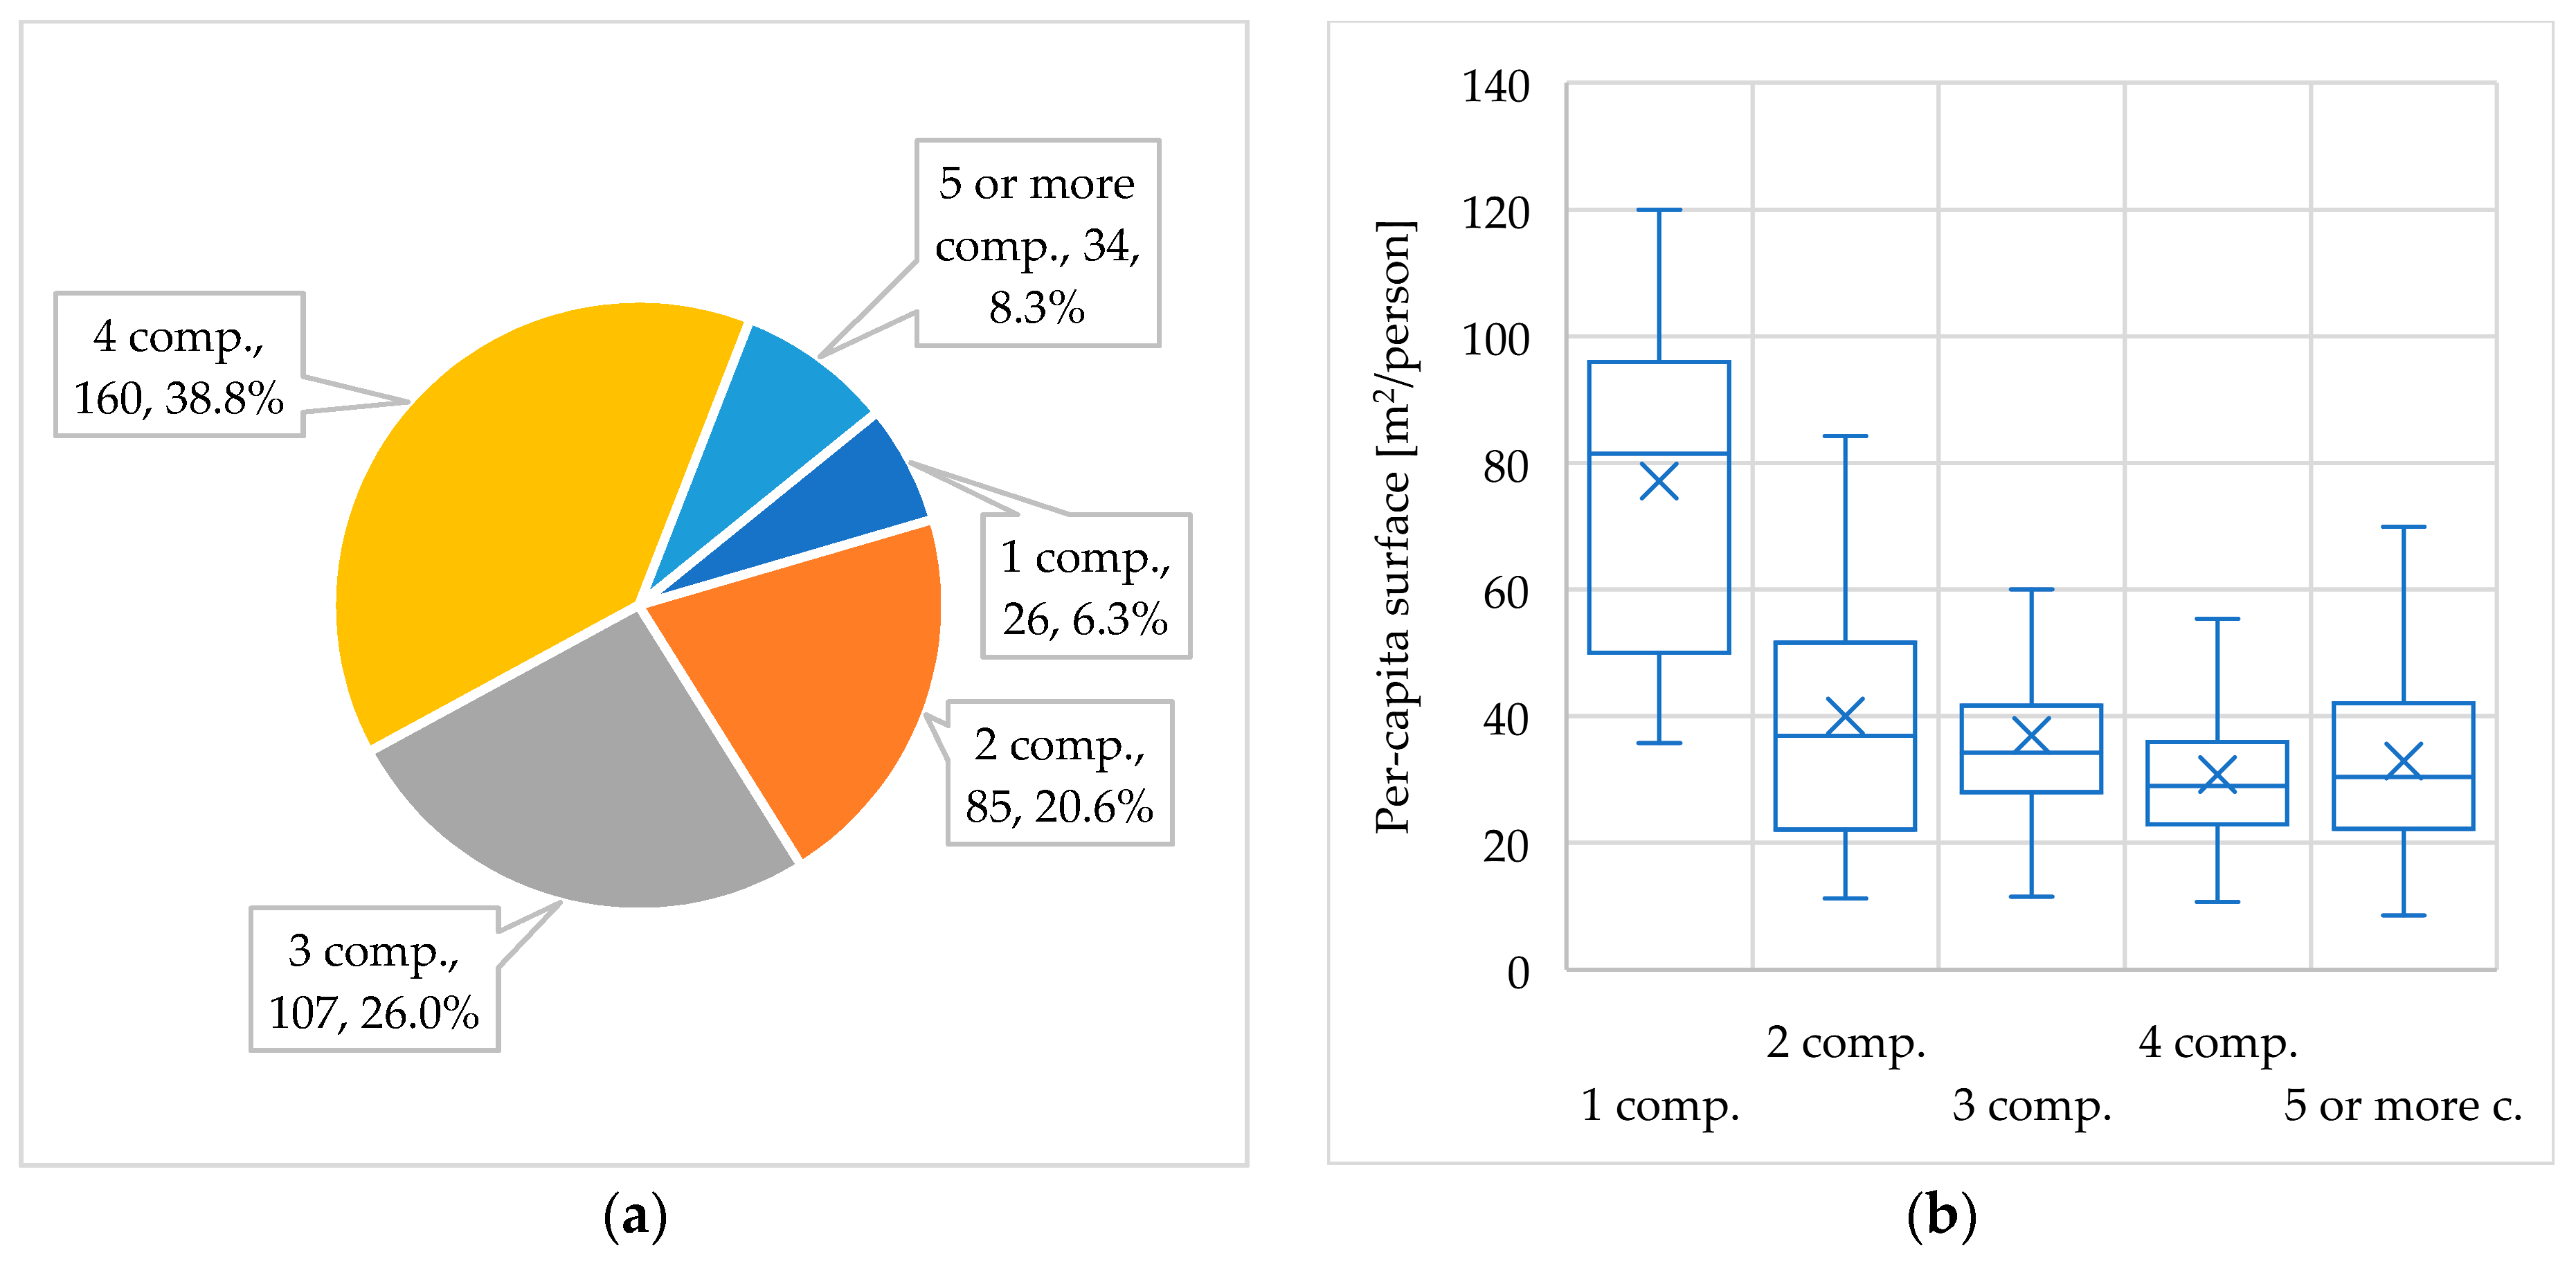
Figure 3a shows the apartments’ subdivision by the number of family members; the most recurrent classes consist of three people households and four people households, with shares equal to 26.0% and 38.8%, respectively. The per capita surface decreases as the number of family members increases (see Figure 3b), ranging from an average value of 77 m2/person for single-core households up to 31 m2/person for all those families consisting of four components.
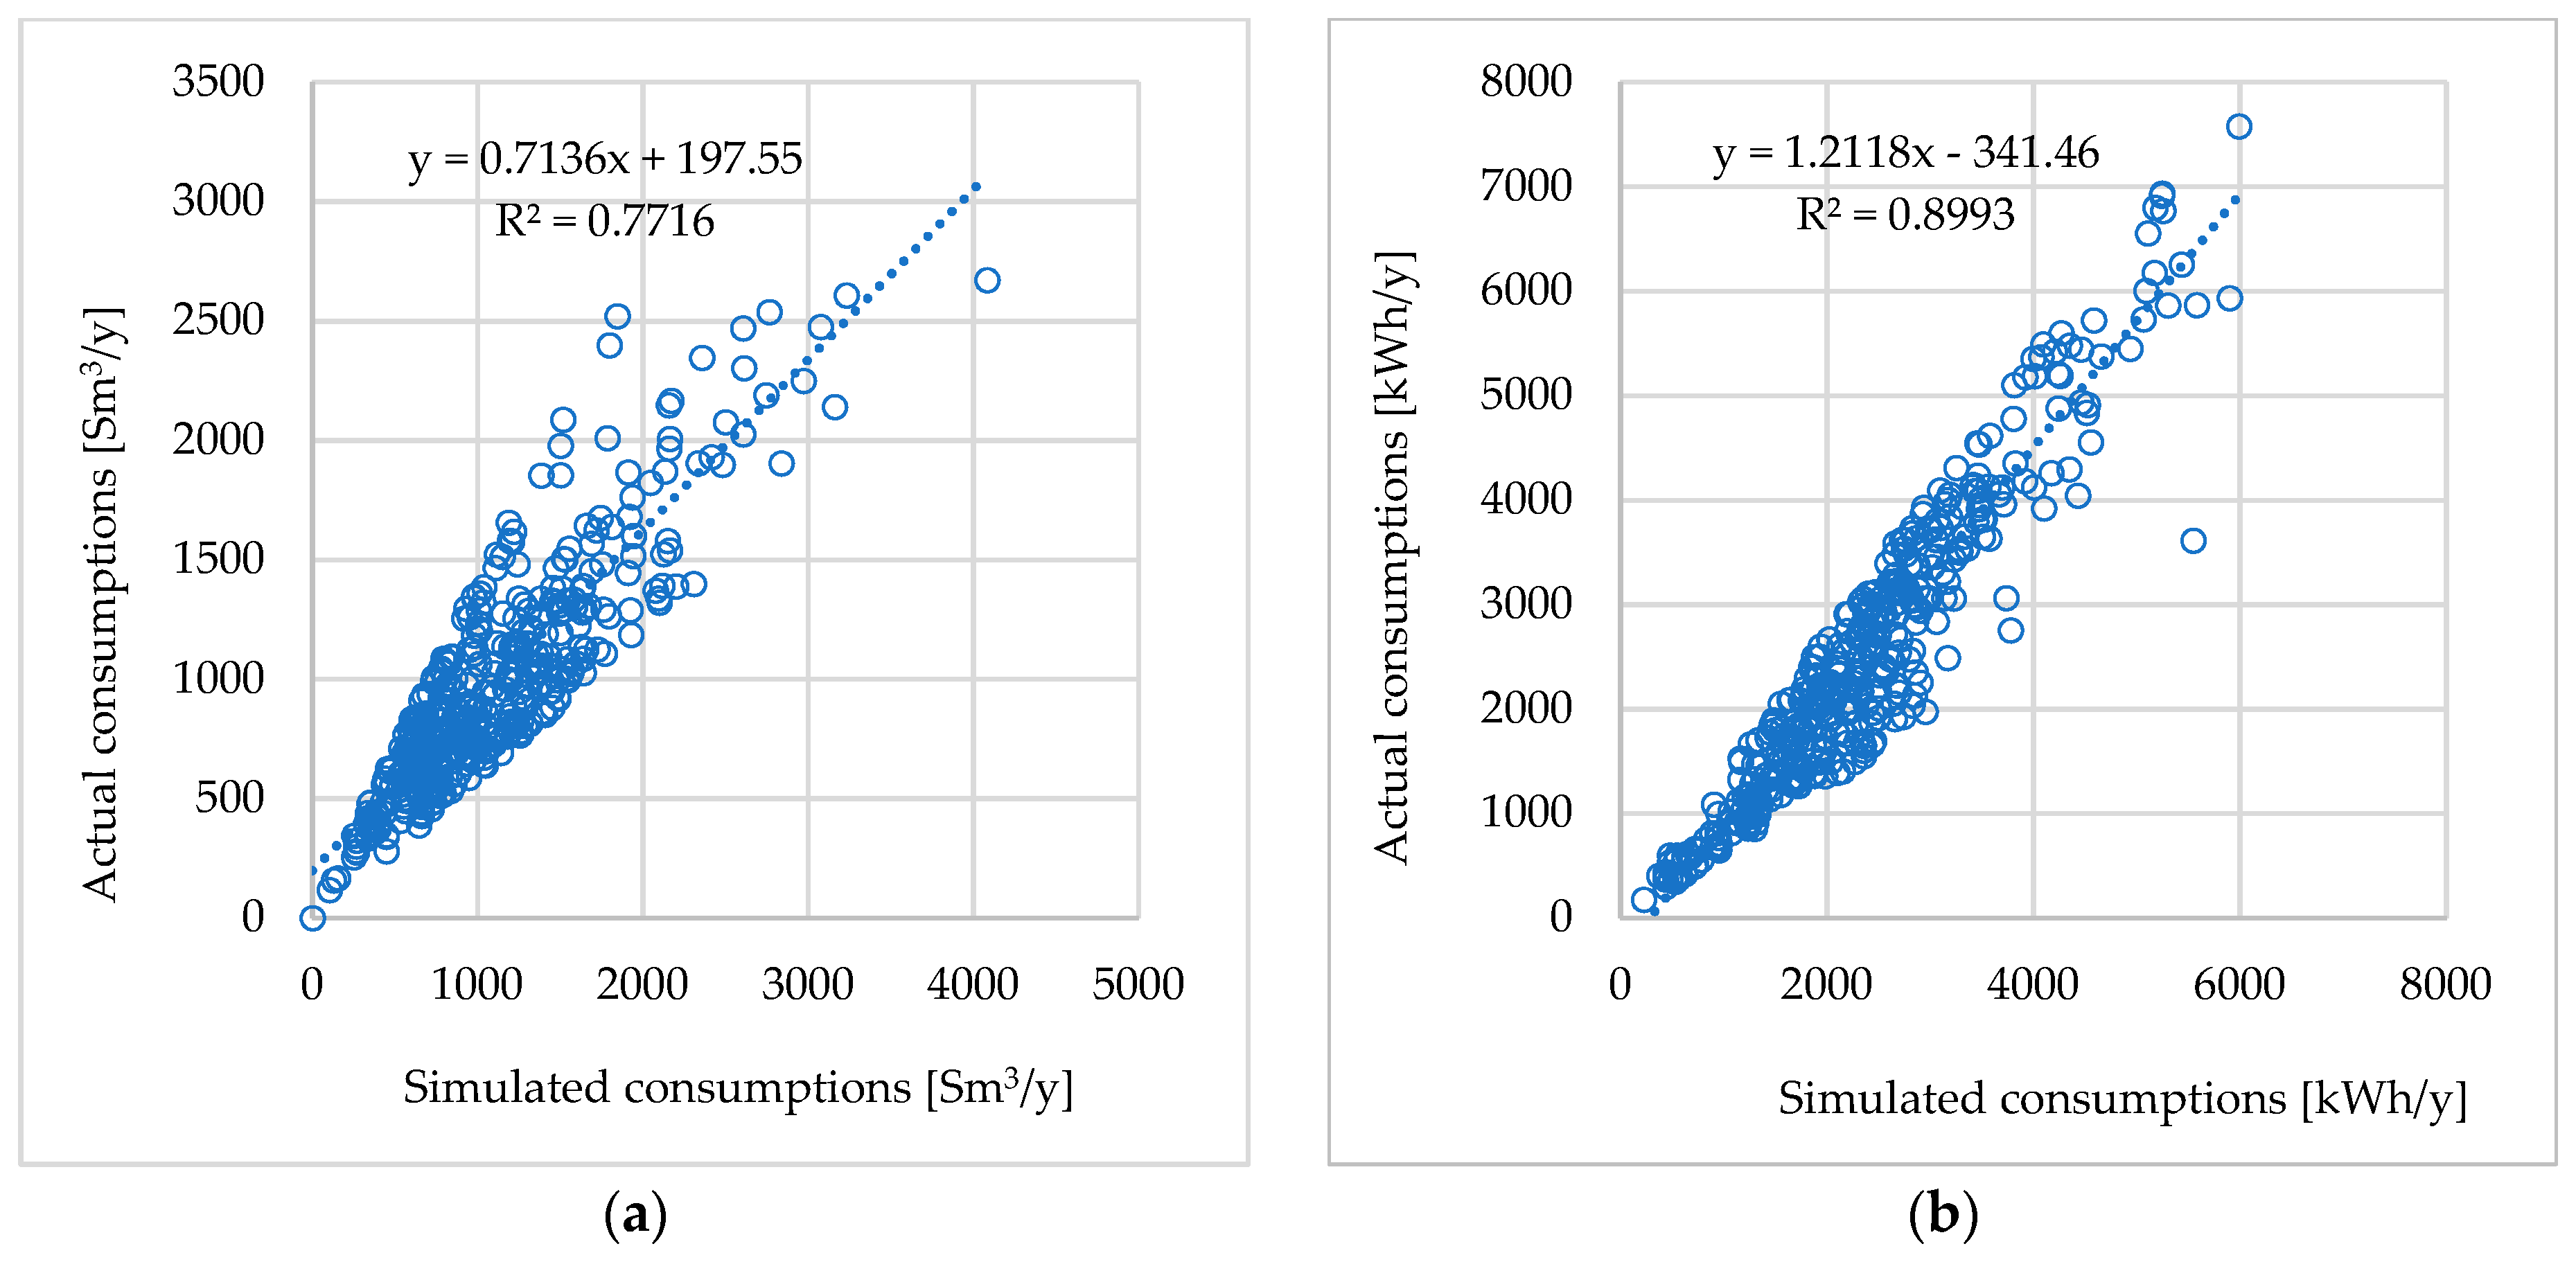
The questionnaire for data collection also includes a comparison between the simulated consumptions and the real ones which were entered by the user. Figure 4 shows the dispersions related to the natural gas (NG) volumes and the electricity needs; the predictive model for the electricity needs is characterised by a higher correlation coefficient than the NG one and they are equal to 0.8993 and 0.7716, respectively.
On the contrary, when the linear regressive analysis is used for both NG and electricity consumptions, the outcomes from the data forecasting model are characterized by large standard errors.
The yearly NG consumptions equation (expressed by Sm3/y) reads as follows:
where Sfloor denotes the dwelling floor surface and N is the number of occupants.
Similarly, for the yearly electricity consumptions (kWh/y) the analytical function is:
In addition, the R2 values and the standard errors are R2 = 0.3453, STDE = 475.01 and R2 = 0.2815, STDE = 924.86, respectively.
Looking at those values, it is possible to note how the traditional statistic method is less reliable than the developed calculation code within the Excel spreadsheet.
Finally, a parametric assessment of electricity and gas consumptions was carried out, normalising all data by the number of components and the building floor surface. In detail, the per capita consumptions have been correlated to the number of components while the specific consumptions by unit of surface have been plotted as a function of building size classes. Those KPIs have been built in accordance with the current Italian building energy certification system, providing technical information related to the building characteristics and the occupants’ behaviour. Anyway, by rearranging those values it is possible to calculate the most common environmental and economic KPIs as reported in literature [60].
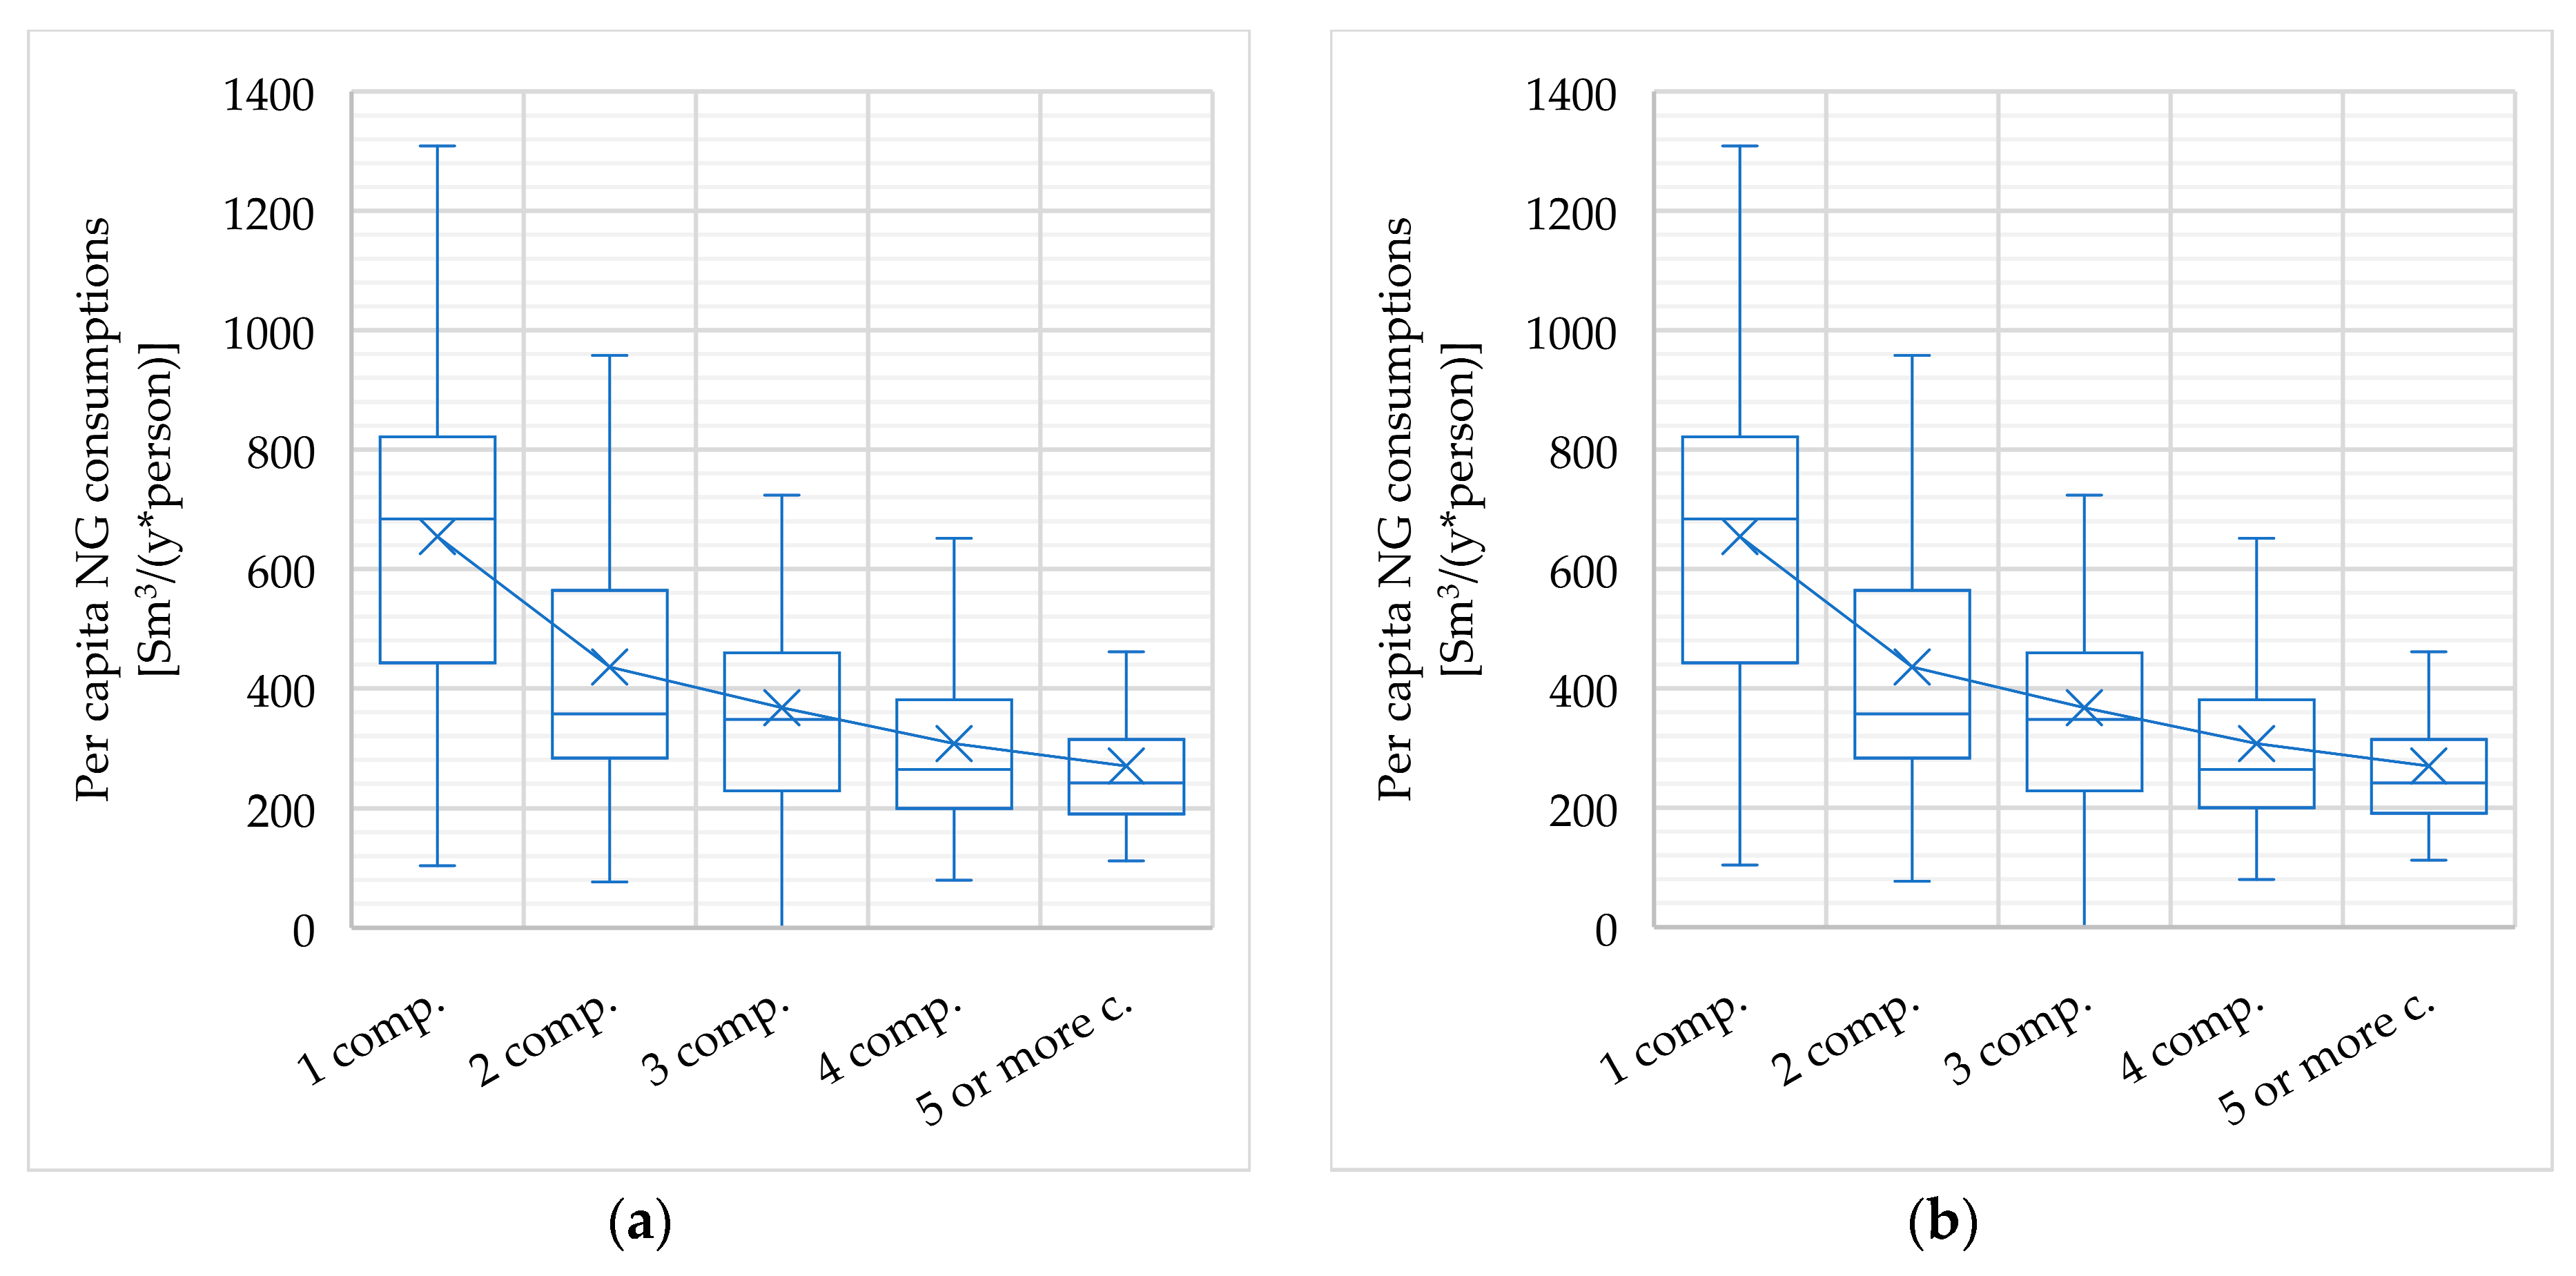
The average value of per capita NG consumption is equal to 368 Sm3/(y·person); as the family members increase (Figure 5), the NG per capita consumption lessens from 654 Sm3/(y·person) (one component) to 269 Sm3/(y·person) (five or more components). As regards the average value of per capita electricity consumption, it is equal to 772 kWh/(y·person); similarly, it decreases as the number of components increases, from 1184 kWh/(y·person) (one component) to 617 kWh/(y·person) (five or more components). Having said this, comparing Italy with other countries, it emerges that in the domestic sector, per capita electricity consumption is quite low. Indeed, the European average value is 1566 kWh/(y·person), while in the United States and Finland it exceeds 4000 kWh/(y·person) [14,61]. That demonstrates how the Italian residential sector is poorly electrified reflecting its dependence on fossil fuel -based technologies, especially for the heating purpose.
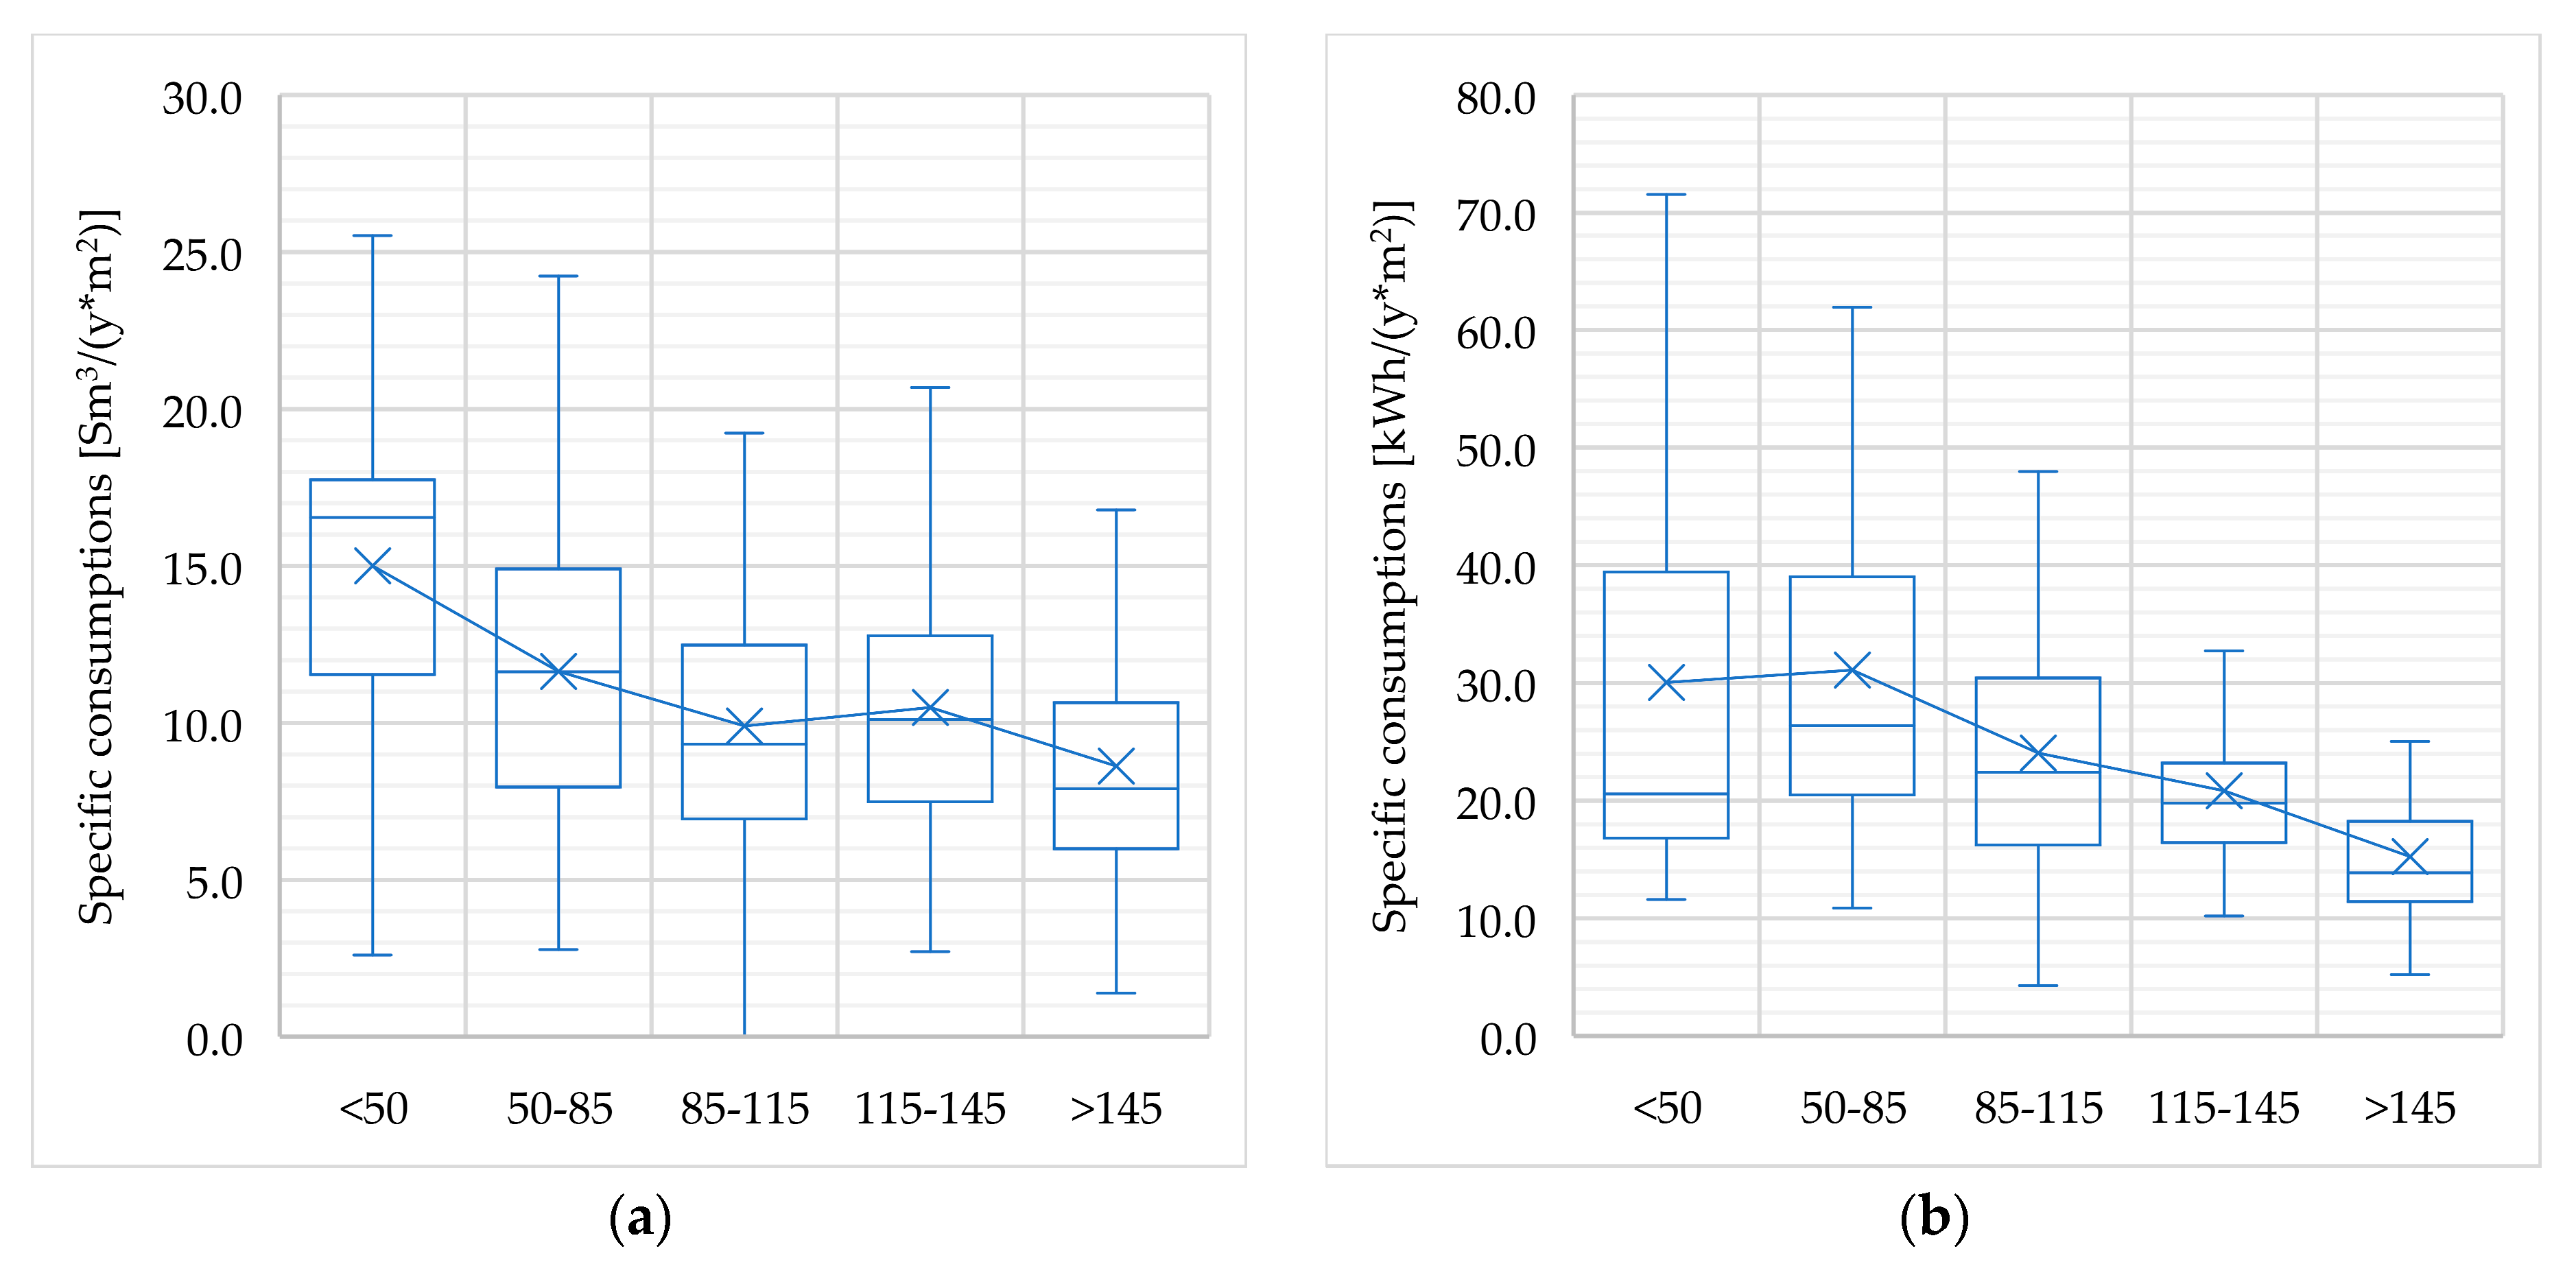
Referring to the normalised data by surface the curves trend are quite different as shown in Figure 6. Likewise, as the apartments size increases the NG specific consumption shrinks less rapidly from 15.0 Sm3/(y·m2) (small households) up to 8.6 Sm3/(y·m2) (large households); on the contrary, for the electric specific consumption it is possible to note that the first two classes show very close values, thereafter as the surface increases more, they goes down almost linearly. However, the highest specific electricity consumption is equal to 30.1 kWh/(y·m2) (small households) while the lowest is 15.2 kWh/(y·m2) (large households).
3.2. Consumption Breakdown by Services
The code used to perform simulations allows to subdivide the energy consumption by the home services (i.e., Heating, Cooling, DHW, Cooking, Refrigeration, Washing, Cleaning and Ironing, Lighting, Audio/Video, Computer/Internet, Personal Care, Other equipment).
The same peculiarities are not available in the recent literature [14], exception for outdated publications [62]. Yet, quite similar results are based on estimation methods associated to the potential demand calculation [63].
Table 3 shows the services widespread within the reference homes; some of those services are present in all homes (i.e., Heating, DHW, Cooking, Refrigeration, Lighting); other services are present only 95% of samples (i.e., Washing, Cleaning and ironing, Audio/Video, Computer/Internet, Personal Care); equipment for cooling purpose are installed only in 275 homes (68.8%).
As regards the heating systems, they are mainly autonomous (72.8%). Furthermore, the NG is the most widely used energy carrier in heating (98.8%) and in domestic hot water preparation (85.2%) as well, given that very often the same heat generator supplies both services. The hobs are generally gas-fired (98.1%), while the ovens are largely electric (92.7%).
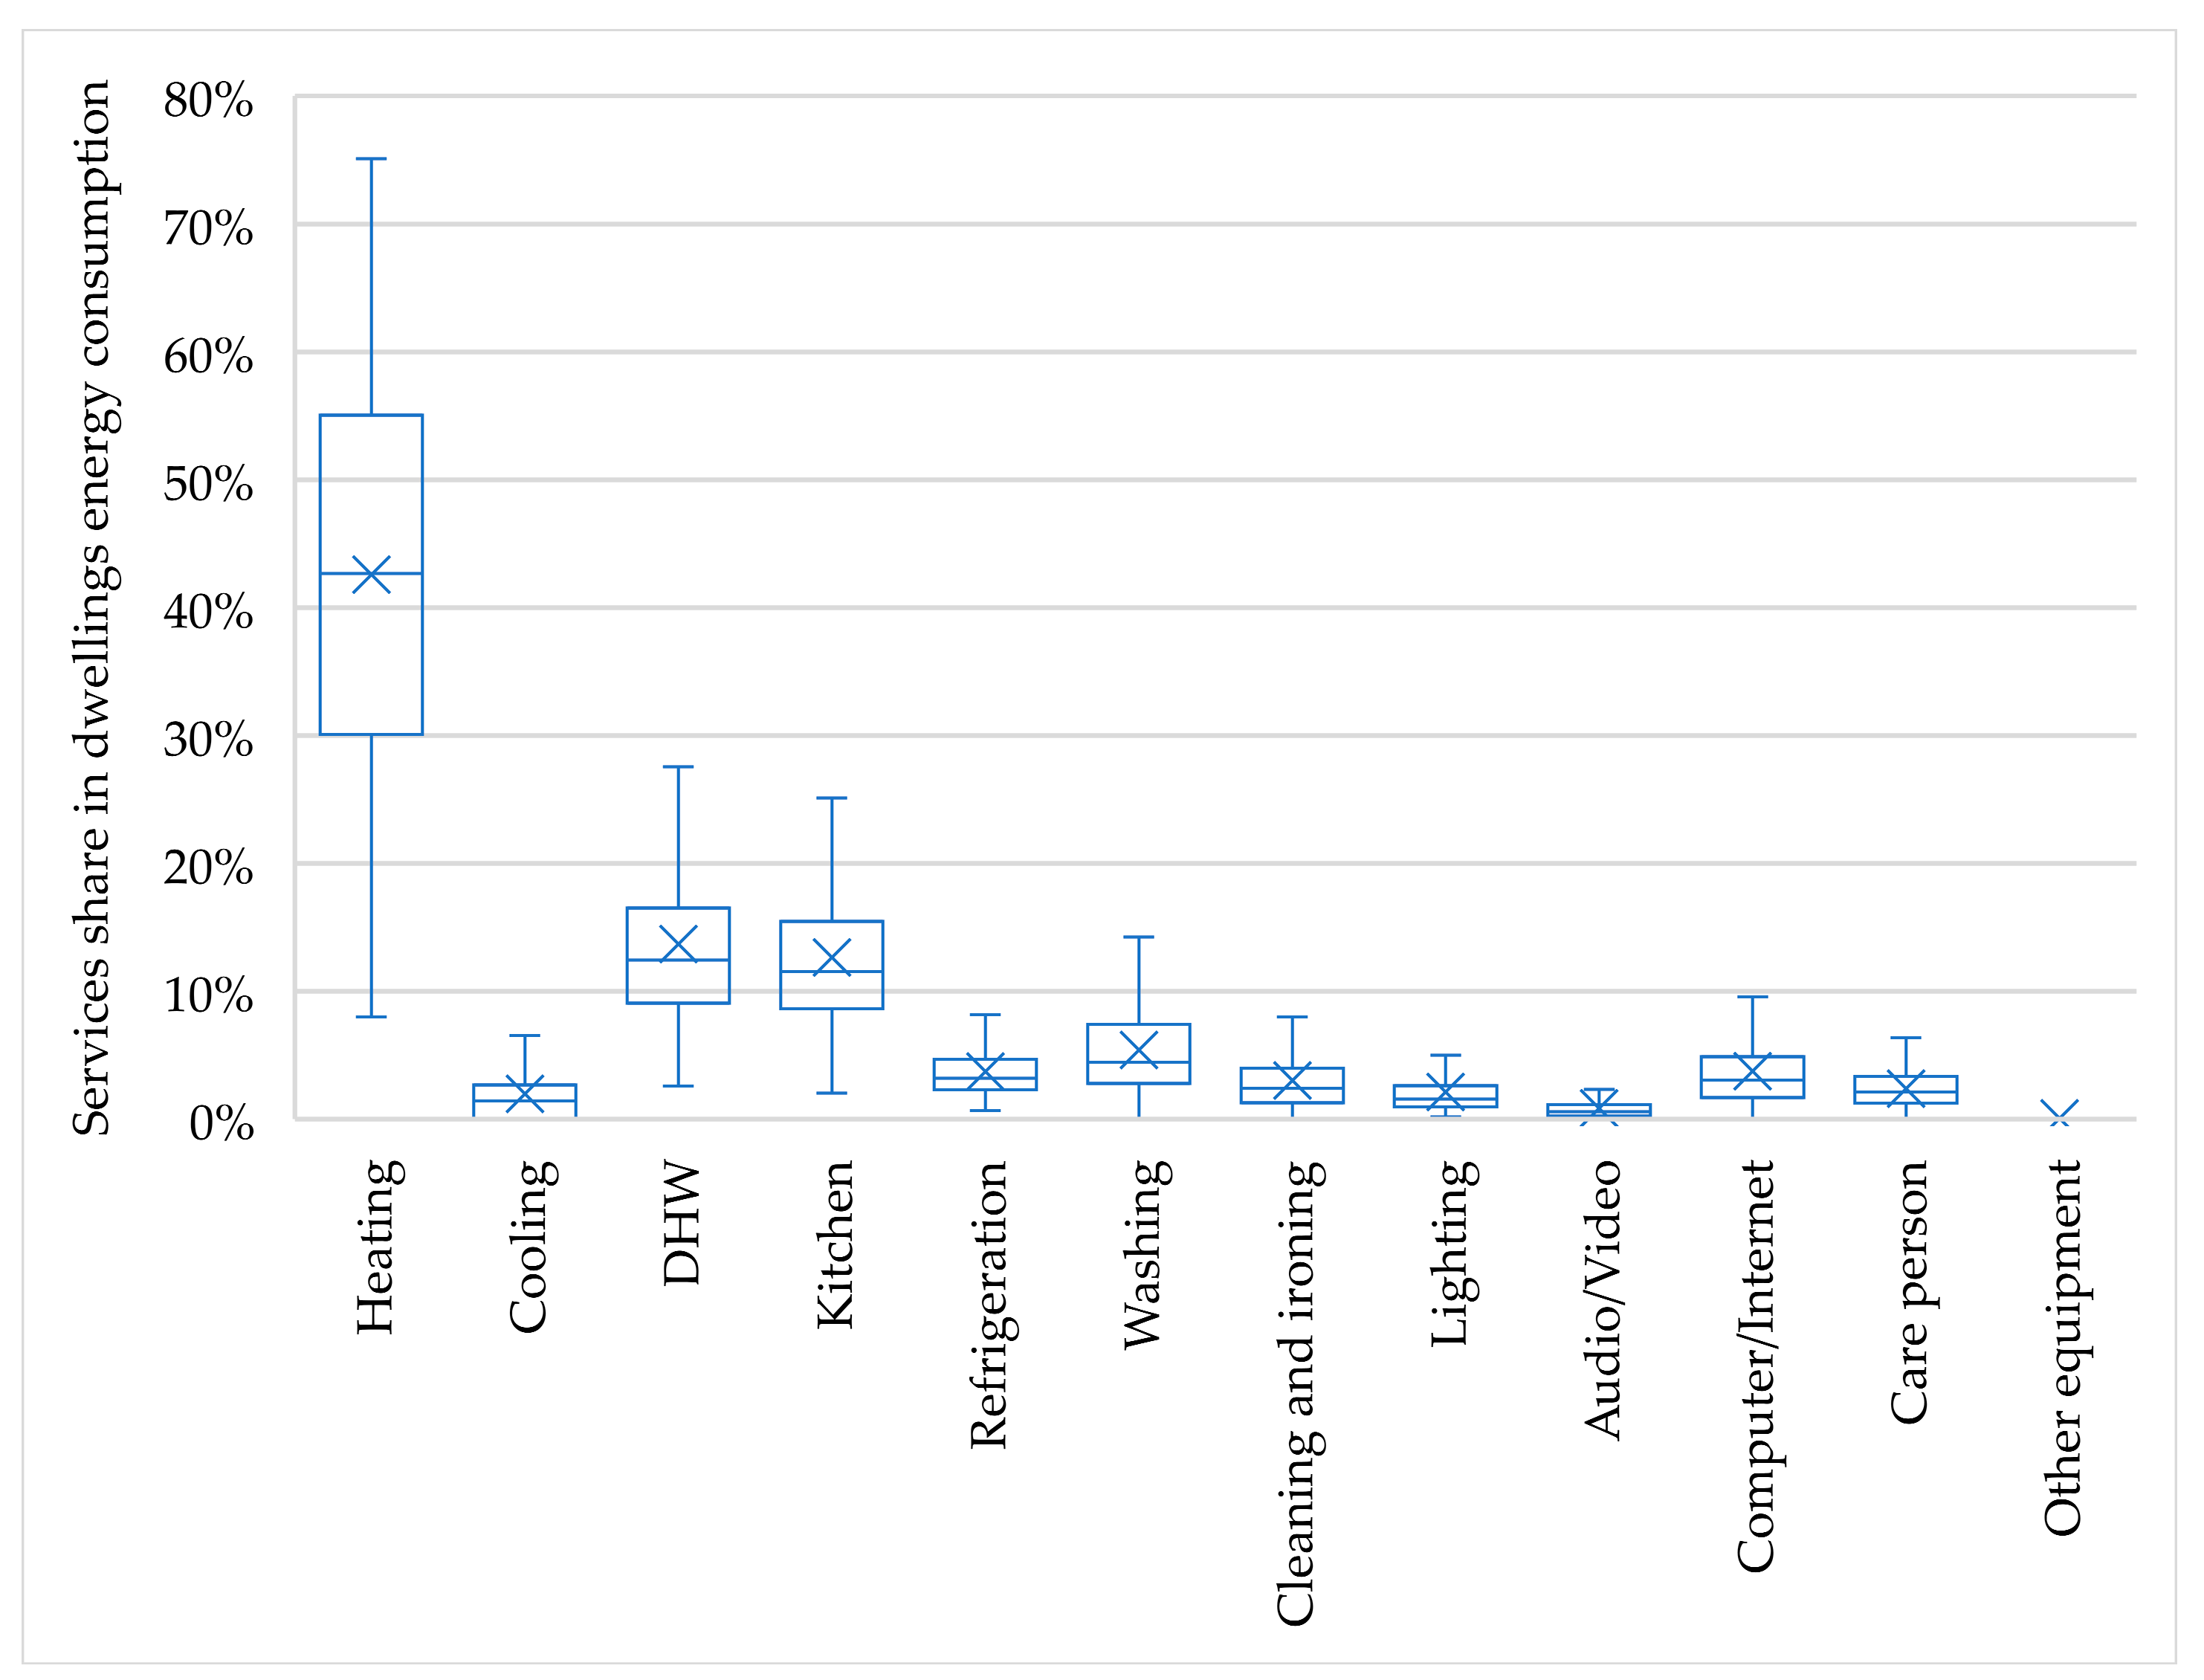
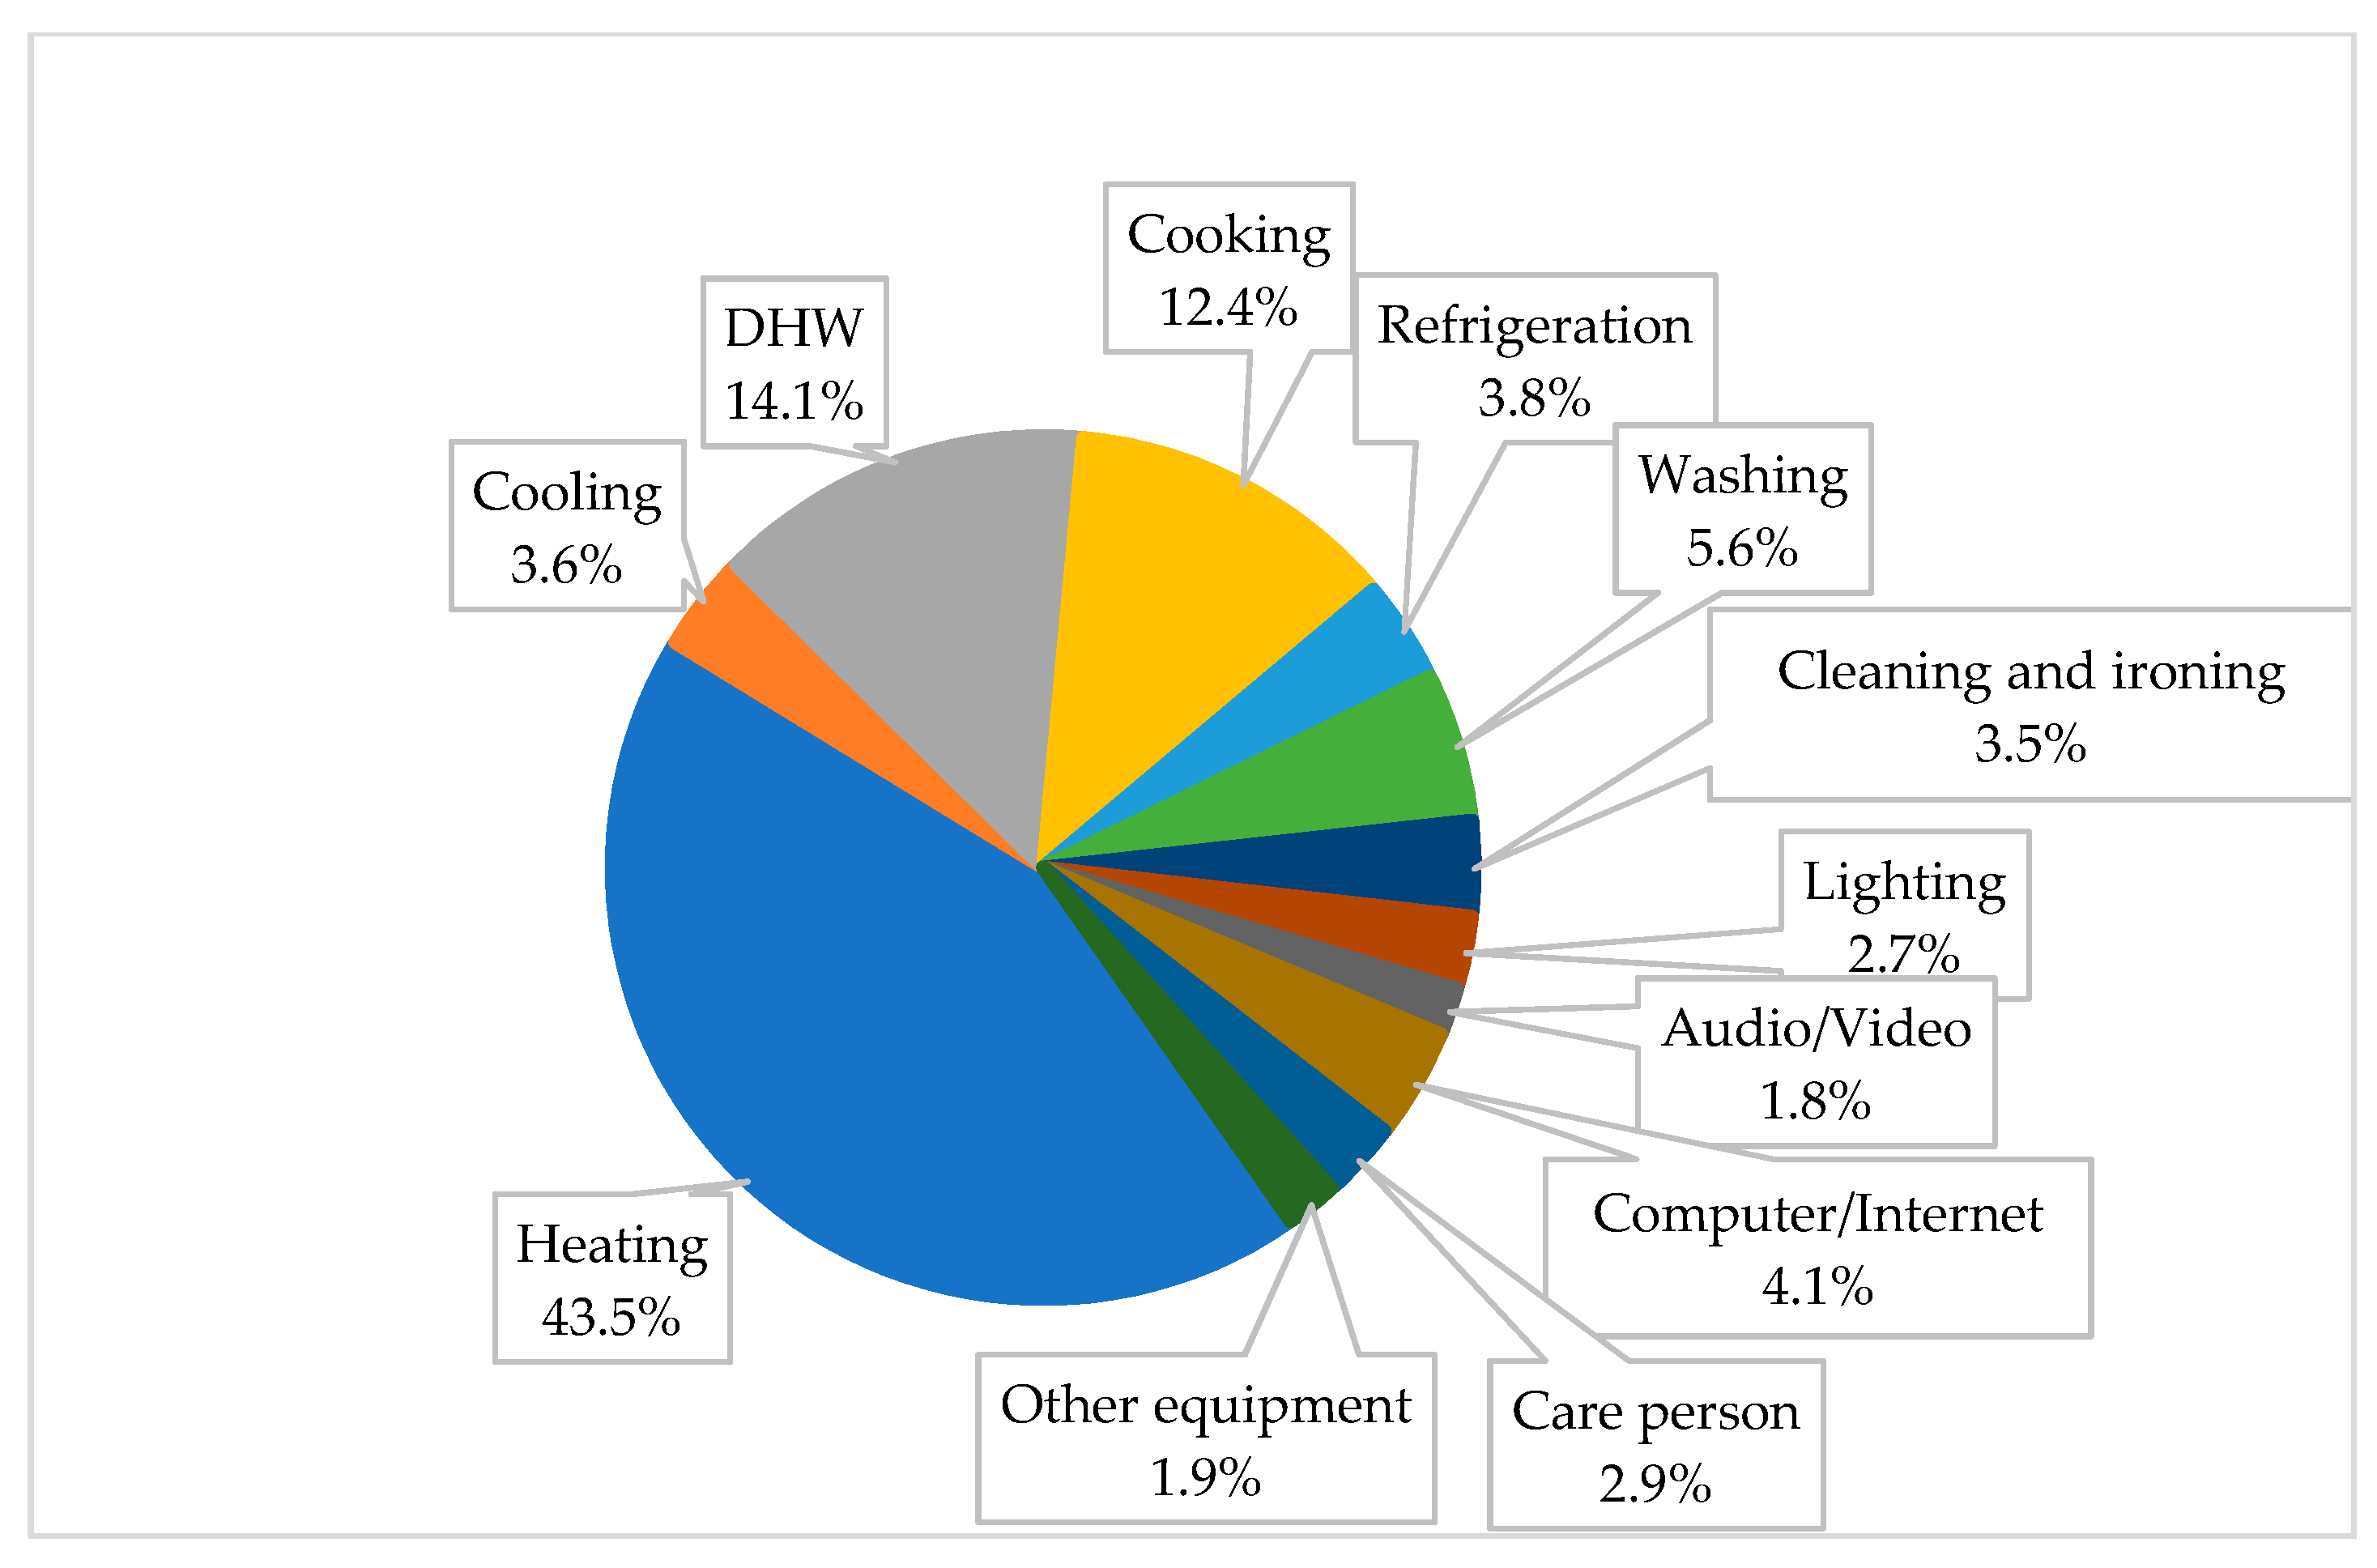
The services share in the overall home consumption are based on the primary energy values and it has been reported in Figure 7 and Figure 8. Heating is the service characterised by the highest share (on average it is equal to 43.5%), showing a wide variability, due to the different climatic conditions, to the geometric and physical characteristics of buildings envelope. Among the other services, only DHW (14.1%) and Cooking (12.4%) exceed the thresholds of 10%, while for the washing service the average is limited to 5.6%; all other services have a share less than 5%.
In the use of the questionnaire several difficulties arose, mainly due to the number of required inputs. That issue discouraged the user to proceed with the compilation in many cases.
Hence, a questionnaire reformulation is to be studied, aimed at eliminating the redundant information which weakly affects the results, according to what is emerged by the previous analysis.
3.3. Potential of Flexibility for the End-Esers
Starting from the simulation outputs, the potential of flexibility associated to the domestic users has been evaluated, searching for the storable loads and the shiftable loads within the typical households’ energy uses.
In Italy, the percentage of electricity consumption in domestic sector is equal to 26.1%; in other countries that indicator can get higher values, such as 64% in Finland and 52.5% in France [14,61].
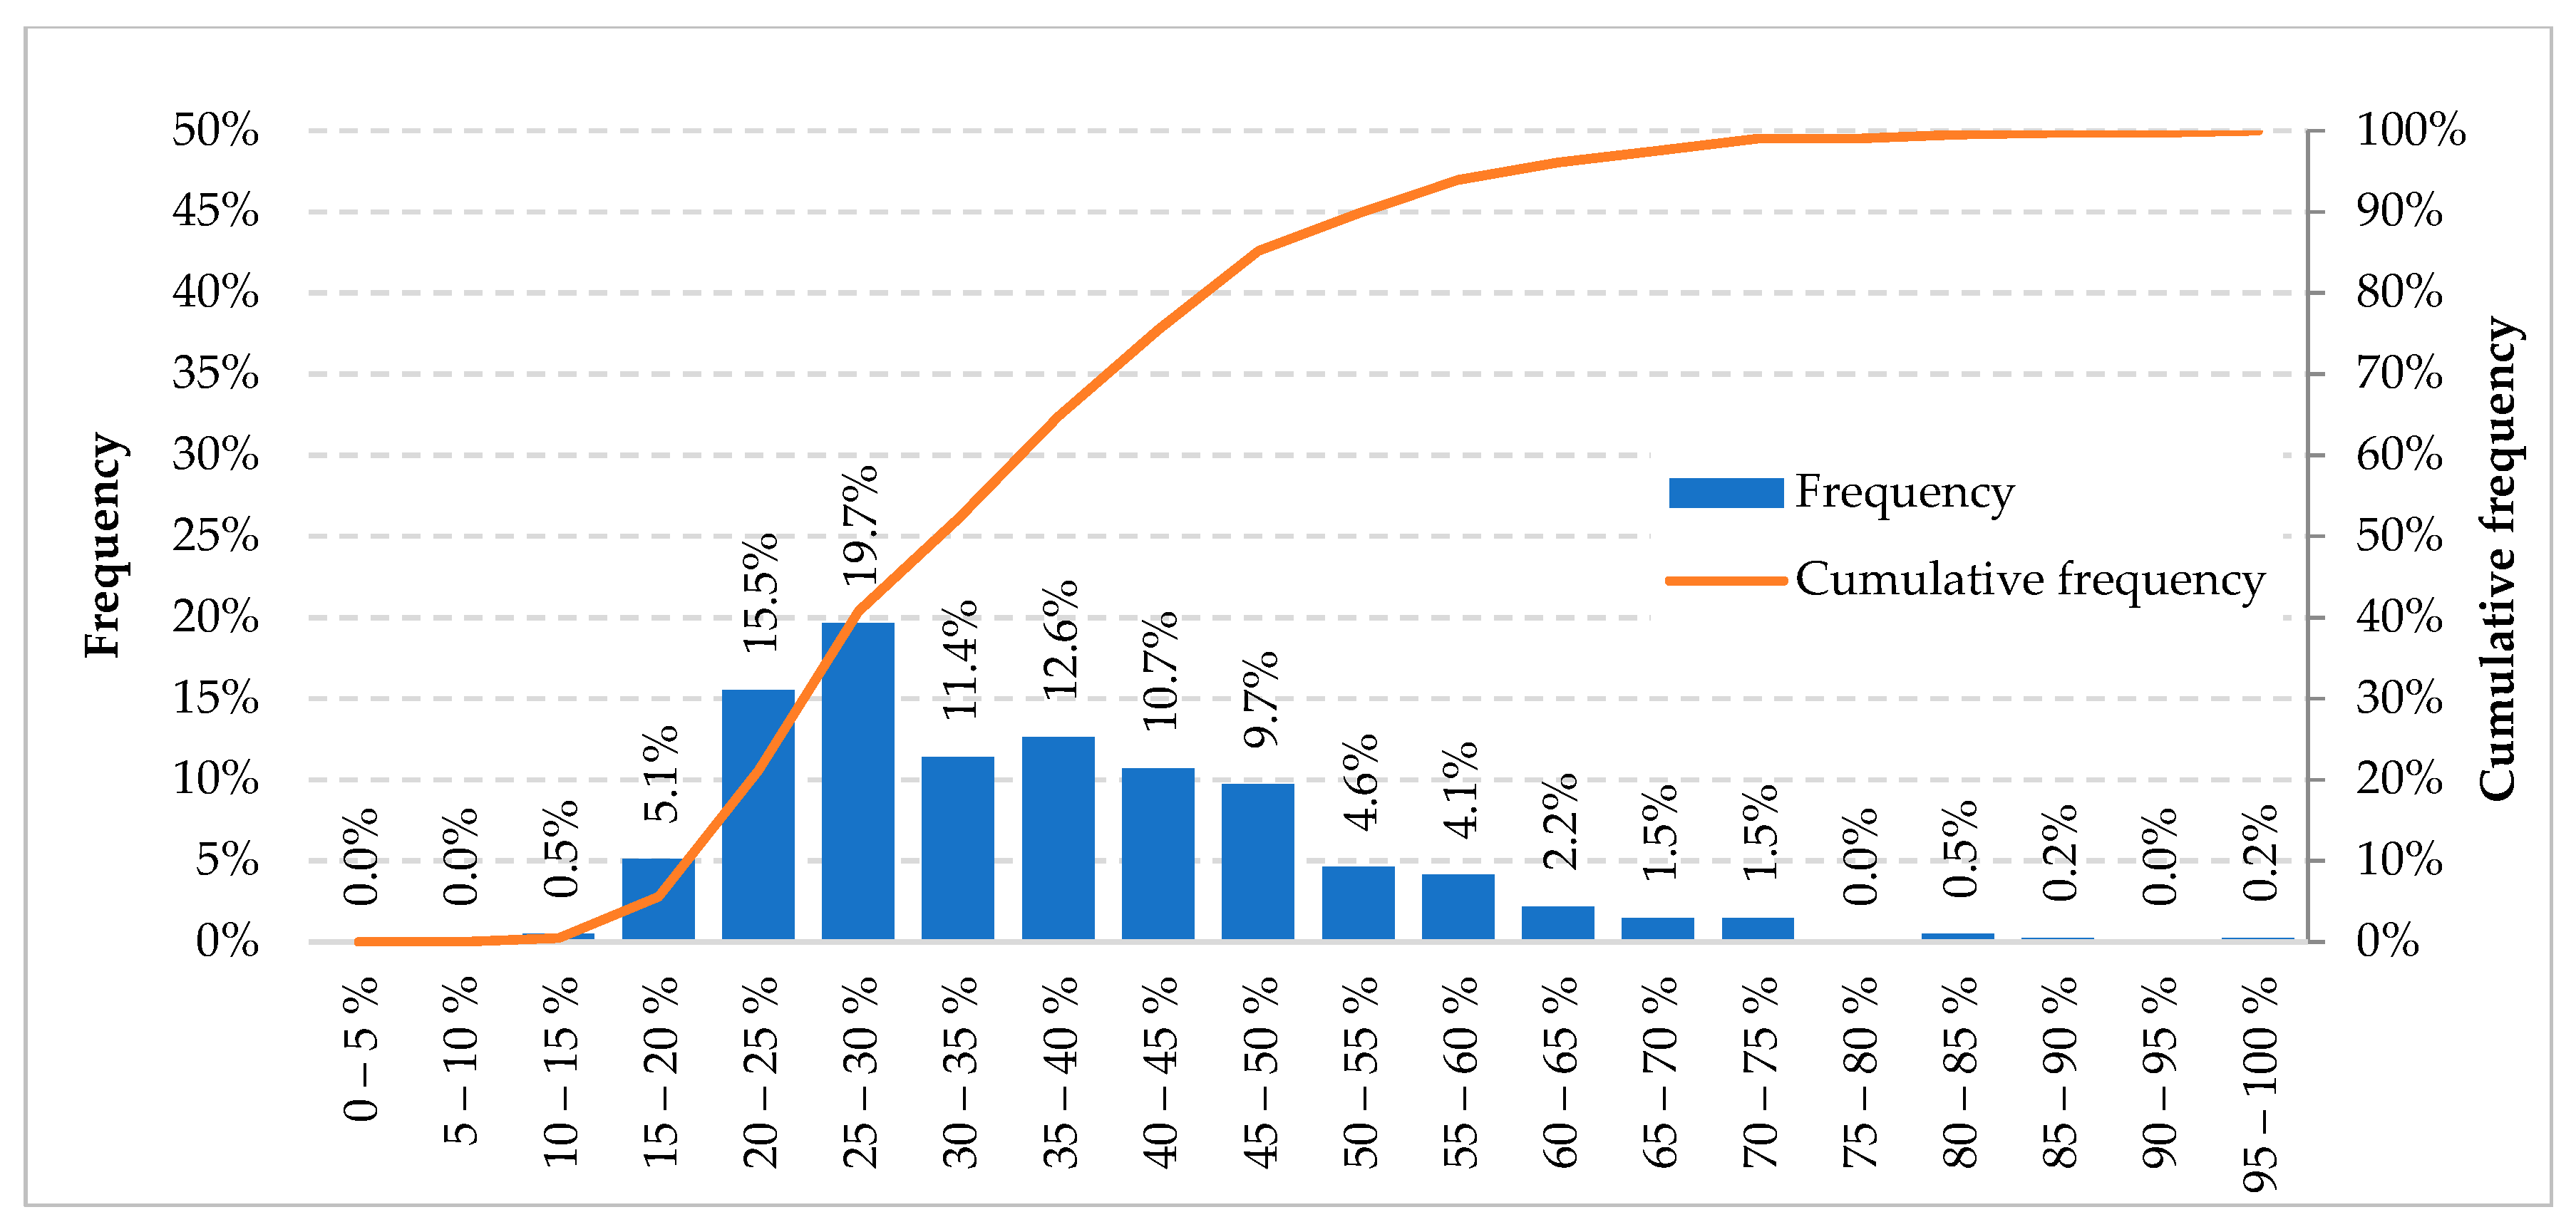
The collected data by the online questionnaires confirm the low electrification degree of Italian residential users (see Figure 9). Nevertheless, referring to the analysed statistical sample, the average electrification degree is equal to 36.5%, resulting therefore greater than the aforementioned value. Moreover, only 14.8% of those dwellings exceed that average value showing an electrification degree higher than 50%, while only one home gets the 100%.
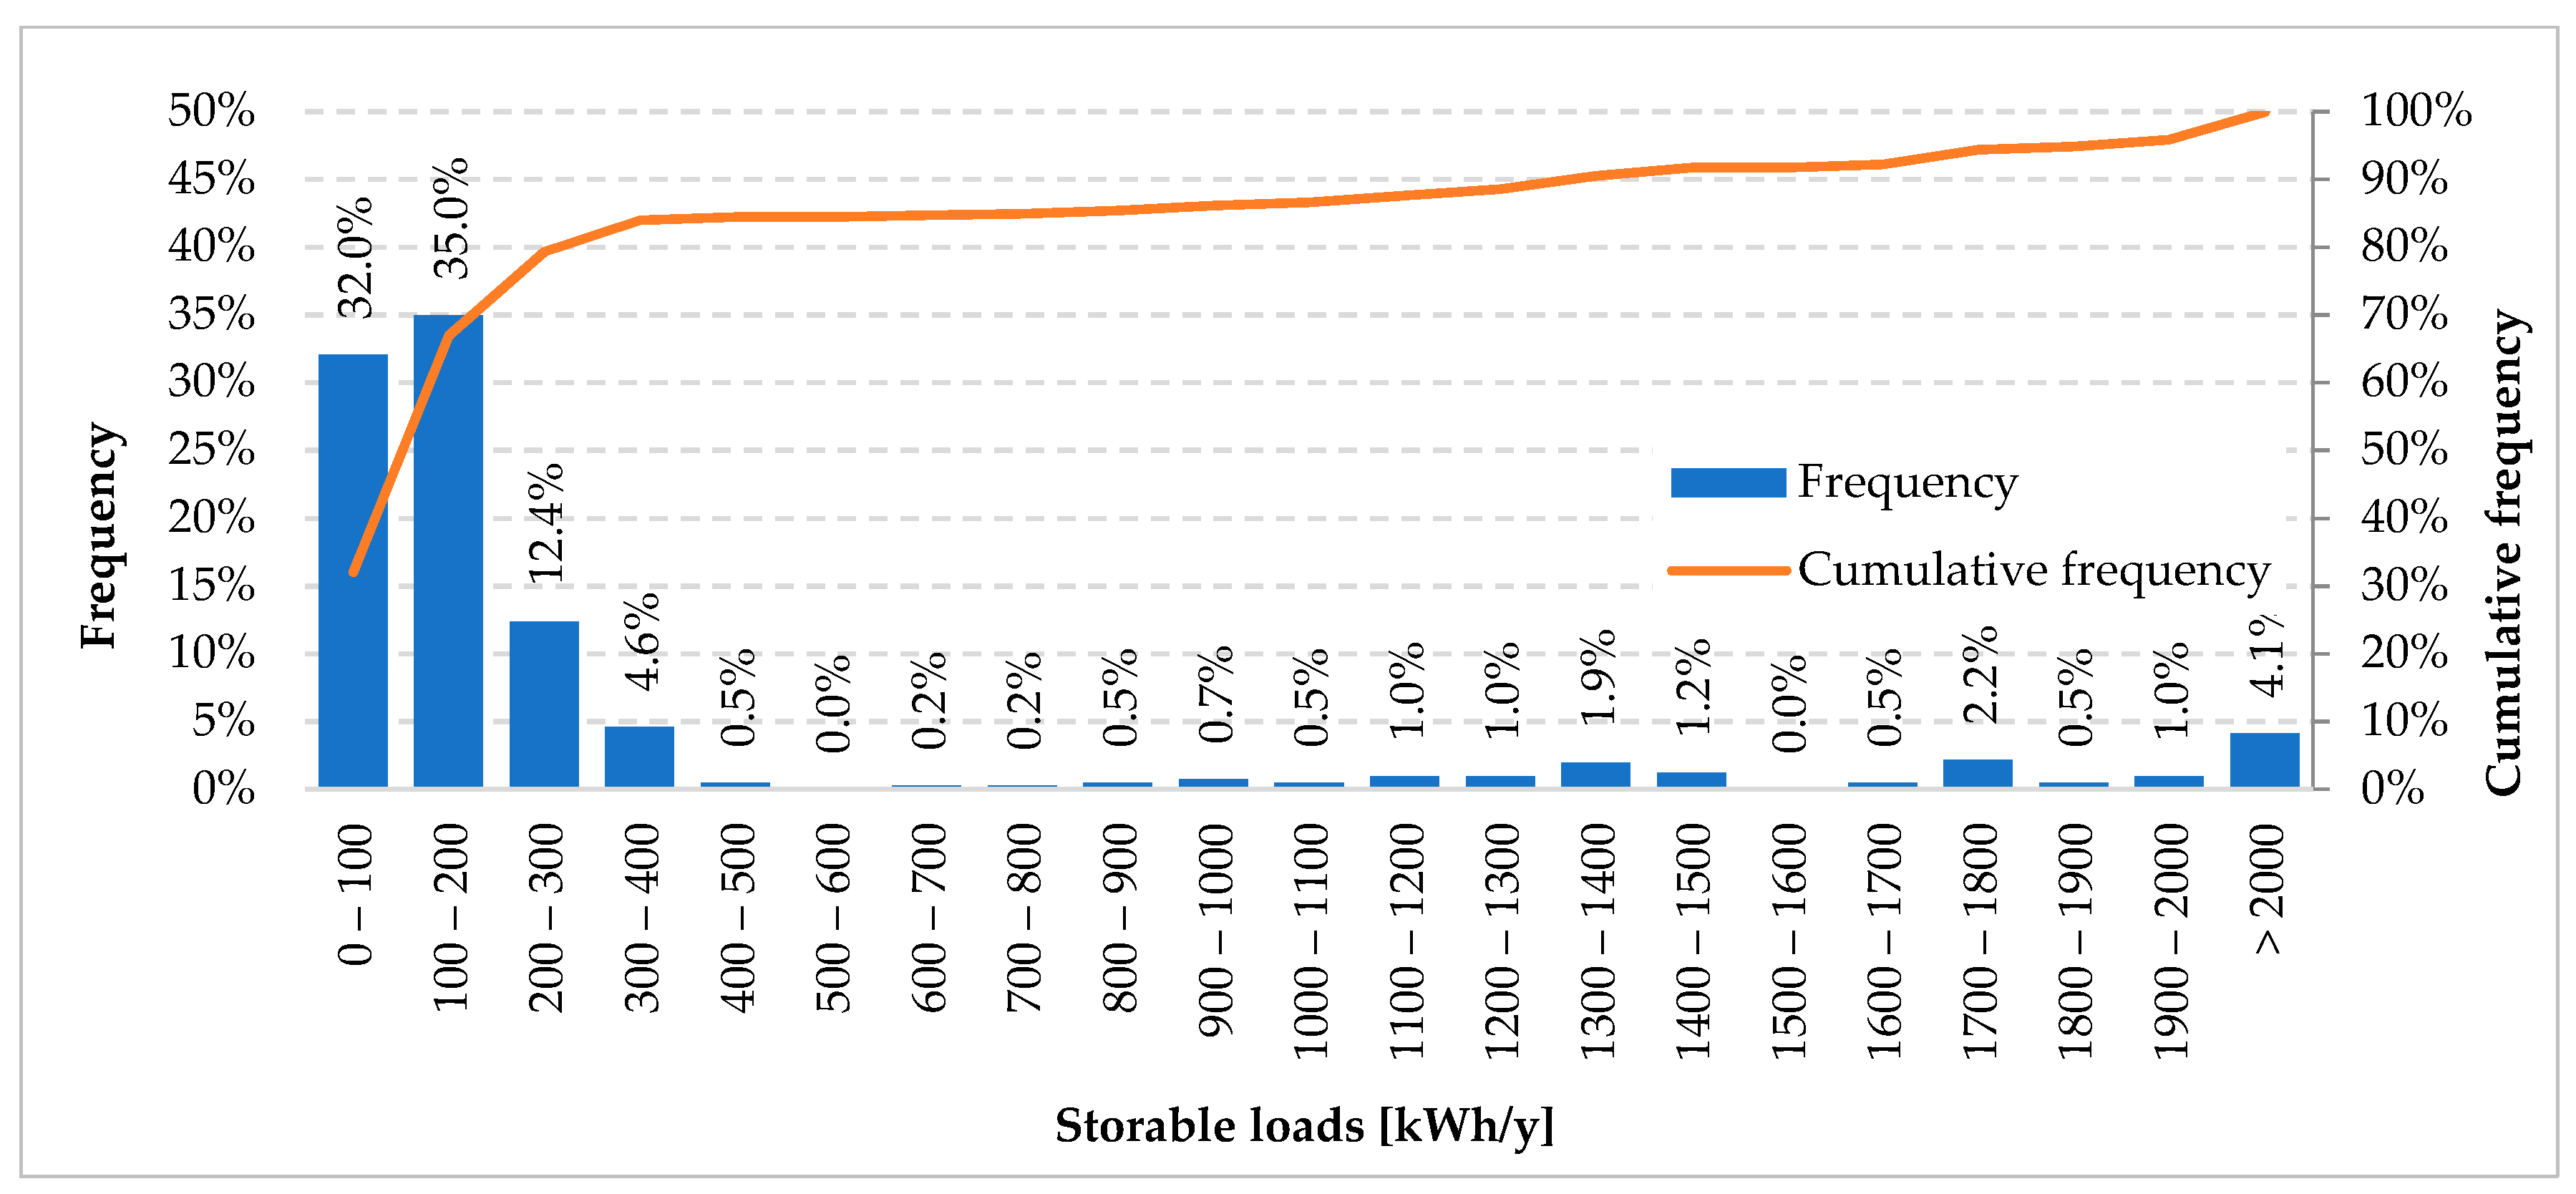
According to the electrical loads’ classification in Section 2, both storable and shiftable loads have been estimated. Figure 10 depicts the frequency analysis related to the storable loads associated to the statistical sample. On average, storable loads of 381 kWh/y can be identified; most homes (84.0%) are characterised by storable loads less than 400 kWh/y, while 67.0% shows storable loads lower than 200 kWh/y. It is important to highlight how the larger storable loads value can be found in all of those dwellings where the DHW is produced by electric water heater or where the equipment for summer air conditioning are mostly used.
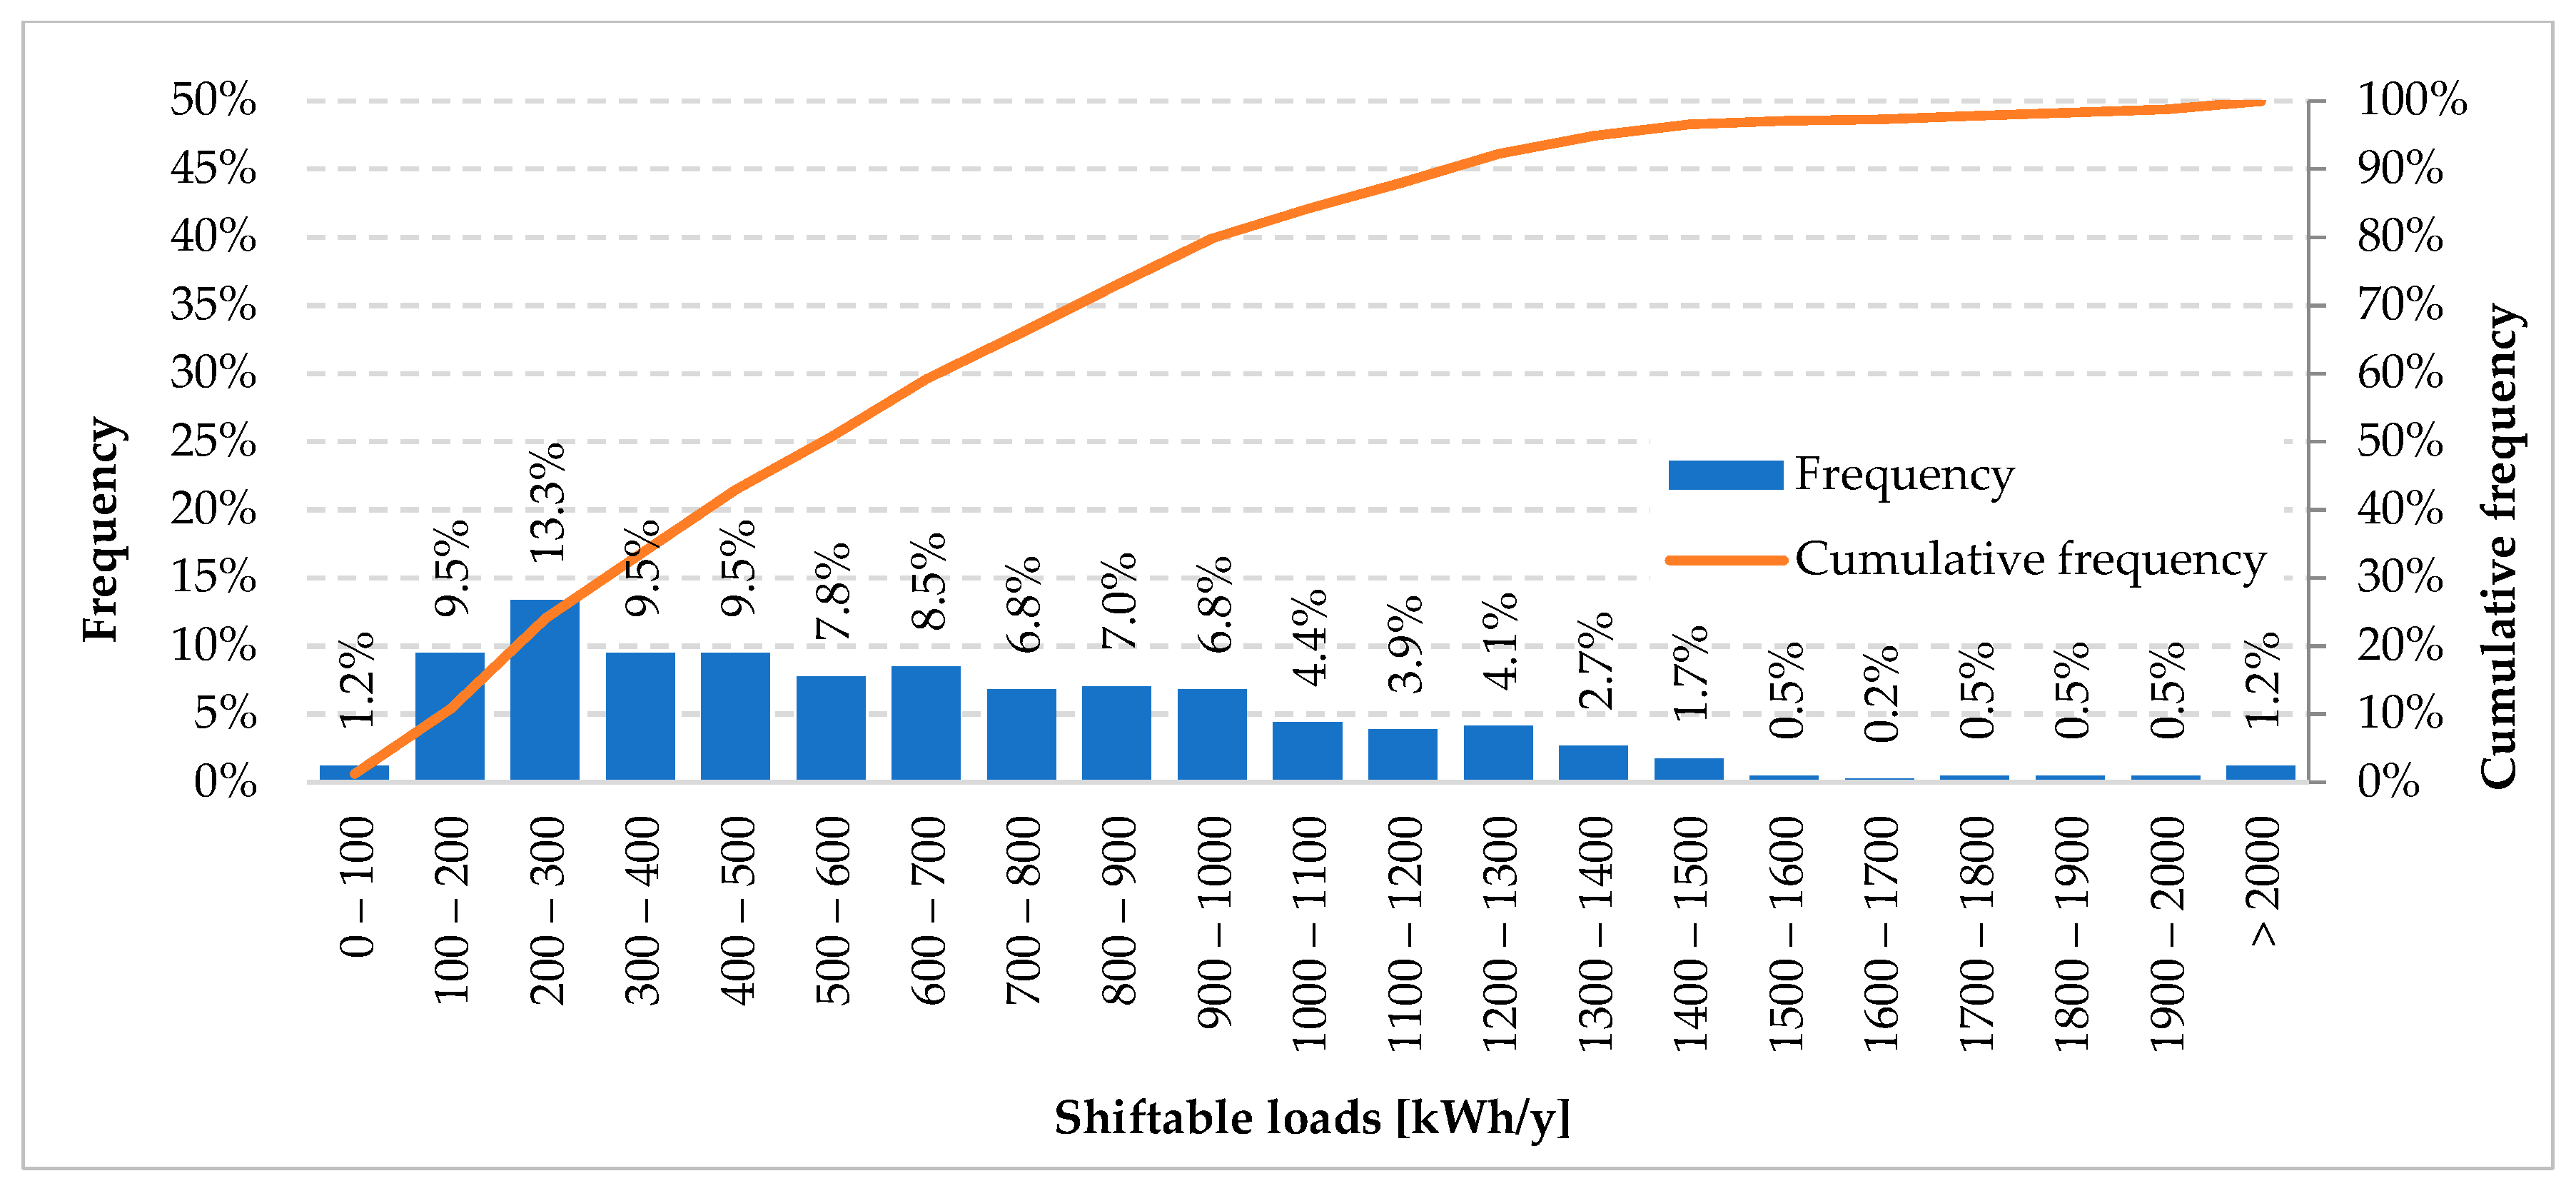
By the same analytical approach Figure 11 shows the frequency analysis related to the deferrable loads. From data, it emerges that statistical sample is characterised by a shiftable loads average value equal 669 kWh/y. Specifically, most homes (50.7%) present a shiftable loads amount less than 600 kWh/year; in addition, where washing machines, dishwashers, tumble dryers are widely used, the higher shiftable loads value can be registered.
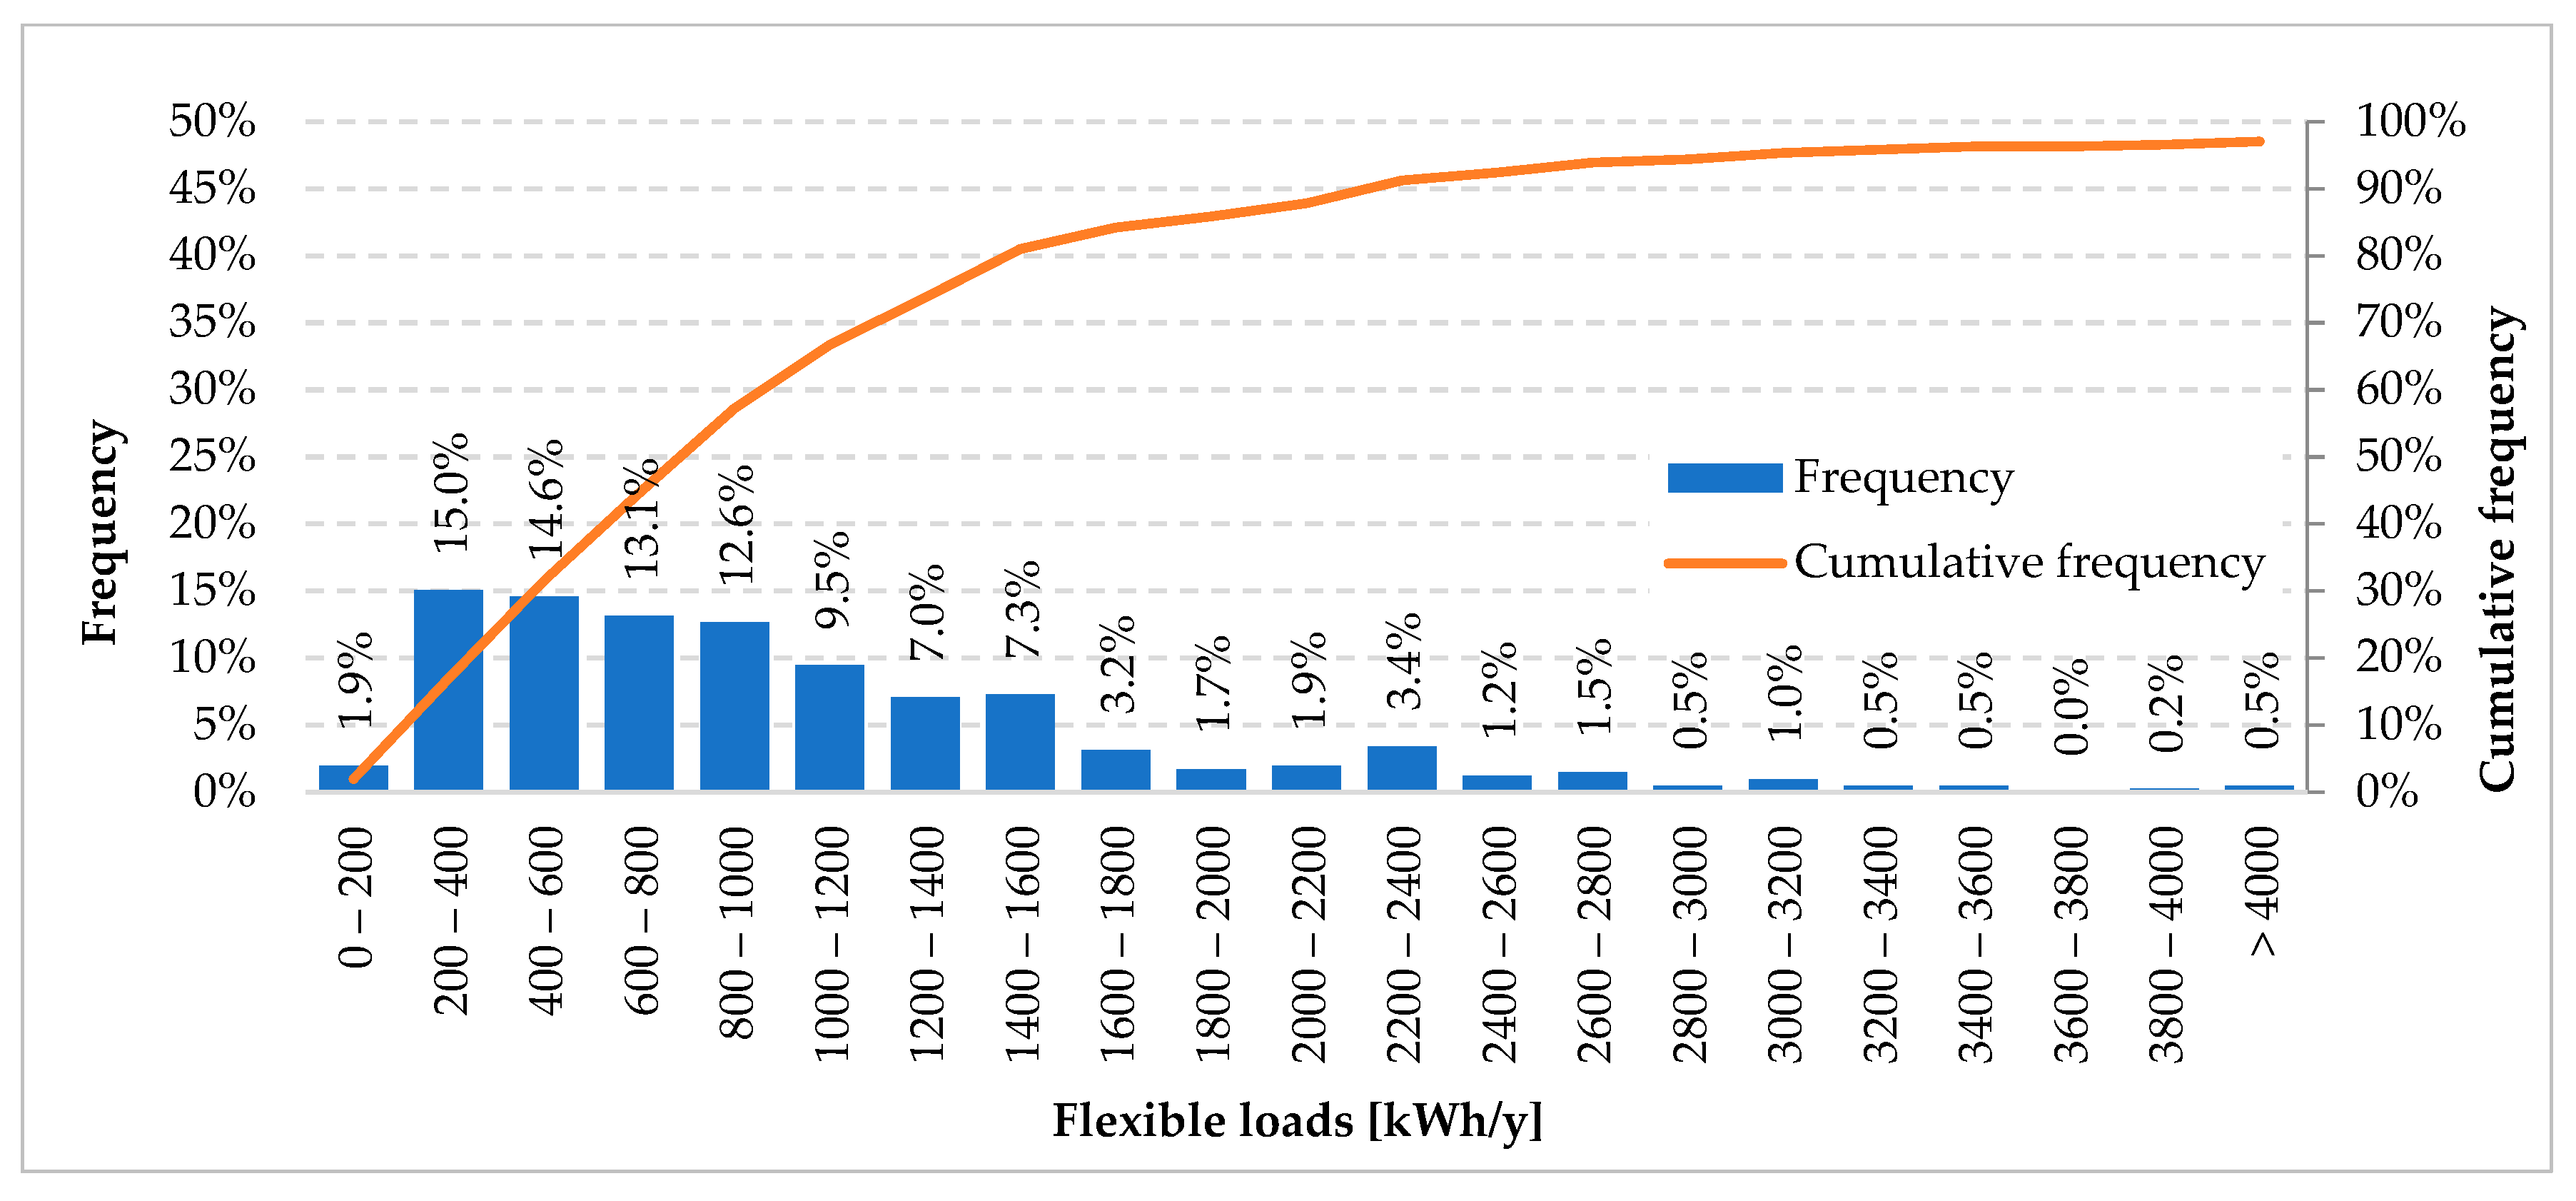
Finally, Figure 12 reports the so-called flexible loads, by adding up the storable loads and the shiftable ones. Therefore, it basically represents the dwellings potential of flexibility showing an average value equal to 1042 kWh/y. Notwithstanding, only 31.6% of homes have the flexible loads value just below 600 kWh/y; 57.3% of homes have the flexible loads lower than 1000 kWh/y, whereas only 12.1% can get amounts higher than 2000 kWh/y.
3.4. Evolutionary Scenarios Hailing from Small Maintenance Interventions
In order to verify the flexible loads temporal stability in the residential sector, eight different evolutionary scenarios have been presented and simulated. Those scenarios take into account multiple small maintenance interventions characterised by low capital expenditure (i.e., lower than 2000 €). In detail, each intervention can be motivated either by the normal equipment change at the end of technical life or by the will to adopt a non-invasive energy requalification. Table 4 summarises all actions that have been accounted for. In all cases, the existing equipment replacement have been simulated having considered the identical ones characterised by enhanced energy performance.
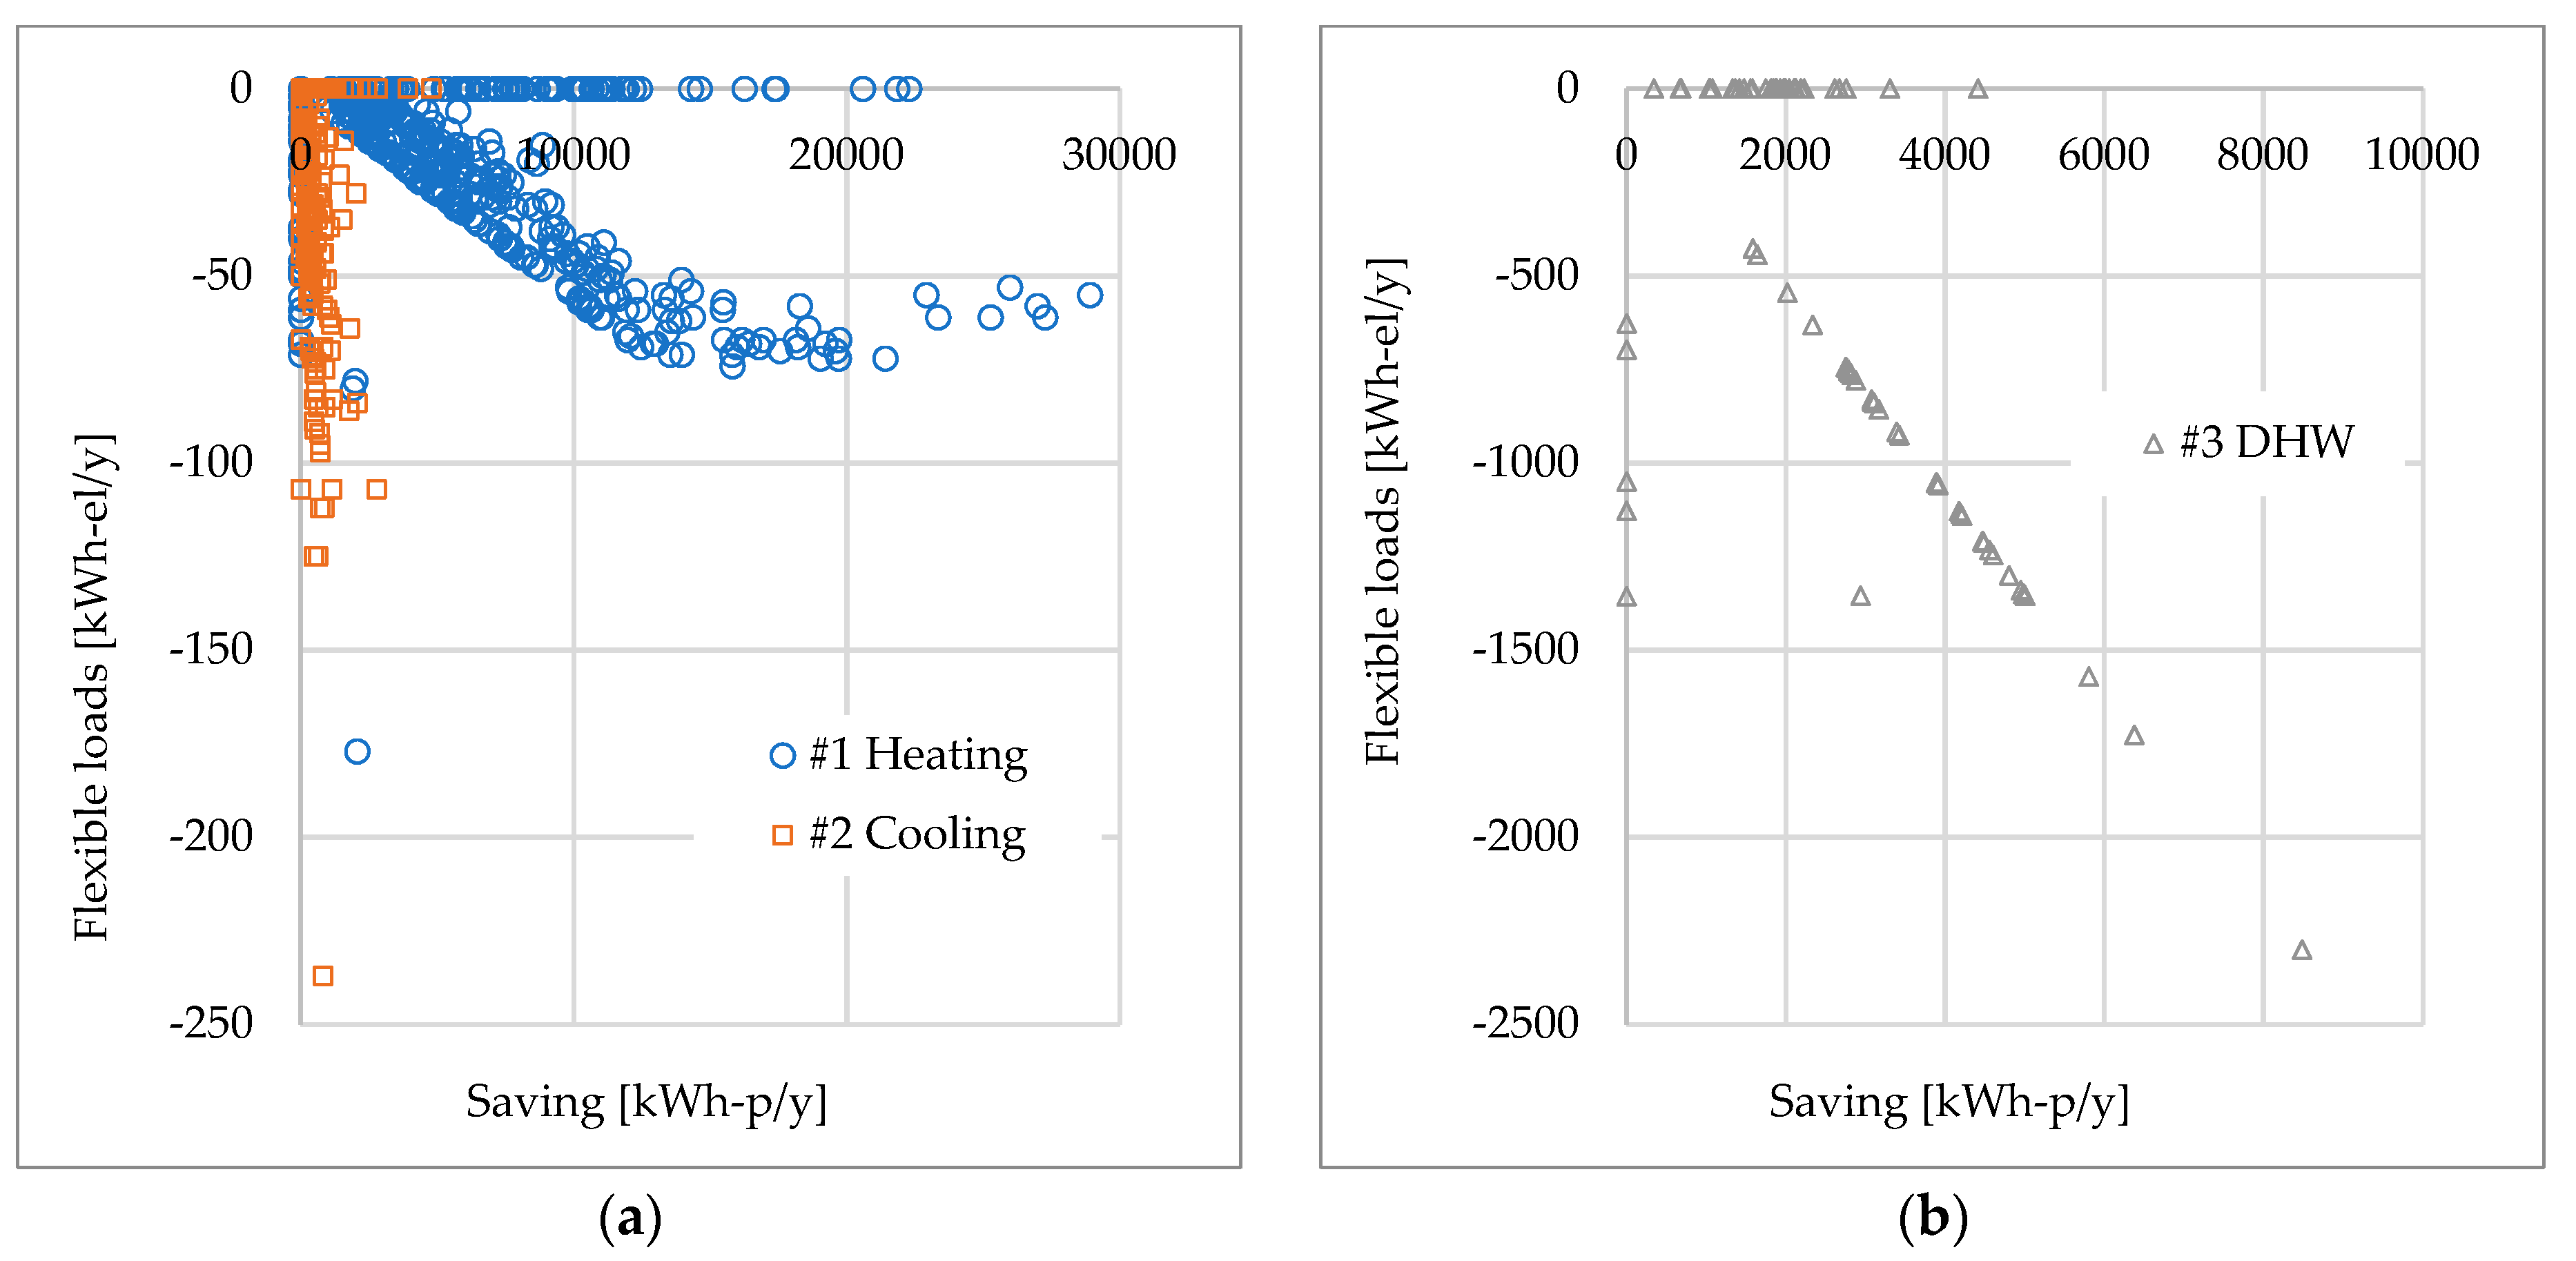
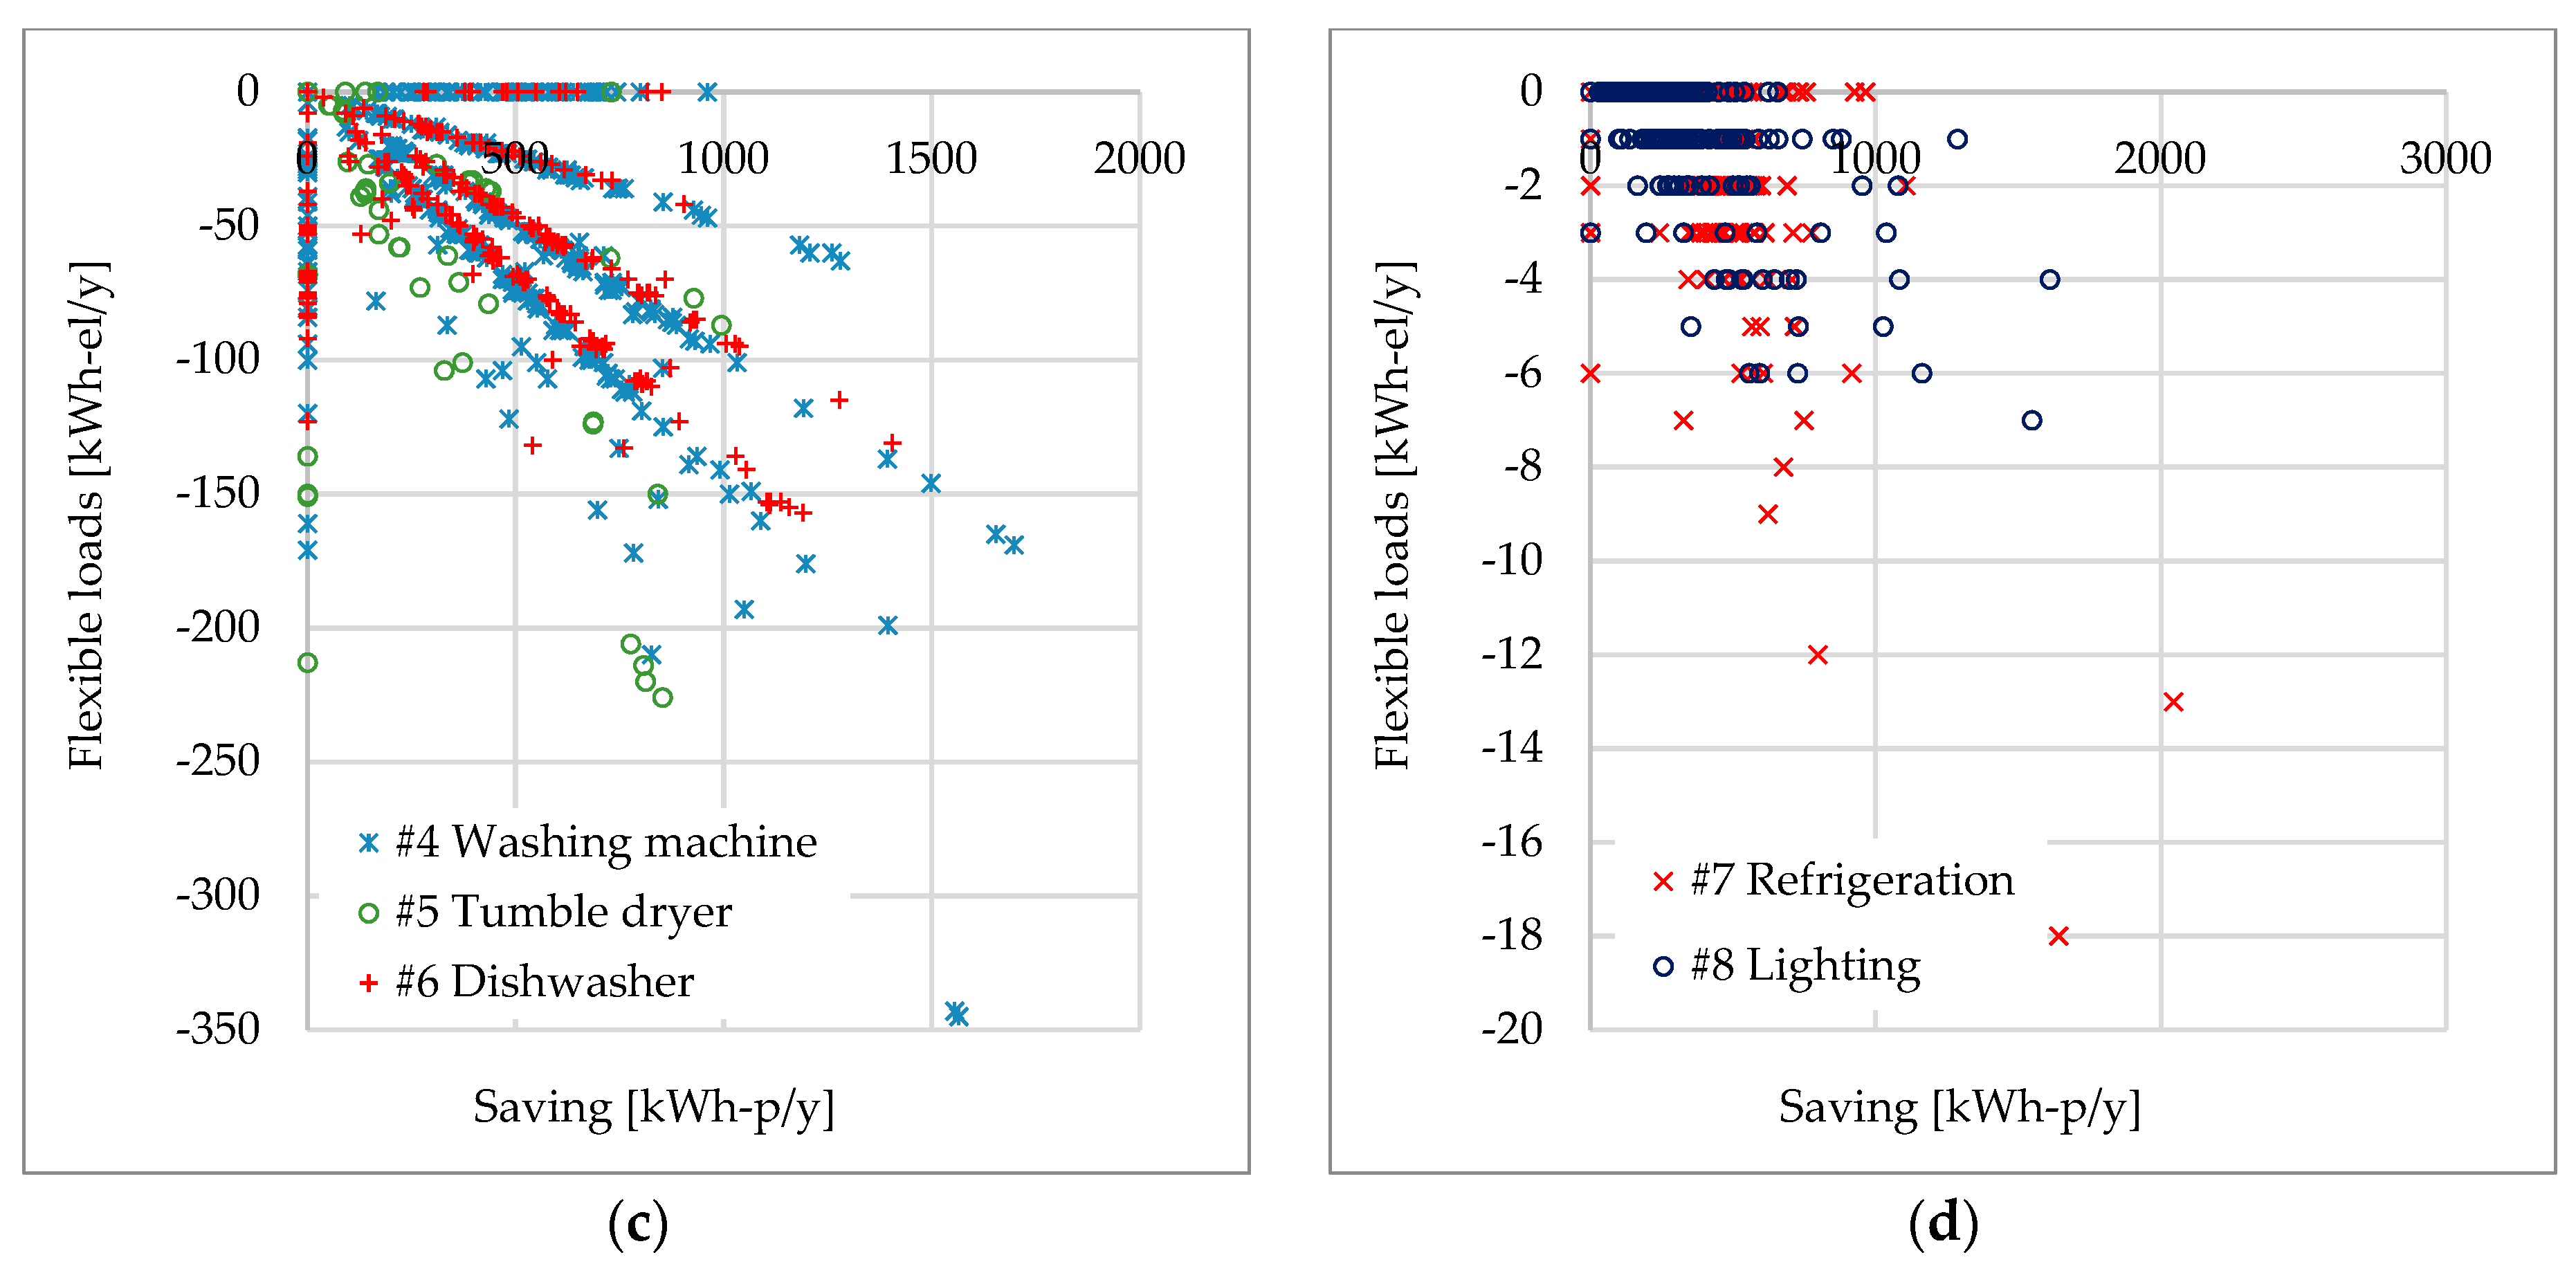
The outcomes of those simulations have been plotted in Figure 13 where the accomplished energy savings are assessed in terms of primary energy, whereas the potential for flexibility in terms of electricity. The graphs show separately the results so as to provide more reading clarity by sorting them in accordance with the loads subdivision presented previously (i.e., storable loads: Heating & Cooling, DHW; shiftable loads: washing; non-shiftable loads: Refrigeration & Lighting). In all cases, it can be noticed how an energy saving and a reduction in the potential of flexibility occur. Indeed, the application of such interventions leads to the lessening of services energy consumption. That is mainly due to the energy lower needs for heating and cooling services which are also caused by the reduction of internal contributions extent.
On the basis of those outputs, the average values of energy saving and changes in the potential of flexibility are reported in Table 5. For this latter, the greatest variation occurs for the DHW service (−130 kWh/y), owing to the electric heater replacement by new heat pump water heaters. Similarly, for the washing service high reduction can be achieved (−503 kWh/y), once washing machines, tumble dryers and dishwashers are substituted by their latest versions.
Essentially, by summing all the reported reductions the overall potential of flexibility difference shrinks up to 273 kWh/y. Indeed, starting from the current value of 1.042 kWh/y, the average value declines to 769 kWh/y.
4. Conclusions
The growing RES share in the Italian electricity system entailed higher balancing features due to the renewables non-programmability. In order to level off as much as possible the demand and production curves, The demand/response program can be beneficial for the electric system by enhancing load flexibility. The application of DR programs to residential users can allow to increase the demand flexibility, facilitating the penetration of renewable energies; however, it shows significant implementation complexities which are mainly represented by the strong loads’ fragmentation. Indeed, the Italian building stock consists approximately of 24 millions of dwellings which are poorly electrified in terms of energy carriers. Hence, the flexible loads amount remains generally low for each single unit.
In any case, before proceeding with any DR program application, a data collection phase is needed to characterize the most common user.
This work proposes the use of a data collection questionnaire based on the Excel platform, allowing to estimate the dwelling energy consumption by a real-time simulation. In such a way, the information gathering can be very effective by an immediate data check and by a comparison between simulated outputs, real consumption data and the reference benchmarks.
Compared to other research projects on the same topic, the use of this calculation tool allows to reduce the data uncertainty and reliability. That is the typical drawback which often occurs when the information is provided by non-expert users.
Having said this, from simulations results and the real data analysis the main findings can be summarized as follows:
- the average value of per capita NG consumption is equal to 368 Sm3/(y*person);
- the average value of per capita electricity consumption is equal to 772 kWh/(y*person);
- the larger the family members, the lower the per capita NG and electricity consumptions are;
- the average value of NG consumption by floor surface is equal to 10.6 Sm3/(y*m2);
- the average value of electricity consumption by floor surface is equal to 23.9 kWh/(y*m2);
- the specific NG and electricity consumptions by floor surface tend to decline not linearly as the apartment size is larger;
- heating, DHW and cooking services represent the highest fraction in dwellings primary energy consumption which is equal to 70%, approximately;
- the average electrification degree of the statistic sample is limited to 36.5%;
- the flexible loads average value is equal to 1000 kWh/y, whereas only 12.1% of households shows flexible loads higher than 2000 kWh/y;
- minor maintenance interventions lead to lower energy consumptions lessening the potential of flexibility to values beneath 800 kWh/y;
The DR program application to residential users is certainly to be further investigated. On the one hand, the benefits that the electrical system can achieve are evident; on the other hand, the only demand flexibility implementation entails small economic benefits for the individual users, and they should be not interested in participating, thereby.
Yet, investigating on the temporal stability related to the potential of flexibility is recommended, given that the present analysis has shown how it tends to decrease when the most common maintenance interventions are adopted. Additionally, evaluating changes in the potential of flexibility related to residential users it might be interesting once more invasive and expensive refurbishment interventions are adopted. To do so, building envelope, power and heating plants and DHW production systems have to be deeply modified.
In the end, further developments for managing properly the new flexible users consist of studying and testing an affordable and reliable automation device able to communicate rapidly and effectively with the energy spot market as well as with the utilities.
Author Contributions
F.M. contributes to this paper by the conceptualization, software implementation and validation; G.L.B. provided the formal analysis and was the writer of final draft along with the reviewing and editing process; L.d.S. was the project scientific coordinator taking care of funding acquisition and project administration.
Funding
This research received no external funding.
Acknowledgments
This work is a part of a wider research activity dealing with: “Study of an aggregator model for a smart district ”. The project has been carried out in cooperation with ENEA—DTE-SEN-SCC (Italian National Agency for New Technologies, Energy and Sustainable Economic Development—Department of Energy Technologies—Smart Energy Division) and CITERA (Sapienza University of Rome—Interdepartmental Research Center for Territory, Construction, Restoration and Environment). The aforementioned institutions are gratefully acknowledged by the authors for their support and funding.
Conflicts of Interest
The authors declare no conflict of interest.
References
- McDonagh, S.; Wall, D.M.; Deane, P.; Murphy, J.D. The effect of electricity markets, and renewable electricity penetration, on the levelised cost of energy of an advanced electro-fuel system incorporating carbon capture and utilisation. Renew. Energy 2019, 131, 364–371. [Google Scholar] [CrossRef]
- Meza, C.G.; Zuluaga Rodríguez, C.; D’Aquino, C.A.; Amado, N.B.; Rodrigues, A.; Sauer, I.L. Toward a 100% renewable island: A case study of Ometepe’s energy mix. Renew. Energy 2019, 132, 628–648. [Google Scholar] [CrossRef]
- Paraschiv, F.; Erni, D.; Pietsch, R. The impact of renewable energies on EEX day-ahead electricity prices. Energy Policy 2014, 73, 196–210. [Google Scholar] [CrossRef] [Green Version]
- Clò, S.; Cataldi, A.; Zoppoli, P. The merit-order effect in the Italian power market: The impact of solar and wind generation on national wholesale electricity prices. Energy Policy 2015, 77, 79–88. [Google Scholar] [CrossRef]
- Zappa, W.; Junginger, M.; van den Broek, M. Is a 100% renewable European power system feasible by 2050? Appl. Energy 2019, 233–234, 1027–1050. [Google Scholar] [CrossRef]
- de Santoli, L.; Mancini, F.; Astiaso Garcia, D. A GIS-based model to assess electric energy consumptions and usable renewable energy potential in Lazio region at municipality scale. Sustain. Cities Soc. 2019, 46, 101413. [Google Scholar] [CrossRef]
- Noussan, M.; Nastasi, B. Data analysis of heating systems for buildings—A tool for energy planning, policies and systems simulation. Energies 2018, 11, 233. [Google Scholar] [CrossRef]
- IEA. IRENA Perspectives for the Energy Transition: Investment Needs for A Low-Carbon Energy System. Available online: https://www.irena.org/publications/2017/Mar/Perspectives-for-the-energy-transition-Investment-needs-for-a-low-carbon-energy-system (accessed on 4 April 2019).
- Simoes, S.G.; Dias, L.; Gouveia, J.P.; Seixas, J.; De Miglio, R.; Chiodi, A.; Gargiulo, M.; Long, G.; Giannakidis, G. INSMART—Insights on integrated modelling of EU cities energy system transition. Energy Strategy Rev. 2018, 20, 150–155. [Google Scholar] [CrossRef]
- Strbac, G. Demand side management: Benefits and challenges. Energy Policy 2008, 36, 4419–4426. [Google Scholar] [CrossRef]
- Palensky, P.; Dietrich, D. Demand Side Management: Demand Response, Intelligent Energy Systems, and Smart Loads. IEEE Trans. Ind. Inform. 2011, 7, 381–388. [Google Scholar] [CrossRef]
- Mohsenian-Rad, A.-H.; Wong, V.W.S.; Jatskevich, J.; Schober, R.; Leon-Garcia, A. Autonomous Demand-Side Management Based on Game-Theoretic Energy Consumption Scheduling for the Future Smart Grid. IEEE Trans. Smart Grid 2010, 1, 320–331. [Google Scholar] [CrossRef]
- Earle, T.C. Trust, confidence, and the 2008 global financial crisis. Risk Anal. 2009, 29, 785–792. [Google Scholar] [CrossRef]
- Eurostat Database—Eurostat. Available online: https://ec.europa.eu/eurostat/data/database (accessed on 4 April 2019).
- Foteinaki, K.; Li, R.; Heller, A.; Rode, C. Heating system energy flexibility of low-energy residential buildings. Energy Build. 2018, 180, 95–108. [Google Scholar] [CrossRef]
- Balint, A.; Kazmi, H. Determinants of energy flexibility in residential hot water systems. Energy Build. 2019, 188–189, 286–296. [Google Scholar] [CrossRef]
- Issi, F.; Kaplan, O. The determination of load profiles and power consumptions of home appliances. Energies 2018, 11, 607. [Google Scholar] [CrossRef]
- Chen, Y.; Xu, P.; Gu, J.; Schmidt, F.; Li, W. Measures to improve energy demand flexibility in buildings for demand response (DR): A review. Energy Build. 2018, 177, 125–139. [Google Scholar] [CrossRef]
- Castellani, B.; Morini, E.; Nastasi, B.; Nicolini, A.; Rossi, F.; Castellani, B.; Morini, E.; Nastasi, B.; Nicolini, A.; Rossi, F. Small-Scale Compressed Air Energy Storage Application for Renewable Energy Integration in a Listed Building. Energies 2018, 11, 1921. [Google Scholar] [CrossRef]
- Shakouri, G.H.; Kazemi, A. Multi-objective cost-load optimization for demand side management of a residential area in smart grids. Sustain. Cities Soc. 2017, 32, 171–180. [Google Scholar] [CrossRef]
- Tsemekidi Tzeiranaki, S.; Bertoldi, P.; Diluiso, F.; Castellazzi, L.; Economidou, M.; Labanca, N.; Ribeiro Serrenho, T.; Zangheri, P. Analysis of the EU Residential Energy Consumption: Trends and Determinants. Energies 2019, 12, 1065. [Google Scholar] [CrossRef]
- Gaglia, A.G.; Dialynas, E.N.; Argiriou, A.A.; Kostopoulou, E.; Tsiamitros, D.; Stimoniaris, D.; Laskos, K.M. Energy performance of European residential buildings: Energy use, technical and environmental characteristics of the Greek residential sector—Energy conservation and CO₂ reduction. Energy Build. 2019, 183, 86–104. [Google Scholar] [CrossRef]
- Vogiatzi, C.; Gemenetzi, G.; Massou, L.; Poulopoulos, S.; Papaefthimiou, S.; Zervas, E. Energy use and saving in residential sector and occupant behavior: A case study in Athens. Energy Build. 2018, 181, 1–9. [Google Scholar] [CrossRef]
- Chang, C.; Zhu, N.; Yang, K.; Yang, F. Data and analytics for heating energy consumption of residential buildings: The case of a severe cold climate region of China. Energy Build. 2018, 172, 104–115. [Google Scholar] [CrossRef]
- Sepehr, M.; Eghtedaei, R.; Toolabimoghadam, A.; Noorollahi, Y.; Mohammadi, M. Modeling the electrical energy consumption profile for residential buildings in Iran. Sustain. Cities Soc. 2018, 41, 481–489. [Google Scholar] [CrossRef]
- Laicane, I.; Blumberga, D.; Blumberga, A.; Rosa, M. Evaluation of Household Electricity Savings. Analysis of Household Electricity Demand Profile and User Activities. Energy Procedia 2015, 72, 285–292. [Google Scholar] [CrossRef] [Green Version]
- Shiraki, H.; Nakamura, S.; Ashina, S.; Honjo, K. Estimating the hourly electricity profile of Japanese households—Coupling of engineering and statistical methods. Energy 2016, 114, 478–491. [Google Scholar] [CrossRef]
- Chuan, L.; Ukil, A. Modeling and Validation of Electrical Load Profiling in Residential Buildings in Singapore. IEEE Trans. Power Syst. 2015, 30, 2800–2809. [Google Scholar] [CrossRef]
- Hafeez, G.; Javaid, N.; Iqbal, S.; Khan, F.A. Optimal residential load scheduling under utility and rooftop photovoltaic units. Energies 2018, 11, 611. [Google Scholar] [CrossRef]
- Shirazi, E.; Zakariazadeh, A.; Jadid, S. Optimal joint scheduling of electrical and thermal appliances in a smart home environment. Energy Convers. Manag. 2015, 106, 181–193. [Google Scholar] [CrossRef]
- Ahmad, A.; Khan, A.; Javaid, N.; Hussain, H.M.; Abdul, W.; Almogren, A.; Alamri, A.; Azim Niaz, I.; Ahmad, A.; Khan, A.; et al. An Optimized Home Energy Management System with Integrated Renewable Energy and Storage Resources. Energies 2017, 10, 549. [Google Scholar] [CrossRef]
- Balvedi, B.F.; Ghisi, E.; Lamberts, R. A review of occupant behaviour in residential buildings. Energy Build. 2018, 174, 495–505. [Google Scholar] [CrossRef]
- D’Oca, S.; Hong, T.; Langevin, J. The human dimensions of energy use in buildings: A review. Renew. Sustain. Energy Rev. 2018, 81, 731–742. [Google Scholar] [CrossRef] [Green Version]
- Calì, D.; Andersen, R.K.; Müller, D.; Olesen, B.W. Analysis of occupants’ behavior related to the use of windows in German households. Build. Environ. 2016, 103, 54–69. [Google Scholar] [CrossRef]
- Andersen, R.K.; Fabi, V.; Corgnati, S.P. Predicted and actual indoor environmental quality: Verification of occupants’ behaviour models in residential buildings. Energy Build. 2016, 127, 105–115. [Google Scholar] [CrossRef]
- Zhao, D.; McCoy, A.P.; Du, J.; Agee, P.; Lu, Y. Interaction effects of building technology and resident behavior on energy consumption in residential buildings. Energy Build. 2017, 134, 223–233. [Google Scholar] [CrossRef]
- Chen, S.; Yang, W.; Yoshino, H.; Levine, M.D.; Newhouse, K.; Hinge, A. Definition of occupant behavior in residential buildings and its application to behavior analysis in case studies. Energy Build. 2015, 104, 1–13. [Google Scholar] [CrossRef]
- ISTAT Italian National Institute of Statistics Edifici Residenziali. Available online: http://dati-censimentopopolazione.istat.it/Index.aspx?DataSetCode=DICA_EDIFICIRES (accessed on 4 April 2019).
- Terna, S.P.A. Consumi Energia Elettrica per Settore Merceologico. Available online: http://www.terna.it/default/Home/SISTEMA_ELETTRICO/statistiche/consumi_settore_merceologico.aspx (accessed on 4 April 2019).
- ENEA-Italian National Agency for Energy Efficiency. Analysis and Results of Energy Efficiency Policies in Italy Energy Efficiency Annual Report. Available online: www.efficienzaenergetica.enea.it. (accessed on 4 April 2019).
- Zheng, X.; Wei, C.; Qin, P.; Guo, J.; Yu, Y.; Song, F.; Chen, Z. Characteristics of residential energy consumption in China: Findings from a household survey. Energy Policy 2014, 75, 126–135. [Google Scholar] [CrossRef]
- Shipworth, M. Thermostat settings in English houses: No evidence of change between 1984 and 2007. Build. Environ. 2011, 46, 635–642. [Google Scholar] [CrossRef] [Green Version]
- Guerra Santin, O.; Itard, L.; Visscher, H. The effect of occupancy and building characteristics on energy use for space and water heating in Dutch residential stock. Energy Build. 2009, 41, 1223–1232. [Google Scholar] [CrossRef]
- Carpino, C.; Mora, D.; De Simone, M. On the use of questionnaire in residential buildings. A review of collected data, methodologies and objectives. Energy Build. 2019, 186, 297–318. [Google Scholar] [CrossRef]
- Fabbri, K. How to use online surveys to understand human behaviour concerning window opening in terms of building energy performance. Adv. Build. Energy Res. 2016, 10, 213–239. [Google Scholar] [CrossRef]
- Rinaldi, A.; Schweiker, M.; Iannone, F. On uses of energy in buildings: Extracting influencing factors of occupant behaviour by means of a questionnaire survey. Energy Build. 2018, 168, 298–308. [Google Scholar] [CrossRef]
- Ruggieri, G.; Zangheri, P.; Bulgarelli, M.; Pistochini, P.; Ruggieri, G.; Zangheri, P.; Bulgarelli, M.; Pistochini, P. Monitoring a Sample of Main Televisions and Connected Entertainment Systems in Northern Italy. Energies 2019, 12, 1741. [Google Scholar] [CrossRef]
- Divina, F.; Torres, M.G.; Goméz Vela, F.A.; Vázquez Noguera, J.L.V.; Divina, F.; García Torres, M.; Goméz Vela, F.A.; Vázquez Noguera, J.L. A Comparative Study of Time Series Forecasting Methods for Short Term Electric Energy Consumption Prediction in Smart Buildings. Energies 2019, 12, 1934. [Google Scholar] [CrossRef]
- Hu, S.; Yan, D.; Guo, S.; Cui, Y.; Dong, B. A survey on energy consumption and energy usage behavior of households and residential building in urban China. Energy Build. 2017, 148, 366–378. [Google Scholar] [CrossRef]
- Bianco, V.; De Rosa, M.; Scarpa, F.; Tagliafico, L.A. Analysis of energy demand in residential buildings for different climates by means of dynamic simulation. Int. J. Ambient Energy 2016, 37, 108–120. [Google Scholar] [CrossRef]
- Mancini, F.; Cecconi, M.; De Sanctis, F.; Beltotto, A. Energy Retrofit of a Historic Building Using Simplified Dynamic Energy Modeling. Energy Procedia 2016, 101, 1119–1126. [Google Scholar] [CrossRef]
- De Santoli, L.; Mancini, F.; Clemente, C.; Lucci, S. Energy and technological refurbishment of the School of Architecture Valle Giulia, Rome. Energy Procedia 2017, 133, 382–391. [Google Scholar] [CrossRef]
- Mancini, F.; Clemente, C.; Carbonara, E.; Fraioli, S. Energy and environmental retrofitting of the university building of Orthopaedic and Traumatological Clinic within Sapienza Città Universitaria. Energy Procedia 2017, 126, 195–202. [Google Scholar] [CrossRef]
- Suomalainen, K.; Eyers, D.; Ford, R.; Stephenson, J.; Anderson, B.; Jack, M. Detailed comparison of energy-related time-use diaries and monitored residential electricity demand. Energy Build. 2019, 183, 418–427. [Google Scholar] [CrossRef]
- Martinez Soto, A.; Jentsch, M.F. Comparison of prediction models for determining energy demand in the residential sector of a country. Energy Build. 2016, 128, 38–55. [Google Scholar] [CrossRef]
- ISTAT Italian National Institute of Statistics. I consumi energetici delle famiglie. Available online: https://www.istat.it/it/archivio/142173 (accessed on 4 April 2019).
- Schweiker, M.; Shukuya, M. Comparison of theoretical and statistical models of air-conditioning-unit usage behaviour in a residential setting under Japanese climatic conditions. Build. Environ. 2009, 44, 2137–2149. [Google Scholar] [CrossRef]
- Ren, X.; Yan, D.; Wang, C. Air-conditioning usage conditional probability model for residential buildings. Build. Environ. 2014, 81, 172–182. [Google Scholar] [CrossRef]
- He, X.; Keyaerts, N.; Azevedo, I.; Meeus, L.; Hancher, L.; Glachant, J.M. How to engage consumers in demand response: A contract perspective. Util. Policy 2013, 27, 108–122. [Google Scholar] [CrossRef] [Green Version]
- Kylili, A.; Fokaides, P.A.; Lopez Jimenez, P.A. Key Performance Indicators (KPIs) approach in buildings renovation for the sustainability of the built environment: A review. Renew. Sustain. Energy Rev. 2016, 56, 906–915. [Google Scholar] [CrossRef]
- Lanati, F.; Gelmini, A.R. Impatti del dynamic pricing applicato ai consumatori elettrici residenziali. Available online: http://www.energy-home.it/Documents/2016-May DynamicPricingBook/160508DynamicPricingBook_ExecSummary.pdf (accessed on 4 April 2019).
- Cicero, F.; Di Gaetano, N.; Speziale, L. I comportamenti di consumo elettrico delle famiglie italiane. Energ. Elettr. 2010, 87, 57–63. [Google Scholar]
- Gelmini, A.; Lanati, F.; Polidoro, F.; Vitale, S. Scenari elettro-energetici. Available online: http://www.rse-web.it/temi.page?docIdType=1&typeDesc=Report&docType_1=yes&resultList=yes&RSE_manipulatePath=yes&objId=1&RSE_originalURI=/temi/sottotema/documenti/2&country=ita (accessed on 4 April 2019).
Figure 1.
General loads mix and self-generation.

Figure 2.
Buildings’ subdivision. (a) Year of Construction; (b) Surface.

Figure 3.
Buildings’ subdivision. (a) Household vs. family components; (b) Per-capita surface vs. family components.
Figure 3.
Buildings’ subdivision. (a) Household vs. family components; (b) Per-capita surface vs. family components.

Figure 4.
Actual consumptions vs. simulated consumptions (a) Natural Gas; (b) Electricity.

Figure 5.
Per capita consumptions; (a) Natural Gas; (b) Electricity.

Figure 6.
Specific consumptions by unit of surface vs. dwelling size: (a) Natural Gas; (b) Electricity.
Figure 6.
Specific consumptions by unit of surface vs. dwelling size: (a) Natural Gas; (b) Electricity.

Figure 7.
Services share in dwellings energy consumption.

Figure 8.
Average values of services share in dwellings energy consumption.

Figure 9.
Dwellings electrification degree.

Figure 10.
Storable loads.

Figure 11.
Shiftable loads.

Figure 12.
Flexible loads.

Figure 13.
Changes in potential of flexibility vs. energy savings (as a function of primary energy) related to the evolutionary scenarios: (a) Heating & Cooling; (b) DHW; (c) Washing; (d) Refrigeration & Lighting.
Figure 13.
Changes in potential of flexibility vs. energy savings (as a function of primary energy) related to the evolutionary scenarios: (a) Heating & Cooling; (b) DHW; (c) Washing; (d) Refrigeration & Lighting.


Table 1.
Questionnaire structure.
Building location
| Kitchen
|
Table 2.
Refurbishment actions on building.
| Building Construction Year | Refurbishment Actions on Building | |||
|---|---|---|---|---|
| Walls | Roofs | Floors | Windows | |
| before 1919 | 0 (0%) | 0 (0%) | 0 (0%) | 5 (41.7%) |
| 1919–1945 | 2 (4.8%) | 2 (4.8%) | 3 (7.1%) | 29 (69%) |
| 1946–1961 | 6 (10.2%) | 8 (13.6%) | 1 (1.7%) | 46 (78%) |
| 1962–1971 | 8 (12.7%) | 7 (11.1%) | 3 (4.8%) | 29 (46%) |
| 1972–1981 | 13 (14.8%) | 13 (14.8%) | 5 (5.7%) | 44 (50%) |
| 1982–1991 | 5 (8.9%) | 5 (8.9%) | 3 (5.4%) | 22 (39.3%) |
| 1991–2005 | 16 (21.3%) | 14 (18.7%) | 9 (12%) | 13 (17.3%) |
| 2006–2008 | 0 (0%) | 0 (0%) | 0 (0%) | 0 (0%) |
| 2008–2010 | 2 (33.3%) | 1 (16.7%) | 0 (0%) | 2 (33.3%) |
| 2010–2015 | 4 (50%) | 4 (50%) | 3 (37.5%) | 2 (25%) |
| after 2015 | 0 (0%) | 0 (0%) | 0 (0%) | 0 (0%) |
| Total | 56 (13.6%) | 54 (13.1%) | 27 (6.6%) | 192 (46.6%) |
Table 3.
Services spread within homes.
| Service | Number (Share) | Type | Number (Share) |
|---|---|---|---|
| Heating | 412 (100%) | Traditional boiler | 318 (77.2%) |
| Condensing boiler | 89 (21.6%) | ||
| Heat pump | 5 (1.2%) | ||
| Cooling | 284 (68.9%) | ||
| DHW | 412 (100%) | Instantaneous Boiler | 321 (77.9%) |
| Boiler with storage | 30 (7.3%) | ||
| Electric water heather | 53 (12.9%) | ||
| Heat Pump water heater | 8 (1.9%) | ||
| Cooking | 412 (100%) | - | - |
| Refrigeration | 412 (100%) | - | - |
| Washing | 408 (99.0%) | Washing machine | 408 (99.0%) |
| Tumble dryer | 65 (15.8%) | ||
| Dishwasher | 247 (60.0%) | ||
| Cleaning and ironing | 397 (96.4%) | - | - |
| Lighting | 412 (100%) | - | - |
| Video audio | 410 (99.5%) | - | - |
| Internet computer | 400 (97.1%) | - | - |
| Care person | 404 (98.1%) | - | - |
| Other equipment | 45 (10.9%) | - | - |
Table 4.
Evolutionary Scenarios.
| # | Service | Reference Scenario | New Scenario |
|---|---|---|---|
| #1 | Heating | Traditional boiler | Condensing boiler |
| Condensing boiler | Condensing boiler | ||
| Heat pump | Heat pump–A+++ Class | ||
| #2 | Cooling | Electric air conditioner | Electric air conditioner–A+++ Class |
| #3 | DHW | Instantaneous water heater | Instantaneous condensing boiler |
| Water heater with storage | Condensing boiler with storage | ||
| Electric water heater | Heat Pump water heater | ||
| Heat Pump water heater | Heat Pump water heater | ||
| #4 | Washing | Washing machine | Washing machine–Same size–A+++ Class |
| #5 | Tumble dryer | Tumble dryer–Same size–A+++ Class | |
| #6 | Dishwasher | Dishwasher–Same size–A+++ Class | |
| #7 | Refrigeration | Existing refrigerator | Refrigerator–Same size–A+++ Class |
| #8 | Lighting | Existing Lamps | LED Lamps |
Table 5.
Energy saving and changes in potential of flexibility: average values.
| # | Service | Energy Saving [kWh-p] | Potential of Flexibility Variation [kWh-e] |
|---|---|---|---|
| #1 | Heating | 6979 | −28 |
| #2 | Cooling | 325 | −19 |
| #3 | DHW | 1927 | −130 |
| #4 | Washing machine | 456 | −50 |
| #5 | Tumble dryer | 60 | −14 |
| #6 | Dishwasher | 262 | −32 |
| #7 | Refrigeration | 417 | −1 |
| #8 | Lighting | 302 | 0 |
© 2019 by the authors. Licensee MDPI, Basel, Switzerland. This article is an open access article distributed under the terms and conditions of the Creative Commons Attribution (CC BY) license (http://creativecommons.org/licenses/by/4.0/).
Share and Cite
MDPI and ACS Style
Mancini, F.; Lo Basso, G.; De Santoli, L. Energy Use in Residential Buildings: Characterisation for Identifying Flexible Loads by Means of a Questionnaire Survey. Energies 2019, 12, 2055. https://doi.org/10.3390/en12112055
AMA Style
Mancini F, Lo Basso G, De Santoli L. Energy Use in Residential Buildings: Characterisation for Identifying Flexible Loads by Means of a Questionnaire Survey. Energies. 2019; 12(11):2055. https://doi.org/10.3390/en12112055
Chicago/Turabian StyleMancini, Francesco, Gianluigi Lo Basso, and Livio De Santoli. 2019. "Energy Use in Residential Buildings: Characterisation for Identifying Flexible Loads by Means of a Questionnaire Survey" Energies 12, no. 11: 2055. https://doi.org/10.3390/en12112055
Note that from the first issue of 2016, this journal uses article numbers instead of page numbers. See further details here.