Article

Facies and the Architecture of Estuarine Tidal Bar in the Lower Cretaceous Mcmurray Formation, Central Athabasca Oil Sands, Alberta, Canada

1
School of Geosciences, China University of Petroleum (East China), Qingdao 266580, China
2
Research Institute of Petroleum Exploration & Development, Beijing 100083, China
*
Authors to whom correspondence should be addressed.
Energies 2019, 12(9), 1769; https://doi.org/10.3390/en12091769
Submission received: 27 March 2019 / Revised: 29 April 2019 / Accepted: 6 May 2019 / Published: 10 May 2019
(This article belongs to the Special Issue Reservoir Simulation and Prediction of Gas, Oil and Coal Mine)

Abstract

:
In this study, data obtained from the Lower Cretaceous McMurray Formation in the central Athabasca Oil Sands, northeastern Alberta, Canada, are examined and used to establish the architecture of stacked fluvial and estuarine tidal bar deposits. A total of 13 distinguishable facies (F1–F7, F8a–F8b, and F9–F13) corresponding to stacked fluvial and estuarine deposits are recognized. These facies are then reassembled into four facies associations: fluvial deposits, tidal flat, tidal bar complex, and tidal bar cap. Of these, the lower fluvial deposits show a highly eroded channel lag and tidal influences in the cross-stratified sand and wavy interbeds. The fluvial deposits pass upwards into upper tidal-dominated tidal flats and a massive homogeneous tidal sand bar complex. Very thick tidal-influenced facies (F8a–F8b, up to 22 m) caused by semi-diurnal and semi-lunar cycles are also observed in tidal flats. Based on studies of the facies and facies associations, a three-dimensional (3-D) architecture model is finally established and used to analyze the internal distribution of the stacked fluvial and estuarine deposits. This is the first time that a 3-D model of the paleo-estuary tidal bar has been constructed. The results of this study will assist future research analyzing the architecture of stacked fluvial and estuarine deposits.

1. Introduction

Estuarine tidal bars, which are also called linear sand ridges or linear sandbanks, occur in the mouths of tide-dominated estuaries [1] or in mixed tide-and-wave dominated estuaries [2,3,4]. Estuarine tidal bars show strong similarities with tidal bars found in tide-dominated deltas, as they can be elongated [1,5] or lobate [6], and are typically a few kilometers long, hundreds of meters wide, and between a few meters and tens of meters in height.
To date, few studies have provided three-dimensional (3-D) architecture of the depositional environment of complex paleo estuarine sand bar stratigraphy. The lack of such studies is mainly due to the relatively limited resolution of seismic data, difficulty in recovering complete cores, and the scarcity of intensive drilling projects within single sand bar complexes. Studies that have been conducted in estuaries have been commonly based on the interpretation of internal sedimentary structures, bedding types, and the stratification sequences observed in rock outcrops or cores [4,5]. Although rock outcrops can provide the two-dimensional (2-D) architecture of estuarine deposits, they offer little information about the internal 3-D architecture. In addition, as this study focuses on a region where there is no river cutting through the developed area, rock outcrops cannot be used to provide information to enable 3-D modeling in the analysis of the risk of tar sand development. However, current research conducted on estuarine tidal flats and tidal bars can be employed in reconstructing the 3-D architecture of ancient estuarine deposits. For example, Caston [7] used detailed sand-wave and current observations over the Norfolk Sandbanks in the UK [7] and found that the strongest tidal currents and sand transport directions are primarily parallel to (and clockwise around) the ridges, whereas, on the banks themselves, they turn progressively towards the crests in shallower water, thereby tending to maintain the banks. These banks are typically asymmetric, with the steeper side facing obliquely towards the tile direction of net sand transport.
Charitha & Collins [8] investigated the modern Scarweather Sands and predicted the bed-load transport paths by combing near-bed current meter observations and empirically derived formulae. It is also demonstrated that water circulation and sand transport paths form part of a clockwise eddy system around the sandbank. Mechanisms controlling the location and characteristics of this particular sandbank are shown to be explicable in terms of a combination of models for sandbank formation and maintenance.
Xavier & Eric [9] analyzed long-term morphological change processes of mixed-energy environments of the Gironde Estuary and Marennes-Oleron Bay, based on a finite element model called Telemac2D. Their simulation results indicated that the northeastern side of the tidal sand bar is flood-dominated, whereas the southwestern side is ebb-dominated, causing the whole tidal sand bar to be centered in a clockwise converging transport cell. Simulations of historical bathymetries support the idea that sandbank locations coincide with converging sand transport zones between mutually evasive ebb-flood channels. Because of the water-saturated nature of the sediments, coring is the only feasible procedure in modern estuarine tidal flat and tidal bar research. Due to the high cost of recent sediment coring, only a few wells have been drilled. The sediment timescales are not comparable between modern estuarine deposits and the ancient estuarine deposits (~12 My) in our study area.
This paper provides new data on the internal structure of a complex tidal sand bar in an estuary in northeastern Alberta [10,11] (Figure 1). Down hole logging of 448 wells are carried out, of which 69 wells are treated with down hole coring procedure. Well log and core observation data from 448 wells and 69 wells, respectively, from the McMurray Formation are used to reconstruct the internal architecture of a single estuarine sand bar complex, thereby providing new insight into its evolutionary history. The main aims of this paper are to gain a better understand of the sedimentology and internal architecture of fluvial and tidal estuarine deposits in the McMurray Formation within the northeastern Alberta Basin, and to provide an insight into the architecture and facies distribution of ancient stacked fluvial and estuarine deposits.

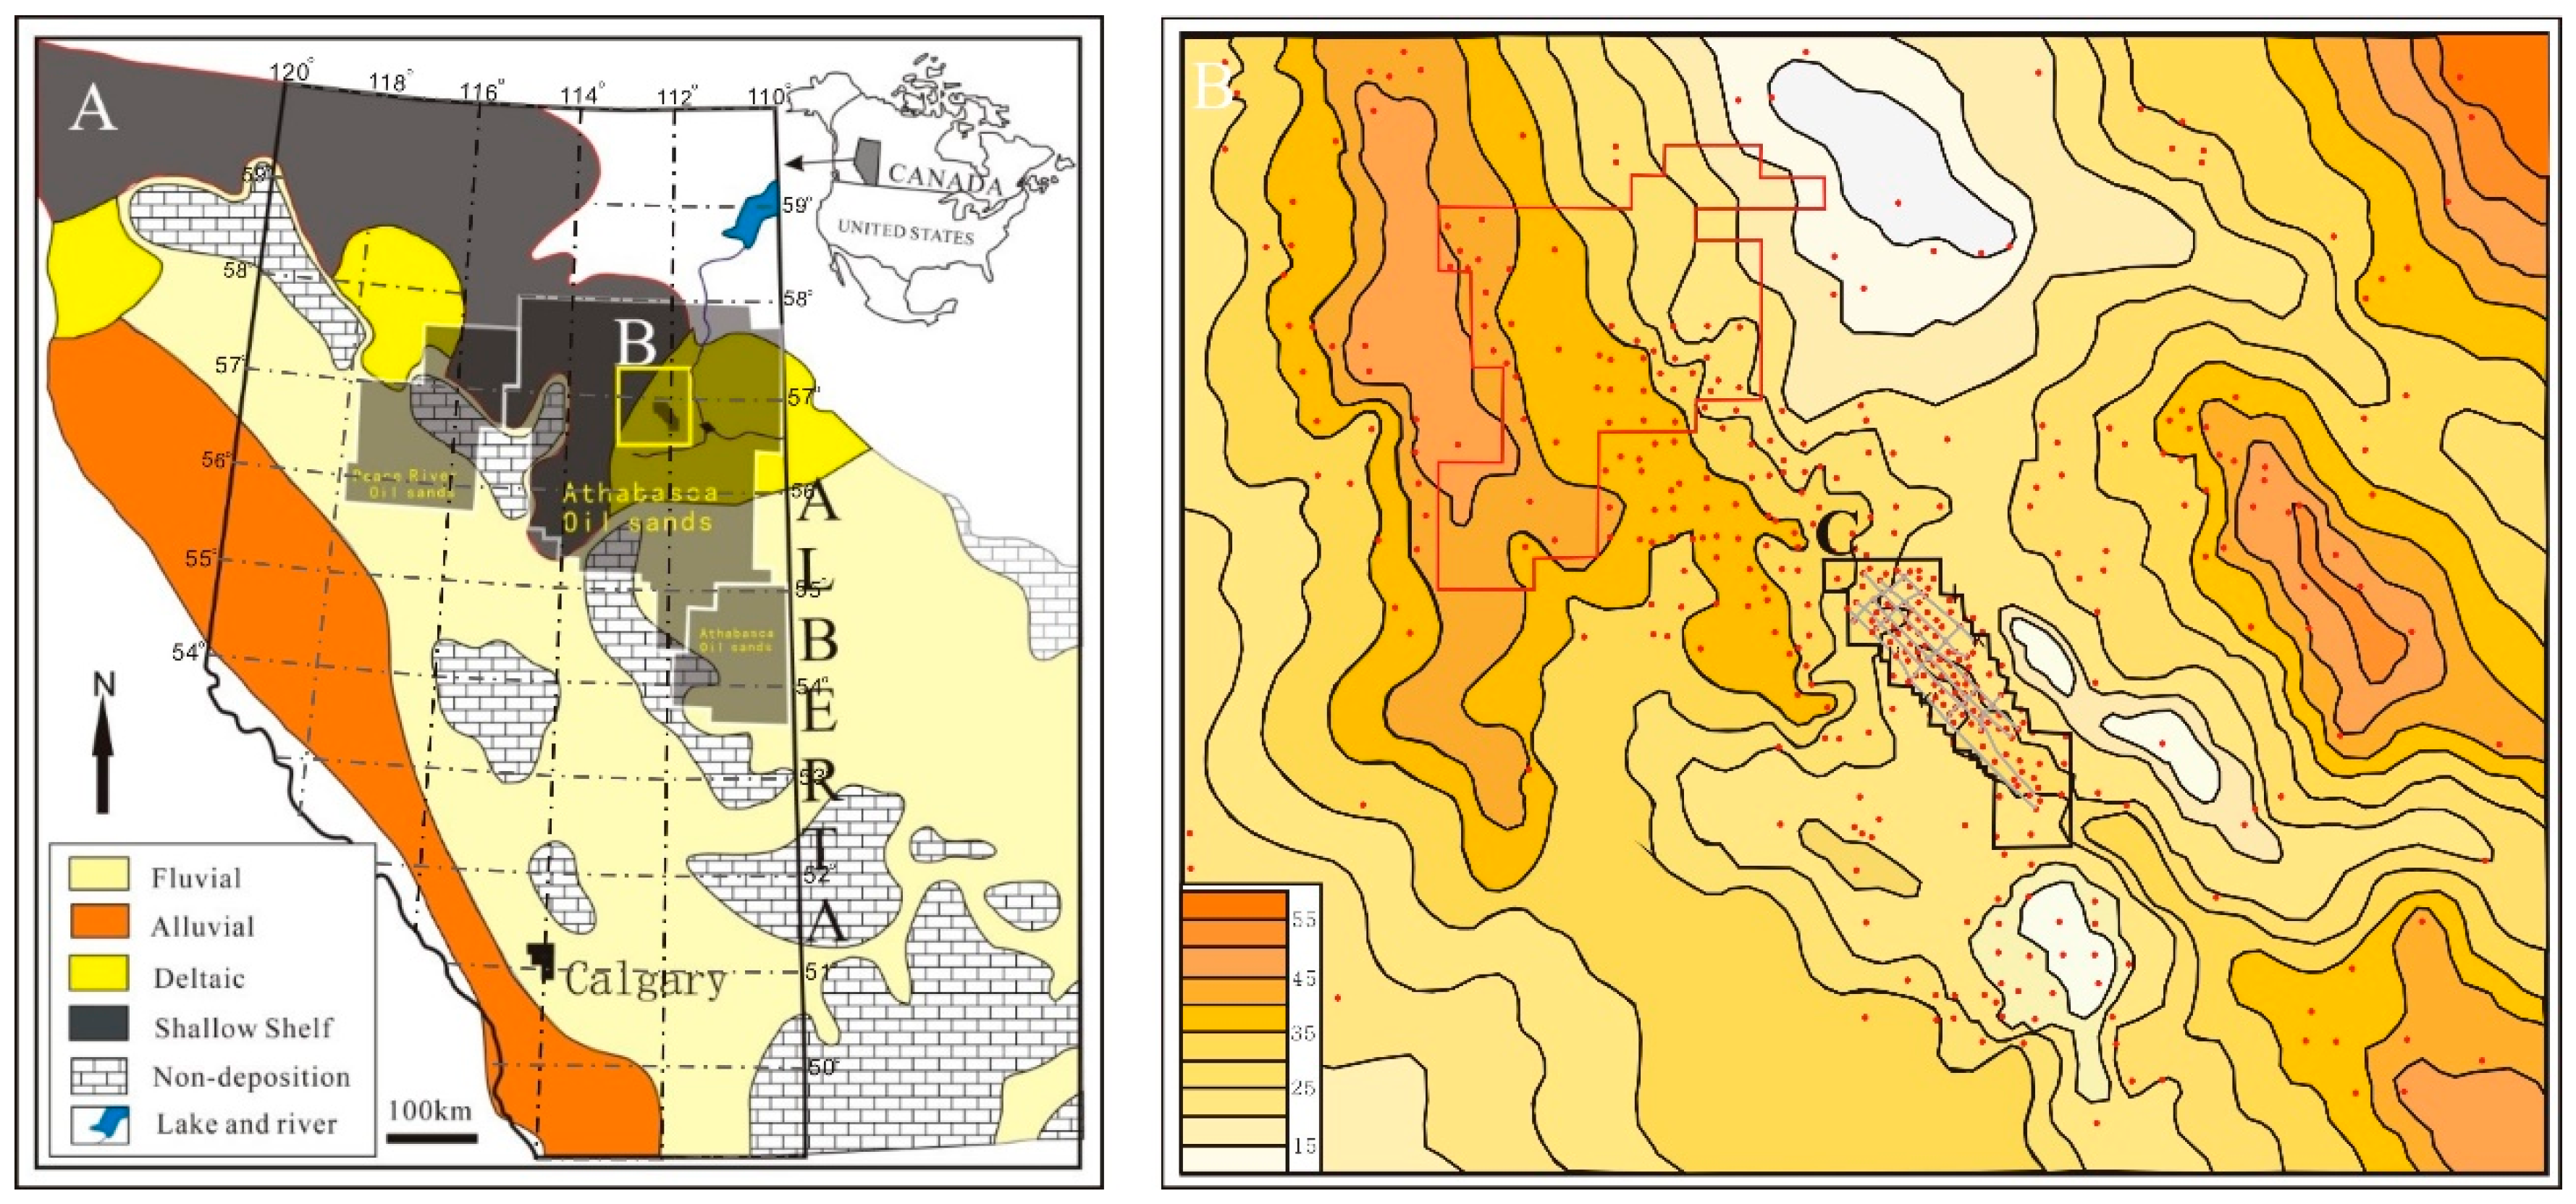
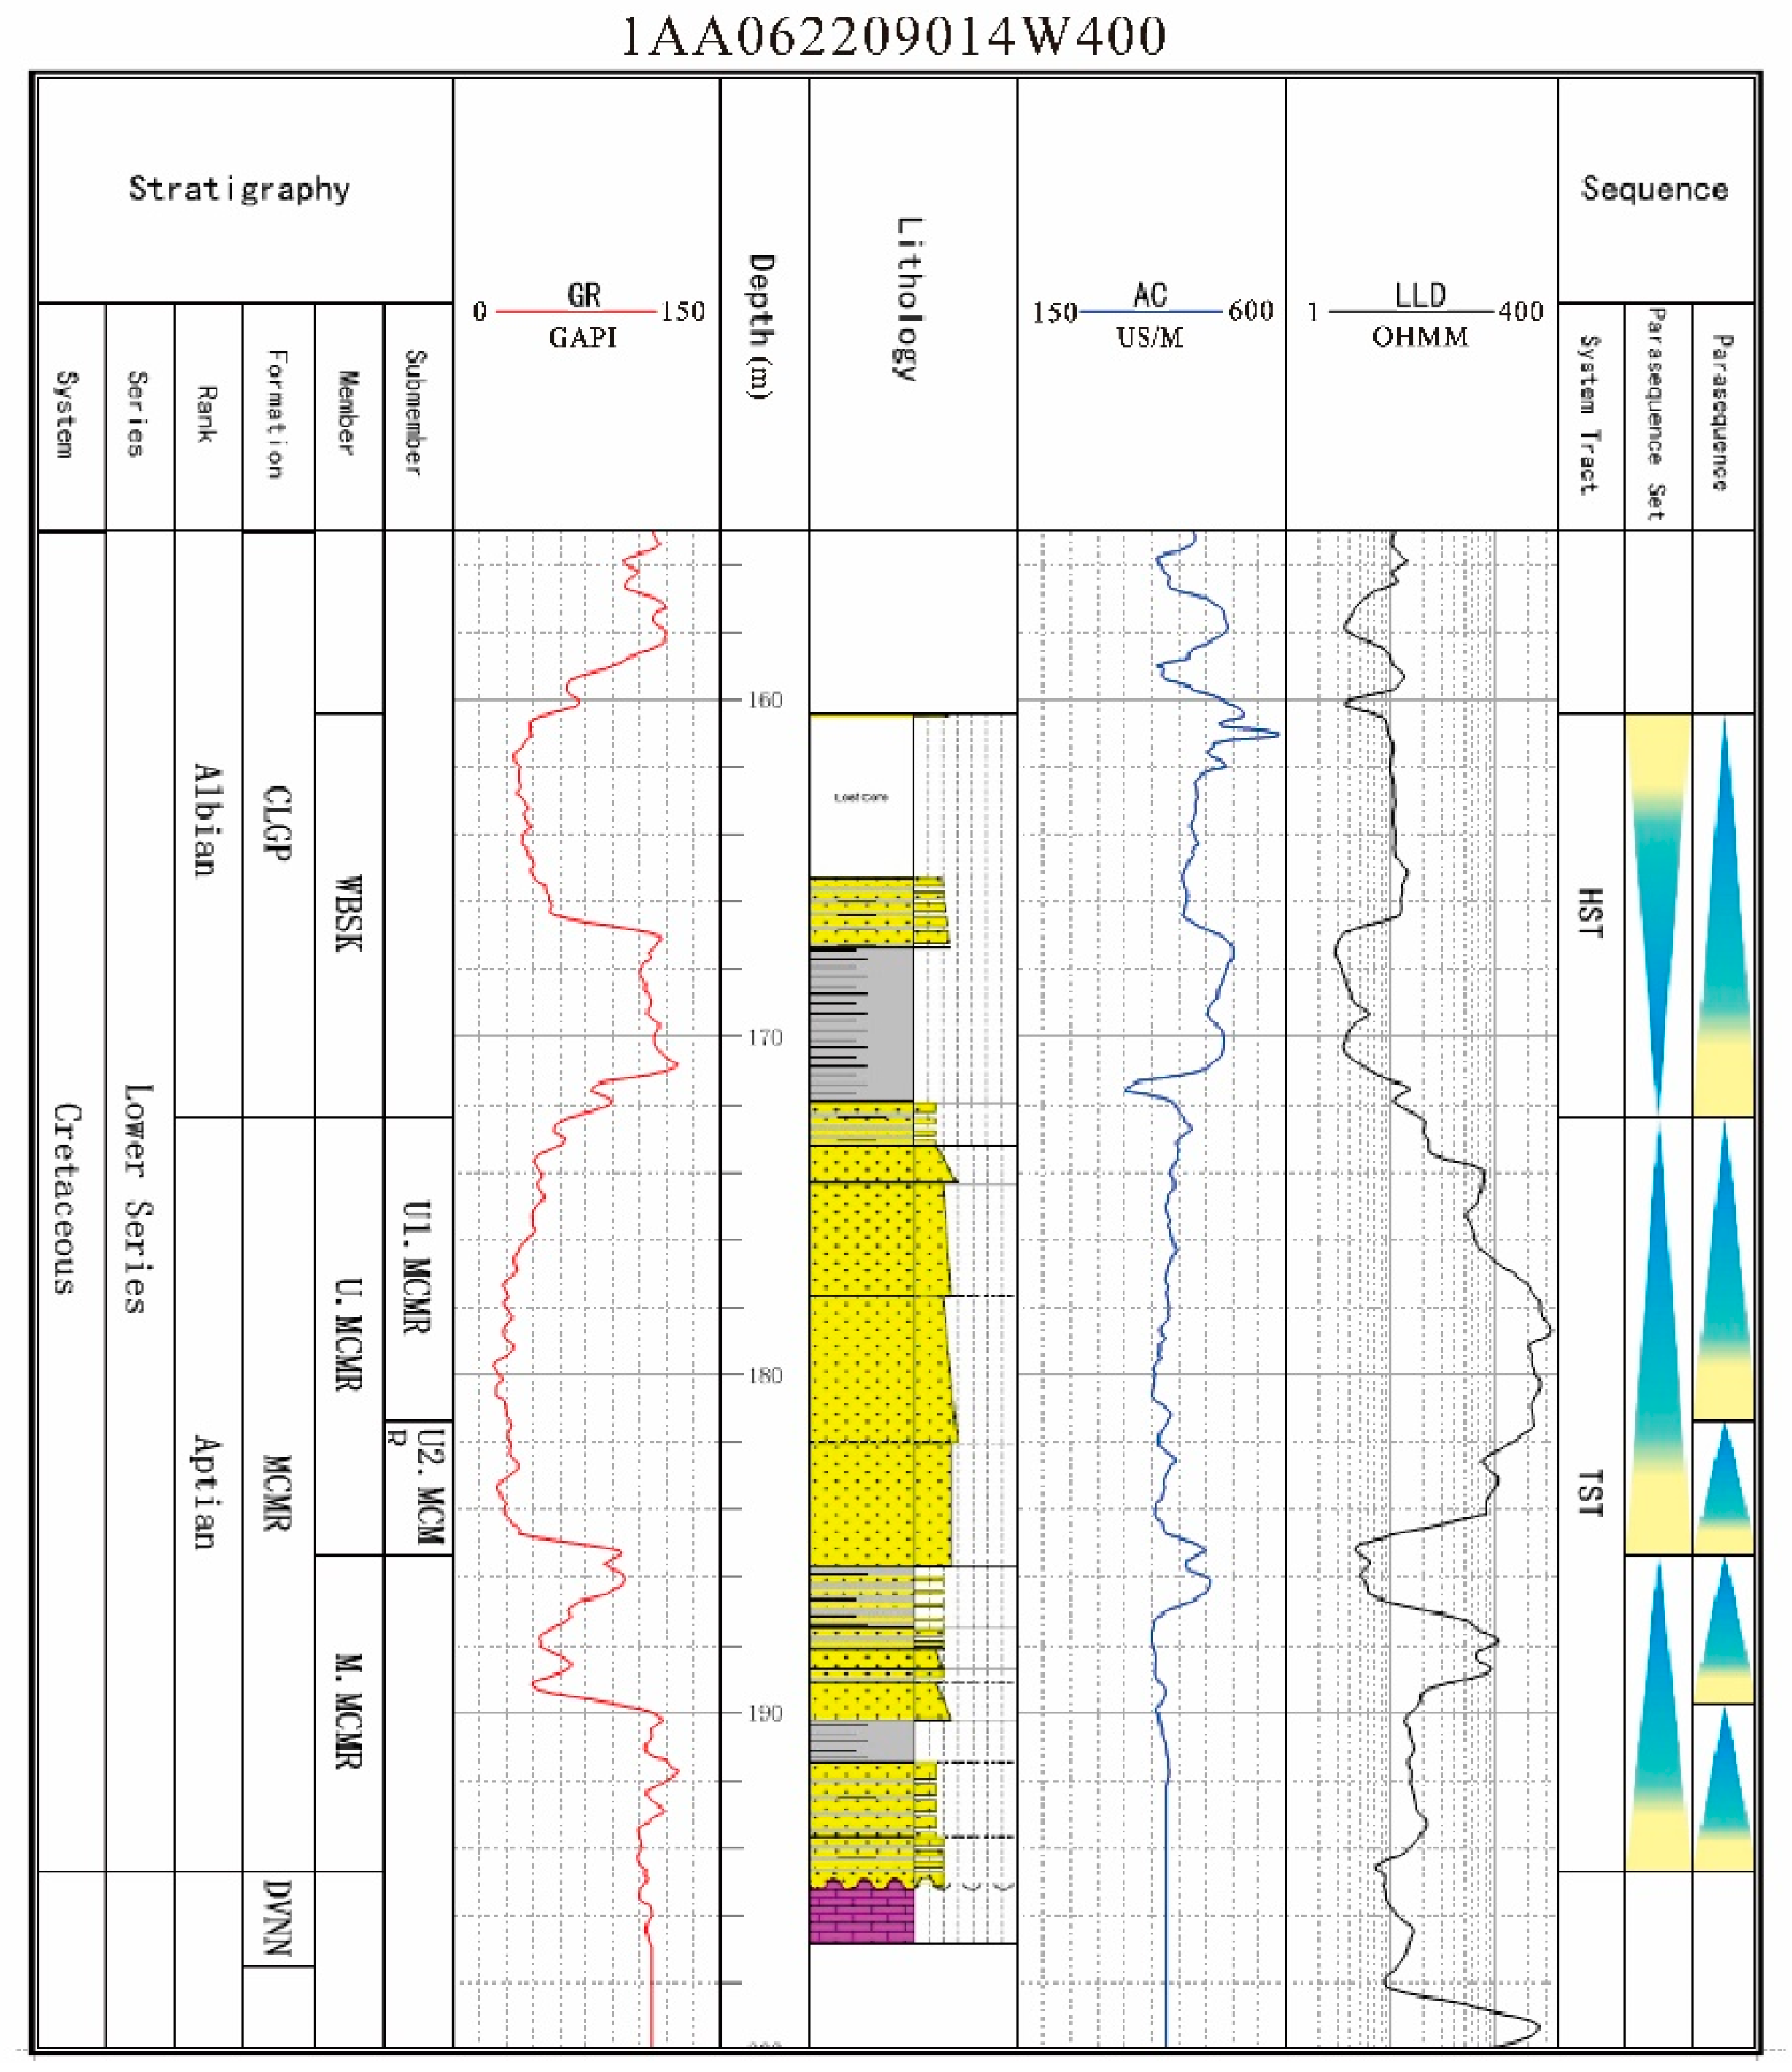
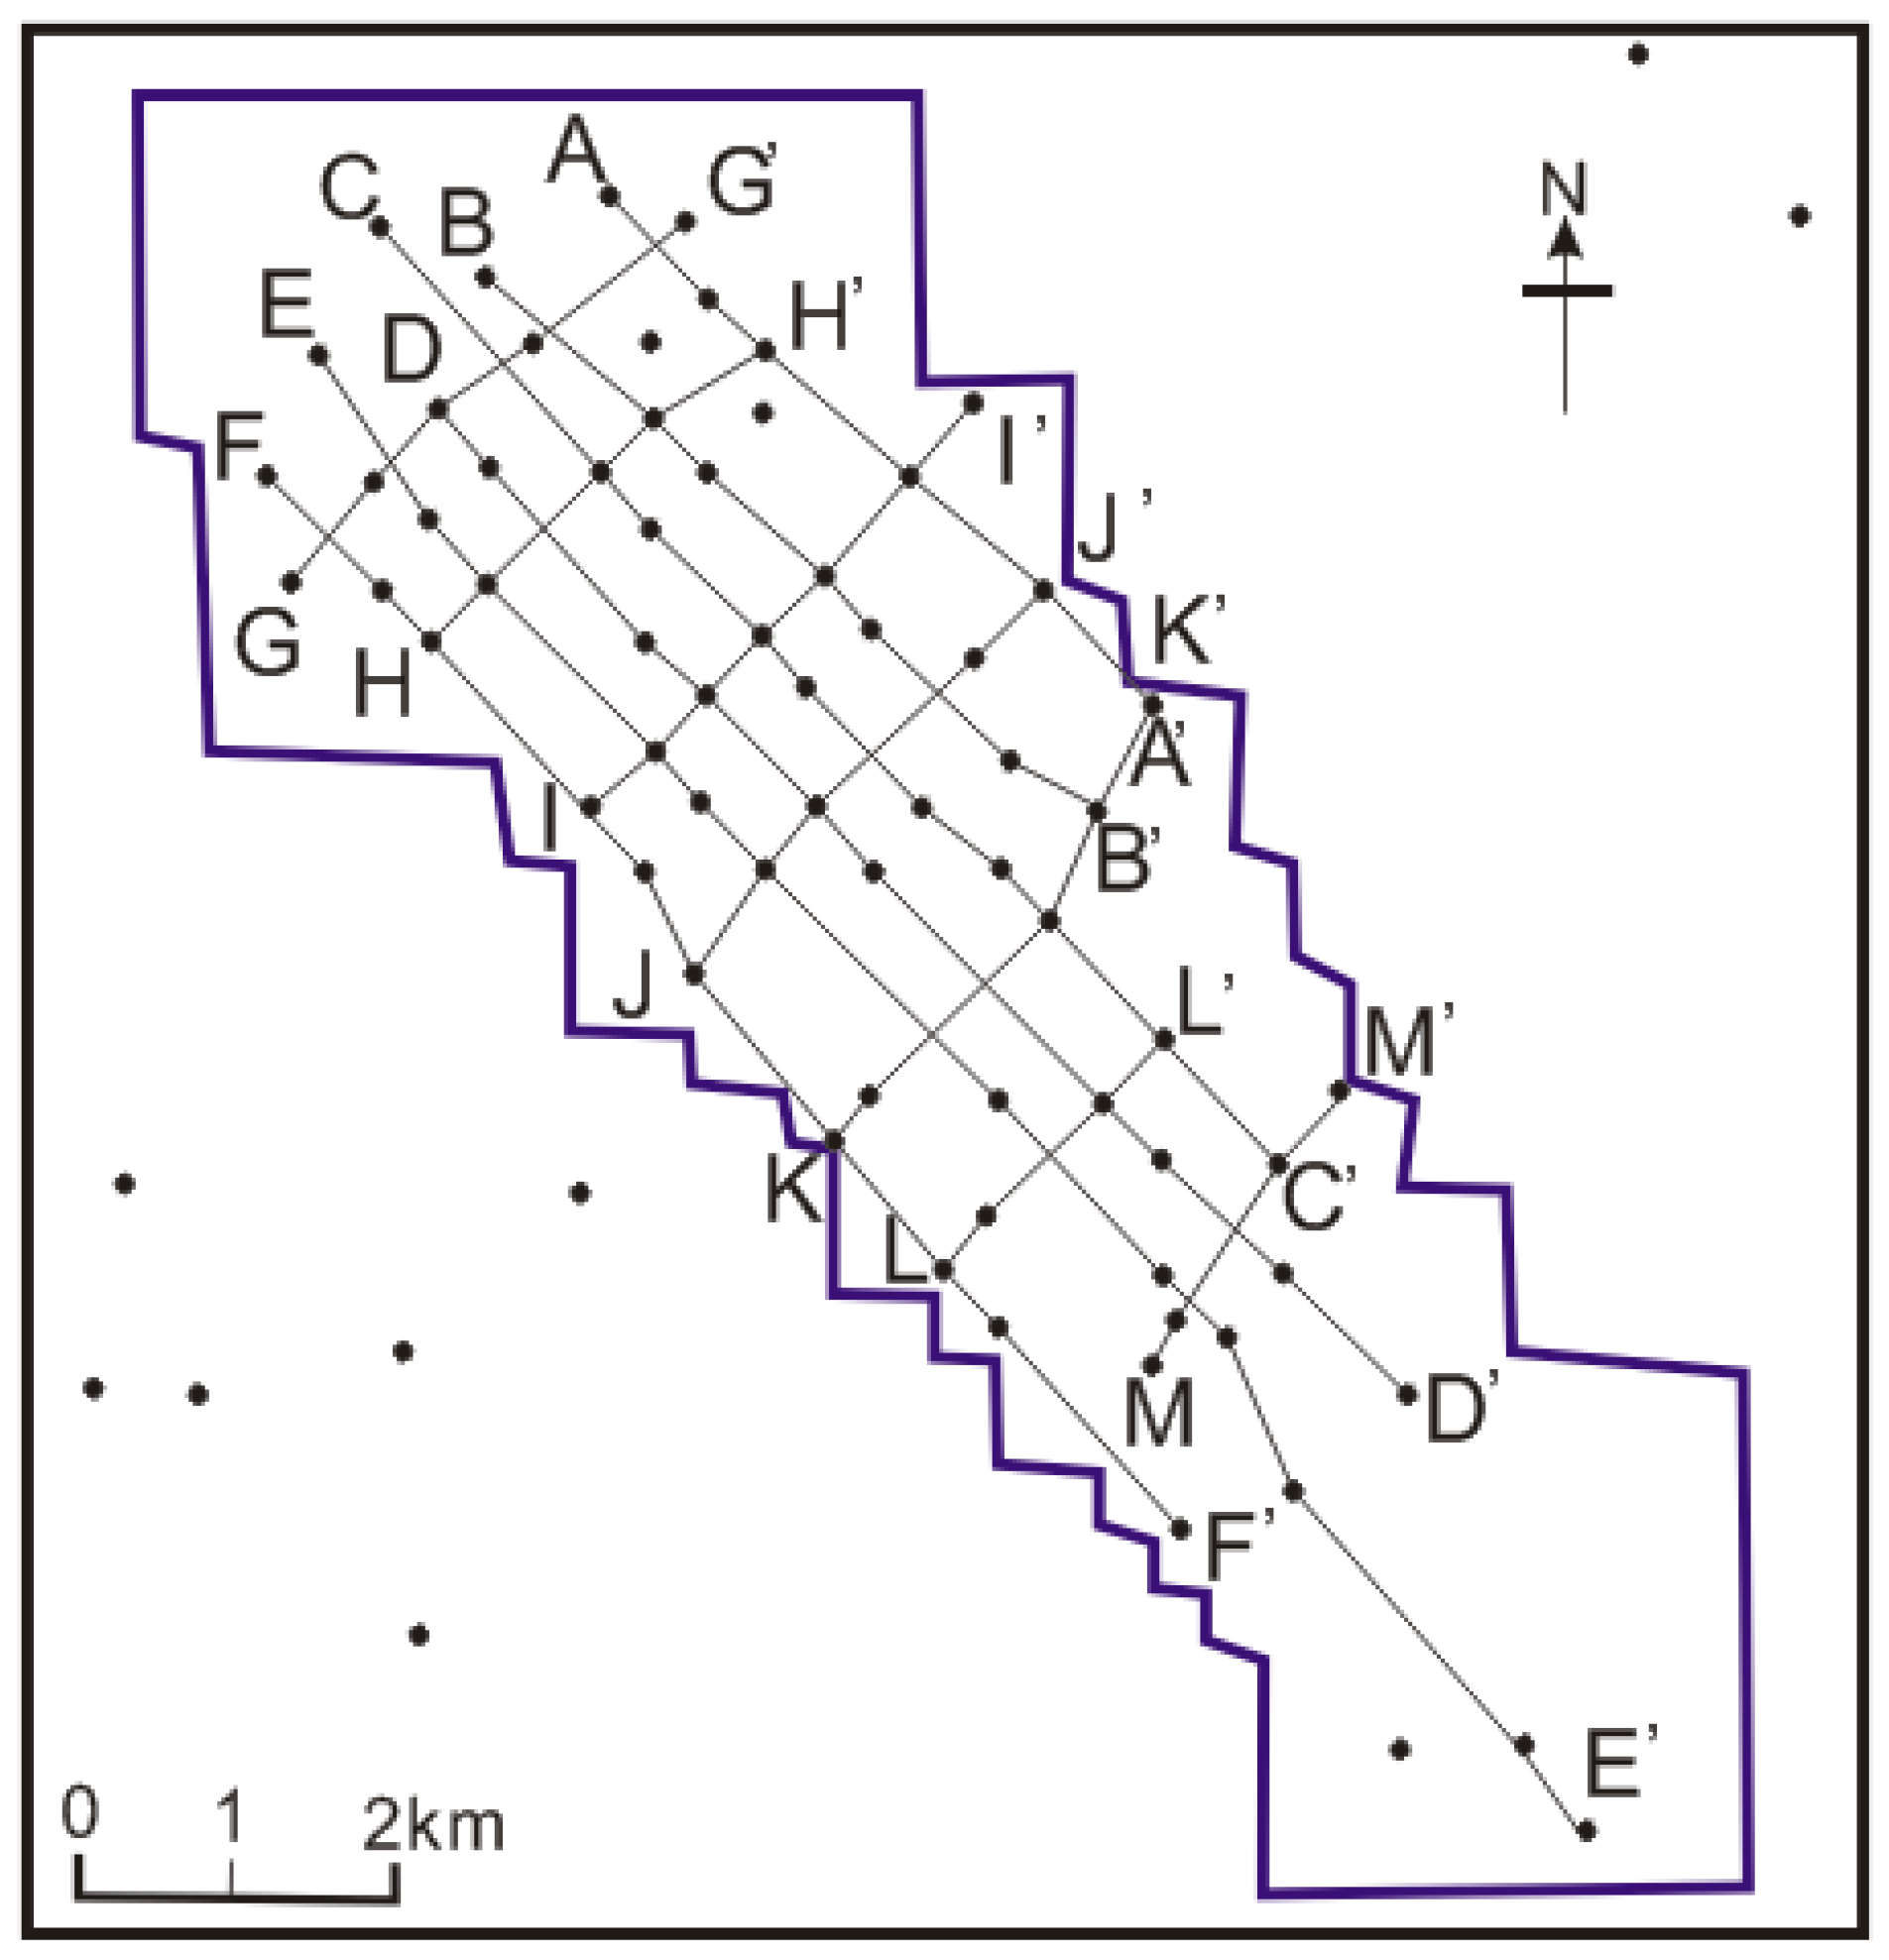
2. Study Area and Methodology

The study area is located in the central Athabasca oil sand area, in the Lower Cretaceous McMurray Formation within the Alberta Basin, approximately 100 km northeast of the city of Fort McMurray (Figure 1) [10,11]. The Alberta Basin is a foreland basin (Figure 1) [10,11] that is located between the Canadian Shield and the Rocky Mountains. The main production areas of Canada’s oil sands are Athabasca, Cold Lake, and Peace River, all of which are located within the basin [12,13,14].
The Athabasca oil-sand deposits have been the focus of much research relating to stratigraphy, sedimentology, ichnology, and reservoir characterization [15,16,17,18,19,20,21,22,23,24,25]. The Wabiskaw-McMurray formation is considered to be a succession of fluvial, estuarine, and shore facies [16,18,19]. Carrigy [26] subdivided the McMurray formation into three stratigraphic units, the Lower McMurray (L.MCMU), Middle McMurray (M.MCMU), and Upper McMurray (U.MCMU), based on lithological variations, and these units have been widely used by recent researchers [18,25]. In this respect, the following is generally considered: the L.MCMU contains braided fluvial deposits that infilled paleo-topographic lows, and it mainly consists of massive sandstone and coarse pebbly conglomerates that were deposited within shallow meandering fluvial channels [17,24,25]; The L.MCMU Formation was regionally eroded during the transgressive period in which the Boreal Sea invaded the Alberta Basin from the northwest (Figure 2). Rivers were forced to retreat from the northwest to southeast as sea levels rose, and many estuaries consequently developed. In this region of the basin, the main McMurray sand rests upon Devonian-aged carbonates, the top of which has been shown in the lithology track of a well-log answer plot (Figure 2).
The M.MCMU consists of massive inclined heterolithic strata (IHS) beds [25] and represents a tidal-influenced fluvial to estuarine environment [15,16,20]; and the U.MCMU consists of fine-grained deposits dominated by estuarine facies [17]. It is also generally believed that the McMurray Formation was formed in a fluvial-estuarine depositional environment [17,19]. However, although the architecture of the L.MCMU and M.MCMU deposits have been widely studied [24,25], the architecture of the tidal bar in the U.MCMU has not yet been well established. This study, therefore, focuses on the tidal bar deposits in the U.MCMU.
In this study, standard petrophysical analyzes were conducted on wireline log data obtained from 448 wells in Athabasca. In addition, the data from all wells were subjected to quality control in terms of nomenclature standardization; curves were corrected for environmental and wellbore effects. The final data products obtained were used to analyze sand body thicknesses in the McMurray Formation with respect to the isopatch map (Figure 1) [10,11].
As previously mentioned, core observation data from 69 wells were used in this study (Figure 3), and the lithological variabilities were studied in detail based on geophysical well log attributes. All data were used to present details of sediment facies and facies associations.

3. Facies Association and Interpretation

Core observations enabled 13 facies to be distinguished (Table 1), and from this information, four facies associations in the McMurray deposits were proposed: tidal influenced fluvial deposits, tidal flat deposits, tidal bar deposits, and tidal bar caps. It is notable that the terms “architectural element”, “architectural surface”, and the hierarchy used in element analysis are widely employed in classical architecture with respect to the construction of fluvial systems [6,27,28], whereas the terms “facies” and “facies association” are widely used in architecture with respect to the construction of construct marine deposits [3,29,30,31,32,33]. This current study uses the latter terms, as it focuses on analyzing estuarine architecture. The key characteristic features of each of the facies associations are described in the following text.

3.1. Facies Association FA1

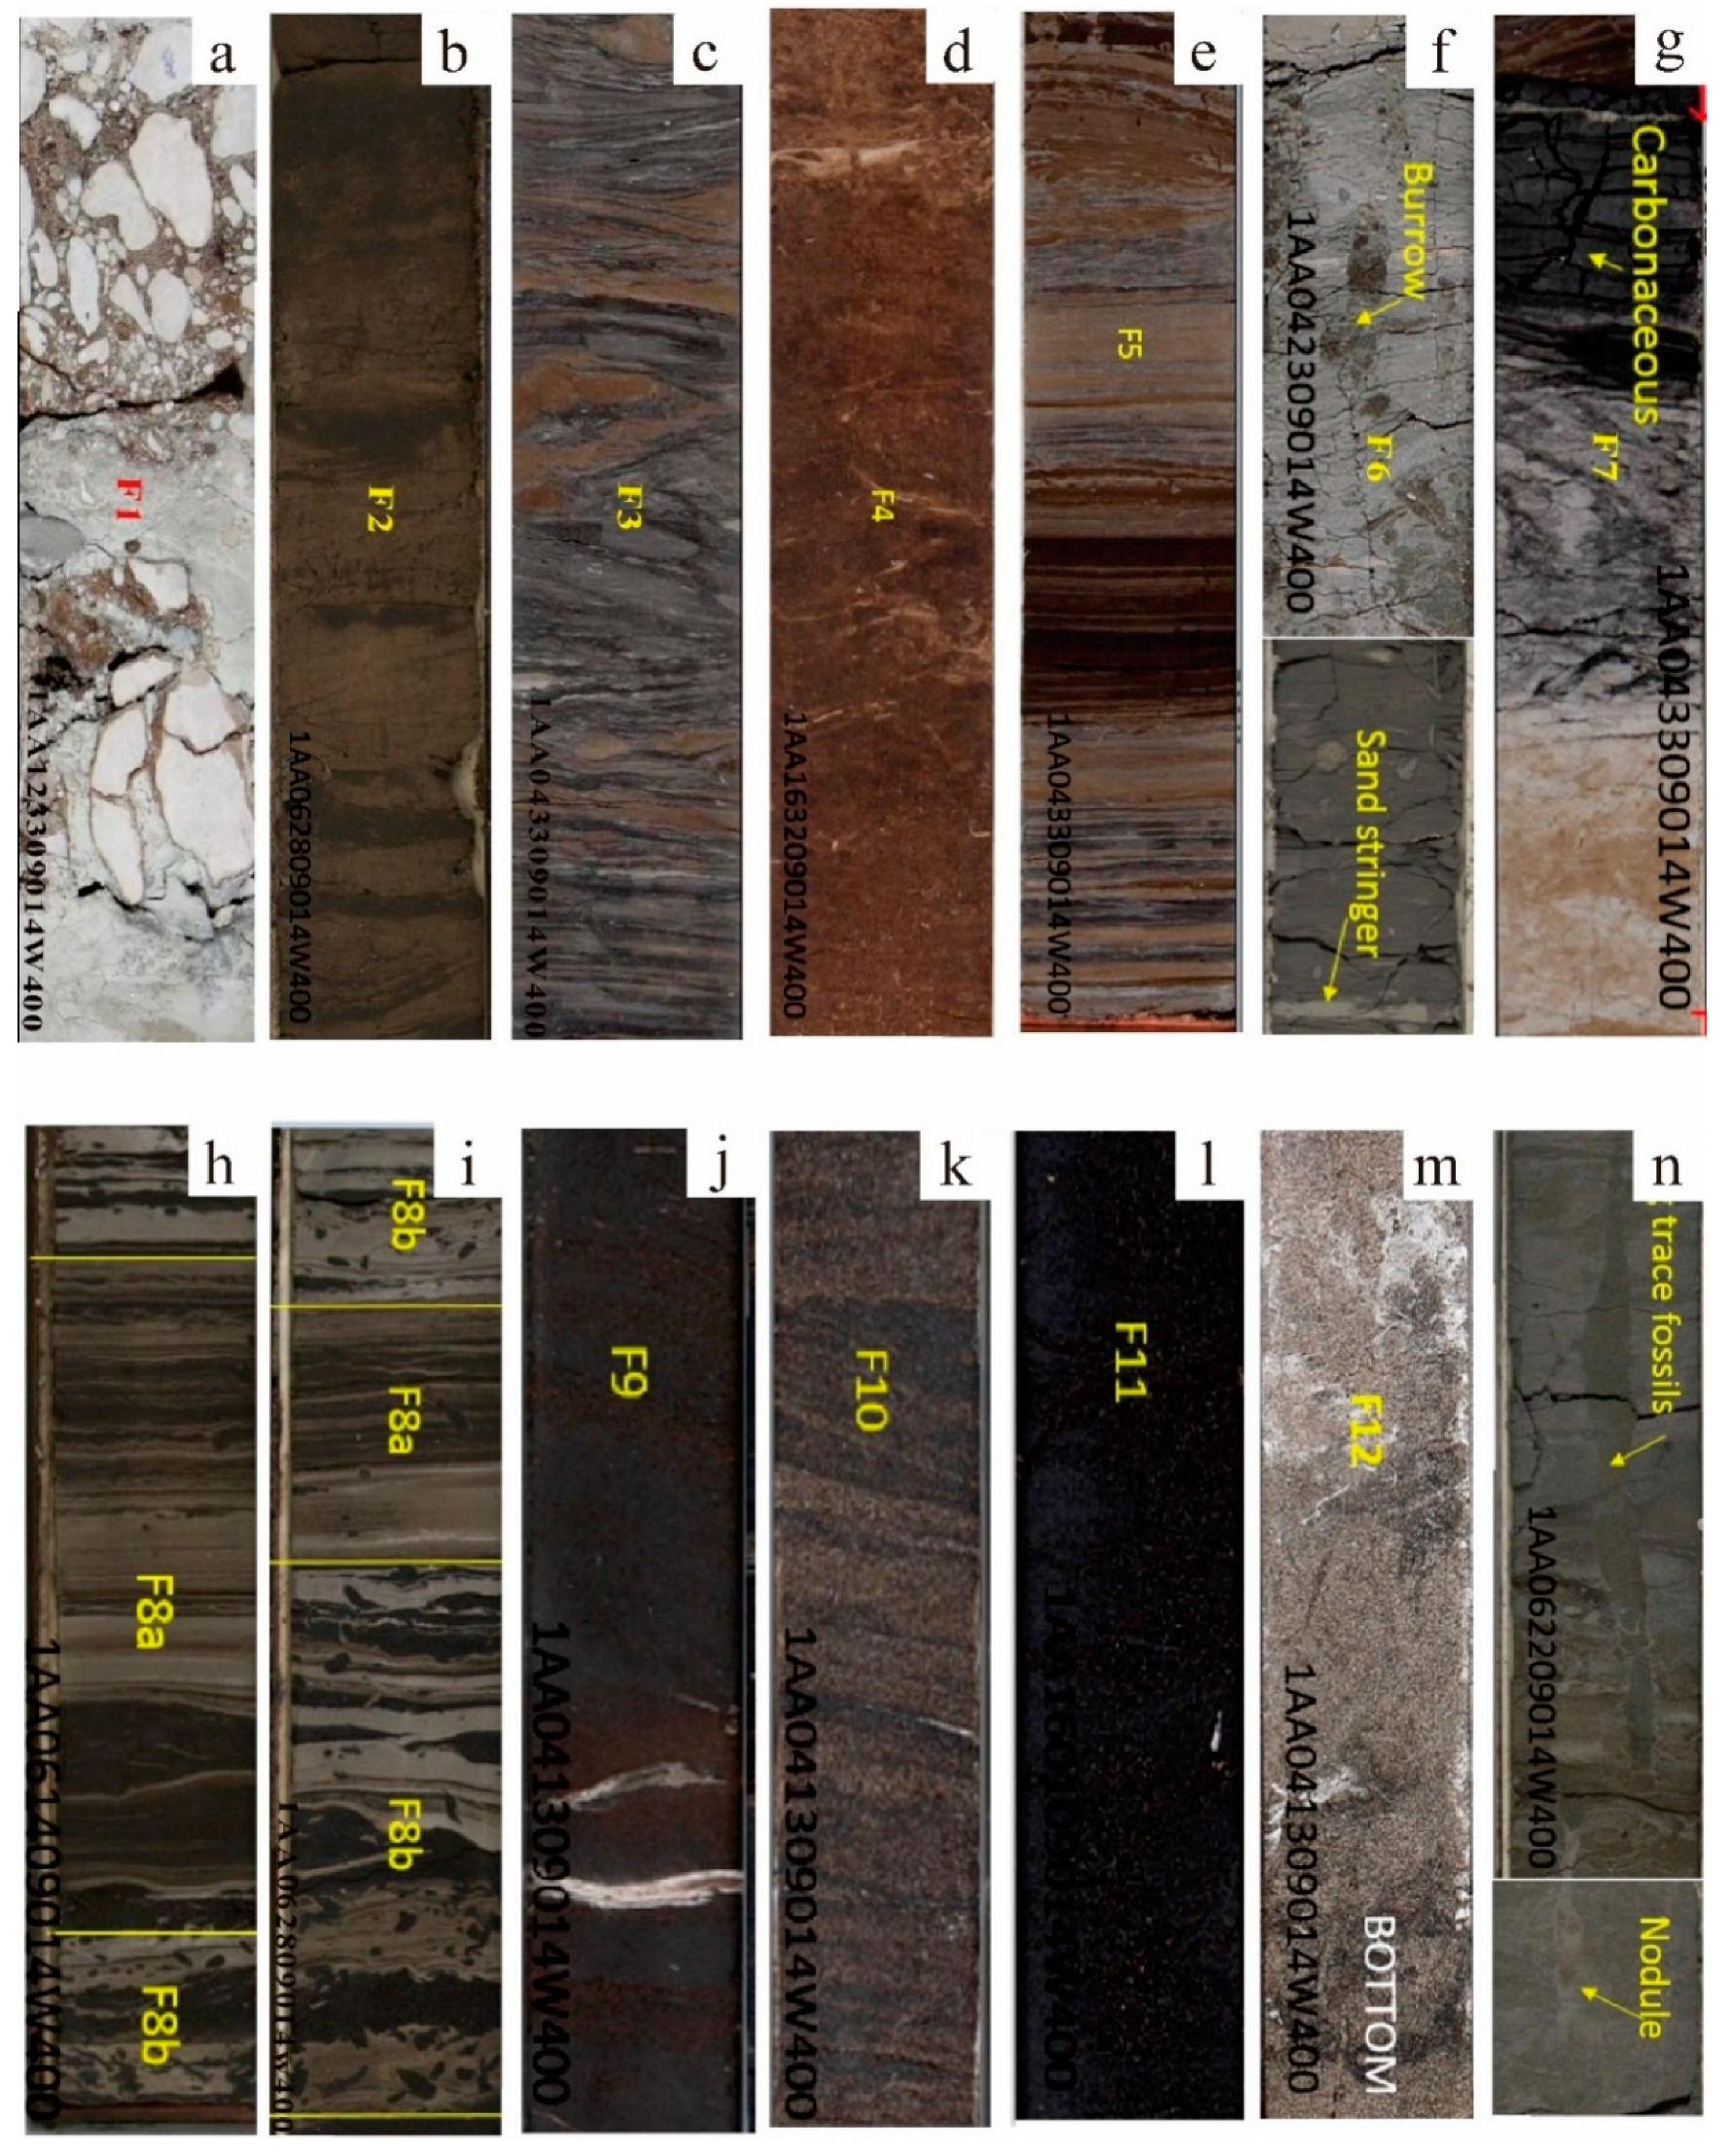
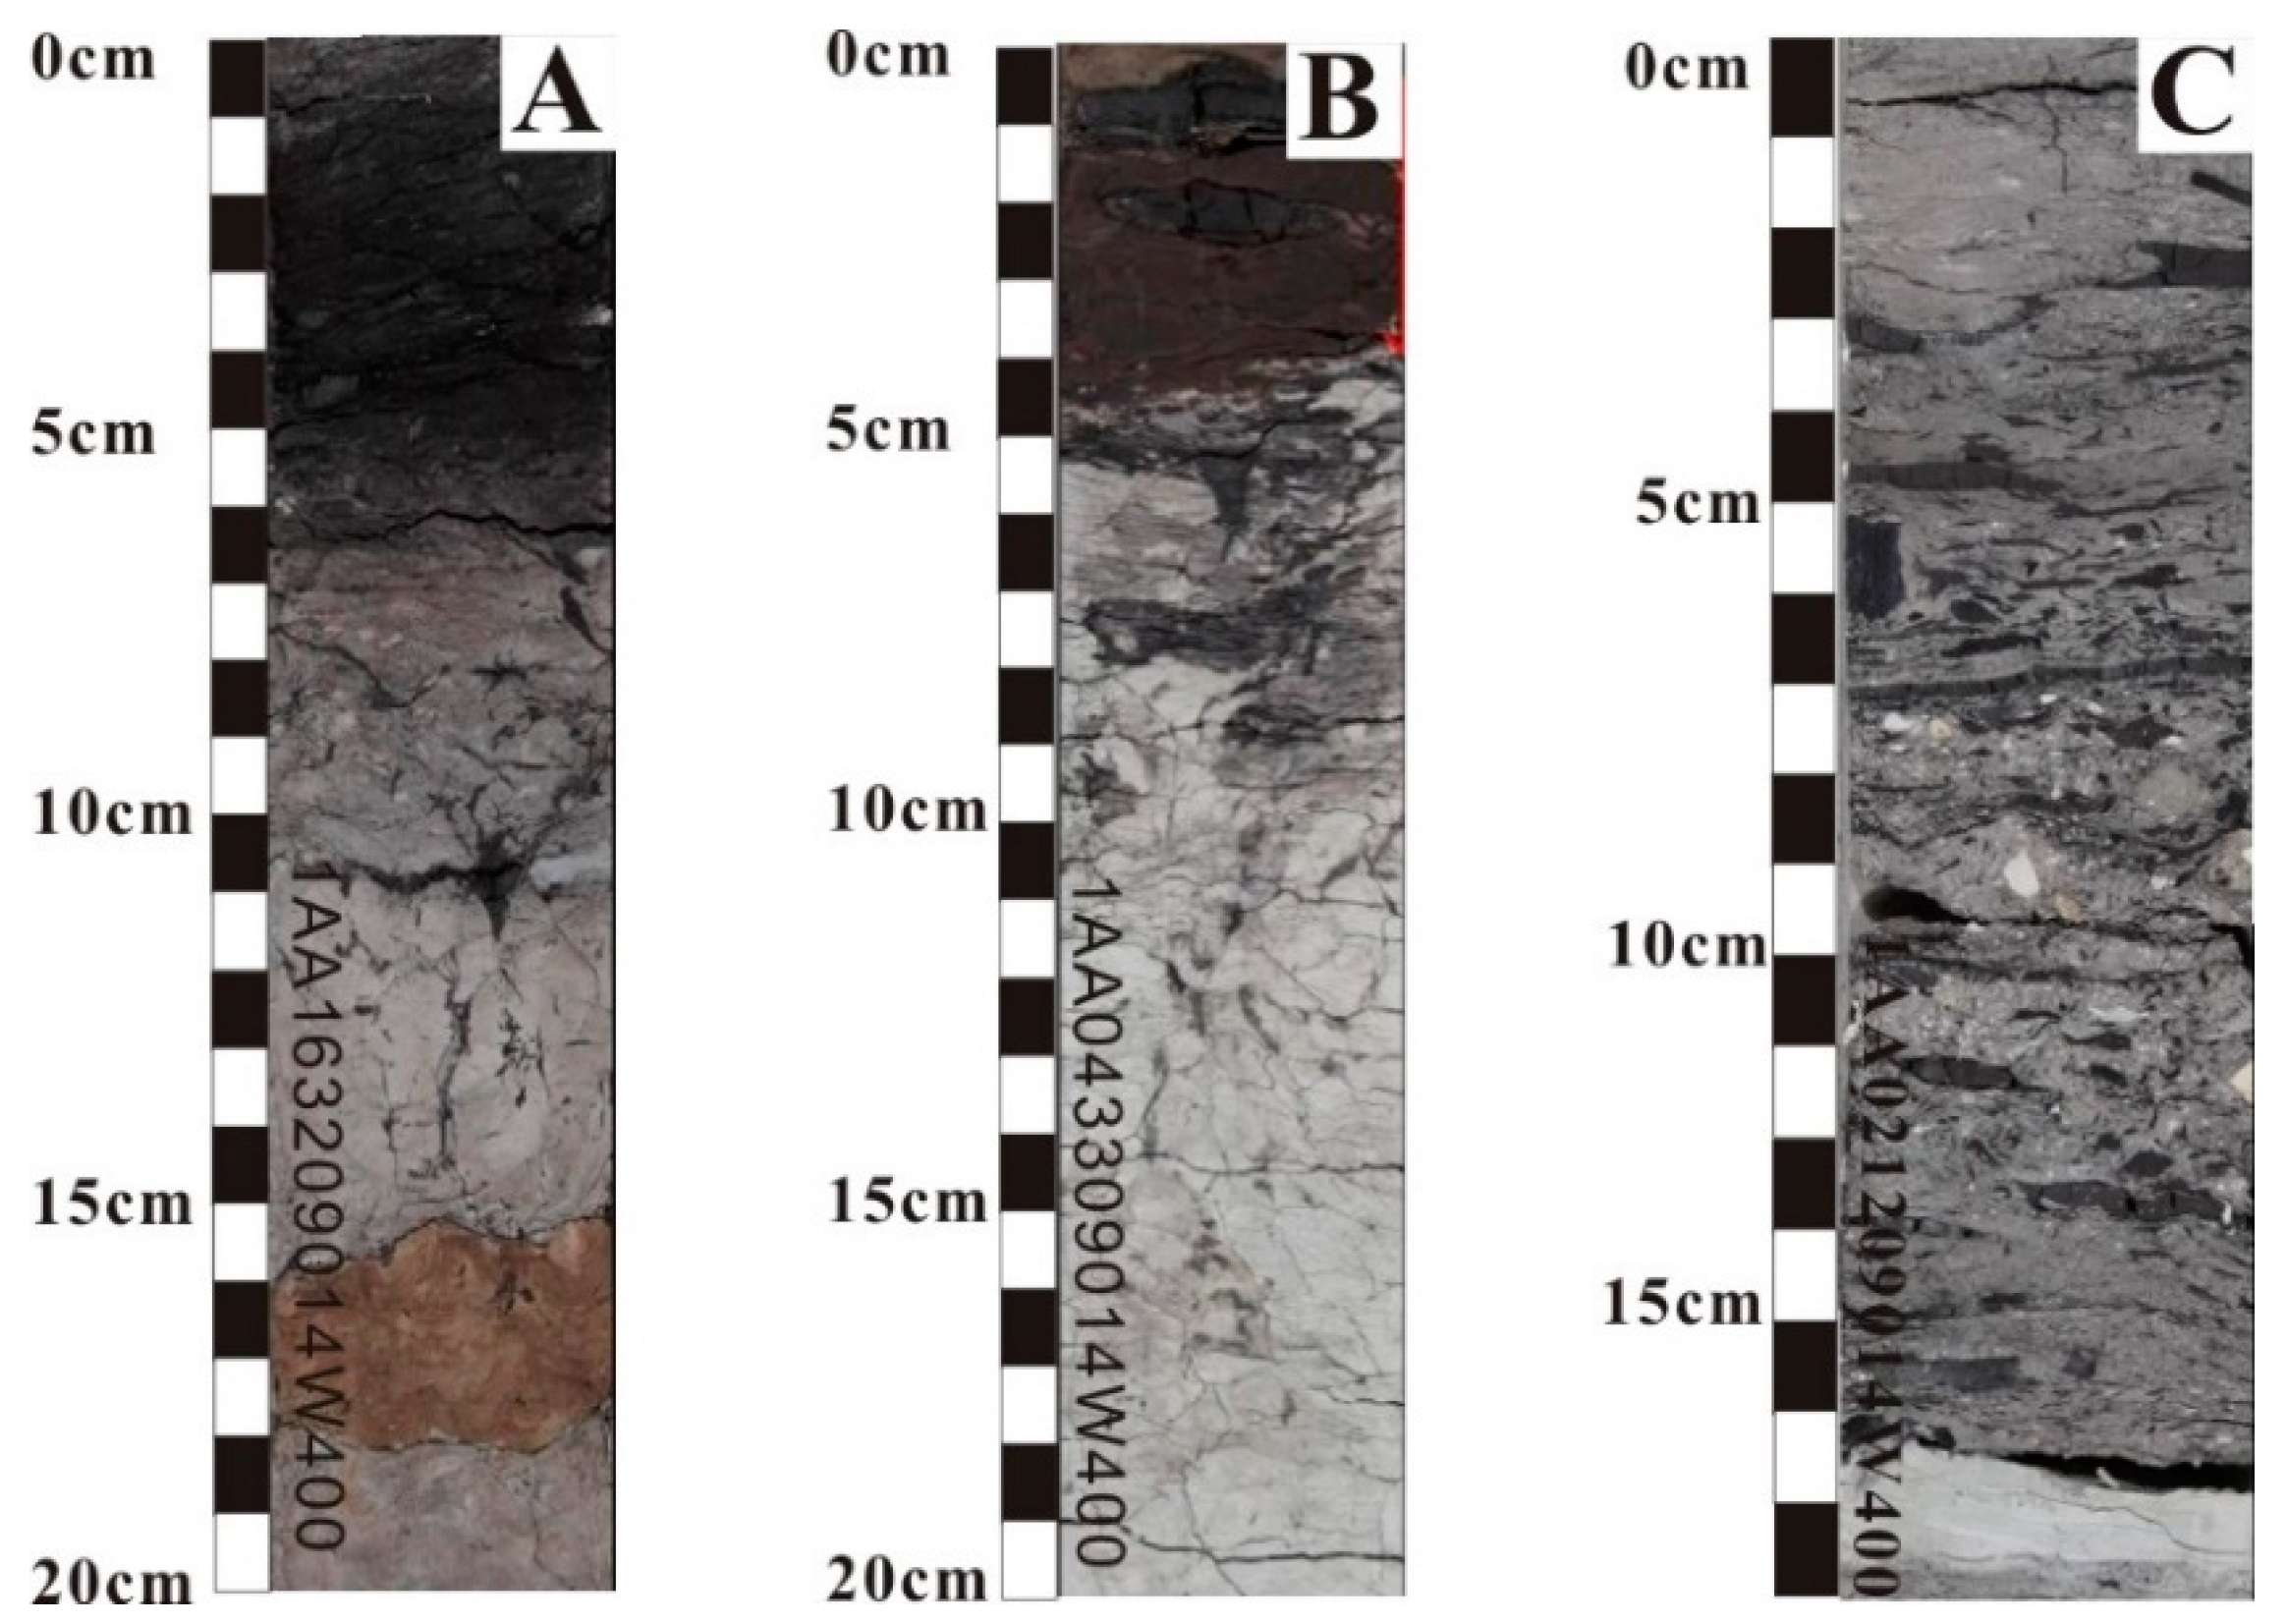
3.1.1. Facies F1: Mud Clast Breccia

The F1 facies comprises mud-clast breccias that are likely the result of upstream point bar erosion during fluvial or tidal flooding periods (Figure 4a). The underlying contact is highly erosional, and the high cohesiveness of these clasts suggests a short transport distance. Furthermore, the thickness of this facies implies a high abundance of mud within this environment [11]. It is considered that F1 was formed from cut bank or point bar derived breccia [34], but a comparison with bedding in nearby wells is required to determine this classification. However, in this study, F1 indicates a fluvial depositional setting [35].

3.1.2. Facies F2: High-Angle Cross-Stratified Sands

Facies F2 facies comprise unidirectional large cross-stratified sands with bitumen-saturated laminae (Figure 4b). However, the sedimentary features are mostly obscured by saturated oil. Facies F2 is related to the rapid deposition and migration of bedforms. Organisms could not easily inhabit the high-energy substrate, and thus the bulk of F2 is unburrowed. The occasionally presented burrow may indicate a pause in bedform migration [36].

3.1.3. Facies F3: Low-Angle Cross-Stratified Sands

Facies F3 comprises uniformly low-angle, dipping, laminated bedding (Figure 4c). F3 is mostly mud-dominated in the study area. Most of the biogenic structures within F3 are Planolites, while a few of the beds at the boundary areas of facies F3 and F8 contain three trace fossil genera: Planolites, Gyrolithes, and Cylindrichnus. Facies F3 records the laterally accreted tidal-fluvial point bars in the study area. The work of Hauck et al. [37] and Pemberton [21] show that the bioturbation intensity is usually low in tidal-fluvial point bar due to fluctuating salinity and high sedimentation rates. However, in this study, bioturbated muds were observed, and Brekke and Envoy [38] reported similar results. The bioturbated muds indicate that the deposition rate was slow in this area, and there was time for infauna to inhabit and churn facies F4.

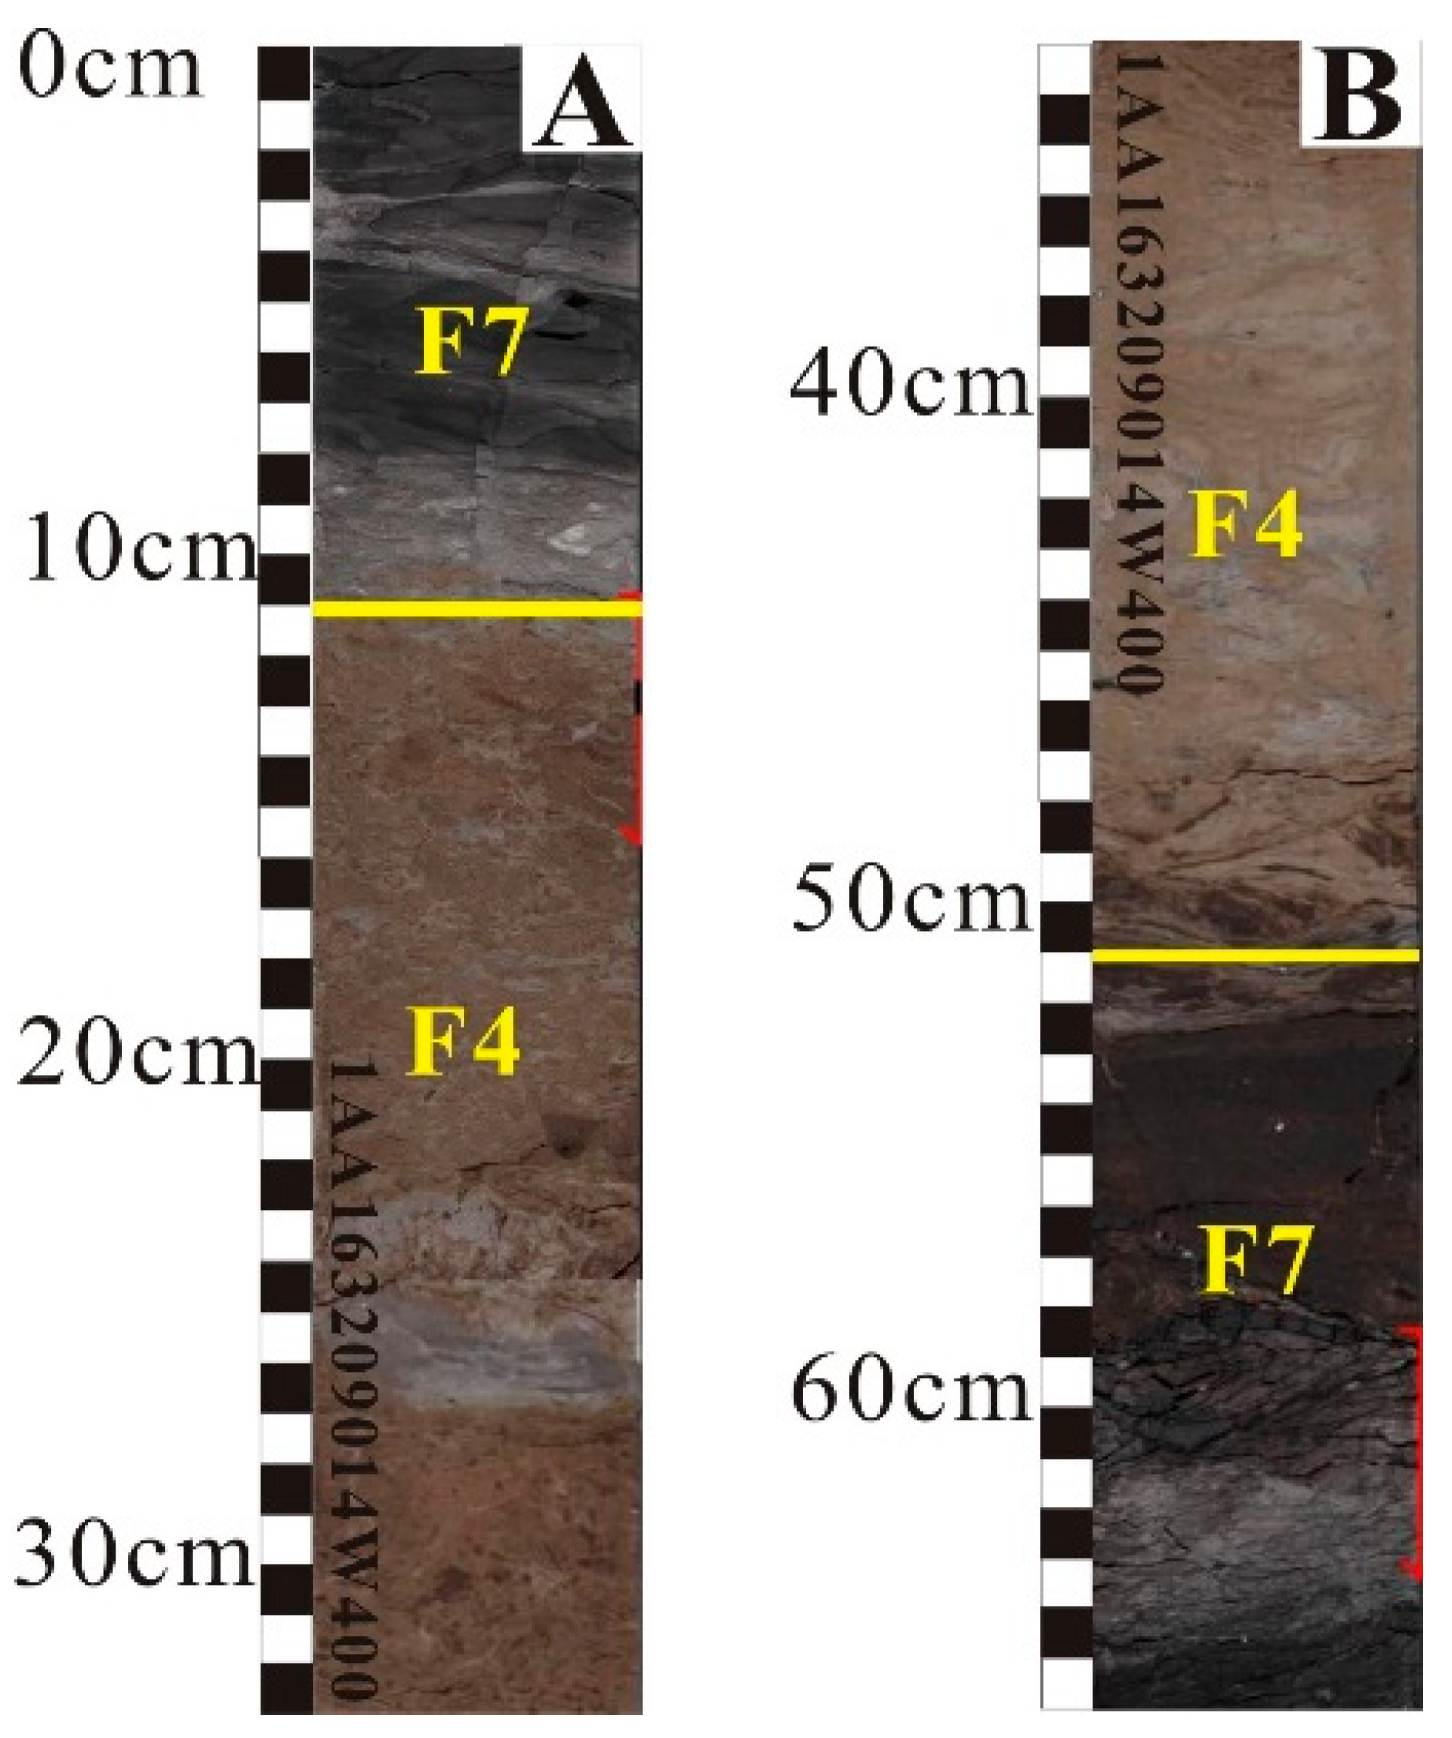
3.1.4. Facies F4: Consolidated Sand Clay

F4 facies comprises consolidated sand clay with slightly heterolithic fine-grained sands (Figure 4d) and substantial amounts of bioturbated consolidated sand clay. Bedding is extremely evident in facies F4. The leading fossils are scattered carbonaceous debris and disintegrating woody fragments. Facies F4 represents salt marsh and flood plain deposition that occurred with brackish water. The pervasive bioturbation indicates that facies F4 was deposited relatively slowly. It is considered that F4 was deposited in between carbonaceous muds facies F7 (Figure 5), which indicates that the brackish water level varied with time.

3.1.5. Facies F5: Sand Wave Bedding Mud

The F5 facies comprises medium-brown-gray silty mud with 20–25% sand occurring as wavy interbeds and lenses and some very small-scale cross-laminae ripples (Figure 4e). The sand is brown and silty, and the mud is massive to laminated and shows some convoluted laminations. The basal contact is erosional, and some cm-scale nodules from the underlying carbonate are present within the shale. The shale becomes grayer as it nears the base.
Some ripples are draped by mudstone laminae measuring a few mm-thick, which indicate slack-water periods. In addition, alternating thick and fine bundles of laminae within the dunes or ripple cross-beds suggest the occurrence of neap–spring–neap tidal fluctuations. These observations correspond to previous observations of the occurrence of slack water periods only during the high tide period [11]. Facies F5 is very similar to Facies F8, and Facies F5 is associated with Facies F4, as it usually appears in the middle of Facies F4. It is considered that facies F5 was deposited on a salt marsh during periods of seasonal high discharge fluctuations.

3.1.6. Facies F6 Clay and F7 Carbonaceous Muds

The F6 facies comprises medium- to dark-gray laminated and highly fissile shale, with abundant silty lenses and interbeds. The basal contact is burrowed with several vertical burrows on a cm-thick scale that are filled with gray-green glauconitic sand (Figure 4f) at the bottom. Some laminated medium-gray clay shale with occasional sand stringers and trace pyrites is also found (Figure 4f) together with light- to medium-gray laminated shale that becomes highly fissile and less dense; this is then followed by a few glauconitic sand grains.
The F7 facies (Figure 4g) occurs at the lower part of fluvial deposits and comprises dark-brown-reddish oxidized muds containing very fine silty laminae, the rootlets of plants (Figure 6A,B) and carbonaceous debris (Figure 6C) of plant fragments.
F6 is associated with F5, which is interpreted as a vertical accretion at the top of a point bar [11]. F7 is typically only a few cm-thick and usually appears adjacent to F6. The occurrences of F7 reflect the exposure of McMurray Formation sediments.

3.1.7. Facies Association FA1 Interpretation

Facies Association 1 (FA1) comprises tidally influenced fluvial channels (F1), point bars (F2,F3), an over bank (F5), and flood plains (F4,F6, F7). These deposits comprise upward fining bedsets that are 0- to 12-m-thick, with fine- to medium-grained, moderately sorted sandstones with eroded bases (facies F2). The eroded surfaces are typically concave up and overlain by clay-clast conglomerates; in some of the units, the cross-strata and ripples are draped with layers of mudstone that are 1- to 5-cm-thick (facies F3). Packages of moderately sorted, unidirectional, planar and trough cross-stratified sandstones that are 1- to 12-m-thick and overlay the horizontal or concave-up eroded surfaces, suggest deposition in a fluvial environment [39]. However, cross-strata with rhythmically occurring mudstone and mica drapes (facies F5) indicate a tidal influence [40]. Fossil root fragments are found on internal eroded surfaces and the bottom sets of cross-strata (facies F7), which indicate a salt marsh environment. The systematic occurrence of mudstone drapes to unidirectional ripples suggests a strong tidal influence and deposition in a fluvial channel below the tidal limit1. Cyclic thickening and thinning of the paired drapes along individual cross-sets indicate the rhythm of neap and spring tides (facies F7).

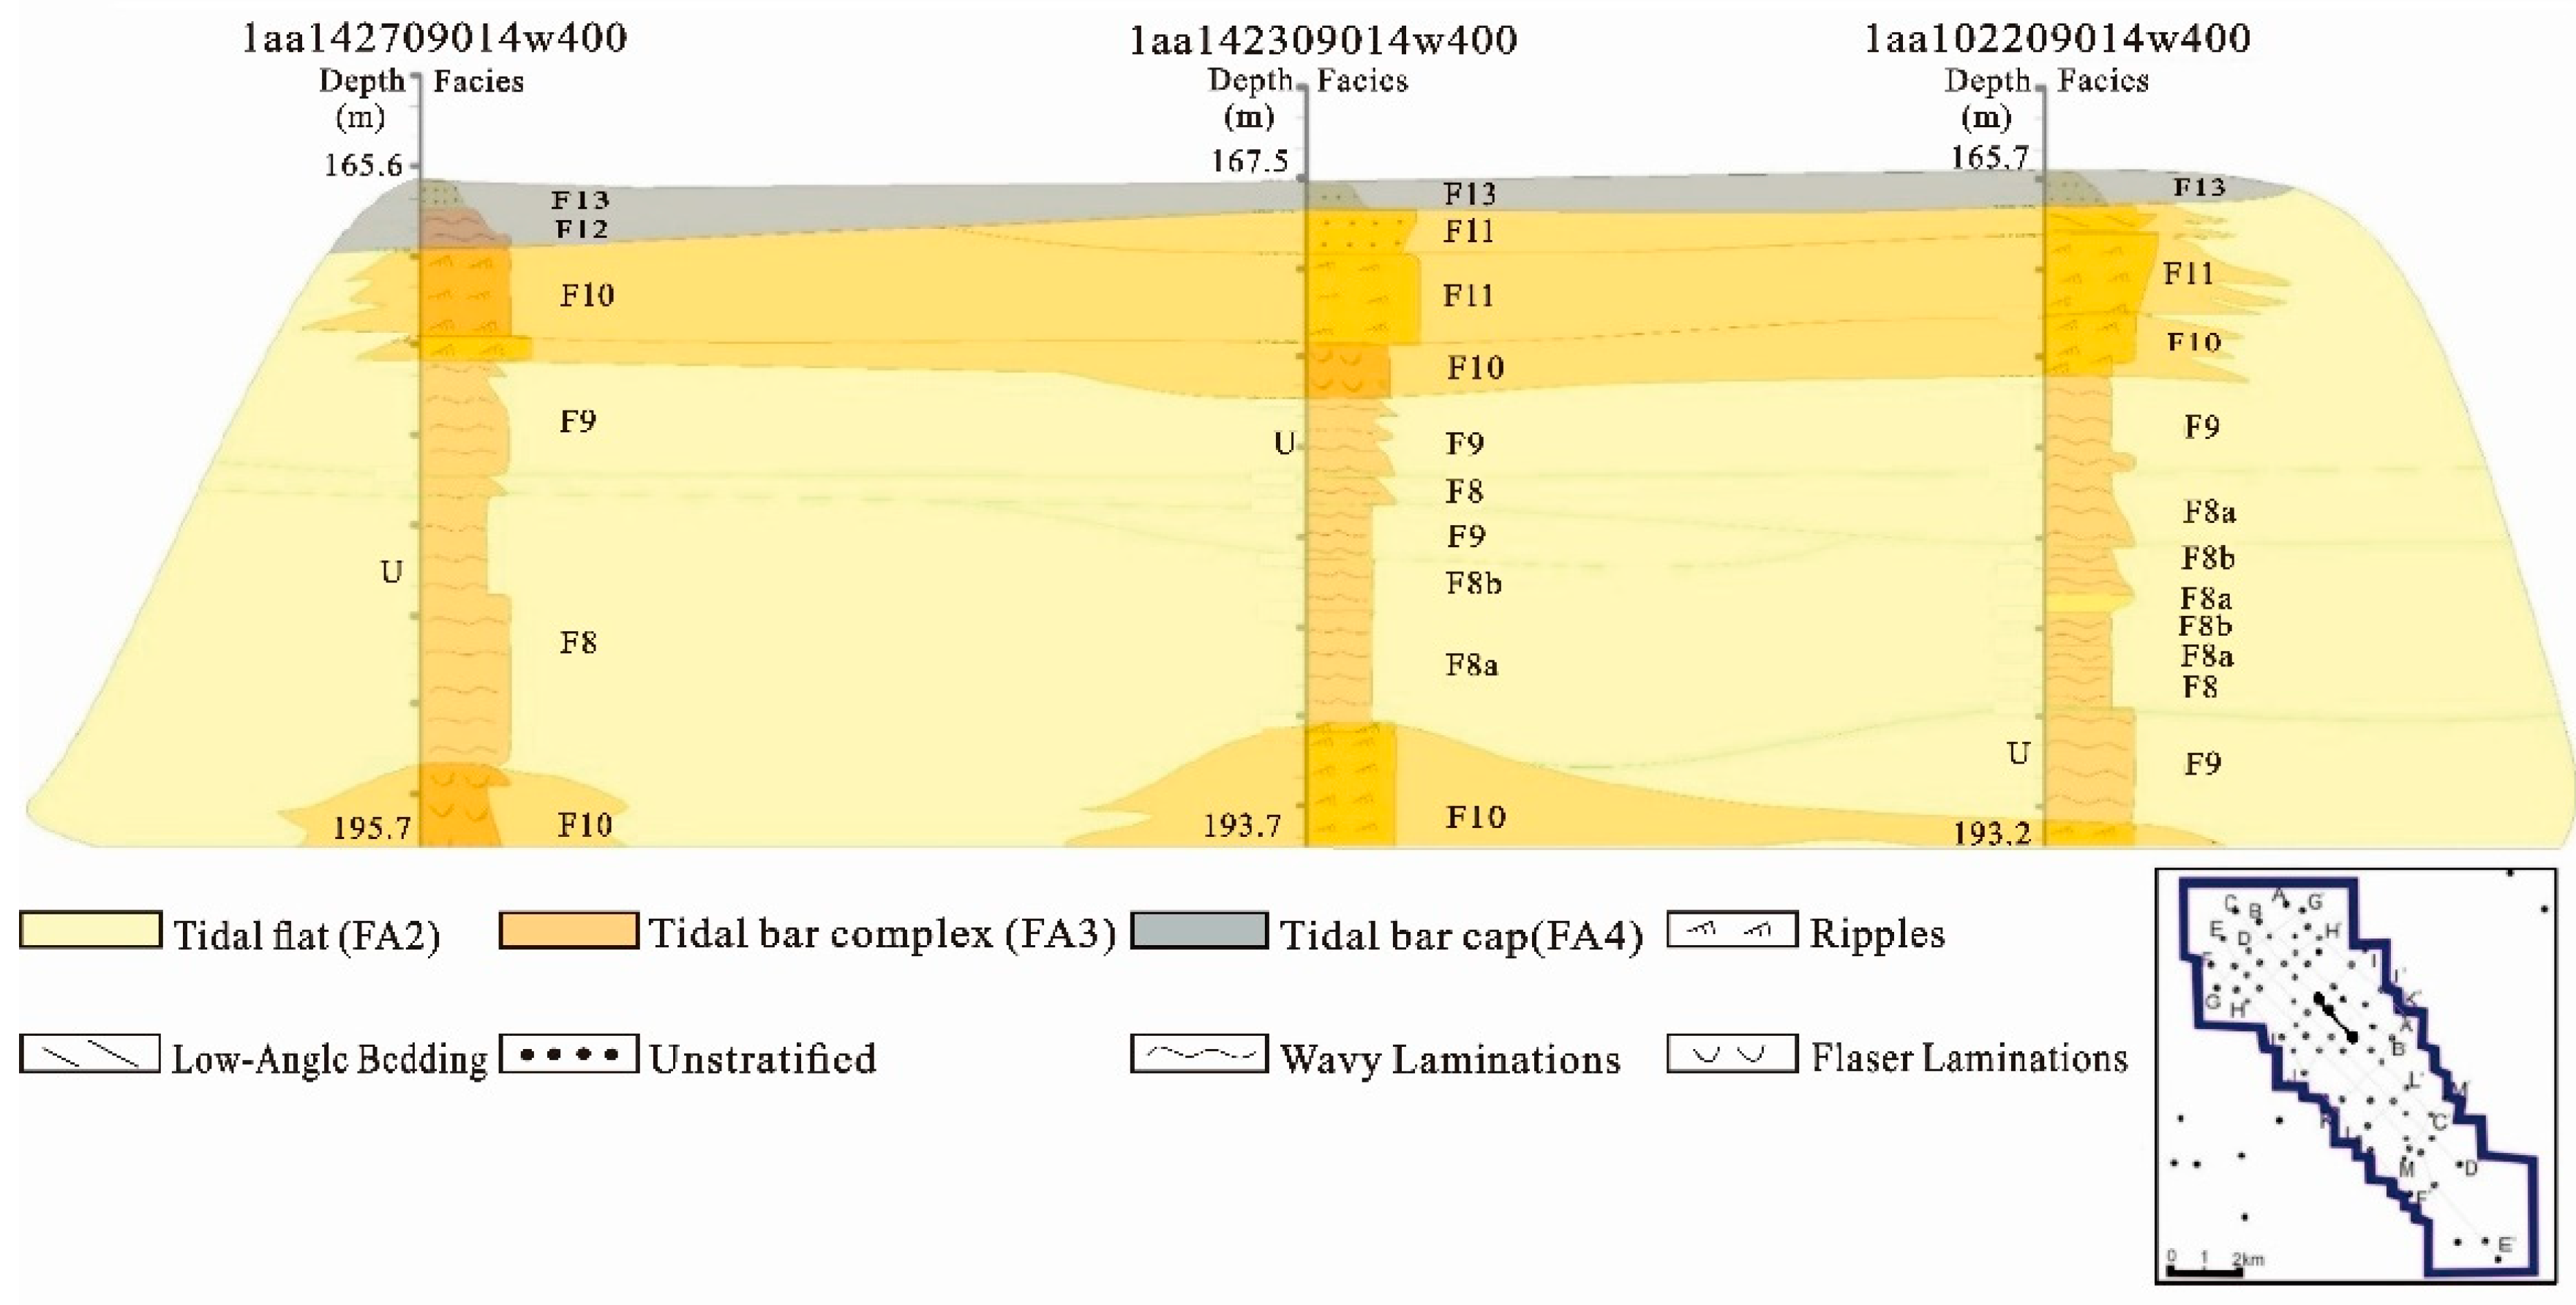
3.2. Facies Association FA2

3.2.1. Facies F8: F8a (Sand-Dominated Layers) and F8b (Mud-Dominated Layers)

The F8 facies of muddy-sand tidal rhythmites shows tidal rhythmicity, in which sand-poor packages at neap-tide and sand-rich packages at spring-tide are identified (Figure 4h,i). The F8 face is formed by F8a sand with shale interbeds and F8b laminated shale sand (Figure 4h,i); the F8b face shows interbeds/laminations of gray to brown shale on a mm-scale, with interbeds of vfL black sand on a mm- to cm-scale. Bioturbation is very slight and mostly exists in horizontal burrows.
The F8a face comprises sand with shale interbeds, and beds of vfU clean black to brown sand on a cm- to dm-scale that are interbedded with beds of laminated vfL brown sand and light gray-brown shale on a dm-scale. The sand is slightly laminated in places and very loosely consolidated. Sand and shale laminae show slight bioturbation, rare carbonaceous laminae, and some mm-scale scour marks where clean sand overlays interlaminated sand and shale. The F8a face shows sand/clay with massive bioturbated vfU sand interbedded with 20–50% medium-gray clay, trace fossils filled with rich sand, and light- to dark-brown intensely bioturbated sand with trace amounts of light- to medium-gray mud and small burrows (Figure 4h,i).
The F8b face comprises clay/sand with massive medium-gray clay interbedded with 50–100% bitumen sand. There is more sand at the top than at the base. Abundant bioturbation and trace fossils filled with bitumen sand are also found (Figure 4h,i).
Facies F8 represents a mixed sand and mud flat that includes fine sand, a high mud content (20–100%), and strong bioturbation compared with facies association FA1. This facies association comprises thin sandstone and mud drape rhythmites and is interpreted as being a tidal flat deposit [41].

3.2.2. Facies F9: Laminated Sand with Mud

The F9 facies comprises an interval of upward fining of fU to mL moderately to well sorted, black subrounded sand, and 10–20% interbeds of medium- to dark-brown-gray silty mud on a mm- to cm-scale (Figure 4j). The mud interbeds are massive to laminated and sometimes contain carbonaceous interlaminae. Some of the mud beds were disturbed and have resulted in a boudinage appearance. Woody and carbonaceous debris are commonly scattered and some of this is lightly pyritized. Facies F9 is interpreted to represent an open estuarine sand flat deposit that is associated with Facies F8.

3.2.3. F Facies Association FA2 Interpretation

Facies Association 2 consists of a package of mudstone and siltstone that is 17-m-thick with very fine-grained sandstone beds that are 10 mm–300-mm-thick. Although the deposits vary both vertically and laterally across bedsets, they can be classified into three broadly defined facies: F8a is a clay/sand facies where mud is slightly laminated in places; F8b is a sand/clay facies with massive medium-gray clay interbeds and extensively bioturbated sandstones; and F9 is laminated sand with mud (Vsh 10–20%). Structureless mudstones with local swirls indicate soft-sediment deformation or post-depositional biological reworking in the mudstone, which suggests deposition in marshes or intertidal flats.

3.3. Facies Association FA3

3.3.1. Facies F10: Cross-Bed Sand

The F10 facies (Figure 4k) comprises loose to slightly compact, brown-to-black, well-sorted, subrounded-to-rounded sand; very rare silty laminae; and scattered carbonaceous debris. The bitumen stain and compactness increase downward.
Facies F10 is interpreted as being the lower part of a tidal bar. It is linked with the coarsening-upward successions of tidal flats (F8, F9), and is associated with the clean upper part of a tidal bar (F11). The form of the elongated tidal bars is determined by the relative strength of the fluvial and tidal currents [42]. Maguregui and Tyler [43] analyzed the elongate nature of tidal bars, based on closely spaced subsurface data obtained in Lagunillas Field, and reported tidal bars to be 1–4 m-thick. The boundaries of F10 and F11 are important features dividing the stages of the tidal bar. The thickness of each of the tidal bar stages is about 1–4 m, and this in agreement with the results of Maguregui and Tyler [43].

3.3.2. Facies F11: Clean Sand

The F11 facies comprise an interval of upward fining of fU to mL black, moderately to well-sorted, subrounded sand (Figure 4i). The top part is flushed, whereas the basal part has rare mud beds, which are possibly reworked and are on a mm-scale, or they possibly represent bioturbation fill. The sand is loose, and faint trough cross-bedding is visible.
Facies F11 represents the upper part of a tidal bar and is associated with F10. The oil saturation of facies F11 is higher than that in F10, and the color of F11 is much darker than F11. The low bioturbation intensities and trace fossils indicate a high-energy sediment environment [11].

3.3.3. Facies Association 3 Interpretation

These deposits include an upward-coarsening, sheet-like unit that is 2- to 6-m thick, extends laterally from several kilometers to 10-km and is 2- to 5-km wide. This facies association is characterized by its coarse grain size, pure sand content, and low mud content (<7%). The sandstone body is composed of thick and orderly stacked sets of cross-stratified sandstones, which are believed to be key criteria for recognizing tidal environments [44]. This facies association is composed of a series of up-coarsening units of cross-stratified sand. Mud drapes deposited during a slack-water period are common at the low part of each unit, and there are eroded surfaces at the base of each unit. This facies association is interpreted as being a tidal bar deposit, and each up-coarsening unit is a single-stage tidal bar. The deposits change gradually upwards within this section, and they were mapped as three different facies on bedding diagrams (facies F9, F10, F11). However, some of the individual bedsets become gradually thinner, more shale-rich, and increasingly bioturbated over kilometers until they are no longer determined as being distinct units (in terms of F8a and F8b). Outcrop observations and measurements from the Cretaceous McMurray Formation indicate that the paleo tidal sand bar was deposited on fluvial deposits and was approximately 7–15 km long, which is similar to that shown in 2-D architecture section and 3-D architecture model results (Figure 7 and Figure 8).

3.4. Facies Association FA4

3.4.1. Facies F12: Bioturbated Sand

The F12 facies comprises brown, very loose, flushed, subrounded-to-rounded, moderately sorted sand with 25–30% mud (Figure 4m). Mud occurs as rare wispy interbeds and bioturbation fill, and sand is more bioturbated than the mud content indicates. Slightly glauconitic facies occur at the top, with the percentage of glauconite decreasing downward to <5% at the base. Some F12 facies contain bioturbated sand; black, moderately sorted sand with scattered acicular mud clasts on a mm-scale; and reworked mud-filled ichnotraces. In addition, some of the mud beds are slightly salty. The sand becomes very tight and bleeds (although not truly indurated) at the top.
F12 is representative of marine sediments. The mineral glauconite is believed to have been formed by the progressive absorption of potassium and iron by a degraded silicate lattice layer with a low lattice-charge, whereas other silicate-lattice types were eliminated under the unsuitable environmental conditions, the most critical one of which seems to be the redox potential [45]. Glauconite is found to be particularly associated with marine transgressions, which is thus in agreement with the sedimentary environment indicated by associated facies F13.

3.4.2. Facies F13: Glauconitic muddy sand

The F13 facies comprise gray-green, subrounded, moderately sorted, loose, glauconitic sand with a vfL particle size and 45–55% medium-gray silty mud (Figure 4n). Bioturbation is intense, and individual ichnotraces are large (on a cm-scale). Glauconite slightly decreases downwards. The F13 facies also comprise VfL to vfU particle-sized gray-green, subrounded, poorly sorted, glauconitic sand mixed with medium-gray silty mud. Some Diplocraterion traces with lengths of 45-cm are evident. Also present is subangular, moderately sorted, silty, gray-green glauconitic loose sand that is VfL in size and has been thoroughly bioturbated and mixed with 45–55% medium-gray silty mud. The basal contact is sharp with the occurrence glauconite. Bioturbation is intense (on a cm- to dm-scale, with some traces up to 30 cm long).
F13 represents deposition in a broad, open bay and is interpreted to be shallow marine sediments. F13 is the distal expression of F12, and the mudstones correspond to flooding surfaces that were deposited during regional transgressions of the study area.

3.4.3. Facies Association FA4: Interpretation
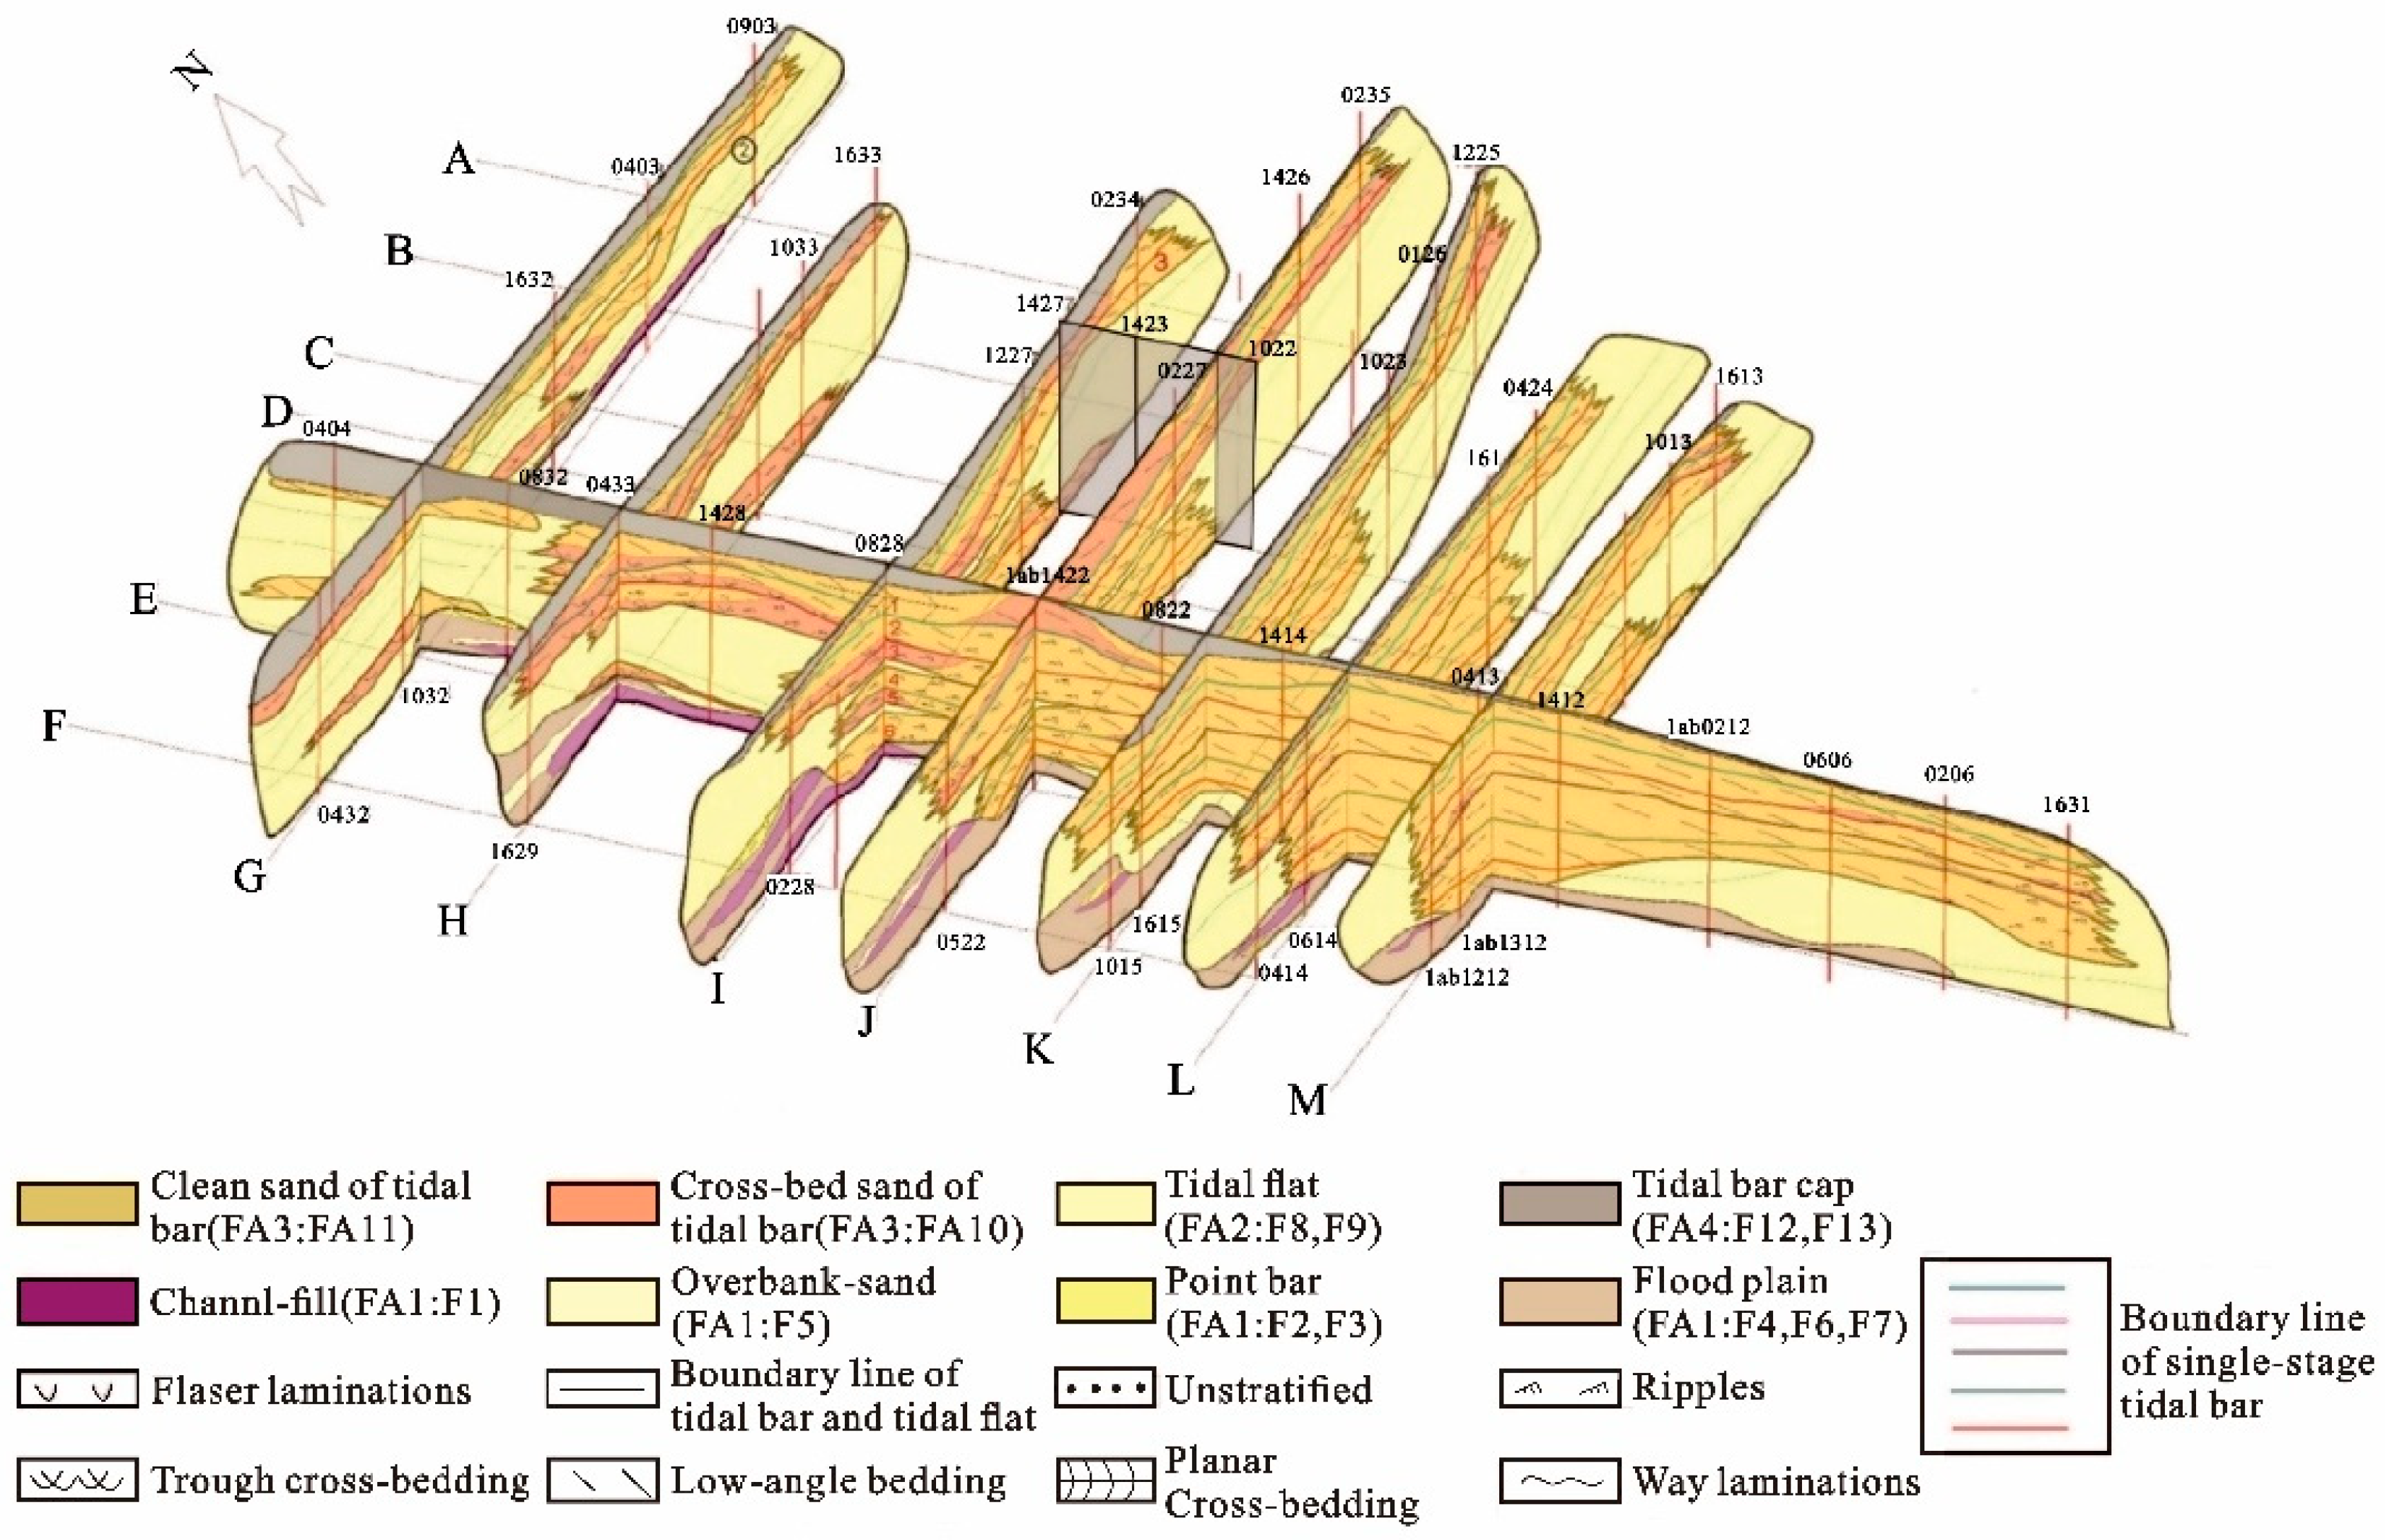
Facies association 4 (FA4) is comprised of glauconitic bioturbated sand (F12) and glauconitic muddy sand (F13). The glauconitic deposits are widespread on present-day continental shelve [46], and the glauconite found in FA4 indicates a shallow-marine sedimentary environment.

4. Discussion

4.1. 3-D architecture of Estuarine Tidal Bar

Although the whole McMurray Formation strata were originally interpreted to be a Gilbert-type delta [26], it is generally now accepted that the middle and upper McMurray Formation strata were tidal bar sand and/or influenced deposits [38,47,48], which is in agreement with the facies associations (FA2 and FA3) interpreted from our results. The origin and areal distribution of these tidal strata have attracted considerable research attention [11,38]. However, to our knowledge, only two-dimensional (2D) architecture models of these strata have been proposed, and 3D architecture has not yet been discussed.
Based on interpretations of data and facies associations provided in this work, the internal architecture of the stacked fluvial and estuarine deposits was determined and is illustrated in the construction of 13 cross-sections grouped within a 3D fence diagram (Figure 8). The estuarine sand bar deposits comprise six sand bar complex units, as shown in Figure 8 and Table 2. The geometry of the underlying fluvial deposits is also well defined, and its thickness varies in a northeastward direction.
From the 3-D architecture model, it appears that the materials forming each of the sand bar complexes were comprised of coarse particles that were too large to be easily carried away. However, a nodal area appears to have been formed around the central area (well 0822 and well 1414 in Figure 8); the action of tidal currents was reversed in this area and deposits were then formed during a slack period. Once the sand bar complex unit at the bottom had formed, there was limited movement of the nodal area2, and the six sand bar complexes eventually became vertically stacked. The heavy particles around the sand bar complexes were rolled by the tidal current up the slope, thereby forming a slope, and their direction was reversed when the tide turned. In this way, the tidal currents tended to maintain the existence of the tidal bar complex within the tidal-controlled estuarine environment.
As there was no particular point at which the ebb and the flood current met more frequently than at other points, flood- and ebb-tides were free to meet at any point from end to end around the final tidal bar complex. When one sand bar complex kernel had been formed, simulation results show that the nodal area grew more easily around the existing tidal bar.

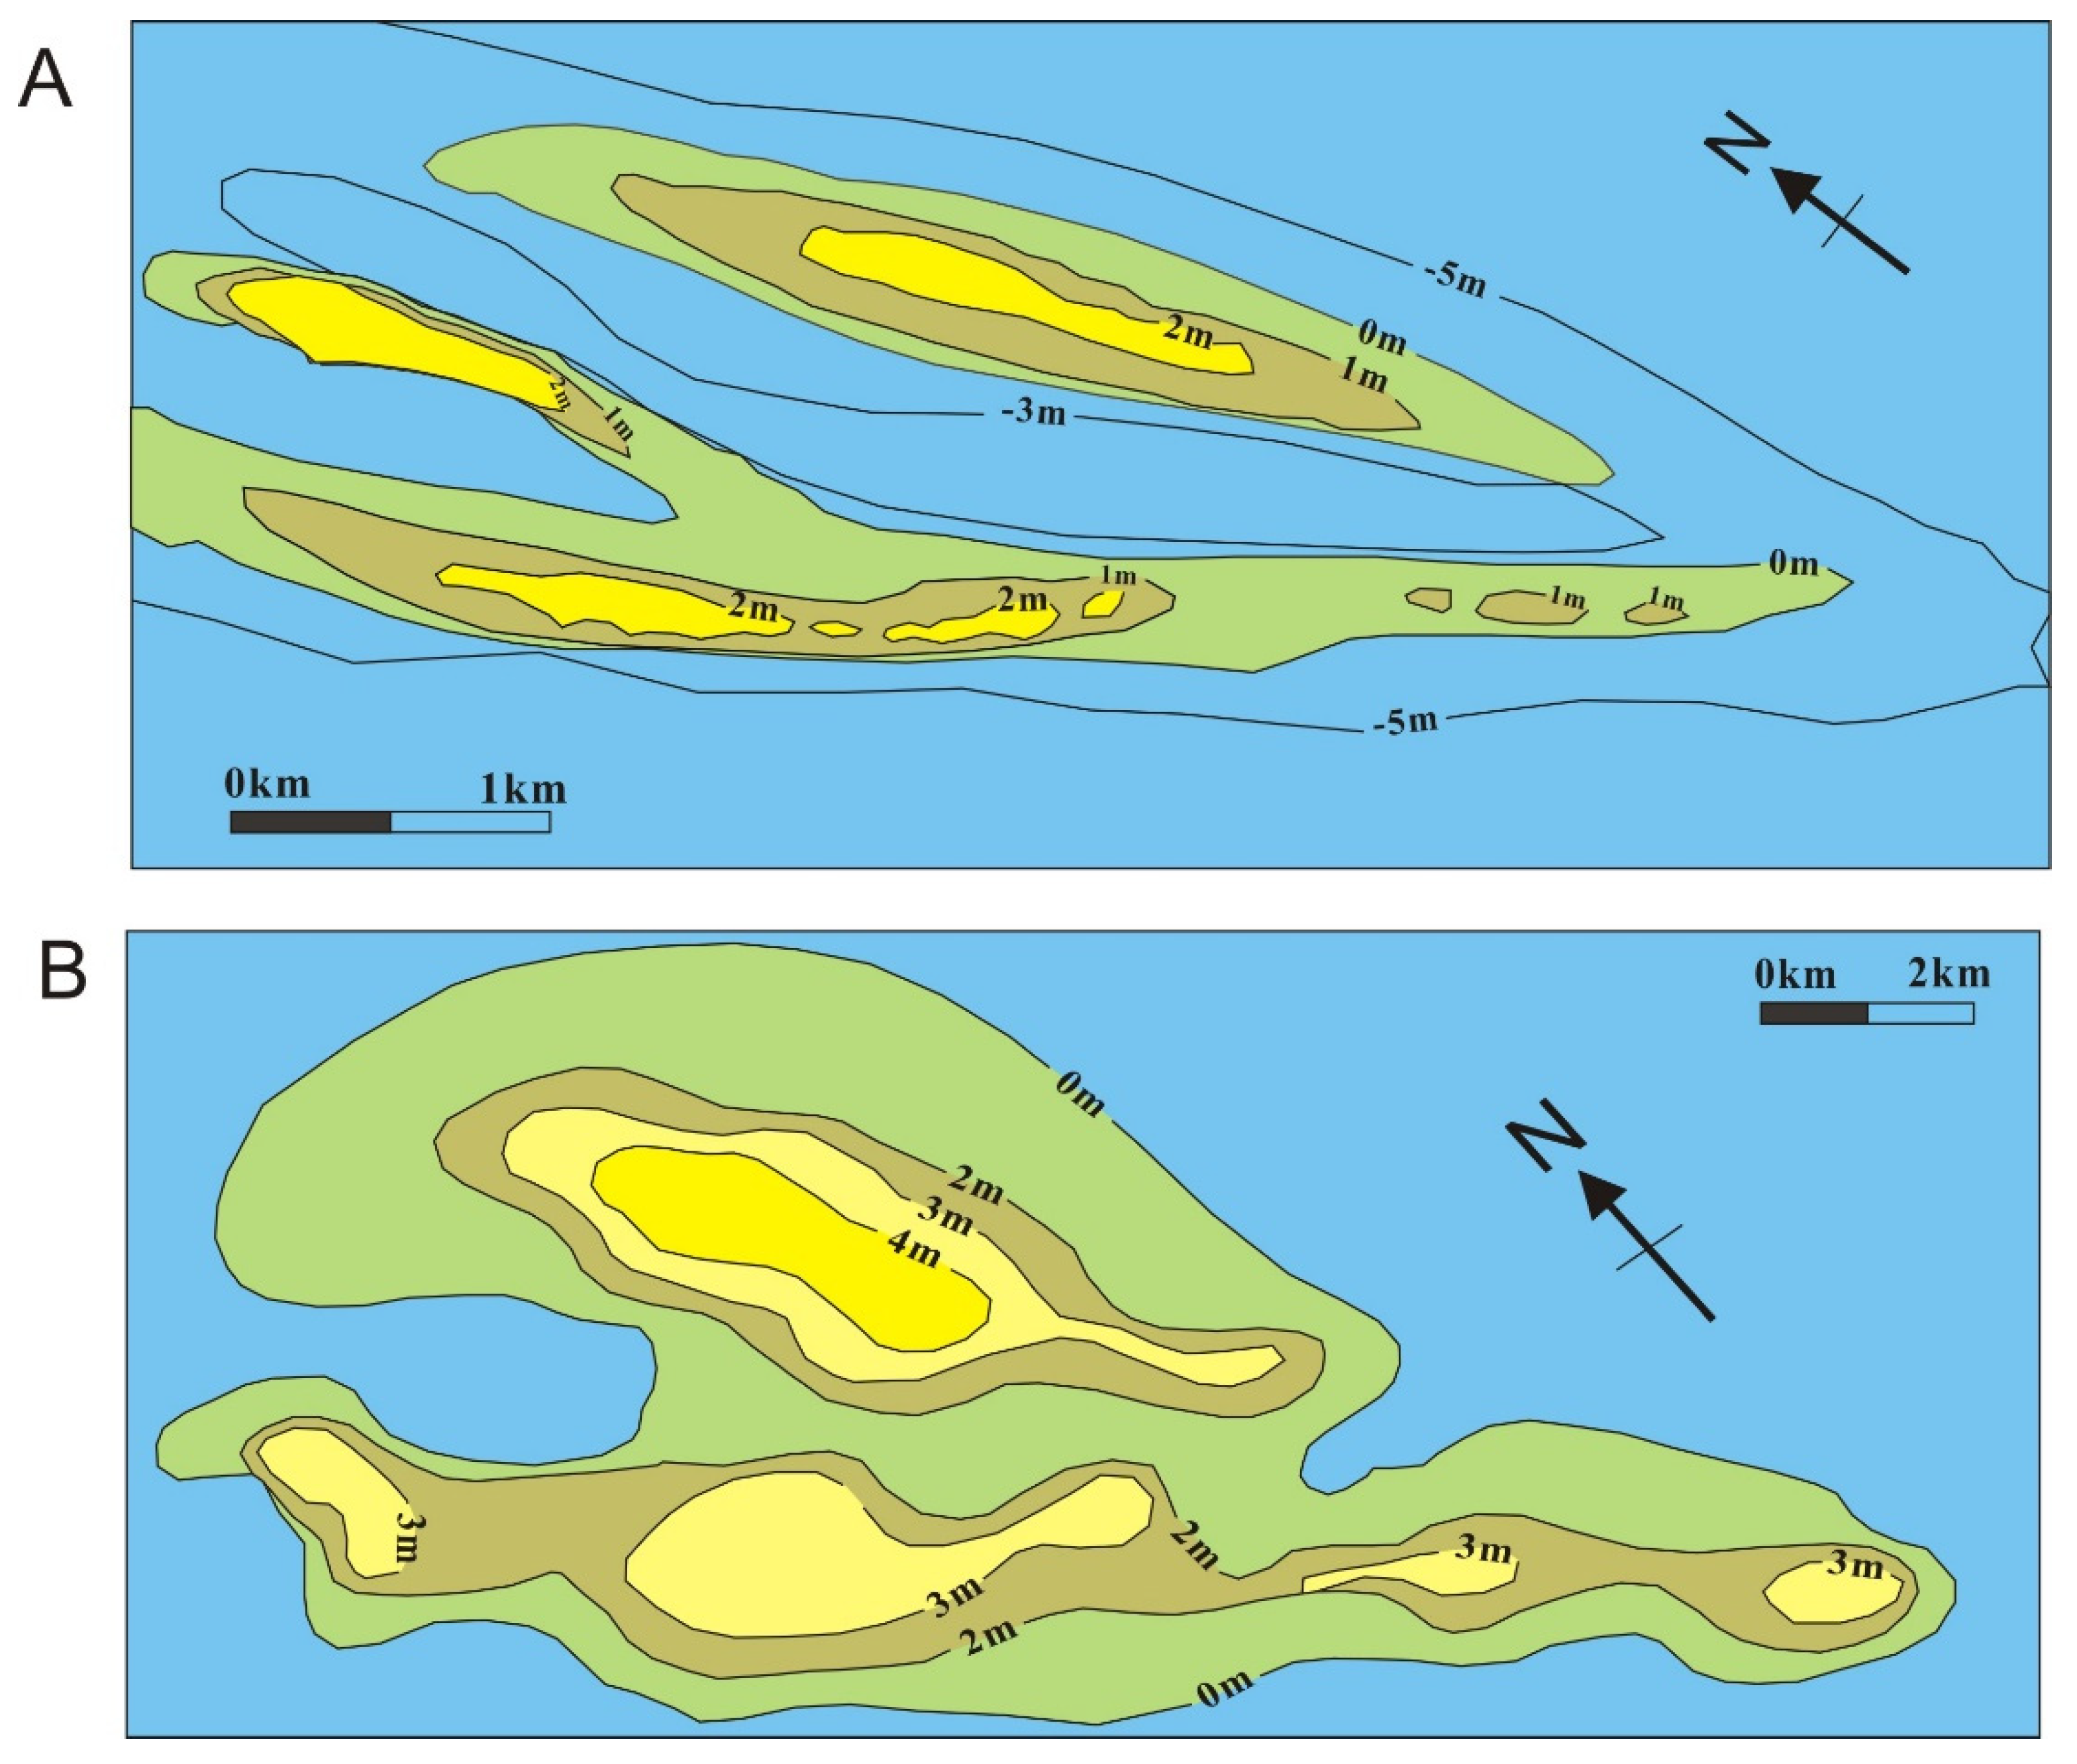
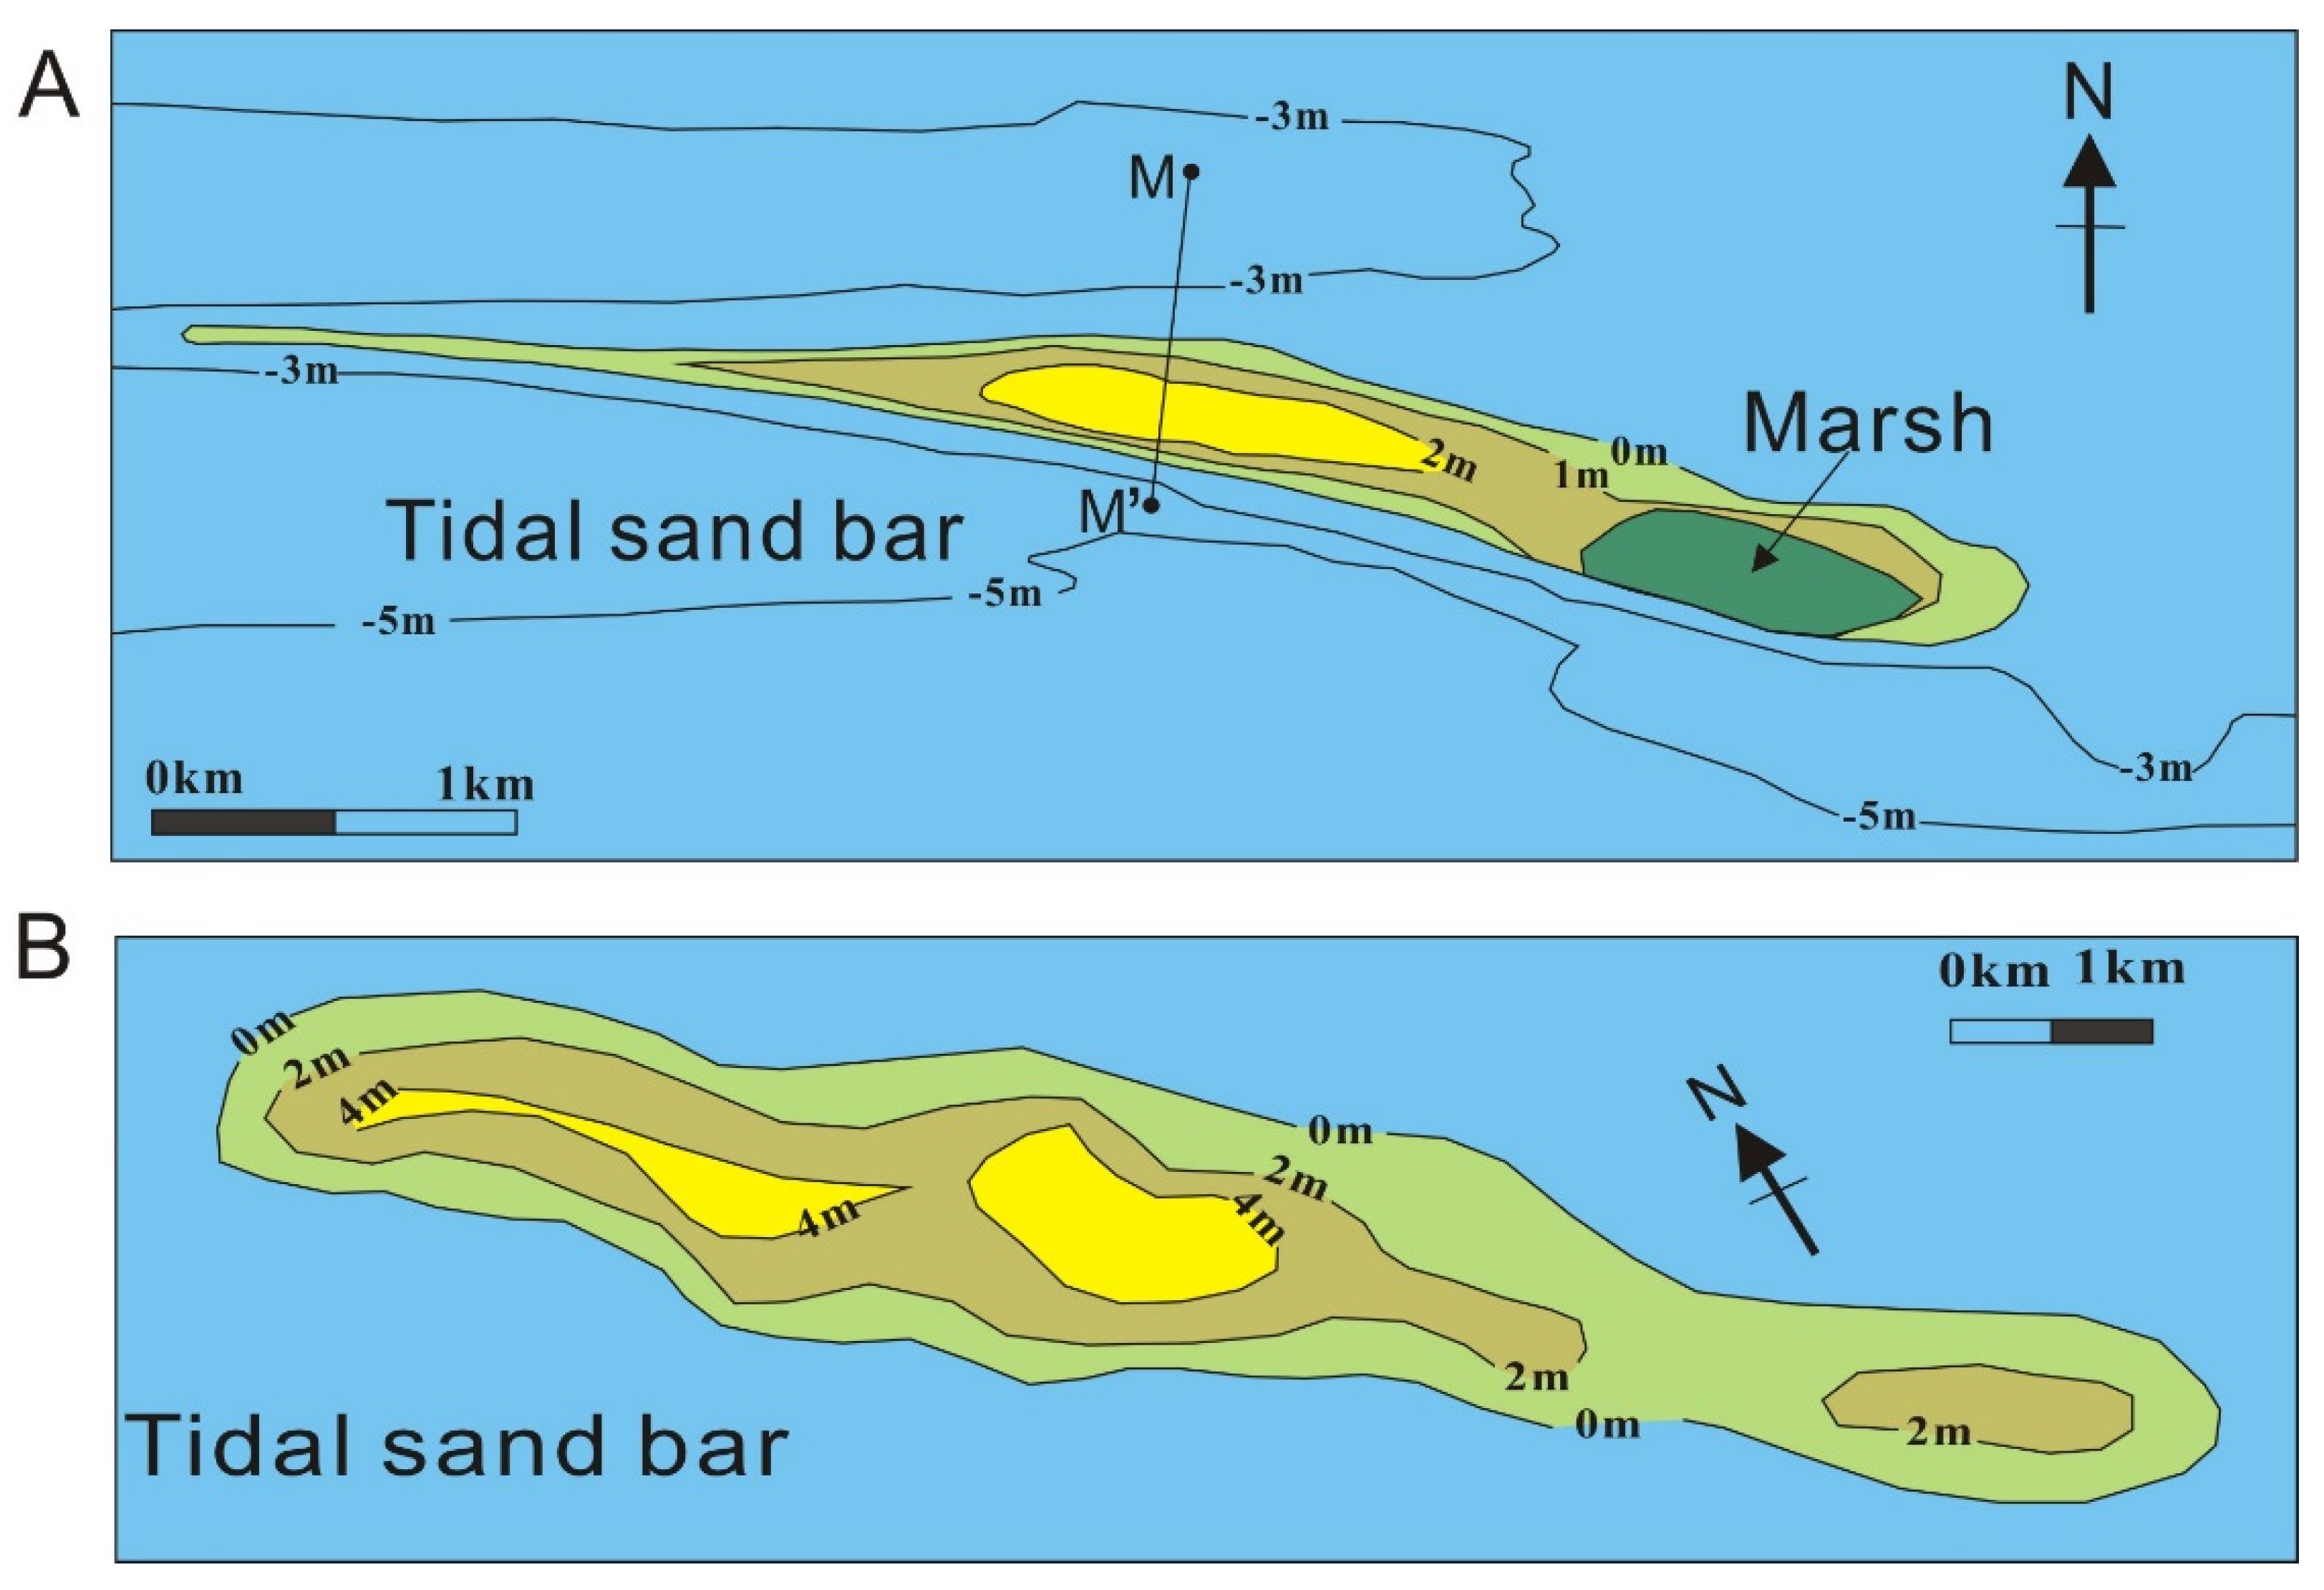
4.2. Two Tidal Bar Types Within McMurray Formation and Comparisons with Modern Deposits

Modern estuarine tidal bars have been observed around the world in various depositional settings, such as the Thames Estuary [49], Bay of Fundy1, Bristol Channel [50], Chesapeake Bay [51], Delaware Bay [52] and Moreton Bay [53]. The hydrodynamic contexts and bar morphologies have been analyzed in great detail by the above authors. However, the vertical successions of facies within McMurray Formation Strata have been infrequently compared with these modern estuarine tidal bar deposits, and they have been even more rarely related to an internal architecture model.
In this study, the tidal bar shape in the modern Gironde Estuary was found to be similar to that of the ancient bars in the McMurray Formation (Figure 9 and Figure 10) [5,54]. Tidal sand bar deposits form large and complicated hydrocarbon reservoirs, and it is usually difficult to reconstruct the architecture using limited drilling well data. However, the similarity between the Gironde Estuary tidal bars and the McMurray tidal bars discussed in this study may enable more information to be derived about the McMurray tidal bars and may even provide details about the tidal pattern.
The Gironde Estuary tidal bar deposits have been described in detail [1,29,54], and descriptions can be traced back to the 16th century [55]. The Gironde Estuary is located in south-west France on the Aquitaine coast, and was formed at the junction of the Dordogne and the Garonne Rivers [54].
From the results of previous studies on the Gironde Estuary, it appears that the tidal bars can be grouped into two main morphologies: lobate tidal bar (Figure 9A) [54] and elongated tidal bars [5,54,56]. A comparison between the tidal bars in the Gironde Estuary and those in the McMurray Formation shows that the latter could also be classified as belonging to the above two types (Figure 9 and Figure 10) [5,54]. Figure 9 [54] shows that the lobate tidal bar is composed of two main spits that are partially separated from one another by a shallow sandy channel. The lobate tidal bar in the Gironde Estuary has a length and width of approximately 4.61 km and 1.41 km, respectively, with a length-to-width ratio (LWR) of 3.27 [54], while the lobate tidal bar of tidal unit 6 in the McMurray Formation has a length and width of 15.01 km and 4.51 km, respectively, with a LWR of 3.33, which is similar to that of the LWR value from the Gironde Estuary. The LWR values of the lobate tidal bar in units 4, 5, and 6 are 3.33, 3.42, and 3.26, respectively, with an average value of 3.34; these values are also similar to that of the lobate tidal bar in the Gironde Estuary (LWR = 3.27).
The elongated tidal bar in the Gironde Estuary has a length and width of approximately 6 km and 605 m, respectively (Figure 10A) [5], and a LWR of approximately 9.9, while the elongated tidal bar of sand bar unit 3 in the McMurray Formation has a length and width of approximately 10.87 km and 1.28 km, respectively, with a LWR of approximately 5.07. The LWR values of elongated tidal bar units 1, 2, and 3 are 4.19, 8.22 and 5.07, respectively, with an average value of 5.83, which is close to that of 6.9 reported in the work of Leuven et al. [57]. The results show that the LWR values of the elongated tidal bar are higher than those of the lobate tidal bar in both the Gironde Estuary and in the McMurray Formation.

5. Conclusions

Thirteen distinguishable litho-facies frameworks were established, and four facies associations (tidal-influenced fluvial deposits, tidal flat deposits, tidal bar deposits, and tidal bar caps) were proposed to interpret the McMurray deposits. Ultimately, a detailed 3-D architectural model of stacked fluvial and estuarine bar deposits in the McMurray deposits was established. The bulk of the sand bar complex consists of five face sets (F8a, F8b, F9, F10, F11) and two facies associations (tidal flat deposits, tidal bar deposits), which are up to 20 m thick and were produced by accretion of a muddy tidal flat and a sandy tidal bar. A comparison with a model of the Gironde Estuary tidal bar shows that the ancient McMurray Formation tidal bars have a similar distribution pattern, and two types of tidal bars (lobate tidal bars and elongated tidal bars), are proposed to represent the tidal bar pattern in the McMurray Formation. Ultimately, a detailed 3-D architectural model of stacked fluvial and estuarine bar deposits in the McMurray deposits was established. The architecture of the sand bar complex is believed to reflect the evolution of the area throughout the Lower Cretaceous sea level rise in the Western Internal Seaway, which caused an increase in tidal energy to a resonant condition and explains the in-place infilling of incised fluvial channels and the predominance of wave-influenced features related to the rising sea level.

Author Contributions

M.T. organized and written the article, S.L., K.Z., J.H., provided supporting data.

Funding

This research was funded by Natural Science Foundation of China (grant number: 41330313, 41402108, 415303315, 41406050), Foundation of Shandong Province (grand number: ZR2019MD006, ZR2014DL003) and National Science and Technology Major Project (grand number: 2016ZX05046-001-005, 2017ZX05049-005, 2016ZX05029002-002).

Conflicts of Interest

The authors declare no conflict of interest.

References

  1. Dalrymple, R.W. Tidal depositional systems. In Faceis Models: Response to Sea Level Change; Walder, R.G., Jamee, N.P., Eds.; Geological Association of Canada: St. John’s, NL, Canada, 1990; pp. 195–218. [Google Scholar]
  2. Wilson, J.C.; Elliott, M.; Cutts, N.D.; Mander, L.; Mendao, V.; Perez-Dominguez, R.; Phelps, A. Coastal and offshore wind energy generation: Is it environmentally benign. Energies 2010, 2, 1383–1422. [Google Scholar] [CrossRef]
  3. Chaumillon, E.; Fenies, H.; Billy, J.; Breilh, J.F.; Richetti, H. Tida and fluvial controls on the internal architecture and sedimentary facies of a lobate estuarine tidal bar (the Plassac Tidal bar in the Gironde Estuary, France). Mar. Geol. 2013, 346, 58–72. [Google Scholar] [CrossRef]
  4. Zhang, X.; Lin, C.; Dalrymple, M.R.W.; Gao, S.; Li, Y.L. Facies architecture and depositional model of a macrotidal incised-vally succession (Qiantang River estuary, eastern China), and differences from other macrotidal systems. Geol. Soc. Am. Bull. 2014, 126, 499–522. [Google Scholar] [CrossRef]
  5. Iglesias, I.; Venancio, S.; Pinho, J.L.; Avilez-Valente, P.; Vieira, J.M.P. Two models solutions for the douro estuary: Flood risk assessment and breakwater effects. Estuaries and Coasts 2019, 42, 348–364. [Google Scholar] [CrossRef]
  6. Allen, J.R.L. Studies in fluviatile sedimentation: Bars, bar complexes and sandstone sheets (low sinuosity braided streams) in the Brownstonenews (L’Devonian), Welsh Borders. Sediment. Geol. 1983, 33, 237–293. [Google Scholar] [CrossRef]
  7. Caston, V.N.D. Linear sand banks in the southern North Sea. Sedimentology 1972, 18, 63–78. [Google Scholar] [CrossRef]
  8. Charitha, P.; Collins, M. Mechanisms for linear sandbank formation and maintenance in relation to dynamical oceanographic observations. Prog. Oceanogr. 1987, 19, 117–176. [Google Scholar]
  9. Xavier, B.; Eric, C. Contribution of simulation on historical bathymetries to the understanding of evolutions of estuarine sand banks. C.R. Geosciences 2005, 337, 1375–1383. [Google Scholar]
  10. Labrecque, P.A.; Jensen, J.L.; Hubbard, S.M. Cyclicity in lower cretaceous point bar deposits with implications for reservoir characterization, Athabasca oil sands, Alberta, Canada. Sediment. Geol. 2011, 242, 18–33. [Google Scholar] [CrossRef]
  11. Musial, G.; Reynaud, J.Y.; Gingras, M.; Fenies, H.; Labourdette, R.; Parize, O. Subsurface and outcrop characterization of large tidally influenced point bars of the Cretaceous McMurray Formation (Alberta, Canada). Sediment. Geol. 2012, 11, 156–172. [Google Scholar] [CrossRef]
  12. Dale, A.L.; David, C. Westerly derived early Cretaceous gold paleoplacers in the Western Canada Foreland Basin, southwestern Alberta: Tectonic and economic implications. Can. J. Earth Sci. 1995, 32, 1079–1092. [Google Scholar]
  13. Milovan, F.; Stephen, M.H.; Ronald, J.P.; Larter, S.R. Recognition of down-valley translation in tidally influenced meandering fluvial deposits, Athabasca Oil Sands (Cretaceous), Alberta, Canada. Mar. Pet. Geol. 2011, 29, 219–232. [Google Scholar]
  14. Derald, G.S.; Stephen, M.H.; Dale, A.L.; Milovan, F. Counter point bar deposits: Lithofacies and reservoir significancein the meandering modern Peace River and ancient McMurray Formation, Alberta, Canada. Sedimentology 2009, 56, 1655–1669. [Google Scholar]
  15. Cant, D.J. Sedimentological and sequence stratigraphic organization of a foreland clastic wedge, Mannille Group, Western Canada Basin. J. Sediment Res. 1996, 66, 1137–1147. [Google Scholar]
  16. Cant, D.J. Regional stratigraphy, sedimentology and petroleum geology of the grand rapids formation, Mannville group, Northeastern Alberta. Bull. Can. Pet. Geol. 1997, 2, 141–154. [Google Scholar]
  17. Herin, F.J.; Cotterill, D.K.; Berhane, H. An Atlas of Litho-Facies of the McMurray Formation, Athabasca Oil Sands Deposits, Northeastern Alberta: Surface and Subsurface; Alberta Energy and Utilities Board: Edmonton, AB, Canada, 2000; p. 216.
  18. Herin, F.J.; Cotterill, D.K. Field Guide: Regional Sedimentology and Processes of Deposition of the Athabasca Oil Sands, Northestern Alberta; Alberta Energy and Utilities Board: Edmonton, AB, Canada, 2006; p. 157.
  19. Herin, F.J. The cretaceous McMurray oil sands, Alberta, Canada: A world-class tidally influenced fluvial-estuarine system. Dev. Sediment. 2015, 68, 561–621. [Google Scholar]
  20. Miall, A.D. The environmental hydrogeology of the oil sands, Lower Athabasca area, Alberta. Geosci. Can. 2013, 40, 215–233. [Google Scholar] [CrossRef]
  21. Pemberton, S.G.; Flach, P.D.; Mossop, G.D. Trace fossils from the Athabasca oil sands, Alberta, Canada. Science 1982, 217, 825–827. [Google Scholar] [CrossRef]
  22. Langenberg, C.W.; Hein, F.J.; Lawton, D.; Cunningham, J. Seismic modeling of fluvial-estuarine deposits in the Athabasca oil sands using ray-tracing techniques, Steepbank River area, northeastern Alberta. Bull. Can. Petrol. Geol 2002, 50, 347–353. [Google Scholar] [CrossRef]
  23. Gingras, M.; Maceachern, J.A.; Dashtgard, S.E.; Pemberton, G. The significance of trace fossils in the McMurray Formation, Alberta, Canada. Bull. Can. Pet. Geol 2016, 64, 233–250. [Google Scholar] [CrossRef]
  24. Martinius, A.W.; Fustic, M.; Garner, D.L.; Jablonski, B.V.J.; Strobl, R.S.; MacEachern, J.A.; Dashtgard, S.E. Reservoir characterization and multiscale heterogeneity modeling of inclined heterolithic strata for bitumen-production forecasting, McMurray Formation, Corner, Alberta, Canada. Mar. Pet. Geol. 2017, 82, 336–361. [Google Scholar] [CrossRef]
  25. Shinn, Y.J.; Lee, H.S.; Kwon, Y.K.; Kwak, W.J. Lithofacies distribution and depositional environment in the Lower Cretaceous McMurray Formation, BlackGold Lease, northern Alberta: Implications for geometry and distribution of oil sand reservoirs. Geosci. J. 2014, 18, 325–337. [Google Scholar] [CrossRef]
  26. Carrigy, M.A. Geology of the McMurray Formation, Part III, General Geology of the McMurray Area; Alberta Research Council: Edmonton, AB, Canada, 1959; pp. 1–130. [Google Scholar]
  27. Tang, M.M.; Zhao, H.Y.; Ma, H.F.; Lu, S.F.; Chen, Y.M. Study on CO2 huff-n-puff of horizontal wells in continental tight oil reservoirs. Fuel 2017, 188, 140–154. [Google Scholar] [CrossRef]
  28. Miall, A.D. Facies architecture in clastic sedimentary basins. In Frontieers in Sedimentary Geology, New Perspectives of Basin Analysis; Springer-Verlag: New York, NY, USA, 1988; pp. 67–81. [Google Scholar]
  29. Hugues, F.; Tastet, J.P. Facies and architecture of an estuarine tidal bar (the Trompeloup bar, Gironde Estuary, SW France). Mar. Geol. 1998, 150, 149–169. [Google Scholar]
  30. Shanmugam, G.; Poffenberger, M.; Alava, J.T. Tide-dominated estuarine facies in the Hollin and Napo formations, Sacha field, Oriente Basin, Ecuador. AAPG Bull. 2000, 84, 652–682. [Google Scholar]
  31. Willis, B.J.; Gable, S. Sharp-based, tidal-dominated deltas of the Sego sandstone book cliffs, Utah, USA. Sedimentology 2001, 48, 479–506. [Google Scholar] [CrossRef]
  32. Anthony, E.J.; Oyede, L.M.; Lang, J. Sedimentation in a fluvial infilling, barrier-bound estuary on a wave-dominated, microtidal coast: The Oueme River estuary, Benin, west Africa. Sedimentology 2002, 49, 1095–1112. [Google Scholar] [CrossRef]
  33. Piret, P.B. Stacked fluvial and tidal-dominated estuarine deposits in high-frequency sequences of Eocene Central Basin. Sedimentology 2005, 52, 391–428. [Google Scholar]
  34. Nardin, T.R.; Feldman, H.R.; Carter, B.J. Stratigraphic architecture of a large-scale point-bar complex in the McMurray Formation: Syncrude’s Mildred Lake Mine, Alberta, Canada. Heavy-oil and oil-sand petroleum systems in Alberta and beyond. AAPG Stud. Geol. 2013, 64, 273–311. [Google Scholar]
  35. Jablonski, B.V.J.; Dalrymple, R.W.; Marzo, M. Recognition of strong seasonality and climatic cyclicity in an ancient, fluvially dominated, tidally influenced point bar: Middle McMurray Formation, Lower Steepbank River, north-eastern Alberta, Canada. Sedimentology 2016, 63, 552–585. [Google Scholar] [CrossRef]
  36. Dashtgard, S.E. Linking invertebrate burrow distributions (neoichnology) to physicochemical stresses on a sandy tidal flat: Implications for the rock record. Sedimentology 2011, 58, 1303–1325. [Google Scholar] [CrossRef]
  37. Hauck, T.E.; Dashtgard, S.E.; Pemberton, S.G.; Gingras, M.K. Brackish-water ichnological trends in a microtidal barrier island/embayment system, Kouchibouguac National Park, New Brunswick, Canada. Palaios 2009, 24, 478–496. [Google Scholar] [CrossRef]
  38. Brekke, H.; Evoy, R.W. Use of dipmeter data in the definition of the internal architecture of point bar deposits in the Athabasca oilsands: Implications for the middle McMurray Formation in the Hangingstone area, alberta. West Tex. Geol. Soc. 2004, 4, 157. [Google Scholar]
  39. Collinson, J.D. Alluvial sediments. In Sedimentary Environment: Processes, Facies and Stratigraphy; Reading, H.G., Ed.; Blackwell Science Ltd.: Oxford, UK, 1996; pp. 37–82. [Google Scholar]
  40. Anna, P.; Piret, P.B. Regressive to transgressive transits reflected in tidal bars, Middle Devonian Baltic Basin. Sediment. Geol. 2009, 218, 48–60. [Google Scholar]
  41. Erin, E.C.; Arnott, R.W.C. Facies distribution and stratigraphic architecture of the Lower Cretaceous McMurray Formation, Lewis Property, northeastern Alberta. Bull. Can. Pet. Geol. 2007, 55, 99–124. [Google Scholar]
  42. Plink, B.P. Effects of tides on deltaic deposition: Causes and responses. Sediment. Geol 2012, 279, 107–133. [Google Scholar] [CrossRef]
  43. Maguregui, T.; Tyler, N. Evolution of middle Eocene tide-dominated deltaic sandstones, Lagunillas field, Maracaibo basin, western Venezuela. In The Three-Dimensional Facies Architecture of Terrigenous Clastic Sediments and Its Implications for Hydrocarbon Recovery and Discovery: SEPM Concepts in Sedimentology and Palaeontology; Miall, A.D., Tyler, N., Eds.; GeoScienceWorld: Mclean, VA, USA, 1991; pp. 233–244. [Google Scholar]
  44. Longhitano, S.G.; Donatella, M.; Ronald, J.S.; Ainsworth, R.B. Tidal depositional systems in the rock record: A review and new insights. Sediment. Geol. 2012, 279, 2–22. [Google Scholar] [CrossRef]
  45. Mcrae, C.G. Glauconite. Earth Sci. Rev. 1972, 8, 397–440. [Google Scholar] [CrossRef]
  46. Odin, G.S. Significance of green particles in arenites. In Provenance of Arenites; Zuffa, G.G., Ed.; Springer-Verlag: New York, NY, USA, 1985; pp. 279–307. [Google Scholar]
  47. Cody, J.; Youn, S.; Riddy, A.; Gittins, S. Implications of reservoir compartments on the design and execution of the Christina Lake thermal recovery projects. In Proceedings of the Canadian Society of Petroleum Geologists Annual Meeting, Calgary, AB, Canada, 18–22 June 2001; CSPG Special Publications: Calgary, AB, Canada, 2001. [Google Scholar]
  48. Blakney, B. Tidally-Influenced Point Bars: Morphological Signatures and their Application to the McMurray Formation. Available online: https://www.geoconvention.com/archives/2004/105S0130.pdf (accessed on 29 April 2019).
  49. Robinson, A.H.W. Ebb–flood channel systems in sandy bays and estuaries. Geography 1960, 45, 183–199. [Google Scholar]
  50. Harris, P.T. Large-scale bedforms as indicators of mutually evasive sand transport and the sequential infilling of wide-mouthed estuaries. Sediment. Geol. 1988, 57, 273–298. [Google Scholar] [CrossRef]
  51. Ludwick, J.C. Tidal currents and zig-zag sand shoals in a wide estuary entrance. Geol. Soc. Am. Bull. 1974, 85, 717–726. [Google Scholar] [CrossRef]
  52. Knebel, H.J. Modern sedimentary environments in a large tidal estuary, Delaware Bay. Mar. Geol. 1989, 86, 119–136. [Google Scholar] [CrossRef]
  53. Harris, P.T.; Pattiaratchi, C.B.; Cole, A.R.; Keene, J.B. Evolution of subtidal sandbanks in Moreton Bay, eastern Australia. Mar. Geol. 1992, 103, 225–247. [Google Scholar] [CrossRef]
  54. Billy, J.; Eric, C.; Hugues, F.; Clement, P. Tidal and fluvial controls on the morphological evolution of a lobate estuary bar: The Plassac Tidal Bar in the Gironde Estuary (France). Geomorphology 2012, 170, 86–97. [Google Scholar] [CrossRef]
  55. Cremer, M. Etude Dynamique de L’evolution des Bancs de Sable Dans Lestudaire de la Gironde. Ph.D. Thesis, University of Bordeaux, Bordeaux, France, 1975. [Google Scholar]
  56. Fenies, H.; De Resseguier, A.; Tastet, J.P. Intertidal clay-drape couplets (Gironde Estuary, France). Sedimentology 1999, 46, 1–15. [Google Scholar] [CrossRef]
  57. Leuven, J.R.F.W.; Kleinhans, M.G.; Weisscher, S.A.H.; Vegt, M.V. Tidal sand bar dimensions and shapes in estuaries. Earth Sci. Rev. 2016, 161, 204–223. [Google Scholar] [CrossRef] [Green Version]
Figure 1. Generalized paleographic map (modified from Labrecque et al., 2011 [10]; Musial et al., 2012 [11]) and isopatch map of sand body thickness of the McMurray formation. (A) shows the Athabasca Oil field area; (B) represents sand body thicknesses.
Energies 12 01769 g001
Figure 2. Stratigraphy of the Lower Cretaceous Athabasca oil sand area. WBSK: Wabiskaw member; U.MCMR: upper McMurray Formation; M.MCMR: middle McMurray Formation. The lower McMurray Formation is missing in this well.
Energies 12 01769 g002
Figure 3. Locations of measured cores and stratigraphic cross-sections (region C in Figure 1).
Energies 12 01769 g003
Figure 4. Photographs of typical sedimentary characteristics of thirteen facies in the McMurray Formation: (a) Core image of well 1AA043309014W400, depth interval is 191.10–191.50 m; (b) Core image of well 1AA062809014W400, depth interval is 194.15–194.55 m; (c) Core image of well 1AA043309014W400, depth interval is 189.90–190.30 m; (d) Core image of well 1AA163209014W400, depth interval is 193.70–194.10 m; (e) Core image of well 1AA043309014W400, depth interval is 189.00–189.40 m; (f) Core image of well 1AA042309014W400, depth interval of the top segment is 163.70–164.10 m, depth interval of the bottom segment is 165.00–165.40 m; (g) Core image of well 1AA043309014W400, depth interval is 191.10–191.50 m; (h) Core image of well 1AA061409014W400, depth interval is 196.90–197.30 m; (i) Core image of well 1AA062809014W400, depth interval is 182.20–182.60 m; (j) Core image of well 1AA041309014W400, depth interval is 190.10–190.50 m; (k) Core image of well 1AA041309014W400, depth interval is 176.15–176.55 m; (l) Core image of well 1AA160109014W400, depth interval is 203.80–204.20 m; (m) Core image of well 1AA041309014W400, depth interval is 175.15–175.55 m; (n) Core image of well 1AA062209014W400, depth interval is 172.10–172.50 m.
Energies 12 01769 g004
Figure 5. Succession of Facies 4 and 7. (A) Top segment of the succession (0–33 cm); (B) Bottom segment of the succession (33–66 cm).
Energies 12 01769 g005
Figure 6. Rootlets (A,B) and carbonaceous debris (C).
Energies 12 01769 g006
Figure 7. Facies and facies associations of tidal bar complex, tidal flat and tidal bar cap.
Energies 12 01769 g007
Figure 8. Axonometric drawing showing 3-D architecture of estuarine tidal bar deposits (The dark area show the location of Figure 7, (Since all well names have a prefix of “1AA” and a suffix of “09014W400”, so the well names are simplified by omitted by the prefix “1AA” and suffix “09014W400” in this figure).
Energies 12 01769 g008
Figure 9. Spatial distribution of lobate tidal bars in McMurray Formation and Gironde Estuary: (A) bathymetry of lobate tidal bar in Gironde Estuary, France (modified from Billy et al., 2012); (B) Isopach map of Sand bar complex unit 6, McMurray Formation).
Energies 12 01769 g009
Figure 10. Spatial distribution of elongated tidal bars in McMurray Formation and Gironde Estuary: (A) Bathymetry of elongated tidal bar in Gironde Estuary, France (modified from Fenies and Tastet, 1998); (B) Isopach map of sand bar complex unit 3, McMurray Formation).
Energies 12 01769 g010
Table 1. Summary of identified facies characteristics.
Litho-FaciesLitho-Facies NameSand TexturesVshSedimentary StructureOther Characteristics
F1Mud clast brecciafL10–40Underlying contact is highly erosional and clasts have high cohesionMud-clast breccias that are likely the result of point bar erosion
F2High-angle cross-stratified sandsfU5–15Large cross-stratified sandsBitumen-stained laminae
F3Low-angle cross-stratified sandsfU-vfU10–20Low-angle dipping laminated beddingBiogenic structure: Planolites, Cyrolithes, and Cylindrichnus.
F4Consolidated sand clayvfU40–80Consolidated sand clay that shows slightly heterolithic fine-grained sandsNumerous bioturbated sand clay
F5Sand wave bedding mudvfL80–95Wavy interbeds and sand lenses with some very small-scale ripple cross-laminaeMassive to laminated mud
F6ClayvfL>95Silty sand lenses and sand interbedsFissile at top becoming less so towards base
F7Carbonaceous mudsvfL>50Silty sand laminae and carbonaceous laminationsBiogenic structure: Rootlets.
F8aSand-dominated layersvfL-vfU20–50Black to brown sand interbeds with laminated shale. F8a and F8b commonly mutual-coexistence
F8bMud dominated layersvfL50–100Massive medium-gray clay interbeds with a small amount of bitumen sand.
F9Laminated sand with mudfU-mL10–20Black to brown sand with mm- to cm-scale mud interbeds Commonly scattered woody and carbonaceous debris
F10Cross-bed sandmL5–10Brown to black sand with rare silty laminaeVery rare silty laminae
F11Clean sandfU-mL<5Massive sand with black moderately to well sorted Loose sand, low bioturbation intensities
F12Bioturbated sandfL25–30Black to brown sub-rounded, moderately sorted sand with scattering acicular mud clasts. Some mud beds with lightly salty
F13Glauconitic muddy sandvfL-vfU40–80Gray-green glauconitic sand with medium-gray silty mud. Shale percentage 80% at top to 40% at base
(Sand textures are abbreviated as in the following: very fine-lower, vfL; very-fine-upper, vfU; fine-lower, fL; fine-upper, fU; medium-lower, mL).
Table 2. Architectural parameters of tidal sand bars in McMurray Formation.
UnitLength L (km)Average Width W (km)Thickness T (m)LWRBar Type
17.081.692.664.19ETB
211.351.382.658.22ETB
310.871.282.145.07ETB
414.714.302.793.42LTB
515.274.682.523.26LTB
615.014.511.853.33LTB
(LWR = length-width-ratio; ETB = elongated tidal bar; LTB = lobate tidal bar).

