Assessment of Flexibilisation Potential by Changing Energy Sources Using Monte Carlo Simulation

Department for Sustainable Products and Processes (upp), University of Kassel, 34125 Kassel, Germany
*
Author to whom correspondence should be addressed.
Energies 2019, 12(4), 711; https://doi.org/10.3390/en12040711
Submission received: 19 January 2019
/
Revised: 15 February 2019
/
Accepted: 19 February 2019
/
Published: 21 February 2019
(This article belongs to the Section A1: Smart Grids and Microgrids)
Abstract
:In the fight against anthropogenic climate change, the benefit of the integration of fluctuating renewable energies (wind and photovoltaics) into the electricity grid is a widely proved concept. At the same time, a fluctuating and decentralised supply of energy, especially at lower voltage levels, leads to a local discrepancy in the power balance between generation and consumption. A possible solution in connection with demand side management is the grid-oriented flexibilisation of energy demand. The present study shows how the use of an innovative hybrid-redundant high-temperature heat system (combined heat and power (CHP), power-to-heat system (PtH), gas boiler) can contribute to a flexibilisation of the electrical energy demand of plastics processing companies. In this context, the flexibilisation potential of a company is to be understood as the grid-related change of the energy supply through a change of the energy sources within the framework of the process heat supply. For this purpose, an omniscient control algorithm is developed that specifies the schedule of the individual system components. A sensitivity analysis is used to test the functionality of the control algorithm. Determination of the electrical flexibilisation potential is carried out via a comprehensive simulation study using Monte Carlo methods. For this purpose, the residual load curves of four characteristic distribution grids with a high share of renewable energies as well as heat load profiles of injection moulding machines are taken into consideration. A frequency distribution provides information on the electrical flexibilisation potential to be expected depending on the various combinations. The evaluation is carried out using a specially introduced logic, which identifies grid-relevant changes in the company’s power consumption as flexibilisation potential based on a reference load curve. The results show that a reliable energy supply for production is possible despite flexibilisation. Depending on the grid under consideration, there are differences in the exploitation of the potential, which essentially depends on the installed renewable capacity. Depending on the scenario under consideration, an average of up to 1486 kWhel can be shifted in a positive direction and 1199 kWhel in a negative direction.
1. Introduction and Problem Definition
The Paris Climate Change Convention adopted in 2015 represents a significant milestone in the fight against anthropogenic climate change. For the second time since the Kyoto Agreement, countries around the world have committed themselves to minimising greenhouse gas emissions [1]. Pushed by various global and national challenges, such as the finite nature of fossil fuels, high amounts of energy imports and rising energy consumption and costs, a radical rethink has taken place in politics, society and industry. However, the increased utilisation of renewable energies has created new challenges for all involved.
With renewable energies making up 38.2% of its total electricity generation, Germany already plays a pioneering international role in terms of potential expansion and system integration [2]. For the year 2050, the IEA estimates the worldwide share of renewable energies will be at 57% [3]. Whereby the share of fluctuating renewable energies, e.g., wind energy and photovoltaic systems, will predominate (in Germany at 87%) [4].
Due to the land requirements of regenerative energy systems, as well as meteorological and geographical reasons, renewable generation plants are often built in rural, sparsely populated and structurally weak regions. Furthermore, the weather-driven feed-in fluctuations of these producers are often confronted with a low electrical energy demand within the supply regions. The increased share of installed renewable generation capacities during the last years has led to local and temporary imbalances between generation and consumption within the electricity supply grid. Without intervention and the implementation of system-securing measures, grid stability cannot be maintained [5]. With regard to a local scale, this makes power balancing the central challenge of energy system transformation. Historically grown grids are only conditionally geared to the emerging decentralised, bottom-up generation structure. The topology of electricity grids, which has so far been conceived centrally and top-down, is reaching its limits [6].
A more flexible management of electrical grids contributes to the security of energy supply. Flexibilisation means both an adjustment of the controllable generation capacity and a deviation from consumption patterns to harmonise the power balance [7].
In this context, large-scale consumers and controllable generation plants in the distribution grid have a strong leverage effect. On the load side, the industrial sector, with a global share of 10.9% and 46% of Germany’s total electricity consumption in 2012, offers links to flexibilisation [8,9].
The focus of this study is set on energy-intensive processes in the plastic industry. These provide relevant examples of the combination of industrial electricity and heat supply. Almost a third of the 2900 companies in Germany use injection moulding machines exclusively for manufacturing products. The number of companies that have an in-house injection moulding line is around 2300 [10].
Based on the limited investigation possibilities regarding industrial flexibilisation potential, the growing linkage between electricity and heat sectors through a decentralised process heat supply is of interest. In this respect, power-to-heat-plants (PtH), or combined heat and power plants (CHP) can be regarded as key technologies [11]. Possible influences of flexibilisation in the field of electrical operating performance on the heating sector, and thus indirectly on production operation, ought to be compensated by the technical design of the plant structure and the implementation of suitable strategic flexibilisation concepts.
Besides the general problem described above, the validity of the results when considering certain measures (including those mentioned above) represents a serious problem. In many cases, static calculations are carried out which, for example, do not take sufficient account of thermal inertia or losses. These are suitable for simple extrapolations of the electrical load management and grid relief potential. In most cases, however, they represent only one case under defined boundary conditions and do not provide any information about its general validity. Energy-intensive sectors such as basic chemicals, electrical steel, metal, wood and paper industries as well as mining and cement operations are the focus of the investigations. The quantification of static flexibilisation potential in research and literature is based on parameters such as energy demand, installed capacity, hours of full use, seasonal availability and electricity intensity [9,12,13].
The same applies to dynamic observations, which include different boundary conditions such as the weather. In order to prove the general validity of a potential, as well as to determine it quantitatively, every possible combination of input data and boundary conditions should be analysed [10].
To close these research gaps, a comprehensive simulation study using Monte Carlo methods (MCM) is applied. For this purpose, a simulation model is developed which represents the high-temperature heat supply of plastics processing machines.
The present work combines two levels of process flexibilisation: considering the supply situation in electrical grids, and the production of plastic parts. In this context, the research question refers to the grid-coordinated use of different heat generation technologies in the industrial sector and the quantification of the achievable electrical flexibilisation potential under reciprocal operating conditions. The decisive criterion for plant operation remains a secure supply of production whose requirements must be synchronised with a grid status orientated heat supply.
The following work is divided into six sections. In the second section related work is discussed in detail and is placed in scientific context. The section closes with a description of the relevant research gaps.
The third section describes the general methodology of the simulation study as well as the input data for the model. This is followed by a description of the simulation setup and the experimental plan in the fourth section. It also contains a detailed description of the evaluation methodology. The results are presented and critically analysed in the fifth section. The last section summarizes the findings of the paper. It also gives an outlook on future work.
2. Related Work
The literature contains a variety of concepts for making heat supply more flexible. The most important ones are presented and discussed in the following section.
2.1. Literature Review
Approaches to flexibilisation measures linked to the utilization of PtH and CHP can be classified according to the following characteristics:
- Use of thermal storage
- Load management/flexibility through energy source change
In general, the use of PtH and CHP plants is linked to the integration of buffer storage systems to avoid frequent plant cycles [14]. In this respect, intelligent storage management, which achieves a temporal decoupling of the existing heat demand and the current grid situation, is of central importance. Lödige et al. [15] present a schedule-based concept for the electricity driven management of block-type thermal power stations. The strategy concept considers heat demand forecasts and the number of CHP starts required to keep wear as well as heating and cooling losses to a minimum. The approach of Wehmhörner [16] describes a system consisting of a CHP plant and thermal storage. Flexibilisation is realised by a cascade control, which regulates the electrical variables in the inner cascade as a function of the residual load, whereas the thermal variables in the outer cascade are dependent on heat demand. An increase in the residual load implies an increase in engine speed and electrical power output. Heat-side fluctuations can be compensated to a certain extent by the storage tank. If a critical system state is exceeded, the cascade control initiates an adjustment of the electrical power output proportional to the thermal deviation. With a similar approach, it is also conceivable to increase the flexibility of PtH systems through thermal storage. Kleinertz and Samweber [17] explaine a concept for the charging control of PtH systems that covers both load peaks and voltage range violations in electrical grids. Thus, the operation of PtH systems can be induced at times of increased power generation by photovoltaic (PV) systems, or in cases where the voltage limit value at the grid connection point is exceeded. The integration of a thermal storage tank ensures the integration of emerging heat at all time. Köpp et al. [18] simulate the use of CHP plants within a virtual power plant (VPP), including photovoltaic and wind power plants. The CHP plants of the VPP can provide a flexible amount of electrical energy in the course depending on fluctuating load coverage by wind energy and photovoltaic plants. At the level of individual plants, the flexibilisation strategy is based on the use of thermal storage as well.
The reciprocal substitution of chemical energy sources and electrical energy for heat supply provides a further approach to flexibilisation. The increased application of this concept, which is based on a change of energy source, is often attributable to the industrial sector. Due to high losses, storage-based flexibilisation concepts are not suitable at high system temperatures of up to 300 °C [19]. Heating systems using electric and fuel-based heat suppliers therefore often provide the process reliability required for the industrial sector [20]. In this instance, Molderink et al. [21] show that process flexibilisation is largely attributable to hybrid and redundant heat supply as well as to the existing long-term storage possibilities of conventional energy sources. Schulz and Brandstätt [22] describe the residual load-oriented operation of CHP plants in combination with heaters. In this respect, an increase in potential is shown by the system combination of a CHP system and an electric heater, which can use surplus electricity for heat supply in time periods where the residual load is negative, and the CHP system is switched off. This implies an adjustment of the classic heat-led base-load operation of the CHP plant and the peak-load operation of the electric heater towards an alternating mode of operation depending on the grid situation. Khripko [23] focuses on redundant systems consisting of gas boilers and electric boilers, as well as on CHP units and electric boilers for industrial heat and steam supply. Advantages with regard to supply security or the possibility of supplementing or replacing obsolete boilers with electrically operated systems are highlighted.
Spieker et al. [24] introduce a heating system for the provision of control power considering changing energy sources, consisting of the components of a CHP, a gas boiler, an electric heater and thermal storage. In comparison to previously presented flexibilisation concepts, the high degree of freedom in controlling heat supply should be emphasised. The provision of positive control power can be achieved by either increasing the CHP output or reducing the power consumption of the electric heater. Negative control power is determined by the reversed control direction of both generators.
Apart from their technical design, flexibilisation strategies also differ in terms of their overriding objectives. In principle, flexible operating behaviour can be achieved through the orientation of different reference values [25]. The selection of the external signal as the reference variable has a major impact on the outcome of the flexibilisation concepts. There is a difference between the following concepts and the reference quantity used in each case:
- System flexibility: grid frequency
- Market flexibility: energy exchange (EEX) price
- Grid service flexibility: local residual load
A system or market-oriented request for plant flexibilisation is the standard use case for plant deployment [14]. In the study by Köpp et al. [18], a market-based use of CHP plants can be found within a virtual power plant, while Spieker et al. [24] propose an alternative marketing combination of plant flexibilisation via the spot and standard power market. The grid-based reference values masked regional effects of the grid feed-in of renewable energies. The adaption strategy of the operation of CHP and PtH plants to the local residual grid load, proposed by Schulz and Brandstätt [22] and Wehmhörner [16], followes this approach. Consideration of the local power balance in electrical grids can contribute to minimising transmission losses but also decisively reduces reversed power flows and the regulation of generation from renewable energies [26].
From a technical perspective, most of the concepts presented in this section attest to the high potential for flexibilisation through thermal storage, especially for small to medium-sized CHP plants. Despite a high demand for process heat, high supply temperatures, and high standards with respect to process reliability, industrial applications are rarely part of standard flexibilisation concepts [27].
2.2. Research Gaps
The optimised operation of the electricity grid with regard to the integration of fluctuating renewable energies can be achieved by various measures. A successful approach is to make producers as well as consumption more flexible. The literature review provided an overview of the existing approaches and applications. The consideration of a combined heat and power system for high-temperature heat has not yet been carried out. In this context, the following research questions will be answered:
- What is the contribution of the flexibilisation through a change of energy source for the integration of renewable energies?
- Can the supply capability of the heat system be maintained under changing conditions of distribution grid and production?
- Which potential differences arise with regard to changing residual load curves?
- Can production reliability be maintained under varying probabilistic production conditions?
3. Methodology and Modelling
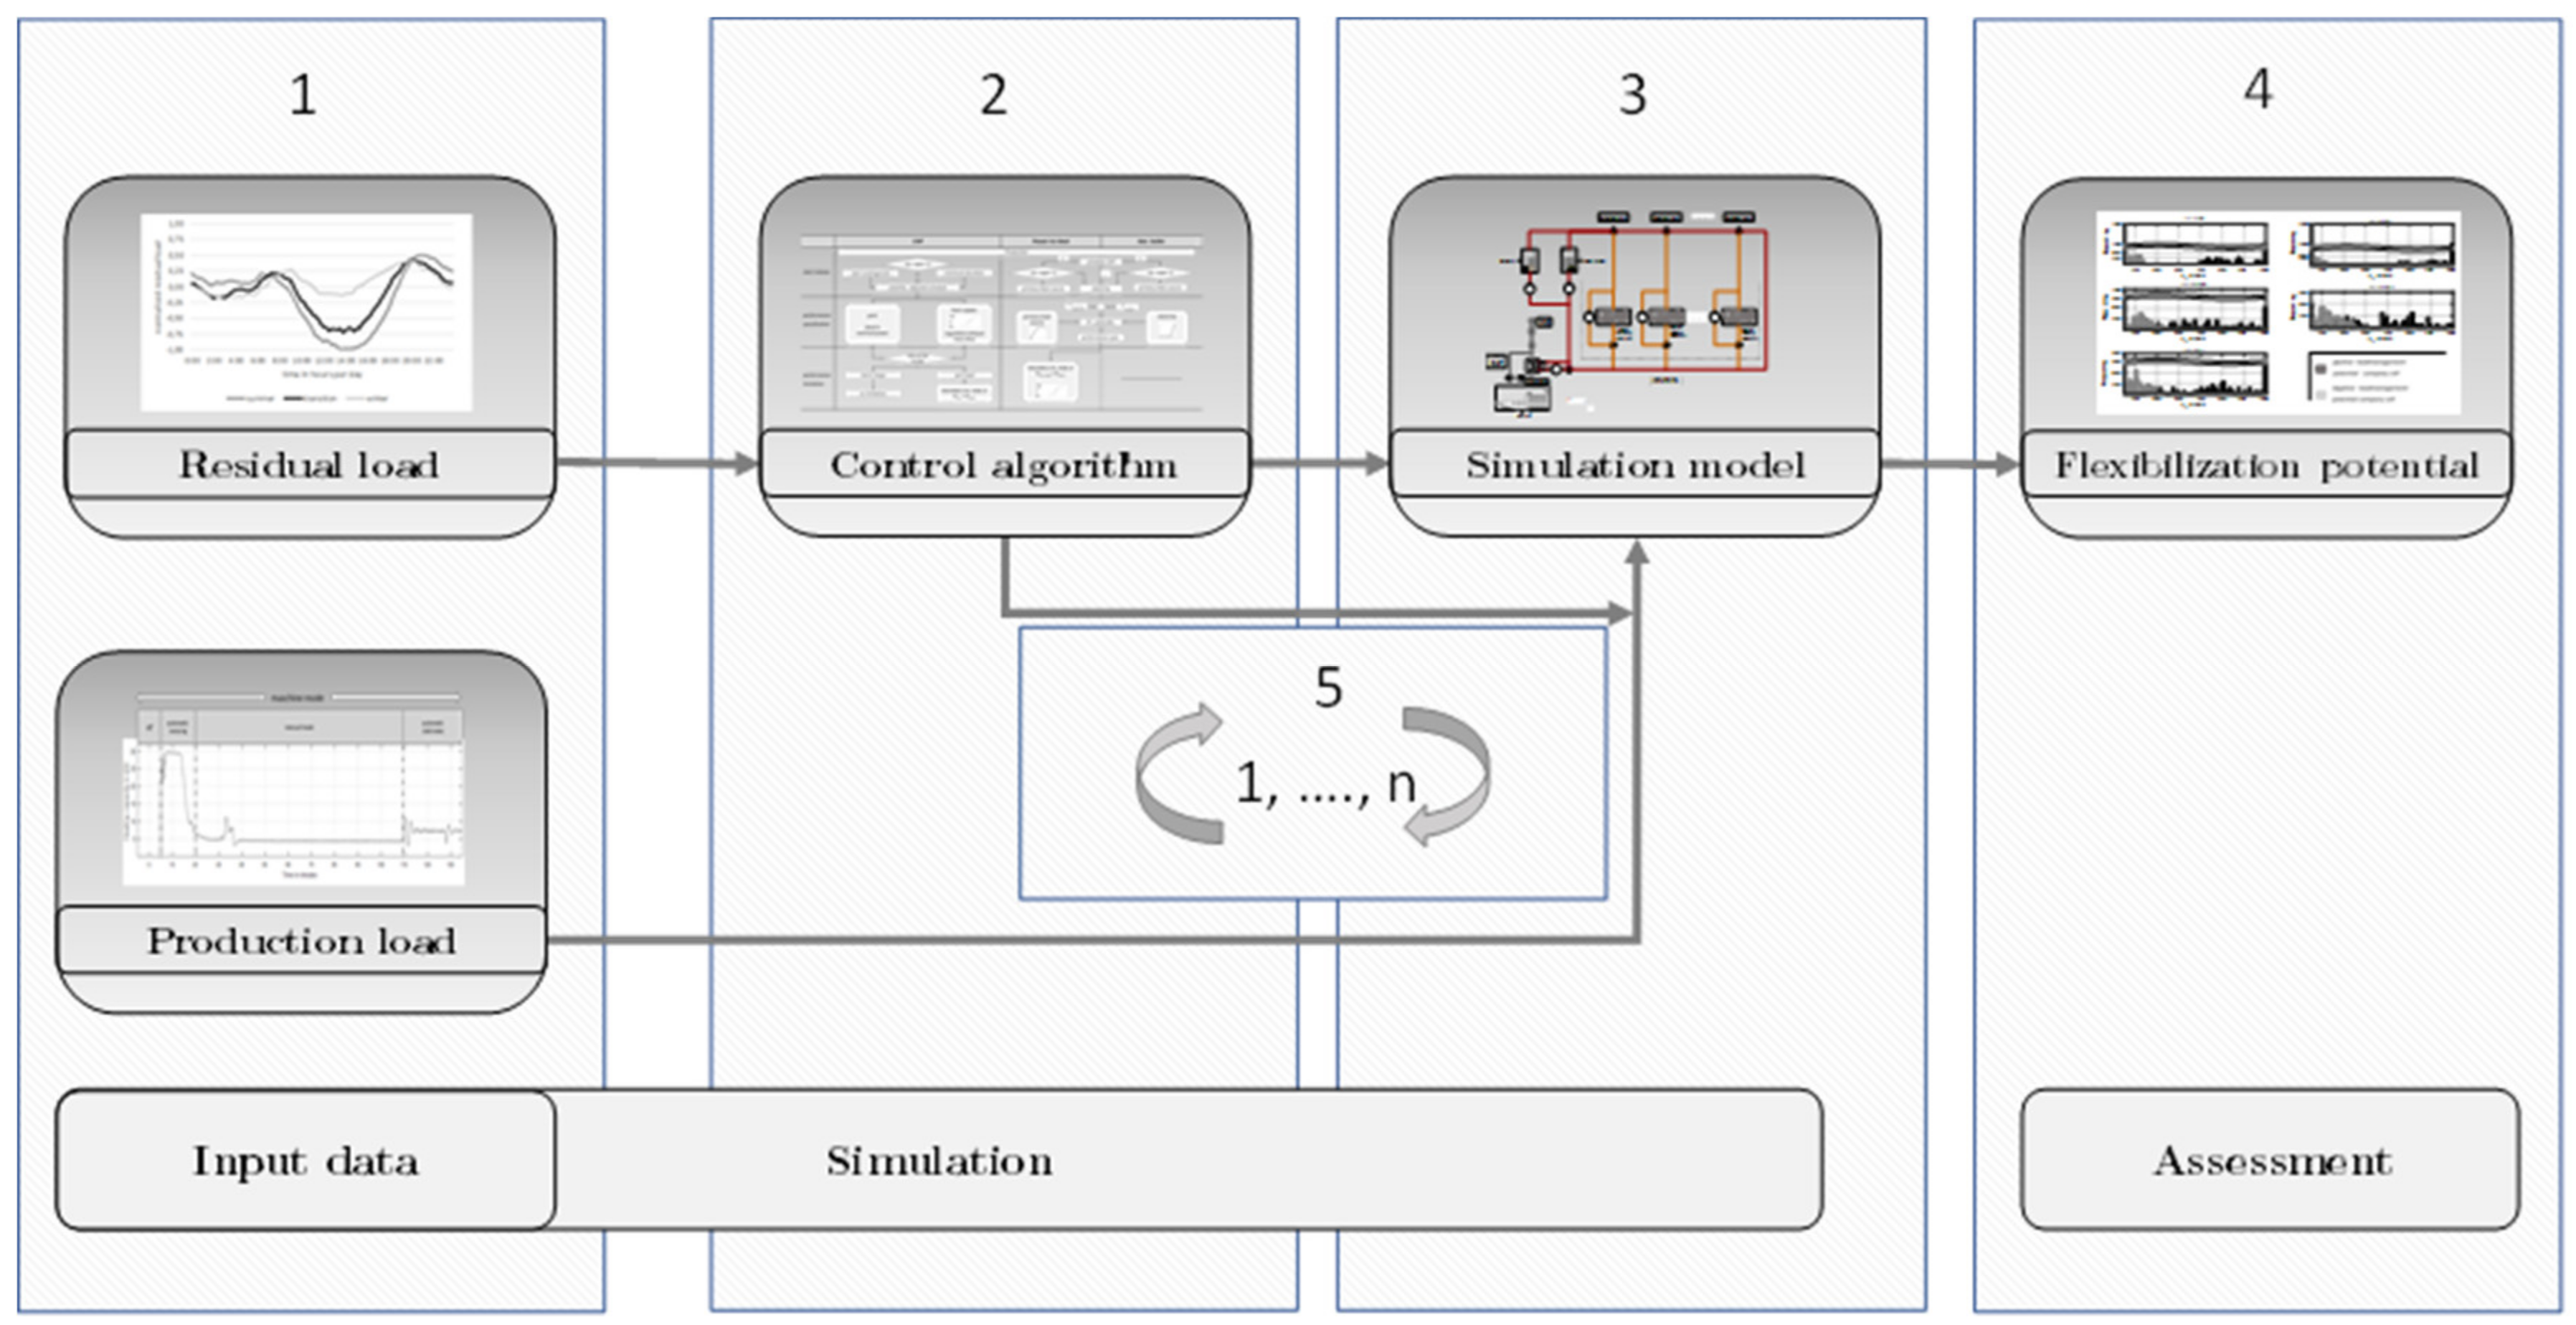
An extensive simulation study is carried out in order to quantify the flexibilisation potential of change of energy sources using the example of an injection moulding company. The simulation study is based on measured data of both plastic manufacturers and residual loads of varying grids. The general methodology of the simulation study is described below and visualised in Figure 1.
The starting points are the two essential input data sets of the simulation (Figure 1, part 1):
- The first input sets are residual load profiles from four rural distribution grids with a high share of fluctuating renewable energies. Different electric grid states are considered for a dynamic potential determination.
- The second input sets are heating load profiles of injection moulding machines synthesized from real measurement data. The derivation of heat load profiles of the injection moulding machines is based on probability density functions.
A plant schedule for the operation of all relevant system components (CHP, PtH, gas boiler) is determined the next step. A control algorithm specifies the basic operating mode of the components with regard to the residual load of the current time step (Figure 1, part 2).
The simulation model maps a scaled heating system consisting of a CHP, PtH, and gas boiler as well as thermal oil pipes, heat exchangers, pumps and consumers. Within the model, the schedule is compared with the probabilistic load profiles and, if necessary, adapted by the algorithm (Figure 1, part 3).
The evaluation of the flexibilisation potential is based on various scenarios. For this purpose, an initial state (the original state of the company with a purely electrical energy supply) is always compared with different complex expansion states and baselines (Figure 1, part 4).
To enable a generally valid statement about flexibilisation potential under as many conceivable combination possibilities, a large number of different residual loads (followed by different schedules) are coupled with different production load profiles. A Monte Carlo simulation is used for this purpose. In general, Monte Carlo methods are algorithms that use random inputs. They can be used to simulate complex stochastic models and generate data series with typical conditions and trends. They are used in various fields such as physics, economics, medicine, and technology.
The stochastic influences of technical and economic systems are often modelled by probability density functions (PDF) and Markov chains. The Monte Carlo method and the Markov chains are used to investigate the properties of a techno-economic system that behaved randomly [28]. For this purpose, random system variables are generated, which describe the behaviour of system components to a sufficient extent and enabled conclusions to be drawn about the behaviour of the overall system (Figure 1, part 5).
3.1. Input Data
3.1.1. Residual Load
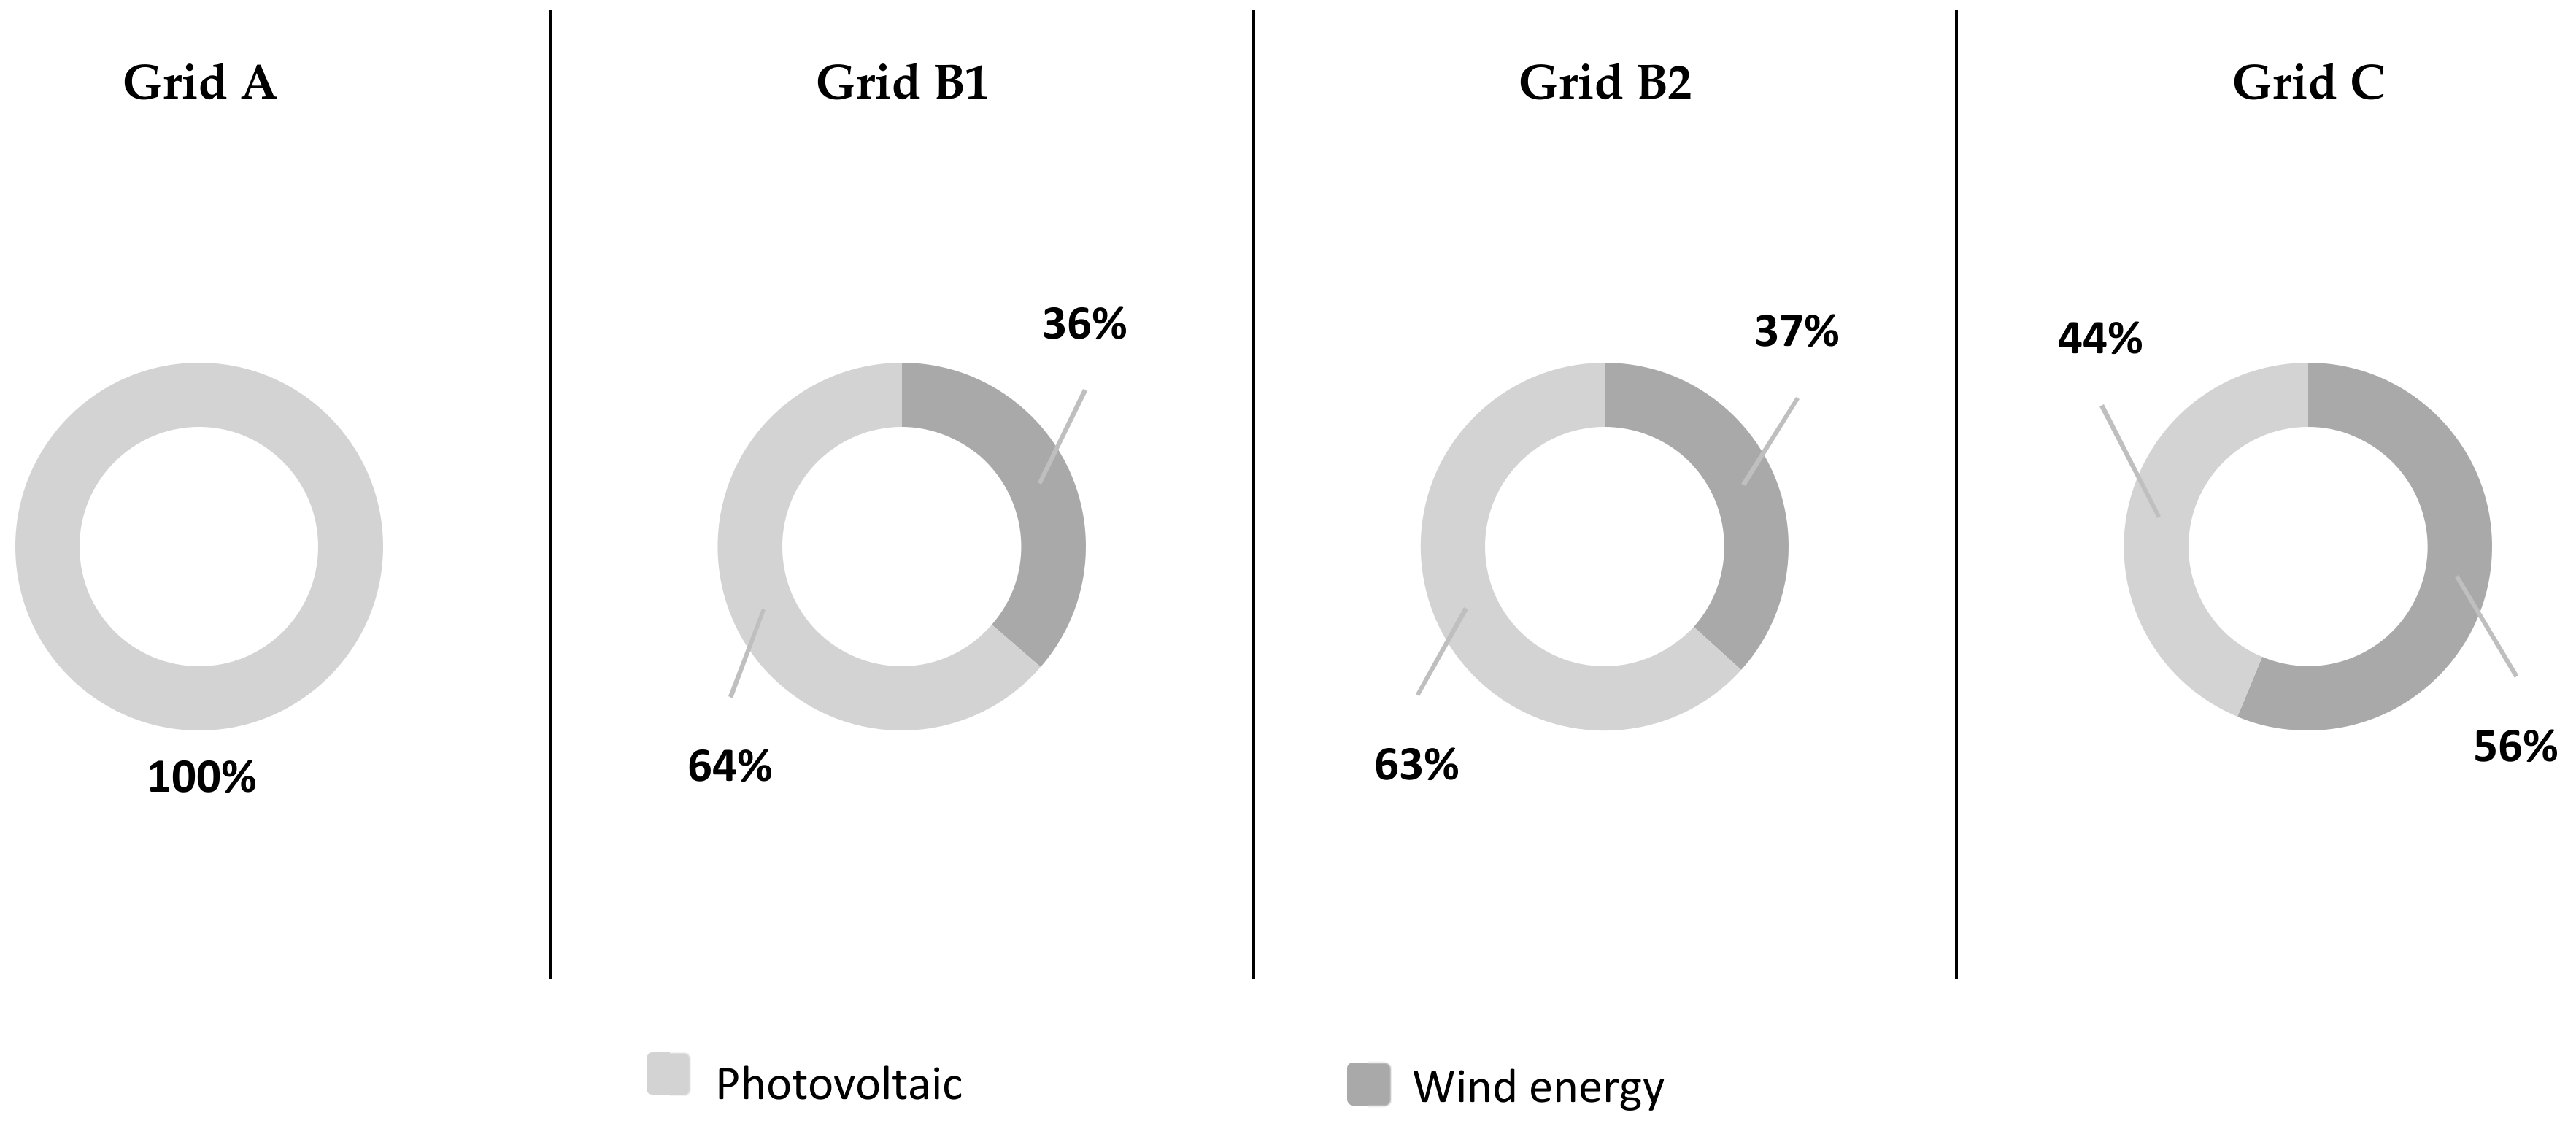
The measuring point of the residual load profiles is the transformer level between high and medium voltage. The datasets are available in 15 min intervals over a period of one year and represent rural grids. For the investigations, 15 different real measured residual load profiles are considered, of which typical profiles are identified and chosen for further processing. The distribution grids of similar geographical locations show similar characteristics. In southern Germany, there is an increased accumulation of grids with a strong photovoltaic character. The north-east of Germany comprises distribution grids in which there are an increasing number of wind turbines. Grids with a strong mixed character with both generators are located in the middle of Germany [29]. The following groups are selected:
- Grid A: Photovoltaics embossing
- Grid B: Photovoltaic dominated mixed embossing
- Grid C: Wind energy dominated mixed embossing
A technology-specific breakdown of the volatile relative generator output is provided for a rough allocation of the individual residual load profiles in Figure 2.
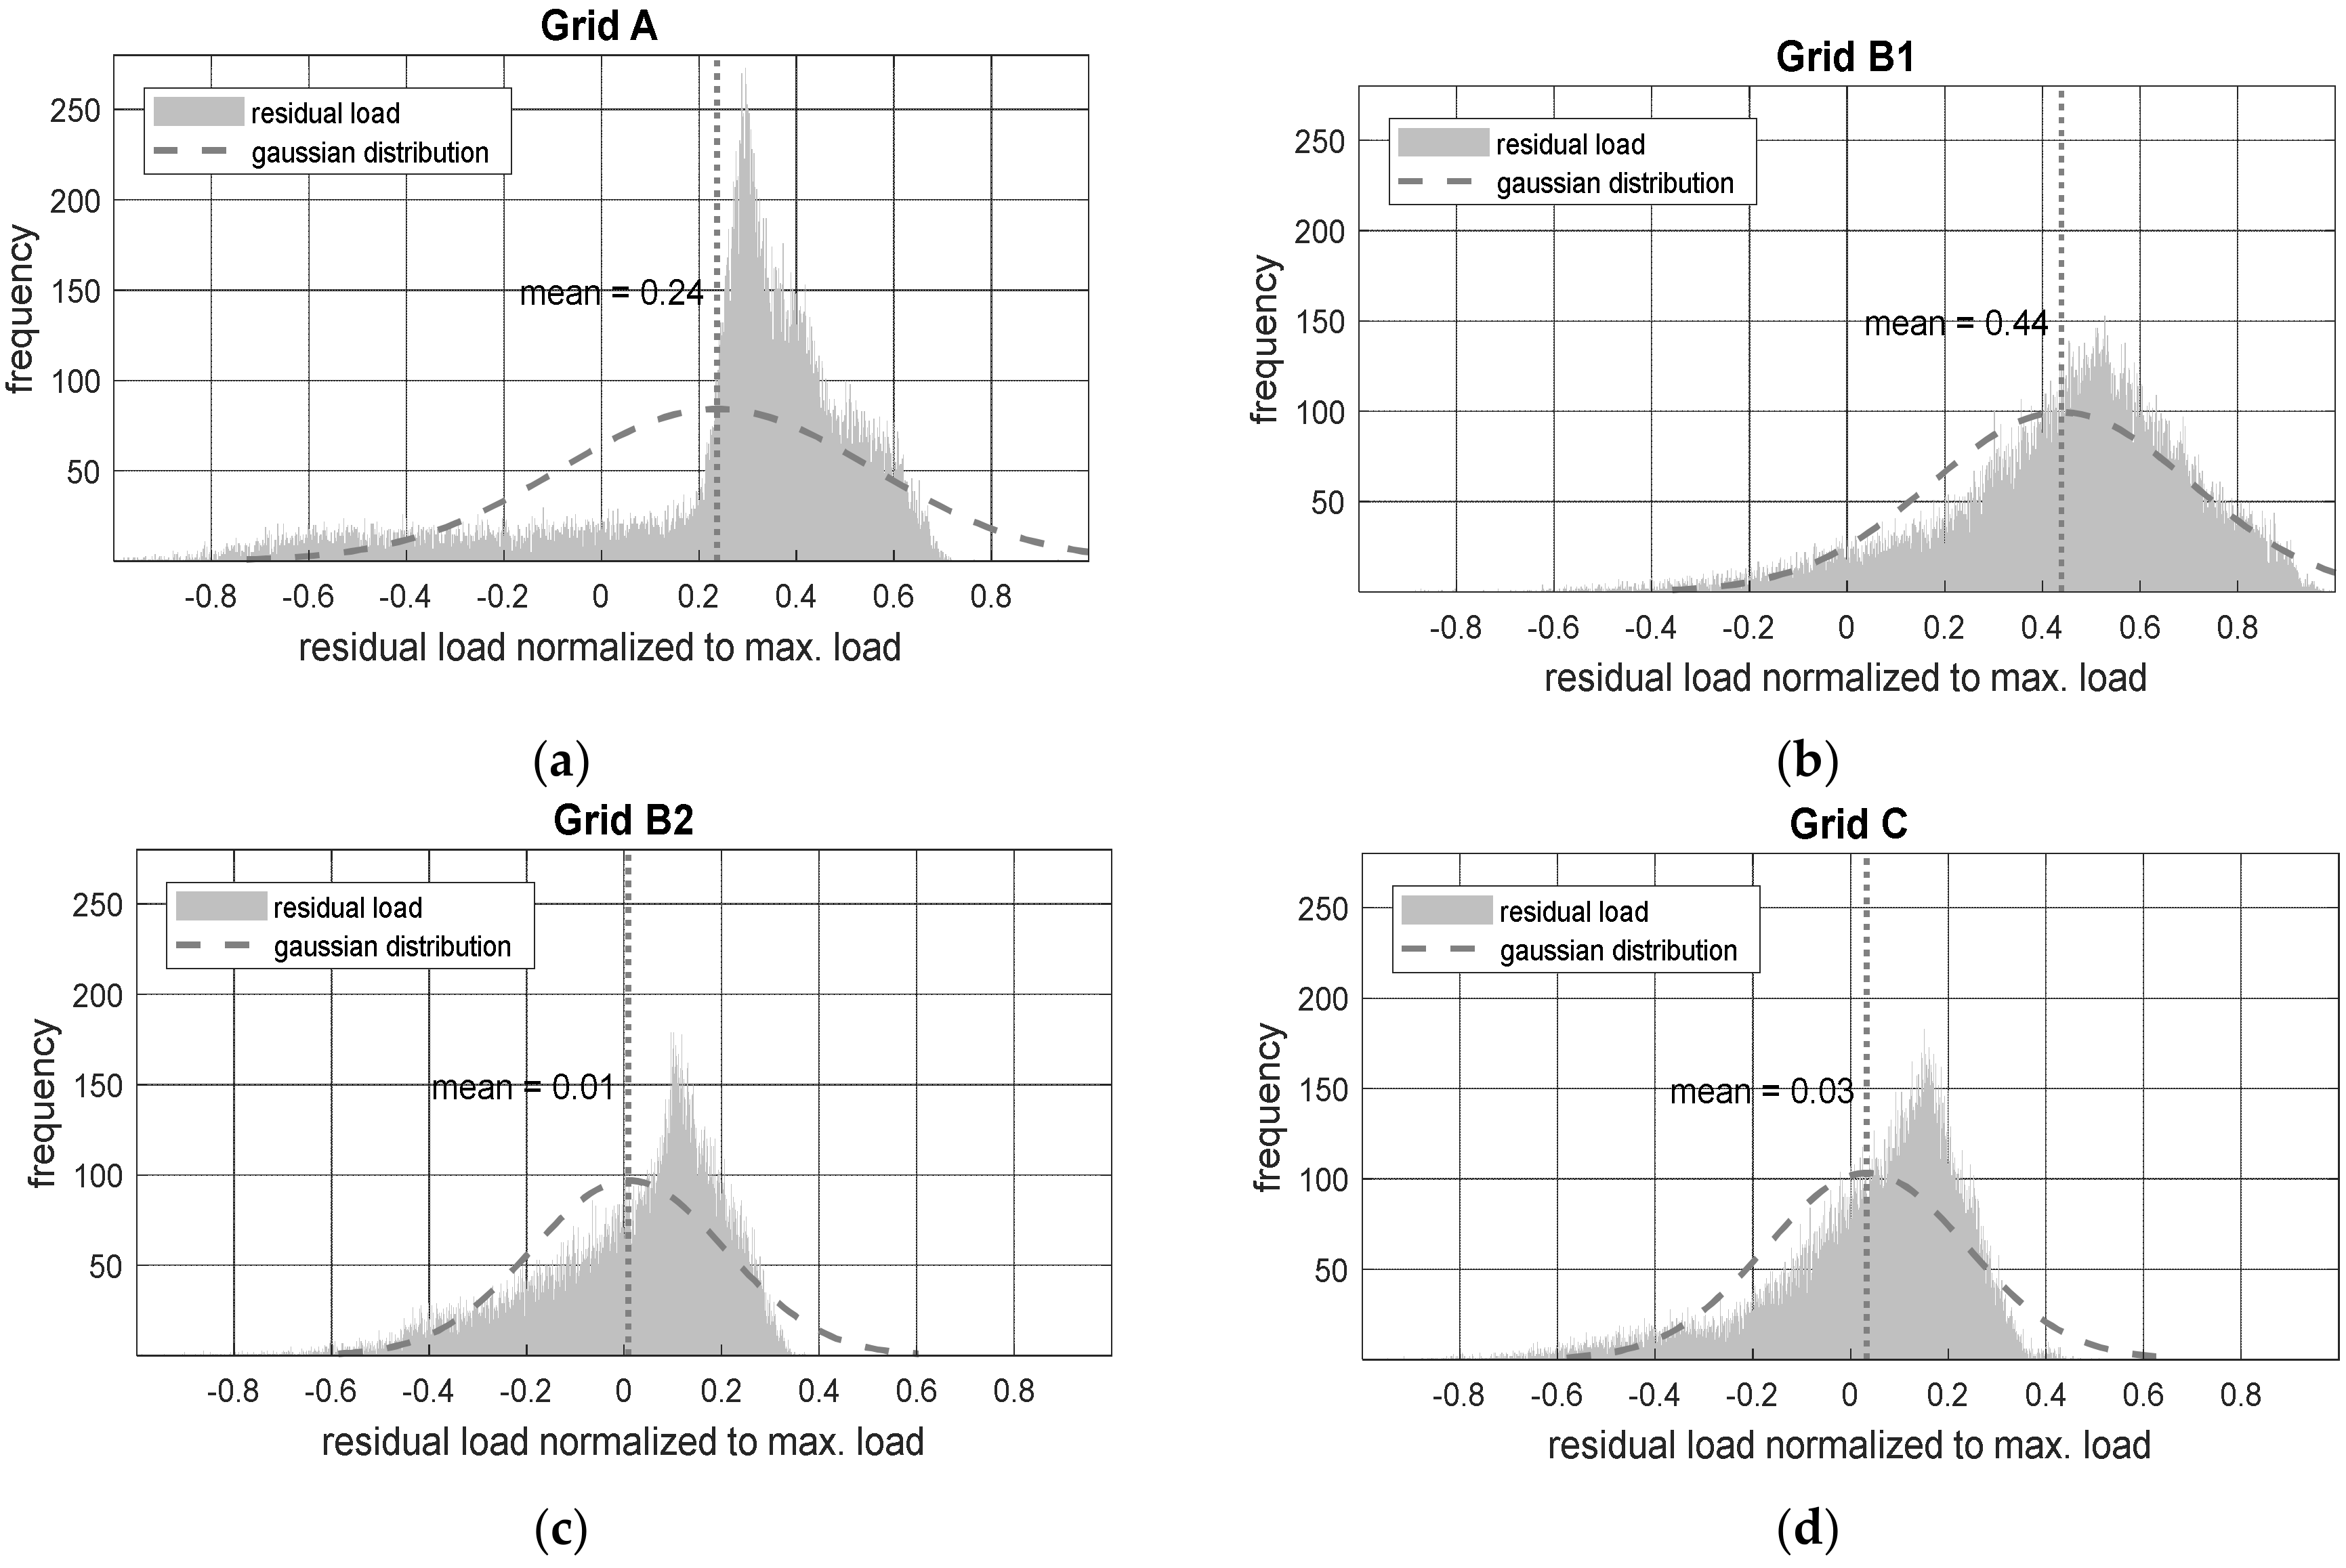
Figure 3 shows the histograms of the residual load curves normalised to the respective grid maximum load for each type of grid over the observation period of one year.
Characteristically for the distribution of the PV-dominated, Grid A has a right-skewness over a wide scatter range. A wide, evenly distributed flank into the negative range is visible. The same applies with a much lesser extent to the histogram of Grid B1. The scattering of the distribution runs almost exclusively over the positive range of the residual load. Grid days without reversal of the load flow are rather an exception for this class of distribution grid. Comparative to the histogram of Grid B2, similar statements can be made for the volatility of the curve and load flow changes of Grid C.
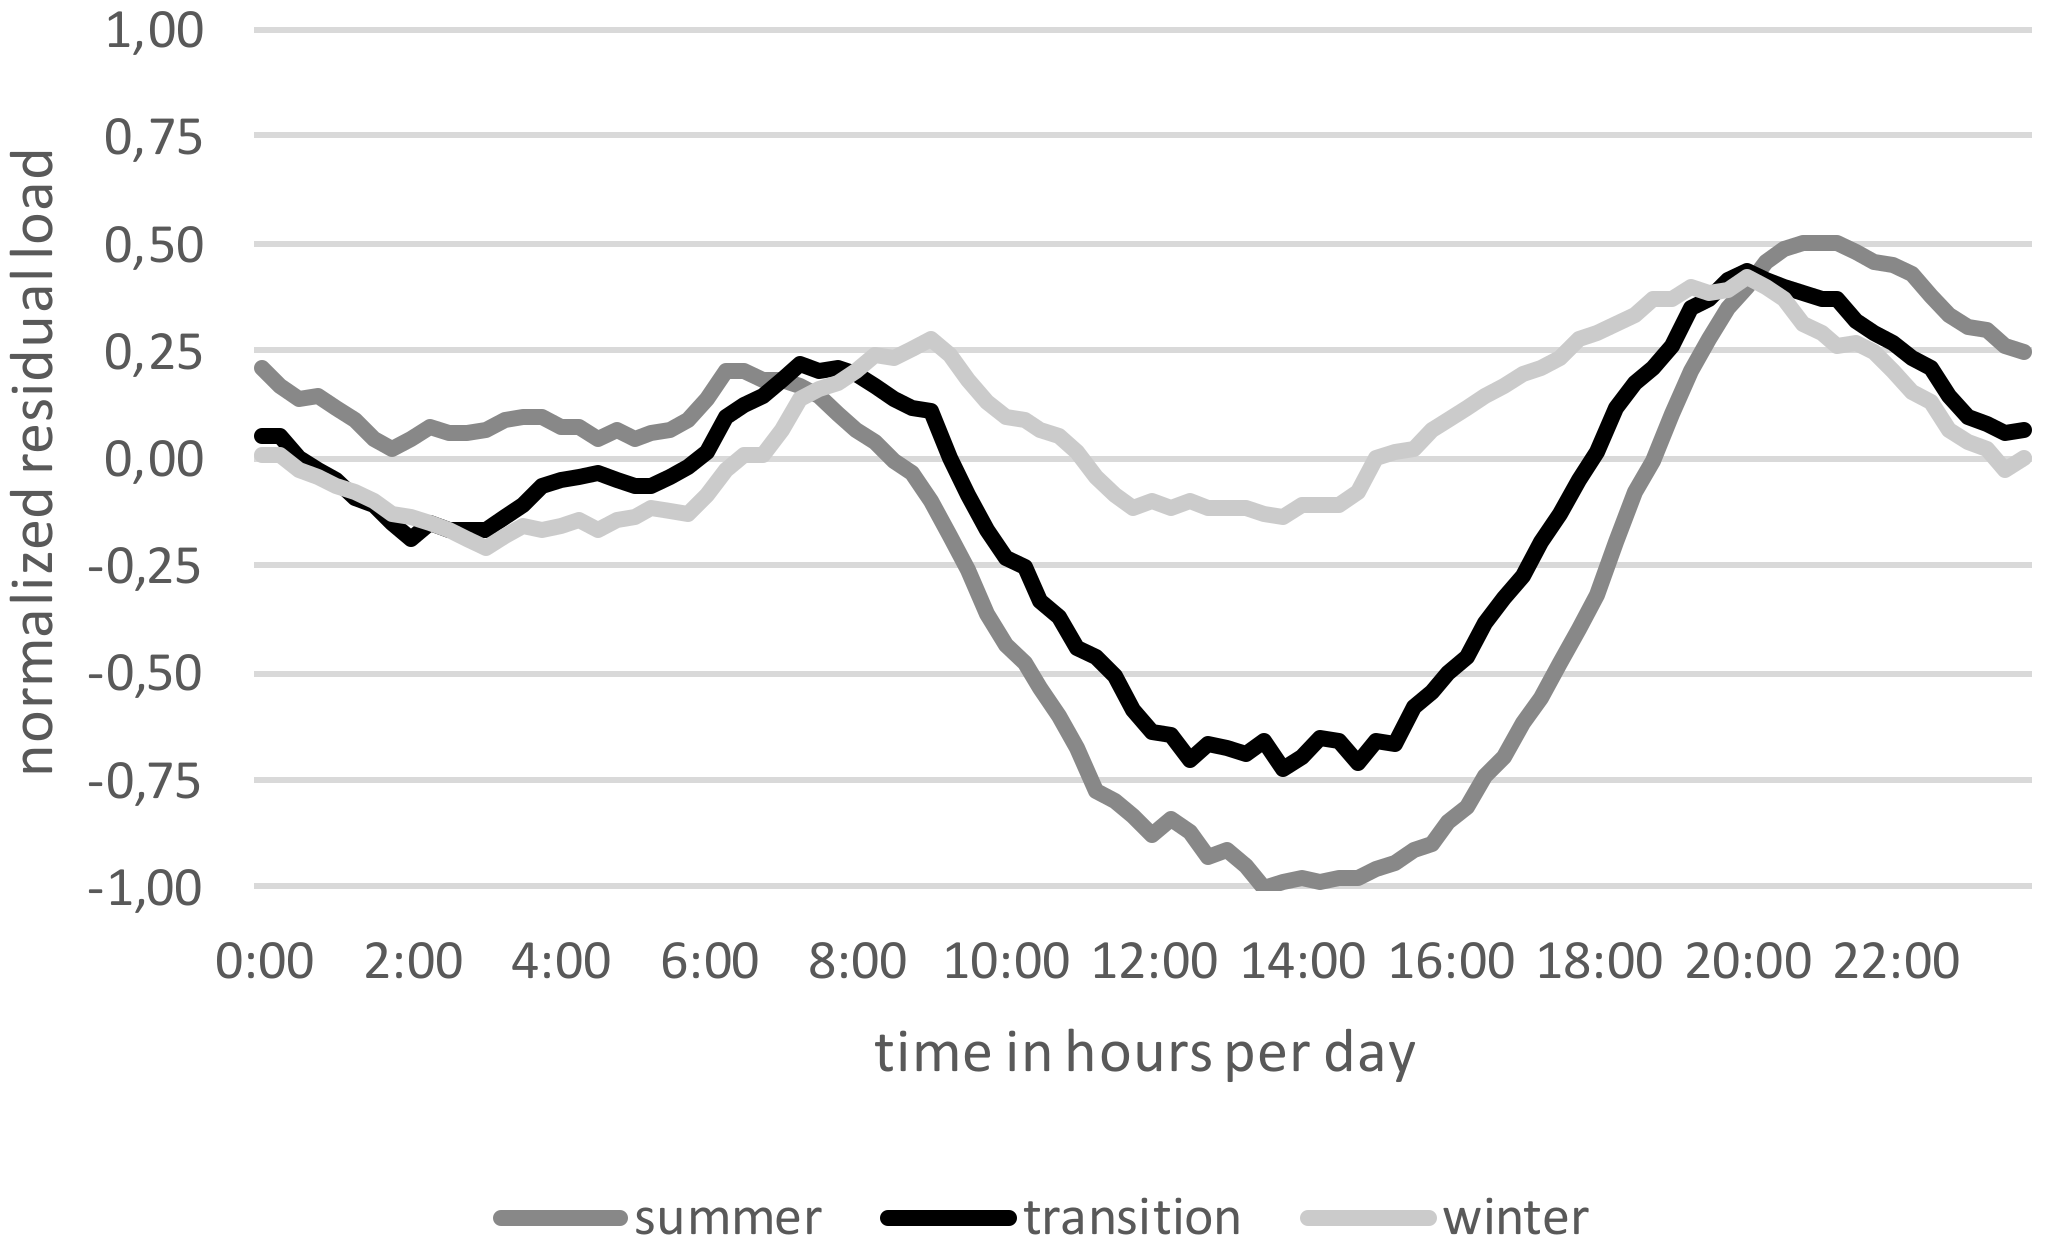
The specific feed-in characteristics of renewable energy systems show both, different effects on recurring systematic structures of the residual load curve and its volatility [30]. Grid-based reference values such as residual load fluctuate in this consequence along different time scales [31]. The feed-in process of wind turbines is subject to strong seasonal influences. The operation of PV systems is therefore subject to other feed-in structures, which are characterised by far-reaching daytime and seasonal generation patterns (see Figure 4).
3.1.2. Probabilistic Heating Profiles
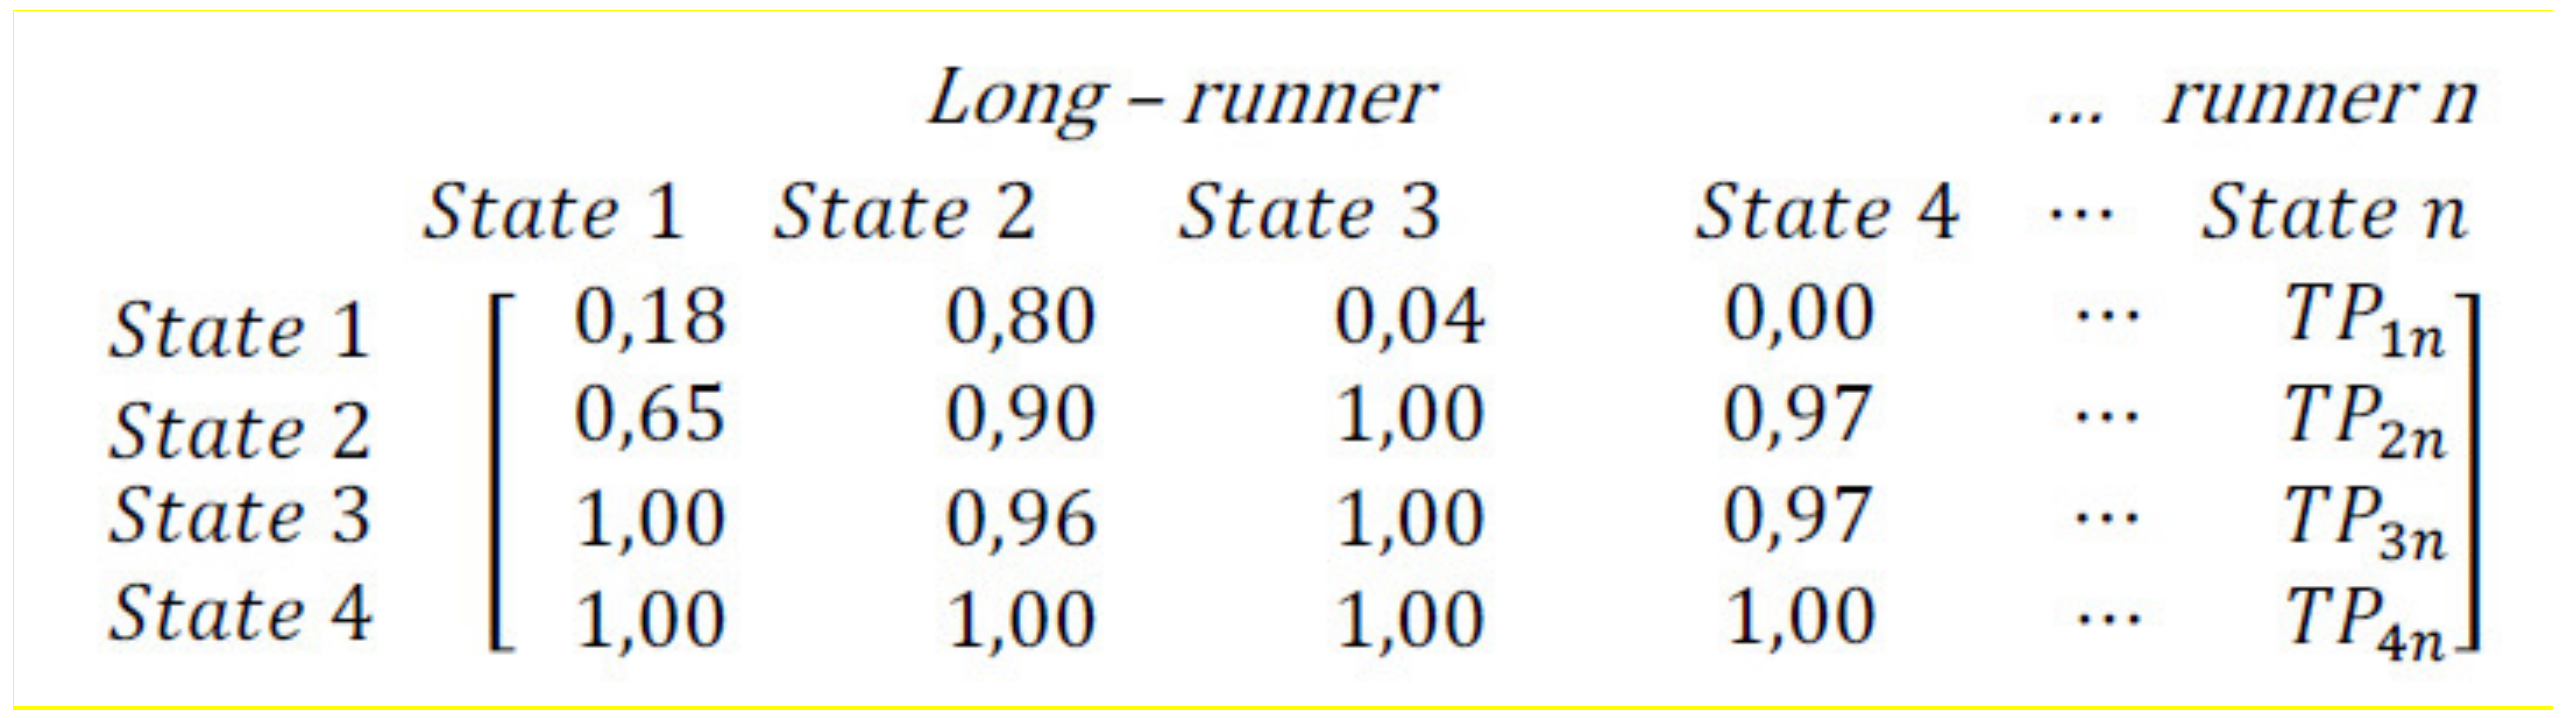
Apart from the specifications of the distribution grid condition, the grid-compatible use of plants is oriented towards the demands of production. In the case of injection moulding companies these are represented by the heat load profiles of the injection moulding machines (IM). In addition to the type of machine, the specific level of heating output also depends on the operating condition of the utilized machines. In this respect, a differentiation has to be made between the following operating modes:
- Automatic mode: autonomous production (state 1)
- Manual operation: machine operator specifies cycle time and power consumption (state 2)
- Alarm operation: fault, only important components are kept at temperature (state 3)
- Offline: systems at stand-by (state 4)
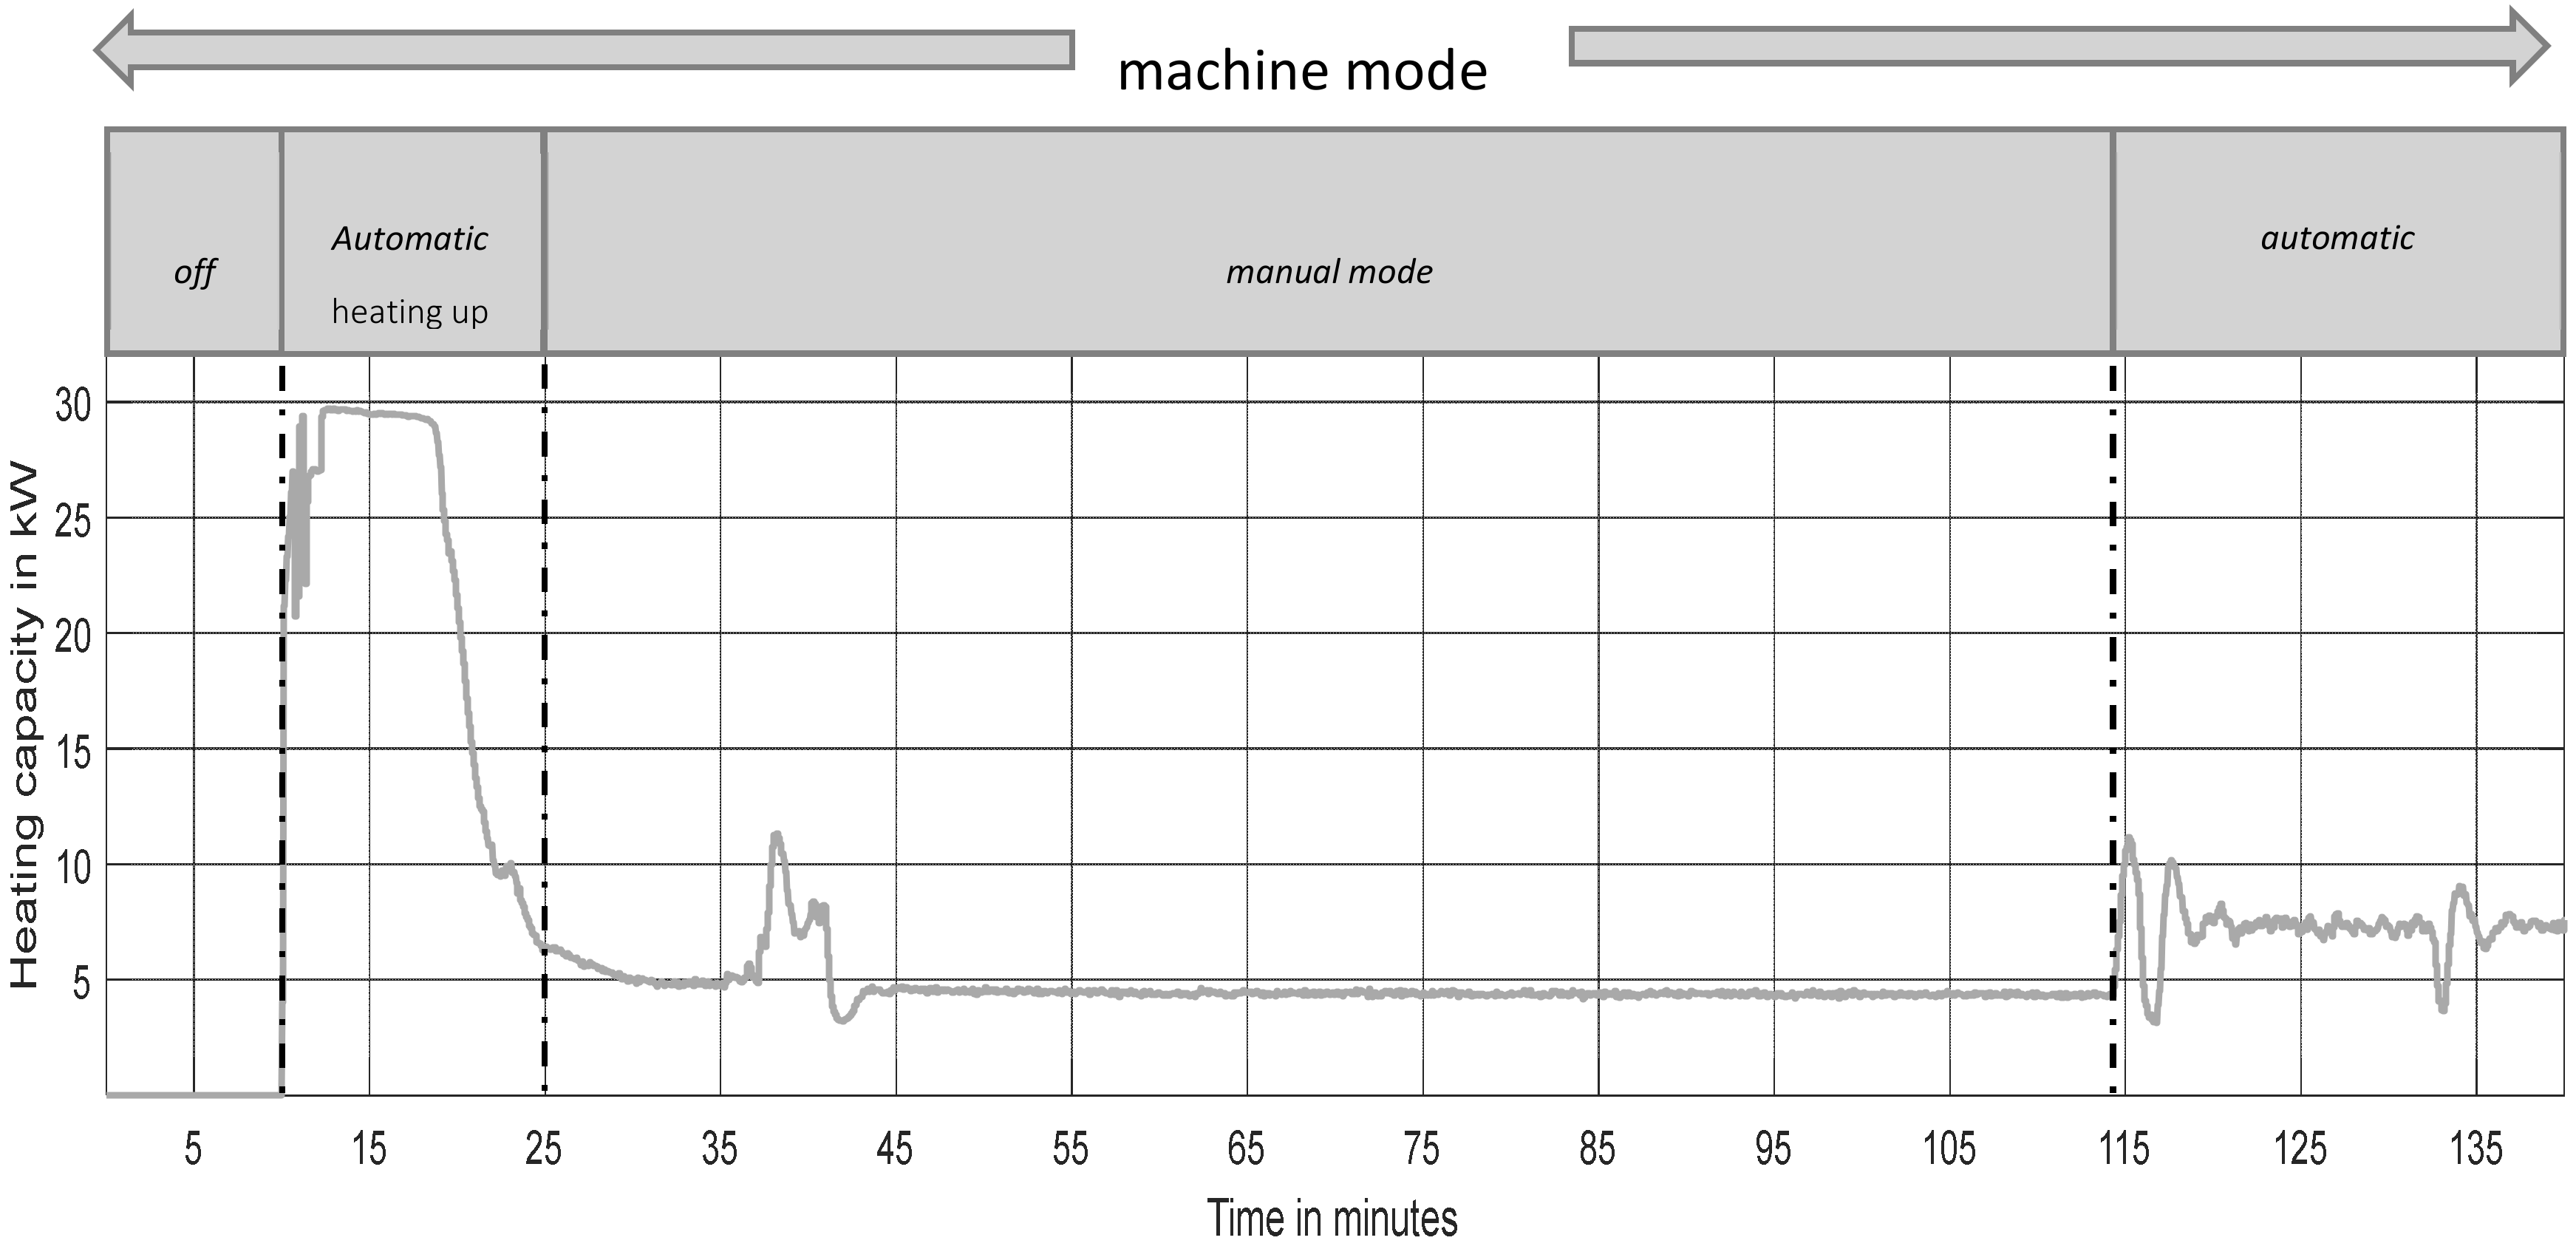
Figure 5 shows an example of the measured profile of the heating power of an injection moulding machine over changing system states.
The evaluation shows that the heat output reached its maximum during automatic operation. Nevertheless, a differentiation must be made for this mode between a stationary heating output during operation and a heating peak during the start-up process. The frequency of occurrence of individual operating states and transitions between operating states themselves are analysed in a real medium-sized company and included in the simulation by means of transition probabilities (Figure 6) [10].
The transition probabilities indicate the change of state from state x to state y. The probabilities are set up in a transition density function for all machine types and used for random load profile generation.
Plants with similar behaviour regarding their production runtimes form the following groups:
- Long-runner: The production time is longer than 80% of the possible production time. The production is interrupted only by short alarm and offline times.
- Short-runner: The production time of the machine is shorter than 40% of the possible production time.
- Normal-runner-offline: The production time is by nearly 60% of the possible production time. Production is interrupted by few but long offline times.
- Normal-runner-cycle: The production time is by nearly 60% of the possible production time. Production is interrupted by many short offline times.
The heat demand profiles are derived on this basis by a sequence of the various operating states. The start-up process within automatic mode represents a special case. This is only present in the simulation if the IM has been in offline mode for at least 2 h and the subsequent automatic mode can be maintained for 1 h. For the actual simulation, a machine park based on the previous executions is defined.
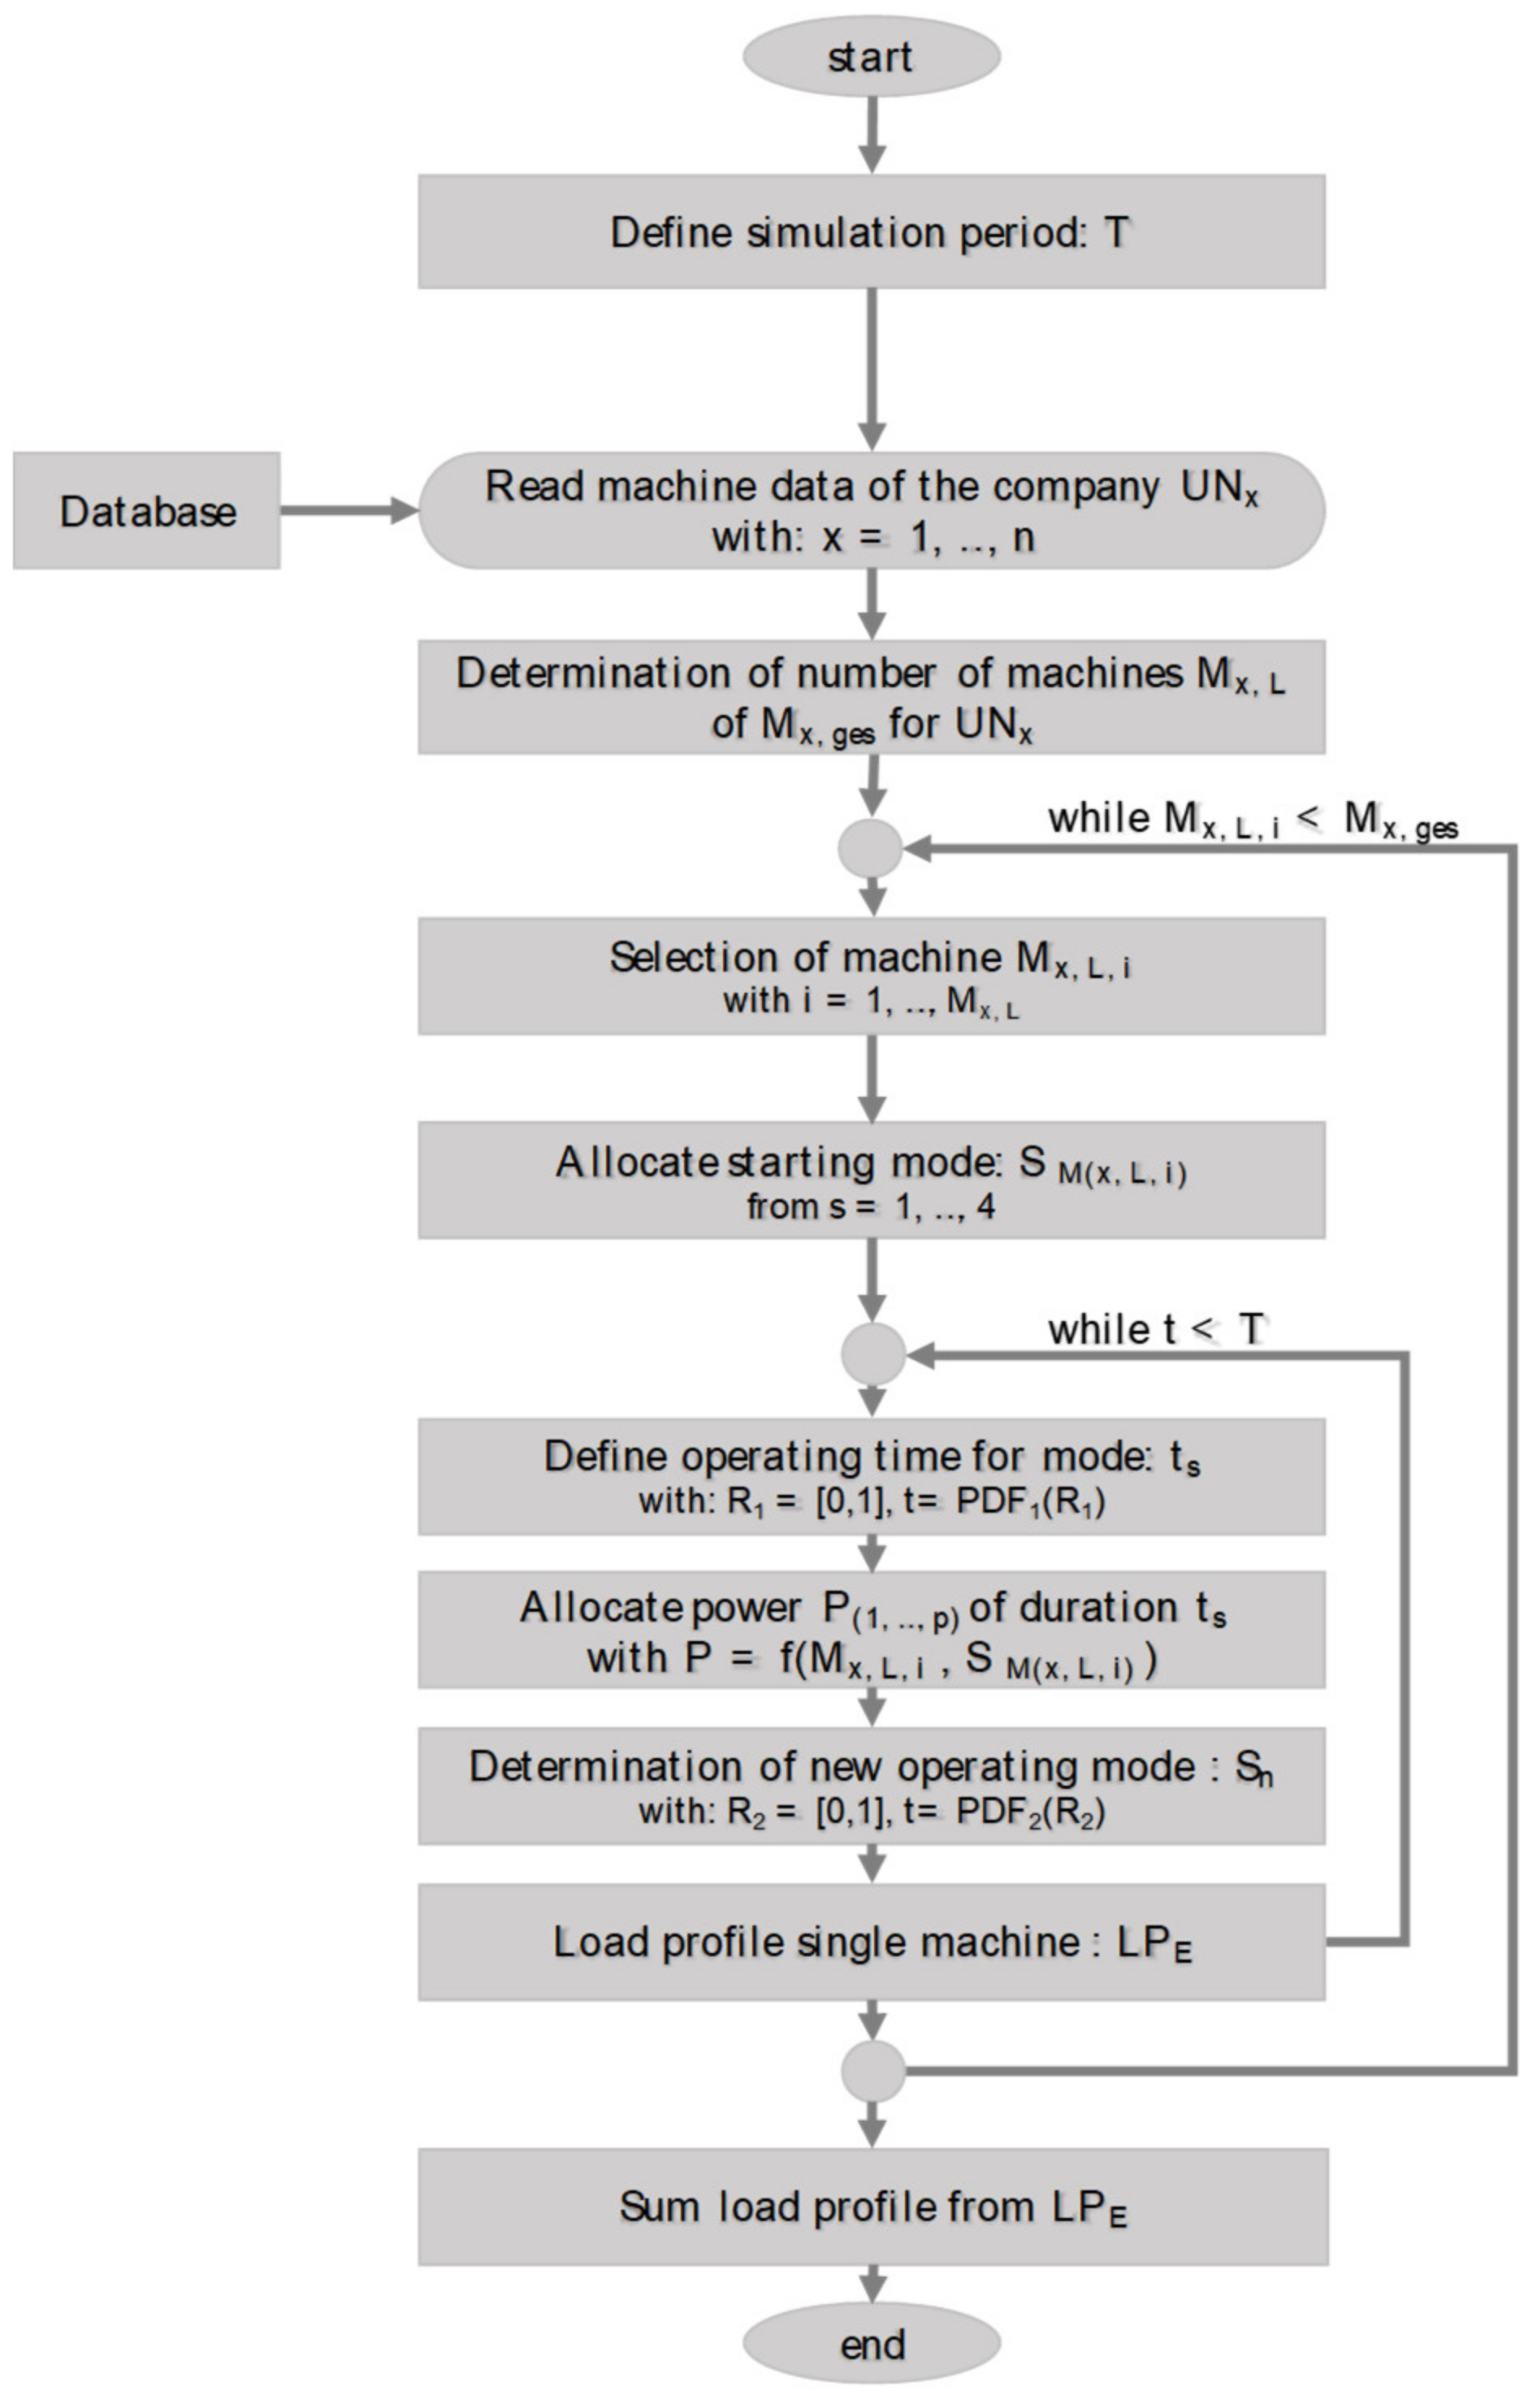
A generation of the profiles according to the mentioned approach allows a manifold illustration of different production-side influencing factors on the load management potential of the overall system. Figure 7 illustrates the process described for generating the heating load profiles. A more detailed description of the process and the pseudo code can be seen in Dunkelberg et al. [10].
The process starts with the definition of the simulation time period, T. All relevant machine data are loaded from a database for the company UNx. The machines are allocated to runtime groups. This is followed by the determination of the number of machines in the groups (Mx,L). In the next step the load profiles are determined.
At the beginning, the start mode, S, of a machine is defined. The length of the state is determined by a random value, R, in the range from 0 to 1 (ts). This determines the length of the mode in combination with the probability density function (PDF, see also Figure 6). The power values P(1, …, P) of the machine are assigned to the length of the operating state. A new operating state is defined, and the process is repeated. In total, the process is performed individually for each machine from each machine group. At the end, a sum load curve are calculated.
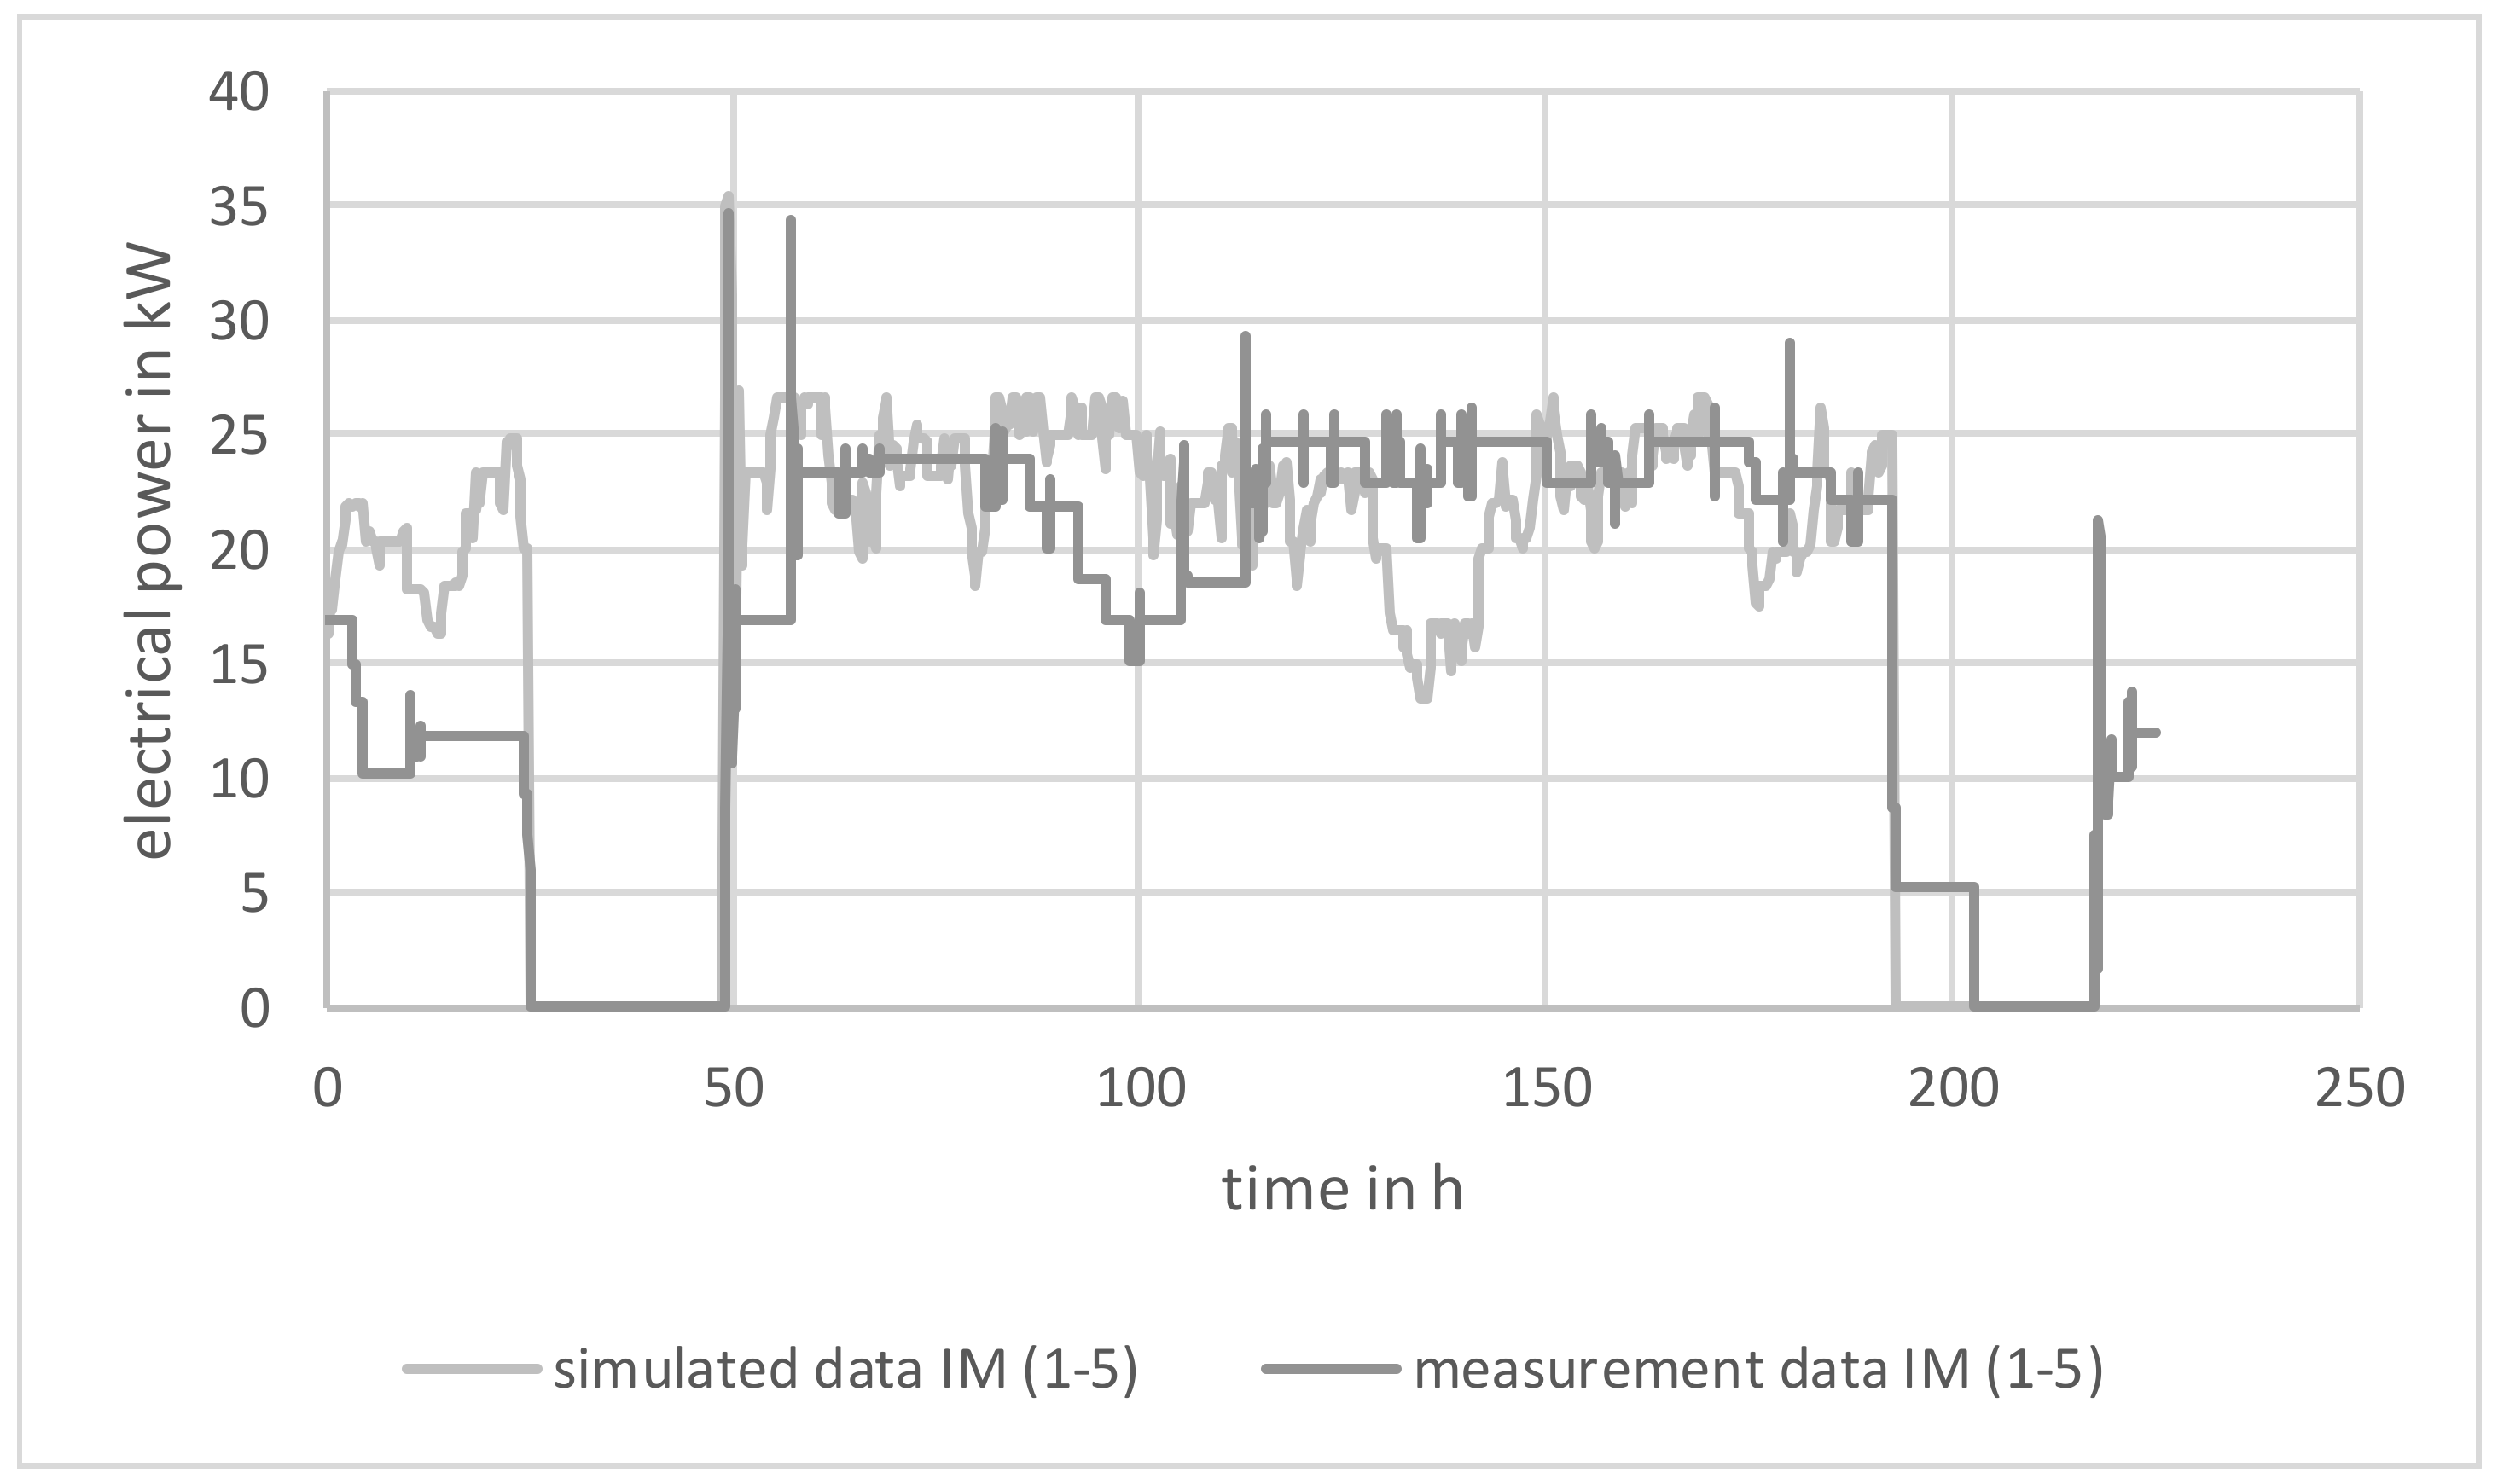
A comparison of the synthetic load profiles with measurement data of five IM of a plastic packaging manufacturer shows a high correspondence. Both the lowering over the weekend and the start-up peaks are comparable (Figure 8).
Deviations in the process result from the probability-dependent changes in state. On average, the two performance curves are at the same level.
3.1.3. Modelling
The energy required for the production process is almost exclusively supplied by the purchase of electrical energy from the grid [32].
The substitution of electricity for heating purposes by other energy sources, such as natural gas, requires a technical redesign of the heat supply that allows the use of different heat generators [33]. Dunkelberg et al. [34,35] describe an alternative concept for supplying heat to extruders and plastification cylinders from decentralised heat sources using organic fluids. A heat flow is conducted to the extruders by means of flow and return lines and fed to the respective temperature control zones of the IM. Regarding the very high system temperatures of up to 300 °C required for melting the materials, temperature-resistant thermal oil is suitable as a heat transfer medium. The heating of the thermal oil system can be carried out on this basis via classic gas boilers, CHP or PtH systems.
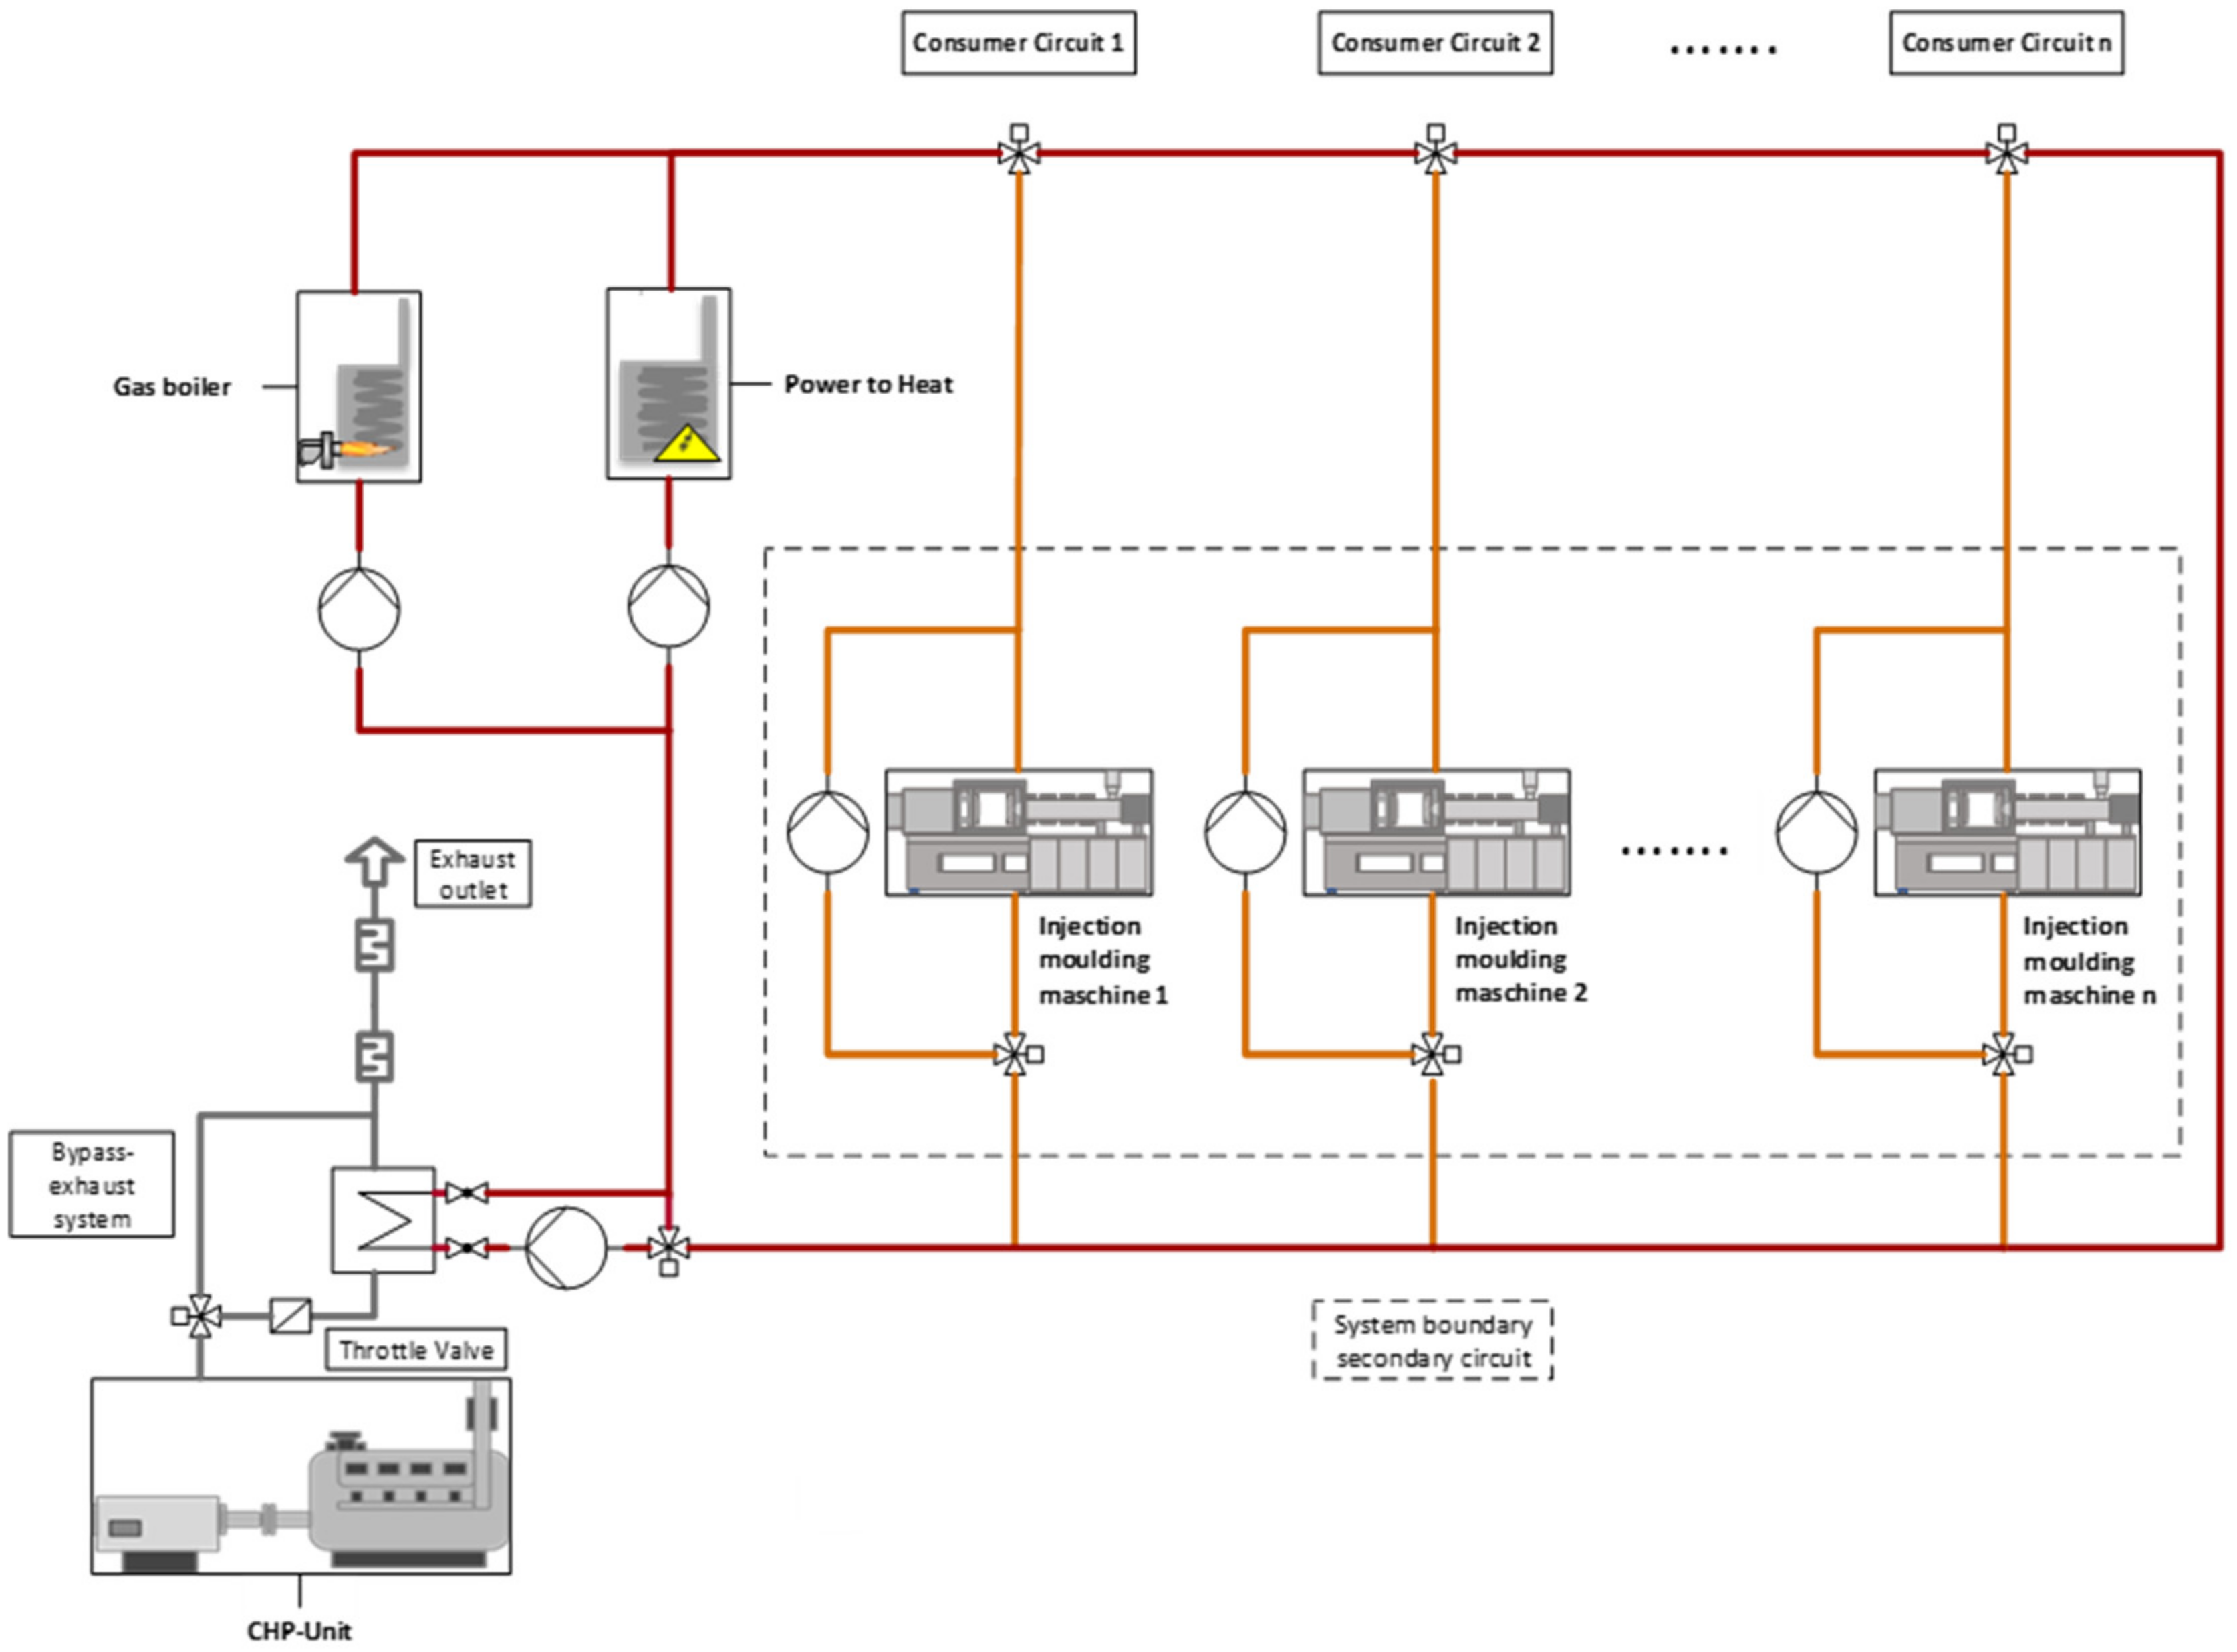
An object of further investigation is the heat compound system presented in Figure 9 (characteristic data is shown in Table 1), which is suitable for the thermal supply of the injection moulding process using various energy sources. To determine the potential, the system shown is mapped using a simulation model in Matlab/Simulink.
The system integrates three options, which are available for the process of heat supply (CHP, PtH, gas boiler). On site, the producers are integrated into the thermal oil circulation system shown in Figure 9. The simulation model can be divided into different circuits. The integration of the heat suppliers takes place separately and independently of each other in the primary circuit. Due to high system temperatures, the heat-side integration of the CHP plant takes place via the heat exchanger of the combustion engine installed in the plant. The exhaust gas mass flow through the heat exchanger is controlled by throttle valves in such a way that the thermal heat decoupling could be adjusted independently.
Circulation pumps convey the thermal oil. The IM are supplied via individual circuits. The consumption of the consumer circuits (secondary circuit) is controlled via valves, which adjusted the extraction mass flow to supply the IM from the primary circuit. The central control variables are the temperatures to be maintained.
The simulation model is based on the model presented in Dunkelberg et al. [35]. Components of the heat system such as pipes, pumps and heat exchangers are explained in detail there. The relevant heat generation plants are briefly explained below.
Combined heat and power unit:
The core of the simulation model is a CHP unit, which provides the high-temperature heat (up to 300 °C) via the exhaust tract. The heat output of the CHP unit depends on the nominal electrical output of the CHP unit. The model is based on a four-stroke rope process. The Seiliger process is a thermodynamic cyclic process that comes close to the real processes in a combustion engine. It is a combination of the equilibrium space and equilibrium pressure process.
The temperatures, pressures and fuel mass flows for each change of state result from the load-dependent calculation of electrical and thermal efficiencies. The engine temperature is formed by the heat transfer between the combustion gas and the engine block. The exhaust gas mass flow results from the air volume and the fuel volume.
PtH:
In addition to the gas boiler, the PtH system ensures the operating temperature of the thermal oil. The efficiency is set to a fixed value. The temperature of the thermal oil depends on the processing temperature. The maximum power of the PtH system is set at 20 kWel. The electric heater has a small storage element (pipe) which models minimal inertia and losses to the environment via convection and radiation.
The temperature increase ∆ϑ of the thermal oil is calculated by the delivered power, Pel, the mass flow and the specific material values of the medium and the efficiency .
Gas boiler:
As in every real system, there are losses and inertia in a heater unit. The start-up process is represented by a Pt1 element that is based on the behaviour of a real gas boiler. The thermal efficiency is fixed. The inertia of the thermal power is modelled by a characteristic curve of a real heater. The losses are modelled by using a small storage element.
4. Simulation Setup and Experimental Plan
The main element of the investigations is the comparison of various input factors. Residual load profiles and heat demand profiles are combined by several simulation runs. Individual grid (RL) and production days (PL) are considered.
The actual simulation period is preceded by a running-in phase. This serves to adapt the operation of the heat generators to the consumption situation at the beginning of the day (0 a.m). The maximum combination scope of the annual cycles is determined by drawing a random sample. The repercussions of both input data records on the simulation (XRL and XPL ) are considered in equal parts by a symmetrical sample size of 60 different daily progressions each (xRL and xPL). Each remaining grid day is linked to each possible production situation. This procedure resultes in a final combination scope of 3600 different simulation runs (xRL × xPL) for each of the four reference grids.
4.1. Control Logic
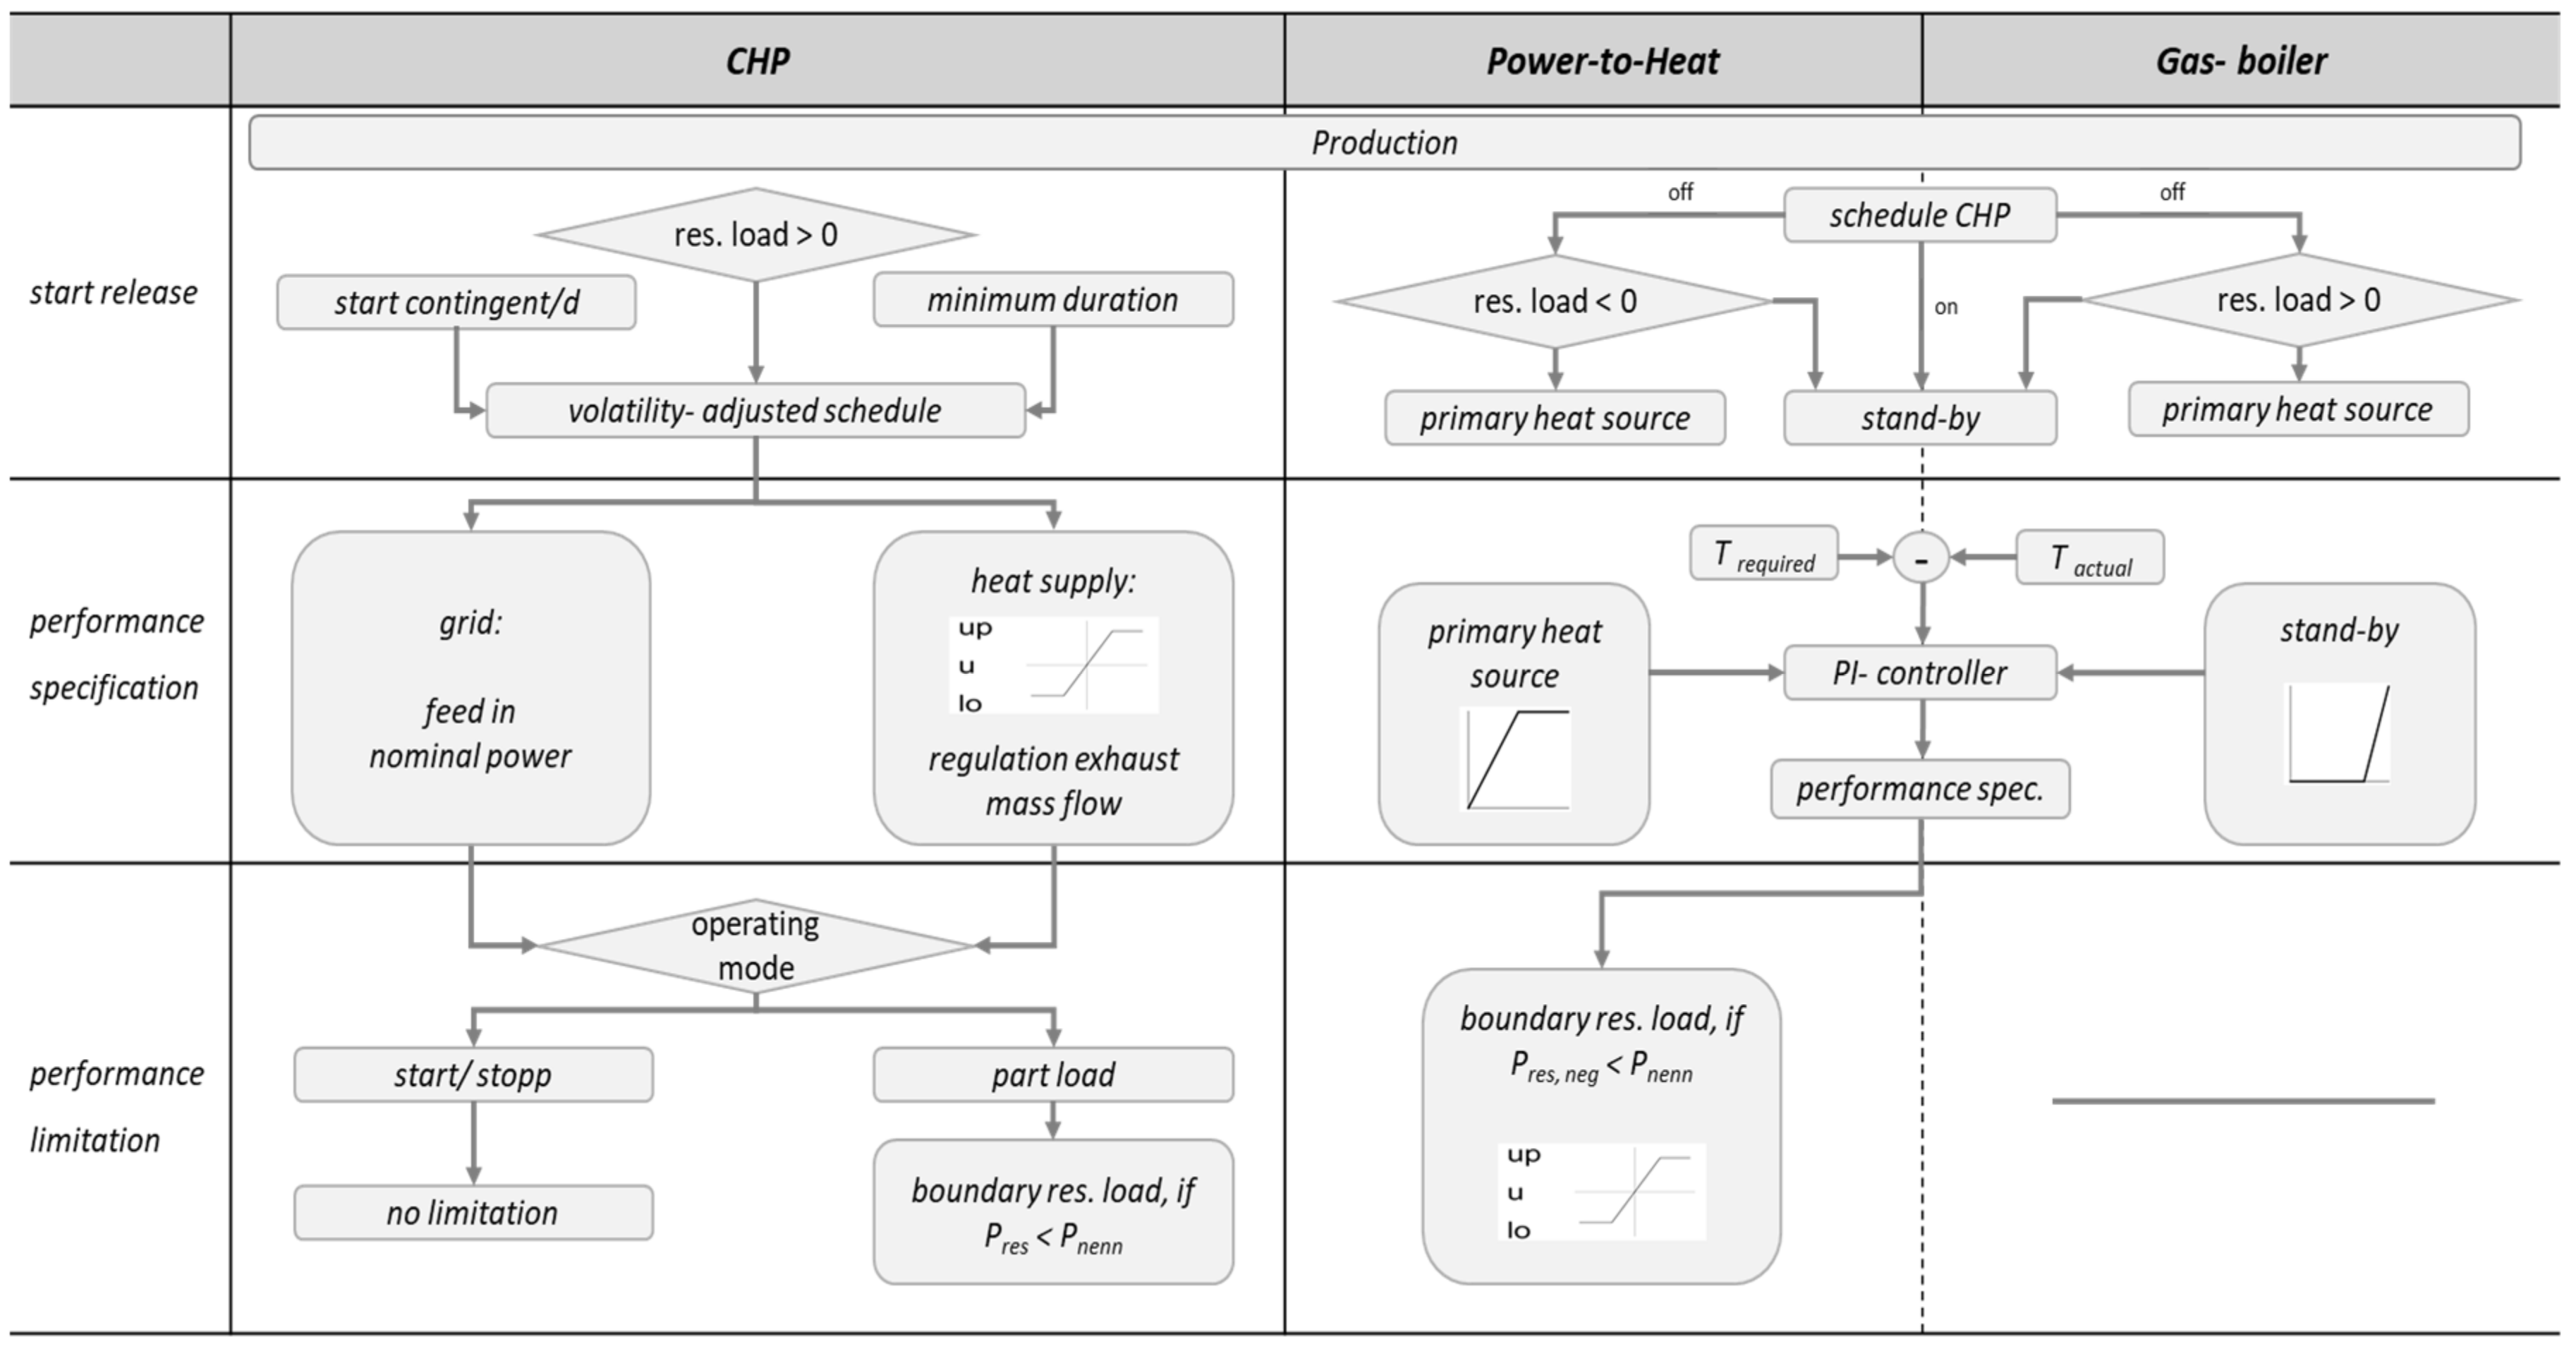
Considering the supply situation of the distribution grid, the number of decisive control variables increases. The local residual load of a distribution grid section serves as a pulse quantity for the flow-side controlled variables. The operating requirements of CHP units and PtH systems can be designed according to the feed-in fluctuations of renewable energies. The general responsiveness of the overall system to changes in the residual grid load is dependent on the technical restrictions of the plants themselves [36]. In the context of simulation, plant operation is oriented towards a control logic that is broken down into the levels of start release, power specification and power limitation (Figure 10).
The main difference between distribution grid-oriented system operation and heat-controlled operation is the definition of the grid induced start releases. The start release coordinates the coverage of the heat demand on the basis of the local residual grid load and takes up technical restrictions at the level of the individual plants. The operation of the CHP is initiated in the event of positive residual load intervals. In order to avoid frequent plant cycles, the CHP plant is given a fluctuation-adjusted schedule. This limites the residual load induced operation over a defined time interval to a fixed starting frequency (2 per day) and minimum running time (2 h). The CHP unit is operated at its rated electrical output. If the residual load applied fell below the maximum feed-in power of the CHP unit, the feed-in power can be limited to the value of the residual load. The CHP unit then ran in partial load operation (50–100% of Pmax).
Depending on the CHP schedule, optimum adaptation of operation is not possible for all grid situations. The operating call-off of the PtH system is generally intended for negative residual load. If, however, the schedule of the CHP plant provides a run through (tResidualload_neg < 2 h), then the PtH plant is switched off. In these cases, the PtH system only serves as a peak load supplier. The PtH system is not started until the heat extraction of the CHP unit during the period is insufficient for thermal supply. The output specification of the PtH system and gas boiler depends in each case on the heat load applied and is only restricted by the grid status on side of the PtH system. The gas boiler ensures the security of the peak load supply when the PtH system is used primarily. The gas boiler is also used as a flexible heat generator to compensate for large heat load fluctuations during operation of the CHP and positive residual load. A priority call-off of the gas boiler is indirectly set by schedule specifications of the CHP, which prevent a brief start-up of the plant in the event of positive residual load fluctuations. The gas boiler contributes in all applications, decoupled from the grid situation, to covering the heat demand.
4.2. Evaluation Methodology
In order to achieve grid-serving flexibility, it is essential to adjust the power balance at the lowest possible level. In this context, a cellular approach is often promoted, whereby supply and demand for electricity are fully balanced within a local restricted area. Accordingly, the assessment of the flexibility potential follows a cellular approach that maps regionalised energy flows within defined system boundaries. In the present case, a company in the plastics processing industry forms a self-sufficient cell (company cell) that can be subsumed under the cell of the respective distribution grid and connected with other consumers and generation plants. The electrical load profile, which at the same time exerts an adjusting effect on the power balance of the distribution grid cell, forms the flexibility parameter of the company cell. Temporary changes in the consumption load due to the operation of the PtH plant are to be regarded as potential via the company’s energy cell. The purely balance sheet allocation of the grid feed-in by the CHP separates the flexibility potential gained according to its starting point. The generation of the CHP plant is to be credited directly to the company’s load profile without feeding it into the grid. The feed-in of the CHP is an indirect load management potential. Grid feeds from the plant, on the other hand, could be seen as immediate impact on the power balance of the distribution grid cell. For this appraisal, the flexibility potential of the CHP is therefore conceptually separated from the load management potential of the company as power balancing potential.
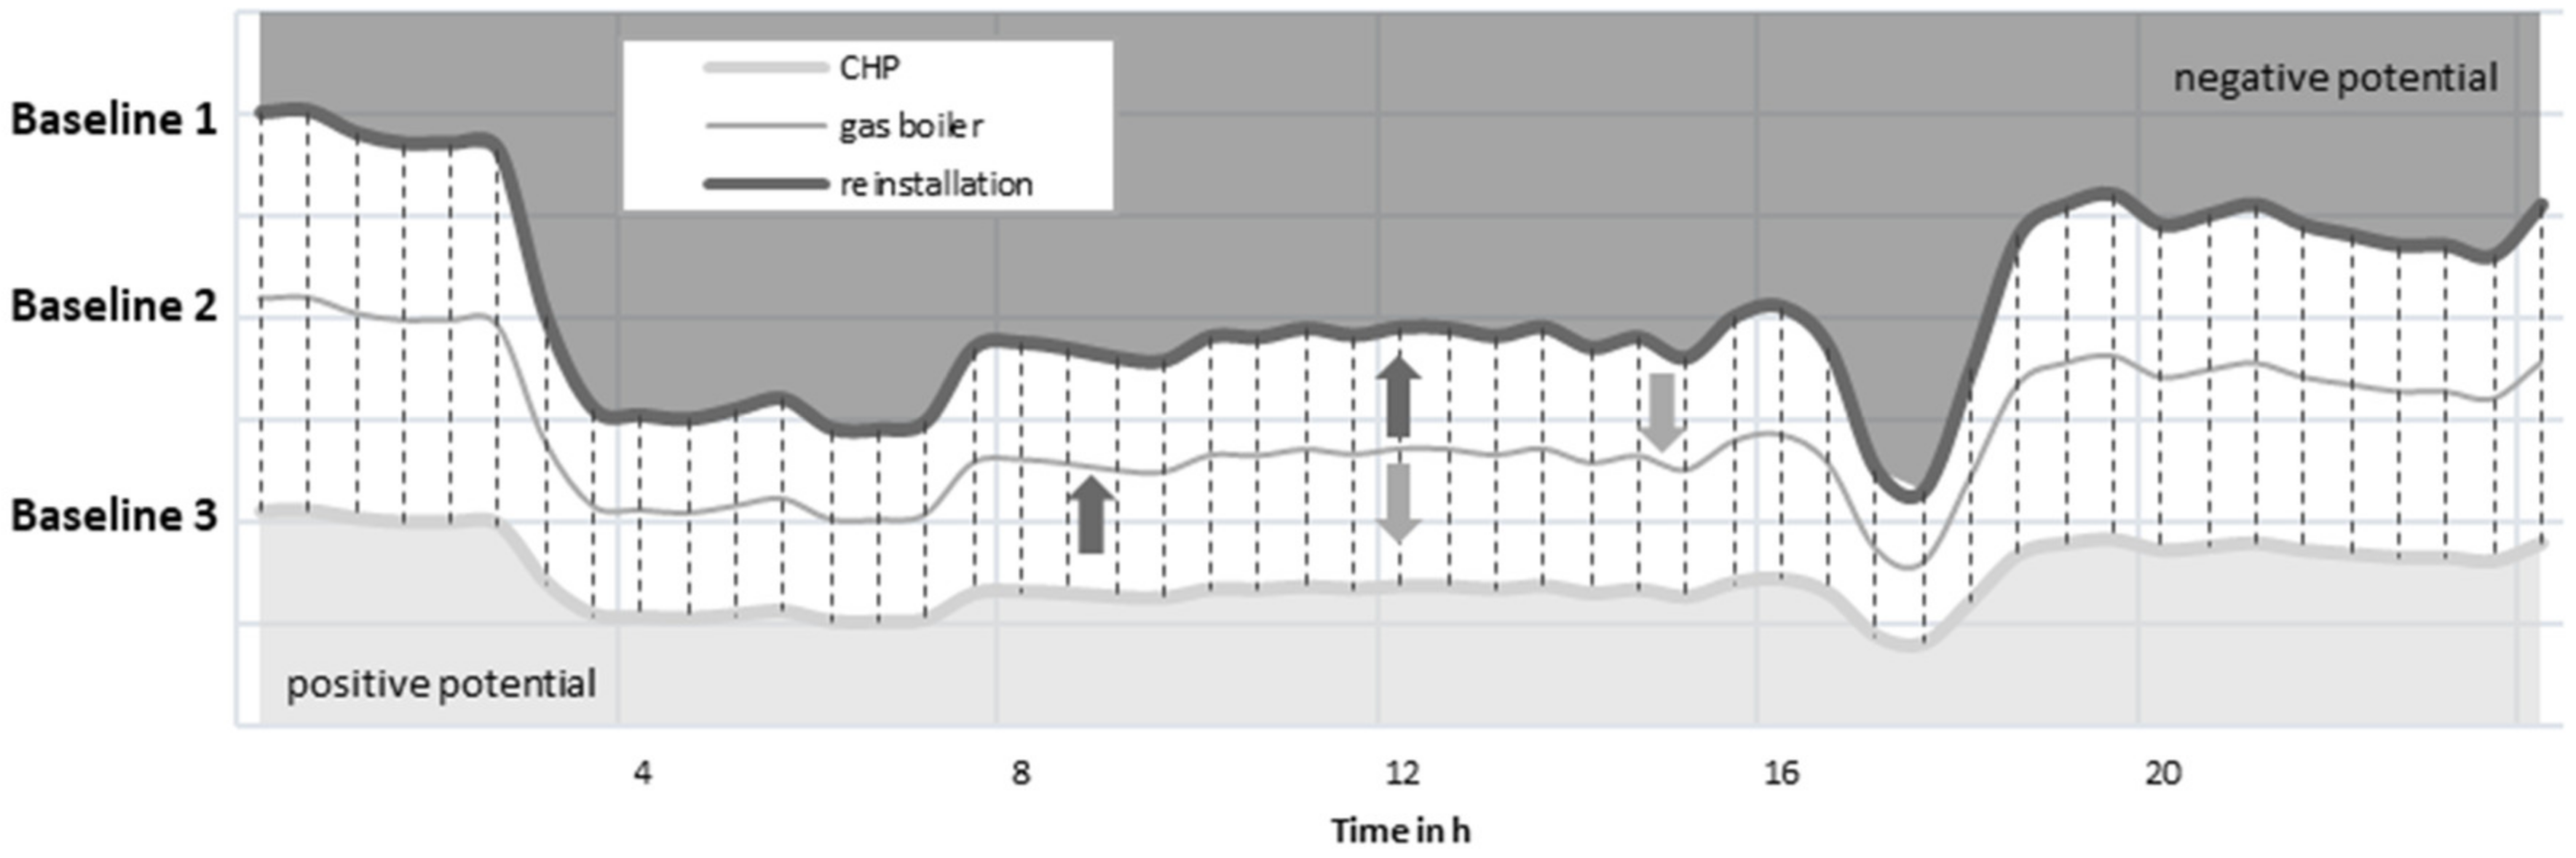
The assessment of flexibility potential is based on the planned schedule of the heating system. Changes in the electrical load profile in the company cell or adjustments to the power balance of the distribution grid cell are to be regarded as potential. The initial course of both variables forms a baseline that defines the boundary between a positive and negative flexibilisation potential. The chosen sign convention followed the adjustment direction of the grid feeds. Figure 11 shows the limits of the baseline using a typical load profile for the company cell.
The course of the baseline shifts depending on the assumed initial state of the heat supply.
- Status quo (baseline 1): the conventional electrical heating of the IM set the classic grid reference profile of the company as a baseline for any flexibilisation.
- Status thermal oil (baseline 2): if a thermal oil system is already installed, the baseline will be lower by the proportion of the electrical power consumption accounted for the heat supply of the IM. Centrally assumed heat suppliers of this initial state are gas boilers or CHP units in heat-led operation.
- CHP status (baseline 3): the use of a CHP unit leads to a third baseline in the case of complete own electricity utilisation. This reduces the load profile evenly in order to maintain the constant feed-in power of the CHP unit during the heat-led operation. The baseline of the distribution grid cell, represented by the power balance, shifts only under the assumption of heat-led reference operation of the CHP when fed into the grid, as compared to the initial state.
From a balance point of view, the newly introduced or substituted electrical power is equivalent in all assessment cases due to the distribution grid inducted operation. Only the allocation to the potential concepts is different according to the evaluation system and the set baseline. In the following, the flexibility potential is classified according to the baselines of the supply situation. The generation of the CHP is evaluated for own electricity use and grid feed-in.
5. Results and Critical Review
Individual input and parameter variations are considered in the evaluation and interpretation of the results. The relevant electrical parameters of the plant operation are tapped for an analysis. This includes the simulated electrical power of the individual generators as well as their work performed per simulation time.
5.1. Parameter Sensitivity
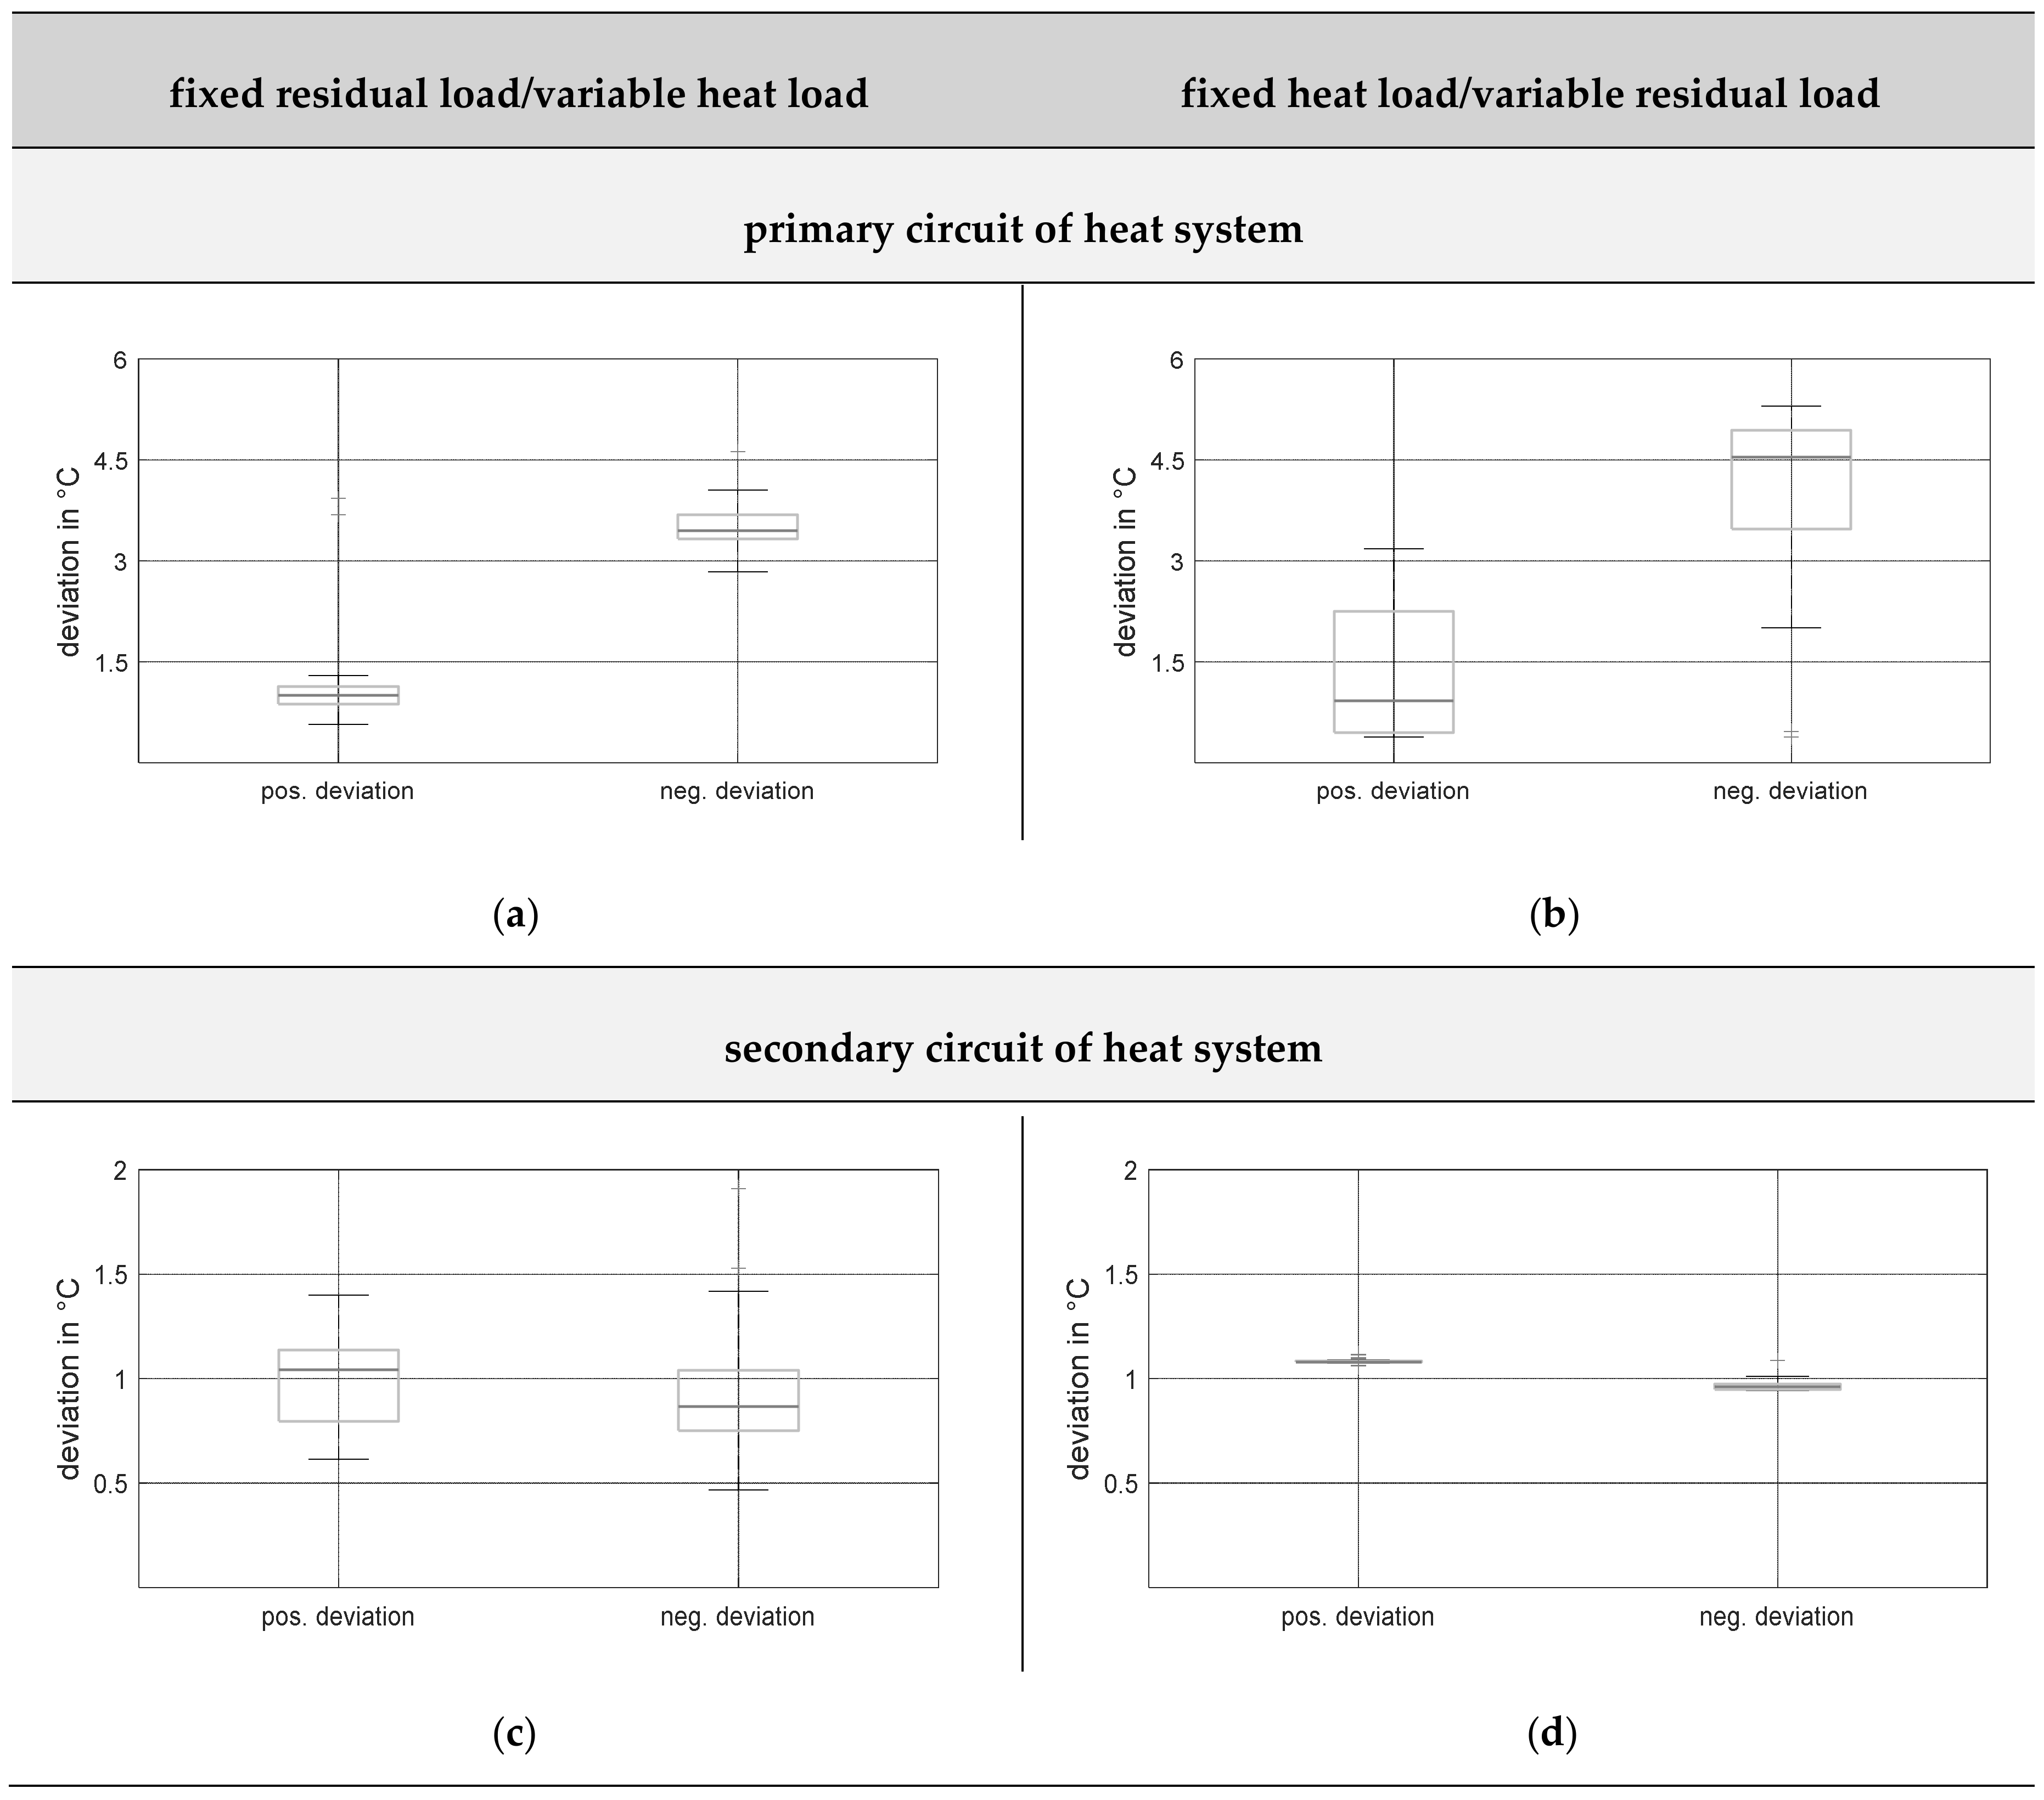
In perspective, the applicability of a grid-oriented operation of a heating system is linked to a reliable supply of the production and technical restrictions of heat generators. Combined with an overheating of the system, not only are the critical undershoots of the target temperature recorded, but also overtemperatures. These are listed separately in the evaluation on the basis of the sign of their deviation direction. Figure 12 shows the value distributions over the variation range of one factor, with a set △T of 40 °C between primary (300 °C) and secondary (260 °C) circuit temperature. For comparison purposes, the grid data used in the figure refers to reference Grid B2.
A striking feature of the distributions first of all is the scattering width of the box plots, which changes with the variation of the input factor. For the primary circuit, whose positive and negative temperature deviations are distributed in an uneven order of magnitude, this increases with the variation of the grid state. With a constant grid profile and modulation of the production profile, the extremes of the temperature deviations fluctuate over a noticeably smaller interval. The exact opposite developments result for the scatter range of the secondary circuit. Above all, the variation of the heat load profile has an influence on the position and fluctuation of the value distributions. Consequently, a different sensitivity of the input factors to the temperature development in the supply circuits can be observed in the reference condition (△T of 40 °C). The occurrence of local extremes in the simulated temperature profiles of the primary circuit can therefore be derived from the residual load-related operating point changes of the individual generators. Depending on the change sequence of the prioritised heat generator and its control characteristics, the intensity of possible temperature fluctuations diverges. In conjunction with the modification of the system parameters, an adaptation of the set temperatures in particular has an effect on the applicability of the grid-oriented operation. The decisive feature is not only the absolute level of the set target temperatures, but rather the change in the temperature difference between the primary- and secondary circuit. Accordingly, the reduction of the temperature difference to 10 or 20 °C within the scope of parameter modification results in a changed sensitivity of the input factors to the temperature profiles. A scattering range of the extreme value distribution that diverges with the variation of individual input factors is only recognisable in a shift of the median for this application case. Rather, control deviations of the secondary circuit are increasingly also subject to the grid-induced fluctuations of the primary circuit.
5.2. New Installation of Heating System (a)
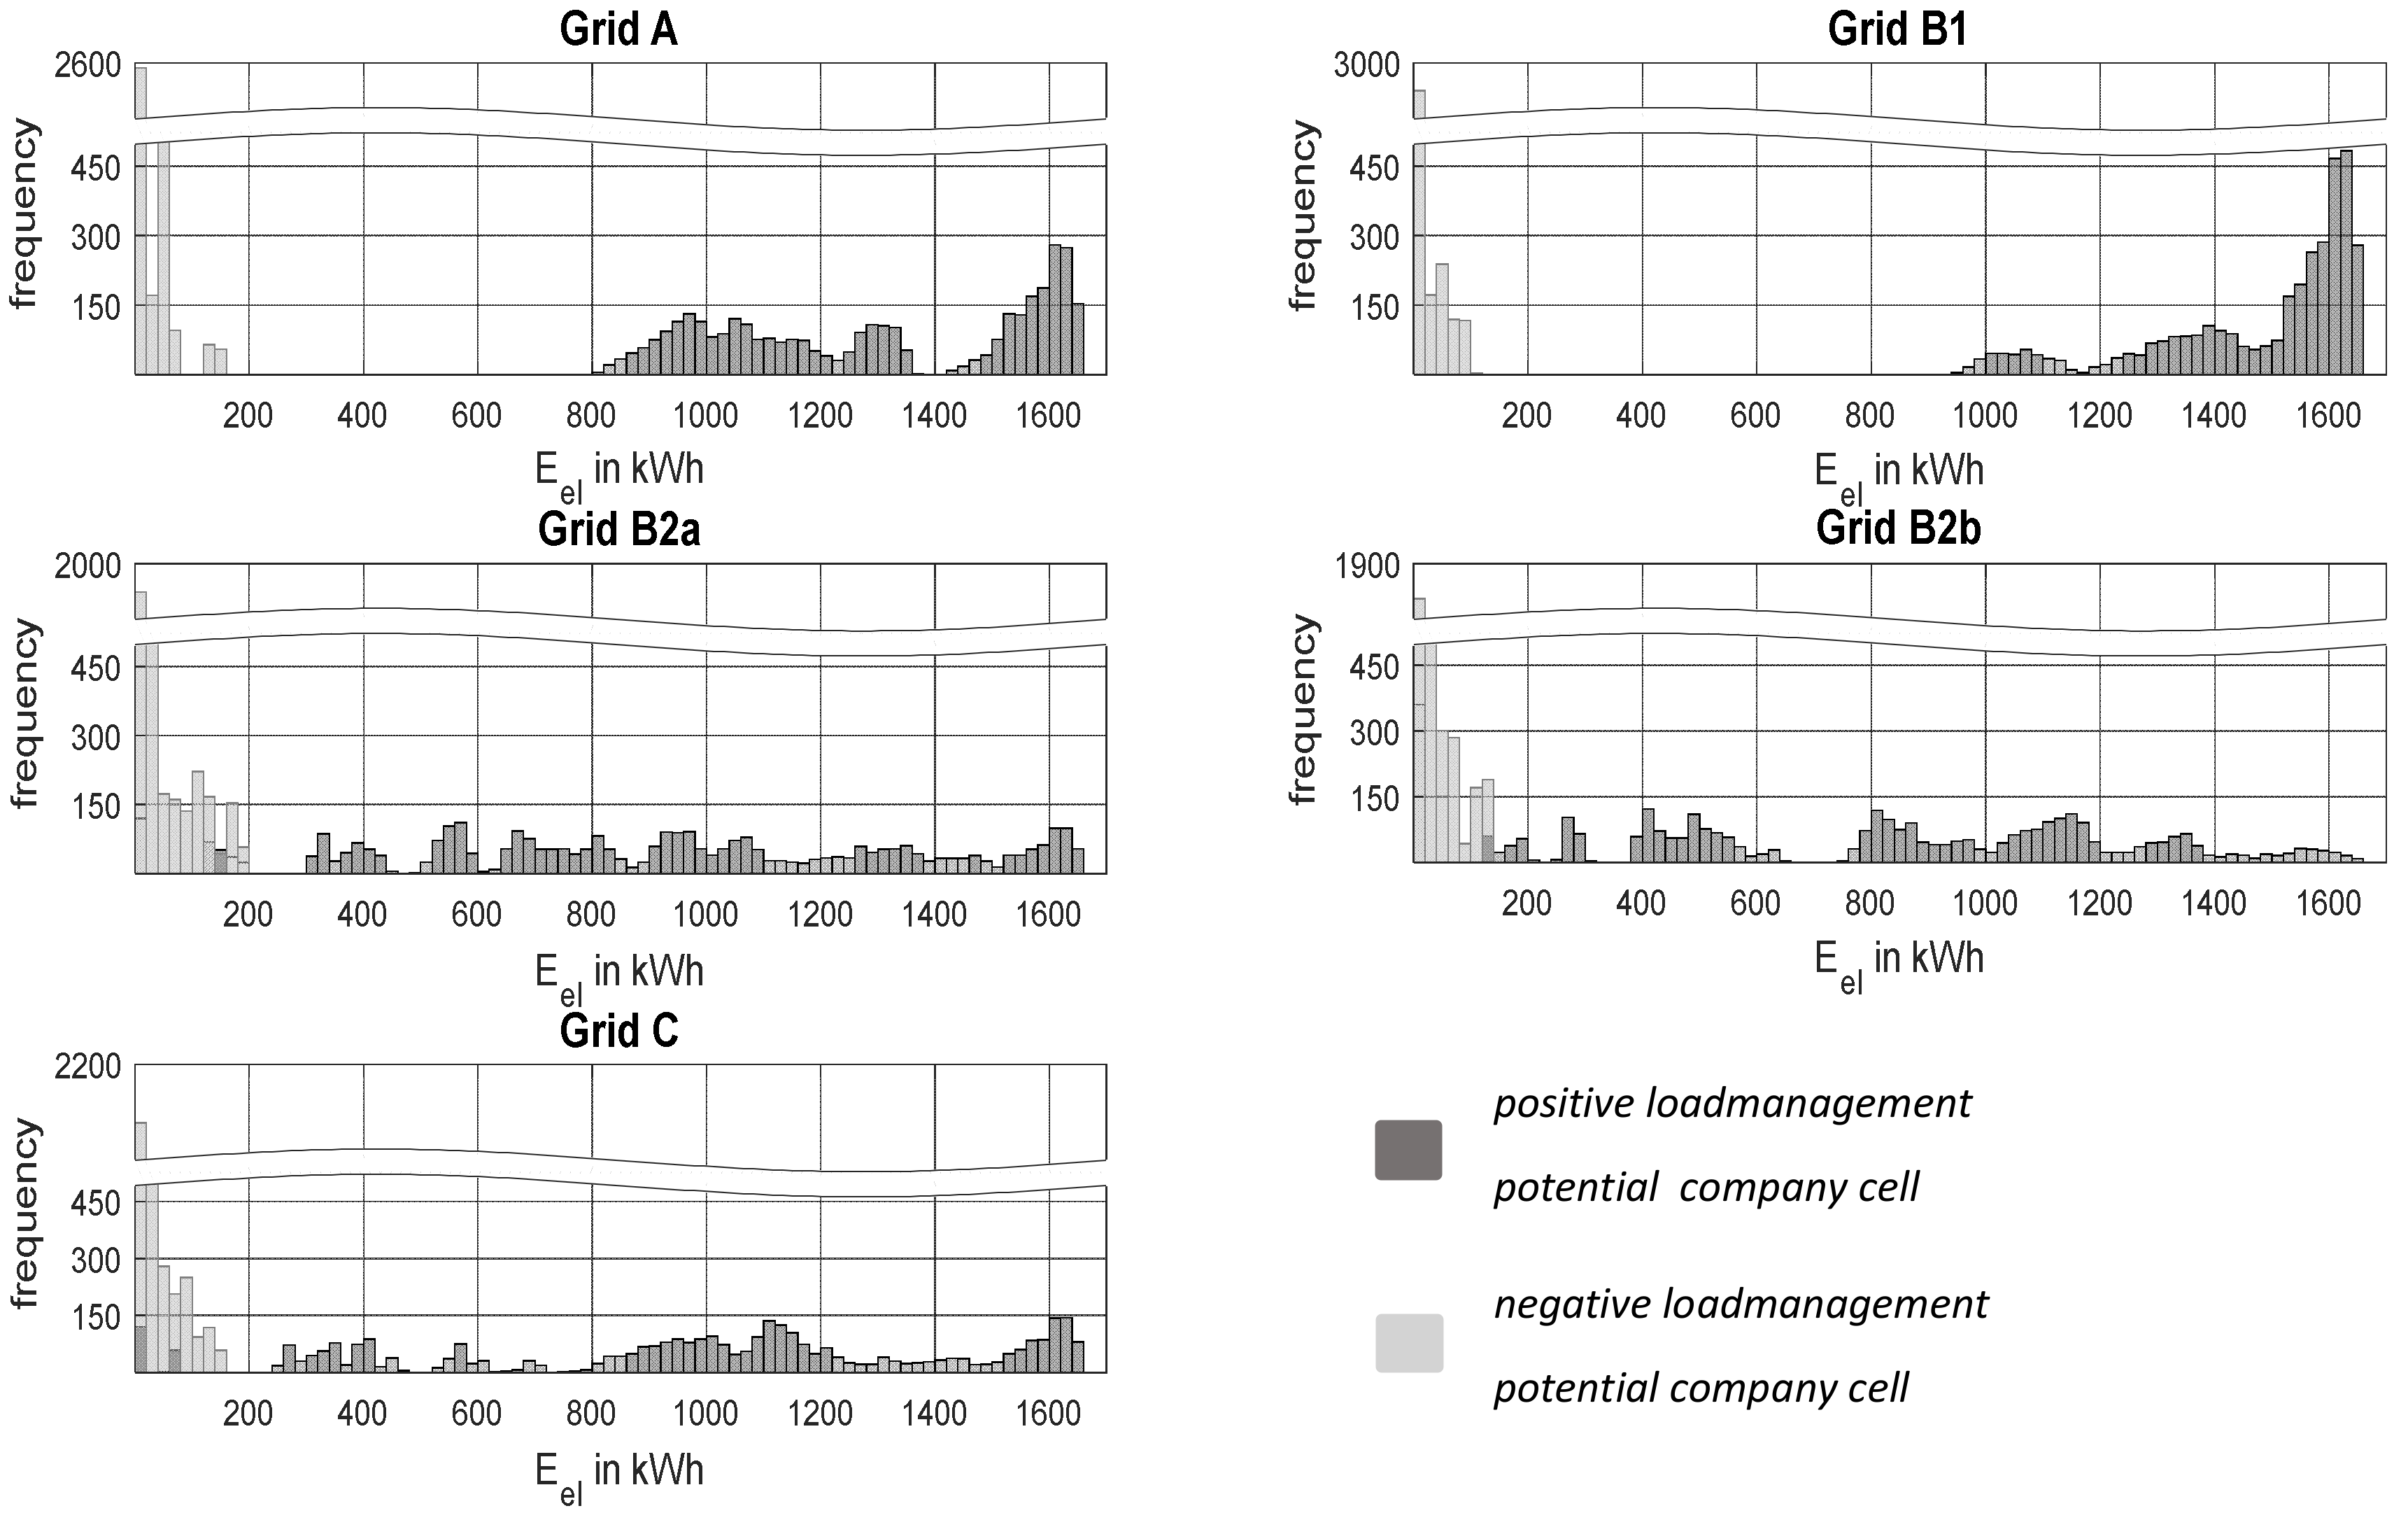
Baseline 1 serves as an assessment standard for a restructuring of the heat supply through the installation of the heating system. Flexibilisation potentials of the company cell are thus given primarily by a reduction of the grid reference profile. The operation of the PtH plant shifts the profile almost into the baseline’s starting position, due to a power consumption similar to the substituted share of the electrical heat supply. The distribution grid potential thus lies in the operation of the CHP unit. In total, the positively displaceable power fluctuates between 60 and 70 kW across the simulation runs. The use of the positive flexibility potential for the company cell is shown in Figure 13 over the variation range of the input data sets. A side effect of the new installation of the heat compound system with the flexibilisation of the CHP is an additional “must run” of the feed-in power. Passing through negative residual load intervals in partial load ensures a lower consumption load than in the original state when further use is made of the heat extraction and feed-in of the CHP unit. Differences arising between the baseline and the reduced consumption load, which can not be shifted to the initial state by the PtH system, characterise the unfavourable operating effect during grid oversupply.
The frequency of occurrence and the share of the “must run” in the potential survey for Grids A and B1 are lowest. A positive load management potential can be determined on each of the observation days. Cyclical patterns of residual load cause a load management potential that rises from 800 kWh/d and is induced by the CHP unit. Since grid days with an exclusively positive residual load curve in Grid A and B1 make up the majority of the supply situation, both frequency distributions reach a distribution peak at a potential of 1600 kWh/d. Recurring structures in the derivable positive load management potential of Grids B2 and C are not discernible. Instead, the volatility of the residual load ensures a very heterogeneous distribution of the potential in a range of approximately 200–1700 kWh/d. Broader distributions of the running time of the CHP, bases on lower consumption loads and the unstructured feed-in process of wind power plants, considerably individualise potential exploitations per grid day. Equally important is the fact that exploiting the positive potential in these grids increasingly requires the partial load operation of the CHP unit. The “must run” therefore increases in frequency of occurrence and in its volume to almost 200 kWh/d at maximum.
Assuming that the CHP generation is fed into the grid, the positive flexibility potential of the company cell is split into a further share of the distribution grid cell. Contrary to the baseline, only the substituted share of the electrical heat supply can now be counted as a positive load management potential. For outputs of 6 to 16 kW, the achievable potential of the company cell is limited to 425 kWh/d across the simulation runs. At 54 kW, the feed-in capacity of the CHP formes the shiftable capacity of the distribution grid cell. Contrary to the baseline of the grid cell, plant operation under negative residual load also requires the “must run” shown.
5.3. Supply via Gas Boiler (b)
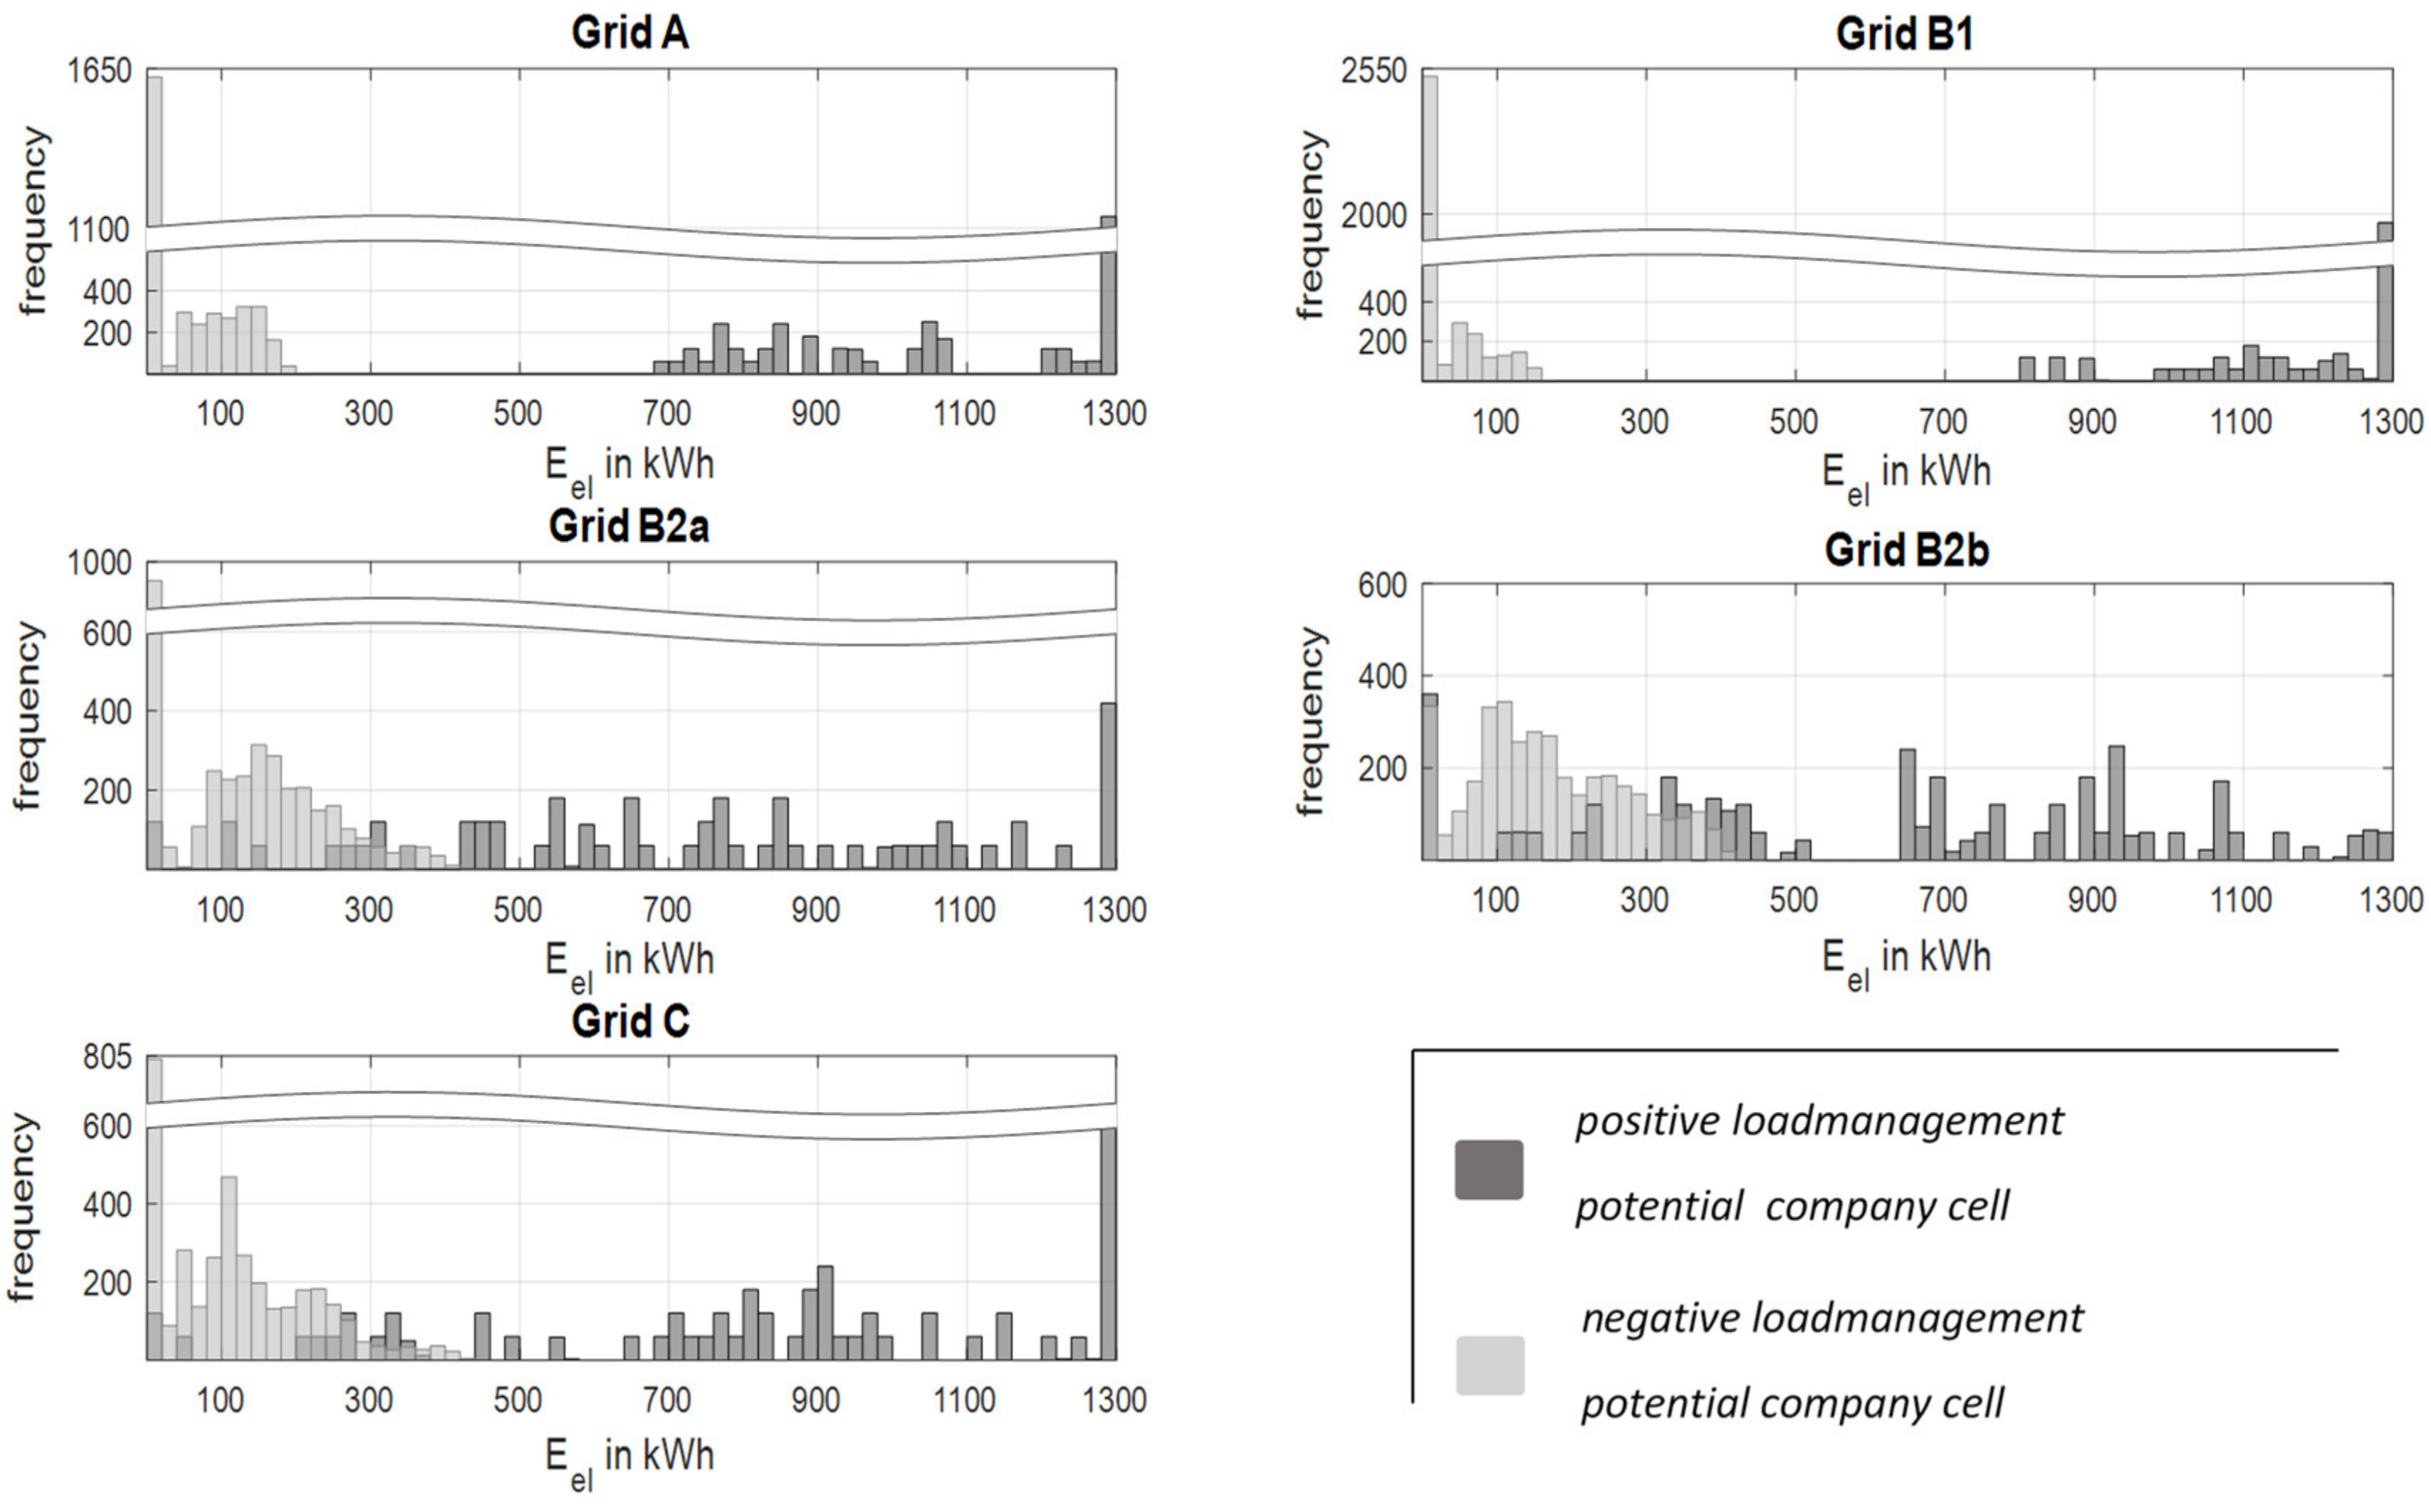
Assuming a gas boiler fired thermal oil system as the initial supply situation, the evaluation of the flexibility potential is based on baseline 2. Therefore, substitutions of the electrical grid supply for heating are not included in the assessment. Not only the operation of the CHP plant but also a call for the PtH plant results in a relocation of the assumed baseline. The use of the CHP generated electricity reduces the load profile of the company cell by 54 kW in nominal power operation and generates a positive load management potential. The use of renewable surplus electricity from the grid, made possible by the operating windows of the PtH plant, initiates a negative potential. The negative shiftable output runs between 10 and 19 kW when the system is called up primarily. Load management potentials due to the grid-interactive operation of the heat generators are compared with each other in Figure 14. The negative load management potential is consistently in a low range as a result of the lower output during operation of the PtH system. The gradations to a positive potential are clearest for grid A and B1. The positive characteristics of the residual load provides an extreme distribution of the potentials, which leads to positive load management potentials of almost 1300 kWh/d in frequent continuous operation of the CHP. Rarer operating windows of the PtH plant can be used with a negative potential of up to 200 kWh/d.
A strong division of the potential according to the control direction is not available to the same extent for Grid B2 and C. At peak times, the negative potential doubles to 400 kWh/d, also depending on high heat loads. For Grid B2a and C, the positive potential continues to have the distribution peak discussed for continuous operation of the CHP but achieves less frequency of occurrence. Special features in the supply situation of grid B2b emerge in a broad distribution of the negative potential. Contrary to the potential survey of the following year (B2a), the positive load management potentials are located with increasing frequency in a range of 700 to 900 kWh/d. Also, in the case of baseline 2, partial load operation with a negative residual load necessary for a short-term flexibilisation of the CHP operation is associated with an additional “must run” feed-in power. Any effects on grid operation are equivalent to the frequency distributions of the “must run” described in section (a).The resulting “must run” is corrected by a peak load call-off of the PtH plant, which raises the load profile further in the direction of the baseline but can not offset the minimum feed-in due to a lower plant capacity.
The changeover from the use of the CHP plant’s own electricity to a complete grid feed-in results in a restructuring of the load management potential of the company cell. Positive potentials referred to CHP operation can now be seen equivalently as the power balancing potential of the distribution grid cell. From this perspective, the negative load management potential of the PtH plant remains for the company cell. However, the changed classification of the “must run” generation of the CHP in the distribution grid cell allows an additional crediting of the peak load call-off of the PtH plant as negative potential. In the balance sheet, load increases of the operating input are no longer superimposed by the minimum feed-in of the CHP plant. However, the continuing heat extraction of the CHP unit only permits outputs of 6 to 12 kW over short peak load call-off windows and only slightly expands the negative load management potential overall.
5.4. Supply via Heat-controlled CHP Operation (c)
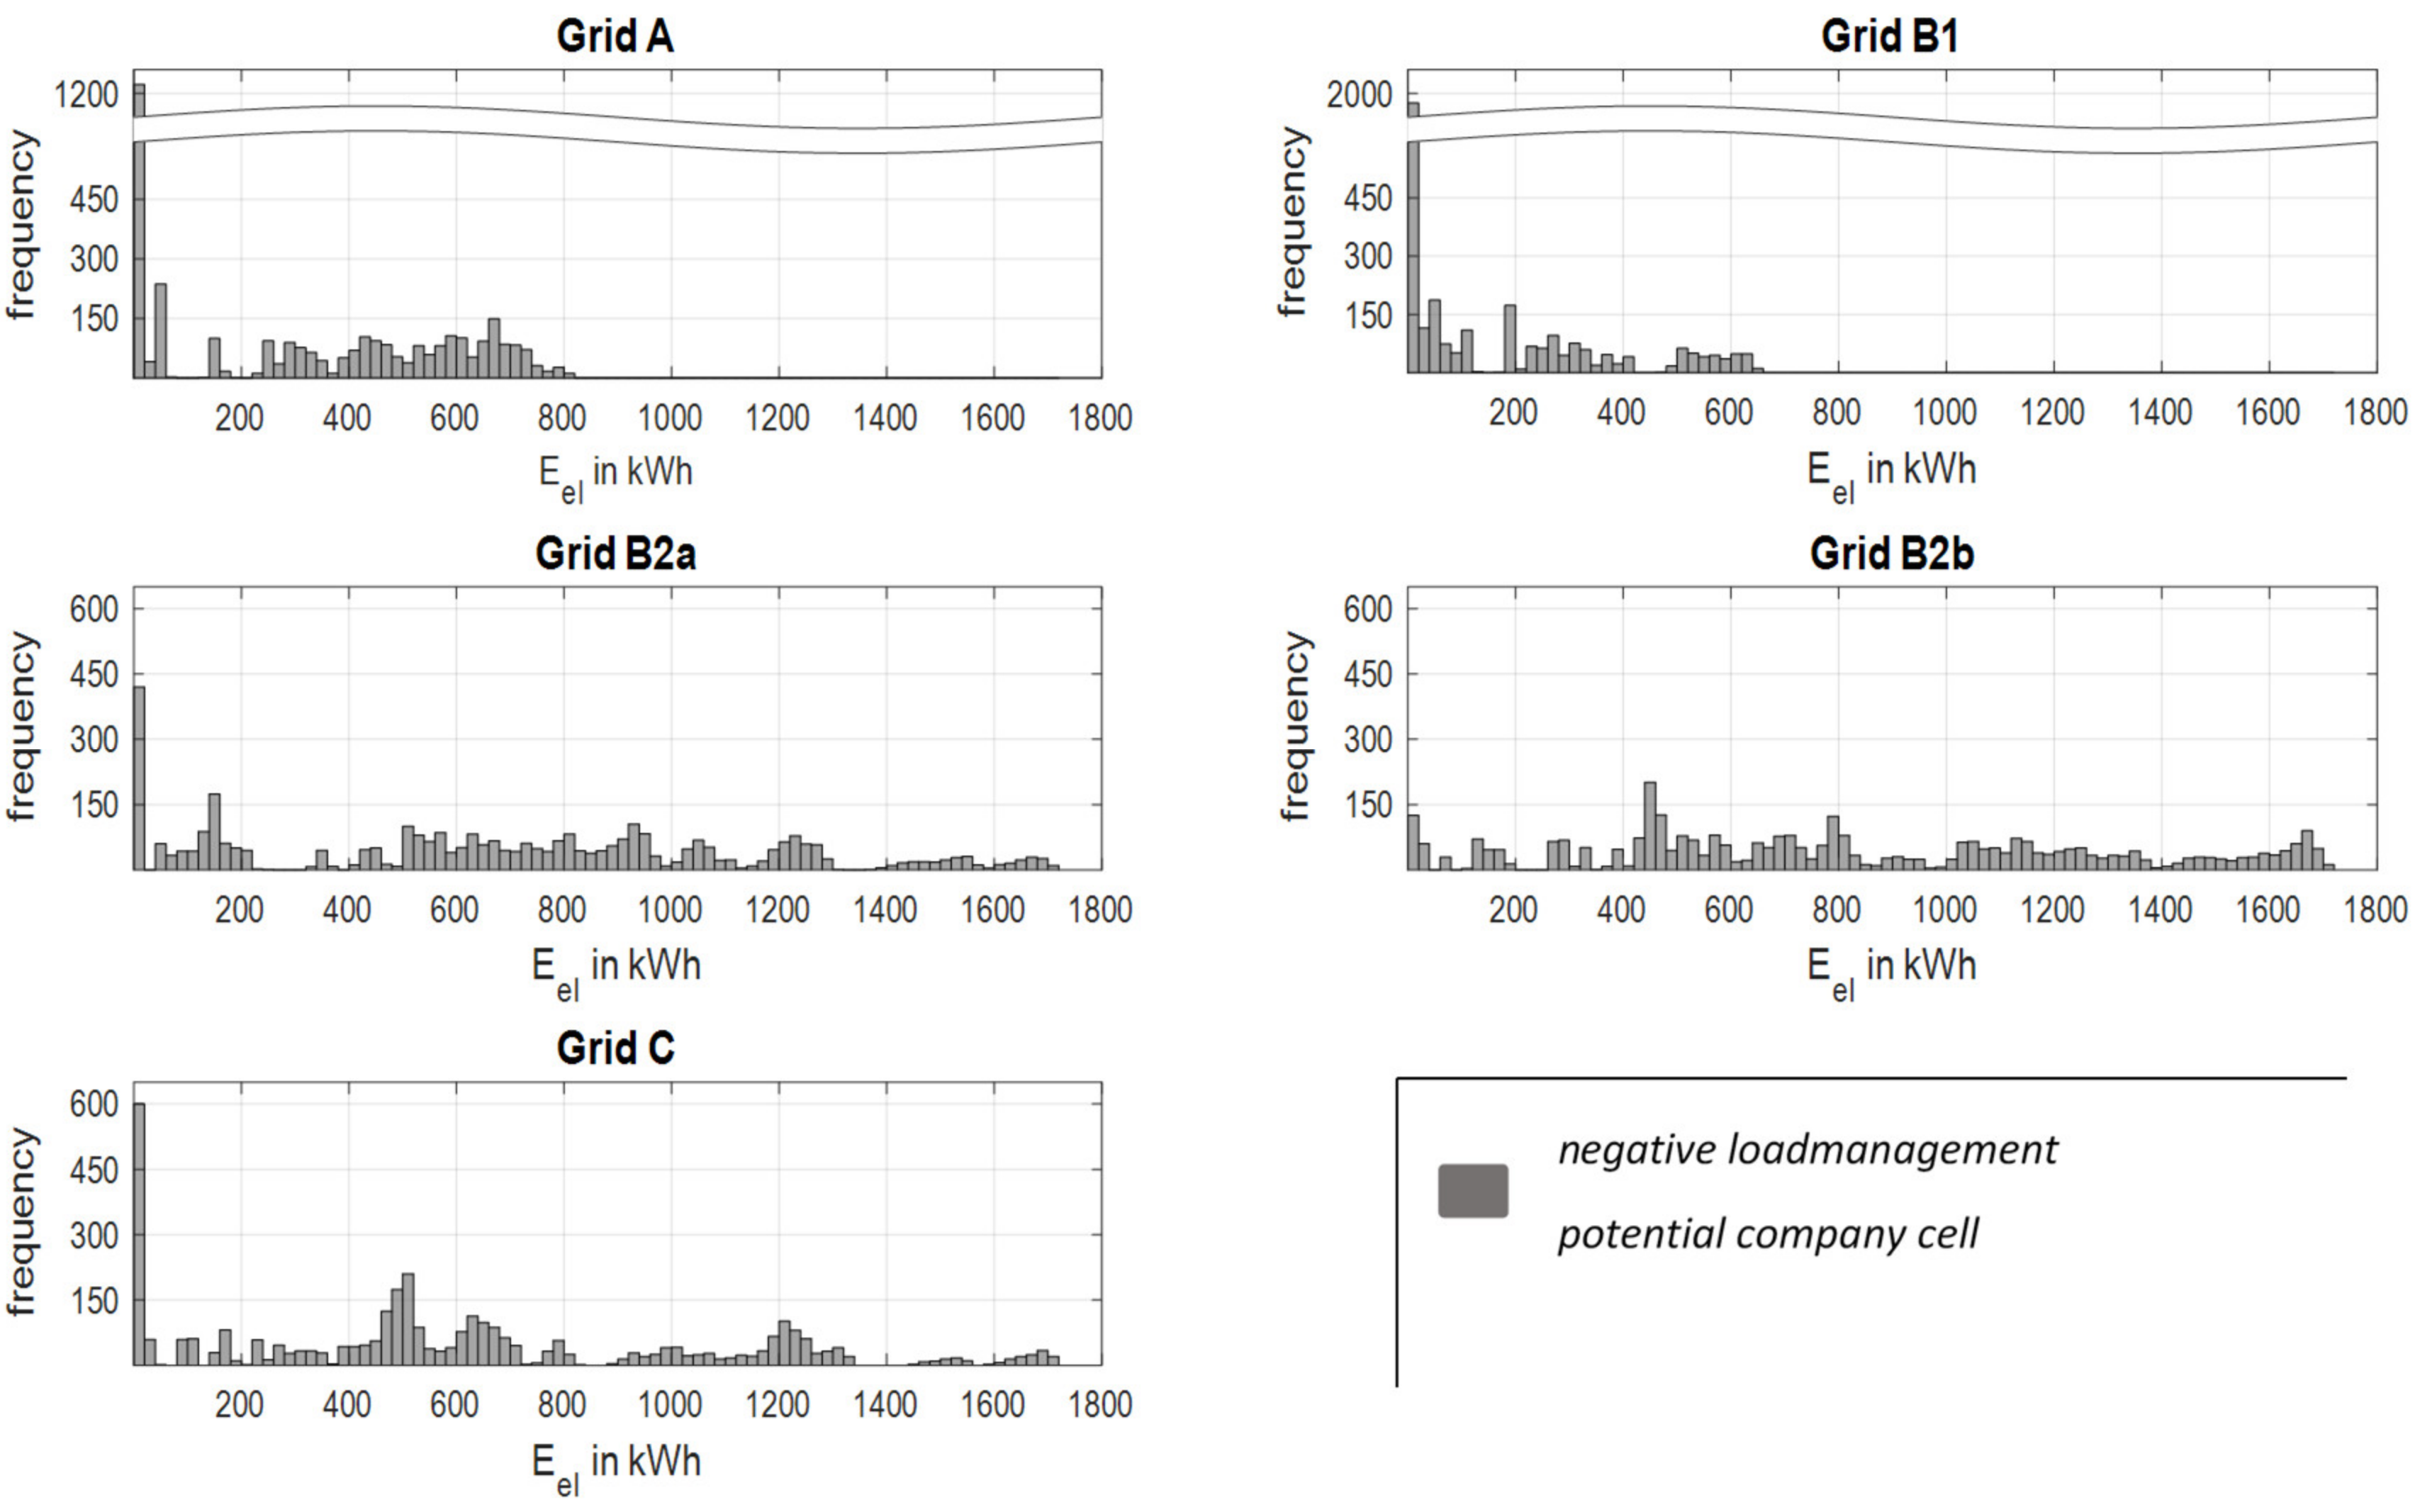
The classic heat-controlled and runtime-optimised use of the CHP completes the assessment perspective. Assuming a continuous use of 54 kW provided in the nominal power operation of the CHP, baseline 3 is the relevant reference of the company cell. Strategic measures of load reduction, through targeted operation of the CHP, do not open up any positive potential, depending on the continuous call of the plant for heat management. The load management assessment, on the other hand, focuses on the negative potential created by the planned power reductions of the CHP unit and commissioning of the PtH plant. Taken together, these targeted increases in the consumption load represent the flexibility potential visualised in Figure 15.
In contrast to the previous assessment, driving through negative residual load intervals in partial load shifts the baseline over the neutral position. Correspondingly, specifications of the power limitation of the CHP are not due to an undesired “must run” of the feed-in power but are additional potential of the company cell. The achievable shiftable negative output of approximately 55 to 73 kW is based on complete power cuts in the CHP unit and primary operation of the PtH plant. Call combinations from the partial load operation of the CHP and peak load call of the PtH system lead to a shiftable output of 30 to 38 kW.
Contrary to the potential shown in the case “New installation of Heating System”, the long operating times of the CHP in grid A and B1 result in a low potential. Shorter time windows for the system shutdown of the CHP units reach up to a threshold value of 800 kWh/d, which is slightly exceeded in grid A. For the remaining grids, the potential range is broadly diversified up to days on which the negative load management potential increased to a maximum possible utilisation of 1700 kWh/d. Such a high potential is justified by days on which the CHP operation is paused due to continuous renewable overfeeding of the grid areas.
A reorganisation of the feed-in balance of the CHP also leads here to a division of the derived negative load management potential of the company cell. From then on, the negative load management potential is limited to the operation of the PtH plant. In addition to partial load operation, the remaining CHP unit potential is almost congruent with the negative load management potential of the company cell illustrated in Figure 13. The negative power balancing potential of the distribution grid cell corresponds to the time windows of a CHP operation with reduced output.
5.5. Comparison of Potentials
In summary, the flexibility potential is compared in Table 2 by distribution grid groups according to the evaluation methodology presented. The data referred in each case to the mean values of the flexibilisation potential weighted on the basis of their frequency of occurrence. With regard to the baseline of supply and the direction of control, the potential of the energy suppliers is changing. The potentials of the distribution grid cell (dist.-grid cell) exclusively balance the grid-compatible operating behaviour of the CHP and at the same time indicate its share in the load management potential of the company cell.
The residual load curves of the underlying reference grids are favoured differently according to the control direction of the potential characteristics to be applied. Accordingly, the potential evaluations following baseline 1 and 3 form a strong contrast. As shown in Table 2, there are striking differences in the potential utilisation of grid A and B1 in contrast to the volatile residual load curves of grid B2 and C.
Due to the low performance of the system, the absolute flexibilisation potential is low regardless of the scenario. Nevertheless, in relation to the mean load of the production load profile, it can be classified as very large.
6. Conclusions and Outlook
The results of the study show that flexibilisation of the heat demand of manufacturing companies (using the example of plastics processing) provide a contribution to relieving the electrical grid load in regional distribution grids. For this purpose, a conversion of the electrical heat supply to hybrid heat supply is carried out and described in detail. This means that the company’s electricity consumption could be changed depending on the grid situation. Flexibilisation is a technical potential that evaluates changes in the company’s original supply situation. At the same time, it can be used for relieving the distribution grid.
The concept of potential is subdivided for evaluation purposes. It is valuated from the point of view of the company and the distribution grid.
The investigations are carried out according to the Monte Carlo methodology. This involves the generation and analysis of 14,400 different combinations of daily residual load profiles and production load profiles. This is the advantage of the Monte Carlo method. In contrast to the classical potential determination, this method shows a number of possible results. All of these results can occur with different probability.
The plant schedules and the control of the plant components (CHP, gas, and electrical boiler) are examined by means of a sensitivity analysis. The results show that the concept works. All target functions (temperatures, thermal performance, etc.,) can be met at any time.
A simulation study is used to determine the results of the flexibilisation potentials for a scaled heating system. The results show that a new installation of the system in a company had great positive potential (up to 1486 kWh/d in mean). This results from the operation of the CHP plant. In reference to a supply situation with a gas boiler, high positive potentials (up to 1199 kWh/d in mean) and low negative potentials through the PtH plant (up to 180 kWh/d in mean) are determined. In the case that the company has an existing CHP, in a heat-led operation only negative potentials can be found. These potentials are higher than in the investigations before (up to 829 kWh/d in mean).
The distribution of the grid-specific felxibilisation potentials show a strong individuality, without recurring structures. Generalized statements about the achievable flexibilisation potential are only possible to a limited extent, even if the system structure of the distribution grid remains unchanged.
In general, the differences of the potentials between the selected grid types are large. The highest potentials exist in PV-dominated grids. The lowest potentials are in wind-dominated grids.
In comparison to the selected configuration, a scaling of the selected plant performance of the integrated heating system to supply a larger number of machines is to be expected in operational practice. With regard to the dimensioning of the system performance and the influence of the system operation on the local residual load, increased interventions in the operating mode of the heating system are necessary due to the power limitation on the grid side. In this context, the influence of longer partial load operating times on the CHP plant is becoming more and more important.
The results and findings obtained are currently being transferred to real injection moulding companies. A study examining the flexibilisation potential of all injection moulding companies in Germany is currently being prepared. In addition, the flexibilisation potential through the use of low-temperature heat from CHP is also being investigated. The influence of strongly wind-dominated distribution grids will and must also be investigated.
Author Contributions
Conceptualization: H.D.; Investigation: M.S. and H.D., Methodology: H.D. and H.M., Writing: H.D. and M.S., Project administration: J.H. Review & editing: H.D., M.S. and H.M.
Funding
This research was funded by the German Federal Ministry for Economic Affairs and Energy (FKZ: 03ET1180).
Acknowledgments
The contents of this paper have been acquired within the cooperation project “Smart Consumer—Energy efficiency through systemic coupling of energy flows by means of intelligent measurement and control technology”.
Conflicts of Interest
The authors declare no conflict of interest.
Nomenclature
| Abbreviations | |
| CHP | combined heat and power plant |
| EEX | energy exchange |
| IM | injection moulding |
| M | number of machines |
| MCM | Monte Carlo method |
| probability density functions | |
| PtH | power-to-heat |
| PV | photovoltaic |
| VPP | virtual power plant |
| Symbols | |
| 𝜂 | efficiency [-] |
| 𝜌 | density [kg/m³] |
| T | temperature [°C, °F] |
| cp | specific heat capacity [kJ/(kg·K)] |
| mass flow [kg/h] | |
| m | mass [kg] |
| Ptherm | thermic power [W] |
| Pel | electrical power [W] |
| heat flow [W] | |
| flow [m³/h] | |
| Subscripts | |
| auto | automatic mode |
| alarm | alarm mode |
| EH | electrical heater |
| hand | hand mode |
| i | indices |
| max | max value |
| neg | negative |
| off | offline mode |
| oil | thermooil |
| PL | production load |
| RL | residual load |
| t | time |
References
- United Nations Framework Convention on Climate Change. Adoption of the Paris Agreement. In Proceedings of the 21st Conference of the Parties (UNFCCC), Paris, France, 30 November–11 December 2015.
- Fraunhofer Institut für Solare Energieversorgungssysteme (ISE). Power Generation in Germany—Assessment of 2017. 2018. Available online: https://www.ise.fraunhofer.de/content/dam/ise/en/documents/publications/studies/Stromerzeugung_2017_e.pdf (accessed on 26 February 2018).
- REN21. Renewables 2017. Global Status Report. Montreal. 2017. Available online: http://www.ren21.net/wp-content/uploads/2017/06/17-8399_GSR_2017_Full_Report_0621_ Opt.pdf (accessed on 3 October 2018).
- Federal Ministry for Economic Affairs and Energy (BMWi); Centre for Solar Energy and Hydrogen Research Baden- Württemberg (ZSW). Renewable Energy Sources in Figures. National and International Development. 2017. Available online: https://www.bmwi.de/Redaktion/EN/Publikationen/renewable-energy-sources-in-figures-2016.pdf?__blob=publicationFile&v=5 (accessed on 3 October 2018).
- Kouzelis, K.; Bak-Jensen, B.; Pillai, J.R. The geographical aspect of flexibility in distribution grids. In Proceedings of the IEE Power & Energy Society Innovative Smart Grid Technologies (ISGT), Washington DC, USA, 18–20 February 2015. [Google Scholar]
- Fraunhofer Institut für Windenergie und Energiesystemtechnik (IWES). 17. Kasseler Symposium Energie-Systemtechnik. Tagungsband. Kassel, Germany; Fraunhofer Institut für Windenergie und Energiesystemtechnik: Bremerhaven, Germany, 2012. [Google Scholar]
- Breker, S.; Spengler, N.; Stübner, N.; Heilmann, E.; Wetzel, H. Konkrete Gestaltungsaufgaben eines regionalen Flexibilitätsmarktes auf Verteilnetzebene—Der “RegioFlex Nord- und Mittelhessen”. Vorgehen bei der modellhaften Entwicklung eines netzdienlichen regionalen Marktplatzes zur Erprobung in einem Feldtest im Netzgebiet der EnergieNetz Mitte GmbH. In Proceedings of the Tagung zukünftige Stromnetze für erneuerbare Energien, Berlin, Germany, 30–31 January 2018; pp. 46–61. [Google Scholar]
- U.S. Energy Information Administration. International Energy Outlook 2016; U.S. Energy Information Administration: Washington, DC, USA, 2016; Available online: https://www.eia.gov/outlooks/ieo/pdf/0484(2016).pdf (accessed on 3 October 2018).
- Von Scheven, A.; Prelle, M. Lastmanagementpotenziale in der stromintensiven Industrie zur Maximierung des Anteils regenerativer Energien im bezogenen Strommix. In Proceedings of the VDE Kongress 2012 Stuttgart. Smart Grid, Intelligente Energieversorgung der Zukunft, Stuttgart, Germany, 5–6 November 2012. [Google Scholar]
- Dunkelberg, H.; Meschede, H.; Stöhr, F.; Hesselbach, J. Assessment of Influencing Factors in Decentralized Energy Supply of Manufacturing Industries Using Probabilistic Methods. SNE Special Issue. Simul. Prod. Logist. Impacts Energ. Fact. 2017, 27, 67–77. [Google Scholar]
- Gerhardt, N.; Sandau, F.; Kessler, A.; Kleimaier, M. Wärmeversorgung in flexiblen Energieversorgungssystemen mit hohen Anteilen an erneuerbaren Energien. In Proceedings of the Von Smart Grids zu Smart Markets, ETG- Fachtagung, Kassel, Germany, 25–26 March 2015. [Google Scholar]
- Deutsche Energie-Agentur GmbH (dena). dena-Netzstudie II. Integration erneuerbarer Energien in die deutsche Stromversorgung im Zeitraum 2015–2020 mit Ausblick 2025. Endbericht. Berlin, 2010. Available online: https://www.dena.de/fileadmin/user_upload/Download/Dokumente/Studien___Umfragen/Endbericht_dena-Netzstudie_II.PDF (accessed on 19 January 2019).
- Klobasa, M.; Angerer, A.; Schleich, J.; Buber, T.; Gruber, A.; Hunecke, M.; Roon, V.S. Lastmanagement als Beitrag zur Deckung des Spitzenlastbedarfs in Süddeutschland. Endbericht einer Studie von Fraunhofer ISI und der Forschungsgesellschaft für Energiewirtschaft. Berlin, Germany, 2013. Available online: https://www.agora-energiewende.de/fileadmin2/Projekte/2012/Lastmanagement-als-Beitrag-zur-Versorgungssicherheit/Agora_Studie_Lastmanagement_Sueddeutschland_Endbericht_web.pdf (accessed on 19 January 2019).
- Spieker, S.; Tsatsaronis, G. Dimensionierung von Mini-KWK-Anlagen zur Teilnahme am liberalisierten Strommarkt. VDI Berichte 2011, 2157, 241–258. [Google Scholar]
- Lödige, D.; Thomas, B.; Widmann, C. Stromoptimierter Betrieb von KWK-Anlagen durch intelligentes Wärmespeichermanagement. Reutlingen, Germany, 2016. Available online: http://www.fachdokumente.lubw.baden-wuerttemberg.de/servlet/is/118201/bwe13002_abschlussbericht.pdf?command=downloadContent&filename=bwe13002_abschlussbericht.pdf&FIS=203 (accessed on 25 May 2015).
- Wehmhörner, U. Multikriterielle Regelung mit temperaturbasierter Speicherzustandsbestimmung für Mini-KWK-Anlagen. Doctoral Thesis, Technische Universität München, München, Germany, 8 February 2012. [Google Scholar]
- Kleinertz, B.; Samweber, F. Auswirkungen der elektrischen Wärmebereitstellung auf Verteilnetze. München, Germany, 2017. Available online: https://www.ffe.de/publikationen/vortraege/733-auswirkungen-der-elektrischen-waermebereitstellung-auf-verteilnetze (accessed on 25 May 2018).
- Köpp, C.; von Mettenheim, H.J.; Klages, M.; Breitner, M.H. Analysis of Electrical Load Balancing by Simulation and Neural Network Forecast. Oper. Res. Proc. 2010, 519–524. [Google Scholar] [CrossRef]
- Klotz, E.-M.; Koepp, M.; Peter, F.; Thamling, N.; Wünsch, M.; Ziegenhagen, I.; Eikmeier, B.; Fette, M.; Janßen, K.; Jochem, E. Potenzial- und Kosten-Nutzen-Analyse zu den Einsatzmöglichkeiten von Kraft-Wärme-Kopplung (Umsetzung der EU-Energieeffizienzrichtlinie) sowie Evaluierung des KWKG im Jahr 2014. Berlin, Germany, 2014. Available online: https://www.bmwi.de/Redaktion/DE/Publikatio-nen/Studien/potenzial-und-kosten-nutzen-analyse-zu-den-einsatzmoeglichkei-ten-von-kraft-waerme-kopplung.html (accessed on 28 May 2018).
- Bloess, A.; Schill, W.P.; Zerrahn, A. Power-to-Heat for Renewable Energy Integration: Technologies, Modeling Approaches, and Flexibility Potentials. Berlin, Germany, 2017. Available online: https://www.diw.de/documents/%20publikationen/73/diw_01.c.563007.de/dp1677.pdf (accessed on 25 May 2018).
- Molderink, A.; Bakker, V.; Bosman, M.G.C.; Hurink, J.L.; Smit, G.J.M. Management and Control of Domestic Smart Grid Technology. IEEE Trans. Smart Grid 2012, 2, 109–119. [Google Scholar] [CrossRef]
- Schulz, W.; Brandstätt, C. Flexibilitätsreserven aus dem Wärmemarkt. Bochum, Germany, 2013. Available online: https://www.bee-ev.de/fileadmin/Publikationen/Studien/Plattform/BEE-Plattform-Systemtransformation_Waermeflexibilitaeten.pdf (accessed on 25 May 2018).
- Khripko, D.; Dunkelberg, H.; Summerbell, D.L.; Hesselbach, J. Energy Efficiency and Demand Side Management: A Case Study of a Holistic Energy Concept in Polymer Processing. Procedia Manuf. 2018, 21, 702–709. Available online: https://www.sciencedirect.com/science/article/pii/S2351978918302142 (accessed on 11 February 2019). [CrossRef]
- Spieker, S.; Christidis, A.; Tsatsaronis, G. Einsatz von BHKW mit Wärmespeicher im virtuellen Regelenergiekraftwerk. Modellierung der Regelenergiebereitstellung bei komplexen Energiesystemen mit intertemporalen Restriktionen. 10. Fachtagung Optimierung in der Energiewirtschaft 2012, 2212, 61–78. [Google Scholar]
- European Distribution System Operators for Smart Grids (EDSO) Flexibility: The Role of DSOs in Tomorrow’s Electricity Market. 2014. Available online: https://www.edsoforsmartgrids.eu/wp-content/uploads/public/EDSO-views-on-Flexibility-FINAL-May-5th-2014.pdf (accessed on 25 May 2018).
- Zeng, Y.; Zhang, R.; Wang, D.; Mu, Y.; Jia, H. A regional power grid operation and planning method considering renewable energy generation and load control. Appl. Energy 2019, 237, 304–313. [Google Scholar] [CrossRef]
- Krzikalla, N.; Achner, S.; Brühl, S. Möglichkeiten zum Ausgleich fluktuierender Einspeisungen aus erneuerbaren Energien. Studie im Auftrag des Bundesverbandes Erneuerbare Energie. Bochum, Germany, 2013. Available online: https://www.bee-ev.de/fileadmin/Publikationen/Studien/Plattform/BEE-Plattform-Systemtransformation_Ausgleichsmoeglichkeiten.pdf (accessed on 25 May 2018).
- Lemieux, C. Monte Carlo and Quasi-Monte Carlo Sampling; Springer Science + Business Media: New York, NY, USA, 2009. [Google Scholar]
- Büchner, J.; Katzfey, J.; Flörcken, O.; Moser, A.; Schuster, H.; Dierkes, S.; van Leeuwen, T.; Verheggen, L.; Uslar, M.; van Amelsvoort, M. Moderne Verteilernetze für Deutschland. Verteilernetzstudie. Studie im Auftrag des Bundesministeriums für Wirtschaft und Energie (BMWi). Berlin, Germany, 2014. Available online: https://www.bmwi.de/Redaktion/DE/Publikationen/Studien/verteilernetzstudie.html (accessed on 25 August 2018).
- Consentec, r2b: Voraussetzungen einer optimalen Integration erneuerbarer Energien in das Stromversorgungssystem. Studie im Auftrag des Bundes-ministeriums für Wirtschaft und Technologie. Aachen, Germany, 2010. Available online: http://www.consentec.de/wp-content/uploads/2011/12/endbericht-optimale-in-tergration-erneuerbare-energie.pdf (accessed on 25 May 2018).
- Klein, K.; Langer, R.; Kalz, D.; Herkel, S.; Henning, H.M. Grid support coefficients for electricity-based heating and cooling and field data analysis of present-day installations in Germany. Appl. Energy 2016, 162, 853–867. [Google Scholar] [CrossRef]
- Dunkelberg, H.; Weiß, T.; Mazurek, F. Energy- and ecologically-oriented selection of plastic materials. Procedia Manuf. in press..
- Köse, E.; Sauer, A.; Pelzel, C. Energieflexibel durch bivalente Produktionsanlagen. Mit bivalent ausgelegten Produktionsprozessen Energiekosten senken und das Stromnetz stabilisieren. wt Werkstatttechnik 2017, 5, 366–372. [Google Scholar]
- Dunkelberg, H.; Rommel, B.; Hesselbach, J. Der thermoöltemperierte Extruder. Nutzung thermischer Energie zur Temperierung von Heiz- und Kühlzonen. Carl Hanser Verlag Kunststoffe 2016, 10, 223–228. [Google Scholar]
- Dunkelberg, H.; Wagner, J.; Hannen, C.; Schlüter, A.; Phan, L.; Hesselbach, J.; Lin, C.-X. Optimization of the energy supply in the plastics industry to reduce the primary energy demand. J. Clean. Prod. 2018, 192, 790–800. [Google Scholar] [CrossRef]
- Lannoye, E.; Flynn, D.; O’Malley, M. Power system flexibility assessment—State of the art. In Proceedings of the 2012 IEEE Power and Energy Society General Meeting, New Energy Horizons—Opportunities and Challenges, San Diego, CA, USA, 22–26 July 2012; pp. 1–6. [Google Scholar]
Figure 1.
Presentation of the methodical procedure.

Figure 2.
Relative share of renewable generation capacity.

Figure 3.
Histograms of the residual load curves. (a) Grid A photovaoltaics embossing; (b) Grid B1 photovoltaic dominated mixed embossing; (c) Grid B2 photovoltaic dominated mixed embossing; (d) Grid C wind energy dominated mixed embossing.
Figure 3.
Histograms of the residual load curves. (a) Grid A photovaoltaics embossing; (b) Grid B1 photovoltaic dominated mixed embossing; (c) Grid B2 photovoltaic dominated mixed embossing; (d) Grid C wind energy dominated mixed embossing.

Figure 4.
Seasonal curves of the daily residual load (averaged and normalized) of Grid B2. Transition refers to the spring and autumn months.
Figure 4.
Seasonal curves of the daily residual load (averaged and normalized) of Grid B2. Transition refers to the spring and autumn months.

Figure 5.
Profile of the heating power of an injection moulding machine (measurement data).

Figure 6.
Transition density function of the modes of injection moulding machines (IM) [12].
Figure 6.
Transition density function of the modes of injection moulding machines (IM) [12].

Figure 7.
Flowchart of the load profile creation process.

Figure 8.
Simulated and measured load profiles of real machines at a company.

Figure 9.
Hybrid-redundant heat system.

Figure 10.
Control logic of the heat system.

Figure 11.
Methodology of different chosen baselines.

Figure 12.
Influence of residual load and heat demand on temperature fluctuations in primary- and secondary circuits (specified as deviation from target value). (a) fixed residual load, primary circuit (b) fixed heat load, primary circuit (c) fixed residual load, secondary circuit (d) fixed heat load, secondary circuit

Figure 13.
Flexibility potential for the grids (including two years for Grid B (B2a and B2b)) and baseline 1. (a) distribution grid A; (b) distribution grid B1; (c) distribution grid B2a; (d) distribution grid B2b; (e) distribution grid C.
Figure 13.
Flexibility potential for the grids (including two years for Grid B (B2a and B2b)) and baseline 1. (a) distribution grid A; (b) distribution grid B1; (c) distribution grid B2a; (d) distribution grid B2b; (e) distribution grid C.

Figure 14.
Flexibility potential for the grids and baseline 2. (a) distribution grid A; (b) distribution grid B1; (c) distribution grid B2a; (d) distribution grid B2b; (e) distribution grid C.
Figure 14.
Flexibility potential for the grids and baseline 2. (a) distribution grid A; (b) distribution grid B1; (c) distribution grid B2a; (d) distribution grid B2b; (e) distribution grid C.

Figure 15.
Flexibility potential for the grids and baseline 3. (a) distribution grid A; (b) distribution grid B1; (c) distribution grid B2a; (d) distribution grid B2b; (e) distribution grid C.
Figure 15.
Flexibility potential for the grids and baseline 3. (a) distribution grid A; (b) distribution grid B1; (c) distribution grid B2a; (d) distribution grid B2b; (e) distribution grid C.


Table 1.
Performances of the suppliers.
| Power | CHP | PtH | Gas Boiler |
|---|---|---|---|
| [kW] | 24 | 20 | 20 |
| [kW] | 54 | 20 | - |
Table 2.
Comparison of the potentials.
| Grid Ref. | Energy-Cell | Baseline 1 (Reinstallation) | Baseline 2 (Gas Boiler) | Baseline 3 (CHP) | |
|---|---|---|---|---|---|
 positive pot. in [kWh]
 |  negative pot. in [kWh]
 | ||||
| Grid A | company cell | 1309 | 1058 | 74 | 308 |
| dist.-grid cell | 1058 | - | 244 | ||
| Grid B1 | company cell | 1486 | 1199 | 42 | 137 |
| dist.-grid cell | 1199 | - | 110 | ||
| Grid B2a | company cell | 918 | 742 | 146 | 682 |
| dist.-grid cell | 742 | - | 537 | ||
| Grid B2b | company cell | 785 | 637 | 180 | 829 |
| dist.-grid cell | 637 | - | 653 | ||
| Grid C | company cell | 1002 | 811 | 133 | 606 |
| dist.-grid cell | 811 | - | 479 | ||
© 2019 by the authors. Licensee MDPI, Basel, Switzerland. This article is an open access article distributed under the terms and conditions of the Creative Commons Attribution (CC BY) license (http://creativecommons.org/licenses/by/4.0/).
Share and Cite
MDPI and ACS Style
Dunkelberg, H.; Sondermann, M.; Meschede, H.; Hesselbach, J. Assessment of Flexibilisation Potential by Changing Energy Sources Using Monte Carlo Simulation. Energies 2019, 12, 711. https://doi.org/10.3390/en12040711
AMA Style
Dunkelberg H, Sondermann M, Meschede H, Hesselbach J. Assessment of Flexibilisation Potential by Changing Energy Sources Using Monte Carlo Simulation. Energies. 2019; 12(4):711. https://doi.org/10.3390/en12040711
Chicago/Turabian StyleDunkelberg, Heiko, Maximilian Sondermann, Henning Meschede, and Jens Hesselbach. 2019. "Assessment of Flexibilisation Potential by Changing Energy Sources Using Monte Carlo Simulation" Energies 12, no. 4: 711. https://doi.org/10.3390/en12040711
Note that from the first issue of 2016, this journal uses article numbers instead of page numbers. See further details here.