Numerical Investigation of Passive Vortex Generators on a Wind Turbine Airfoil Undergoing Pitch Oscillations


Jiangsu Key Laboratory of Hi-Tech Research for Wind Turbine Design, Nanjing University of Aeronautics and Astronautics, Nanjing 210016, China
*
Author to whom correspondence should be addressed.
Energies 2019, 12(4), 654; https://doi.org/10.3390/en12040654
Submission received: 14 January 2019
/
Revised: 13 February 2019
/
Accepted: 14 February 2019
/
Published: 18 February 2019
(This article belongs to the Special Issue Recent Advances in Aerodynamics of Wind Turbines)
Abstract
:Passive vortex generators (VGs) are widely used to suppress the flow separation of wind turbine blades, and hence, to improve rotor performance. VGs have been extensively investigated on stationary airfoils; however, their influence on unsteady airfoil flow remains unclear. Thus, we evaluated the unsteady aerodynamic responses of the DU-97-W300 airfoil with and without VGs undergoing pitch oscillations, which is a typical motion of the turbine unsteady operating conditions. The airfoil flow is simulated by numerically solving the unsteady Reynolds-averaged Navier-Stokes equations with fully resolved VGs. Numerical modelling is validated by good agreement between the calculated and experimental data with respect to the unsteady-uncontrolled flow under pitch oscillations, and the steady-controlled flow with VGs. The dynamic stall of the airfoil was found to be effectively suppressed by VGs. The lift hysteresis intensity is greatly decreased, i.e., by 72.7%, at moderate unsteadiness, and its sensitivity to the reduced frequency is favorably reduced. The influences of vane height and chordwise installation are investigated on the unsteady aerodynamic responses as well. In a no-stall flow regime, decreasing vane height and positioning VGs further downstream can lead to relatively high effectiveness. Compared with the baseline VG geometry, the smaller VGs can decrease the decay exponent of nondimensionalized peak vorticity by almost 0.02, and installation further downstream can increase the aerodynamic pitch damping by 0.0278. The obtained results are helpful to understand the dynamic stall control by means of conventional VGs and to develop more effective VG designs for both steady and unsteady wind turbine airfoil flow.
1. Introduction
Airfoil flow control at the high angle of attack (AOA) is of keen interest in a wide range of industrial fluid dynamics applications. Such flow is encountered in several flight phases (take-off, landing, maneuvering, etc.) and can lead to partial or massive separation, with well-known consequences like vibrations, drag increase and loss of control [1]. The separated flow is also undesirable and can degrade the performance of wind turbine blades with respect to lower output power, higher fatigue loads, and stall noise. In order to keep the flow attached, the near-wall flow must have enough momentum to overcome the adverse pressure gradient and the streamwise viscous dissipation. Consequently, various flow control techniques have been proposed to reenergize the boundary layer [2], among which passive vortex generators (VGs) are simple and cost-effective. Wind turbine field tests indicated annual energy production (AEP) gains of 4% to 10% on the stall-regulated machines with VGs [3,4]. VGs have been found to effectively correct the adverse effects of blade contamination and erosion on the lift coefficient [5]. The performance of the NREL 5-MW wind turbine was significantly improved, showing a 1% increase in the AEP by mitigating the soiling effect [6].
Conventional VGs consist of some pairs of vanes protruding from the surface, angled to the incoming flow, with a height of the order of the boundary-layer thickness. The basic principle of VGs is to produce small vortices shedding near the vane tip, create a wake of upwash and downwash regions, reenergize the boundary layer from the external flow, counteract the adverse pressure gradient, and eventually, suppress the flow separation [5]. Therefore, the aerodynamic efficiency of the airfoil is considerably elevated by VGs at the high AOA. The major deficiency of VGs is the drag penalty for the fully attached flow. At the low AOA, VGs produce a marginal influence on the airfoil lift, inevitably leading to an increased parasitic drag, and then reducing the lift-to-drag ratio. So-called low-profile VGs, with a height between 10% and 50% of the boundary-layer thickness, are a remedy for this shortcoming [7,8]. Their use, however, is often limited to applications where the flow-separation points are relatively fixed, which is uncommon on wind turbine blades due to the variable freestream velocity and rotor speed. Thus, the VG installation is often limited to the blade root region of the pitch-regulated wind turbines, where the flow field is subjected to a high AOA (commonly α > 20°).
Plenty of fundamental investigations of VGs have been conducted over the past decades and have shed light on the flow mechanisms and design methodologies. In order to assess the effectiveness of VG designs, the streamwise evolution of vortices downstream of VGs is often characterized by the peak vorticity, vortex trajectory, vortex size, and decay rate [8,9,10]. Various VG parameters play important roles in the streamwise vortex evolution, and hence, the airfoil performance. Godard and Stanislas [1] conducted wind tunnel measurements on a bump with hot film probes and stereo particle image velocimetry (PIV). They found that the triangular vanes performed better than rectangular ones in terms of the drag penalty, and the counter-rotating array configuration was more effective than the co-rotating one in the momentum transfer. Mueller-Vahl et al. [5] observed that small spanwise spacing of VGs could not only lead to an increase of 12.5° in the stall AOA, and an increase of 31% in the maximum lift coefficient Cl,max, but could also produce a high increase in the drag penalty. The decrease of spanwise spacing brought about an increased interaction of the neighboring vortices so that they moved further away from the airfoil surface. Recently, Baldacchino et al. [11] did a comprehensive experimental parameter study of VGs on the DU97-W-300 airfoil. They found the chordwise VG position and vane height to be of prime importance to the airfoil performance, but the vane length, inclination angle, vane shape, and array packing density were proved to be secondary. Wang et al. [12] investigated the effect of double-row rectangular VGs on the NREL S809 airfoil flow by numerical simulations. The separated flow was found to be further suppressed by the second row of VGs, and the Cl,max was further increased by 0.27 in comparison with the single-row installation near the leading edge. Although a few numerical studies have been conducted by expensive DNS/LES-type calculations [13,14], RANS-based methods are by far the most common. In order to alleviate the dense grid requirements of the fully-resolved VG geometry, a popular method was proposed to simplify VG modelling [15]. The idea was to introduce a local flow-dependent forcing term into the momentum equations by means of an analogy to the thin airfoil theory. This approach has shown potential to capture the effects of VGs on wind turbine airfoils and blades [16,17].
Most of the available information concerning VGs was obtained at a constant AOA; however, rare studies were conducted on the unsteady airfoil performance with VGs at a varying AOA. In practice, inflow turbulence, gusts, yaw misalignment, blade pitch and elastic torsion can cause a time-varying local AOA from the blade-section view. If the AOA variation is wide and fast enough, the boundary layer around the blade surface cannot follow it instantaneously. Consequently, dynamic stall occurs, accompanied by the noticeable unsteady aerodynamic loads. Dynamic stall is characterized by the shedding and passage of a strong vortical disturbance over the suction surface, inducing a highly nonlinear fluctuating pressure field [18,19]. The associated aerodynamic hysteresis is of great significance to turbine structures and output power [20].
Unfortunately, the effect of VGs on the unsteady wind turbine airfoil performance is presently unclear. This paper presents a numerical investigation of the DU97-W-300 airfoil undergoing the representative dynamic-stall motion, sinusoidal pitch oscillation, in order to obtain an unsteady performance evaluation of conventional VGs. The fully-resolved unsteady Reynolds-averaged Navier-Stokes simulations (URANS) method is used, which has succeeded in both the dynamic-stall predictions [21,22] and steady controlled airfoil flow simulations [12,16,23]. VGs are found to favorably control the dynamic stall and reduce the aerodynamic hysteresis. The obtained results indicate that the deep stall of the airfoil is eliminated, and VGs could further reduce the airfoil performance sensitivity to the reduced frequency. A parameter study in vane height and chordwise installation was conducted on the unsteady airfoil flow as well. The performance sensitivity was found to be complicated by the airfoil motions. This work contributes to understanding the effect of passive VGs on the unsteady aerodynamic loads of the wind turbine blades.
2. Numerical Modelling
2.1. Geometry and Mesh Generation
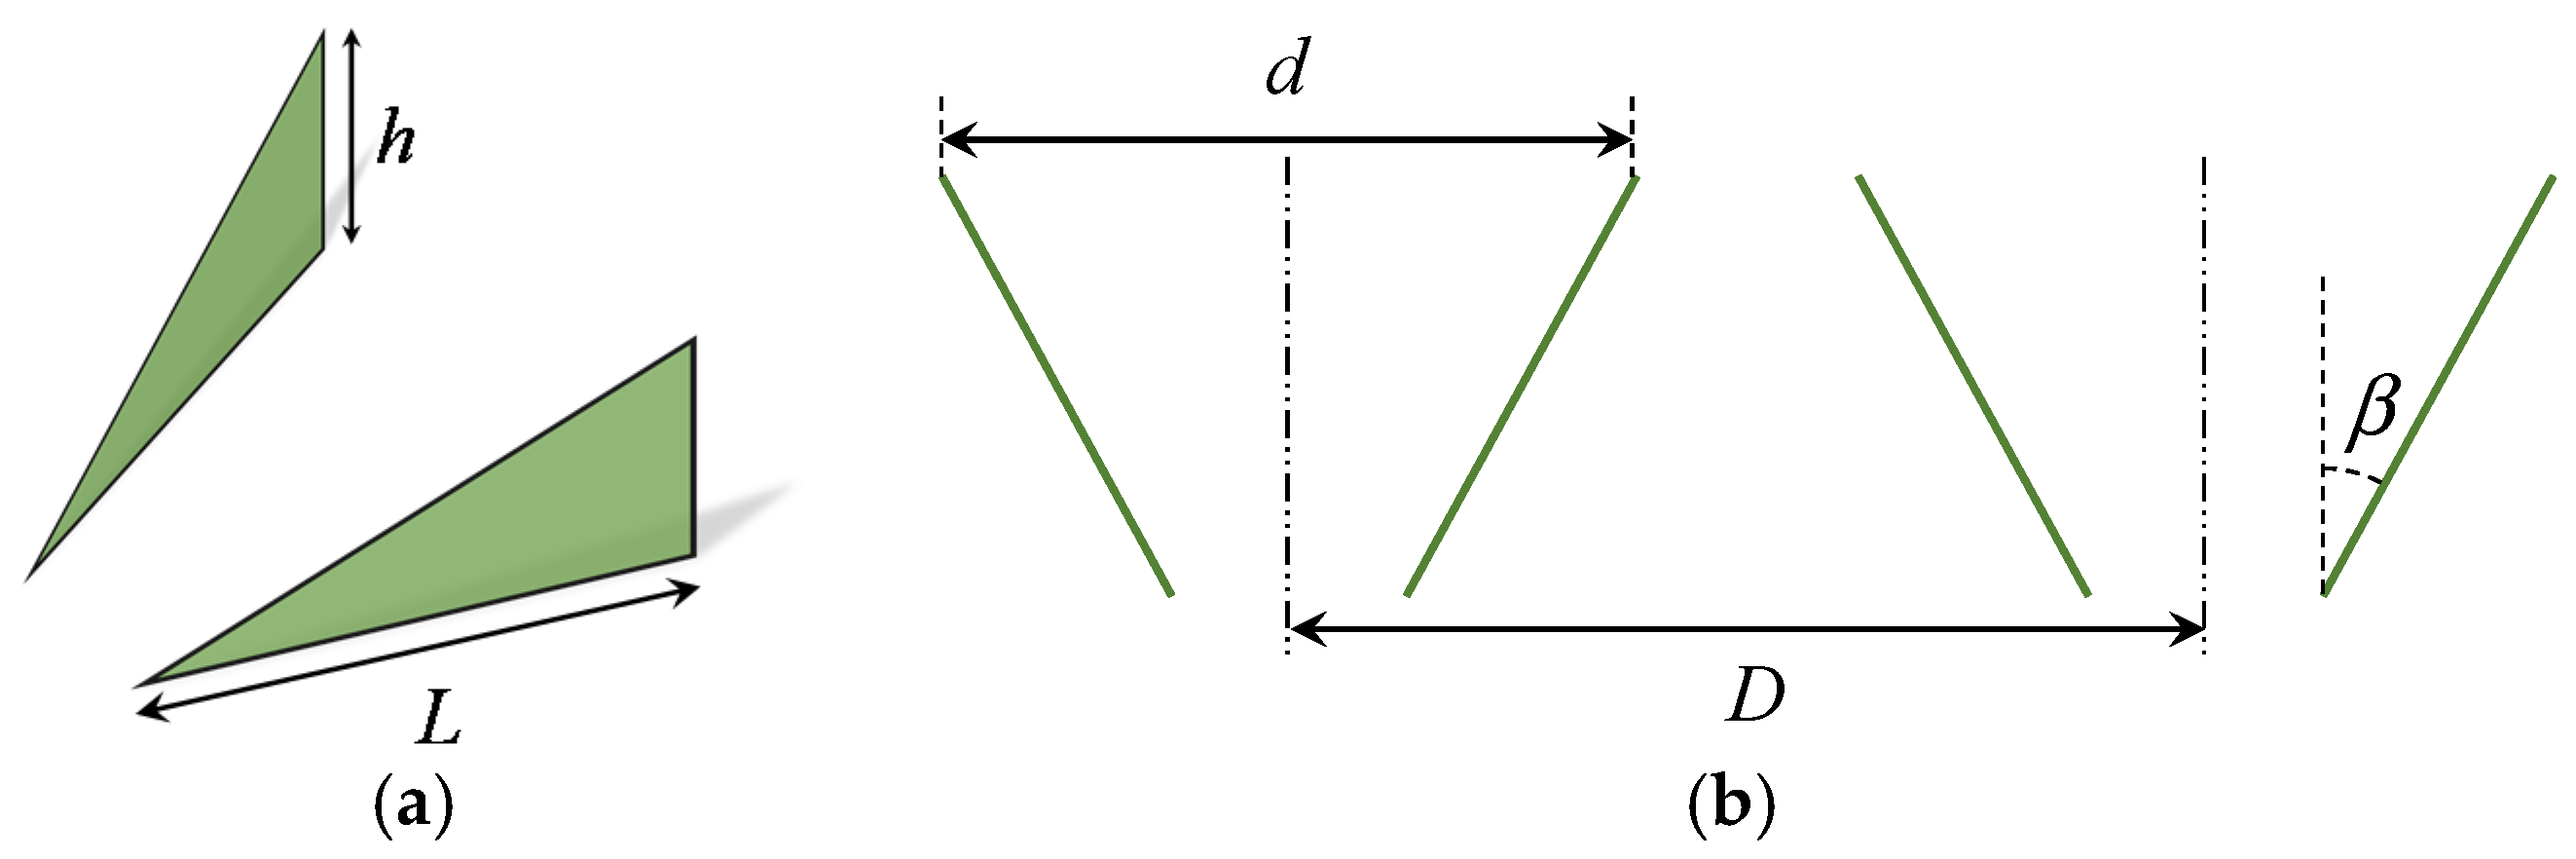
The DU97-W-300 airfoil was originally designed and tested by Timmer et al. [24] for inboard wind turbine blade sections, where the flow field is often first to experience separation. This airfoil has a maximum thickness of 30% around the chordwise location and a blunt trailing edge of 1.7% chord length. Figure 1 shows the schematic of passive delta-shaped vane-type VGs in a counter-rotating common downwash configuration. One might believe that the dominant VG parameters for steady and unsteady airfoil flow should be consistent. Therefore, this study puts emphasis on the effects of chordwise VG position xVG and vane height h on the unsteady aerodynamic responses of the airfoil undergoing pitch oscillations. The airfoil chord length c is 650 mm and the geometric vane inflow angle β is ±15°, which is entirely consistent with recent wind tunnel experiments [11]. Table 1 gives the parameters of VG sets in this work, including the double-row VGs at 20% and 40% chordwise locations. The normalized intra-vane spacing, inter-vane spacing, and vane length are assured constant for all computations.
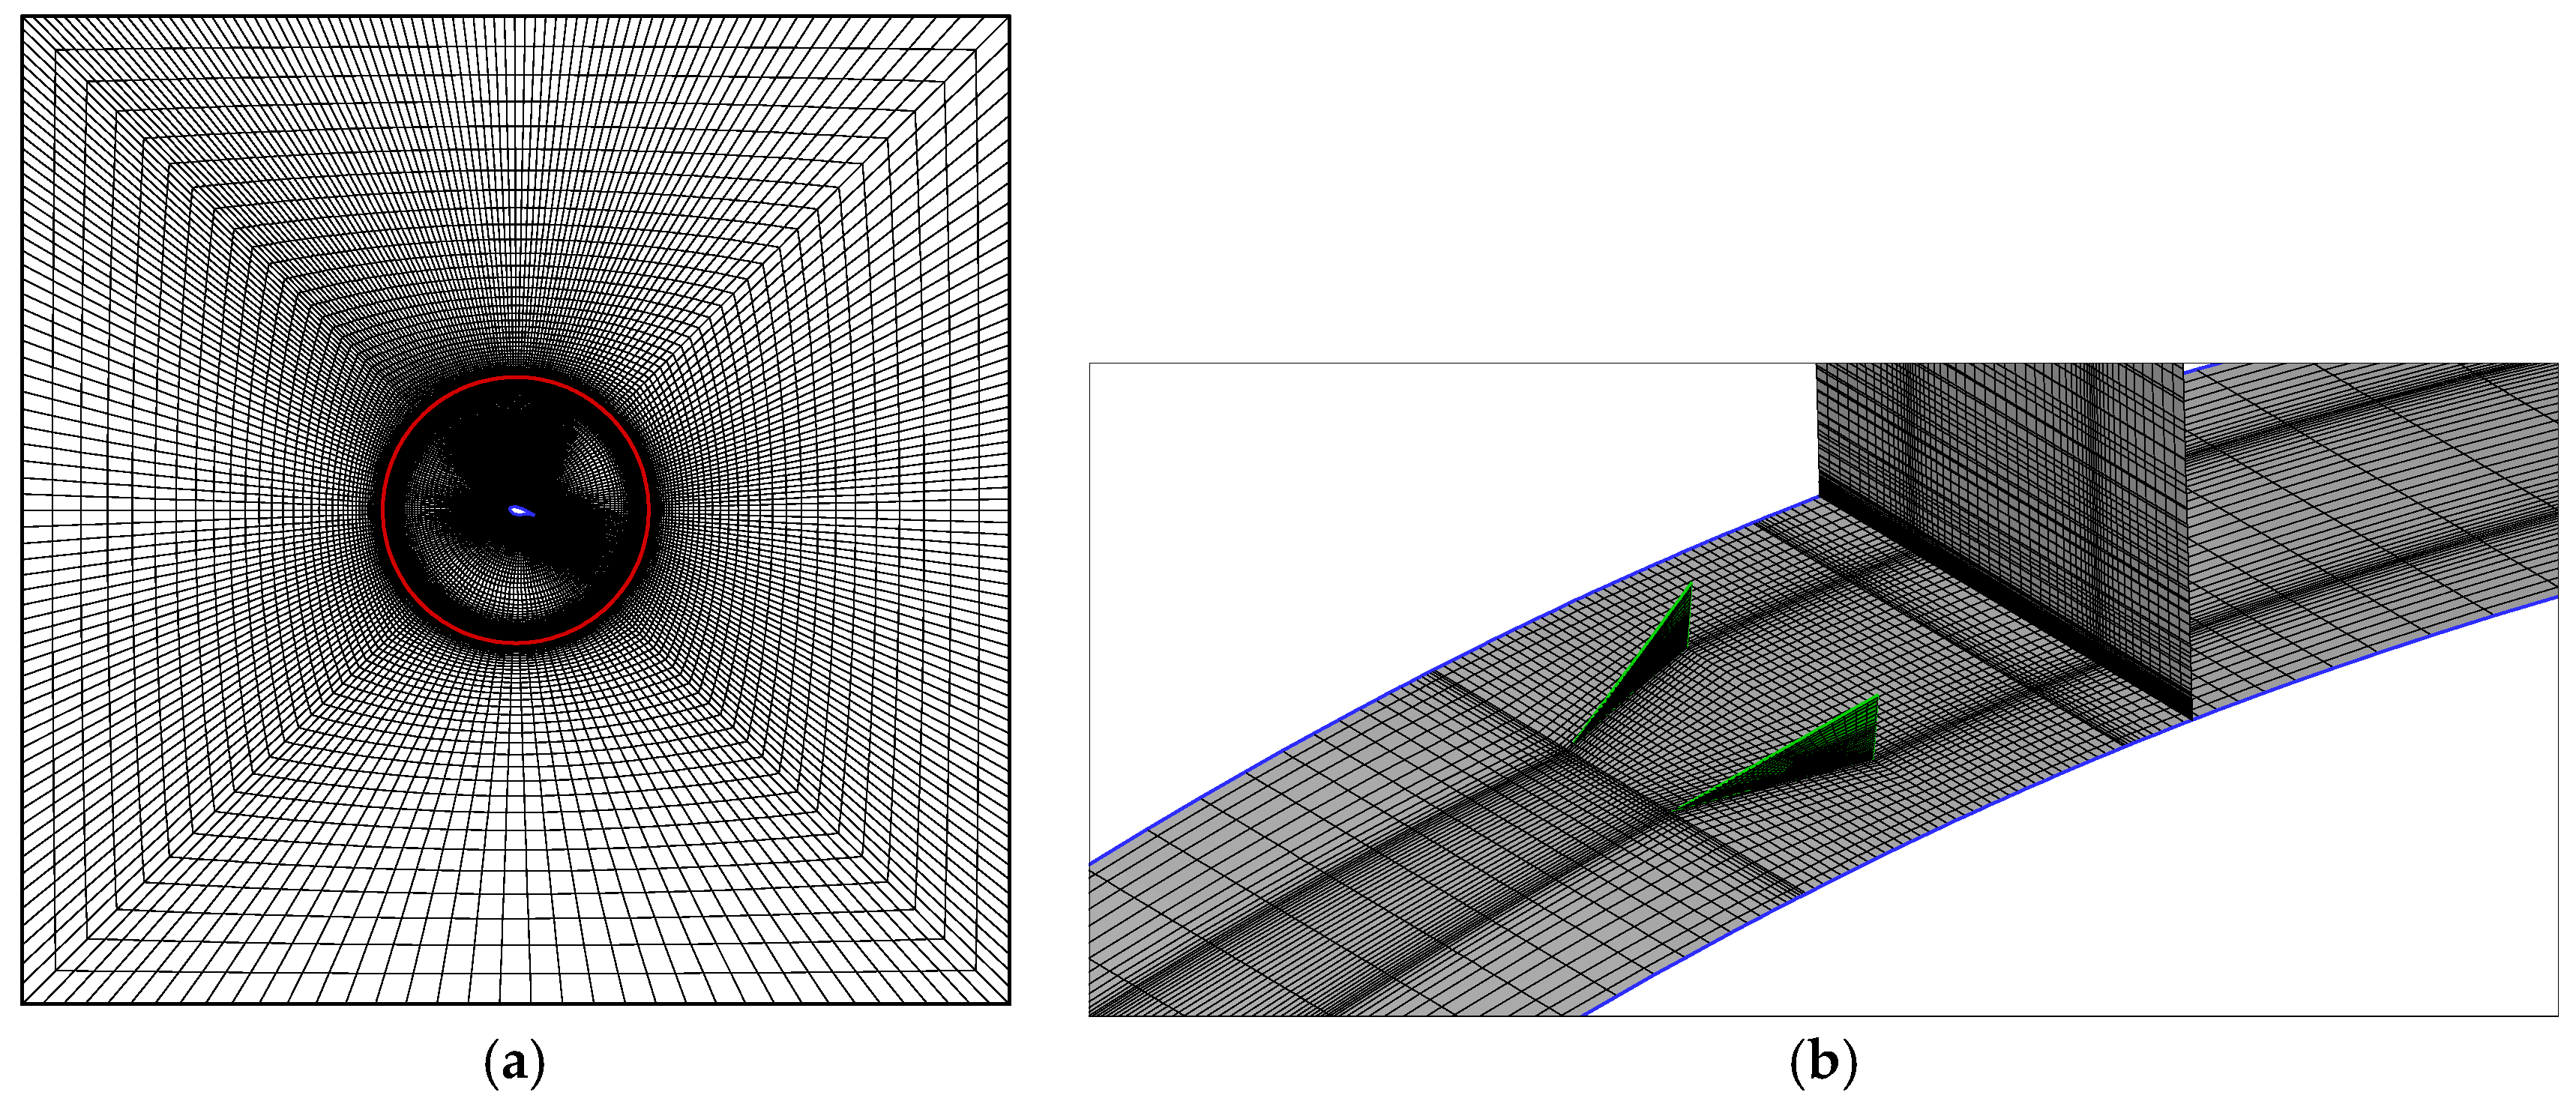
The mesh around the airfoil geometry is generated in a structured O-type configuration to assure the wall orthogonality (Figure 2a). Only one pair of VGs is modelled and the periodic boundary is used on the spanwise boundaries. The wingspan is exactly equal to the inter-vane spacing D (Figure 2b). The sliding-mesh method [25] is used to simulate the pitch oscillations about the quarter-chord axis. Then, the computational zone can be divided into two subdomains, the rotating region (inner) and the stationary region (outer). These two regions interact by a cylindrical sliding interface at radius of 5.4 c (Figure 2a). A user-defined function is introduced in the rotating region to make the instantaneous inflow AOA to satisfy the following formula:
where αmean, A, and f are the mean AOA, AOA amplitude, and frequency of oscillation, respectively. The so-called reduced frequency is defined as k = πfc/U0 with U0 being the freestream velocity. The typical Reynolds number of 2 × 10⁶ is selected in all computations. The uncontrolled airfoil flow without VGs is simulated in two-dimensional conditions to save the computational cost with similar mesh generation.
α(t) = αmean + Asin(2πft)
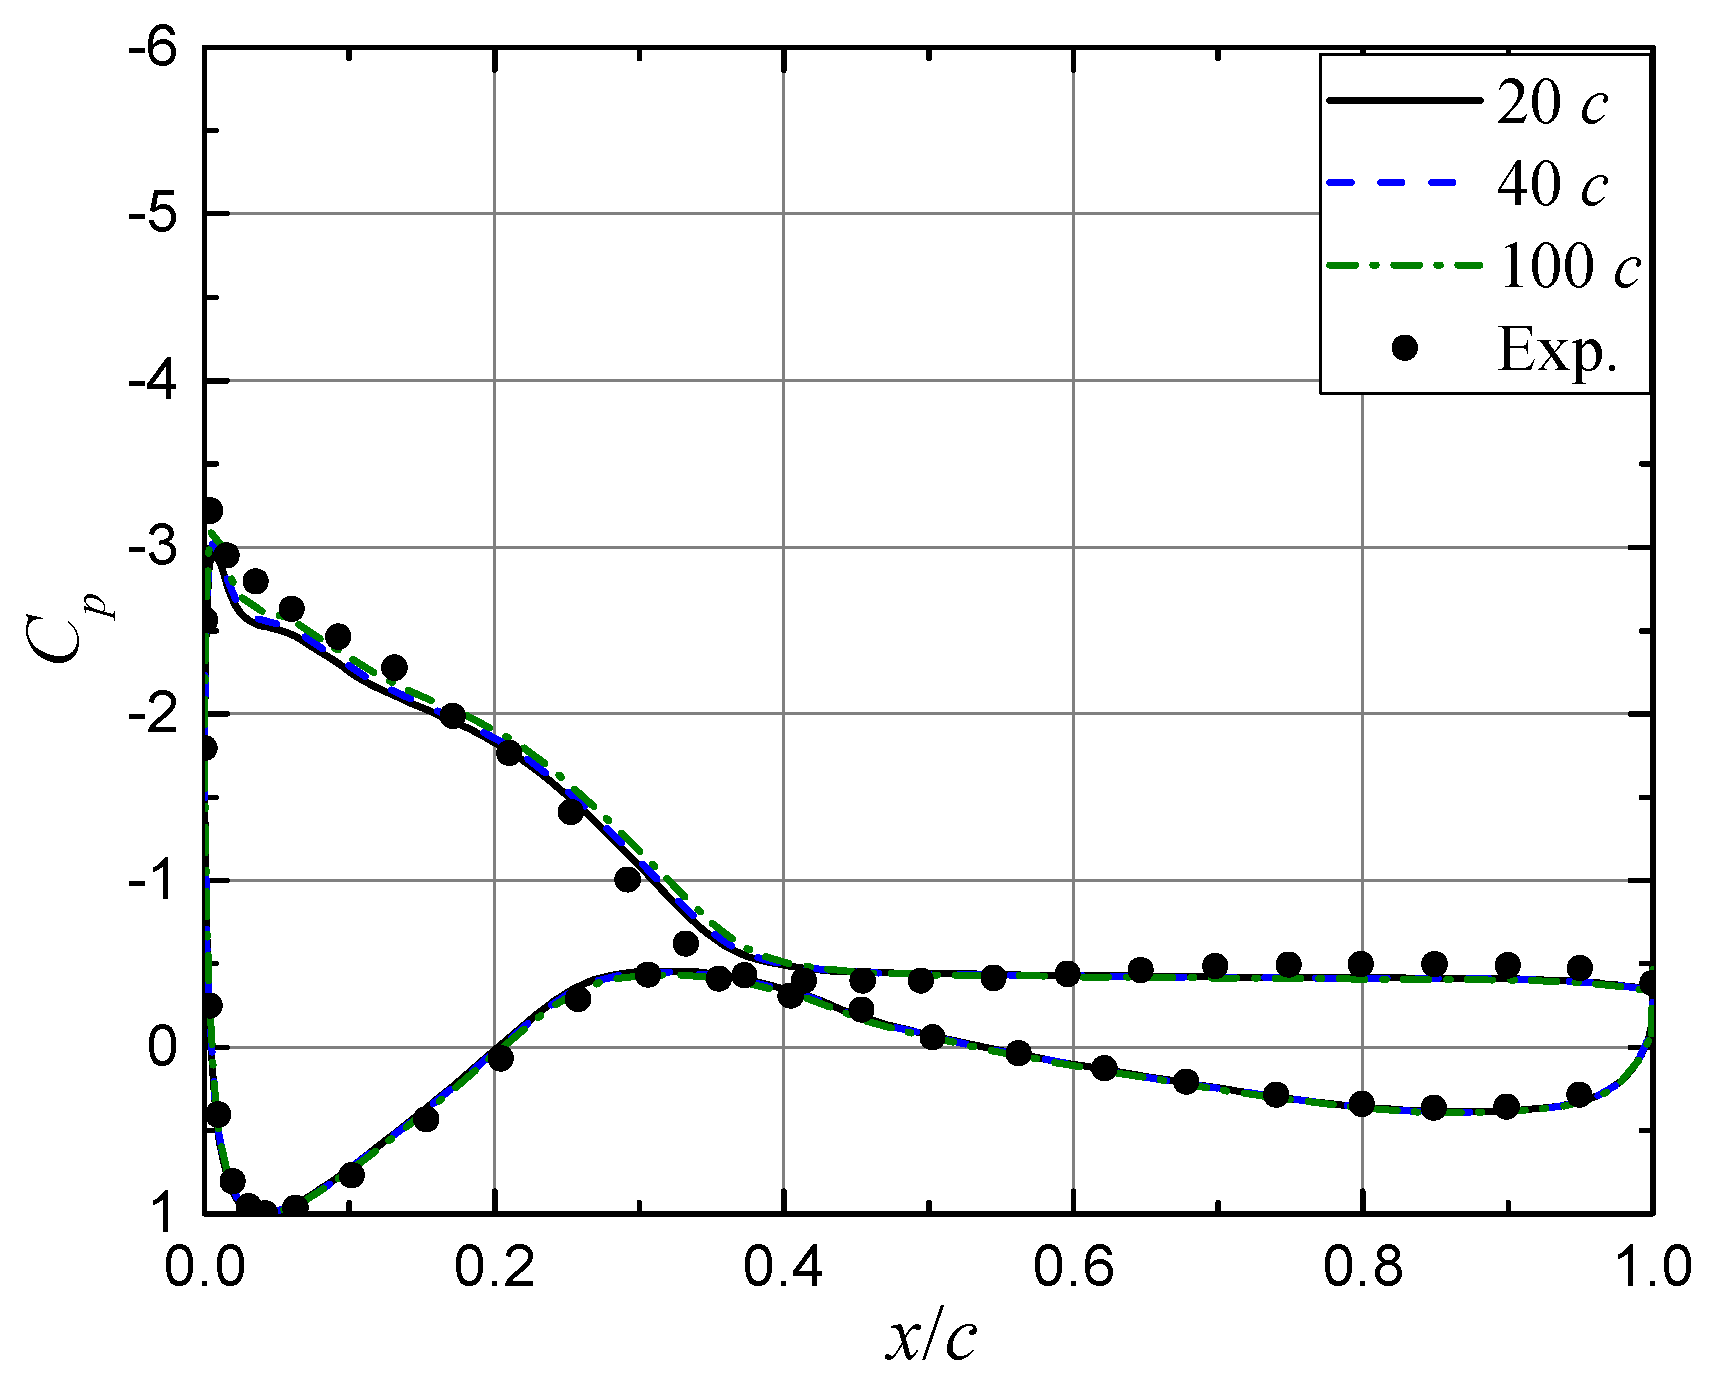
The computational domain is exactly square from the spanwise view. The left, upper, and lower sides are inlet boundary with velocity imposed in the horizontal direction; the right side is outlet boundary with pressure imposed. The inlet turbulence intensity is set at 0.1% and the turbulent viscosity ratio 1, according to the low turbulence wind tunnel experiments [11]. Figure 3 demonstrates that a far-field distance of 20 c away from the airfoil is approximately sufficient. Although the far-field distance of 100 c makes the leading-edge suction peak closer to the experimental value, 20 c leads to a better pressure prediction between the 20% c and 40% c chordwise locations on the suction side, and hence, better predictions of the separation point. Therefore, a far-field distance of 20 c is used in this work.
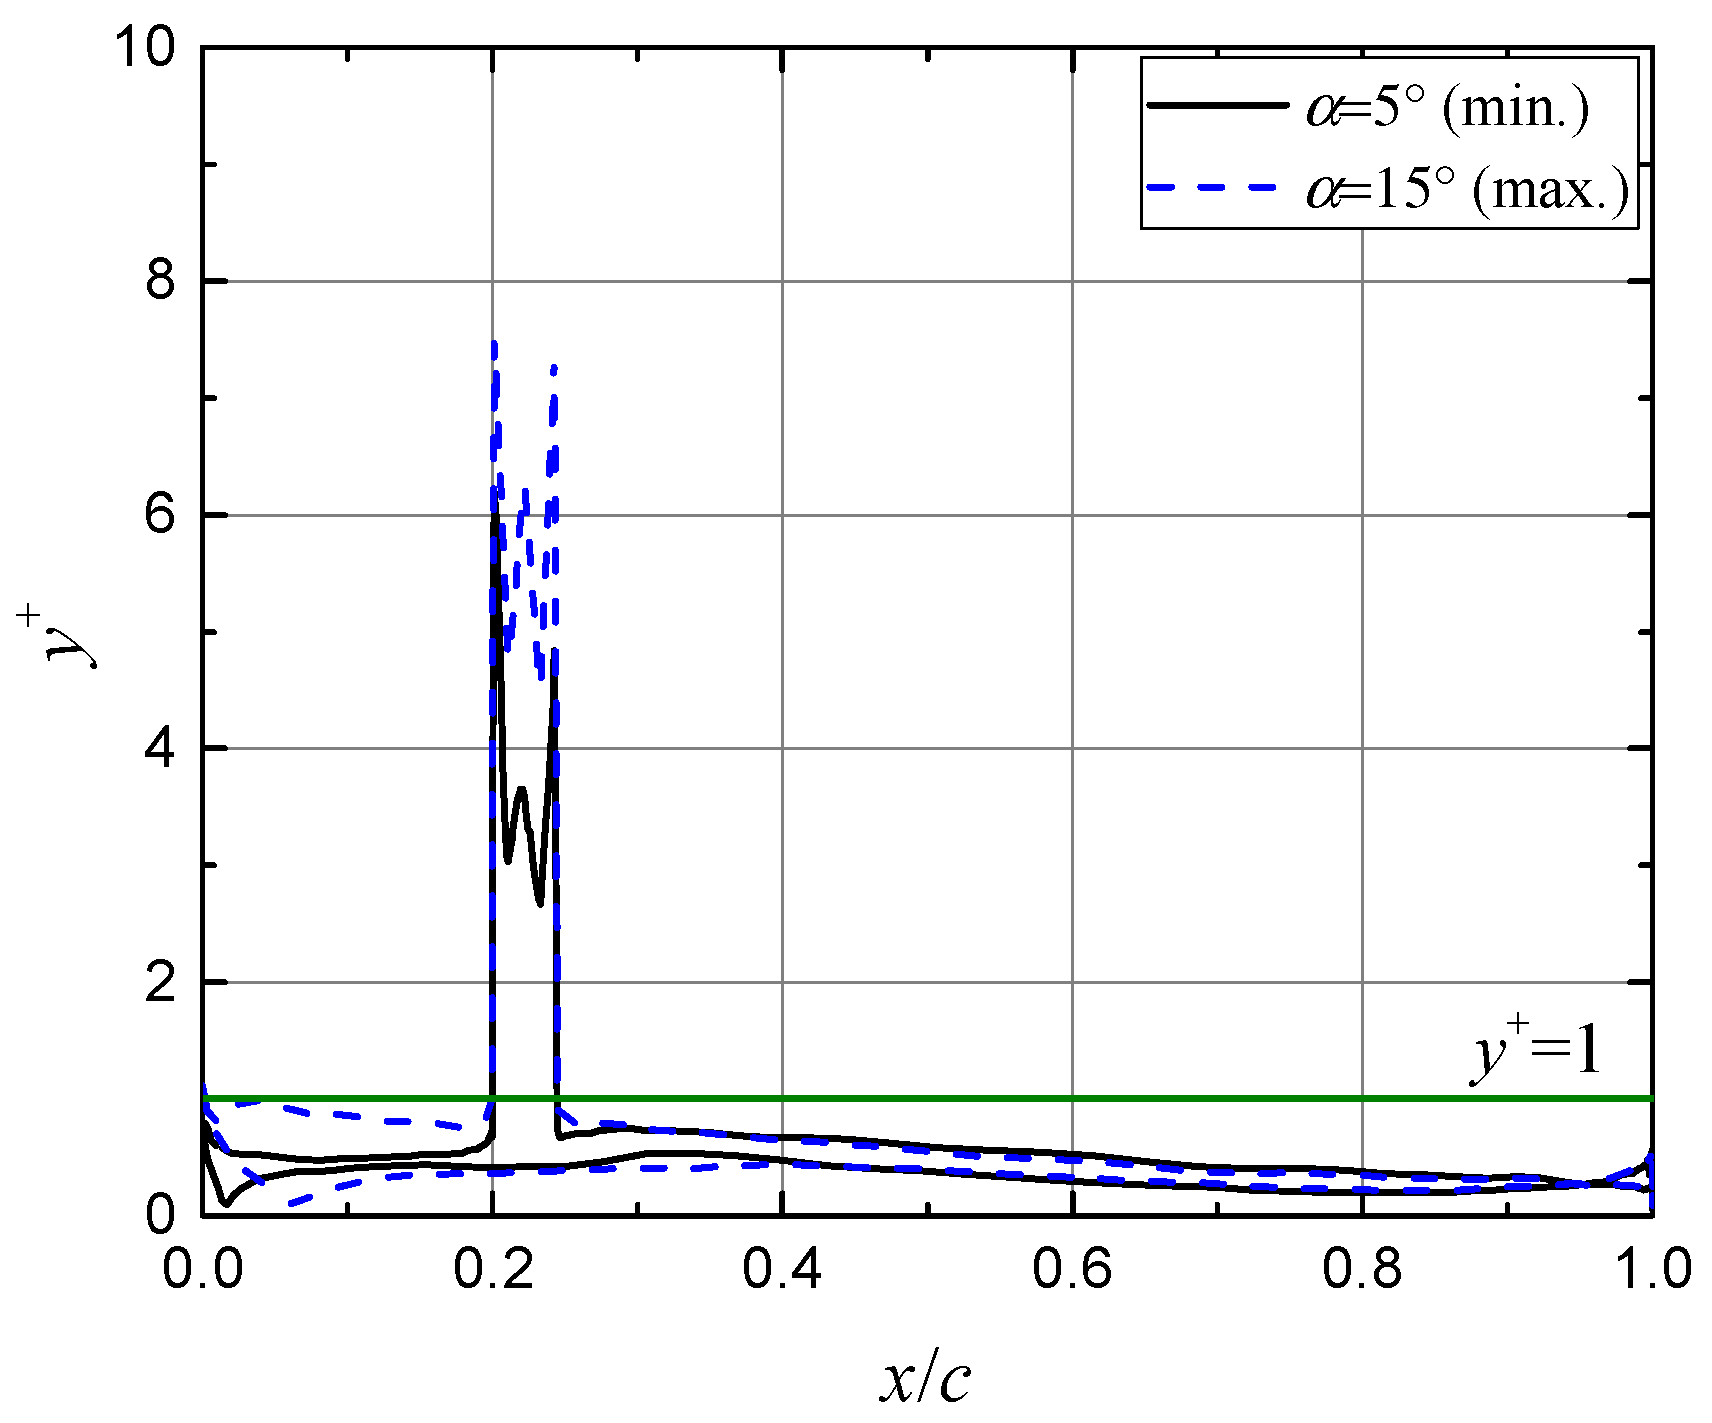
Firstly, four blocks around the VGs are generated. Secondly, the O-type mesh is generated in the computational domain, and the first layer spacing is 10−5 c to assure a good resolution of the viscous sublayer, with the growth rate being 1.08. Each VG vane has only 500 points to save the computational cost (Figure 2b). Figure 4 shows the y+ distributions on the airfoil undergoing pitch oscillation at the minimum and maximum AOA. The y+ value is well less than 1, and there are about 45 normal layers in the boundary layer, except close to the VG location. The maximum wall y+ around VGs has reached 7 due to the limited points on vanes; however, this value is still acceptable [12,23].
2.2. Discretization and Turbulence Modelling
The aerodynamic characteristics of unsteady airfoil flow are predicted by numerically solving the URANS equations with the commercial solver ANSYS/FLUENT 16.0 [25]. In order to obtain a good resolution, the third-order MUSCL convection scheme [25] is used for spatial discretization of the whole set of URANS and turbulence equations, the bounded second-order implicit scheme [25] for time differencing, and the pressure-based Coupled algorithm [25] for the pressure-velocity coupling. Based on experience with previous computations [26], the time step is selected to assure 540 steps computed over each cycle with 20 inner iterations per time step. The turbulence is modelled by the SST k-ω eddy viscosity model [27] incorporated with the γ-Reθ transition model [28], because the dynamic-stall predictions can be enhanced by considering the transitional flow effect [21].
The criterion for the iterative convergence of the numerical results is set by examining the aerodynamic forces of the airfoil and assuring their cycle-to-cycle variations to be negligible. In this work, the converged results are generally obtained after 5 cycles.
2.3. Mesh Dependency Study
The General Richardson Extrapolation method [29] is used to study the mesh dependency for the lift and drag forces. Three different meshes with VGs have been compared: a coarser mesh (about 200 × 160 × 40 points along the wrap-around, normal and spanwise directions, respectively), a standard mesh (240 × 200 × 60 points), and a finer mesh (280 × 240 × 80 points). The mesh sizes are about 1.3 million, 2.9 million, and 5.4 million from coarse to fine. Table 2 illustrates that the monotonic convergence condition is satisfied with the Richardson coefficient R being less than unity. Finally, the medium mesh is used for all simulations of the controlled flow. The equiangular skewness of computational mesh is well below 0.81, with the maximum locating at the leading edge of VGs, and the maximum volume ratio is below 33.
3. Results and Discussion
3.1. Assessment of Unsteady Numerical Modelling
Due to the lack of experimental results with which to provide a reliable estimation of the unsteady aerodynamic characteristics of the DU97-W-300 airfoil under pitch oscillations, a validation of the unsteady numerical modelling by comparison between calculation and experiment on dynamic stall of this specific airfoil DU97-W-300 is not yet possible. However, it is worth evaluating the capability of the URANS method in comparison to the available experimental data of the NREL S809 airfoil [30]. Ramsay et al. [31] conducted a series of wind tunnel tests on this wind turbine airfoil undergoing pitch oscillations, and their data have been extensively used to study the dynamic stall as a reliable benchmark [22,32,33]. The computational mesh is generated in the same manner, with about 240 wrap-around points and 200 normal layers. The mesh independency study has been carried out in our previous work [26].
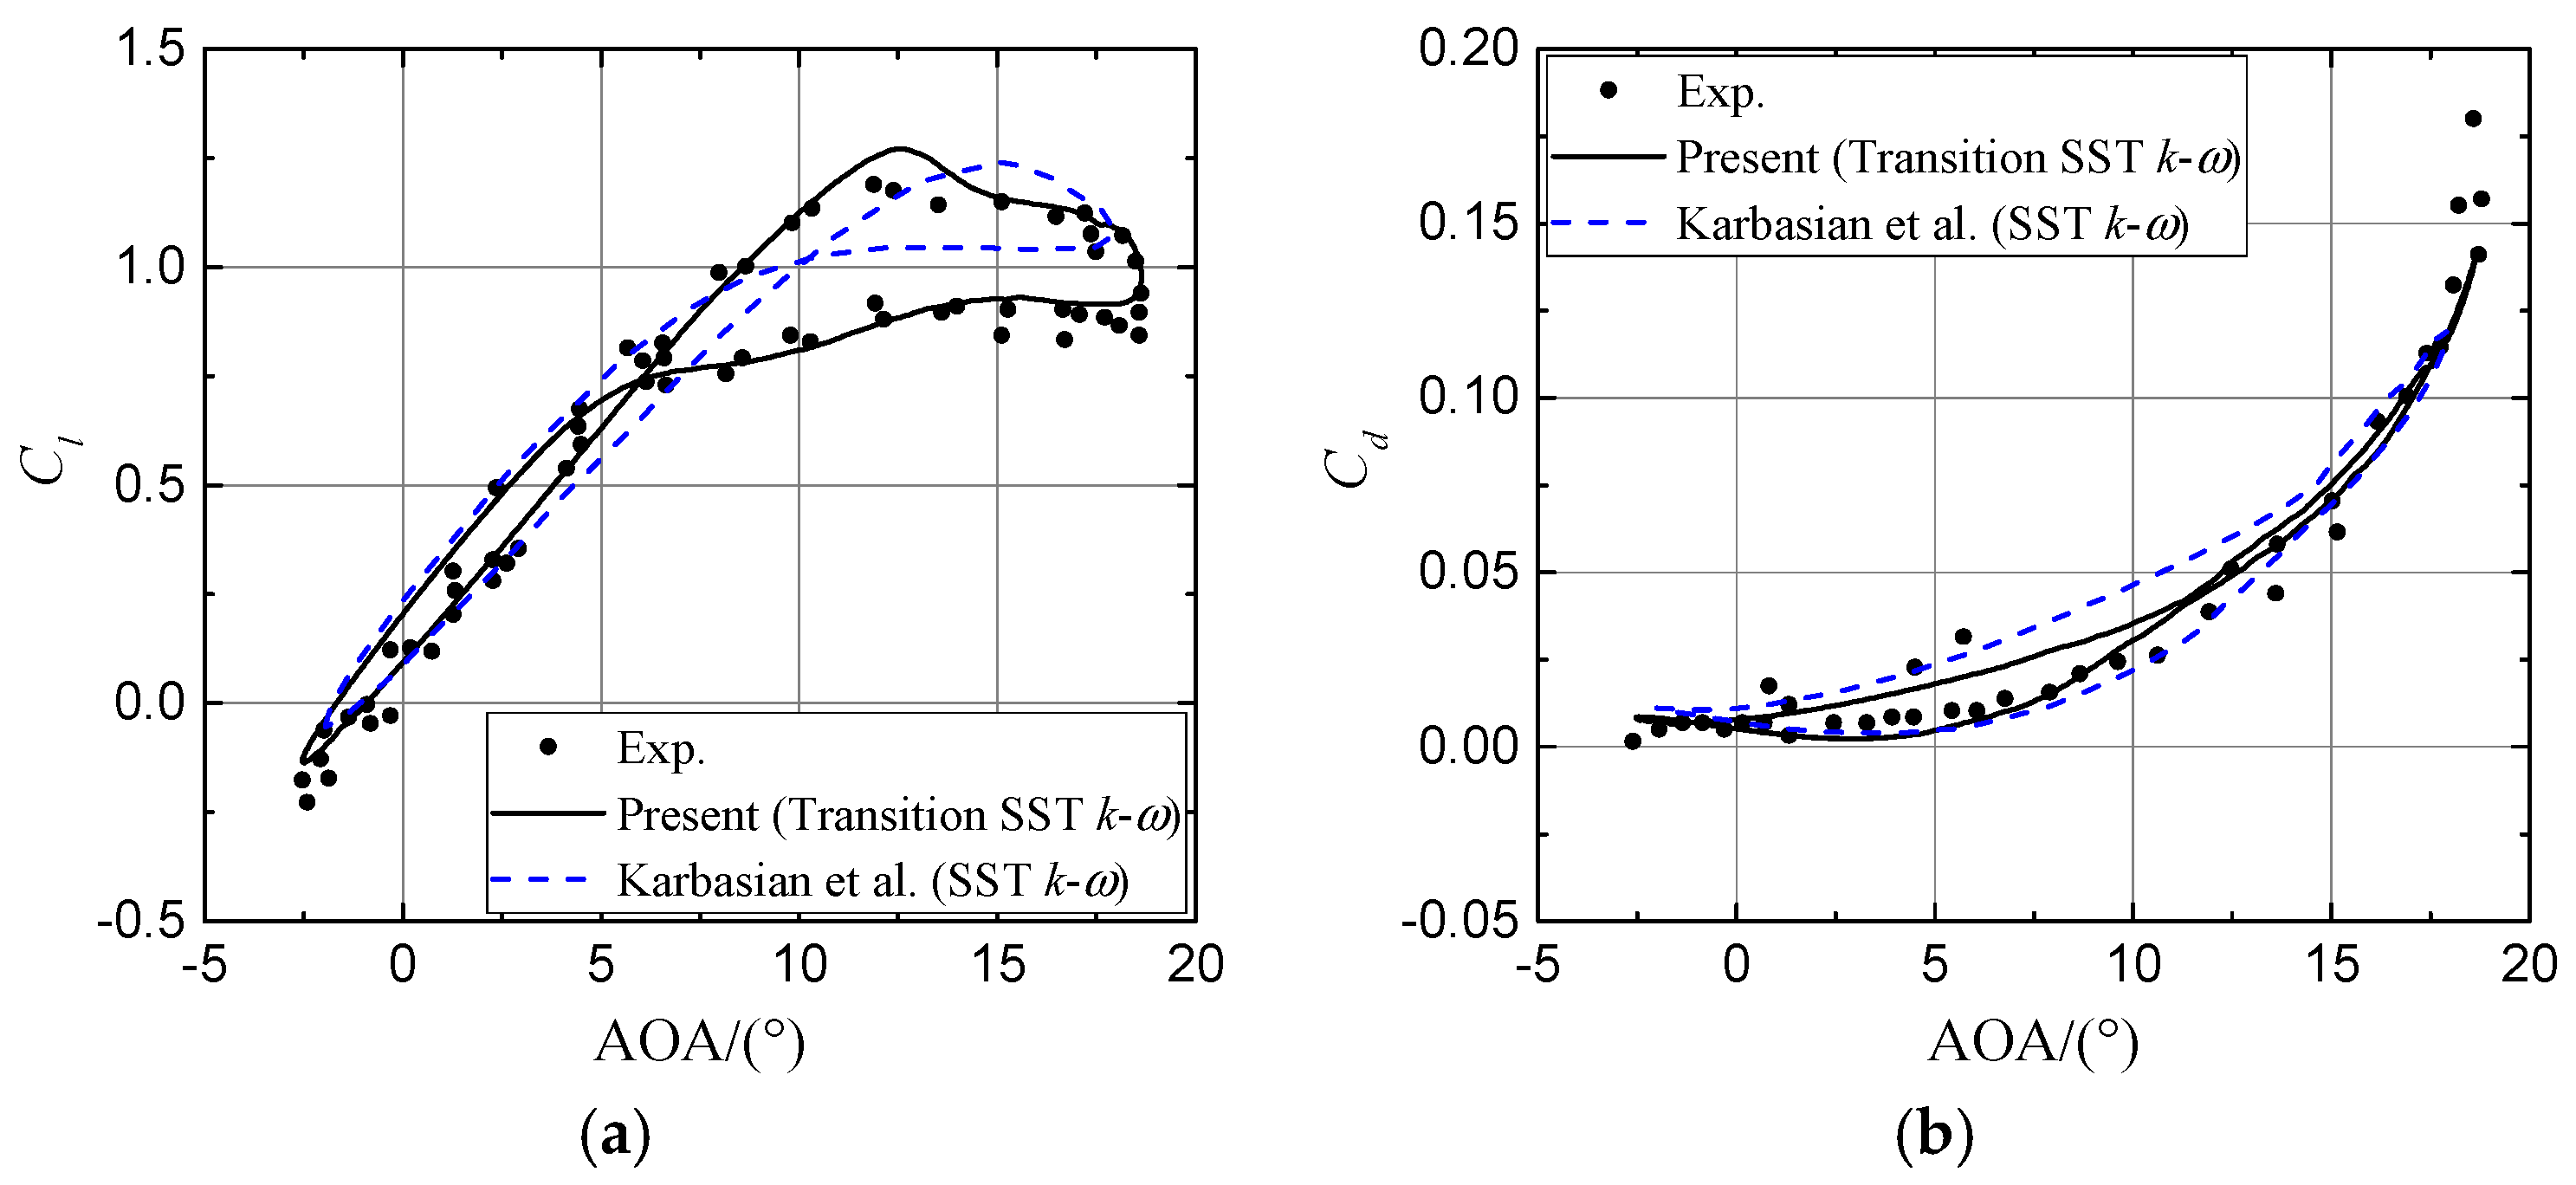
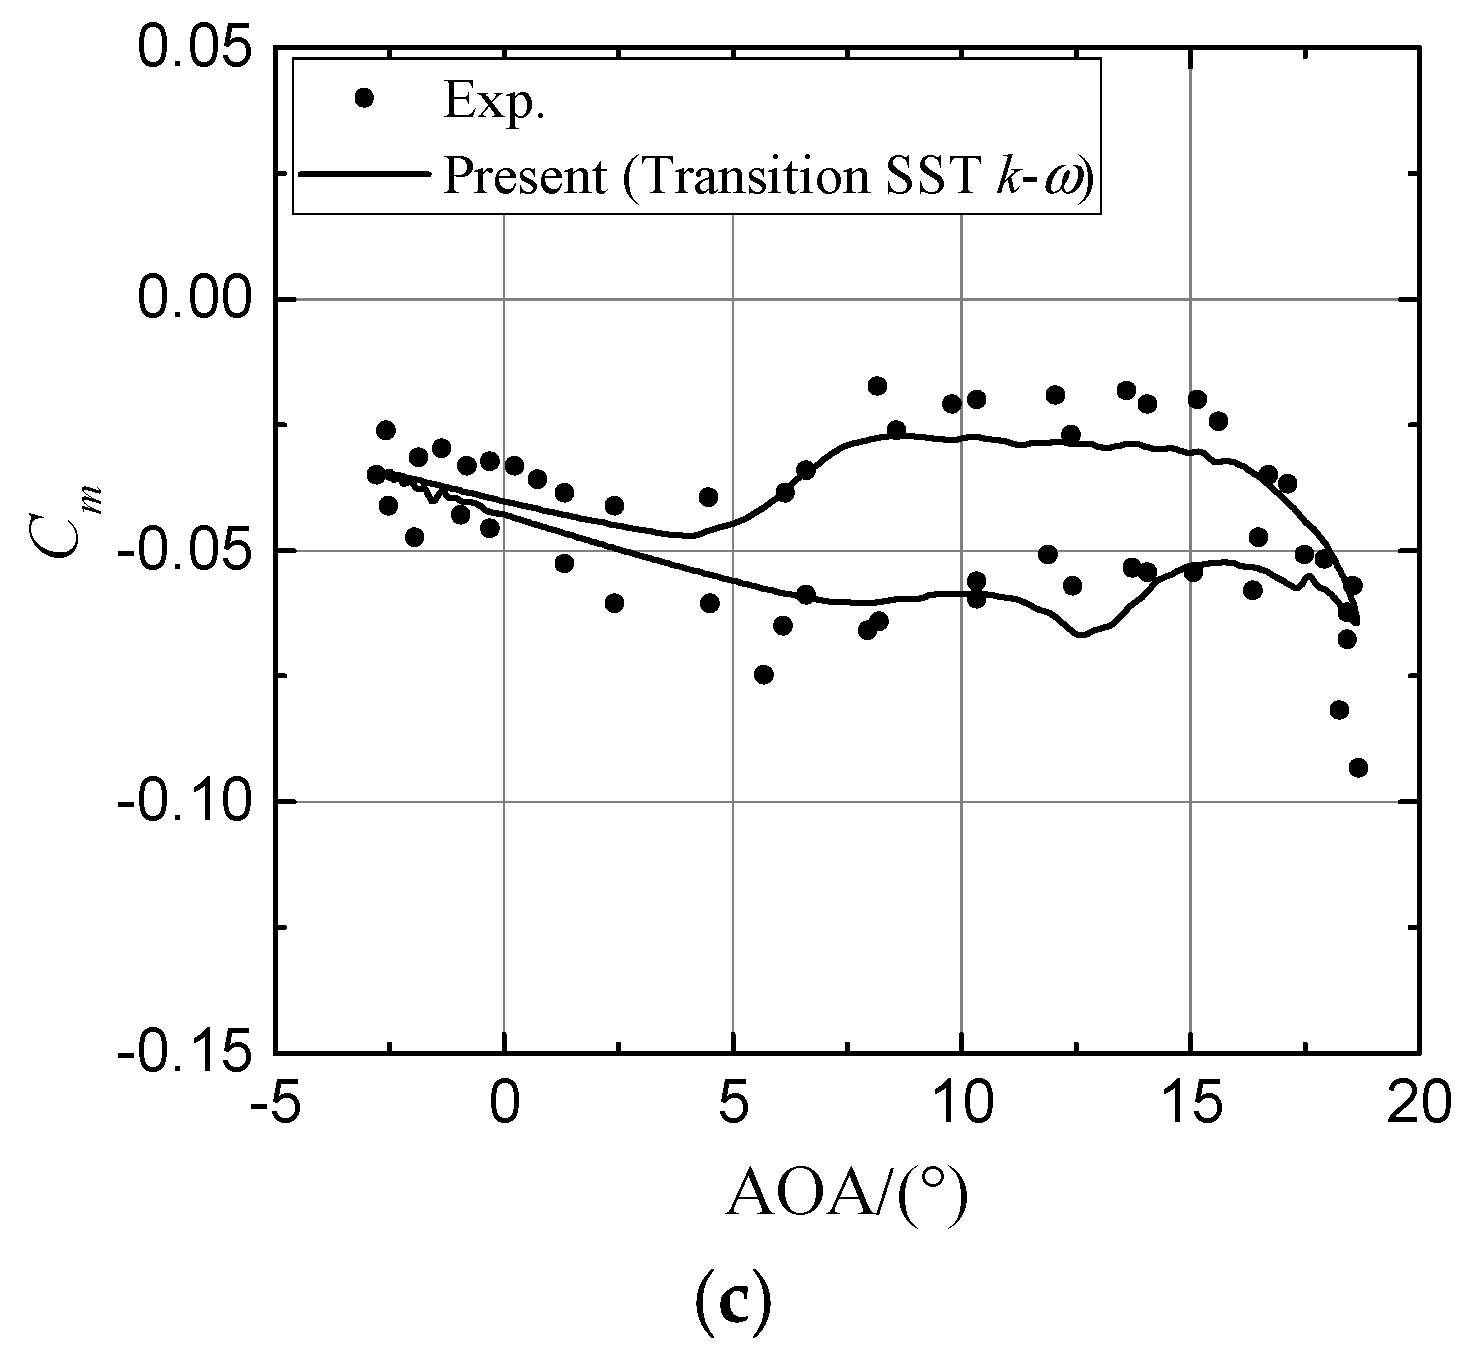
The aerodynamic coefficients in the light and deep stall regimes are presented herein. In comparison with the results of Karbasian et al. [32], present numerical modelling indicates a real improvement due to the consideration of transition effect (Figure 5). In deep stall, a dramatic lift fluctuation occurs when the AOA reaches the maximum and the airfoil begins to pitch down (Figure 6), mainly because the leading-edge vortex sheds and coincides with the secondary trailing-edge vortex during a short period of time [34]. Although the lift coefficient Cl is slightly over-predicted during the flow reattachment, Figure 6 shows a good agreement between the calculated and experimental data, particularly during the upstroke process.
3.2. Validation and Effect of Vortex Generators on the Steady Airfoil Flow
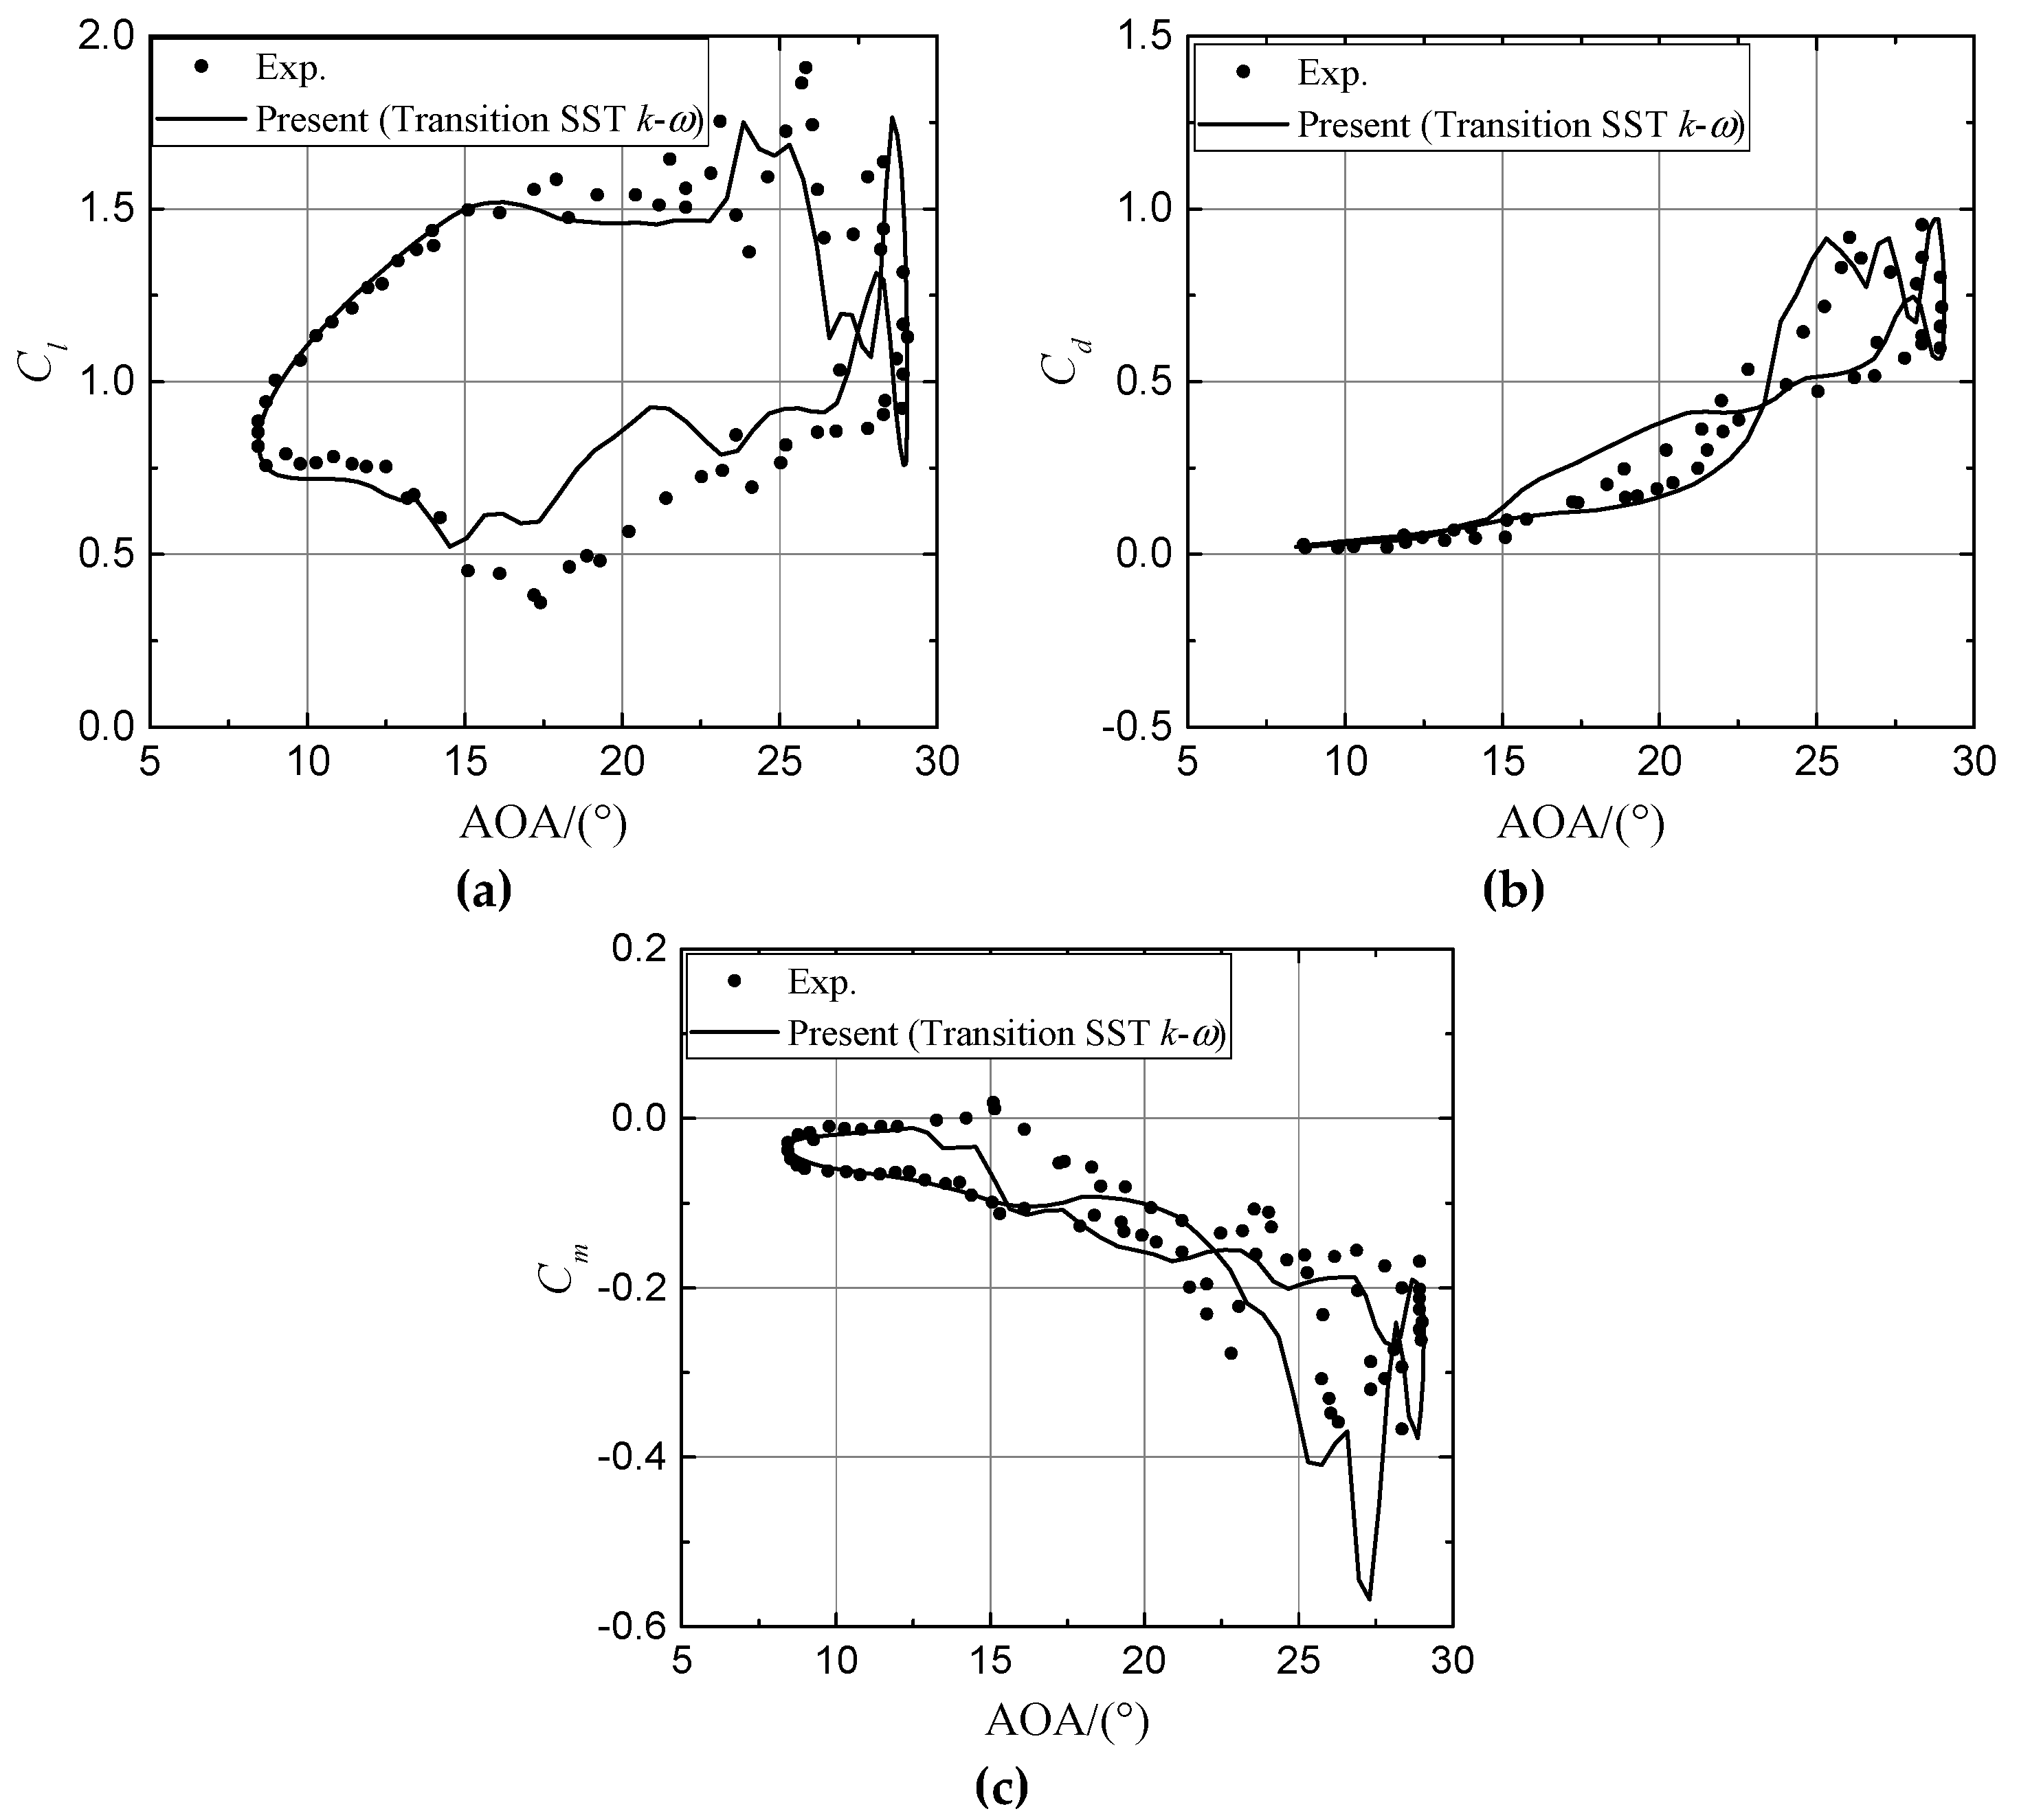
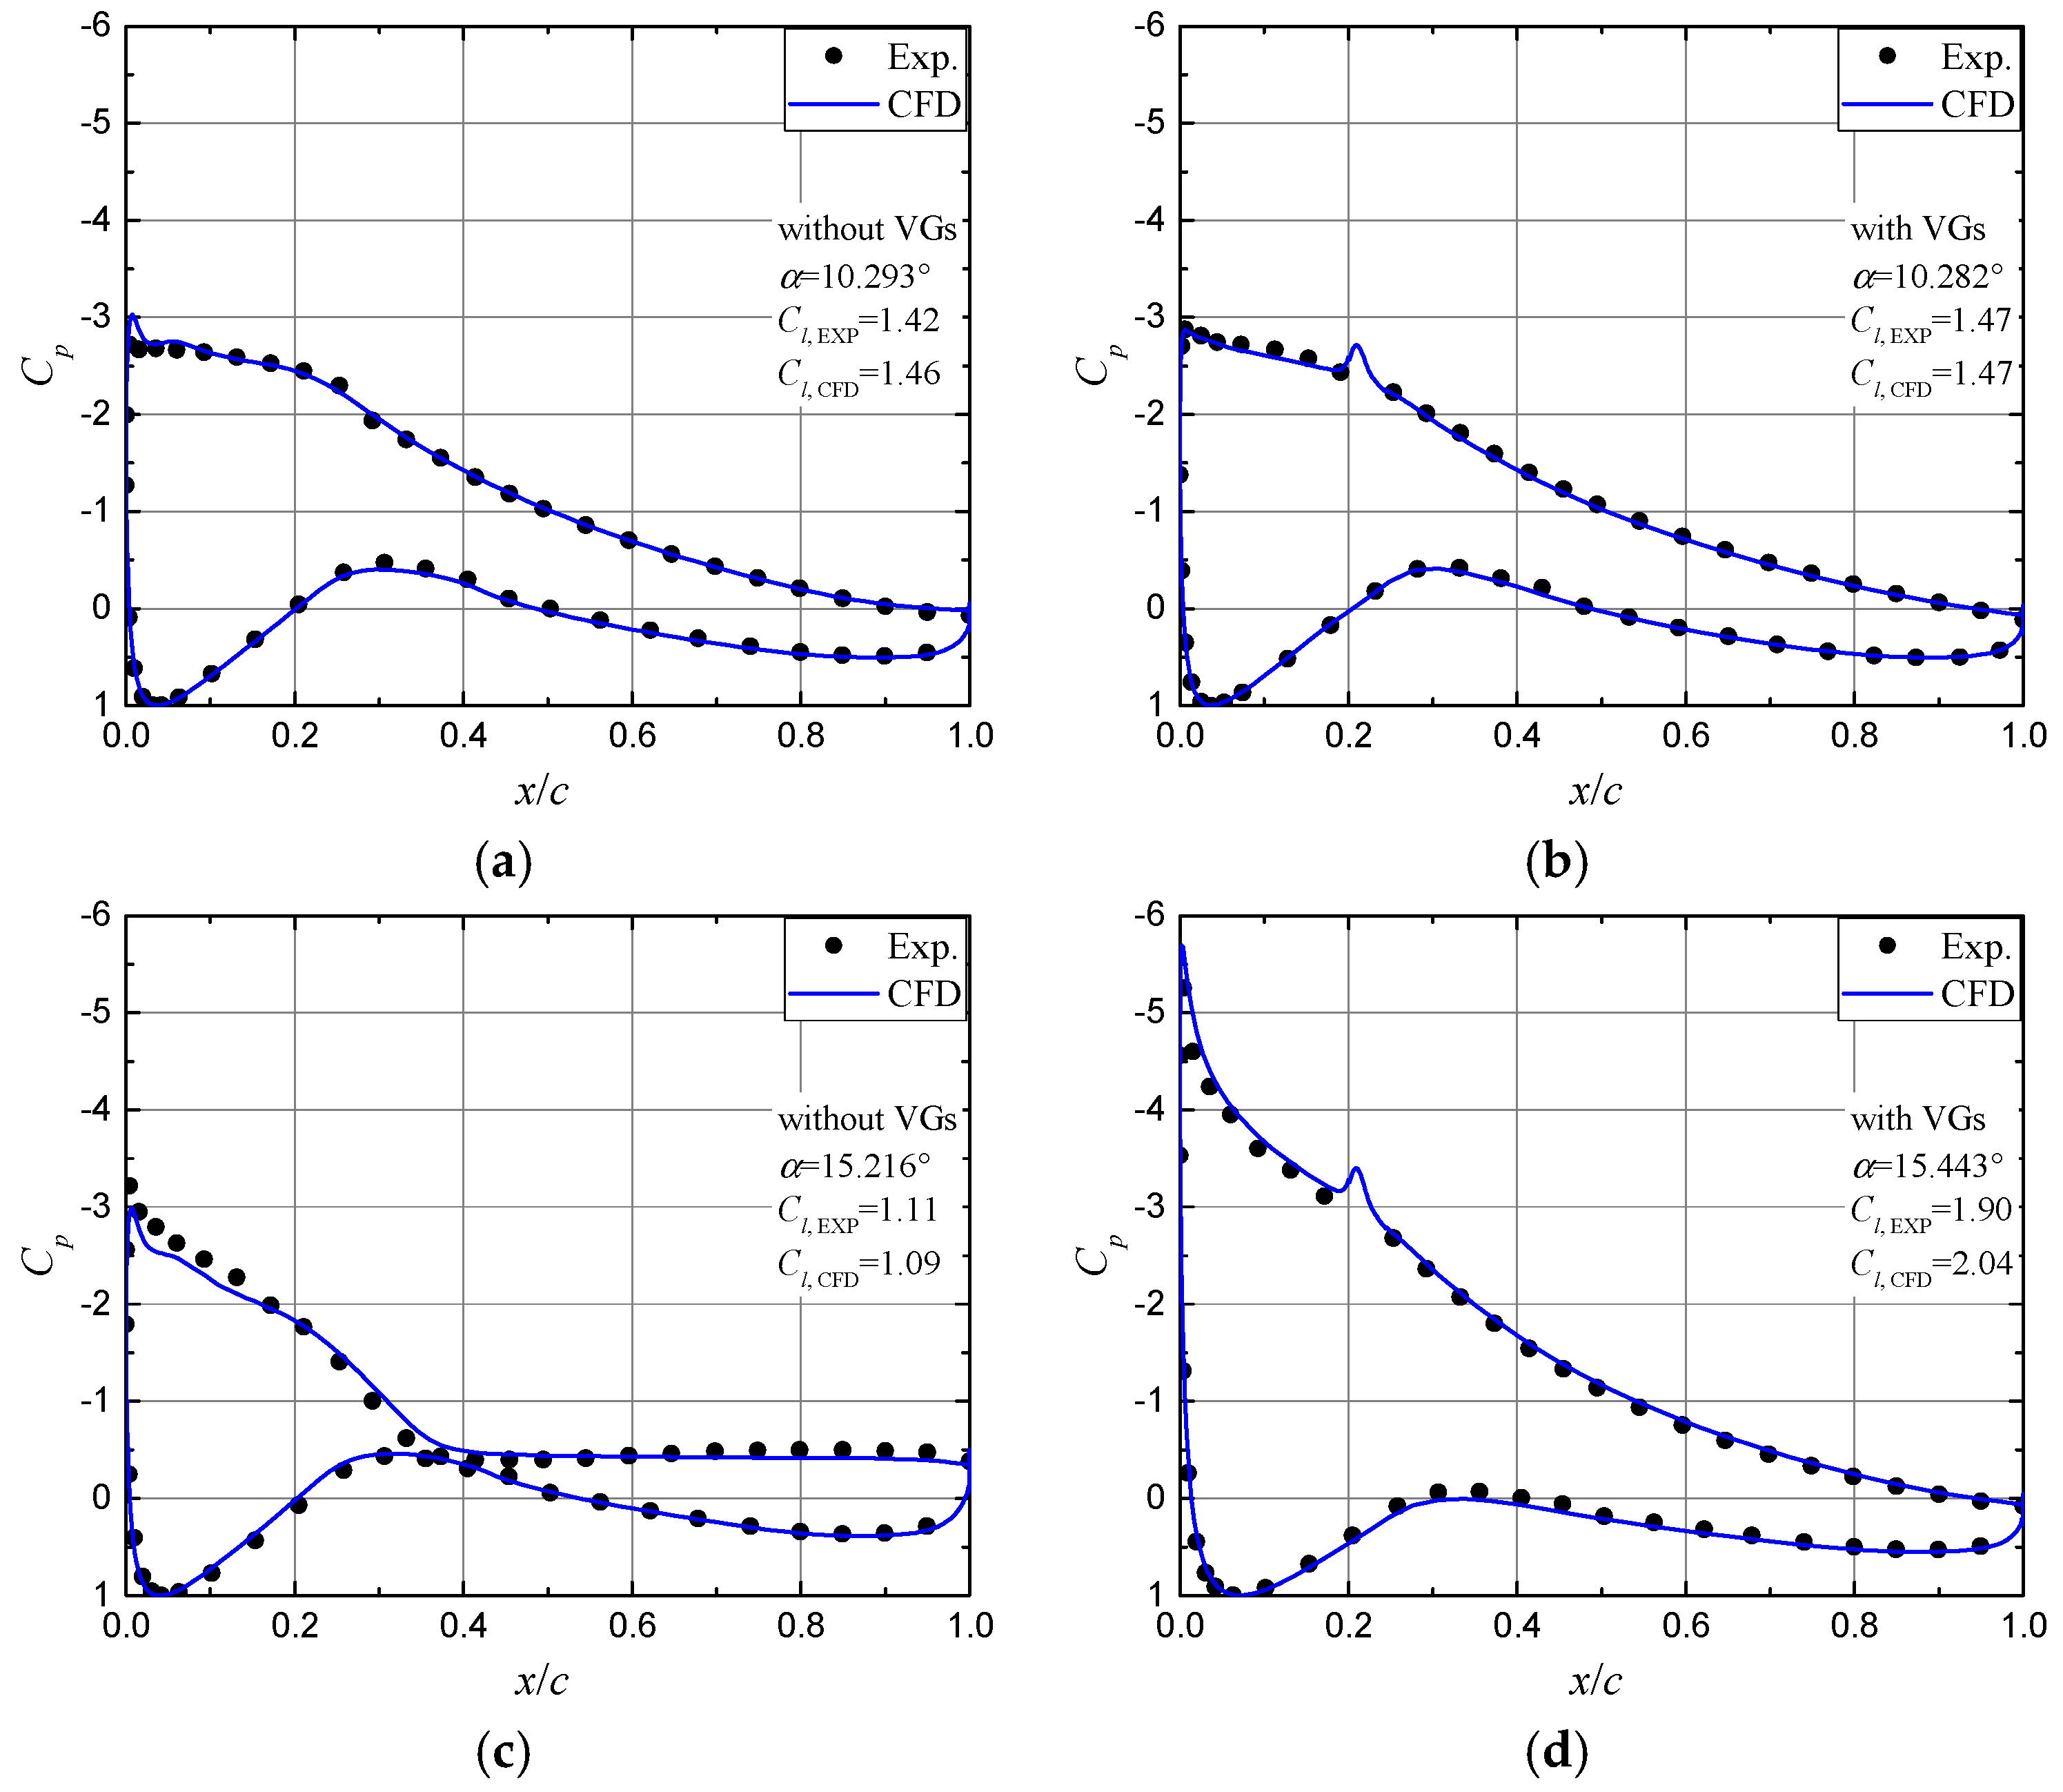
Figure 7 shows the pressure distributions of the DU97-W-300 airfoil with and without the baseline VGs. The calculated pressure distribution is extracted along the centerline of a pair of VGs. Notice that an apparent difference between the calculated and experimental data lies in the suction-side pressure distribution around the VG location, xVG/c = 20%. The slight suction peak around xVG is interpreted by the disruption induced by the VG vanes [11,16]. One can find the discrepancy in calculated and experimental Cl below 2% for the uncontrolled airfoil flow. Although the Cl value of the airfoil with VGs is slightly over-predicted at α = 15.443°, the obtained pressure distributions generally agree with the experimental data, implying that the numerical modelling of airfoil flow is entirely reasonable.
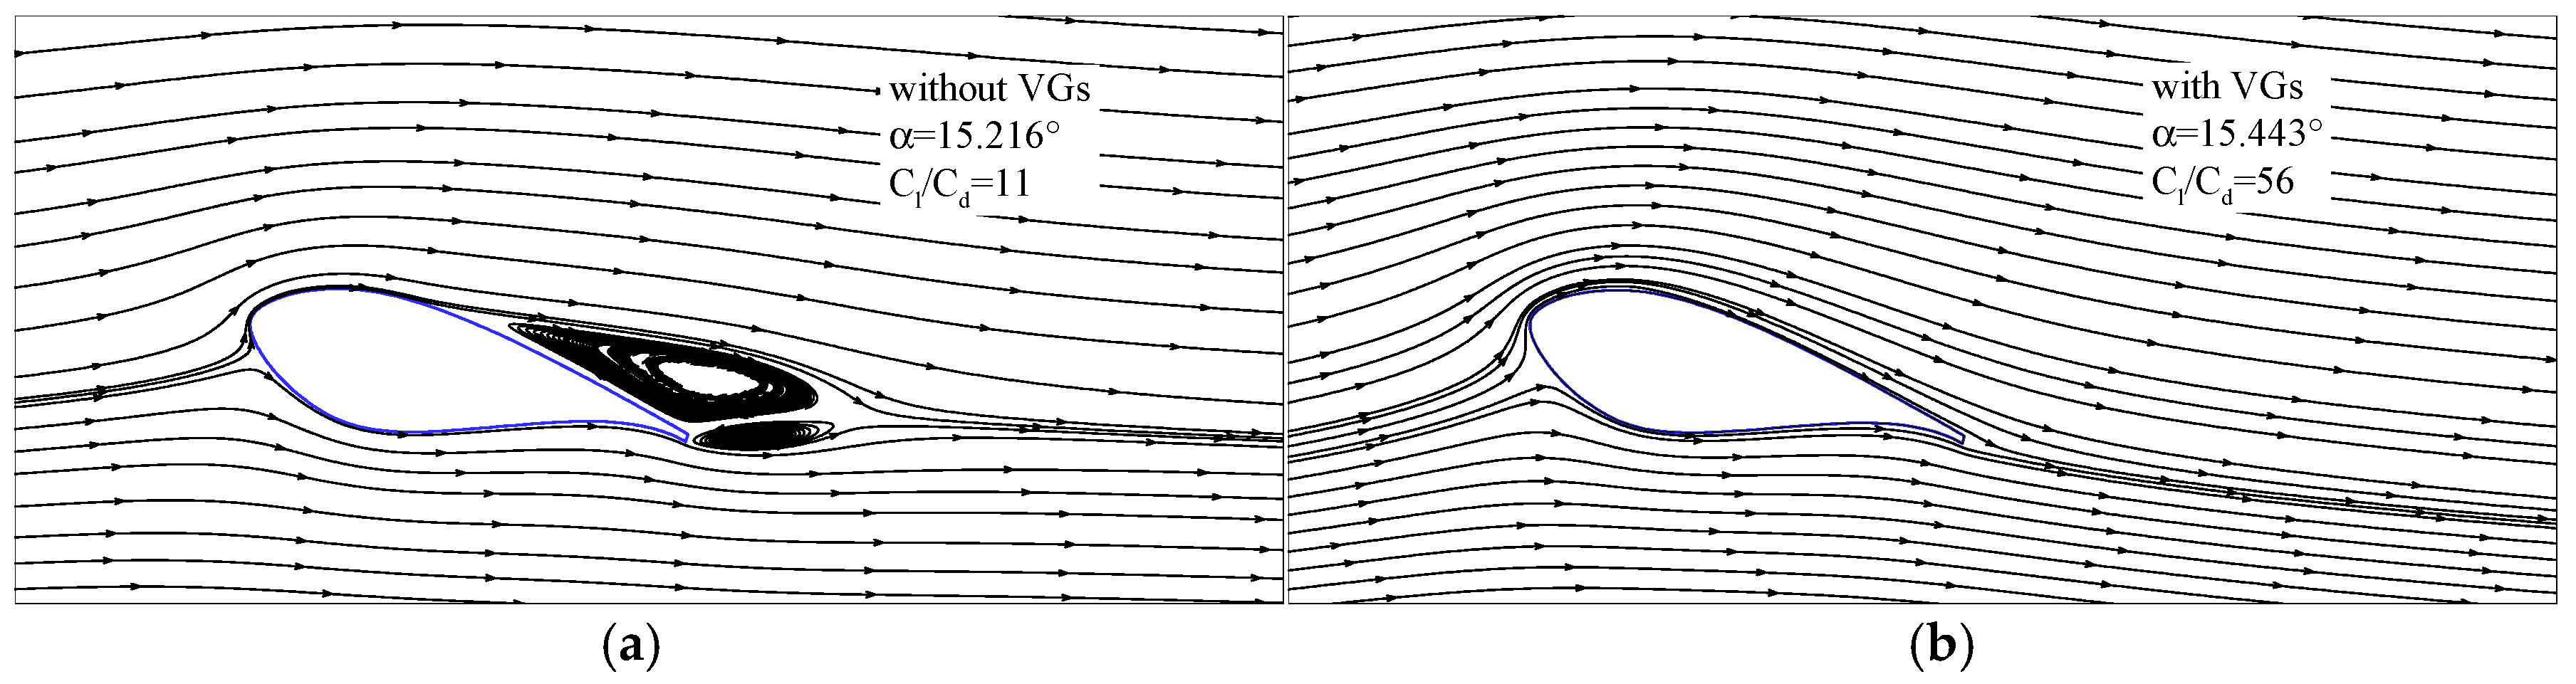
At the low AOA, Figure 7a,b show the almost identical pressure distributions, implying that the flow is fully attached. Nevertheless, the aerodynamic efficiency Cl/Cd drops from 90 (for the uncontrolled flow) to 65 (for the controlled flow), because the existence of VGs increases the parasitic drag, particularly the parts of spoiler-type drag and skin friction drag. At the high AOA, although the uncontrolled flow falls into a noticeable trailing-edge separation (Figure 7c), the controlled flow with VGs has a sharp leading-edge suction peak and no flow separation (Figure 7d), and then the Cl is dramatically increased by 71.2%. Figure 8 indicates that the flow separation is highly suppressed by VGs. As the pressure drag, the dominant part of parasitic drag at a high AOA, is greatly reduced, and the aerodynamic efficiency of the airfoil is effectively elevated by VGs from 11 to 56.
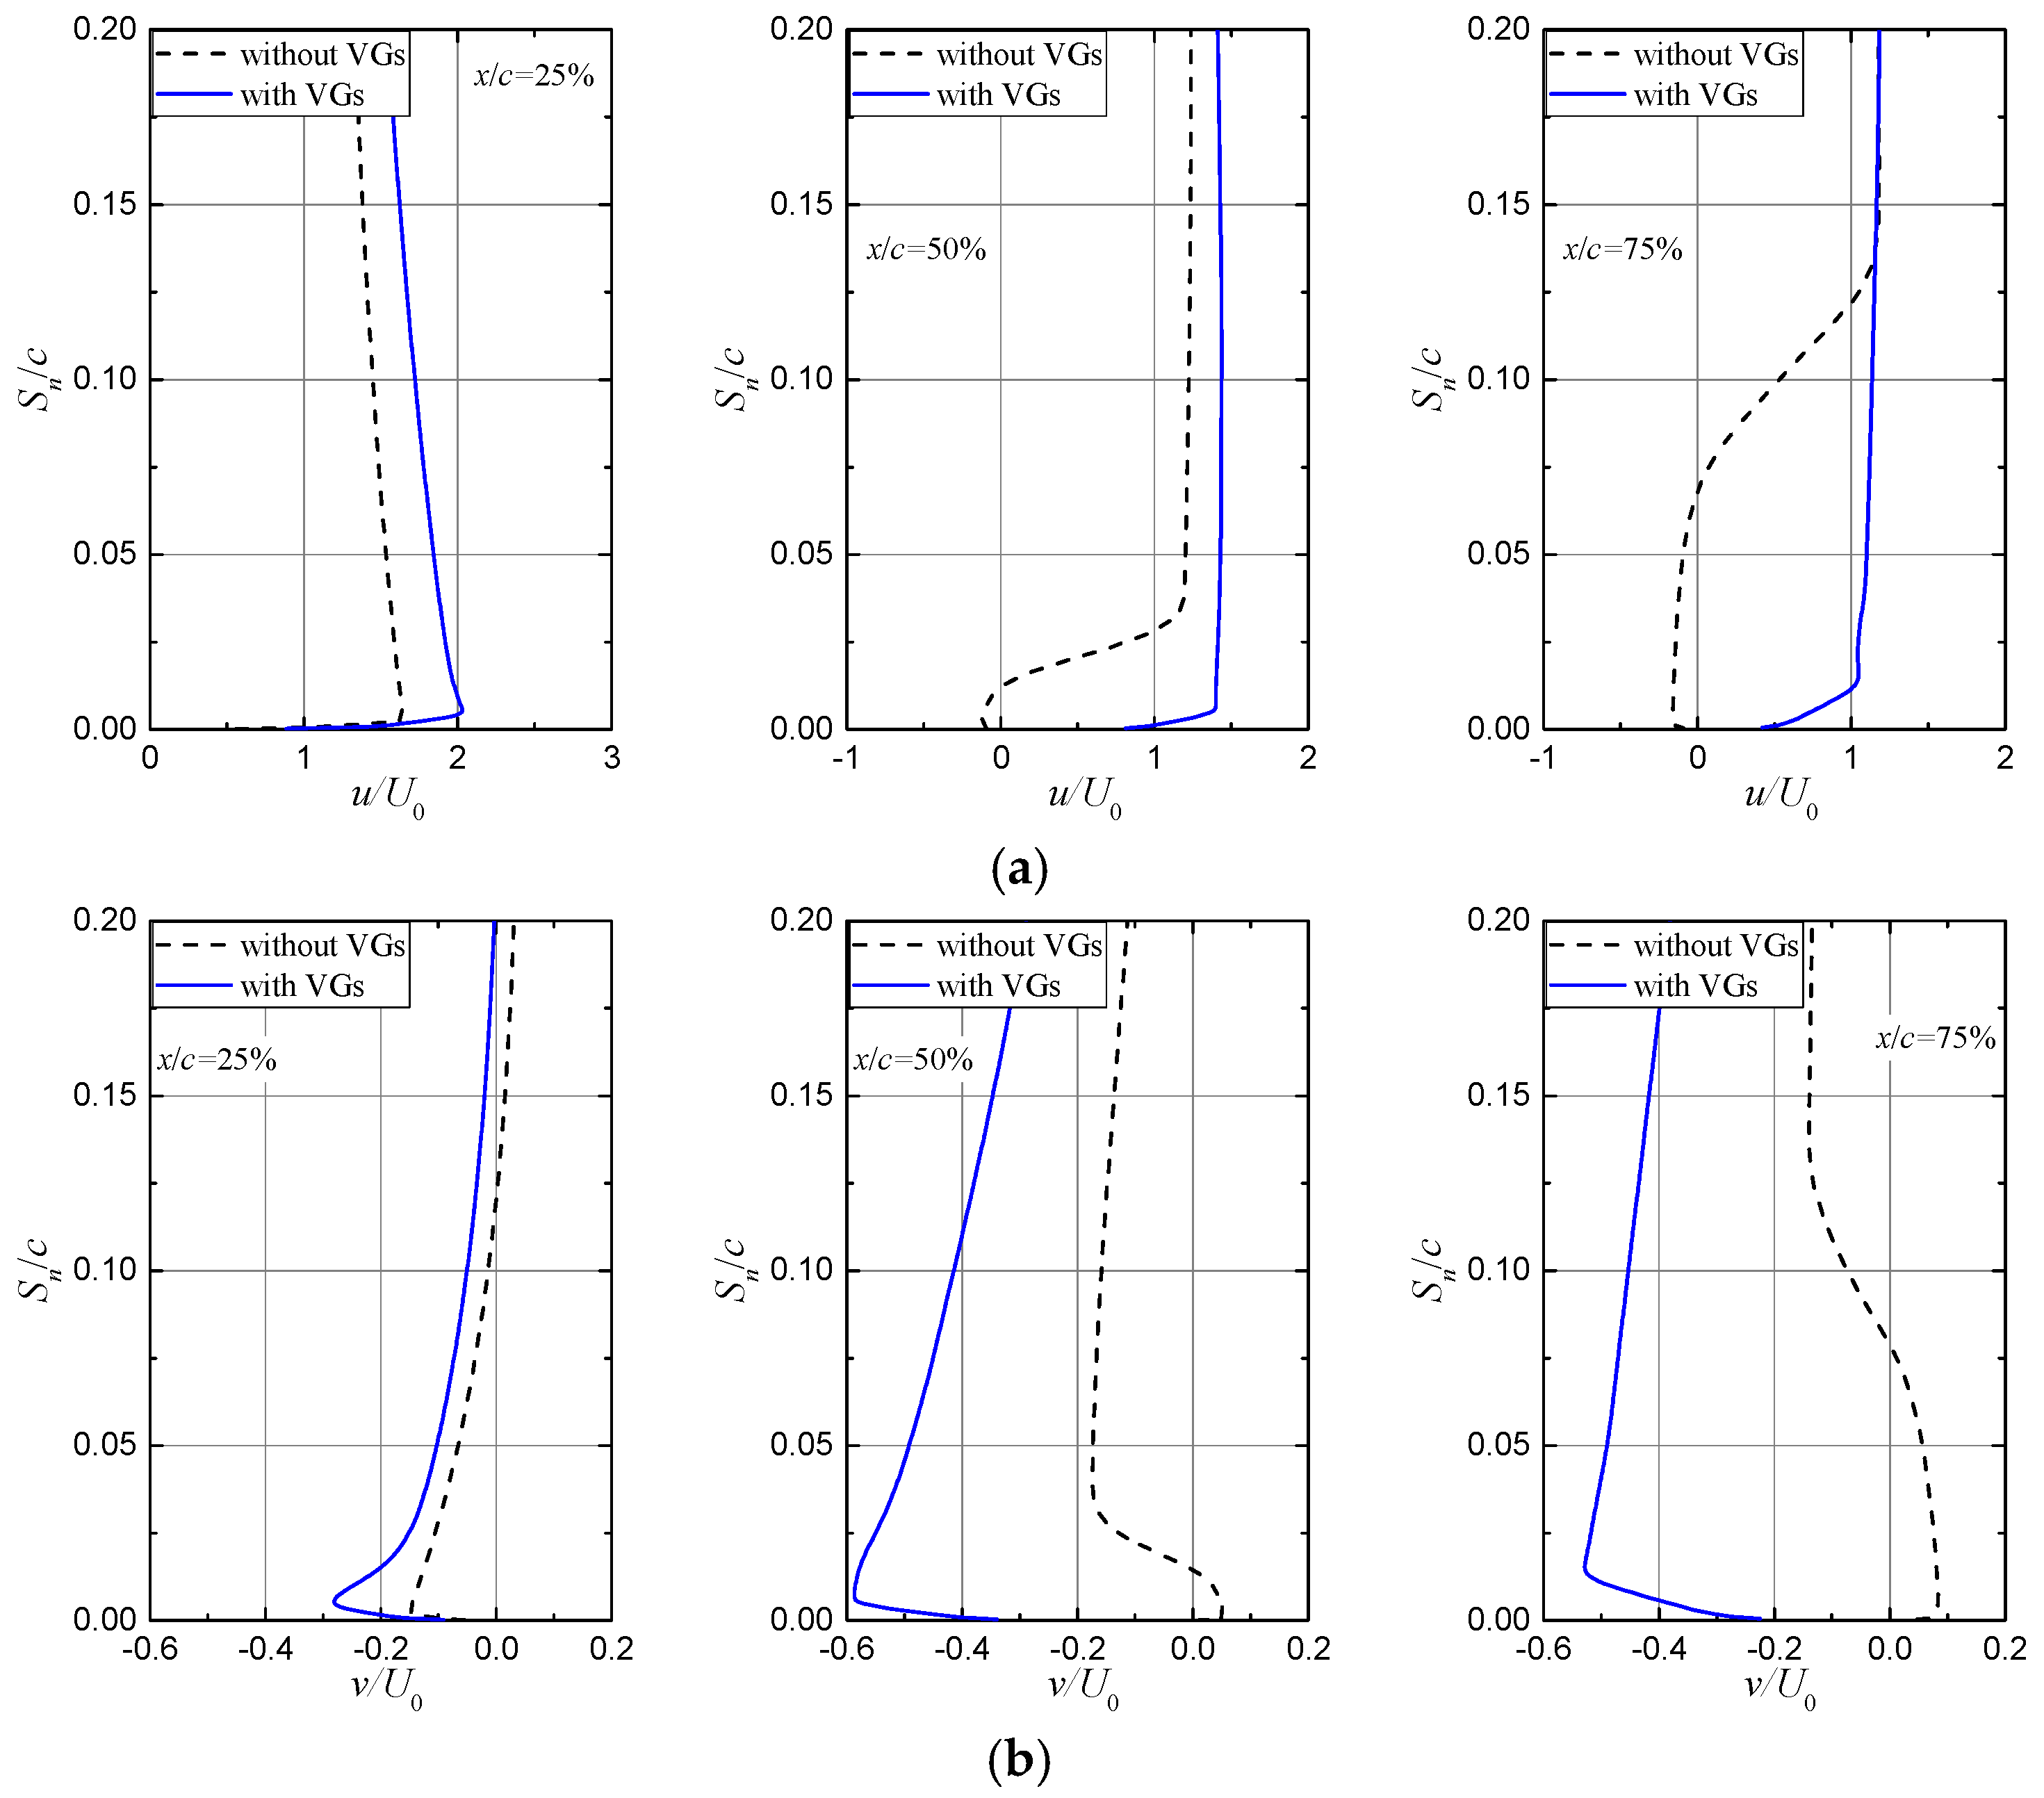
Figure 9 shows the normalized streamwise and normal velocity profiles within the boundary layer at different chordwise locations. The development of airfoil boundary layer agrees well with the PIV measurements on a cylindrical bump with and without VGs [14]. The controlled airfoil flow behaves as expected, in the sense that the downwash due to VGs increases the momentum transport between the external flow and the near-wall flow (Figure 9b), making the boundary layer more resistant to the adverse pressure gradient with respect to the flow detachment from the wall surface (Figure 9a).
3.3. Effect of Vortex Generators on the Unsteady Airfoil Flow under Pitch Oscillations
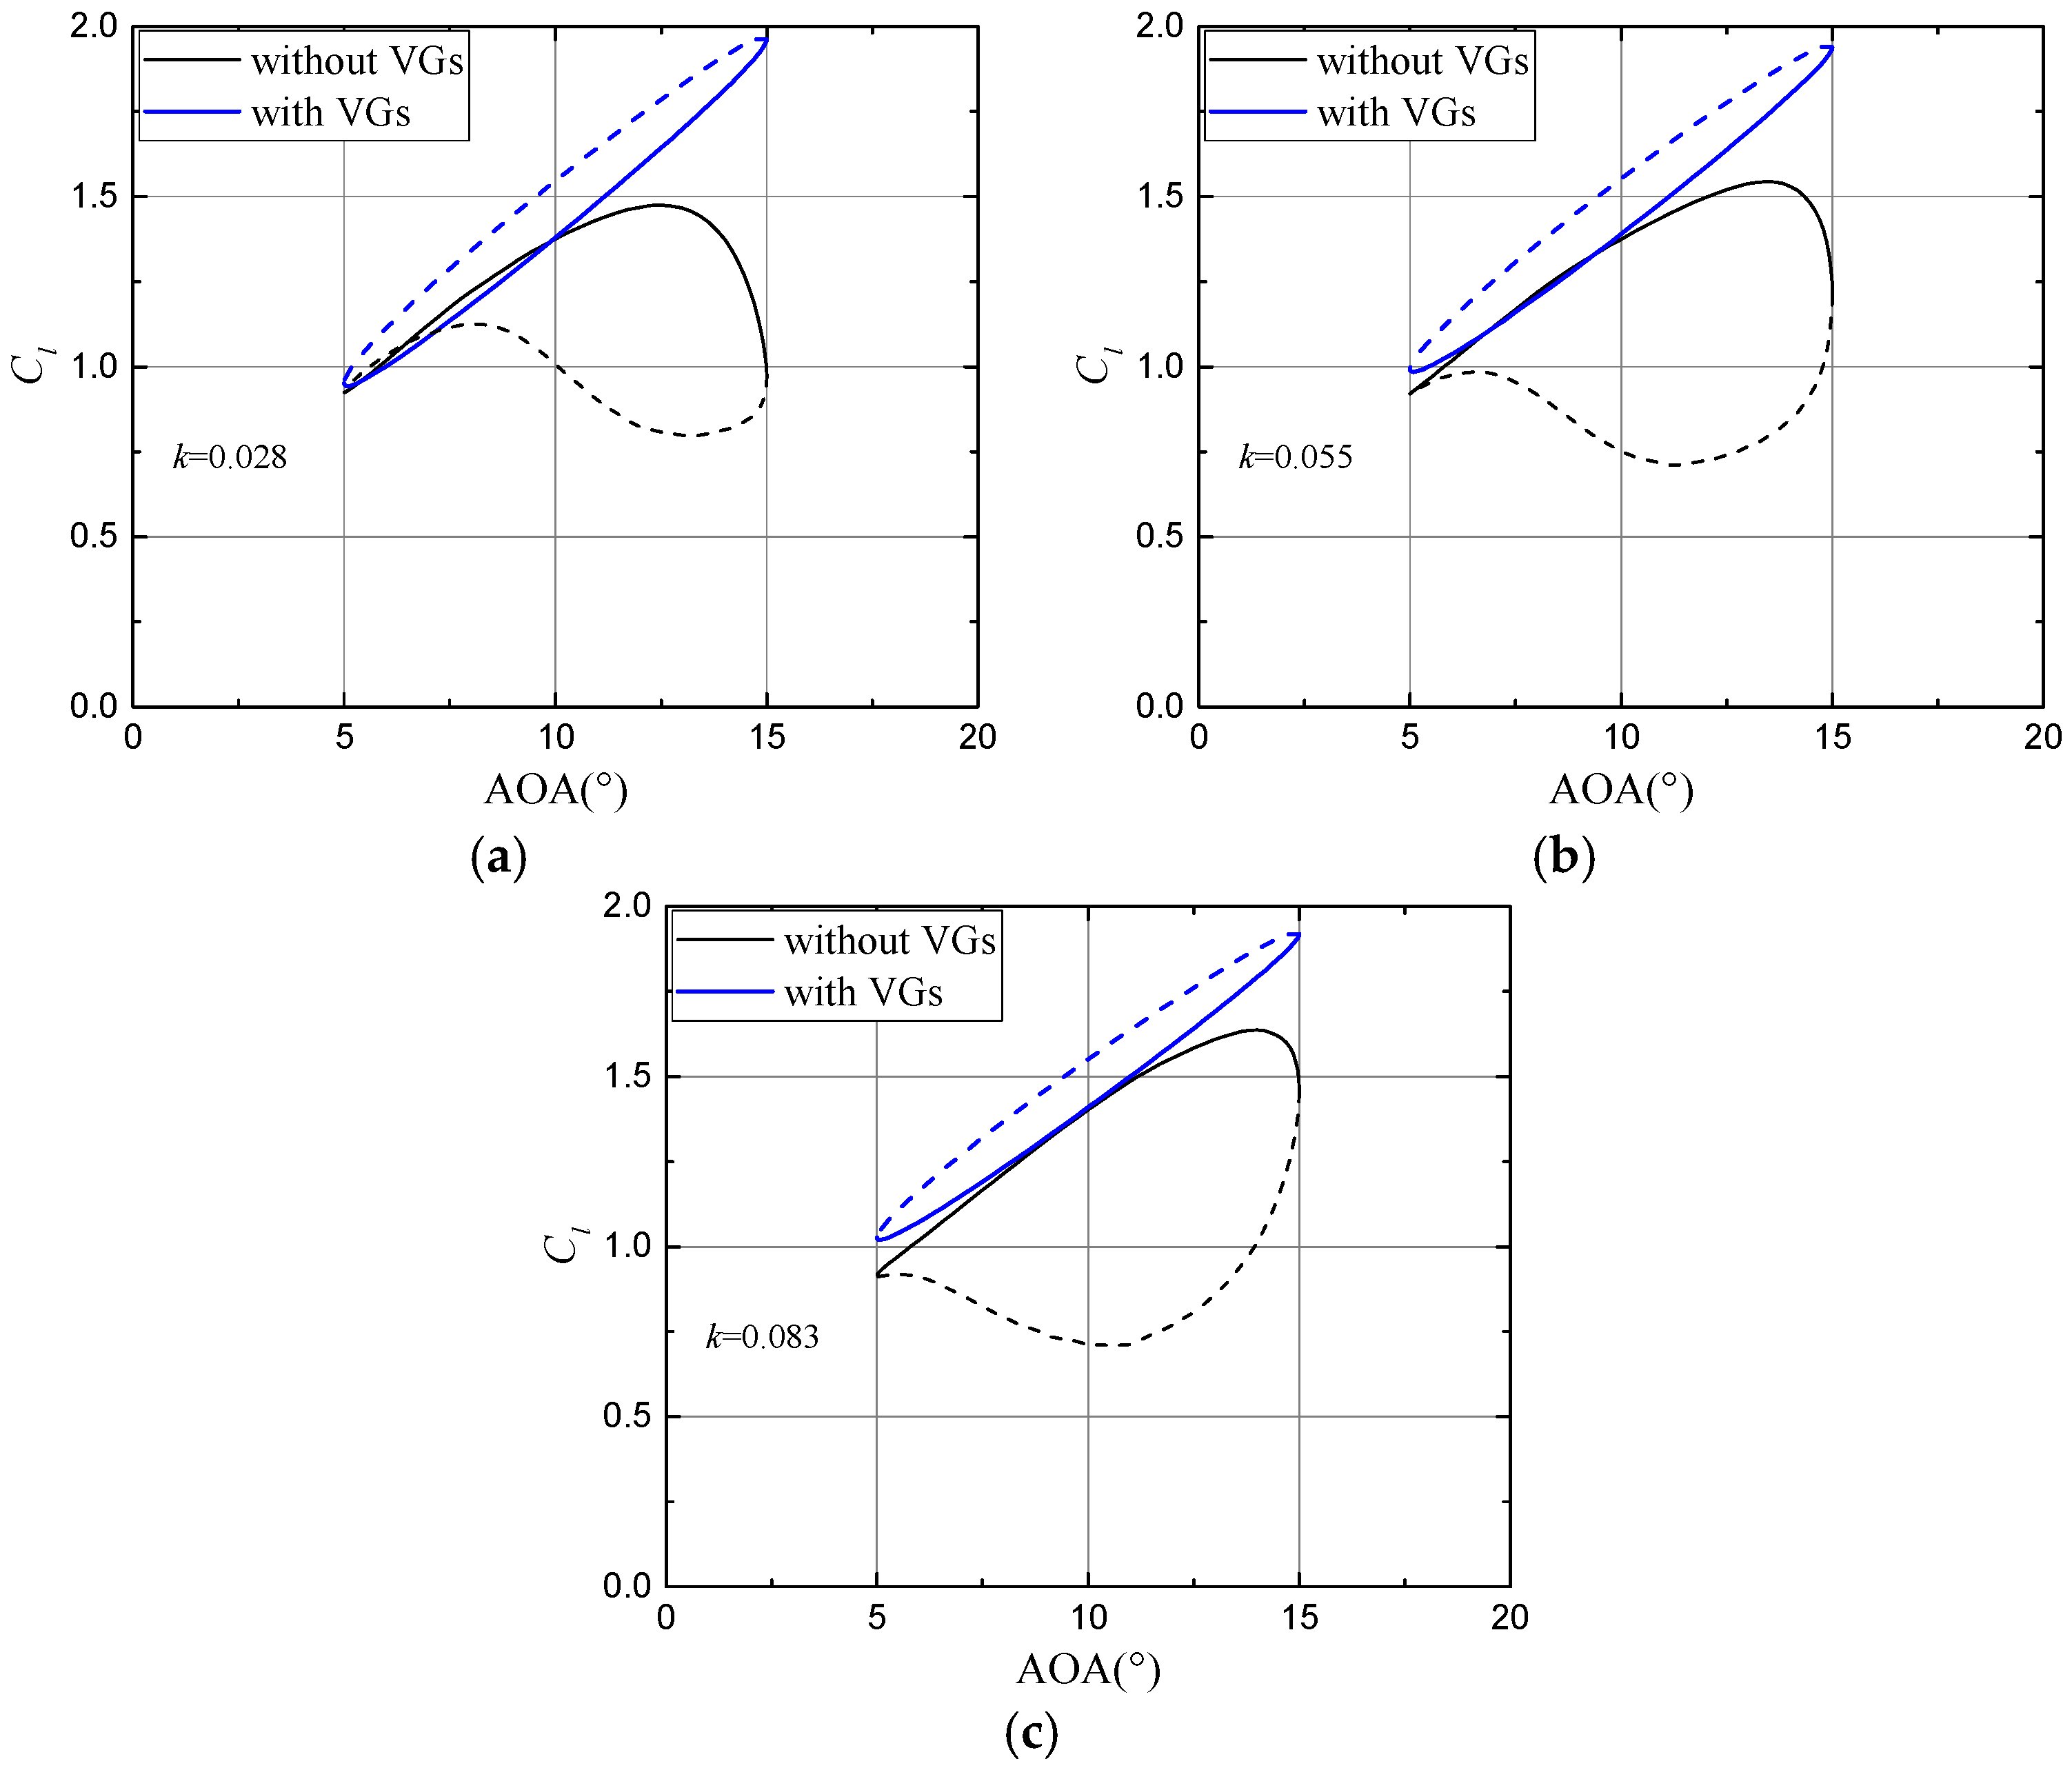
Figure 10 shows the Cl hysteresis loop of the airfoil with and without the baseline VGs under different extent of unsteadiness. Although the uncontrolled flow falls into deep stall regime with the flow reattachment greatly delayed, the controlled flow with VGs is still attached, and the Cl generally follows the unsteady linear theory. One can observe that increasing reduced frequency manifests the aerodynamic hysteresis of uncontrolled airfoil flow, which is typical of trailing-edge stalling airfoils [18,19]. It is interesting to note is that the controlled flow shows an indiscernible impact of the reduced frequency, likely because the unsteady linear aerodynamic responses have relatively low sensitivity to the frequency of motion.
The Cl hysteresis intensity is measured by:
The highly flattened hysteresis loops indicate that VGs can favorably control the dynamic stall. Table 3 illustrates the decrease of 60% to 80% in hysteresis intensity due to the existence of VGs. This observation demonstrates a real potential for controlling the unsteady loads on the wind turbine blades by means of VGs.
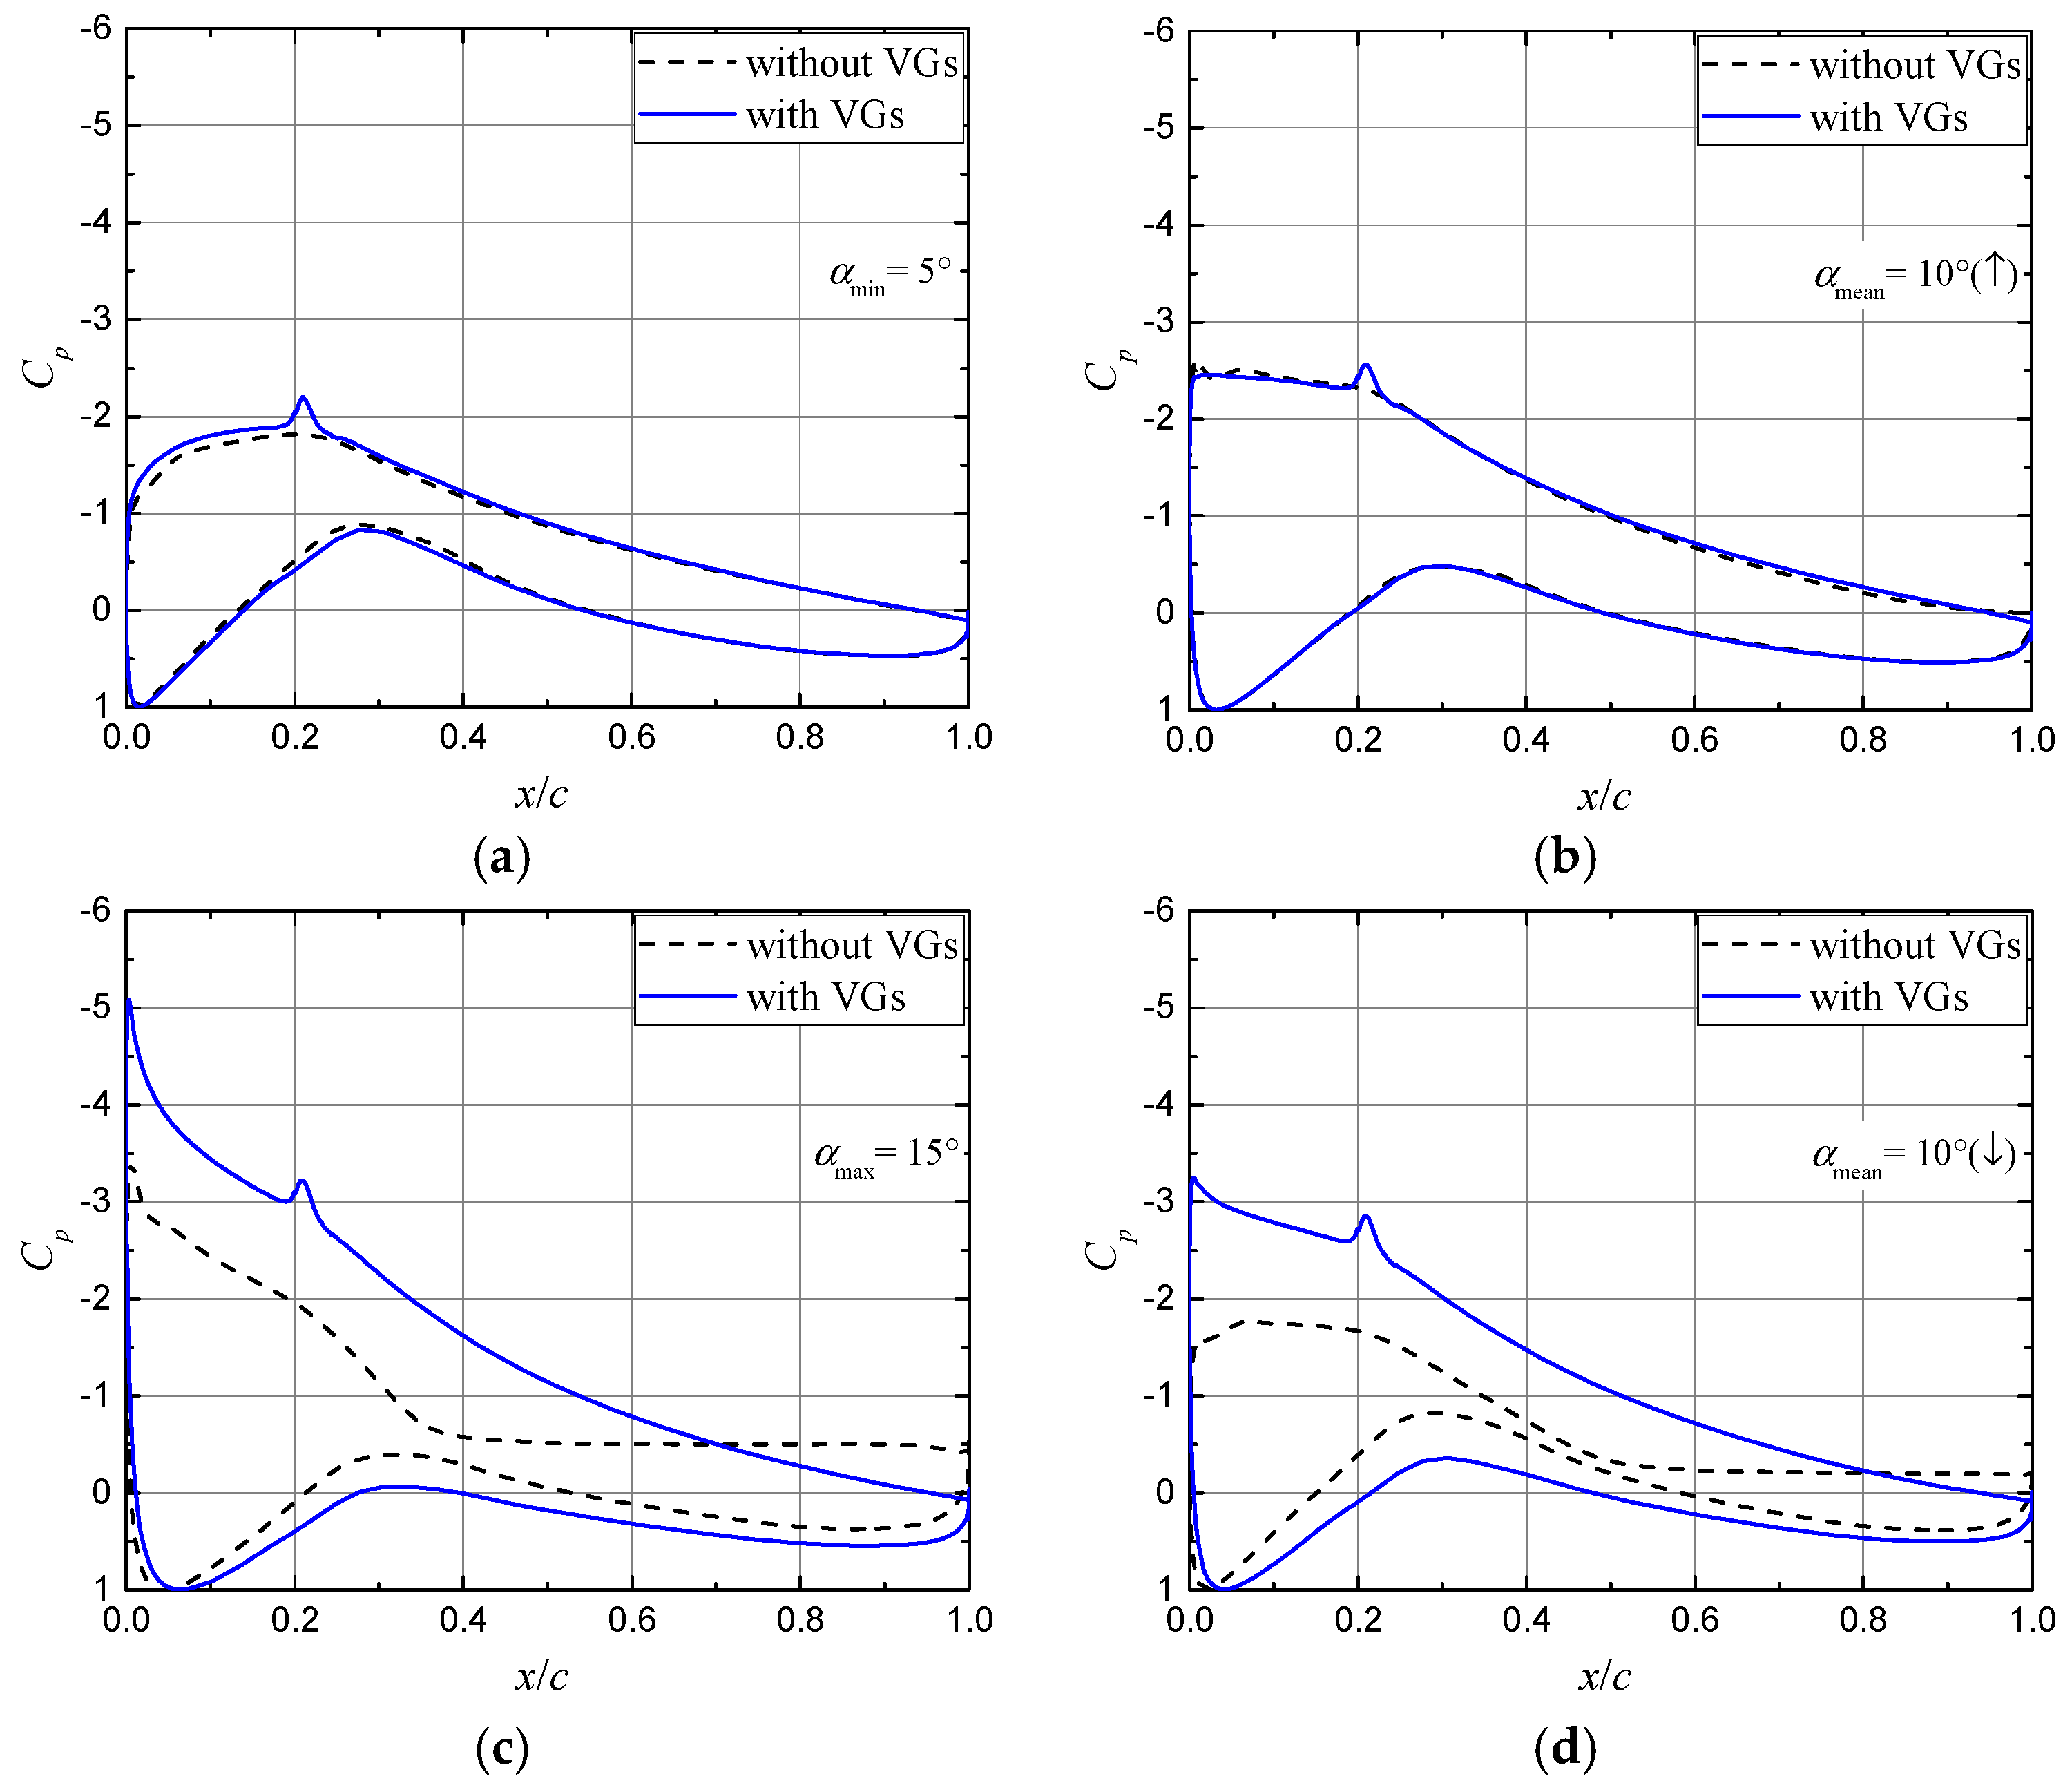
It is noteworthy that the hysteresis loops of Cl with and without VGs are in the opposite direction (Figure 10). Figure 11 shows the unsteady pressure distributions at four typical values of AOA over one pitch-oscillation cycle at k = 0.055. During the upstroke process, VGs can greatly suppress the trailing-edge flow separation at the high AOA, but make a small difference to the pressure distribution at the low AOA, similar to the influence in steady conditions (Figure 7). During the downstroke process, the uncontrolled flow experiences the delayed reattachment of flow separation, with the trailing-edge separation point moving rearward at a low speed (almost from 40% c to 50% c over a quarter period); the controlled pressure distribution at the mean AOA, however, indicates the that the airfoil flow is fully attached (Figure 11d). For the controlled flow, the higher Cl during the downstroke than during the upstroke is attributable to a higher suction over the fore 30% c in comparison between Figure 11b,d.
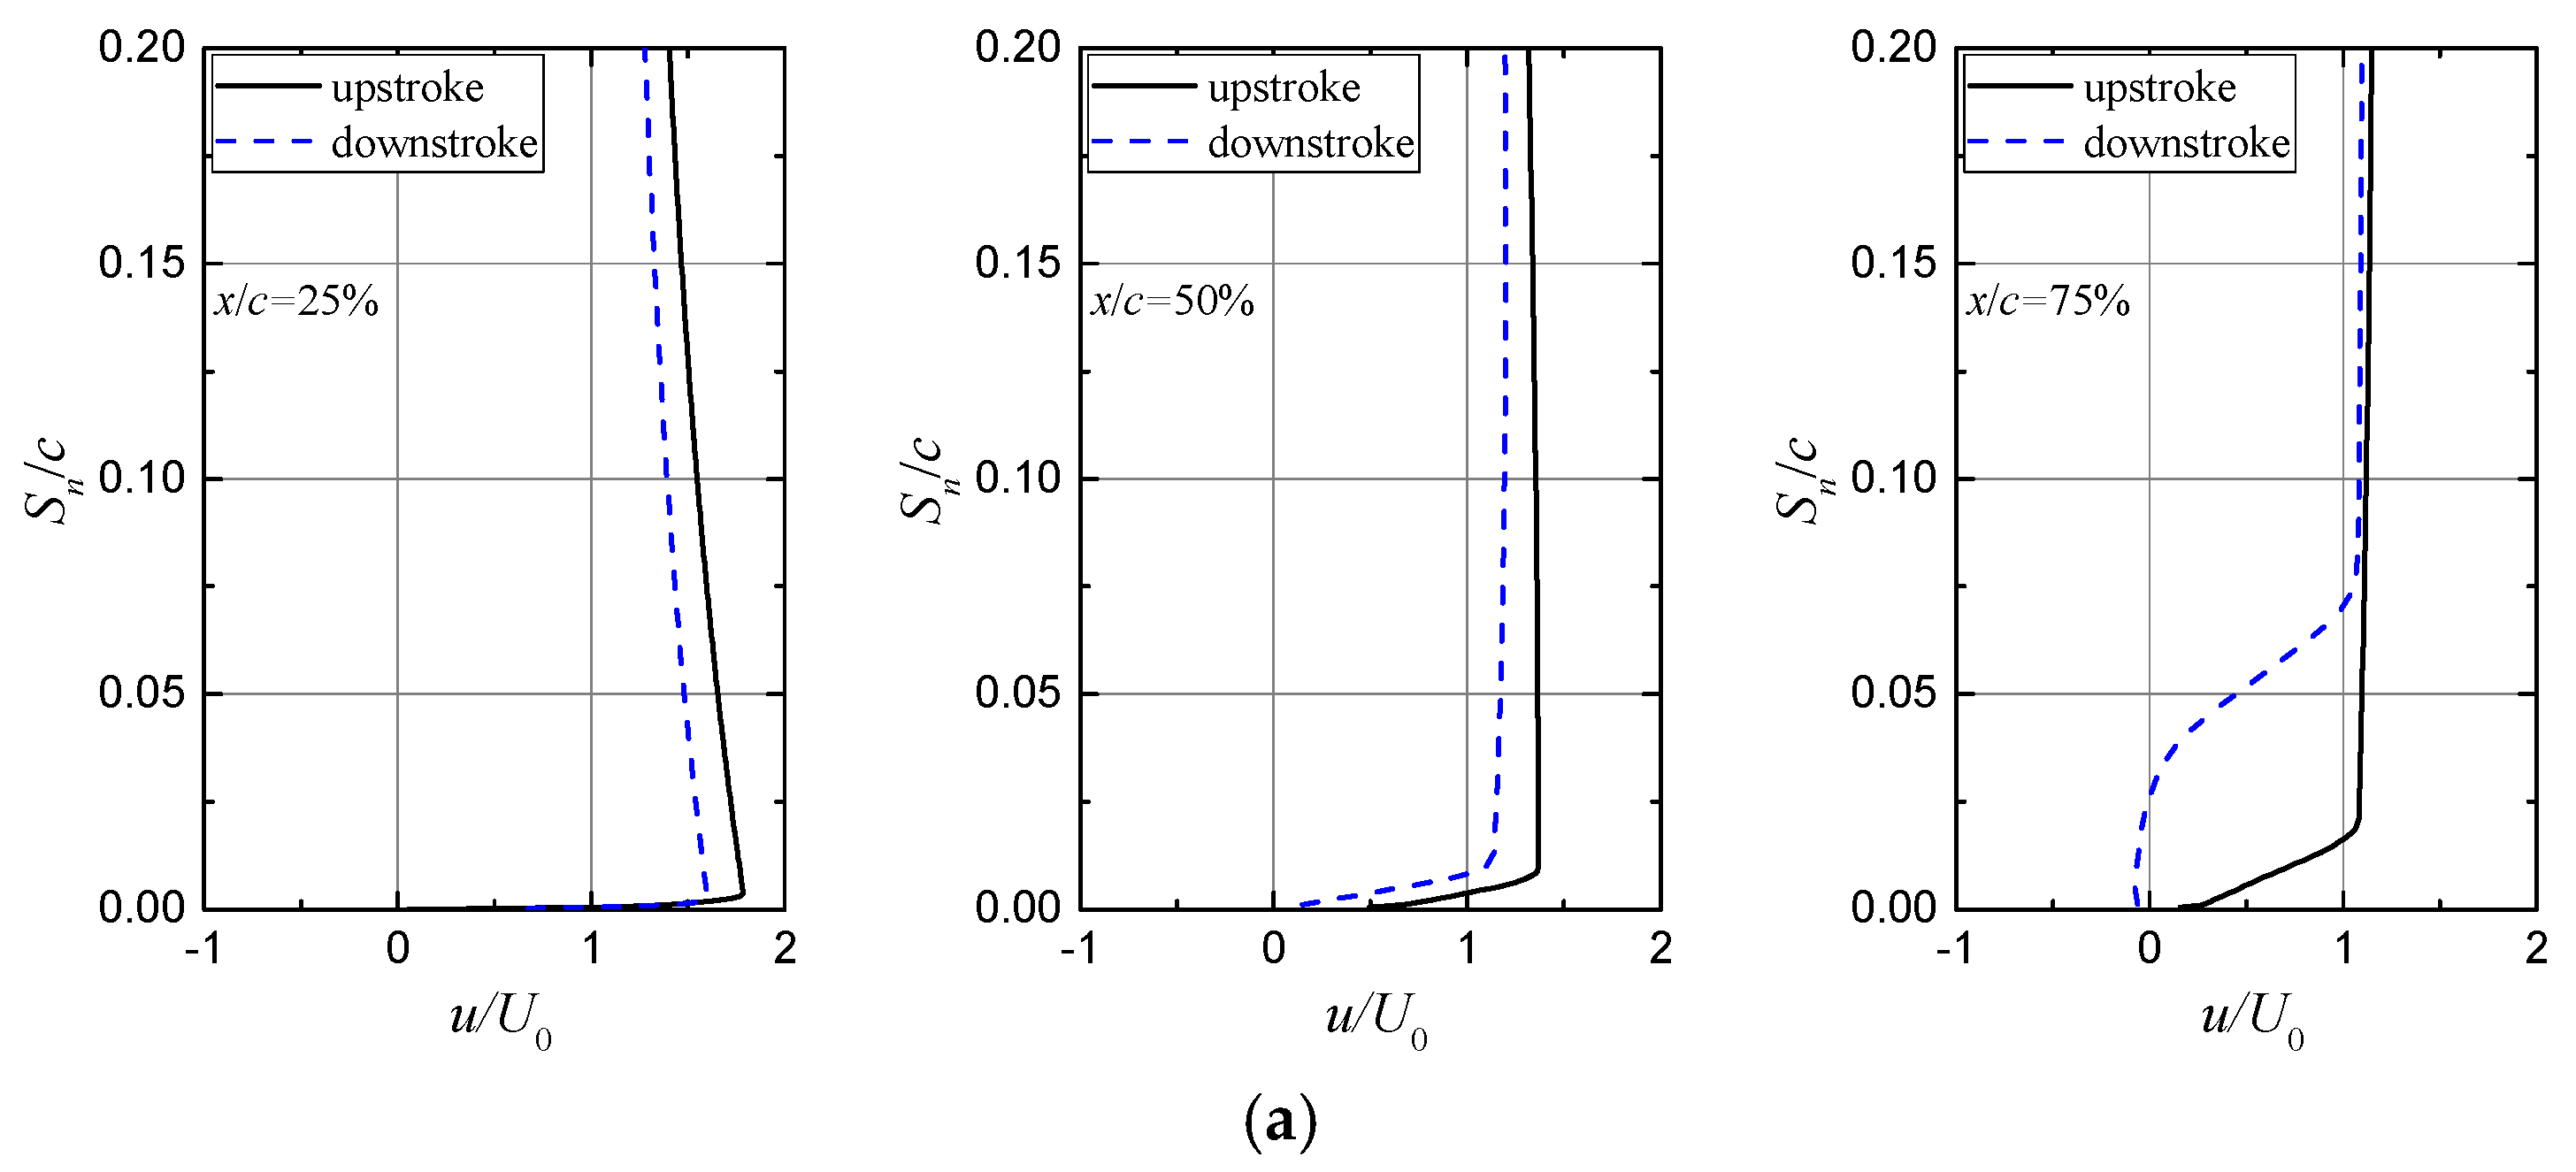
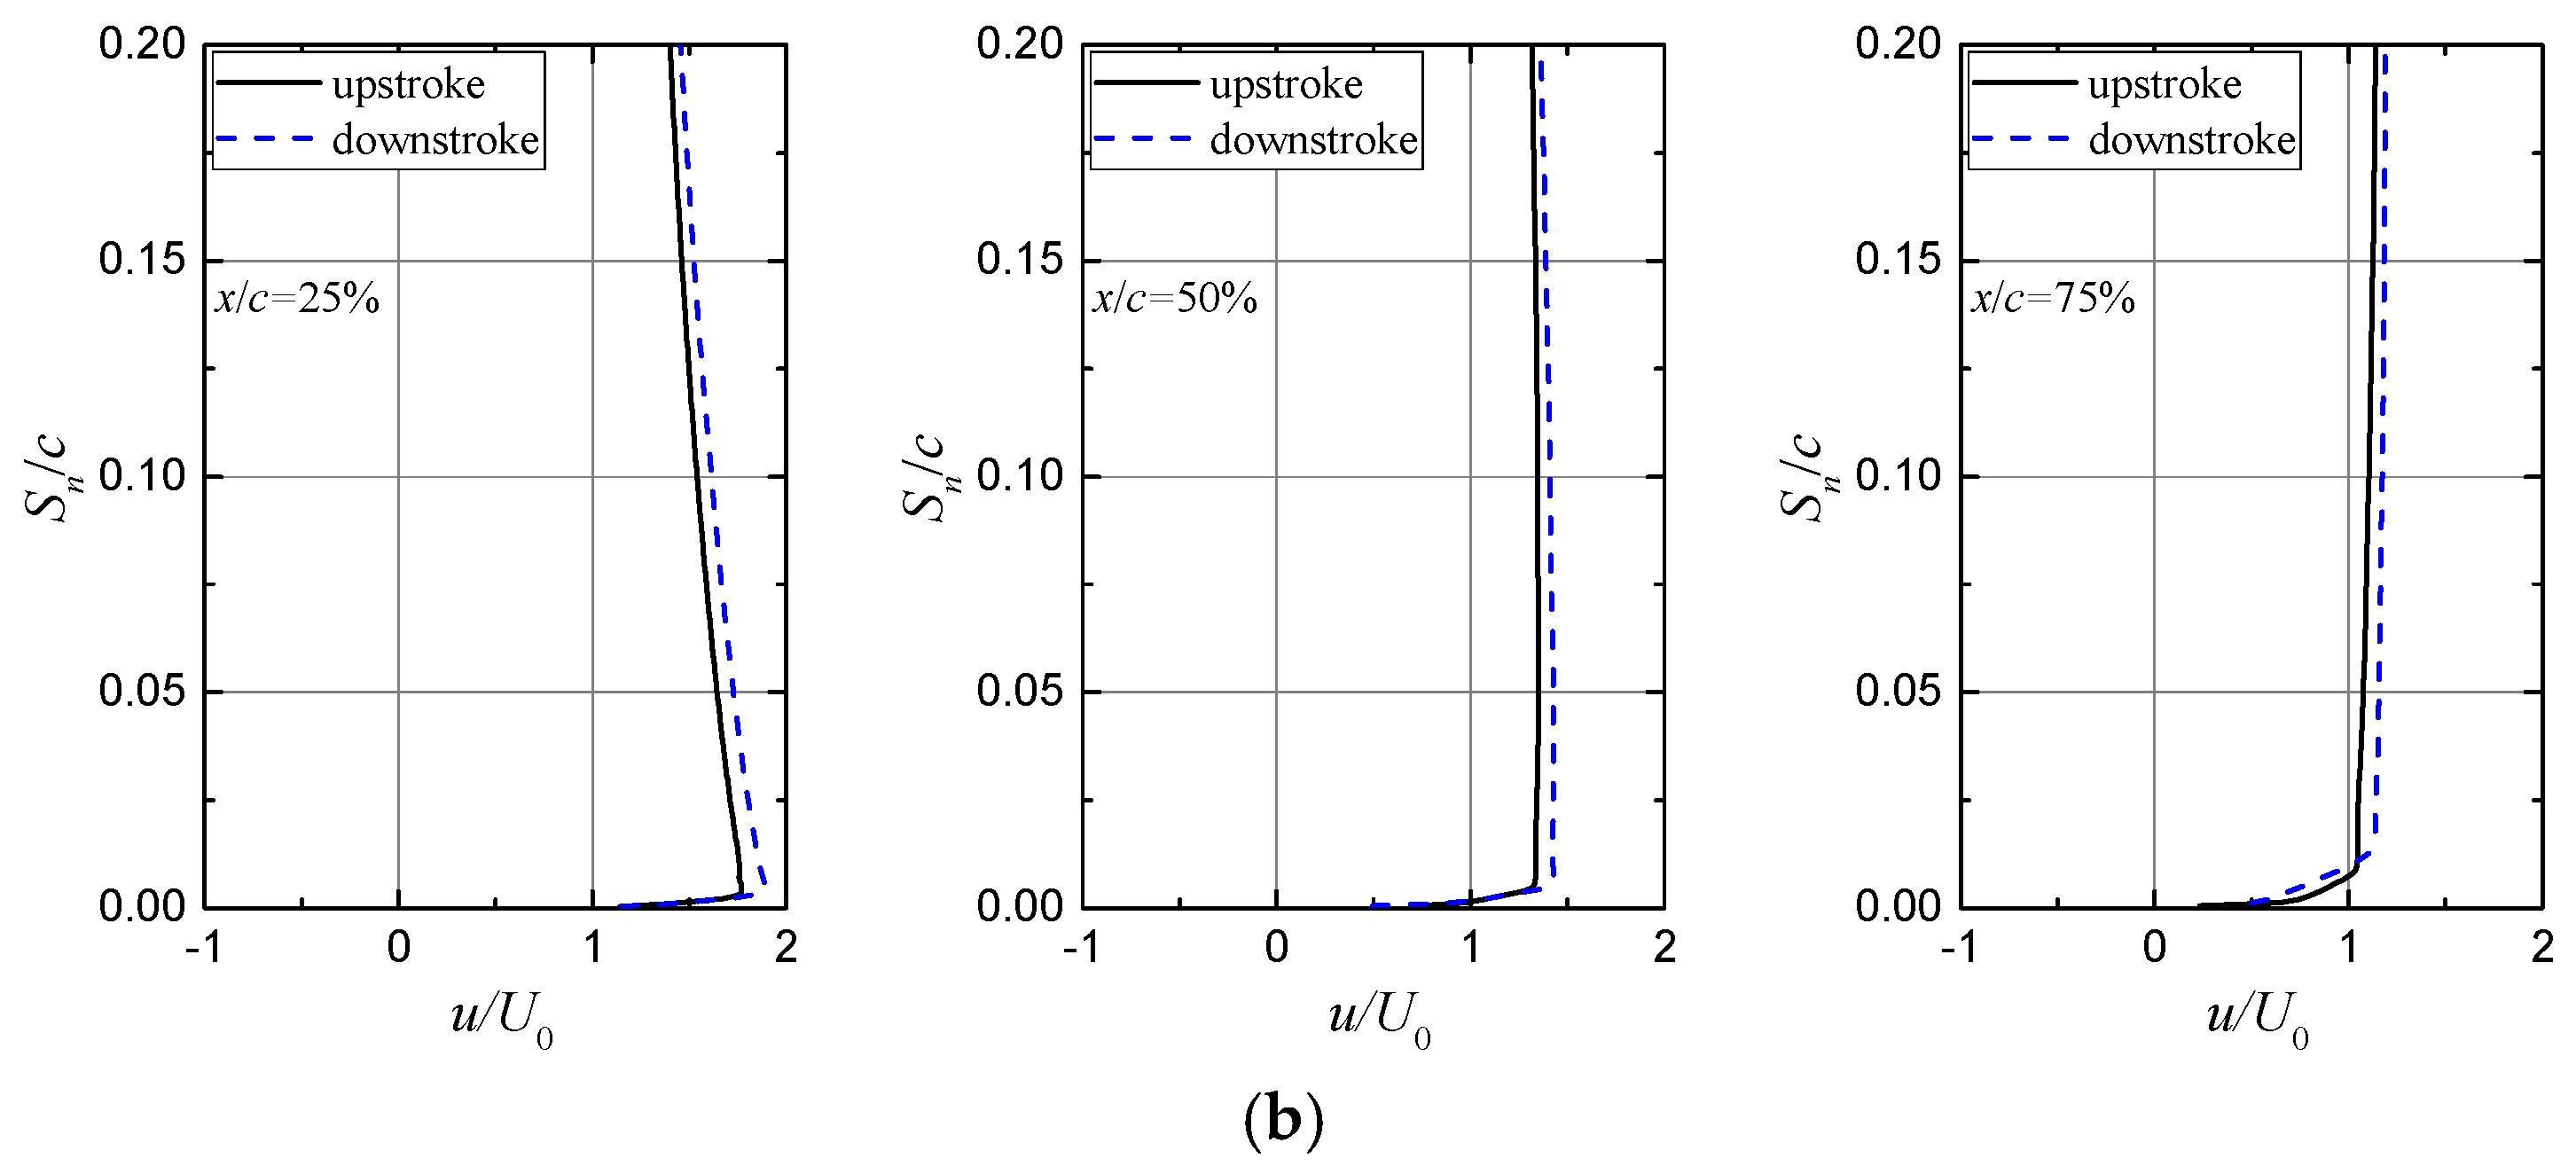
Figure 12a implies that the uncontrolled flow has a higher adverse pressure gradient during the downstroke than during the upstroke, and then a reversed near-wall flow occurs during the downstroke at x/c = 75%. The existence of VGs makes the near-wall flow to obtain momentum from the external flow during the downstroke, and even produces a more resistant velocity profile to the flow separation (Figure 12b). For the controlled flow, the anti-clockwise Cl variation with the AOA is in good agreement with the regime of no stall [18]. This regime well follows the standard inviscid unsteady airfoil theory, namely Theodorsen’s theory [35]. Figure 13a,b show the streamwise velocity field of the airfoil flow with VGs at αmean = 10°. In comparison with the upstroke process, the pitch-down motion effectively increases the flow accelerating around the leading edge, resulting in the higher leading-edge suction, and then increasing the Cl by 13.2% (Figure 13).
3.4. Effect of Vortex Generator Parameters on the Unsteady Aerodynamic Responses
3.4.1. Vane Height
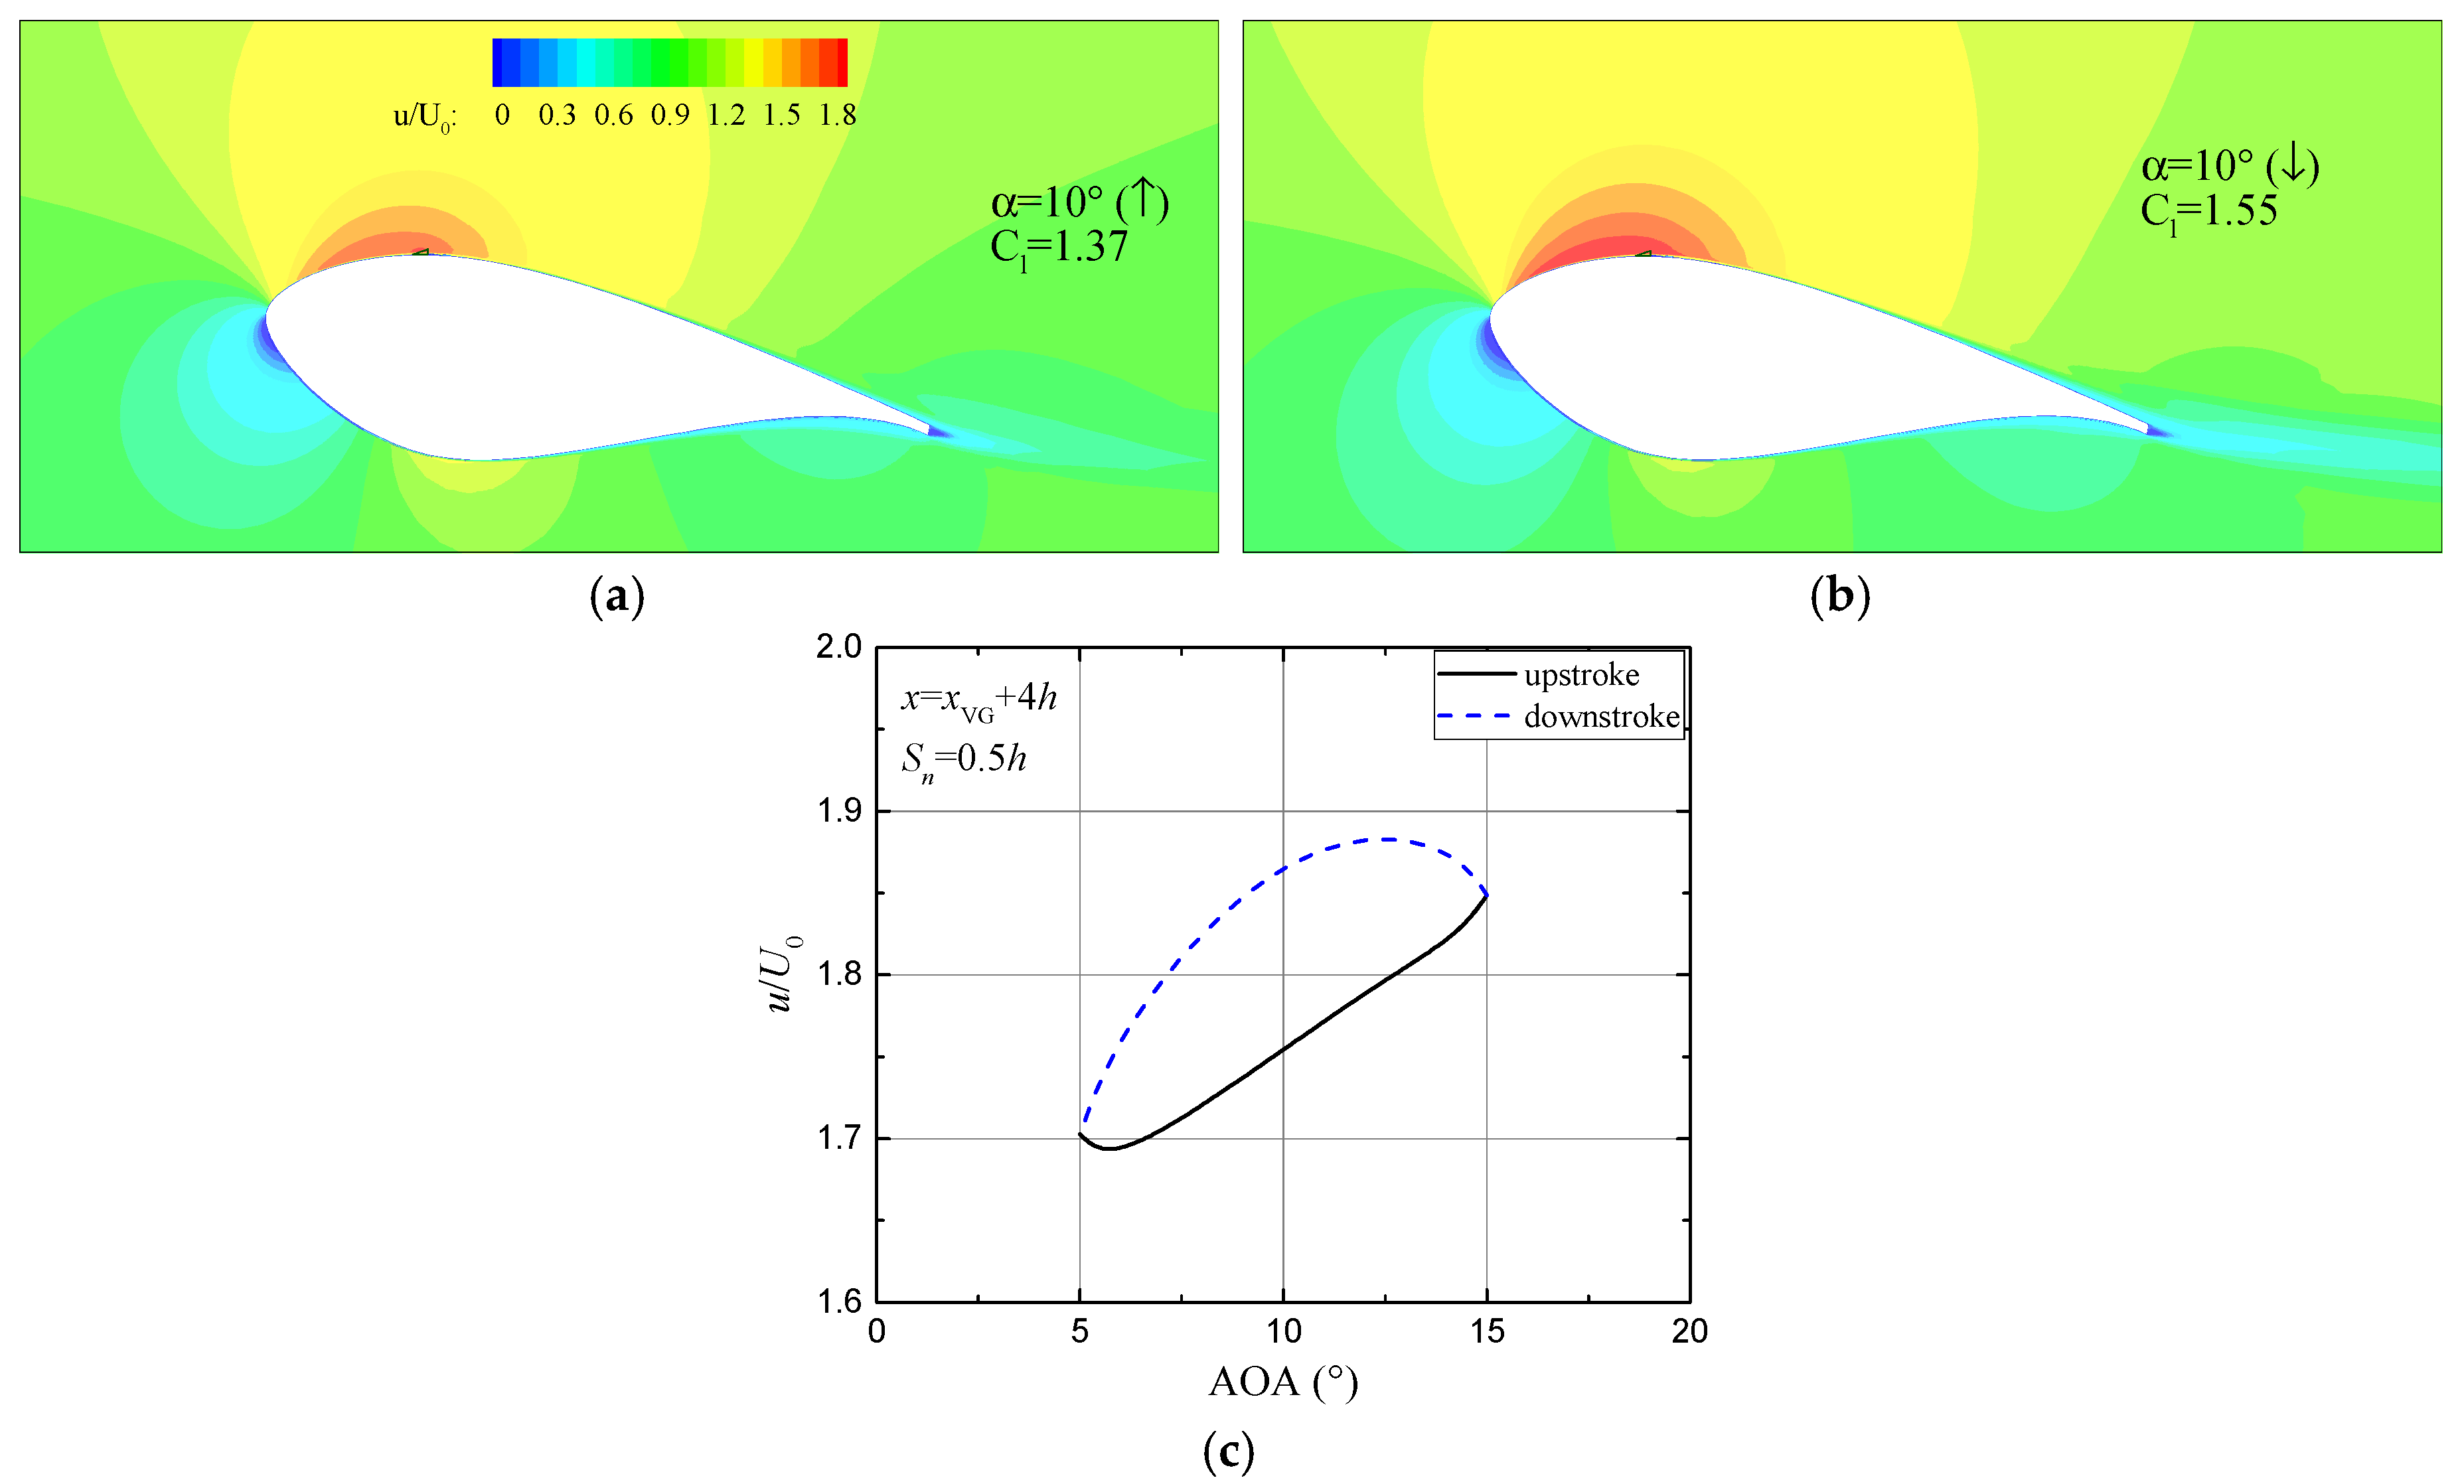
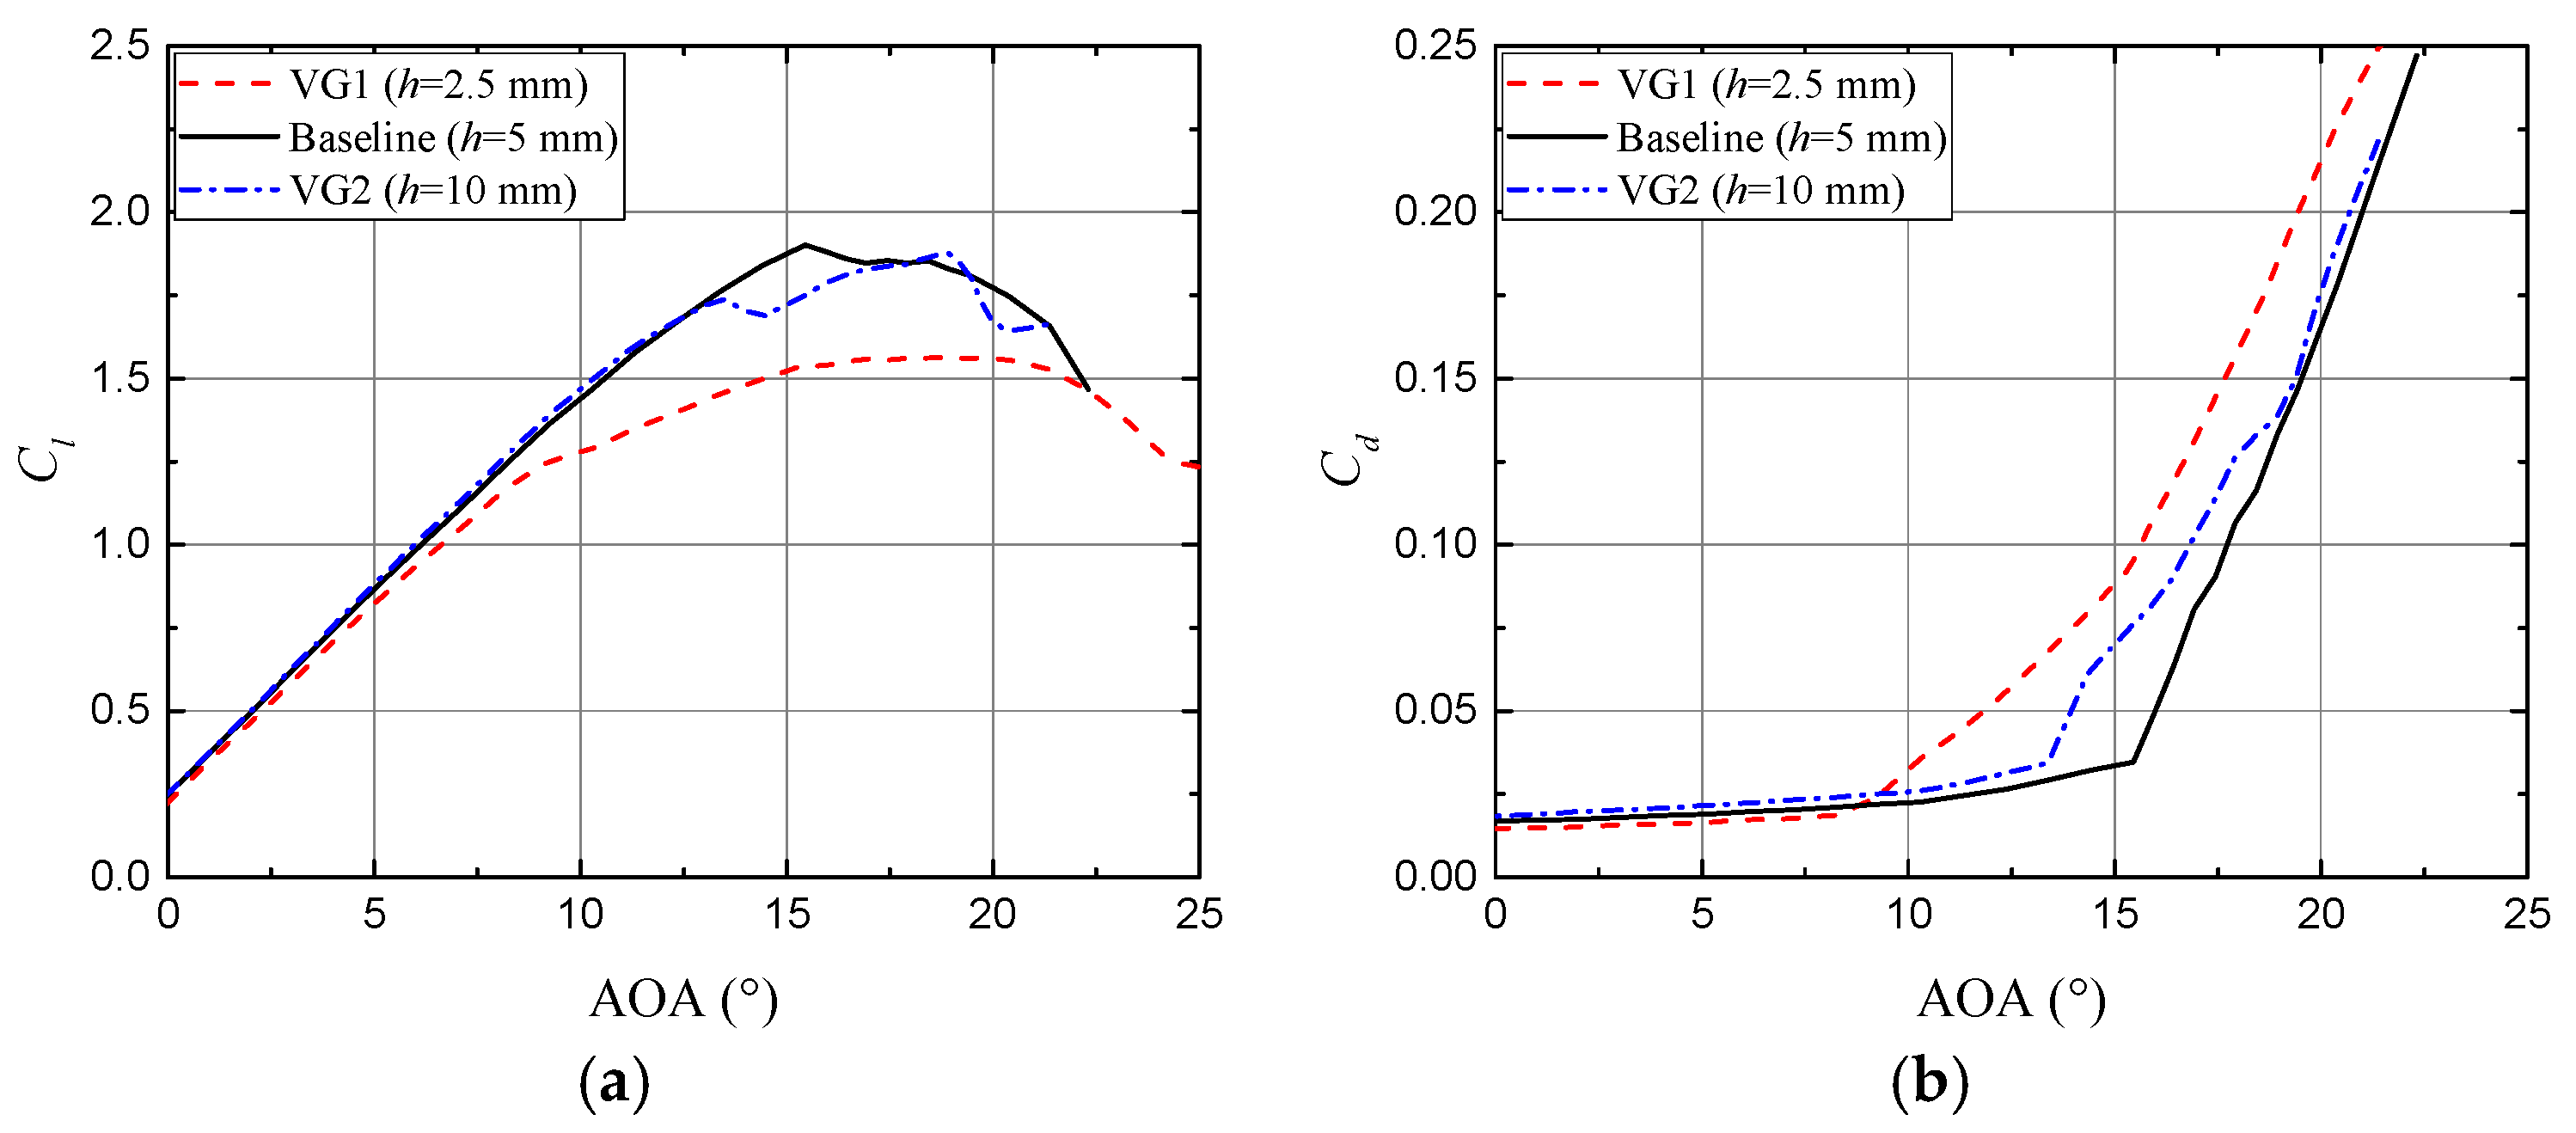
Generally speaking, the larger the VGs, the stronger the induced vortices. Increasing the vane height can make the vortices further downstream of the VGs, advancing the momentum transfer to the wall surface and increasing the lift, but at the cost of high drag penalty [1,5]. Therefore, the selection of vane height is always a trade-off between lift increase and drag penalty. Figure 14 shows the steady experimental aerodynamic coefficients of the DU97-W-300 airfoil with different vane heights [11]. The baseline VG design shows overall good performance in the lift increase and the stall characteristics. One can also observe that the lift slope of linear aerodynamic response increases with the vane height.
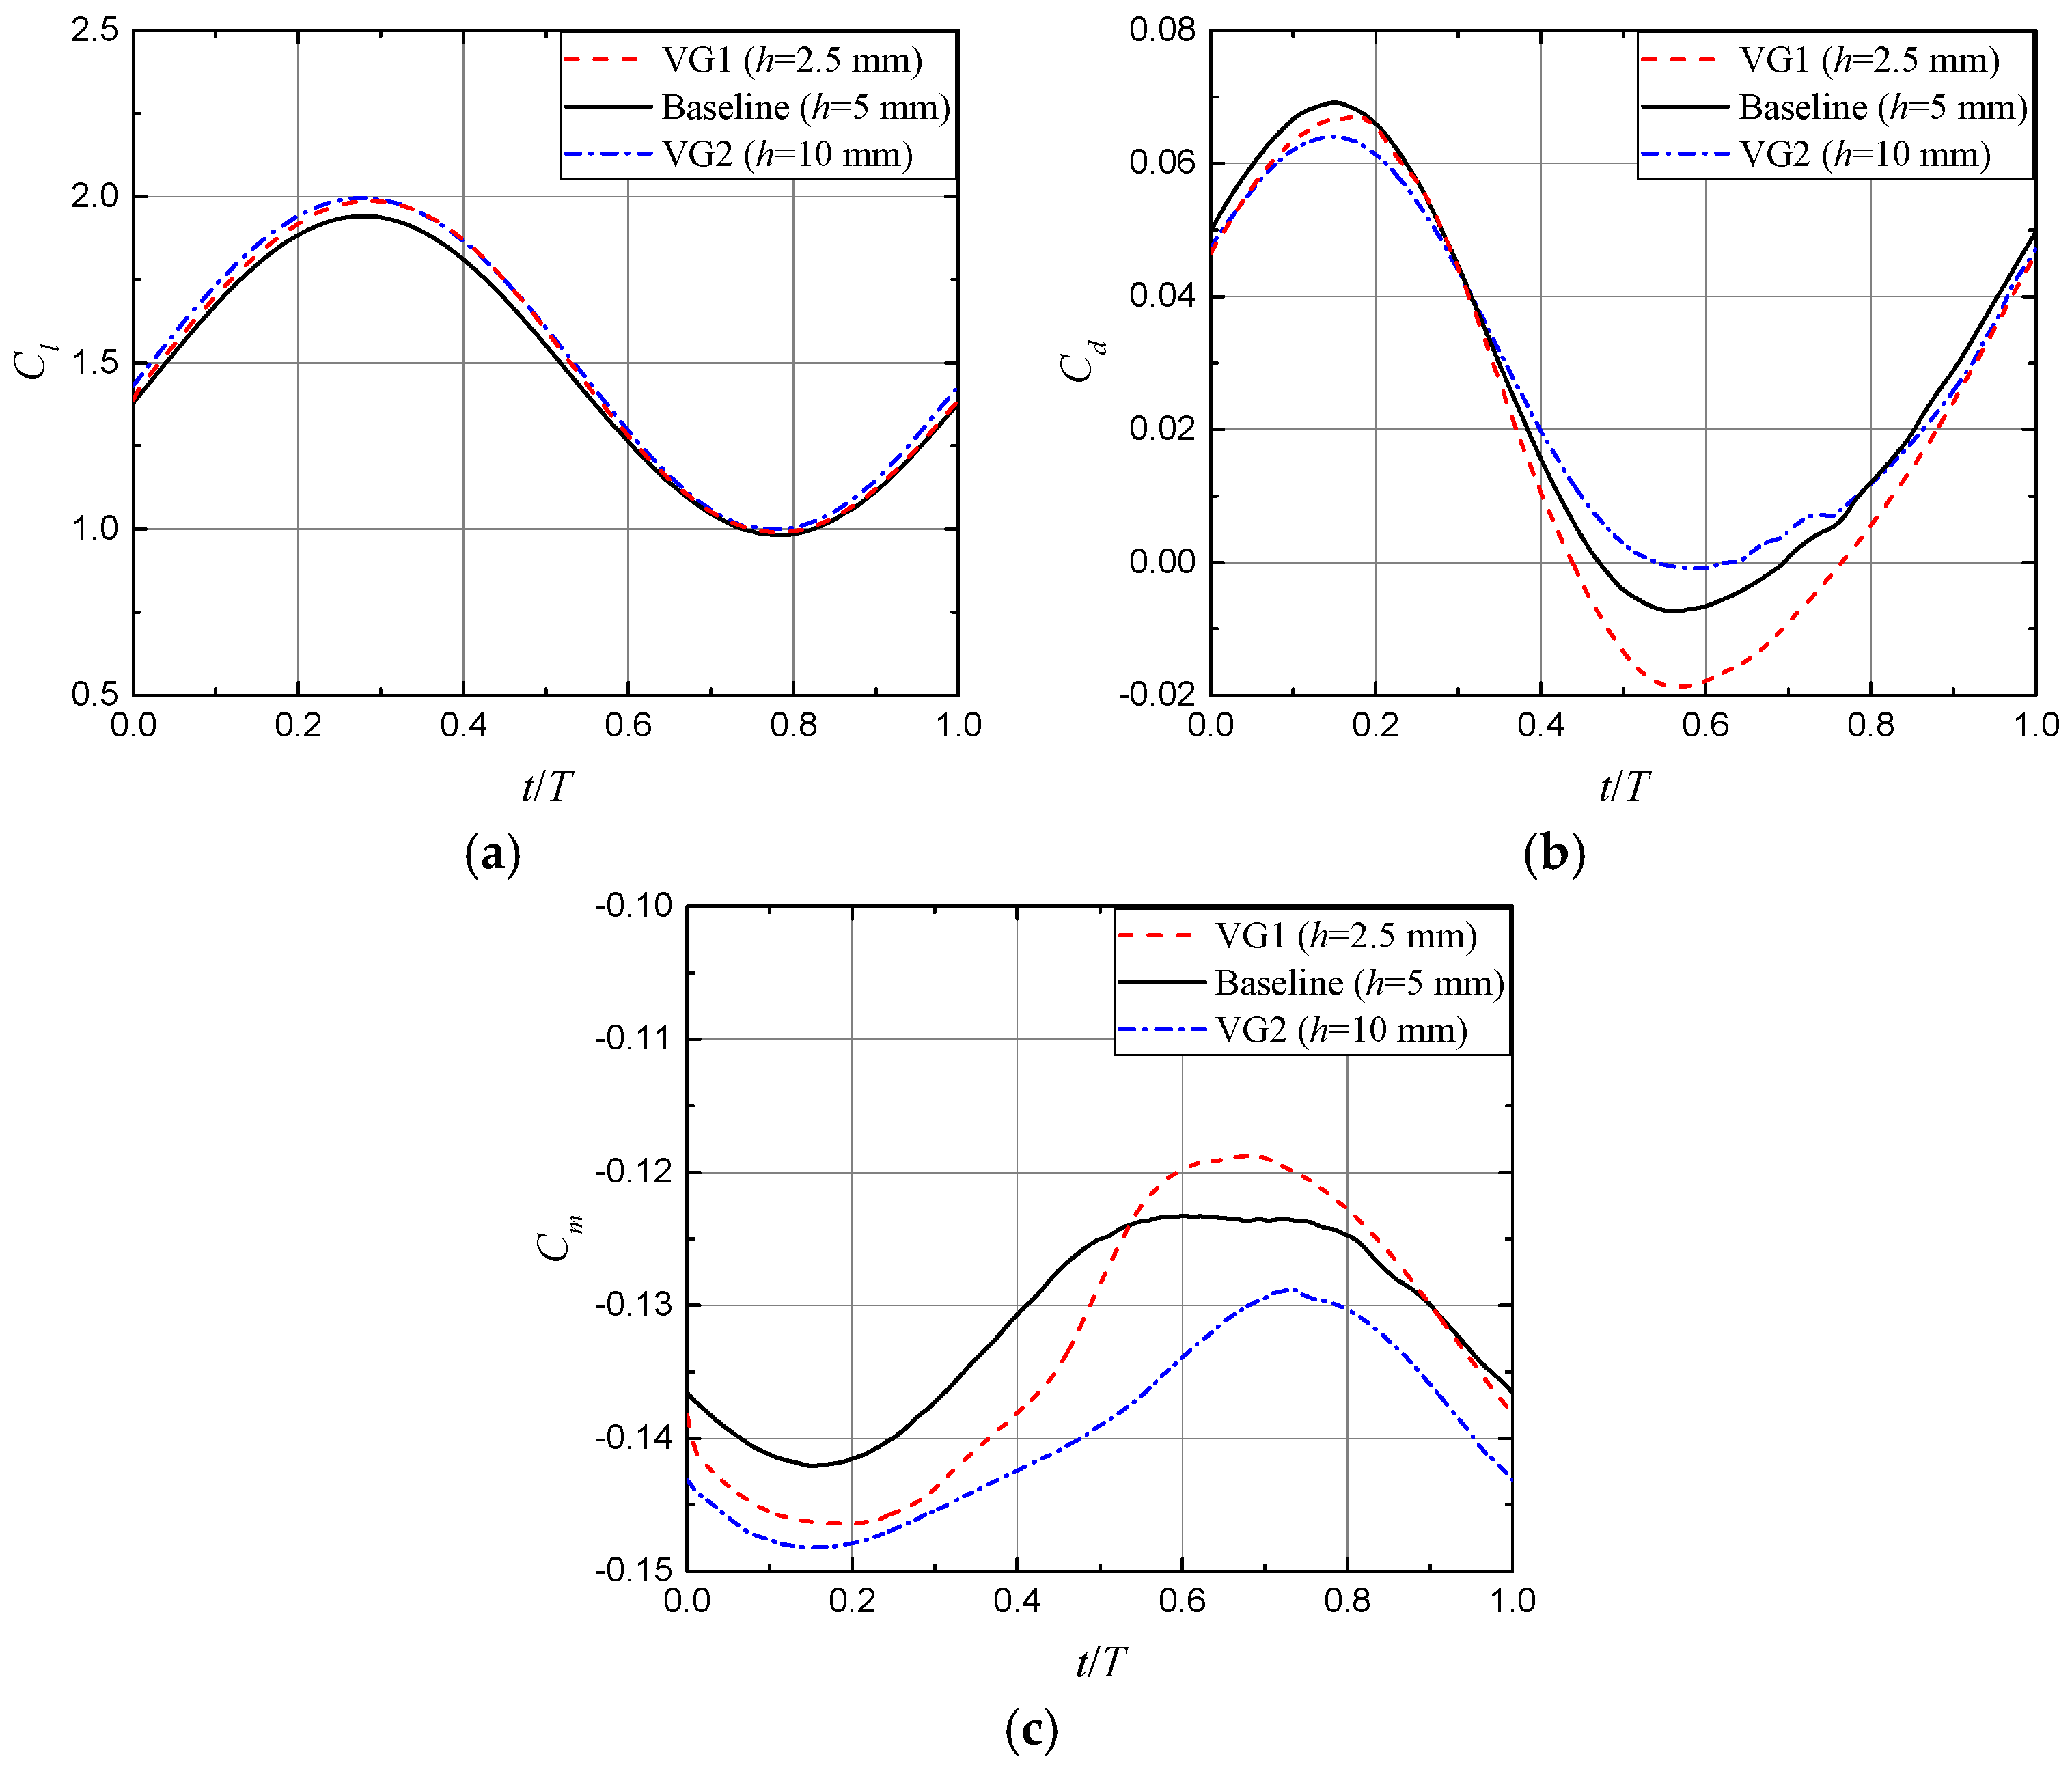
Figure 15 shows the unsteady aerodynamic coefficients of the airfoil with different VGs in height over one pitch-oscillation cycle. The Cl and Cd variations are out of proportion with vane height in comparison with the steady results, particularly at the high AOA where t/T is between 0 and 0.5. The maximum Cl and Cd with VGs of h = 2.5 mm is higher than that of h = 5 mm, although the baseline VGs of h = 5 mm indicates the best effectiveness in steady conditions. This finding indicates the airfoil performance sensitivity to vane height to be complicated due to airfoil motions.
Notice that Figure 15b gives negative Cd around t/T = 0.6. The negative Cd is known incredible for steady airfoil flow, and yet it is proper for unsteady airfoil flow under pitch oscillations. The wind tunnel measurements, numerical simulations, and analytical models have yielded negative Cd in certain instances [21,34,36]. A negative Cd often occurs when the airfoil pitches down towards the minimum AOA, mainly because the pitch-down motion can accelerate the leading-edge flow and lead to higher suction. The associated leading-edge thrust is almost in the opposite direction of Cd at the low AOA, producing the negative Cd. Figure 15b indicates that the minimum Cd increases with the vane height with respect to the spoiler-type drag, consistent with the steady results. It is remarkable that small VGs generally leads to high amplitude of Cd and Cm variations.
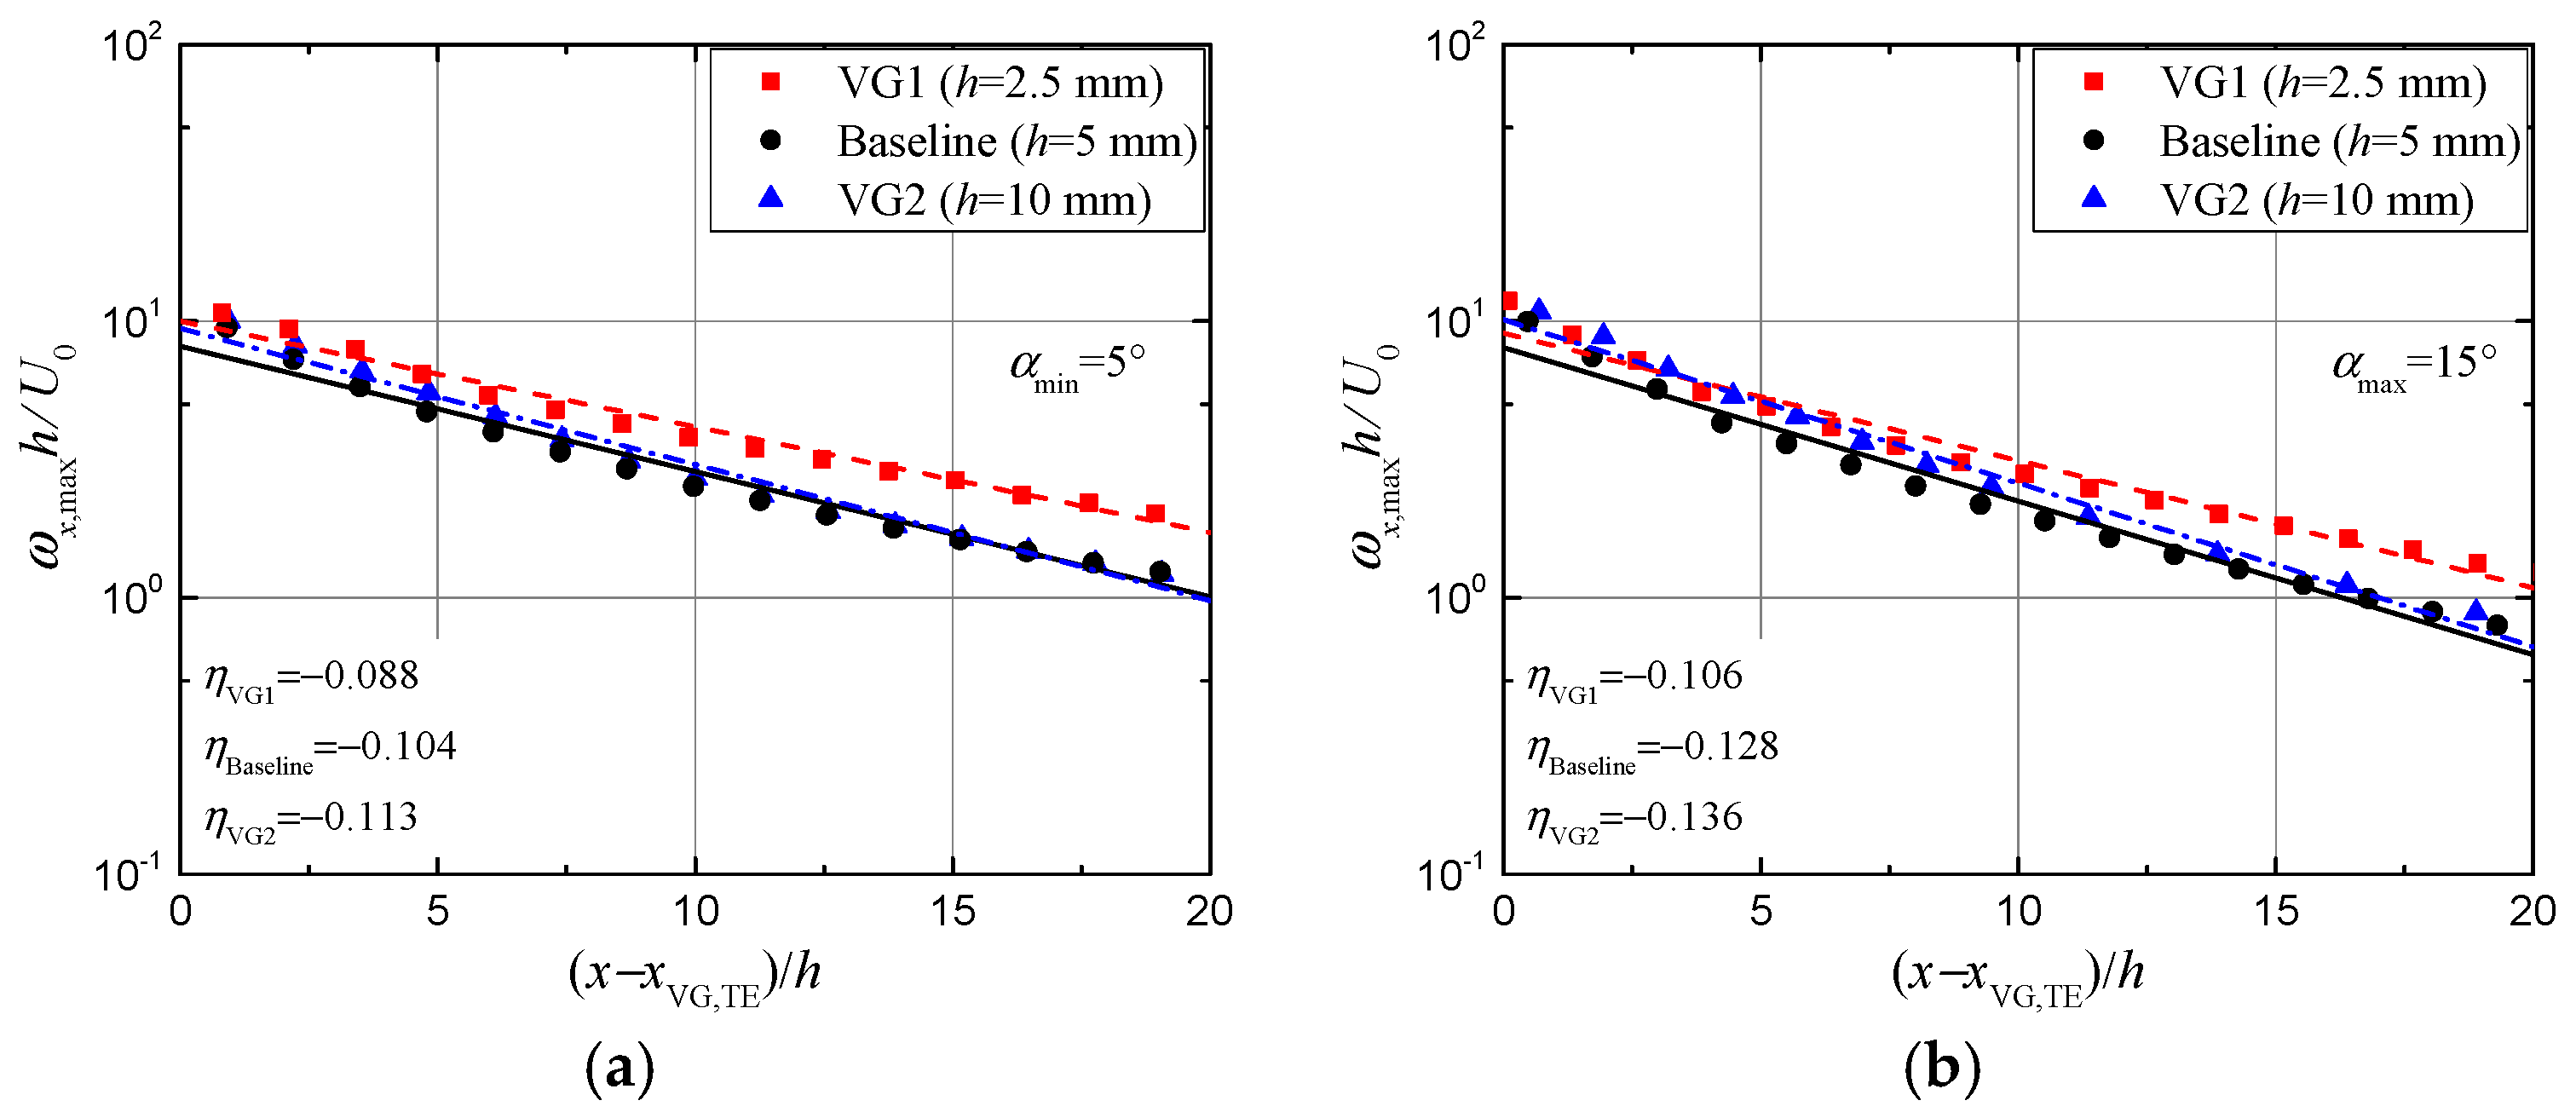
Figure 16 illustrates the exponential decay of streamwise peak vorticity downstream of VGs at the minimum and maximum AOA. The streamwise peak vorticity ωx,max and chordwise location x are nondimensionalized with the vane height and freestream velocity. The exponential decay exponents with different VGs are almost increased by 0.02 between α = 15° and α = 5°, implying higher adverse pressure gradient at the high AOA. Although increasing VG size leads to stronger vortices and their further downstream movement, the nondimensionalized peak vorticity decay indicates that small VGs can produce high effectiveness in higher vortex strength and later decay to improve the aerodynamic responses. This observation suggests that the airfoil performance for steady and unsteady flow lacks consistent sensitivity to VG height, to some extent. Consequently, the implementation of passive VGs on the wind turbines undergoing wide unsteady operating conditions should be carefully evaluated so as to bring the maximum benefit.
3.4.2. Chordwise Position
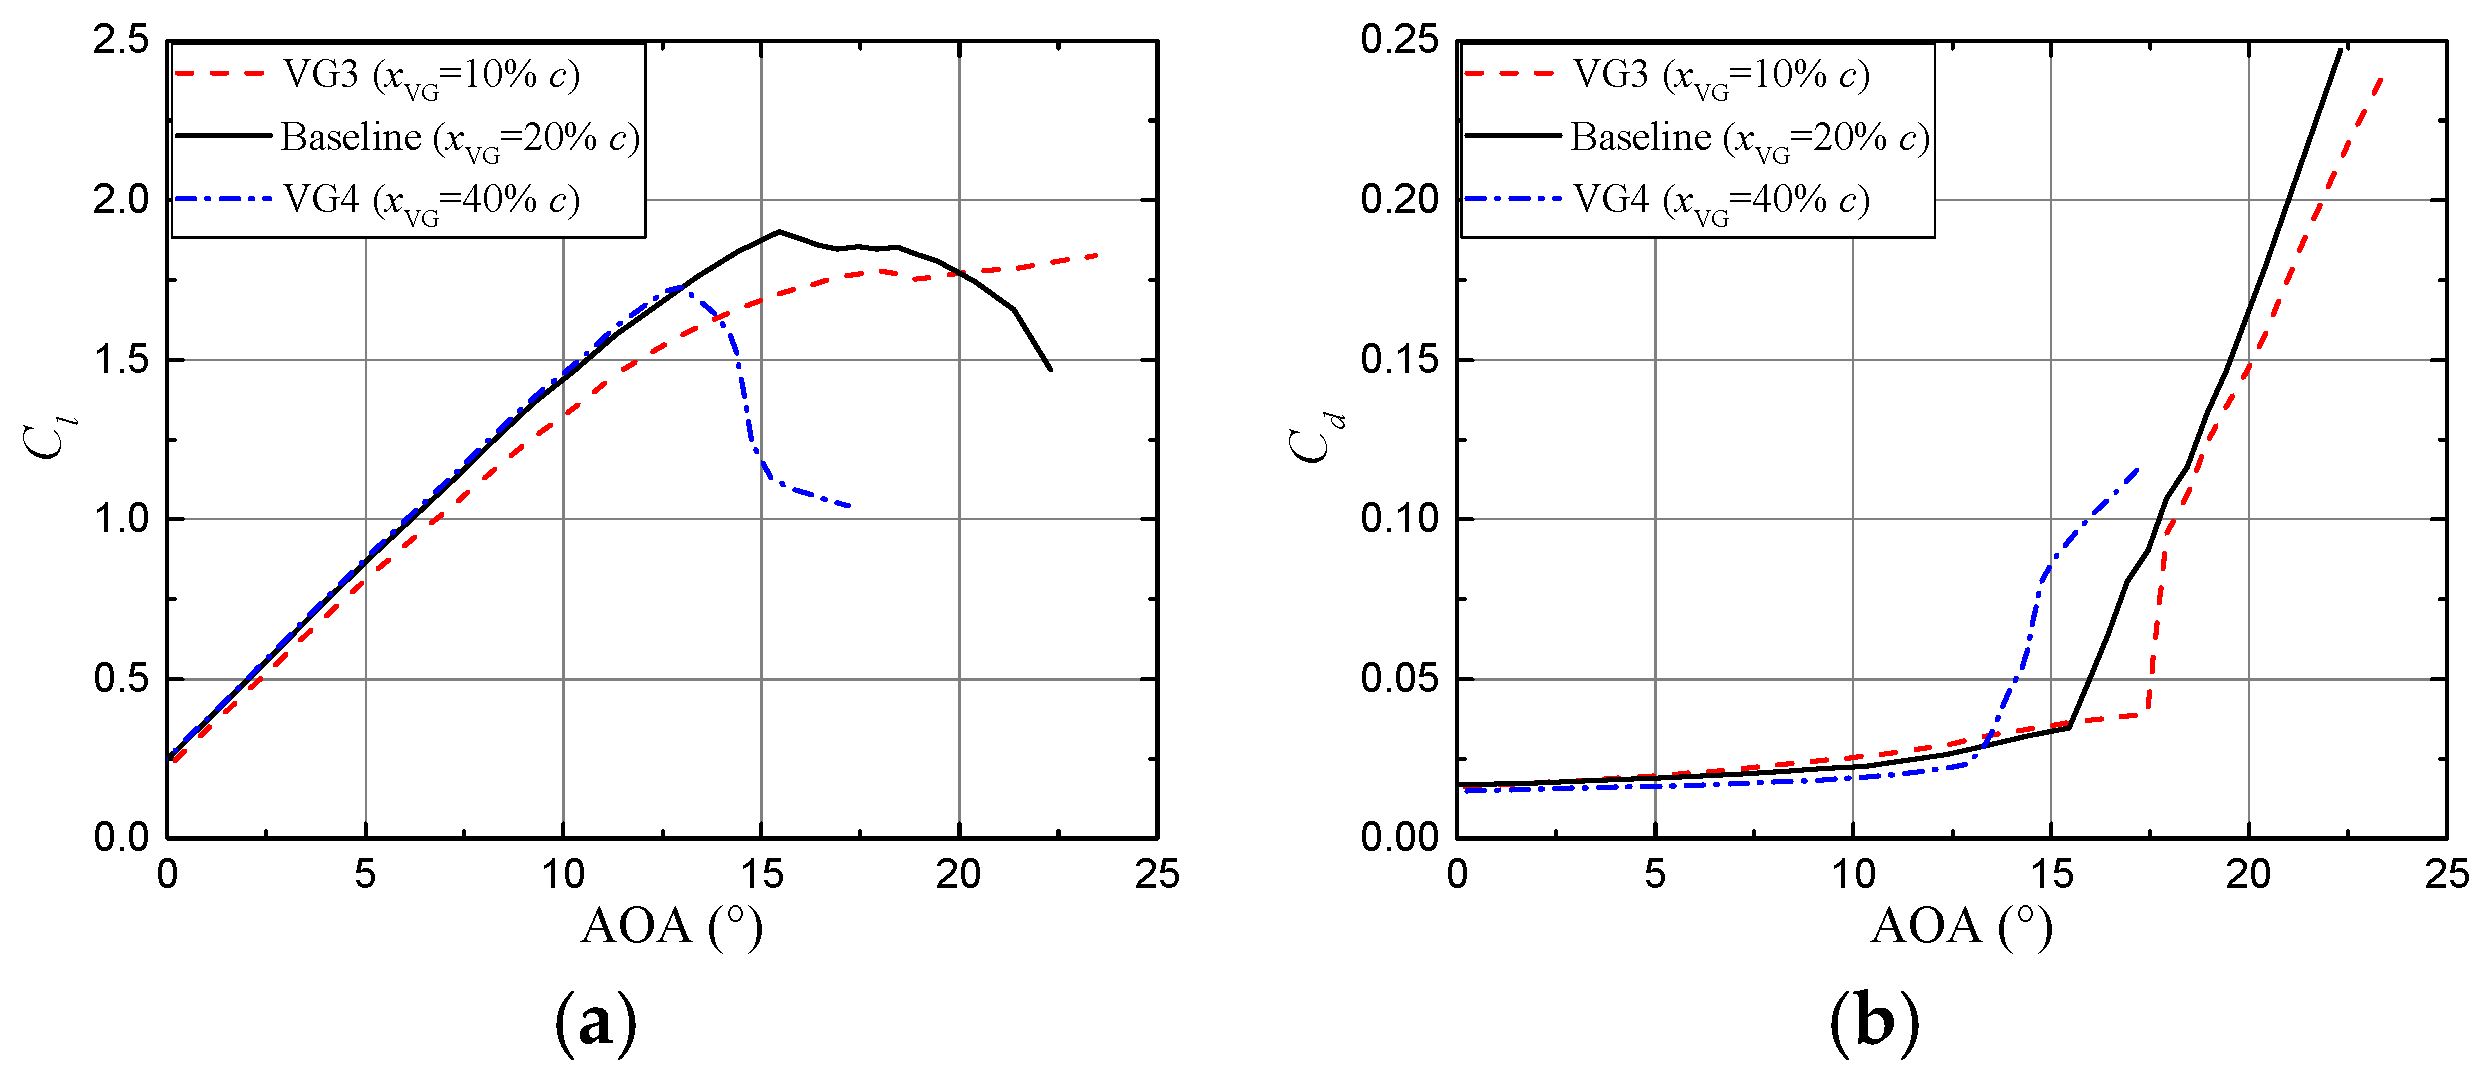
VGs are often placed reasonably close upstream of the separation point to ensure their effectiveness. Figure 17 shows the steady experimental aerodynamic coefficients with different chordwise VG installations [11]. The chordwise position xVG plays a critical role in the post-stall behavior of the airfoil [5]. Positioning the VGs too far downstream leads to an early abrupt stall. In the range of α = 5°–10°, however, the further downstream position of VGs can produce higher Cl and lift slope as well as lower Cd.
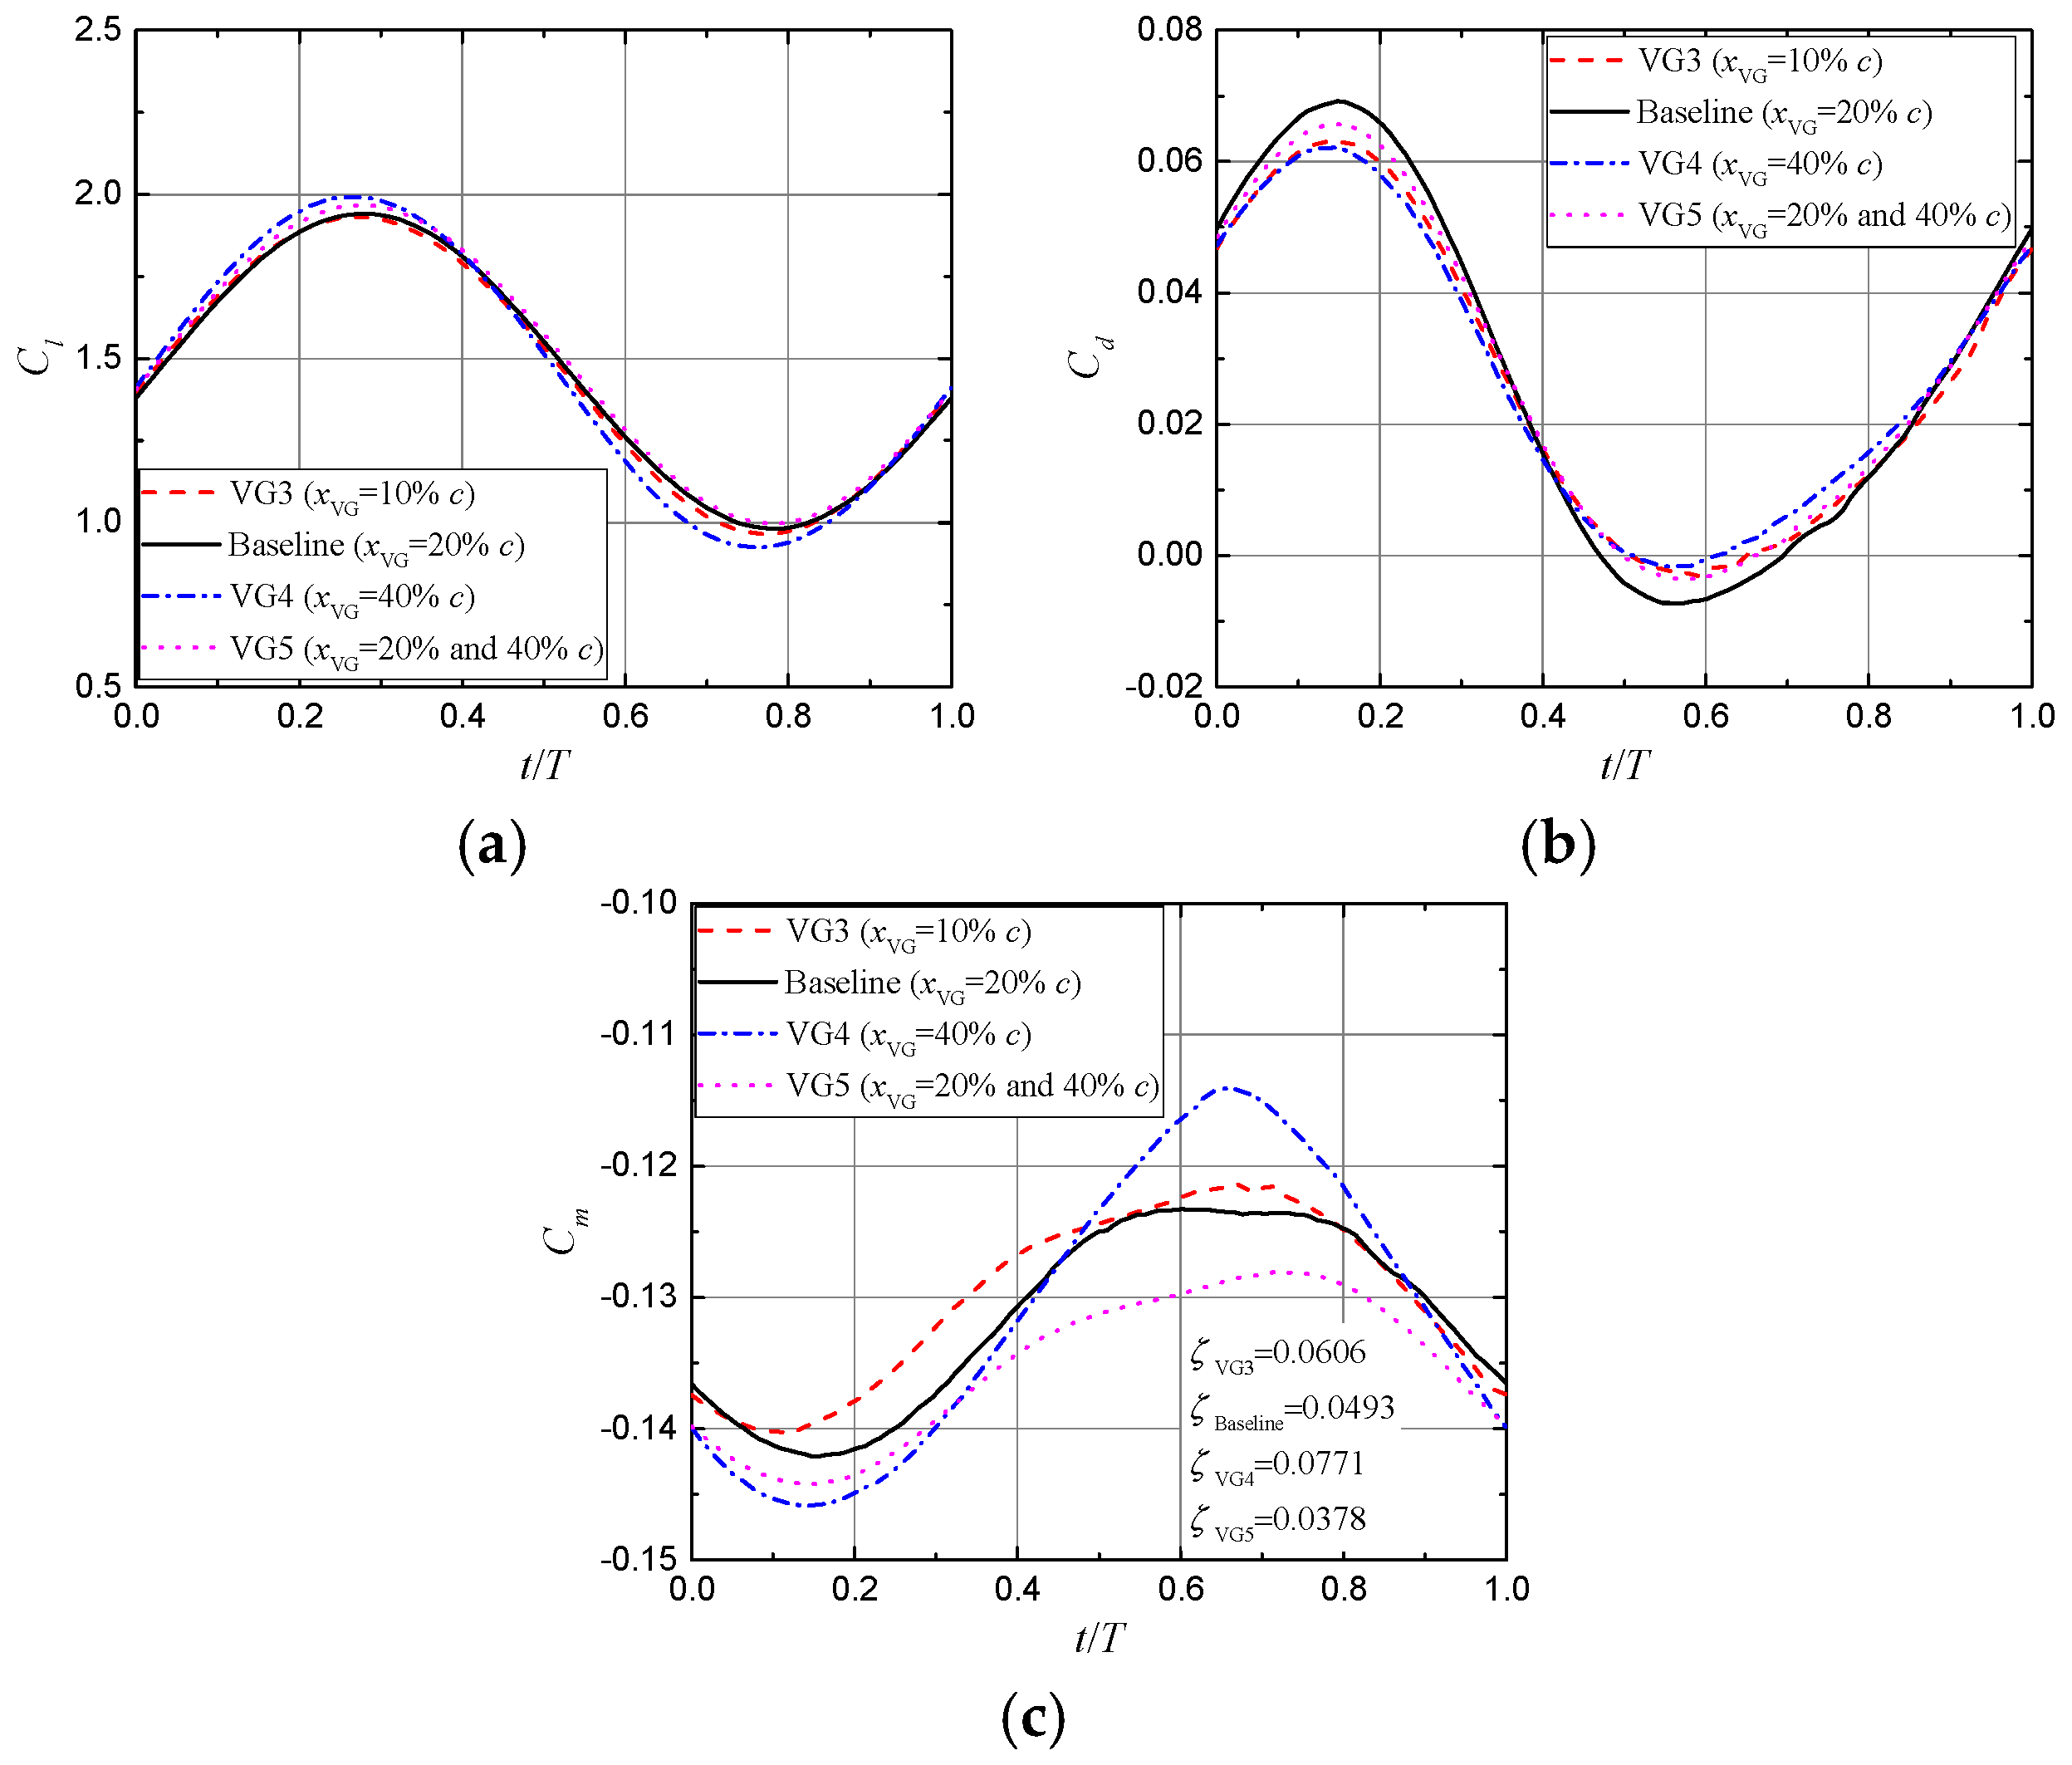
Figure 18 shows the aerodynamic coefficients of the airfoil over one pitch-oscillation cycle. One can find the influence of VG location to be relatively small on the unsteady airfoil flow. This is mainly because the flow is effectively attached by means of different VGs, and dynamic stall did not occur in present computations. The non-linear effect due to flow separation is a key element to determine the performance sensitivity to xVG; however, the obtained results follow the linear flow theory. Accordingly, positioning VGs further downstream results in the large lift and pitching moment amplitudes, and small drag amplitude, in a good agreement with the steady variations with the AOA.
Figure 18c indicates the influence of VG location enhanced on Cm, because Cm combined the VG influences on Cl and Cd together. The so-called aerodynamic pitch damping ζ is given by:
where ζ is obtained over a complete oscillation cycle. The higher value of ζ means a higher torsional aeroelastic stability. If ζ is negative, the airfoil extracts energy from the freestream, the pitch oscillations will tend to increase in amplitude, and then the flutter will occur unless restrained [18]. Although the VG installation at 40% c causes an abrupt stall in steady conditions, it properly controls the dynamic stall and assures a high ζ. This is due to the beneficial influence on the linear aerodynamic responses.
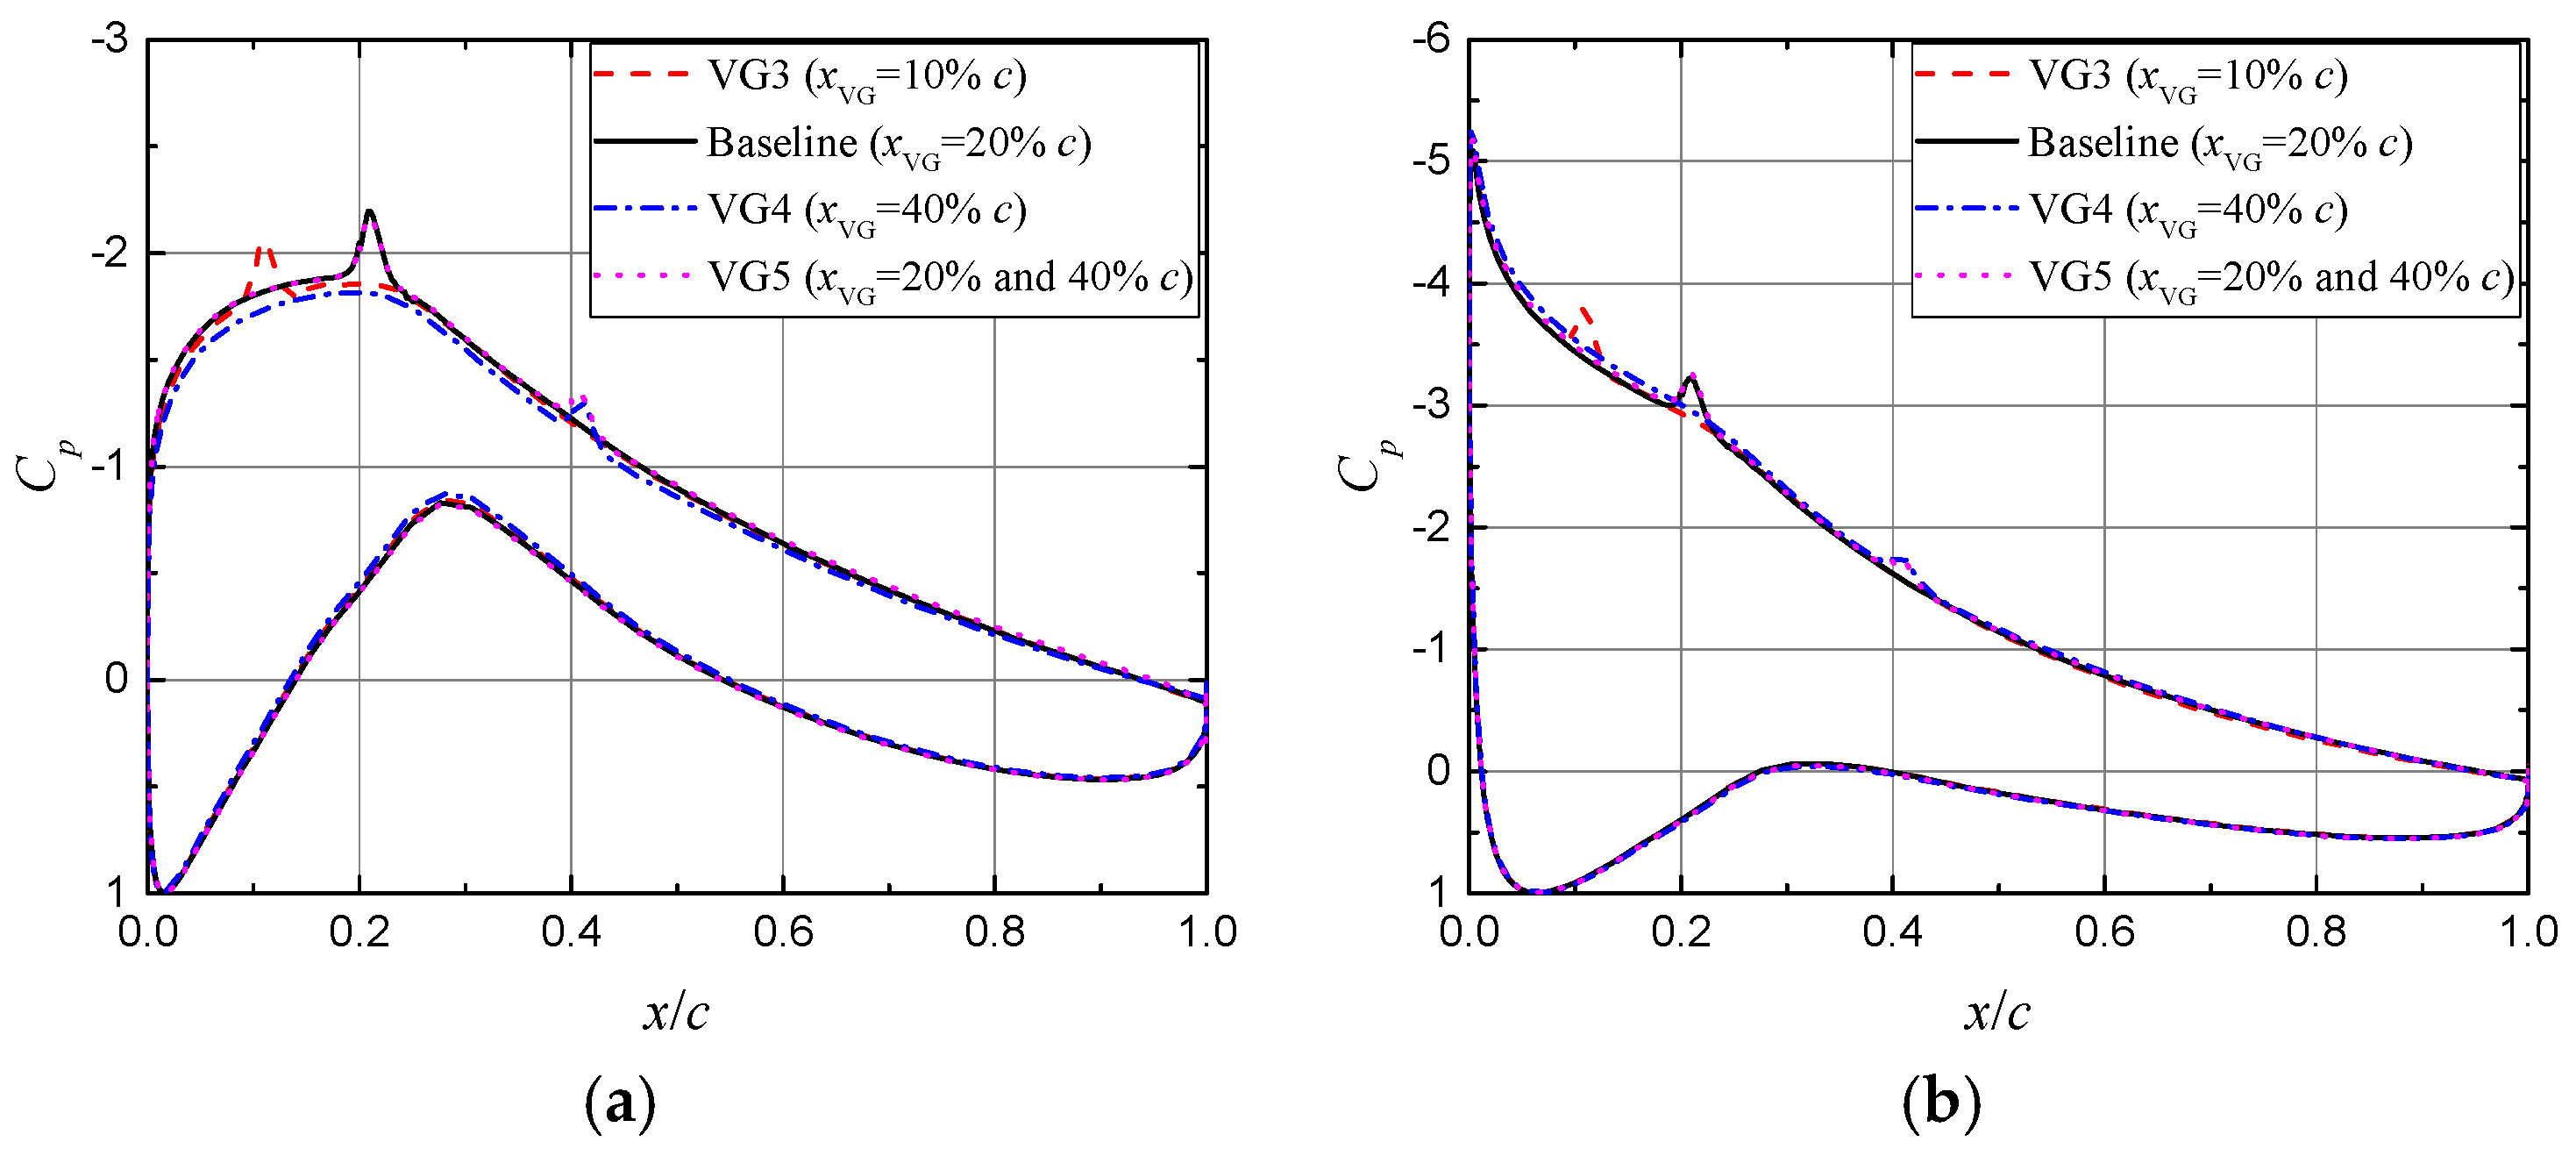
Figure 19 shows the pressure distributions with different VG positions at α = 5° and α = 15°. The main difference lies in the leading-edge suction. In general, xVG has an opposite influence on the leading-edge suction at the minimum and maximum AOA. At α = 5°, increasing xVG results in a decreased leading-edge suction; at α = 15°, however, it leads to an increased leading-edge suction. A plausible reason for this is that the pitch-up and pitch-down motions can produce different effects, deaccelerating and accelerating the flow around the leading edge, respectively.
Wang et al. [12] validated the improvement of double-row VG installations in suppressing the steady separated flow. This study, however, indicates that the influence of double-row VGs on unsteady aerodynamic responses blends together the two single-row VG influences, because the airfoil flow is fully attached over each cycle. McCroskey [18] has proposed that increasing the mean AOA could lead to further dynamic stall regimes: stall onset, light stall, and deep stall. Considering that the airfoil flow in dynamic stall will vary among the fully attached flow, partially separated flow, and massive separated flow with the separated bubble bursting, we believe that the chordwise VG installations might be greatly important in dynamic stall control. In this regard, further investigations are necessary to provide a deeper understanding.
4. Conclusions
This article presents a numerical study of passive VGs on the DU97-W-300 airfoil undergoing pitch oscillations to evaluate the VG influence on the unsteady airfoil performance. The URANS method is used to identify the unsteady aerodynamic characteristics. Present numerical modelling has been validated by good agreements between the experimental and calculated data with respect to the aerodynamic responses of both unsteady-uncontrolled airfoil flow under pitch oscillations and steady-controlled airfoil flow with VGs.
The dynamic stall of the airfoil was found to be effectively controlled by the presence of VGs. In comparison with the uncontrolled flow, the lift hysteresis intensity is significantly decreased by 60% to 80%, and the performance sensitivity to the reduced frequency is reduced as well. During the upstroke, the function of VGs is similar to that in steady conditions. During the downstroke, the pitch-down motion leads to a higher Cl, and hence, the Cl-α hysteresis loop with VGs is in the opposite direction to that without VGs.
The airfoil performance sensitivity to vane height was found to be complicated by the unsteady motions. Although small VGs have relatively low effectiveness in steady airfoil flow, the obtained results indicate that small VGs can produce the higher nondimensionalized vortex strength and later decay to improve the unsteady aerodynamic responses. Positioning the VGs further downstream can lead to large Cl, Cm amplitudes, and small Cd amplitude, for the no stall flow regime. Generally, the further downstream installation of VGs helps to assure the higher torsional aeroelastic stability. Because the controlled flow is fully attached over each cycle, the influence of double-row VGs blends well with the single-row VG influences. Therefore, further investigations are required to evaluate the effectiveness of double-row VGs in the deep dynamic stall regime.
It may be concluded that the implementation of passive VGs on wind turbine blades is highly promising in controlling the unsteady aerodynamic loads. The performance sensitivity to vane height and chordwise position, however, needs careful assessment in order to provide an overall best effective design for both steady and unsteady airfoil flows.
Author Contributions
Z.C. conceived of the research, conducted the data collection and wrote the manuscript. T.W. and J.W. contributed technical guidance and revised the manuscript.
Funding
This work is funded by the National Basic Research Program of China (973 Program) under grant No. 2014CB046200, CAS Key Laboratory of Wind Energy Utilization under grant No. KLWEU-2016-0102, and the Priority Academic Program Development of Jiangsu Higher Education Institutions.
Acknowledgments
The authors would like to thank Daniel Baldacchino of Delft University of Technology for providing the steady experimental data and details of the DU97-W-300 airfoil with vortex generators.
Conflicts of Interest
The authors declare no conflict of interest.
Nomenclature
| ζ | aerodynamic pitch damping |
| α | angle of attack (AOA) |
| η | exponential decay exponent of streamwise peak vorticity |
| β | geometric vane inflow angle |
| ε | hysteresis intensity of the lift coefficient |
| αmean | mean AOA |
| ωx,max | streamwise peak vorticity |
| A | AOA amplitude |
| c | chord length |
| Cd | drag coefficient |
| Cl | lift coefficient |
| Cl,max | maximum lift coefficient |
| Cm | pitching moment coefficient about the quarter-chord axis |
| Cp | pressure coefficient |
| D | inter-vane spacing |
| d | intra-vane spacing |
| f | frequency of oscillation |
| h | vane height |
| k | reduced frequency |
| L | vane length |
| Sn | normal distance away from the wall surface |
| T | period of airfoil motion |
| u | streamwise velocity |
| U0 | freestream velocity |
| v | normal velocity |
| x | chordwise location |
| xVG | chordwise installation of VGs, measured between the airfoil and VG leading edges |
| xVG,TE | chordwise location of VG trailing edge |
References
- Godard, G.; Stanislas, M. Control of a decelerating boundary layer. Part 1: Optimization of passive vortex generators. Aerosp. Sci. Technol. 2006, 10, 181–191. [Google Scholar] [CrossRef]
- Barlas, T.K.; van Kuik, G.A.M. Review of state of the art in smart rotor control research for wind turbines. Prog. Aerosp. Sci. 2010, 46, 1–27. [Google Scholar] [CrossRef]
- Griffin, D.A. Investigation of Vortex Generators for Augmentation of Wind Turbine Power Performance; National Renewable Energy Lab.: Golden, CO, USA, 1996.
- Øye, S. The ELKRAFT 1 MW Wind Turbine: Results from the Test Program. In Proceedings of the 1996 European Union Wind Energy Conference, Göteborg, Sweden, 20–24 May 1996; pp. 251–255. [Google Scholar]
- Mueller-Vahl, H.; Pechlivanoglou, G.; Nayeri, C.N.; Paschereit, C.O. Vortex generators for wind turbine blades: A combined wind tunnel and wind turbine parametric study. In Proceedings of the Asme Turbo Expo 2012; American Society Mechanical Engineers: New York, NY, USA, 2012; Volume 6, pp. 899–914. [Google Scholar]
- Tian, Q.; Corson, D.; Baker, J. Application of Vortex Generators to Wind Turbine Blades. In Proceedings of the 34th Wind Energy Symposium, AIAA SciTech Forum, San Diego, CA, USA, 4–8 January 2016. [Google Scholar] [CrossRef]
- Lin, J.C. Review of research on low-profile vortex generators to control boundary-layer separation. Prog. Aerosp. Sci. 2002, 38, 389–420. [Google Scholar] [CrossRef]
- Martinez-Filgueira, P.; Fernandez-Gamiz, U.; Zulueta, E.; Errasti, I.; Fernandez-Gauna, B. Parametric study of low-profile vortex generators. Int. J. Hydrog. Energy 2017, 42, 17700–17712. [Google Scholar] [CrossRef]
- Velte, C.M. Vortex Generator Flow Model Based on Self-Similarity. Aiaa J. 2013, 51, 526–529. [Google Scholar] [CrossRef]
- Logdberg, O.; Fransson, J.H.M.; Alfredsson, P.H. Streamwise evolution of longitudinal vortices in a turbulent boundary layer. J. Fluid Mech. 2009, 623, 27–58. [Google Scholar] [CrossRef]
- Baldacchino, D.; Ferreira, C.; De Tavernier, D.; Timmer, W.A.; van Bussel, G.J.W. Experimental parameter study for passive vortex generators on a 30% thick airfoil. Wind Energy 2018, 21, 745–765. [Google Scholar] [CrossRef]
- Wang, H.P.; Zhang, B.; Qiu, Q.G.; Xu, X. Flow control on the NREL S809 wind turbine airfoil using vortex generators. Energy 2017, 118, 1210–1221. [Google Scholar] [CrossRef]
- Spalart, P.R.; Shur, M.L.; Strelets, M.K.; Travin, A.K. Direct Simulation and RANS Modelling of a Vortex Generator Flow. Flow Turbul. Combust. 2015, 95, 335–350. [Google Scholar] [CrossRef]
- Velte, C.M.; Hansen, M.O.L.; Cavar, D. Flow analysis of vortex generators on wing sections by stereoscopic particle image velocimetry measurements. Environ. Res. Lett. 2008, 3, 11. [Google Scholar] [CrossRef]
- Jirasek, A. Vortex-generator model and its application to flow control. J. Aircr. 2005, 42, 1486–1491. [Google Scholar] [CrossRef]
- Baldacchino, D.; Manolesos, M.; Ferreira, C.; Salcedo, A.G.; Aparicio, M.; Chaviaropoulos, T.; Diakakis, K.; Florentie, L.; Garcia, N.R.; Papadakis, G.; et al. Iop, Experimental benchmark and code validation for airfoils equipped with passive vortex generators. In Science of Making Torque from Wind; Iop Publishing Ltd.: Bristol, UK, 2016; Volume 753. [Google Scholar]
- Troldborg, N.; Zahle, F.; Sorensen, N.N. Simulation of a MW rotor equipped with vortex generators using CFD and an actuator shape model. In Proceedings of the 53rd AIAA Aerospace Sciences Meeting, Kissimmee, FL, USA, 5–9 January 2015. [Google Scholar]
- McCroskey, W.J. The Phenomenon of Dynamic Stall; National Aeronautics and Space Administration: Washington, DC, USA, 1981.
- Carr, L.W. Progress in analysis and prediction of dynamic stall. J. Aircr. 1988, 25, 6–17. [Google Scholar] [CrossRef]
- Schepers, J.G. Engineering Models in Wind Energy Aerodynamics: Development, Implementation and Analysis using Dedicated Aerodynamic Measurements; Delft University of Technology: Delft, The Netherlands, 2012. [Google Scholar]
- Ekaterinaris, J.A.; Platzer, M.F. Computational prediction of airfoil dynamic stall. Prog. Aerosp. Sci. 1997, 33, 759–846. [Google Scholar] [CrossRef]
- Gharali, K.; Johnson, D.A. Numerical modeling of an S809 airfoil under dynamic stall, erosion and high reduced frequencies. Appl. Energy 2012, 93, 45–52. [Google Scholar] [CrossRef]
- Gao, L.Y.; Zhang, H.; Liu, Y.Q.; Han, S. Effects of vortex generators on a blunt trailing-edge airfoil for wind turbines. Renew. Energy 2015, 76, 303–311. [Google Scholar] [CrossRef]
- Timmer, W.A.; van Rooij, R. Summary of the Delft University wind turbine dedicated airfoils. J. Sol. Energy Eng. Trans. ASME 2003, 125, 488–496. [Google Scholar] [CrossRef]
- ANSYS Inc. FLUENT Theory Guide, Release 16.0; ANSYS Inc.: Canonsburg, PA, USA, 2015. [Google Scholar]
- Zhu, C.; Wang, T. Comparative Study of Dynamic Stall under Pitch Oscillation and Oscillating Freestream on Wind Turbine Airfoil and Blade. Appl. Sci. 2018, 8, 1242. [Google Scholar] [CrossRef]
- Menter, F.R. Two-Equation Eddy-Viscosity Transport Turbulence Model for Engineering Applications. AIAA J. 1994, 32, 1598–1605. [Google Scholar] [CrossRef]
- Menter, F.R.; Langtry, R.B.; Likki, S.R.; Suzen, Y.B.; Huang, P.G.; Volker, S. A correlation-based transition model using local variables—Part I: Model formulation. J. Turbomach. Trans. ASME 2006, 128, 413–422. [Google Scholar] [CrossRef]
- Roache, P.J. Quantification of uncertainty in computational fluid dynamics. Annu. Rev. Fluid Mech. 1997, 29, 123–160. [Google Scholar] [CrossRef]
- Somers, D.M. Design and Experimental Results for the S809 Airfoil; National Renewable Energy Laboratory: Golden, CO, USA, 1997.
- Ramsay, R.F.; Hoffman, M.J.; Gregorek, G.M. Effects of Grit Roughness and Pitch Oscillation on the S809 Airfoil; National Renewable Energy Laboratory: Golden, CO, USA, 1995.
- Karbasian, H.R.; Esfahani, J.A.; Barati, E. Effect of acceleration on dynamic stall of airfoil in unsteady operating conditions. Wind Energy 2016, 19, 17–33. [Google Scholar] [CrossRef]
- Gupta, S.; Leishman, J.G. Dynamic stall modelling of the S809 aerofoil and comparison with experiments. Wind Energy 2006, 9, 521–547. [Google Scholar] [CrossRef]
- Johansen, J. Unsteady Airfoil Flows with Application to Aeroelastic Stability; Risø National Laboratory: Roskilde, Denmark, 1999. [Google Scholar]
- Leishman, J.G. Principles of Helicopter Aerodynamics, 2nd ed.; Cambridge University Press: New York, NY, USA, 2006. [Google Scholar]
- Leishman, J.G.; Beddoes, T.S. A Semi-Empirical Model for Dynamic Stall. J. Am. Helicopter Soc. 1989, 34, 3–17. [Google Scholar] [CrossRef]
Figure 1.
Schematic of the vane-type vortex generators. Nomenclature: h, vane height; L vane length; d, intra-vane spacing; D, inter-vane spacing; β, geometric vane inflow angle: (a) isometric view; (b) planar view.
Figure 1.
Schematic of the vane-type vortex generators. Nomenclature: h, vane height; L vane length; d, intra-vane spacing; D, inter-vane spacing; β, geometric vane inflow angle: (a) isometric view; (b) planar view.

Figure 2.
Computational mesh of the flow field and boundary layer around the airfoil with vortex generators. The red circle denotes the sliding interface: (a) flow field mesh; (b) wall surface and boundary layer mesh.
Figure 2.
Computational mesh of the flow field and boundary layer around the airfoil with vortex generators. The red circle denotes the sliding interface: (a) flow field mesh; (b) wall surface and boundary layer mesh.

Figure 3.
Sensitivity of pressure distribution to the far-field distance. α = 15° without VGs.

Figure 4.
Wall y+ along the wing centerline at α = 5° and α = 15°. The baseline VG geometry is used. αmean = 10°, A = 5° and k = 0.055.
Figure 4.
Wall y+ along the wing centerline at α = 5° and α = 15°. The baseline VG geometry is used. αmean = 10°, A = 5° and k = 0.055.

Figure 5.
Aerodynamic coefficients in light stall of the NREL S809 airfoil under pitch oscillation. αmean = 8°, A = 10°, k = 0.026, and Re = 1 × 10⁶: (a) Cl; (b) Cd; (c) Cm.
Figure 5.
Aerodynamic coefficients in light stall of the NREL S809 airfoil under pitch oscillation. αmean = 8°, A = 10°, k = 0.026, and Re = 1 × 10⁶: (a) Cl; (b) Cd; (c) Cm.


Figure 6.
Aerodynamic coefficients in deep stall of the NREL S809 airfoil under pitch oscillation. αmean = 20°, A = 10°, k = 0.078, and Re = 1 × 10⁶. (a) Cl; (b) Cd; (c) Cm.
Figure 6.
Aerodynamic coefficients in deep stall of the NREL S809 airfoil under pitch oscillation. αmean = 20°, A = 10°, k = 0.078, and Re = 1 × 10⁶. (a) Cl; (b) Cd; (c) Cm.

Figure 7.
Comparison of the calculated and experimental pressure distributions with and without the baseline VGs: (a) α = 10° without VGs; (b) α = 10° with VGs; (c) α = 15° without VGs; (d) α = 15° with VGs.
Figure 7.
Comparison of the calculated and experimental pressure distributions with and without the baseline VGs: (a) α = 10° without VGs; (b) α = 10° with VGs; (c) α = 15° without VGs; (d) α = 15° with VGs.

Figure 8.
Streamlines of the uncontrolled and controlled airfoil flow at α = 15°: (a) without VGs; (b) with VGs.
Figure 8.
Streamlines of the uncontrolled and controlled airfoil flow at α = 15°: (a) without VGs; (b) with VGs.

Figure 9.
Streamwise and normal velocity profiles at 25% c (left), 50% c (middle), and 75% c (right) chordwise locations at α = 15°. Sn denotes the normal distance away from the wall surface: (a) streamwise velocity profile; (b) normal velocity profile.
Figure 9.
Streamwise and normal velocity profiles at 25% c (left), 50% c (middle), and 75% c (right) chordwise locations at α = 15°. Sn denotes the normal distance away from the wall surface: (a) streamwise velocity profile; (b) normal velocity profile.

Figure 10.
Aerodynamic hysteresis of the lift coefficient with and without the baseline VGs at different reduced frequencies. Solid lines denote increasing AOA, and dashed lines decreasing AOA. αmean = 10° and A = 5°. (a) k = 0.028; (b) k = 0.055; (c) k = 0.083.
Figure 10.
Aerodynamic hysteresis of the lift coefficient with and without the baseline VGs at different reduced frequencies. Solid lines denote increasing AOA, and dashed lines decreasing AOA. αmean = 10° and A = 5°. (a) k = 0.028; (b) k = 0.055; (c) k = 0.083.

Figure 11.
Unsteady pressure distributions at the typical AOA over one pitch-oscillation cycle at k = 0.055. (a) α = 5° (min.); (b) α = 10° (mean value during the upstroke); (c) α = 15° (max.); (d) α = 10° (mean value during the downstroke).
Figure 11.
Unsteady pressure distributions at the typical AOA over one pitch-oscillation cycle at k = 0.055. (a) α = 5° (min.); (b) α = 10° (mean value during the upstroke); (c) α = 15° (max.); (d) α = 10° (mean value during the downstroke).

Figure 12.
Streamwise velocity profiles of the uncontrolled and controlled airfoil flow at different chordwise locations at αmean = 10°. (a) without VGs; (b) with VGs.
Figure 12.
Streamwise velocity profiles of the uncontrolled and controlled airfoil flow at different chordwise locations at αmean = 10°. (a) without VGs; (b) with VGs.


Figure 13.
Contour of streamwise velocity field around the airfoil and the streamwise velocity variation in the boundary layer at x = xVG + 4h and Sn = 0.5 h. (a) αmean = 10° during upstroke; (b) αmean = 10° during downstroke; (c) streamwise velocity variation.
Figure 13.
Contour of streamwise velocity field around the airfoil and the streamwise velocity variation in the boundary layer at x = xVG + 4h and Sn = 0.5 h. (a) αmean = 10° during upstroke; (b) αmean = 10° during downstroke; (c) streamwise velocity variation.

Figure 14.
Experimental lift and drag coefficients of the stationary airfoil with different VGs in vane height: (a) Cl; (b) Cd.
Figure 14.
Experimental lift and drag coefficients of the stationary airfoil with different VGs in vane height: (a) Cl; (b) Cd.

Figure 15.
Unsteady aerodynamic coefficients of the airfoil with different VGs in vane height. αmean = 10°, A = 5°, and k = 0.055: (a) Cl; (b) Cd; (c) Cm.
Figure 15.
Unsteady aerodynamic coefficients of the airfoil with different VGs in vane height. αmean = 10°, A = 5°, and k = 0.055: (a) Cl; (b) Cd; (c) Cm.

Figure 16.
Streamwise peak vorticity decay downstream of the different VGs in height. ωx,max denotes the streamwise peak vorticity, η the exponential decay exponent (related to the lines), and xVG,TE the chordwise location of VG trailing edge. (a) α = 5° (min.); (b) α = 15° (max.).
Figure 16.
Streamwise peak vorticity decay downstream of the different VGs in height. ωx,max denotes the streamwise peak vorticity, η the exponential decay exponent (related to the lines), and xVG,TE the chordwise location of VG trailing edge. (a) α = 5° (min.); (b) α = 15° (max.).

Figure 17.
Experimental lift and drag coefficients of the stationary airfoil with different VGs in chordwise installation. (a) Cl; (b) Cd.
Figure 17.
Experimental lift and drag coefficients of the stationary airfoil with different VGs in chordwise installation. (a) Cl; (b) Cd.

Figure 18.
Unsteady aerodynamic coefficients of the airfoil with different VGs in chordwise installation. αmean = 10°, A = 5°, and k = 0.055: (a) Cl; (b) Cd; (c) Cm.
Figure 18.
Unsteady aerodynamic coefficients of the airfoil with different VGs in chordwise installation. αmean = 10°, A = 5°, and k = 0.055: (a) Cl; (b) Cd; (c) Cm.

Figure 19.
Pressure distributions of the airfoil with different VGs in chordwise installation. (a) α = 5° (min.); (b) α = 15° (max.).
Figure 19.
Pressure distributions of the airfoil with different VGs in chordwise installation. (a) α = 5° (min.); (b) α = 15° (max.).


Table 1.
Main parameters of the vortex generators simulated in this study.
| Case Name | xVG/c (%) | h (mm) | d/h | D/h | L/h |
|---|---|---|---|---|---|
| Baseline | 20 | 5 | 3.5 | 7 | 3 |
| VG1 | 20 | 2.5 | 3.5 | 7 | 3 |
| VG2 | 20 | 10 | 3.5 | 7 | 3 |
| VG3 | 10 | 5 | 3.5 | 7 | 3 |
| VG4 | 40 | 5 | 3.5 | 7 | 3 |
| VG5 | 20 and 40 | 5 | 3.5 | 7 | 3 |
Table 2.
Results of the mesh dependency study with VGs at α = 11°.
| Variable | Mesh Resolution | Richardson Extrapolation | ||||
|---|---|---|---|---|---|---|
| Coarse (N) | Medium (N) | Fine (N) | RE (N) | p | R | |
| Lift force | 44.970 | 45.119 | 45.226 | 47.364 | 0.237 | 0.716 |
| Drag force | 0.744 | 0.704 | 0.689 | 0.660 | 2.403 | 0.370 |
Table 3.
Hysteresis intensity of the lift coefficient with and without the baseline VGs.
| Unsteadiness | k | εclean | εVGs | (εclean−εVGs)/εclean |
|---|---|---|---|---|
| Low | 0.028 | 0.640 | 0.268 | 58.2% |
| Moderate | 0.055 | 0.944 | 0.258 | 72.7% |
| High | 0.083 | 1.027 | 0.225 | 78.1% |
© 2019 by the authors. Licensee MDPI, Basel, Switzerland. This article is an open access article distributed under the terms and conditions of the Creative Commons Attribution (CC BY) license (http://creativecommons.org/licenses/by/4.0/).
Share and Cite
MDPI and ACS Style
Zhu, C.; Wang, T.; Wu, J. Numerical Investigation of Passive Vortex Generators on a Wind Turbine Airfoil Undergoing Pitch Oscillations. Energies 2019, 12, 654. https://doi.org/10.3390/en12040654
AMA Style
Zhu C, Wang T, Wu J. Numerical Investigation of Passive Vortex Generators on a Wind Turbine Airfoil Undergoing Pitch Oscillations. Energies. 2019; 12(4):654. https://doi.org/10.3390/en12040654
Chicago/Turabian StyleZhu, Chengyong, Tongguang Wang, and Jianghai Wu. 2019. "Numerical Investigation of Passive Vortex Generators on a Wind Turbine Airfoil Undergoing Pitch Oscillations" Energies 12, no. 4: 654. https://doi.org/10.3390/en12040654
Note that from the first issue of 2016, this journal uses article numbers instead of page numbers. See further details here.