Article

Optimization of Corn Steep Liquor Dosage and Other Fermentation Parameters for Ethanol Production by Saccharomyces cerevisiae Type 1 and Anchor Instant Yeast

by
Abiola Ezekiel Taiwo
*,
Tafirenyika Nyamayaro Madzimbamuto
and
Tunde Victor Ojumu
Department of Chemical Engineering, Cape Peninsula University of Technology, Cape Town 8000, South Africa
*
Author to whom correspondence should be addressed.
Energies 2018, 11(7), 1740; https://doi.org/10.3390/en11071740
Submission received: 19 May 2018 / Revised: 13 June 2018 / Accepted: 20 June 2018 / Published: 3 July 2018

Abstract

:
Bioethanol production has seen an increasing trend in research recently, with a focus on increasing its economic viability. The aim of this study is to develop a low-cost fermentation medium with a minimum of redundant nutritional supplements, thereby minimizing the costs associated with nutritional supplements and seed production. Corn steep liquor (CSL) in glucose fermentation by Saccharomyces Type 1 (ST1) strain and Anchor Instant Yeast (AIY), which are low-cost media, is used as a replacement for yeast extract (YE). The fermentation process parameters were optimized using artificial neural networks (ANN) and the response surface method (RSM). The study shows that for CSL, maximum average ethanol concentrations of 41.92 and 45.16 g/L, representing 82% and 88% of the theoretical yield, were obtained after 36 h of fermentation in a shake flask for ST1 and AIY, respectively. For YE, ethanol concentrations equivalent to 86% and 88% of theoretical yield were obtained with ST1 and AIY, respectively after 48 h. Although ANN better predicted the responses compared to RSM, optimum conditions were better predicted by RSM. This study shows that corn steep liquor is an inexpensive potential nutrient that may have significant cost implications for commercial ethanol production.

1. Introduction

The environmental and economic advantages of dependence on bioethanol, like other biofuels, and its production from varieties of biomass materials have been well reported [1,2]. The view of most research on bioethanol production is to increase yield at reduced cost [1]. Apart from carbon feedstock, nitrogen is another significant nutritional element needed for active microbial growth in the fermentation of most targeted bioactive compounds [3]. Nitrogen deficiency was responsible for the significant reduction in ethanol yield reported by Malherbe, et al. [4]; however, it is the most costly growth media among other components during fermentation [5,6]. Saccharomyces cerevisiae is commonly used for industrial production of bioethanol because of its ability to produce high ethanol concentrations, its low cost, and its easy availability [5,7]. It requires nitrogen compounds to form its own cellular protein and an adequate supply of nutrients to grow [8].
It has been reported that yeast performs better in media containing a mixture of amino acids and glutamic acids than in ammonium sulphate [9]. Although other sources of nitrogen such as yeast extract, beef extract, and malt extract have been reported to support microbial processes, the economic viability of these sources for bioethanol production on an industrial scale are in doubt due to their costs [10,11]. Corn steep liquor (CSL) has been identified as a cheap potential source of nitrogen in biochemical industries as an alternative to the costly nitrogen sources. It is a major side-product in the corn starch industry [3]. It is also a cheap source of proteins, amino acids, minerals, vitamins, and trace elements and can be used as a rich and effective nutritional substitute for expensive complex media like beef extract, meat extract, yeast extract, and peptone in fermentation studies [12,13,14,15]. Studies have shown that CSL can be used as a nutrition supplement and a cheap nitrogen source for cellular growth in the production of some fermentation products [12,14,16]. Edwinoliver et al. [14] showed that the utilization of CSL led to a reduction in the overall cost of lipase production medium by 55–60% of the total medium cost, thereby making the process economically attractive. CSL was also shown to be significant out of the ten low-cost media formulated for Clostridium ragsdalei in ethanol production [17]. Davis et al. [10] presented CSL as a good substitute for yeast extract in the fermentation of hydrolyzed waste starch stream for ethanol production without altering the kinetics of the reaction.
Although some optimization studies have been reported (see Table 1) with respect to the use of CSL as a nutritional enhancement in fermentation media [18,19,20], authors have used one variable at a time to establish their optimum conditions.
However, the fact that this method does not account for the interactive effects which may exist among the variables puts the reliability of such optimum conditions in doubt, especially if large-scale production is envisaged [23]. The interactive effect among the fermentation parameters can be ascertained through the use of effective optimization tools. Response Surface Methodology (RSM) is a statistical tool used for creating a relationship between a set of defined experimental variables and the observed results [24]. RSM quantifies the effect of the control variables, alone or in combination, on a selected response. In addition to analyzing the effects of the independent variables, this method also generates a mathematical expression that describes the relationship between variables and a selected response [25]. Pereira et al. [22] used a Placket–Burman design to initially select the critical nutrients for CSL and other low-cost nutrients for ethanol fermentation, followed by a Box–Behnken design for the optimization of the selected nutrients [22]. It is clear, however, that most of the critical nutrients selected for optimization may be redundant, as they are already contained in adequate quantities in CSL [26]; eliminating them may significantly improve the economics of the process, especially on an industrial scale. While the applicability of RSM to optimization studies has been demonstrated successfully [22,25,27], studies have also shown that its predictive capability may be limited [24,28]. Baş and Boyacı [24] reported that the second-order equation obtained from RSM did not show the interactive effects of pH and substrate concentration on the initial reaction rate of the enzymatic reaction in their study. Similar findings were reported in the lipase catalysis and optimization studies of borage oil: that there was no significant interaction among the variables considered using RSM [28].
Over the past years, data analysis tools such as artificial neural networks and evolutionary computing based on biological phenomena have evolved into well-established techniques for prediction and optimization of processes [29]. Artificial Neural Networks (ANNs) have found wide applications as a learning tool in bioprocessing, with focus areas such as pattern recognition, molecular sequences, data forecasting, and fermentation and optimization studies. [30]. An ANN is a model that processes information using the knowledge of biological nervous systems. It is made up of a vastly interconnected network structure consisting of many simple processing elements (the artificial neurons, units, or nodes) that are capable of performing parallel computation for data processing. The theoretical basis has been described in detail elsewhere [24,31]. ANN models have been reported to be preferred above RSM in accuracy and data prediction [32,33,34]. However, this may not be valid in all cases as the neural network is known for overfitting, which may cause overprediction and thus make validation of predicted data experimentally unrealistic [35,36].
This work is focused on the use of corn steep liquor as a cheap replacement for yeast extract such that the CSL dosage and other fermentation controlling parameters could be optimized, using RSM and ANN techniques, for ethanol production. The objective of this study is to develop a low-cost fermentation medium that is definite and devoid of redundant nutritional supplements, which may minimize the costs associated with the nutritional supplements and seed production that are essential for large-scale bioethanol production.

2. Results and Discussion

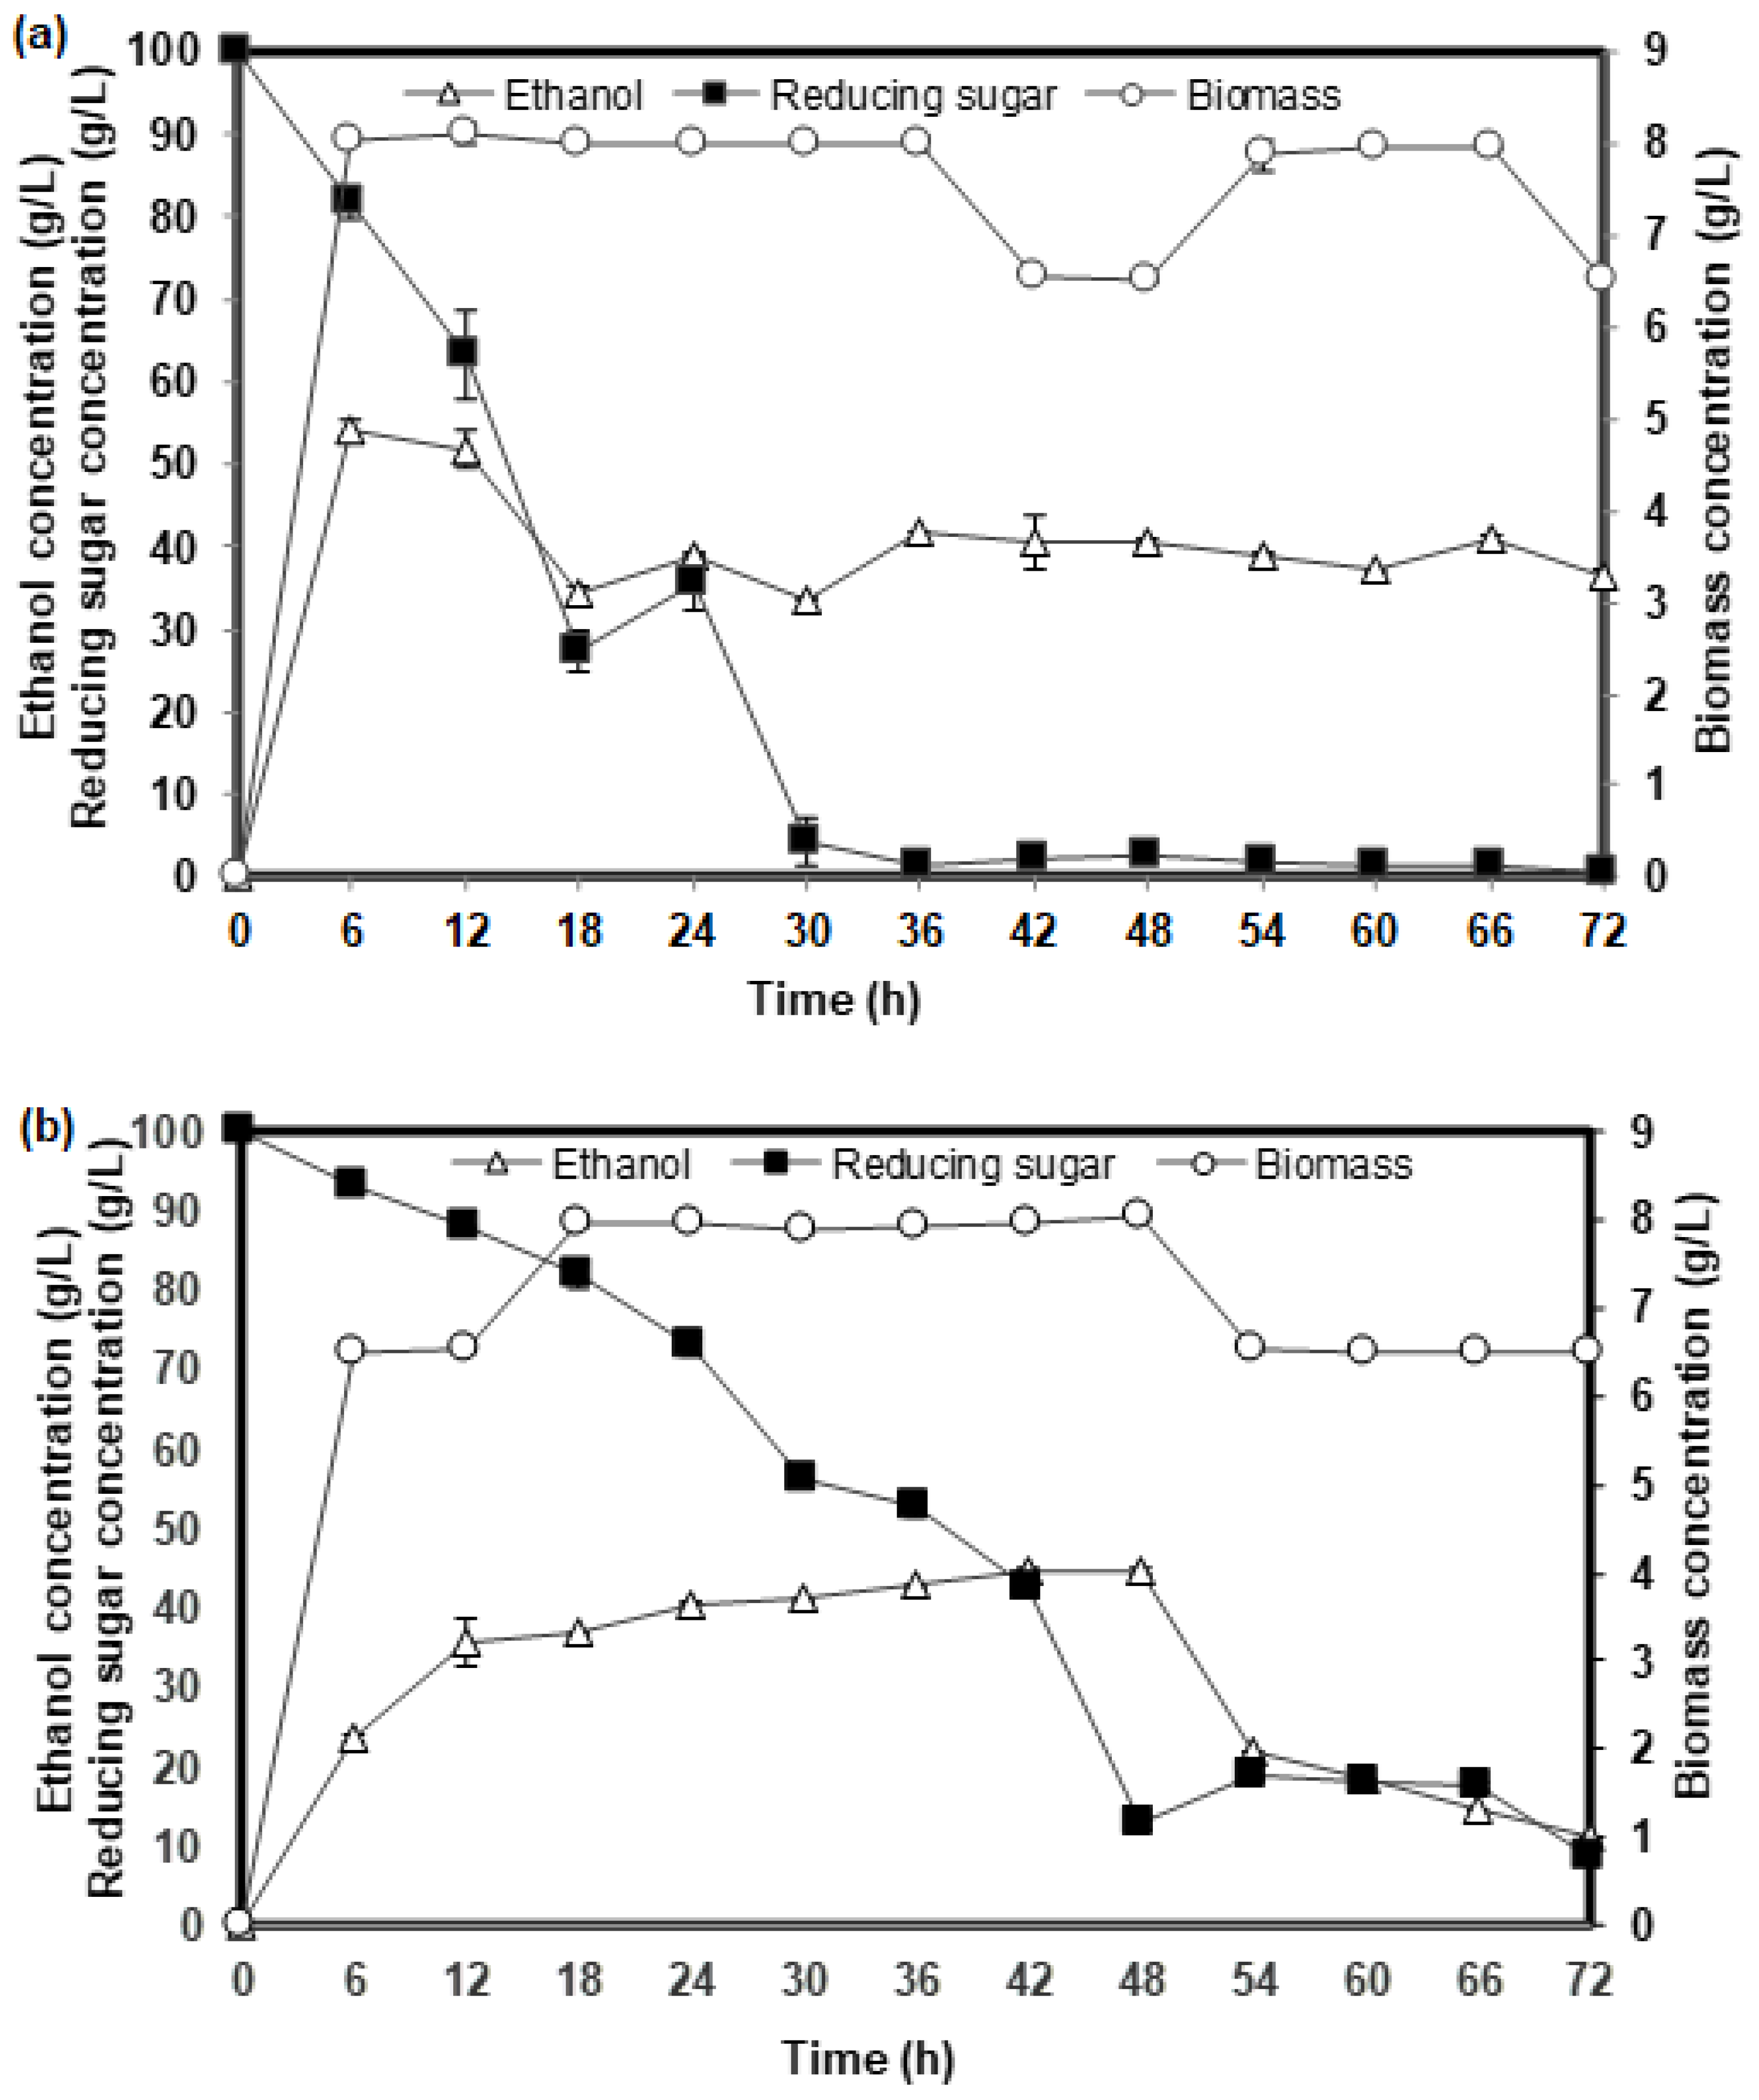
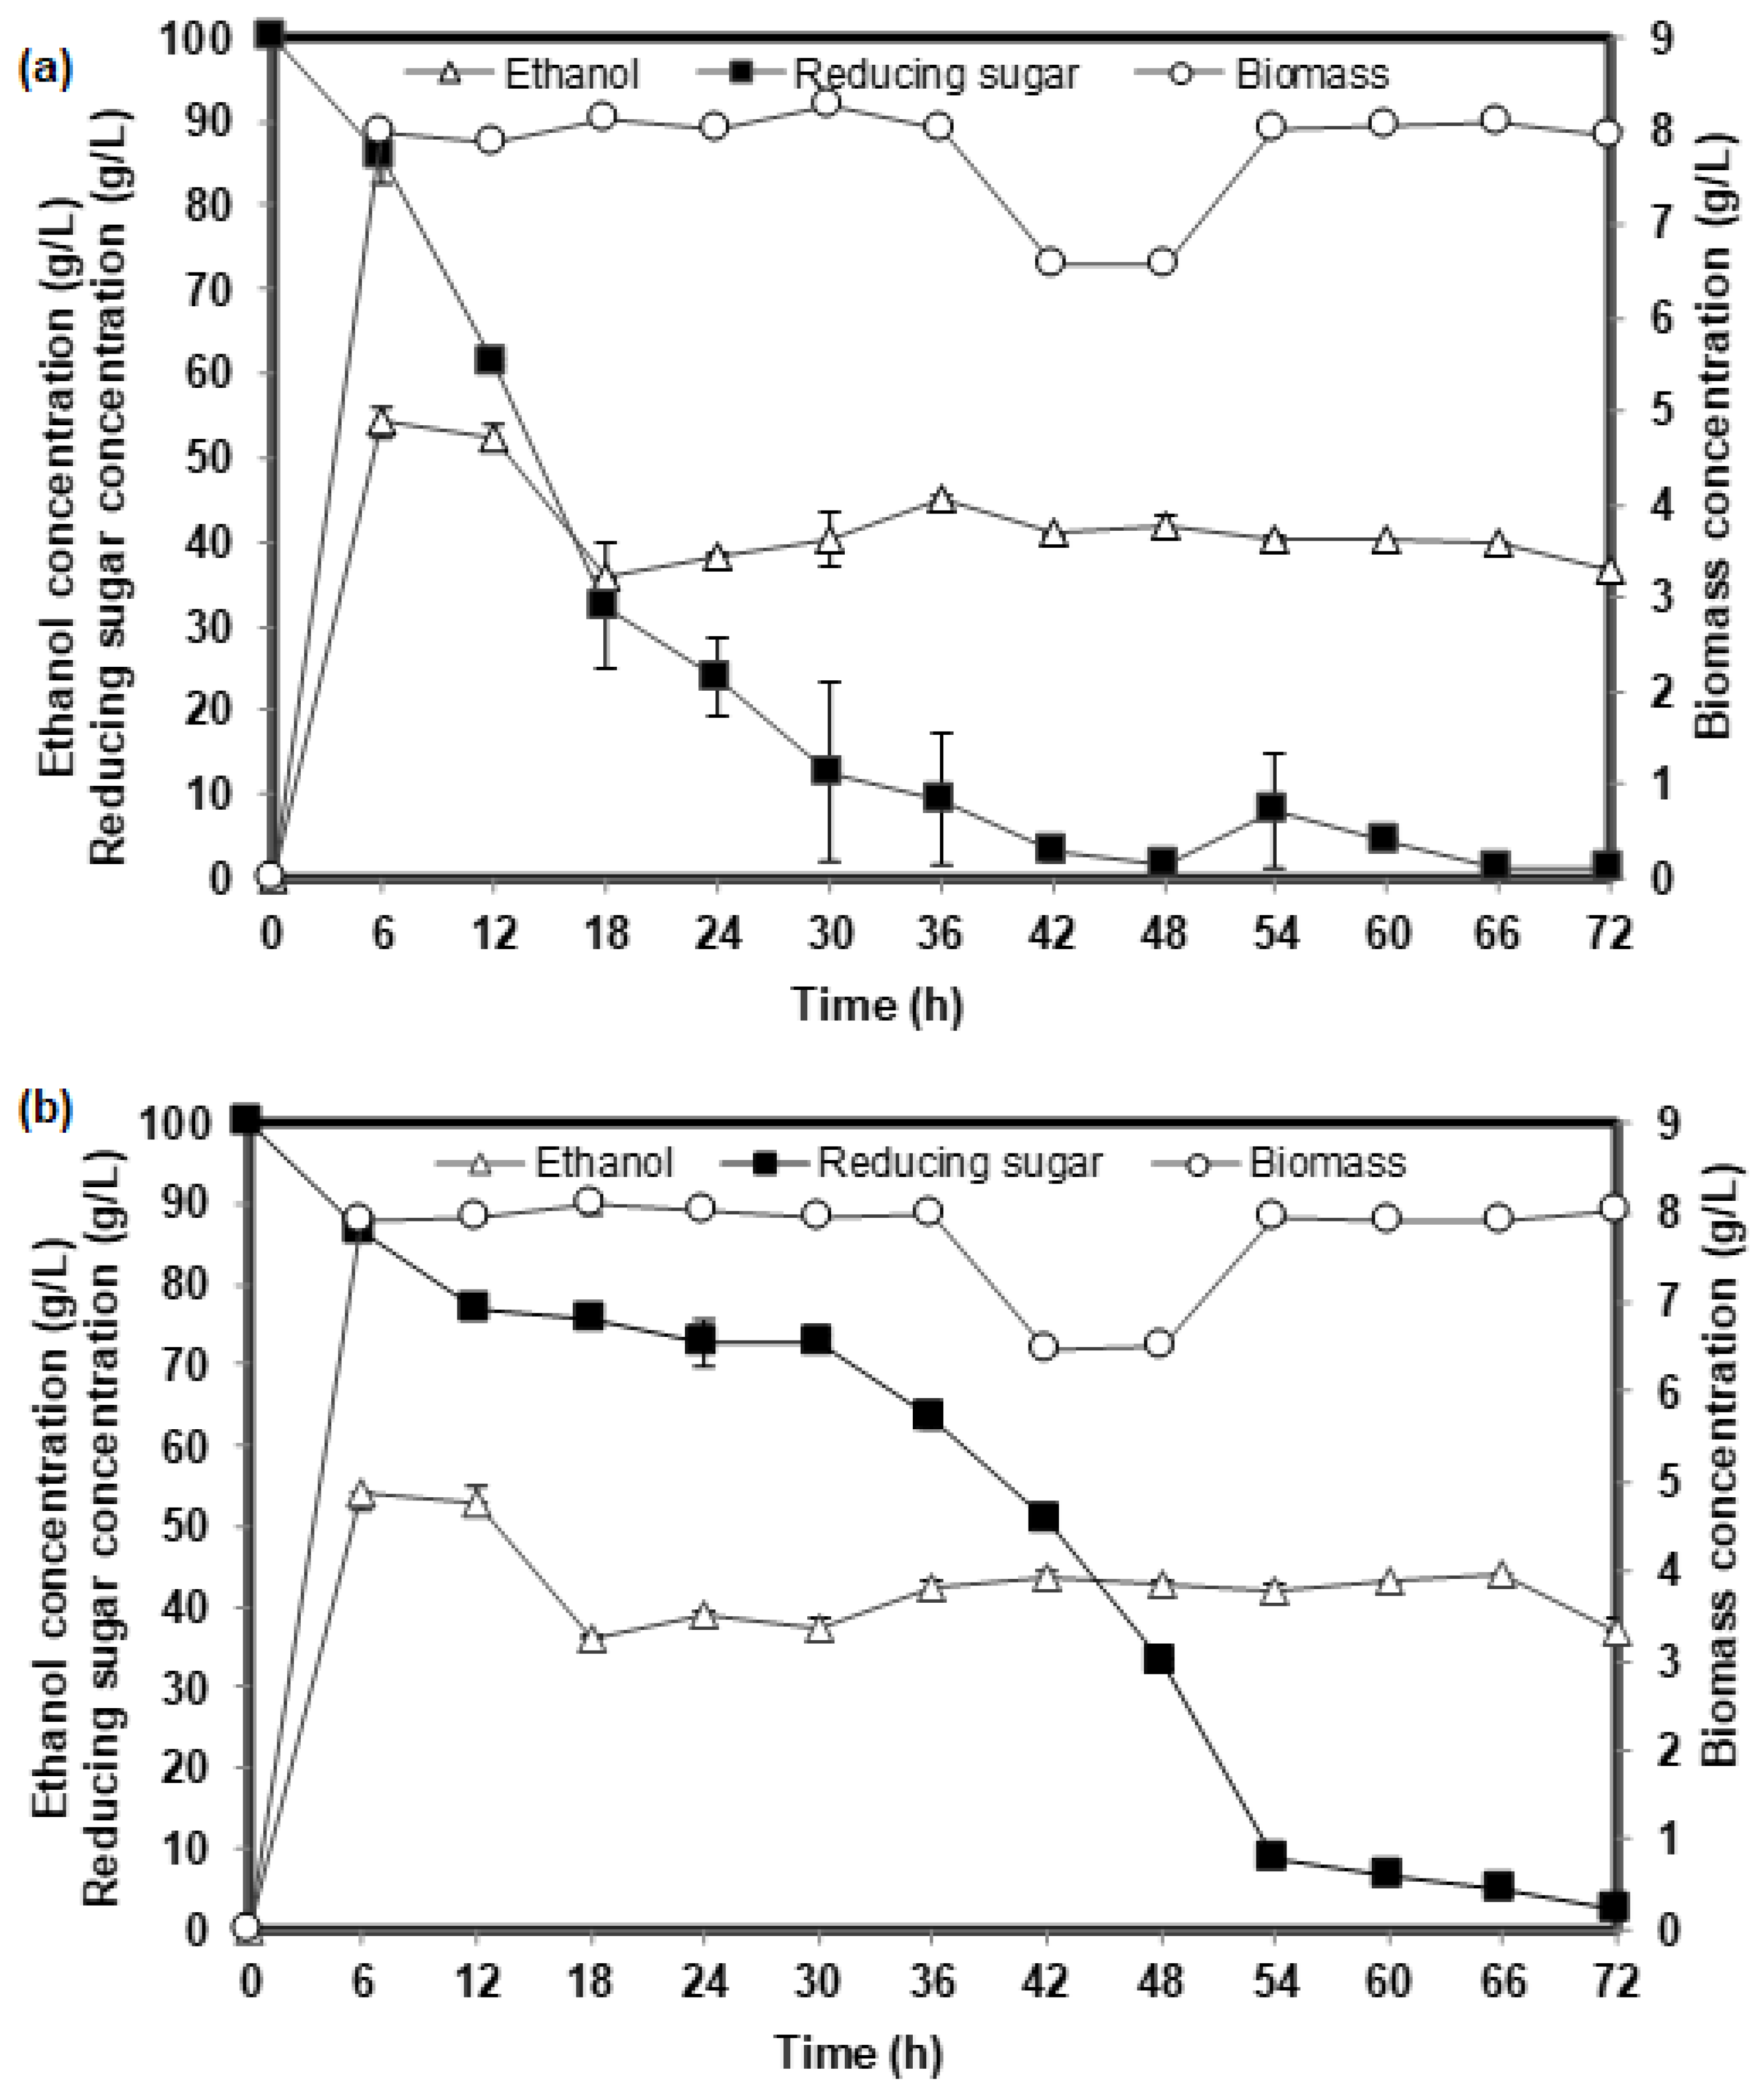
2.1. Comparison of the Fermentation Performance Based on Yeast Extract (YE) and Corn Steep Liquor (CSL) as Inoculum Component for Ethanol Fermentation of Two Yeast Strains

The effects of inoculum, yeast extract, and CSL on the fermentation performance of two yeast strains grown on glucose were investigated by examining the biomass growth, glucose consumption, and ethanol production. Figure 1a shows that CSL supports rapid utilization of the reducing sugar (from 100 g/L to 5 g/L) within the first 30 h of fermentation, whereas the resultant ethanol was already maximal in the first 6 h of fermentation, and so was the biomass growth. Díaz-Montaño [37] also confirmed that most Saccharomyces cerevisiae grew faster within the first 12 h of fermentation and that sugar was often depleted after 24 h of fermentation. The maximum biomass of 8 g/L was obtained, which was constant until 66 h, when it started to decline. The maximum ethanol concentration of 41.92 g/L (which corresponds to 82% of the theoretical yield) was constant and started to decline after 66 h. According to Gao et al. [17], the decline in ethanol yield could be attributable to the reassimilation of produced ethanol by this yeast strain, which might occur as a result of an increase in oxygenation of the fermentation medium. The presence of CSL in the inoculum and fermentation medium appeared to increase the consumption of glucose in the fermentation system for ethanol production, as displayed in Figure 1a. It was earlier stated that the addition of CSL in the fermentation broth increased substrate consumption and promoted high ethanol yield [38]. Although the ethanol concentration remained constant after the first 18 h of fermentation, it can be assumed that the energy derived from reducing sugar metabolism was channelled towards cell maintenance since biomass growth remained constant from the 6th to 66th hours of fermentation [38,39].
On the other hand, when yeast extract was used as the nitrogen source for both the inoculum and the fermentation medium, as depicted in Figure 1b, with 100 g/L of reducing sugar, a relatively slow consumption of the reducing sugar compared to Figure 1a was observed. When about 20% of the reducing sugar was converted (during the first 18 h of fermentation), the ethanol concentration had approached the maximum and so had the biomass growth, yielding 44.8 g/L (~88% theoretical value) and 8 g/L, respectively. It should be noted that malt extract was used as the plate medium of Saccharomyces Type 1 yeast to investigate the effect of CSL while yeast peptone dextrose agar was later used to plate the same yeast strain. However, with regard to the effect of yeast extract, the view is to rule out the possible transfer of the effect on the plate media extracts during the fermentation processes. However, the results showed that there was no significant difference when either malt extract or yeast peptone dextrose agar was used as the plate medium (data not shown). The results showed that addition of CSL reduced the fermentation time and promoted the growth of the organisms.
It can be seen from Figure 2a,b that fermentation progressed in a similar trend to that shown in Figure 1a,b above: in both figures, the biomass concentration peaked at 8 g/L after 6 h of fermentation while the ethanol concentration peaked at the same time. However, the decrease in biomass and ethanol concentrations at 42 h and 18 h, respectively, and the increased cell masses which were maintained after 12 h in Figure 1 and Figure 2 could be indicative of glucose limitation which may be synonymous with the crabtree effect; this cannot be ascertained at this stage [40,41]. The slow conversion of the reducing sugar was also observed with yeast extract as the nutrient source. A similar observation had earlier been reported [42]. In general, these results show that CSL supported rapid consumption of the reducing sugar by both microbes. The ethanol yields were similar when using either CSL or yeast extract as nutrient source for both microbes. The results also show that both microbes appeared to use the energy derived from the metabolism for cell maintenance rather than cell growth during fermentation.

2.2. Ethanol Production from Glucose Fermentation Using CSL Inoculum: Optimization Studies

Optimization studies were carried out using appropriately designed experimental techniques. CSL was used as the only nitrogen source in the inoculum for glucose fermentation. A total of 46 experiments were carried out and a quadratic regression equation was obtained. Thus, it was possible to obtain predictions from both the RSM and ANN models for the two yeast strains—Anchor Instant Yeast and Saccharomyces Type 1. It can be seen from Table 2 that for the AIY strain, an increase in volume of CSL (5.5% w/v) enhanced the concentration of ethanol in the fermented broth, even at low inoculum size. On the other hand, low CSL (0.5% w/v) made the ethanol concentration fall below 40 g/L (78% theoretical) until there was an increase in the volume of the inoculum size. A similar trend was observed for the ST1 strain. It was observed that there is a relationship between the concentration of CSL and the inoculum size. That is, for an increase in the concentration of CSL, a reduction of inoculum size is necessary for an increased yield of ethanol, and vice versa. The results show that the ethanol yield due to the increasing CSL is not significantly different from that due to increasing inoculum size under the same fermentation condition.
Sreenath and Jeffries [21] reported that the components of CSL support biomass growth and fermentation activity and influence production of ethanol. It has been reported that yeast derives its cellular protein primarily from nitrogen compounds [43]. The mycelial growth of the biomass was rapid when more CSL was used rather than a lower amount of the nitrogen source.

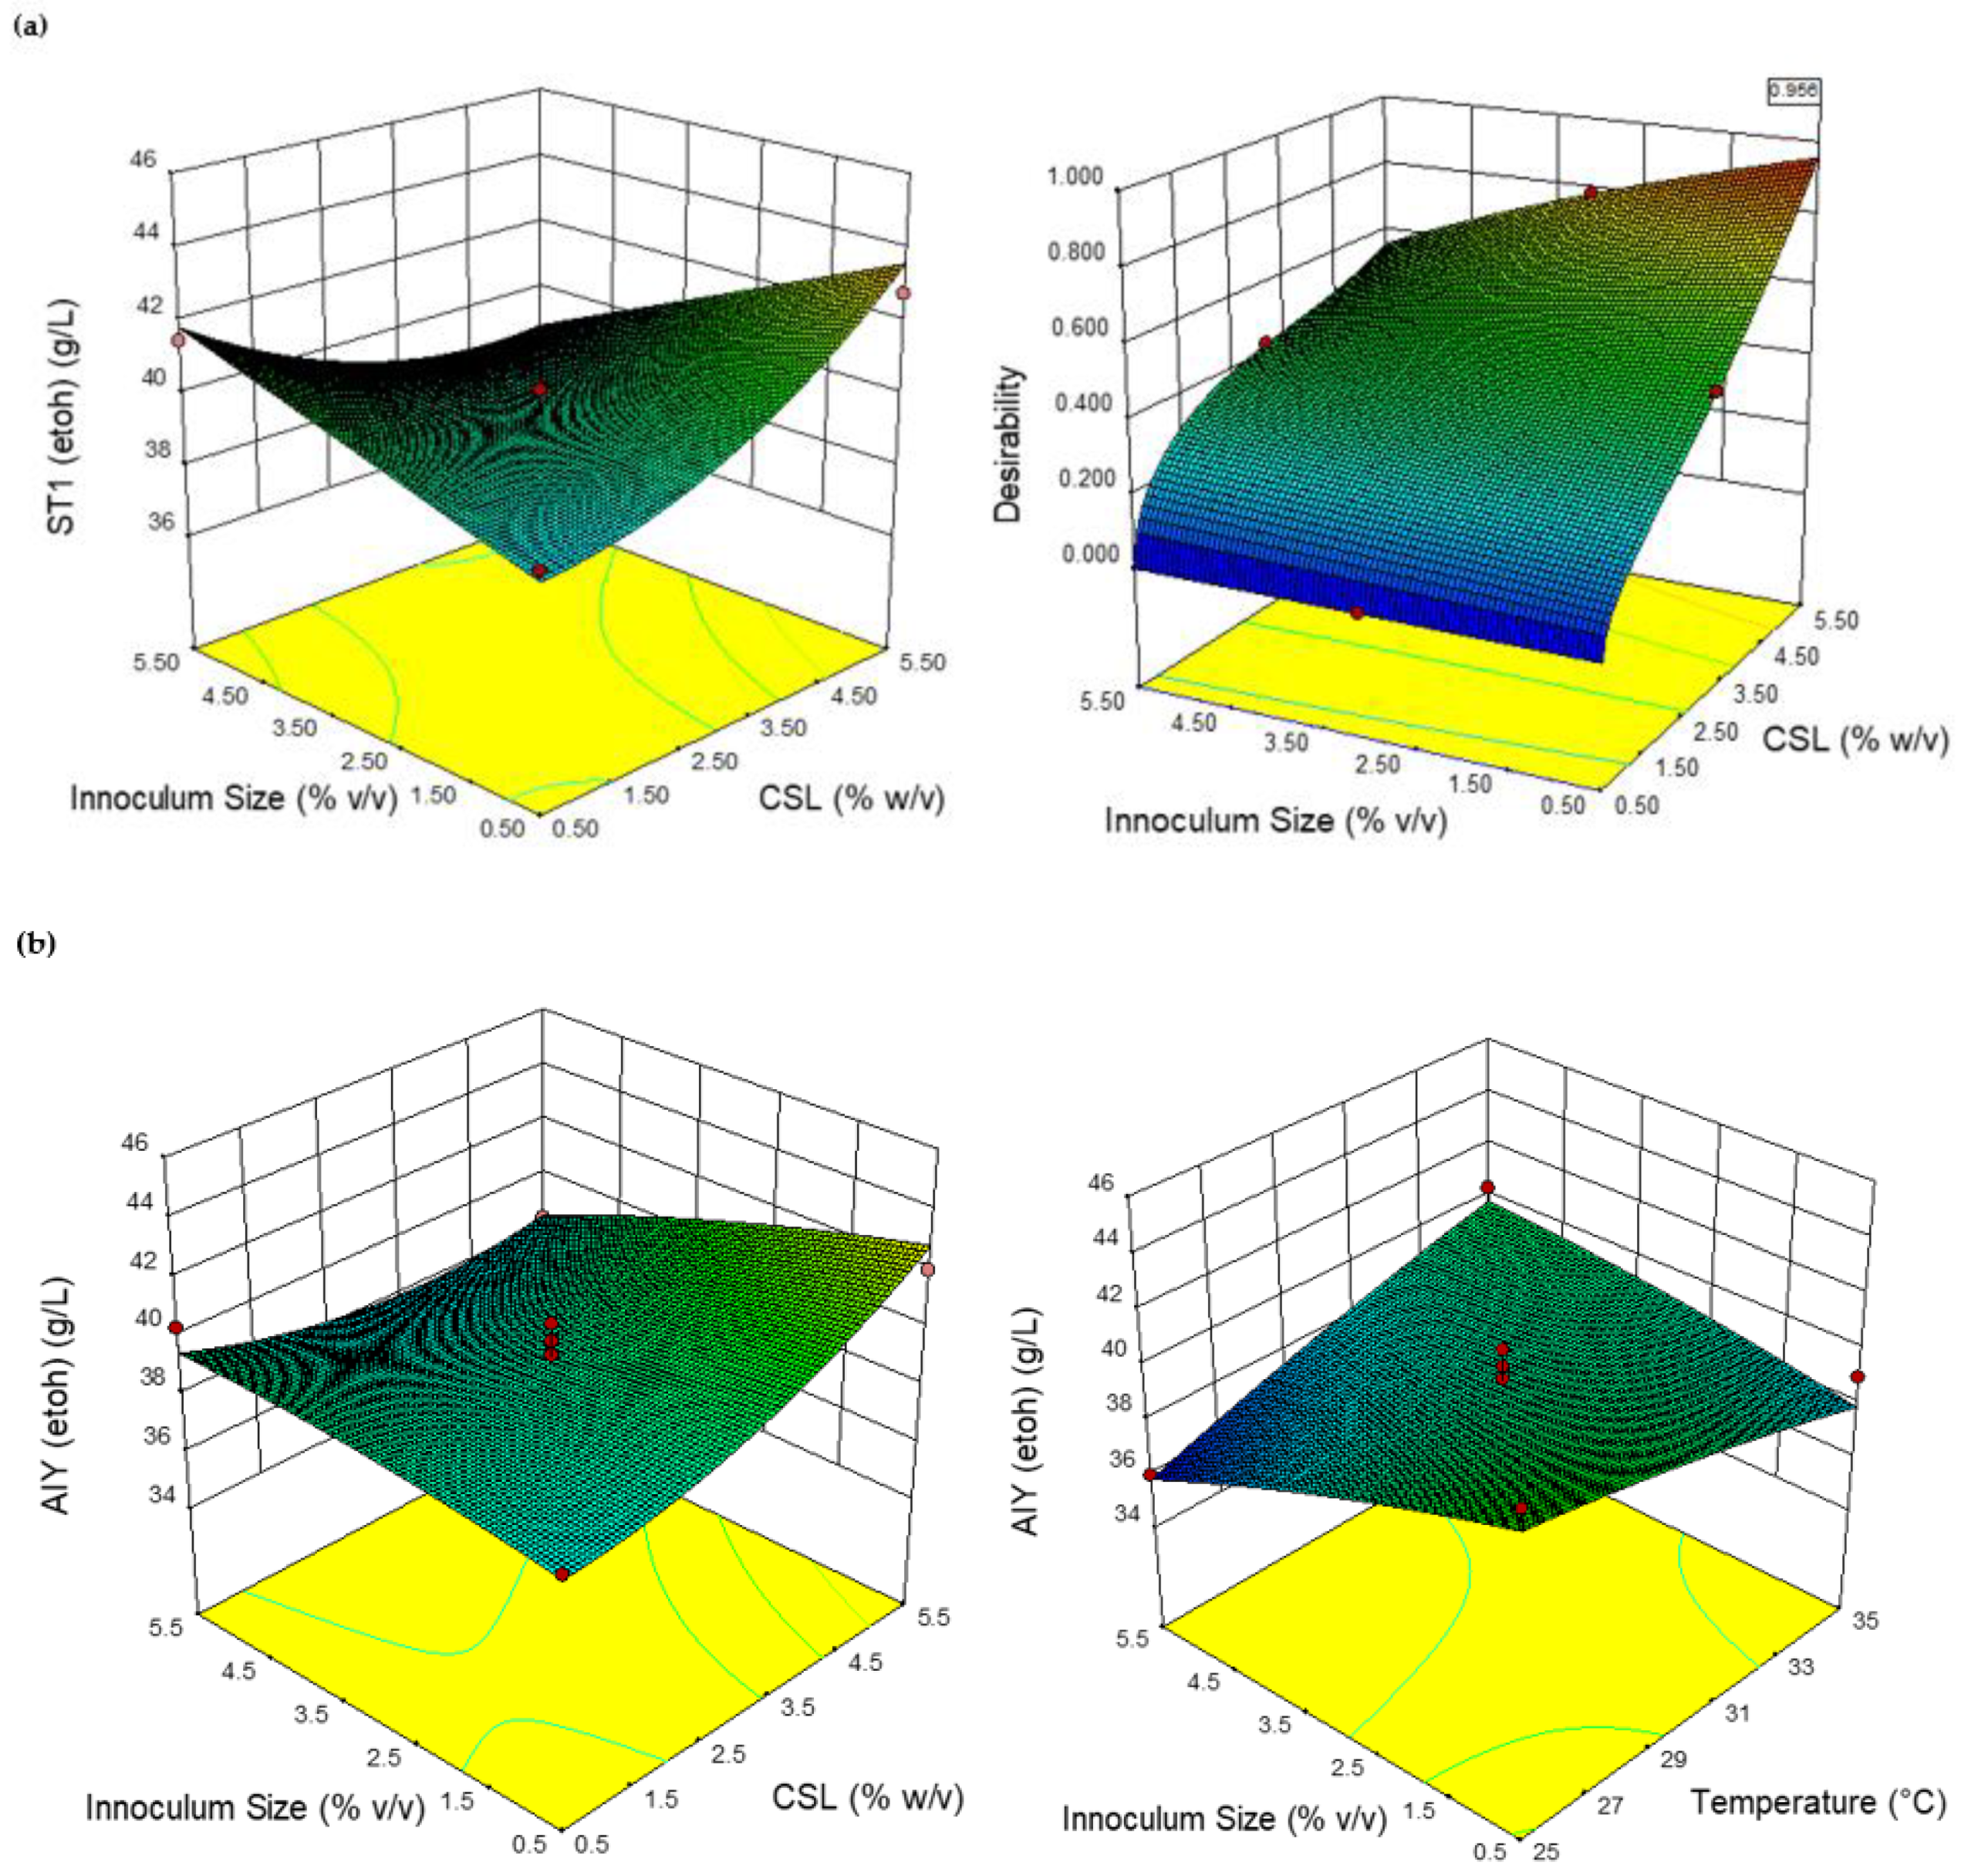
2.3. RSM Modeling Results for Ethanol Production

The results of the experimental design along with the predicted responses are shown in Table 3 for AIY and ST1 yeast strains. For the ST1 yeast strain, the results show that only the synergistic effect of CSL with the inoculum size was significant, e.g., p < 0.0001, while other fermentation parameters such as pH, temperature, and time did not show any significant interaction as presented in Table 4. It should be noted that these operating parameters were carefully chosen to lie within the normal operating condition for this strain as shown in Table 3, and may account for this observation [44]. While the p value indicates the significance of the model parameters, the Fisher test (F value) shows the level of significance of model parameters. However, it does not give a distinction between a positive or a negative significance in the model. The analysis of variance (ANOVA) of the regression equation model shows that the Model F value of 4.07 implies that the model is significant and that there is only a 0.44% chance that a “Model F Value” this large could occur due to noise. Equation (1) shows the fit of the reduced equation for ST1 grown in CSL for ethanol production.
ST1 (Ethanol) = 32.80 + 0.11X1 + 1.23X2 + 0.78X5 − 0.31X1X5 + 0.17X12
The response surface plot of the significant synergistic variable is depicted in Figure 3a. A significant positive influence of corn steep liquor and inoculum size can be clearly seen on ethanol concentration response. The desirability function (DF) graph was used to optimize the performance condition and the interaction effect of corn steep liquor and inoculum size, as in Figure 3a. The response surfaces of the desirability (D) between corn steep liquor and inoculum size were more than 0.92. This desirability of the optimized function obtained in this study was considered acceptable and ranged from 0.8 to 1 [45]. For the AIY yeast strain, the model Fisher test F value of 2.74 with corresponding low probability (p < 0.0001) implies that the model obtained is significant, as presented in Table 4. The results show that CSL, time, inoculum size, and the synergistic interaction of CSL and temperature with inoculum size were significant. Similarly, the double effect of CSL interaction recurred, as was observed in the ST1 strain reported earlier. The “Lack of Fit F value” of 2.82 implies that lack of fit is not significant relative to pure error. There is a 12.66% chance that a “Lack of fit F value” this large could occur due to noise. This implies that the model can suitably represent the actual relationship among selected factors. The final equation showing the terms of interaction in the second-order model is expressed in Equation (2).
AIY (Ethanol) = 39.19 + 0.82X1 − 1.01X3 − 0.84X5 − 1.32X1X5 + 1.785X4X5 + 0.94 X12
The graphical representation of the regression of Equation (2) in terms of significant relationships between variables is depicted in Figure 3b. The independent variables CSL, inoculum size, and temperature affected the ethanol concentration significantly. The increases in concentration of corn steep liquor influenced the concentration of ethanol and brought about a reduction in the use of inoculum size. Tesfaw and Assefa [46] also confirm the importance of the finding that lower inoculum size reduces the cost of production in ethanol fermentation. The mutually significant relationship between inoculum size and temperature was due to the use of a commercial strain (Anchor Instant Yeast) which operated within the specified temperature range (25–35 °C) in the design of the experiment.

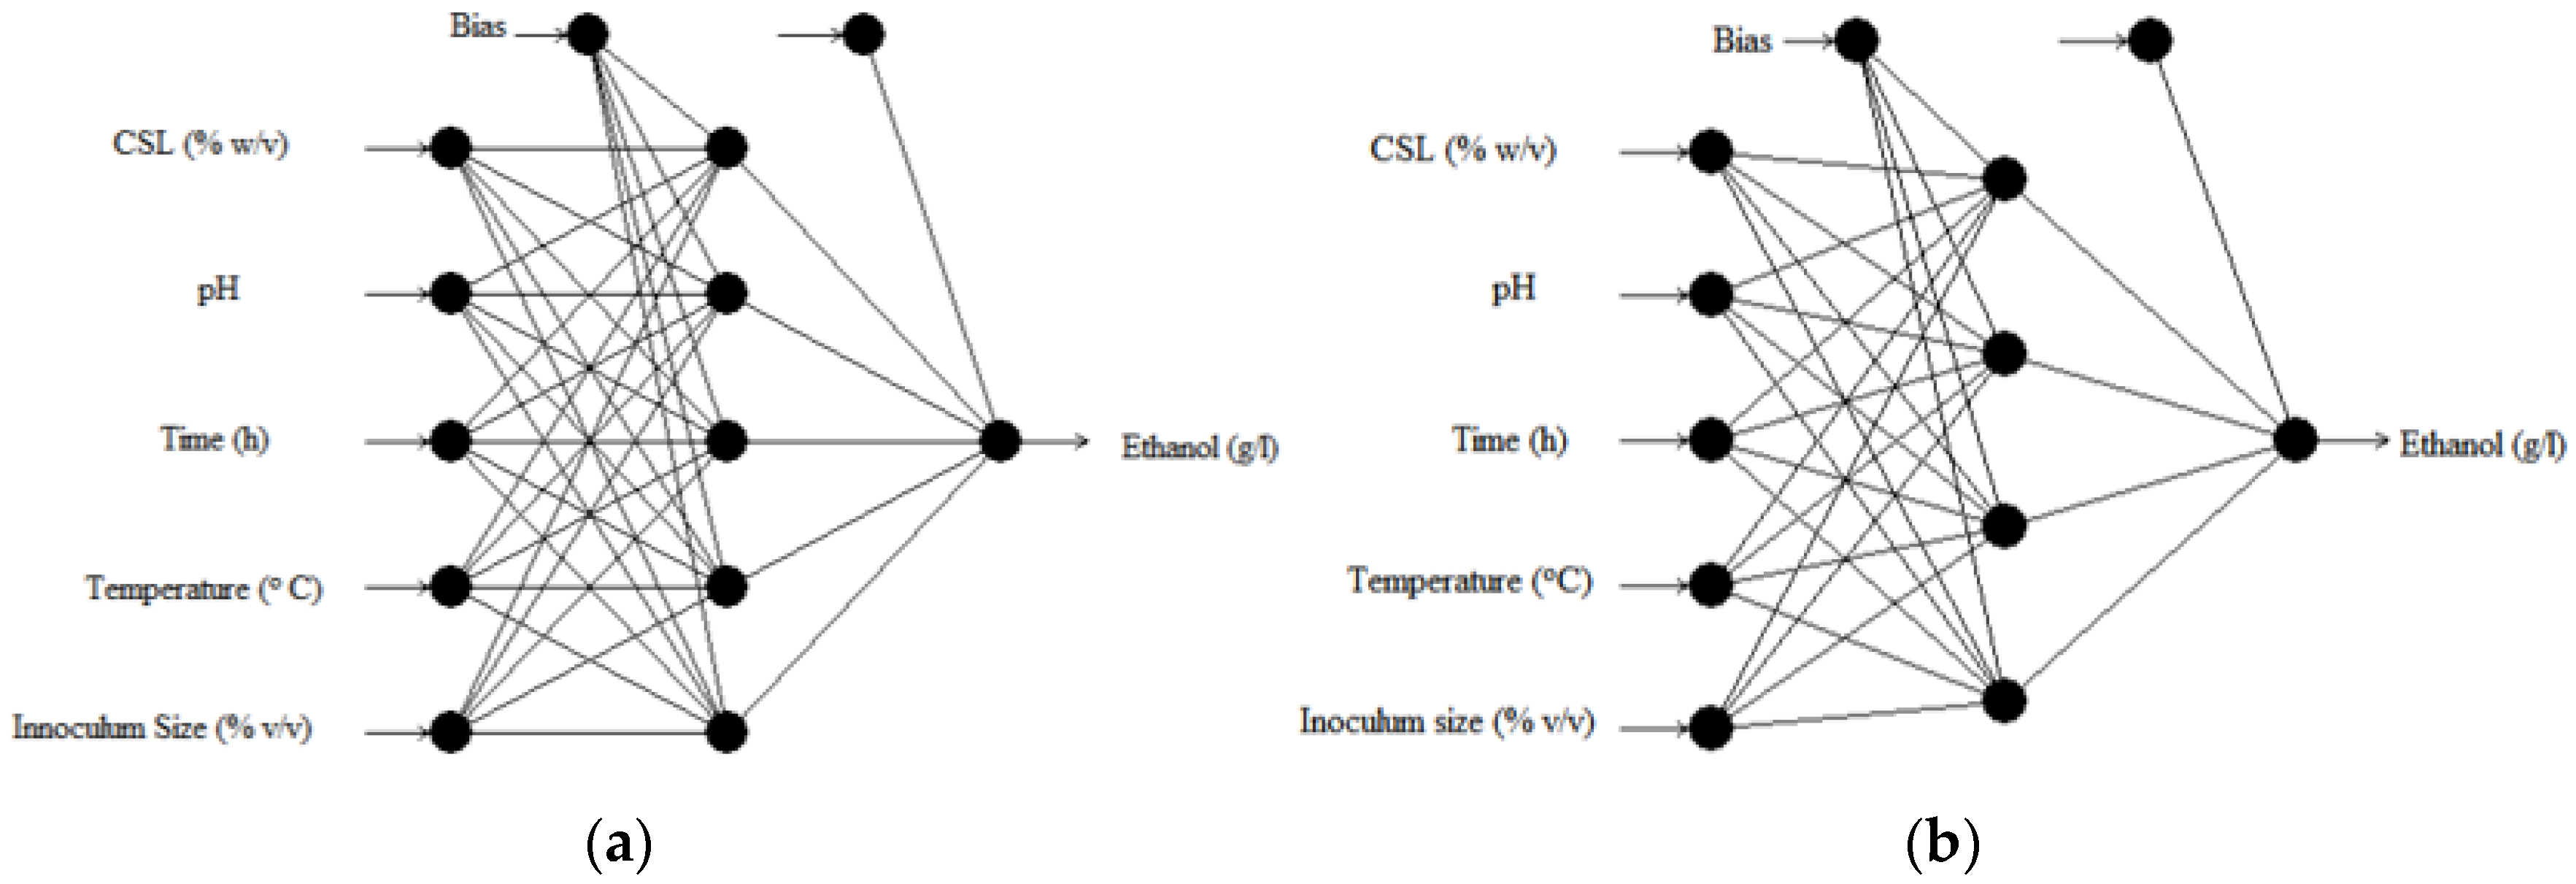
2.4. ANN Modeling Results for Ethanol Production

In the present study, a multilayer normal feedforward network with incremental backpropagation and Sigmoid as the transfer function is the preferred ANN model used for the ST1 strain, and hyperbolic tangent (Tanh) as transfer function for the AIY strain, consisting of 5-4-1 and 5-5-1 topologies, respectively, as shown in Table 5. The software default values of the network for learning rate and momentum were 0.15 and 0.8, respectively. In the case of the ST1 strain training data set, the root mean squared error (RMSE), the mean square error (MSE), the coefficient of determination (R2), and the absolute average deviation (AAD), were 0.2164, 0.04681, 0.9844, and 0.1613%, respectively, whereas for the testing data set, the RMSE, MSE, R2, and AAD were 0.1641, 0.02693, 0.9834, and 0.1402%, respectively, as seen in Table 5. Likewise, for the AIY strain training data set, the RMSE, MSE, R2, and AAD, were 0.4333, 0.1878, 0.9219, and 0.8260, respectively, whereas for the testing data, the RMSE, MSE, R2, and AAD were 0.1952, 0.0381, 0.986, and 0.3406, respectively, as displayed in Table 5. In the comparison of the predicted and observed responses in both the training and testing data sets, it is quite feasible that ANN did not only support the known data selected for the training but also has the ability for generalization of unknown data (the testing data set) [27]. This indicates that statistical models resulting from ANN can be adequately used to describe the input variables for ethanol production using the two yeast strains.

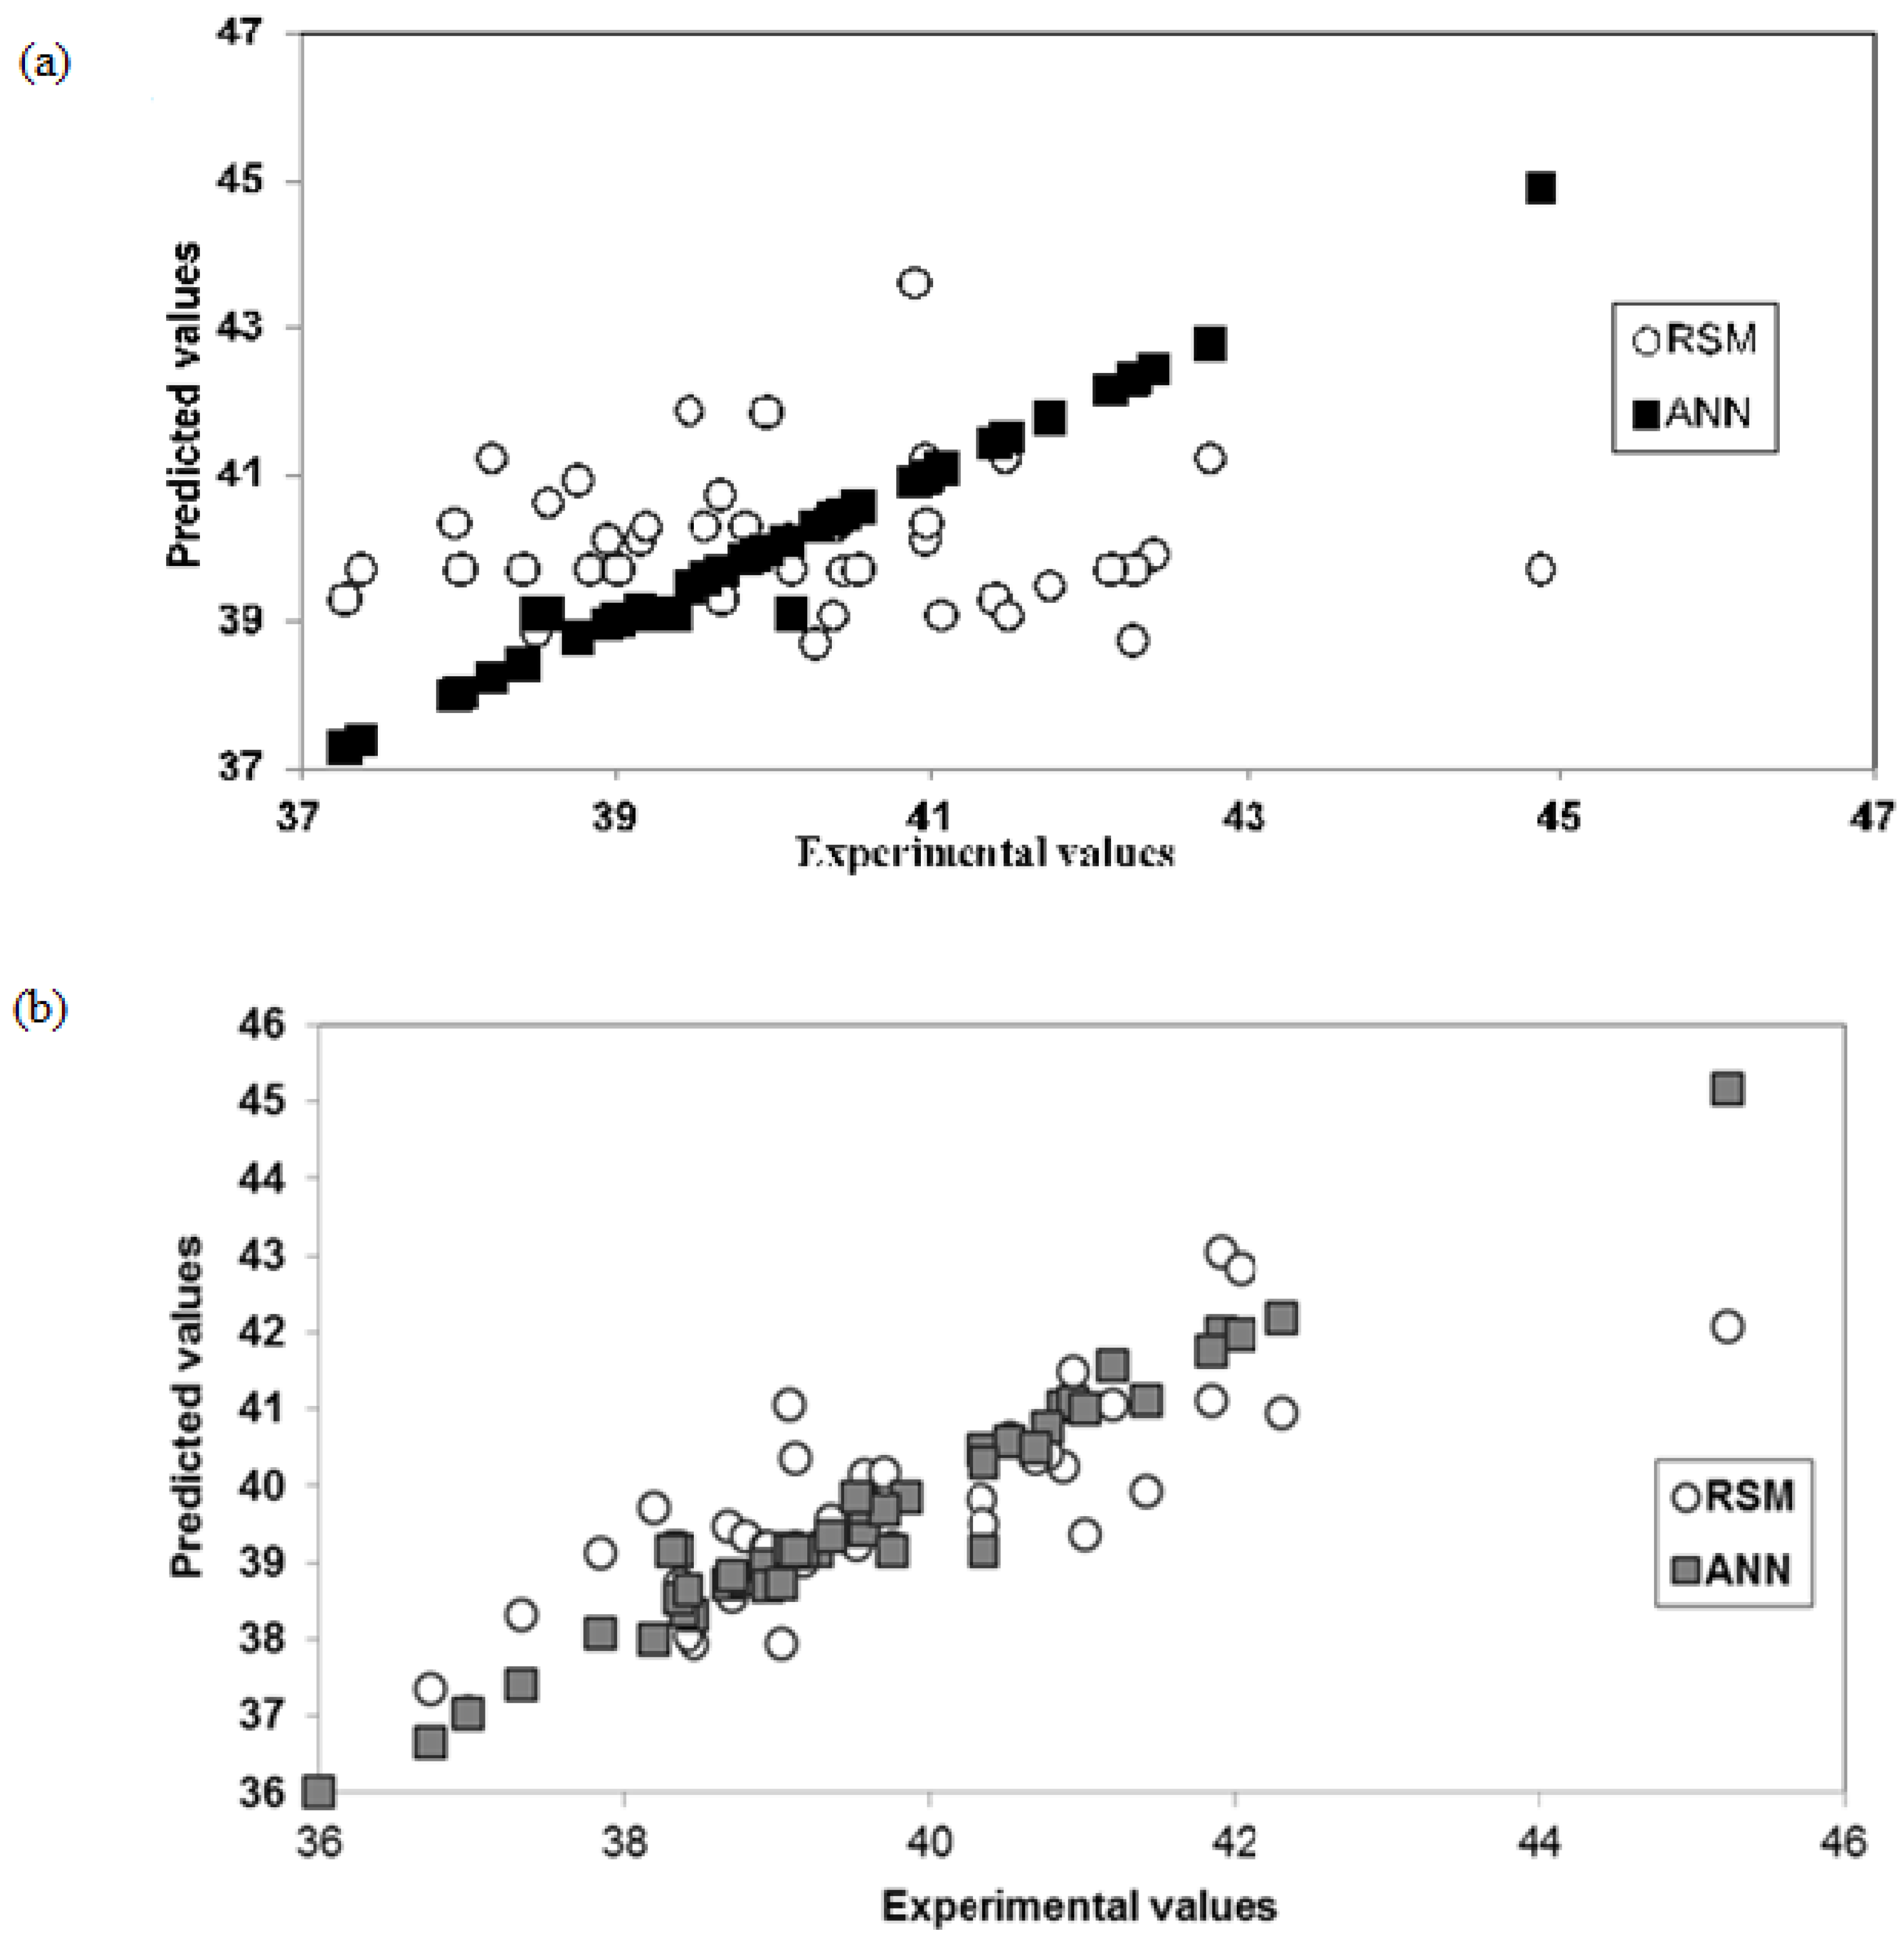
2.5. Comparing RSM and ANN Optimization for Ethanol Production from the Two Yeast Strains

The predicted and experimental ethanol output values of RSM and ANN are presented earlier in Table 3. The statistical measure comparing the whole data set for both RSM and ANN prediction and experimental values is estimated in Table 6. The data obtained from the experiments using AIY appears to perform better than that obtained using ST1 in terms of the relationship between the fermentation control parameters and the ethanol produced. However, the ANN-based approach was better in terms of fitting and estimation capabilities. That said, the RSM optimization of the process parameters was more accurate when validated against experimental data, as presented in Table 7. The better prediction capabilities of ANN were also confirmed by the parity plots between the predicted values and experimental values for the two strains used in ethanol production, as displayed in Figure 4a,b.

3. Materials and Methods

3.1. Microorganism and Inoculum Preparation

Dry yeast, Anchor Instant Yeast, a product of Rymco (Pty) Ltd (Maraisburg Rd, South Africa), 22 Bunsen Street, Industria, South Africa, and a yeast product from Sigma Aldrich (St. Louis, MO, USA) called Saccharomyces Type 1 (Baker’s yeast) were purchased for the study. The activation of the baker’s instant dry yeast was done by adding a spatula of the yeast to 150 mL distilled water in a 250 mL Duran flask and placing it on a shaking platform incubator (Labcon FSIM SP016, Zenfer manufacture Services CC., Maraisburg, South Africa) for 18 h [34]. The yeast was then plated and maintained on malt extract agar. The yeast was stored in a freezer and maintained at a temperature of 4 °C with a subculturing every two weeks. For the inocula, an inoculating loop was used to scoop cells from a colony on the agar plate and transfer them aseptically into a Duran flask (250 mL) containing 50 mL of sterilized medium. The inoculated flask was placed in an incubatory shaker at 200 rpm and 30 °C for 18–20 h before it was used to inoculate the media for the fermentation studies of bioethanol [34,43].

3.2. Media Composition

A modified method of Davis et al. [10] was used for the inoculum and fermentation medium for this study, in which yeast extract was replaced with corn steep liquor. The inoculum medium was composed of the following constituents (g/L): glucose 50; corn steep liquor 5; KH2PO4 2; MgSO4.7H2O 1; (NH4)2SO4 1. The fermentation medium was composed of the following: glucose (g/L) 100; KH2PO4 2; MgSO4.7H2O 1; (NH4)2SO4 1; corn steep liquor (0.5–5.5% w/v) as specified in fermentation variable design. The media and flasks were sterilized with an autoclave maintained at 121 °C for 15 min.

3.3. Submerged Fermentation Study

For the preliminary experimental study of ethanol production, 50 mL of glucose solution (100 g/L) was measured into a 250 mL Duran flask and nutrients were added properly. The pH of the medium was regulated with 3 M NaOH and 1 N HCl buffer solutions. Consequently, 5% volume per volume of the inoculum was added aseptically to the flask. The flasks were transferred into the platform shaker (model: FSIM SP016) at 30 °C and 198 rpm (3.3 Hz). Fermentation was performed for 72 h and sampling done every 6 h.

3.4. Experimental Design

Response Surface Methodology

A Box–Behnken design was used to study the relationship between five fermentation variables. The factorial design with five variables and three levels, including six replicates at the centre point, was used for fitting a quadratic response surface. A total of 46 runs were used to optimize the range and levels of chosen variables which were corn steep liquor (% w/v), pH, time (h), temperature (°C), and inoculum size (% v/v). The range and the levels of the independent variables investigated using the Box–Behnken experimental design in this study are shown in Table 8. The variables chosen for the study have been reported as part of the growth variables that support the specific rate of yeast growth and ethanol production, and their values were carefully chosen to fall within the values that were previously reported [46].

3.5. Analytical Procedures

The fermentation broth was centrifuged using a multitable centrifuge, (FrontierTM 5706, OHAUS Europe GmbH, Greifensee, Switzerland) at 4000 rpm for 15 min and the supernatant obtained was analyzed for ethanol concentrations while the residue was used for biomass analysis.

3.5.1. Reducing Sugar Analysis

The dinitrosalicyclic acid (DNS) method of Miller [47] was used in ascertaining the reducing sugar concentration and the results were expressed as glucose equivalent. To 1 mL of the supernatant broth, 3 mL of the DNS solution was added in the test tube and then heated for 15 min, cooled, and diluted appropriately. After this, the absorbance was measured at a wavelength of 540 nm using a UV–visible Spectrometer (GBC Cintra 2020, GBC Scientific Equipment Pty, Dandenong, Australia).

3.5.2. Ethanol Concentration Determination

The ethanol concentration in the fermentation broth was estimated using the dichromate method with spectrophotometry [48]. In a 50 mL volumetric flask containing 1 mL of the broth, 5 mL of sodium dichromate solution, 5 mL of acetate buffer of pH of 4.3, and 25 mL of 1 N HCl were added appropriately. A vortex mixer was used to shake the mixture for 1 min and placed at room temperature for 2 h until the green-colored reaction product was observed in the solution. The absorbance was read at 578 nm using a UV–visible Spectrometer (GBC Cintra 2020).

3.5.3. Biomass Concentration Determination

Dry Cell Weight (DCW) was obtained by centrifuging a known volume of the fermentation broth followed by oven drying of the cell residue to constant weight using an electric oven (Scientific, series 2000, Scientific Engineering (Pty) Ltd., Roodeport, South Africa), in a preweighed centrifuge tube at 105 °C for approximately 24 h. Thereafter, it was cooled in a desiccator. The biomass concentration was estimated on the basis of the volume of the fresh broth as the difference between the weight of the unused tube and the final weight of the tube plus the dried cells after cooling [34,43].

3.6. Modeling Studies

3.6.1. RSM Analysis

Regression analysis was performed on the observed data obtained from the design experiments. The ethanol concentration was taken as the dependent variable for the two yeast strains; these values are the mean of triplicate data from the fermentation procedure. A second-order polynomial regression model was assumed for a predicted response, shown earlier in Equation (1). Equation (3) gives the model proposed for each response of ethanol concentration on the two yeast strains:
Y = b 0 + i = 1 k b i X i + i = 1 k b i i X i 2 + i < j k b i j X i X j + e
where Y is the independent variable (ethanol concentration), b0 is the intercept value, bi (i=1, 2… k) is the first-order model coefficient, bij is the interaction effect, and bii represents the quadratic coefficients of Xi. Xi and Xj are the input variables that influence the response variable, and e represents the random error. This data was analysed using Design Expert version 10.0. (Stat Ease Inc., Minneapolis, MN, USA).

3.6.2. ANN Analysis

Commercially available Neural Power®, version 2.5 (CPC-X software, Carnegie, PA, USA), was employed in this study. This software has a graphical user interface (GUI) that supports different types of training algorithms. This enables the user to load the data sets, design the network structure, select the training algorithm, and generate the different models for each output variable in a single operation [49]. The networks were trained with incremental backpropagation as this has been reported to be the most commonly used algorithm [34]. To determine the optimal network structure, only one hidden layer was used and the numbers of hidden and output layers (sigmoid, hyperbolic tangent, Gaussian, linear, threshold linear, and bipolar linear) were iteratively determined by developing several networks. The effect of architecture and topology on the neural network performance on ethanol fermentation have been reported elsewhere [34]. Therefore, four and five layers were selected as the best numbers of hidden neurons for the ST1 and AIY strains, respectively, for ethanol production, as shown in Figure 5a,b.
The ANN model chosen in the present work is a multilayer normal feedforward network with incremental backpropagation and Sigmoid as the transfer function for the ST1 strain, and hyperbolic tangent as the transfer function for the AIY strain, consisting of 5-4-1 and 5-5-1 topologies, respectively (Figure 5). The ANN data sets were trained using Root Mean Square Error (RMSE), average Correlation Coefficient (R), and average Determination Coefficients (DC) as the stopping criteria at 0.0001, 1, and 1, respectively. The default values were unaltered for the remaining ANN parameters in the software. In Table 3, the Box Behnken design experimental data was divided into training and testing sets using the option available in the software: 30 of the data sets were used as training data and 16 were used as testing data. The training data was used to compute the network parameters. The testing data was used to ensure the robustness of the network parameters [50].

3.6.3. Predictability of Model Evaluated in Artificial Neural Network (ANN)

The predictive ability of the ANN methods is assessed on the basis of the mean square error (MSE), root mean squared error (RMSE), the coefficient of determination (R2), and the absolute average deviation (AAD) [49] between the predicted values of the network and the actual values, which are calculated by Equations (4)–(7) as follows:
MSE = 1 n i = 1 n ( y i y d i ) 2
RMSE = MSE 1 / 2
where n is the number of points, yi is the predicted value obtained from the neural network model, and ydi is the experimental value.
The coefficient of determination, R2, reflects the degree of fit for the mathematical model. The closer the R value is to 1, the better the model fits the actual data [50]:
R 2 = 1 i = 1 n ( ( y i y d i ) 2 ( y d i y m ) 2 )
where n is the number of points, yi is the predicted value obtained from the neural network model, yid is the experimental value, and ym is the average of the experimental values.
The Absolute Average Deviation (AAD) in Equation (7) is another important index to evaluate the ANN output error between the actual and the predicted output [34]:
AAD = { [ i = 1 n ( | y i y d i | / y d i ) ] / n } × 100
where yi and ydi are the predicted and actual responses, respectively, and n is the number of the points. The network with minimum MSE, RMSE, minimum AAD, and maximum R2 is considered to be the best neural network model [51].

4. Conclusions

CSL can be used as a lower-cost nutrient source in ethanol fermentation using ST1 and Anchor Instant Yeast (AIY) to replace more-expensive yeast extract (YE). CSL can be used for nutrient-enhanced ethanol production in a shorter fermentation time interval compared with YE. Our results show that the optimization methodologies described were effective in establishing the amount of CSL needed for scale-up of production. For the ST1 strain, the optimal condition values established for the ethanol concentration using RSM were CSL of 5.5 (% w/v), pH of 5, time of 27 h, temperature of 33 °C, inoculum size of 0.5% v/v, and with a predicted concentration of 44.20 g·L−1 volume fraction, which was experimentally validated as 43.38 ± 0.0002 g·L−1. The optimal condition values established for ethanol concentration using ANN were CSL of 0.5 (% w/v), pH of 5, time of 36 h, temperature of 34 °C, inoculum size of 5.49% v/v, and predicted concentration of 45.73 g·L−1, which was also validated experimentally as 41.30 ± 0.001 g·L−1. For the AIY strain, the optimal condition values established for the ethanol concentration using RSM were CSL of 5.36 (% w/v), pH of 4, time of 13 h, temperature of 28 °C, inoculum size of 0.72% v/v, and with predicted concentration of 45.48 g·L−1, which was experimentally validated as 45.36 ± 0.02 g·L−1. The optimal condition values established for ethanol concentration using ANN were CSL of 0.5 (% w/v), pH of 5, time of 36 h, temperature of 34 °C, and inoculum size of 5.49% v/v, and with predicted concentration of 45.73 g·L−1 which was also validated experimentally as 40.6 ± 0.01 g·L−1. The training algorithm used in this study was multilayer normal feedforward with incremental backpropagation. Comparing the efficacy of ANN with RSM in terms of the ability to predict the ethanol concentration in this study, it was demonstrated that ANN was better than RSM in both data fitting and estimation capabilities, but the RSM validation result was more accurate than that of ANN. This could be attributed to the small concentration of CSL predicted by ANN which could not favor the ethanol concentration. The study demonstrated that the commercial AIY yeast strain can perform almost the same as the industrial ST1 yeast strain, and that CSL is a good nitrogen supplement for ethanol production.

Author Contributions

A.E.T., T.N.M. and T.V.O. designed the experiment; A.E.T. performed the fermentation experiments and drafted the manuscript. T.V.O. and T.N.M. contributed research materials and provided necessary inputs for the revision of the manuscript as research advisors. All authors read and approved the final manuscript.

Funding

This research was funded by Cape Peninsula University of Technology (CPUT) through the university research fund (URF) programme.

Acknowledgments

A.E. Taiwo acknowledges the grant provided by National Research Foundation–Third World Academy of Sciences (NRF-TWAS), grant number (99988), for his doctoral studies, and the staff development support received from Landmark University, Omu-Aran, Nigeria.

Conflicts of Interest

The authors declare no conflict of interest.

References

  1. Hahn, R.; Cecot, C. The benefits and costs of ethanol: An evaluation of the government’s analysis. J. Regul. Econ. 2009, 35, 275–295. [Google Scholar] [CrossRef]
  2. Sebayang, A.H.; Hassan, M.H.; Ong, H.C.; Dharma, S.; Silitonga, A.S.; Kusumo, F.; Mahlia, T.M.I.; Bahar, A.H. Optimization of reducing sugar production from manihot glaziovii starch using response surface methodology. Energies 2017, 10, 35. [Google Scholar] [CrossRef]
  3. Tan, J.; Jahim, J.; Wu, T.; Harun, S.; Mumtaz, T. Use of corn steep liquor as an economical nitrogen source for biosuccinic acid production by Actinobacillus succinogenes. IOP Conf. Ser. Earth Environ. Sci. 2016, 36. [Google Scholar] [CrossRef]
  4. Malherbe, S.; Bauer, F.; Du Toit, M. Understanding problem fermentations: A review. S. Afr. J. Enol. Vitic. 2007, 28, 169–186. [Google Scholar] [CrossRef]
  5. Li, Z.; Wang, D.; Shi, Y.-C. Effects of nitrogen source on ethanol production in very high gravity fermentation of corn starch. J. Taiwan Inst. Chem. Eng. 2017, 70, 229–235. [Google Scholar] [CrossRef]
  6. Andualem, B.; Gessesse, A. Production of microbial medium from defatted brebra (milletia ferruginea) seed flour to substitute commercial peptone agar. Asian Pac. J. Trop. Biomed. 2013, 3, 790–797. [Google Scholar] [CrossRef]
  7. Azhar, S.H.M.; Abdulla, R.; Jambo, S.A.; Marbawi, H.; Gansau, J.A.; Faik, A.A.M.; Rodrigues, K.F. Yeasts in sustainable bioethanol production: A review. Biochem. Biophys. Rep. 2017, 10, 52–61. [Google Scholar]
  8. Broach, J.R. Nutritional control of growth and development in yeast. Genetics 2012, 192, 73–105. [Google Scholar] [CrossRef] [PubMed]
  9. Albers, E.; Larsson, C.; Lidén, G.; Niklasson, C.; Gustafsson, L. Influence of the nitrogen source on Saccharomyces cerevisiae anaerobic growth and product formation. Appl. Environ. Microbiol. 1996, 62, 3187–3195. [Google Scholar] [PubMed]
  10. Davis, L.; Rogers, P.; Pearce, J.; Peiris, P. Evaluation of zymomonas-based ethanol production from a hydrolysed waste starch stream. Biomass Bioenergy 2006, 30, 809–814. [Google Scholar] [CrossRef]
  11. Abbasiliasi, S.; Tan, J.S.; Ibrahim, T.A.T.; Bashokouh, F.; Ramakrishnan, N.R.; Mustafa, S.; Ariff, A.B. Fermentation factors influencing the production of bacteriocins by lactic acid bacteria: A review. RSC Adv. 2017, 7, 29395–29420. [Google Scholar] [CrossRef]
  12. Lawford, H.G.; Rousseau, J.D. Corn steep liquor as a cost-effective nutrition adjunct in high-performancezymomonas ethanol fermentations. Appl. Biochem. Biotechnol. 1997, 63, 287–304. [Google Scholar] [CrossRef] [PubMed]
  13. Seo, H.-B.; Kim, S.S.; Lee, H.-Y.; Jung, K.-H. High-level production of ethanol during fed-batch ethanol fermentation with a controlled aeration rate and non-sterile glucose powder feeding of Saccharomyces cerevisiae. Biotechnol. Bioprocess Eng. 2009, 14, 591–598. [Google Scholar] [CrossRef]
  14. Edwinoliver, N.; Thirunavukarasu, K.; Purushothaman, S.; Rose, C.; Gowthaman, M.; Kamini, N. Corn steep liquor as a nutrition adjunct for the production of Aspergillus niger lipase and hydrolysis of oils thereof. J. Agric. Food Chem. 2009, 57, 10658–10663. [Google Scholar] [CrossRef] [PubMed]
  15. Tang, Y.; An, M.; Liu, K.; Nagai, S.; Shigematsu, T.; Morimura, S.; Kida, K. Ethanol production from acid hydrolysate of wood biomass using the flocculating yeast Saccharomyces cerevisiae strain kf-7. Process Biochem. 2006, 41, 909–914. [Google Scholar] [CrossRef]
  16. Souza, A.F.; Rodriguez, D.M.; Ribeaux, D.R.; Luna, M.A.; Lima e Silva, T.A.; Andrade, R.F.S.; Gusmão, N.B.; Campos-Takaki, G.M. Waste soybean oil and corn steep liquor as economic substrates for bioemulsifier and biodiesel production by candida lipolytica UCP 0998. Int. J. Mol. Sci. 2016, 17, 1608. [Google Scholar] [CrossRef] [PubMed]
  17. Gao, J.; Atiyeh, H.K.; Phillips, J.R.; Wilkins, M.R.; Huhnke, R.L. Development of low cost medium for ethanol production from syngas by clostridium ragsdalei. Bioresour. Technol. 2013, 147, 508–515. [Google Scholar] [CrossRef] [PubMed]
  18. Saxena, J.; Tanner, R.S. Optimization of a corn steep medium for production of ethanol from synthesis gas fermentation by clostridium ragsdalei. World J. Microbiol. Biotechnol. 2012, 28, 1553–1561. [Google Scholar] [CrossRef] [PubMed]
  19. Maddipati, P.; Atiyeh, H.K.; Bellmer, D.D.; Huhnke, R.L. Ethanol production from syngas by clostridium strain p11 using corn steep liquor as a nutrient replacement to yeast extract. Bioresour. Technol. 2011, 102, 6494–6501. [Google Scholar] [CrossRef] [PubMed]
  20. Kundiyana, D.K.; Huhnke, R.L.; Wilkins, M.R. Syngas fermentation in a 100-l pilot scale fermentor: Design and process considerations. J. Biosci. Bioeng. 2010, 109, 492–498. [Google Scholar] [CrossRef] [PubMed]
  21. Sreenath, H.K.; Jeffries, T.W. Effect of corn steep liquor on fermentation of mixed sugars by candida shehatae fpl-702. Appl. Biochem. Biotechnol. 1996, 57, 551–561. [Google Scholar] [CrossRef]
  22. Pereira, F.B.; Guimarães, P.M.; Teixeira, J.A.; Domingues, L. Optimization of low-cost medium for very high gravity ethanol fermentations by Saccharomyces cerevisiae using statistical experimental designs. Bioresour. Technol. 2010, 101, 7856–7863. [Google Scholar] [CrossRef] [PubMed] [Green Version]
  23. Açıkel, Ü.; Erşan, M.; Açıkel, Y.S. Optimization of critical medium components using response surface methodology for lipase production by rhizopus delemar. Food Bioprod. Process 2010, 88, 31–39. [Google Scholar] [CrossRef]
  24. Baş, D.; Boyacı, İ.H. Modeling and optimization ii: Comparison of estimation capabilities of response surface methodology with artificial neural networks in a biochemical reaction. J. Food Eng. 2007, 78, 846–854. [Google Scholar] [CrossRef]
  25. Osunkanmibi, O.B.; Owolabi, T.O.; Betiku, E. Comparison of artificial neural network and response surface methodology performance on fermentation parameters optimization of bioconversion of cashew apple juice to Gluconic acid. Int. J. Food Eng. 2015, 11, 393–403. [Google Scholar] [CrossRef]
  26. Hull, S.R.; Yang, B.Y.; Venzke, D.; Kulhavy, K.; Montgomery, R. Composition of corn steep water during steeping. J. Agric. Food Chem. 1996, 44, 1857–1863. [Google Scholar] [CrossRef]
  27. Oyeniran, O.; Taiwo, A.; Betiku, E. A modeling study by response surface methodology on the culture parameters optimization of citric acid bioproduction from sweet potato peel. Ife J. Technol. 2013, 22, 21–25. [Google Scholar]
  28. Senanayake, S.N.; Shahidi, F. Lipase-catalyzed incorporation of Docosahexaenoic acid (DHA) into borage oil: Optimization using response surface methodology. Food Chem. 2002, 77, 115–123. [Google Scholar] [CrossRef]
  29. Ebrahimpour, A.; Rahman, R.N.Z.R.A.; Ch’ng, D.H.E.; Basri, M.; Salleh, A.B. A modeling study by response surface methodology and artificial neural network on culture parameters optimization for thermostable lipase production from a newly isolated thermophilic Geobacillus sp. strain ARM. BMC Biotechnol. 2008, 8, 96. [Google Scholar] [CrossRef] [PubMed]
  30. Dumancas, G.G.; Adrianto, I.; Bello, G.; Dozmorov, M. Current developments in machine learning techniques in biological data mining. Bioinf. Biol. Insights 2017, 11, 1–4. [Google Scholar] [CrossRef] [PubMed]
  31. Wesolowski, M.; Suchacz, B. Artificial neural networks: Theoretical background and pharmaceutical applications: A review. J. AOAC Int. 2012, 95, 652–668. [Google Scholar] [CrossRef] [PubMed]
  32. Betiku, E.; Omilakin, O.R.; Ajala, S.O.; Okeleye, A.A.; Taiwo, A.E.; Solomon, B.O. Mathematical modeling and process parameters optimization studies by artificial neural network and response surface methodology: A case of non-edible neem (Azadirachta indica) seed oil biodiesel synthesis. Energy 2014, 72, 266–273. [Google Scholar] [CrossRef]
  33. Ighose, B.O.; Adeleke, I.A.; Damos, M.; Junaid, H.A.; Okpalaeke, K.E.; Betiku, E. Optimization of biodiesel production from thevetia peruviana seed oil by adaptive neuro-fuzzy inference system coupled with genetic algorithm and response surface methodology. Energy Convers. Manag. 2017, 132, 231–240. [Google Scholar] [CrossRef]
  34. Betiku, E.; Taiwo, A.E. Modeling and optimization of bioethanol production from breadfruit starch hydrolyzate vis-à-vis response surface methodology and artificial neural network. Renew. Energy 2015, 74, 87–94. [Google Scholar] [CrossRef]
  35. Tu, J.V. Advantages and disadvantages of using artificial neural networks versus logistic regression for predicting medical outcomes. J. Chronic Dis. 1996, 49, 1225–1231. [Google Scholar] [CrossRef]
  36. Schmidhuber, J. Deep learning in neural networks: An overview. Neural Netw. 2015, 61, 85–117. [Google Scholar] [CrossRef] [PubMed] [Green Version]
  37. Díaz-Montaño, D.M. Continuous agave juice fermentation for producing bioethanol. In Biomass Now-Sustainable Growth and Use; InTech: London, UK, 2013. [Google Scholar]
  38. Sarks, C.; Jin, M.; Sato, T.K.; Balan, V.; Dale, B.E. Studying the rapid bioconversion of lignocellulosic sugars into ethanol using high cell density fermentations with cell recycle. Biotechnol. Biofuels 2014, 7, 73. [Google Scholar] [CrossRef] [PubMed] [Green Version]
  39. Rebnegger, C.; Vos, T.; Graf, A.B.; Valli, M.; Pronk, J.T.; Daran-Lapujade, P.; Mattanovich, D. Pichia pastoris exhibits high viability and a low maintenance energy requirement at near-zero specific growth rates. Appl. Environ. Microbiol. 2016, 82, 4570–4583. [Google Scholar] [CrossRef] [PubMed]
  40. Pfeiffer, T.; Morley, A. An evolutionary perspective on the crabtree effect. Front. Mol. Biosci. 2014, 1, 17. [Google Scholar] [CrossRef] [PubMed]
  41. Van Urk, H.; Postma, E.; Scheffers, W.A.; Van Dijken, J.P. Glucose transport in crabtree-positive and crabtree-negative yeasts. J. Gen. Microbiol. 1989, 135, 2399–2406. [Google Scholar] [CrossRef] [PubMed]
  42. Mezule, L.; Dalecka, B. Adjustment of yeast growth media for the fermentation of lignocellulosic sugars. Chem. Eng. Trans. 2017, 57, 25–30. [Google Scholar]
  43. Betiku, E.; Alade, O. Media evaluation of bioethanol production from cassava starch hydrolysate using Saccharomyces cerevisiae. Energy Sources Part A 2014, 36, 1990–1998. [Google Scholar] [CrossRef]
  44. Jin, H.; Liu, R.; He, Y. Kinetics of batch fermentations for ethanol production with immobilized Saccharomyces cerevisiae growing on sweet sorghum stalk juice. Procedia Environ. Sci. 2012, 12, 137–145. [Google Scholar] [CrossRef]
  45. Sarteshnizi, R.A.; Hosseini, H.; Bondarianzadeh, D.; Colmenero, F.J. Optimization of prebiotic sausage formulation: Effect of using β-glucan and resistant starch by d-optimal mixture design approach. LWT-Food Sci. Technol. 2015, 62, 704–710. [Google Scholar] [CrossRef]
  46. Tesfaw, A.; Assefa, F. Current trends in bioethanol production by Saccharomyces cerevisiae: Substrate, inhibitor reduction, growth variables, coculture, and immobilization. Int. Sch. Res. Not. 2014. [Google Scholar] [CrossRef] [PubMed]
  47. Miller, G.L. Use of dinitrosalicylic acid reagent for determination of reducing sugar. Anal. Chem. 1959, 31, 426–428. [Google Scholar] [CrossRef]
  48. Sumbhate, S.V.; Nayak, S.; Goupale, D.; Tiwari, A.; Jadon, R.S. Colorimetric method for the estimation of ethanol in alcoholic-drinks. J. Anal. Tech. 2012, 1, 1–6. [Google Scholar]
  49. Ghaffari, A.; Abdollahi, H.; Khoshayand, M.; Bozchalooi, I.S.; Dadgar, A.; Rafiee-Tehrani, M. Performance comparison of neural network training algorithms in modeling of bimodal drug delivery. Int. J. Pharm. 2006, 327, 126–138. [Google Scholar] [CrossRef] [PubMed]
  50. Moghaddam, M.G.; Ahmad, F.B.H.; Basri, M.; Rahman, M.B.A. Artificial neural network modeling studies to predict the yield of enzymatic synthesis of betulinic acid ester. Electron. J. Biotechnol. 2010, 13, 3–4. [Google Scholar] [CrossRef]
  51. Basri, M.; Rahman, R.N.Z.R.A.; Ebrahimpour, A.; Salleh, A.B.; Gunawan, E.R.; Rahman, M.B.A. Comparison of estimation capabilities of response surface methodology (RSM) with artificial neural network (ANN) in lipase-catalyzed synthesis of palm-based wax ester. BMC Biotechnol. 2007, 7, 53. [Google Scholar] [CrossRef] [PubMed]
Figure 1. Profile of reducing sugar, ethanol, and biomass concentration against fermentation time of Saccharomyces Type 1 (ST1) yeast (a) with malt extract as plate medium and corn steep liquor as inoculum and fermentation medium, and (b) with yeast peptone dextrose agar as plate medium and yeast extract as inoculum and fermentation medium.
Energies 11 01740 g001
Figure 2. Profile of reducing sugar, ethanol, and biomass concentration against fermentation time of Anchor instant yeast (AIY) (a) with malt extract as plate medium and corn steep liquor as inoculum and fermentation medium, and (b) with yeast peptone dextrose agar as plate medium and yeast extract as inoculum and fermentation medium.
Energies 11 01740 g002
Figure 3. (a) Response surface plot and desirability graph showing the relationship between inoculum size and CSL against ethanol concentration using Saccharomyces Type 1 strain (ST1). (b) Response surface plot describing the effect of inoculum size, CSL, and temperature against ethanol concentration using Anchor Instant Yeast (AIY).
Energies 11 01740 g003
Figure 4. Parity plot of ethanol concentration using RSM and ANN (a) from Saccharomyces cerevisiae Type 1 strain (ST1) and (b) from Anchor Instant Yeast (AIY).
Energies 11 01740 g004
Figure 5. A multilayer feedforward perceptron (MLP) network consisting of (a) five inputs, one hidden layer with five neurons, and one output for Anchor Instant Yeast (AIY); and of (b) five inputs, one hidden layer with four neurons, and one output for ST1 (Saccharomyces Type 1).
Energies 11 01740 g005
Table 1. Comparing present work to previous studies (Corn steep liquor (CSL)).
Glucose (g/L)Type of YeastEthanol (g/L)Yield (%)CSL (% w/v)ScaleAuthor
100Saccharomyces Type 143.39855.5Shake FlaskThis study
100Anchor Instant Yeast45.36895.36Shake FlaskThis study
107Candida shehatae FPL-70240.1735Shake Flask[21]
300Saccharomyces cerevisiae12582110Shake Flask[22]
Table 2. Responses of predictability of response surface method (RSM) and artificial neural network (ANN) on corn steep liquor effects for fermenting two yeast strains (Anchor Instant Yeast (AIY) and Saccharomyces Type 1 (ST1)).
RunsCSL
(% w/v)
pHTime (h)Temperature (°C)Inoculum Size
(% v/v)
Experimental Values (g/L)Predicted
Values (g/L)
Experimental Values (g/L)Predicted
Values (g/L)
ST1RSMANNAIYRSMANN
10.55.024303.040.9640.9240.9640.3439.8240.47
20.54.536303.042.3040.3042.3042.0342.8341.98
30.5 4.512303.039.6940.3039.6940.8840.2641.03
40.54.024303.037.9939.6937.9942.3240.9442.19
50.54.524305.541.4941.8641.4940.9541.4841.09
60.54.524353.039.4740.3039.4736.9937.0537.03
70.54.524300.539.0238.7439.0238.9439.2038.70
80.54.524253.041.5040.3041.5039.7539.1939.14
93.05.024305.539.9039.9139.9038.4637.9438.32
103.04.024253.038.7739.0938.7740.5340.6340.56
113.04.512305.540.3939.3040.3938.1939.7038.00
123.04.036303.036.9939.0936.9938.6939.4738.73
133.04.524303.039.3839.7039.1141.9043.0341.99
143.04.524303.038.8439.7039.1038.8039.3338.77
153.04.524350.539.9740.1139.9739.5739.8239.41
163.04.512253.039.1639.7039.1639.8439.8439.85
173.04.524303.038.5139.7039.1139.2739.1939.14
183.04.512300.540.4140.1140.4141.4239.9341.12
193.04.524250.540.1040.1140.1039.1240.3639.13
203.04.536305.540.9639.3040.9638.7138.5538.84
213.04.524255.537.2839.3037.2838.9339.2038.95
223.05.036303.039.5840.3239.5838.4038.5138.36
233.04.524355.540.4539.3040.4537.8439.1238.08
243.04.536253.039.8439.7039.8436.0035.8436.02
253.05.012303.038.0340.3238.0340.3639.5040.31
263.04.536353.040.3039.7040.3038.3638.7339.14
273.05.024353.042.1540.3242.1541.2041.0641.56
283.04.512353.040.9739.7040.9740.7840.4140.77
293.05.024300.540.5540.7240.5538.3039.1939.14
303.04.024353.039.6839.0939.6839.0841.0639.17
313.04.024305.541.0738.6941.0739.7040.1739.68
323.04.024300.540.2839.4940.2839.1239.1939.14
333.04.524303.038.5839.7039.1138.3639.1938.54
343.04.536300.542.2940.1142.2938.4238.0638.65
353.04.012303.038.9539.0938.9539.5239.2239.85
363.04.524303.039.2039.7039.1141.0239.3740.99
373.04.524303.040.1339.7039.1139.0437.9338.71
383.05.024253.038.4240.3238.4239.3539.5539.33
395.54.536303.042.4241.2242.4236.7437.3636.65
405.55.024303.044.8841.8444.8837.3338.3137.41
415.54.524305.537.3938.8637.3939.5740.1539.71
425.54.512303.041.4241.2241.4239.1839.0239.14
435.54.524353.038.2341.2238.2340.3539.1939.14
445.54.524253.041.7741.2241.7741.8441.1041.74
455.54.524300.542.7743.5942.7745.2342.0845.17
465.54.024303.040.9040.6140.9040.7040.3640.50
Table 3. Experimental design including the coded levels of each parameter and predicted values for ethanol production from ST1 and AIY using RSM and ANN.
RunsCSL
(% w/v)
pHTime
(h)
Temperature
(°C)
Inoculum Size
(% v/v)
Saccharomyces Type 1 (ST1) αAnchor Instant Yeast (AIY) α
ExperimentalPredictedExperimental Predicted
(g/L)RSMANN(g/L)RSMANN
101001* 39.939.9139.9* 38.4637.9438.32
21010042.4241.2242.4236.7437.3636.65
3−1100040.9640.9240.9640.3439.8240.47
40−10−10* 38.7739.0938.77* 40.5340.6340.56
500−10140.3939.340.3938.1939.738
60−110036.9939.0936.9938.6939.4738.73
700000* 39.3839.739.11* 41.943.0341.99
800000* 38.8439.739.1138.839.3338.77
91100044.8841.8444.8837.3338.3137.41
100001−139.9740.1139.9739.5739.8239.41
1100−1−1039.1639.739.1639.8439.8439.85
121000137.3938.8637.39* 39.5740.1539.71
1300000* 38.5139.739.11* 39.2739.1939.14
14−1010042.340.342.342.0342.8341.98
1500−10−140.4140.1140.4141.4239.9341.12
16000−1−1* 40.140.1140.139.1240.3639.13
170010140.9639.340.9638.7138.5538.84
18000−1137.2839.337.2838.9339.238.95
19−10−100* 39.6940.339.69* 40.8840.2641.03
200110039.5840.3239.5838.438.5138.36
21−1−100037.9939.6937.9942.3240.9442.19
2200011* 40.4539.340.45* 37.8439.1238.08
2310−10041.4241.2241.4239.1839.0239.14
241001038.2341.2238.2340.3539.1939.14
25−10001* 41.4941.8641.49* 40.9541.4841.09
26−1001039.4740.339.4736.9937.0537.03
27001−1039.8439.739.843635.8436.02
2801−100* 38.0340.3238.03* 40.3639.540.31
290011040.339.740.338.3638.7339.14
300101042.1540.3242.1541.241.0641.56
3100−110* 40.9739.740.97* 40.7840.4140.77
320100−140.5540.7240.5538.339.1939.14
330−101039.6839.0939.6839.0841.0639.17
340−1001* 41.0738.6941.07* 39.740.1739.68
350−100−140.2839.4940.28* 39.1239.1939.14
36100−1041.7741.2241.7741.8441.141.74
371000−1* 42.7743.5942.77* 45.2342.0845.17
381−100040.940.6140.940.740.3640.5
390000038.5839.739.1138.3639.1938.54
40−1000−1* 39.0238.7439.02* 38.9439.238.7
410010−142.2940.1142.2938.4238.0638.65
420−1−10038.9539.0938.9539.5239.2239.85
43−100−10* 41.540.341.5* 39.7539.1939.14
440000039.239.739.1141.0239.3740.99
450000040.1339.739.1139.0437.9338.71
46010−10* 38.4240.3238.42* 39.3539.5539.33
α Asterisked numbers represent the ANN testing data set while unmarked numbers constitute the training data set; *ANN testing data set.
Table 4. Test of significance: analysis of variance (ANOVA) for ethanol production using two yeast strains.
Saccharomyces Type 1 Yeast (ST1)Anchor Instant Yeast (AIY)
SourceSSdfMSF valuep valueSSdfMSF valuep value
Model39.1157.824.070<0.000184.80204.242.74<0.0001
CSL3.3913.391.760.191610.84110.846.99<0.0001
pH6.0516.053.150.08362.1512.151.390.2503
Time-----16.28116.2810.51<0.0001
Temperature-----0.6510.650.420.5224
Inoculum2.6112.611.360.250511.32111.327.31<0.0001
CSL× Inoculum15.39115.398.00<0.00016.9716.974.50<0.0001
Temperature × inoculum-----12.75112.758.23<0.0001
CSL211.67111.676.07<0.00017.6517.654.94<0.0001
Inoculum2-----0.6810.680.440.5152
Residual76.87401.92--38.73251.55--
Lack of fit75.04352.145.880.028035.58201.782.820.1266
Pure Error1.8250.37--3.1550.63--
Correlation Total115.9745---123.5445---
SS, sum of squares; df, degree of freedom; MS, mean square; F, Fisher test; p, probability value.
Table 5. Statistical measures and performance of the incremental backpropagation algorithm for training and testing data sets for ethanol production using ST1 and AIY.Root mean squared error (RMSE), the mean square error (MSE), the coefficient of determination (R2), and the absolute average deviation (AAD).
StrainTransfer Function TopologyRMSEMSER2AAD%
TrainingTestingTrainingTestingTrainingTestingTrainingTesting
ST1Sigmoid5-4-10.21640.16410.046810.026930.98440.98340.16130.1402
AIYTanh5-5-10.43330.19520.18780.03810.92190.98600.82600.3406
Table 6. Statistical measure comparing the whole data set of RSM and ANN for ethanol production.
StrainRSMANN
R2AAD%RMSEMSER2AAD%RMSEMSE
ST10.342.521.291.680.980.150.190.039
AIY0.981.720.970.840.990.460.290.089
Table 7. Optimal parameters for glucose fermentation and the resulting ethanol concentration using RSM and ANN.
Yeast StrainToolCSL (% w/v)pHTime (h)Temperature
(°C)
Inoculum
(% v/v)
Predicted
(g/L)
Validated
(g/L)
AIYRSM5.364.0612.9928.140.7245.4845.36 ± 0.02
ANN0.504.9935.9934.175.4945.7340.60 ± 0.01
ST1RSM5.505.0026.8332.680.5044.2043.38 ± 0.0002
ANN0.504.993634.175.4945.7341.30 ± 0.001
Table 8. Variables and their levels for the Box–Behnken design.
Coded Factor Levels
VariablesUnits Symbols−101
CSL (% w/v)X10.555.5
pH-X244.55
Time (h)X3122436
Temperature(°C) X4253035
Inoculum Size (% v/v)X50.535.5

