1. Introduction
Ester-based insulating liquids, as eco-friendly products, have been developed providing the transformer market with an interesting alternative to mineral oils. For both natural and synthetic esters, several experimental studies have been conducted providing knowledge on different aspects of ester properties [
1,
2,
3,
4,
5,
6,
7]. Without a doubt the synthetic and natural esters are friendly for the environment, being biodegradable and having high flash points. Simultaneously, they are also characterized by quite good dielectric properties, among which special attention is directed to the higher electrical permittivity of the esters than mineral oils, which is an advantage for electrical field distribution in paper-dielectric liquid insulating systems. The esters also have similar alternating current (AC) breakdown voltages to the mineral oils. In this field the benefit of the esters is their lower susceptibility to moisture content in a volume of the liquid. There is a lack of change in the AC breakdown voltage up to a moisture content of 600 ppm for synthetic esters, and up to a moisture content of 300 ppm for most of the natural esters, respectively. In turn, considering the interaction with the solid insulation in the case of ester liquids, the moisture from thermal aging of the paper is absorbed by the esters, which lengthens the paper lifetime [
2,
7,
8,
9,
10].
One of the significant parameters considered in terms of dielectric properties of the liquids is the lightning impulse breakdown voltage. This parameter describes the behavior of a given liquid under lightning impulse voltage stress. This may be determined in accordance with International Electrotechnical Commission (IEC) 60897 or American Society for Testing and Materials (ASTM) D3300 standards. However, standard-based approaches limit the information only to the value of the breakdown voltage, its standard deviation and, sometimes, the time to breakdown [
11,
12,
13,
14,
15,
16]. Thus, with the usage of one of the above-mentioned standards, there is no possibility to assess the pre-discharge phenomena (usually called streamers) which precede the breakdown. This is possible only through the use of certain experimental techniques, among which a photomultiplier (PMT) registration of light emitted by the pre-breakdown channels is treated as one of the most valuable techniques. It is, however, a well-known fact that the intensity of light is strictly connected with the intensity of the ionization processes occurring during discharge phenomena. Developing discharges generate the pulsed light, which may be registered using proper detectors and then, in the form of waveforms, may be presented on the screen of an oscilloscope. The higher frequency of light pulses registered the more frequent step lengthening of the occurring discharge channels. The higher peak values of the light pulses reflect the higher energy of the discharge itself [
15,
16,
17,
18,
19,
20,
21].
The studies which are described in this paper concern solely the mentioned PMT-based technique used for the assessment of pre-discharges (streamer development) in specific experimental electrode systems in which a point-to-sphere system recommended by the IEC 60897 standard was modified by placing an insulating plate between the electrodes. Such an approach caused the formation of a liquid gap above and below the plate. Thus, it represents, to some extent, a real situation which appears in transformer insulation—an oil gap is divided into parts by a pressboard barrier in order to limit the development of discharges which are able to form the breakdown channel. The observation of streamer development when this development is blocked by an insulating barrier became the main issue of the study.
The measurements were carried out for two synthetic esters, two natural esters, and mineral oil for comparison. Therefore, the results obtained are presented in a comparative form showing the similarities and differences between the characteristics of the liquids and the streamers developed in them under the assumed conditions of the experiment.
2. Methodology Description
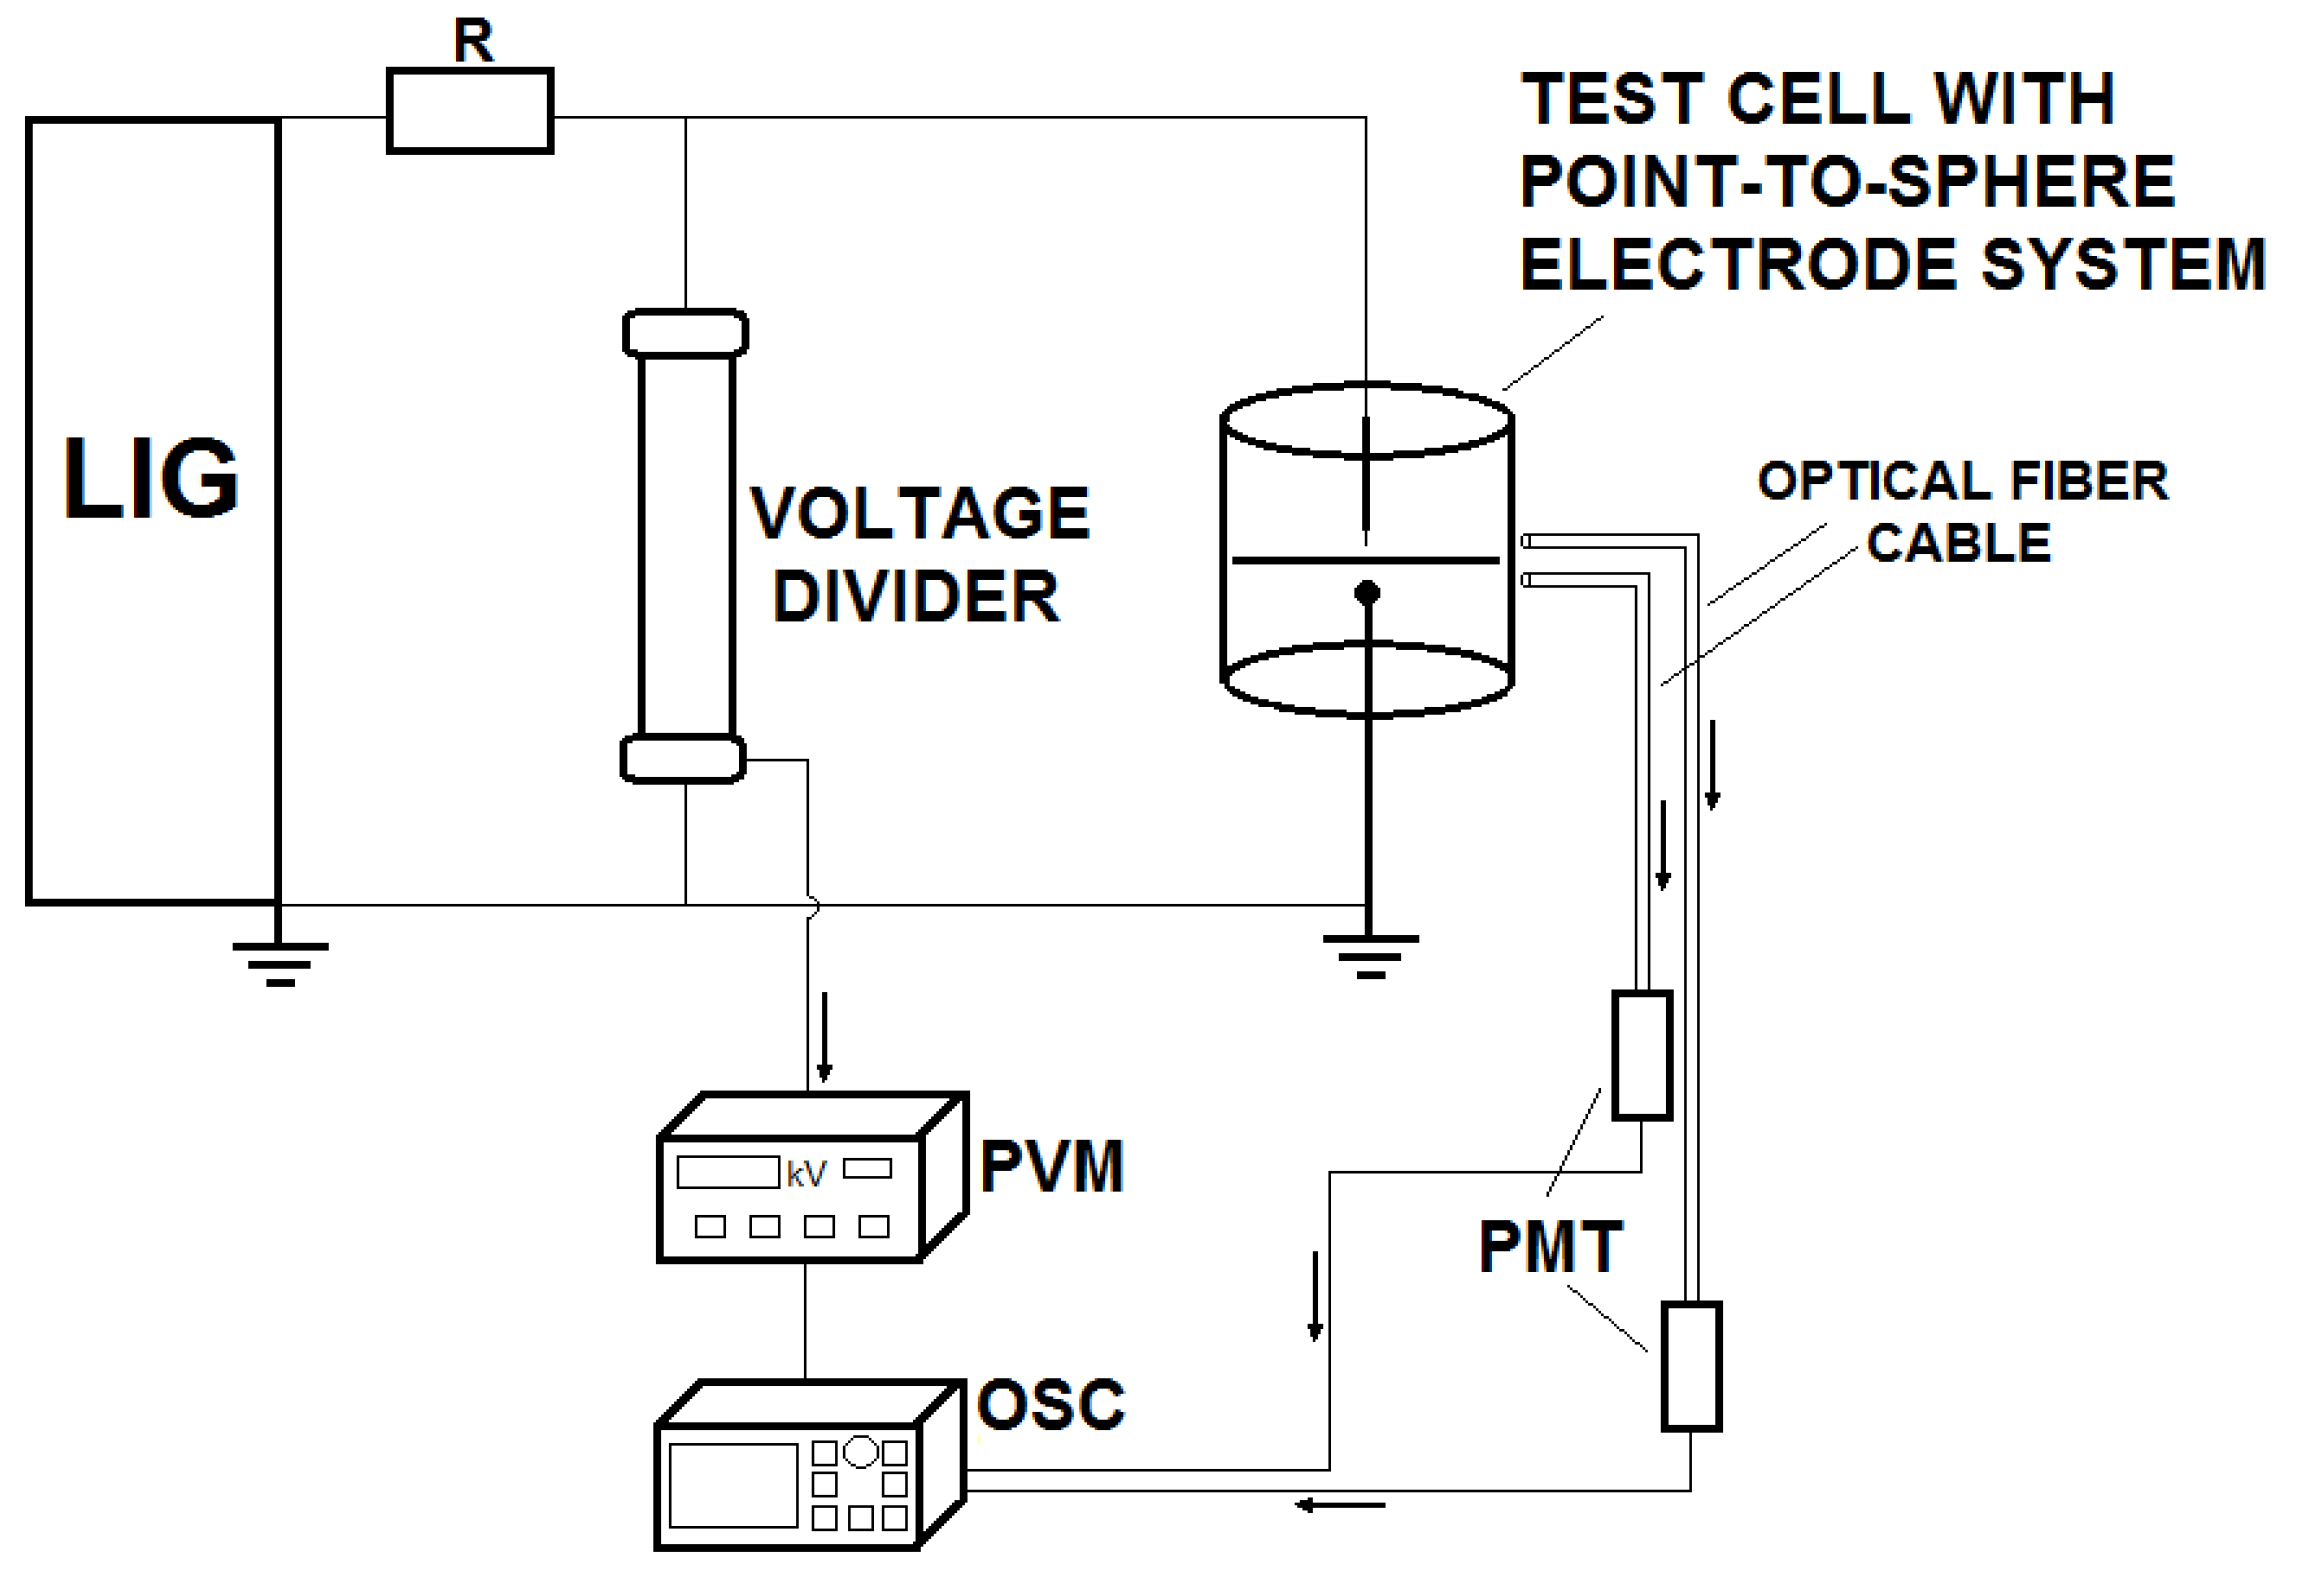
The measurements were performed using the experimental setup presented schematically in
Figure 1.
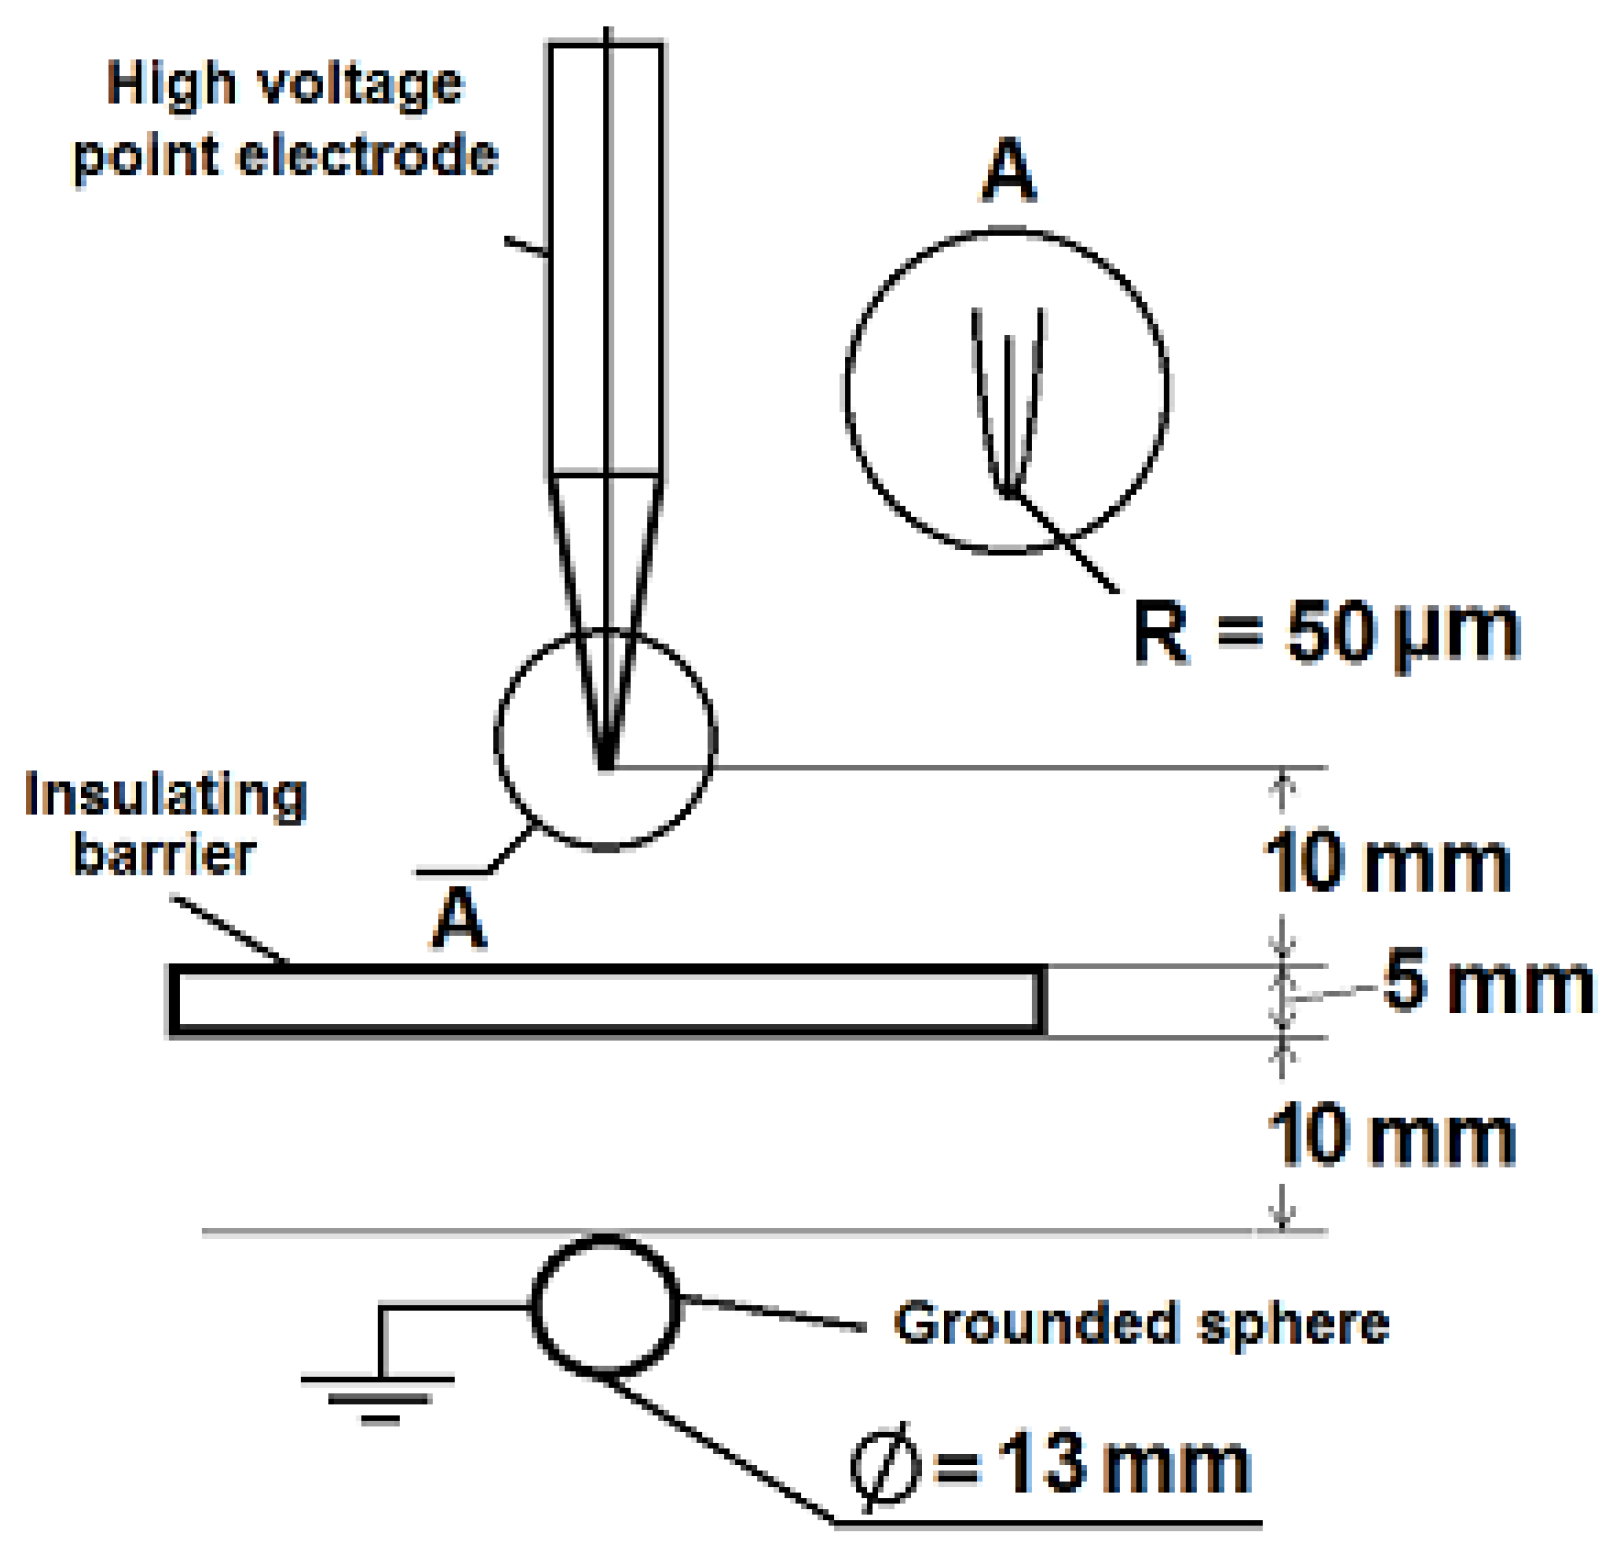
A source of the testing voltage was a Marx generator with a rated voltage of 500 kV and a storage energy of 2.2 kJ. It generated a negative standard lightning impulse voltage of 1.2/50 μs. The peak value of the lightning impulse was measured using a resistive voltage divider and a peak value meter. The voltage waveform was also registered by a digital oscilloscope. The voltage was supplied to the electrode system which is presented in
Figure 2. This system was placed in the transparent test cell made of perspex. The volume of the test cell was 5 L.
A high voltage needle was made of tungsten and had a 50 μm radius of curvature while the grounded electrode was a sphere 13 mm in diameter. The distance between the tip of the needle and the grounded sphere was set to 25 mm. The above-quoted dimensions of the electrodes, as well as the assumed inter-electrode distance, was based on the recommendations of the IEC 60897 standard which is used for the determination of lightning impulse breakdown voltage of dielectric liquids. The recommended electrode system was, however, modified by placing between the high voltage needle and the grounded sphere a pressboard plate 5 mm in thickness, which constituted an insulating barrier for the developed streamers. The diameter of the barrier used was 15 cm. Finally a 10 mm free liquid gap between the tip of the needle and the pressboard plate, as well as between the pressboard plate and the grounded sphere, was obtained. Before the beginning of the experiment the used pressboard plates were dried and then impregnated. The adopted procedure of drying and impregnation carried out in a vacuum chamber included:
- -
24 h of drying in vacuum at a temperature of 105 °C;
- -
filling the chamber with a given liquid under vacuum conditions and impregnating at a temperature of 80 °C for 24 h; and
- -
lowering the temperature to the ambient temperature and leaving the samples for 24 h in the liquid bath.
As was mentioned above, the studies were focused on the observation of streamer development on the basis of light emission registration using the photomultiplier technique. The choice of photomultipliers as a light detector resulted from the commonly known fact that light generated by the streamers is very weak and may be detected only by very sensitive optical instruments of high gain and with a proper time response for registration of fast pulses with rise times of the order of 1–2 ns. The light from the processes observed was registered by two independently-operated photomultipliers. Both of them were Hamamatsu R1925 photomultipliers (Hamamatsu Photonics K.K., Hamamatsu, Japan) with a wavelength range from 300 to 850 nm. The light signal was delivered to the PMTs through optical fiber cables which consisted of 37 individual fibers. The active surface of the cables collecting the light from the processes registered was 5 mm in diameter. The ends of both cables were placed directly at the wall of the test cell at a distance from the point-sphere axis of ca. 10 cm. As it was presented in
Figure 1, the end of one of the optical fiber cables was placed above the line defined by the surface of the insulating plate while the end of the second optical fiber cable was placed below the quoted line. In other words, the first PMT recorded light from the processes occurring between the high-voltage needle and the insulating barrier, while the second PMT recorded the processes occurring between the insulating barrier and the grounded sphere. The output signals from both the PMTs, after being amplified, were registered using the oscilloscope in the form of waveforms (the temporal sequence of discrete negative pulses having rise-times of nanoseconds). Simultaneously, the waveforms obtained were saved on a hard disk of a PC computer where they might be analyzed and compared with the other measurement results. During the whole experiment the PMTs were supplied by the same supply voltage (800 V), which means that the light was acquired with the same gain factor for both the PMTs. Additionally, the same types of amplifiers were used to amplify the output signal from the photomultipliers.
Five different commercial dielectric liquids were tested during the experiment. They included two synthetic esters, two natural esters, and mineral oil for comparison. The data concerning the fundamental physico-chemical and dielectric properties of the liquids tested are presented in
Table 1. These data come from the datasheets provided by the manufacturers or from other available documents [
1,
2,
22,
23,
24,
25].
As can be seen in
Table 1, the synthetic esters tested have similar properties in both the chemical and dielectric range, and are of similar origin with respect to the manufacturing process. The natural esters tested have the same vegetable origin, but are characterized by different values of some fundamental parameters. Firstly, natural ester II has lower viscosity, which is not a typical property for natural esters for electrical purposes. Like other natural esters it is based on triglycerides, but their content is reduced in the direction of using more monoesters. This is made by chemical modifications to the liquid. The ratio between the content of triglycerides and monoesters (in the case of the considered ester it is ca. 50% to 50%) which drives the balance between the properties of the final product. With this, the viscosity was optimized by reducing the flash point, but still keeping the biodegradability. Finally the reference liquid-mineral oil-is of a naphthenic type and is uninhibited.
Prior to the measurements carried out at the lightning impulse voltage, the mineral oil tested was first preprocessed by drying, degassing, and filtering. However, the ester liquids tested were studied as received. In order to be sure that the liquids fulfill the criteria specified individually for a given liquid the quality of the liquids was verified by AC breakdown voltage tests using the IEC 60156 standard. For all the liquids considered, the average values of the AC breakdown voltage exceed 60 kV, which confirmed the appropriate properties of the liquids for lightning tests. In turn, the moisture content of the liquid samples was also measured using IEC 60814. The values obtained were, respectively, 12 ppm for mineral oil, 128 ppm for synthetic ester I, 88 ppm for synthetic ester II, 62 ppm for natural ester I, and 49 ppm for natural ester II. According to the well-known fact that higher natural moisture saturation of the esters and the above-mentioned lack of influence of moisture content on the breakdown voltage of the esters, the data concerning moisture were also assessed as satisfactory.
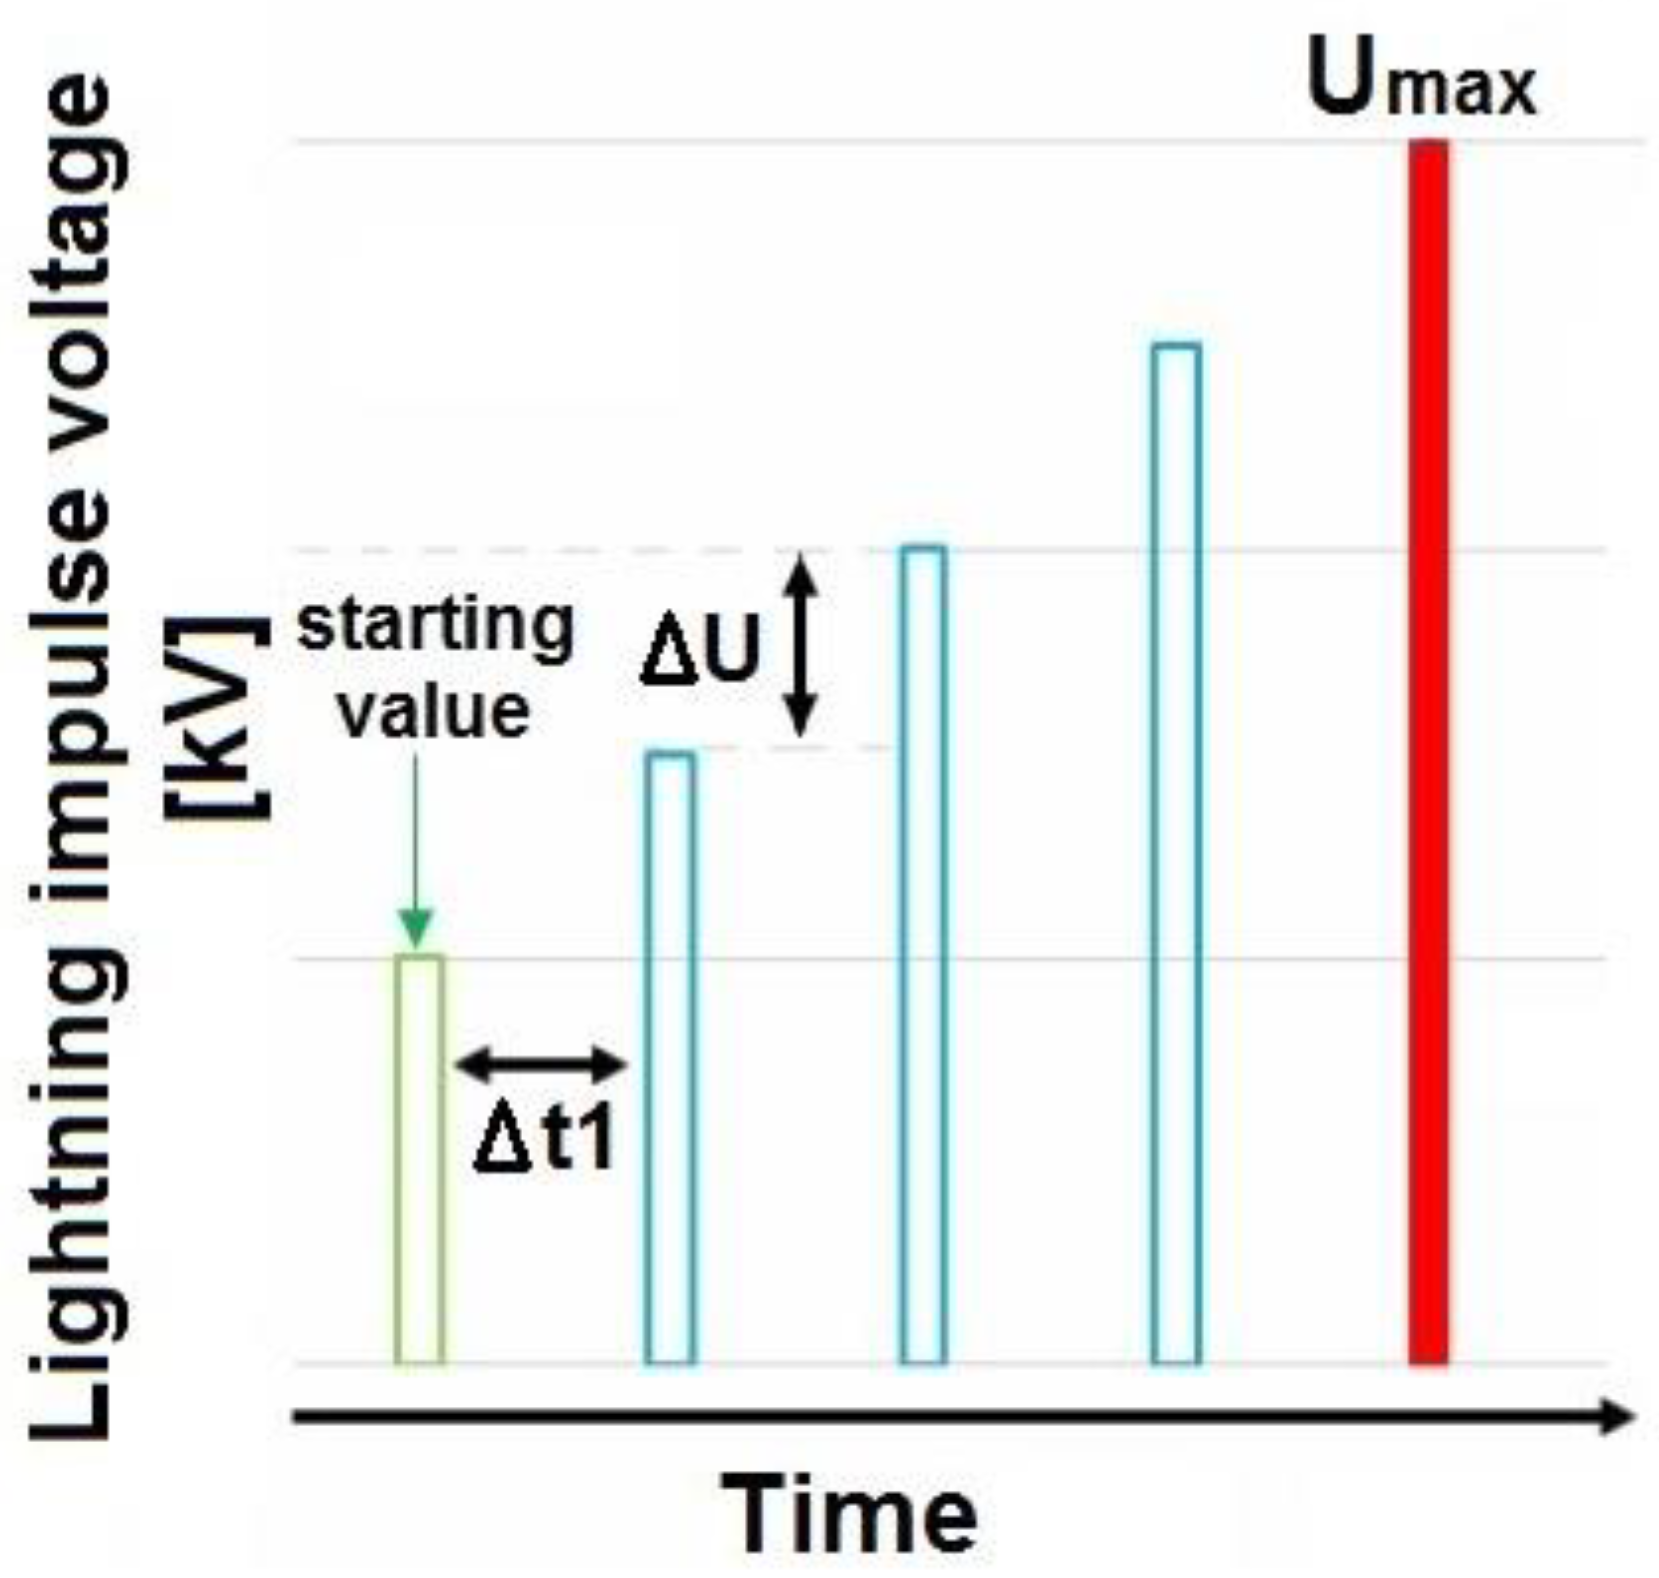
The measurement procedure was established on the basis of previously-performed studies on lightning impulse breakdown voltage determination [
15,
16]. Schematically, the used procedure is presented in
Figure 3.
The experiment began from the so-called starting value, which was 100 kV. This value was lower than previously-evaluated negative lightning impulse breakdown voltages for all the liquids tested in point-to-sphere electrode systems [
15,
16]. Since the evaluated negative lightning impulse breakdown voltage oscillated around 125 kV with ca. 5–7 kV of standard deviation, it was assumed that a value of 100 kV would be the right starting value at which streamers will develop as a basic, slow mode [
18,
19,
20,
21]. Then the subsequent lightning impulses were supplied to the electrode system with the assumed voltage step (Δ
U) equal to 5 kV. One shot per step was applied with time between the subsequent steps (Δ
t1) equal to 1 min. The measurements were stopped at the value of the testing voltage equal to 180 kV (
Umax in
Figure 3). The next measurement procedure was carried out after a 20 min break wherein during this time the liquid sample was stirred. Based on our own experience [
15,
16,
19], as well as recommendations of the standards [
11,
12], it was decided that the liquid samples would not be changed to a new one after a given measurement procedure. This was because breakdown was not reached during the tests. The confirmation of the correctness of the approach adopted was an unintended spread of the data obtained from the measurements. The influence of the previous test on the results obtained from the next measurement procedure was not noticed. The total number of measurement procedures was 6. For each voltage level the oscillograms were registered. They included two courses of light (separately for both the PMTs) and one course of supplied voltage. In this latter case it was possible to identify probable breakdown events [
15,
16,
18,
21,
26]. However, for all the voltage levels applied during the experiment the voltage collapse in the voltage waveforms registered never took place, so it may be stated that breakdown never happened.
3. Measurement Results
Firstly, the analysis was focused on the comparison of the threshold value of the voltage at which the light signal was registered by the PMT that was placed below the insulating barrier. This value was called
Vt, meaning that the streamers also started to propagate in the space between the insulating barrier and grounded sphere. As was mentioned above, six measurement procedures were performed so the
Vt in each case was determined as an average value calculated from the six individual observations. Simultaneously, standard deviations were also evaluated. The results obtained are shown in
Table 2. In order to relate these results to the previously-estimated negative lightning impulse breakdown voltages (
Vb-) for a point-to-sphere electrode system without a pressboard barrier [
15,
16], the table also includes the mentioned
Vb-.
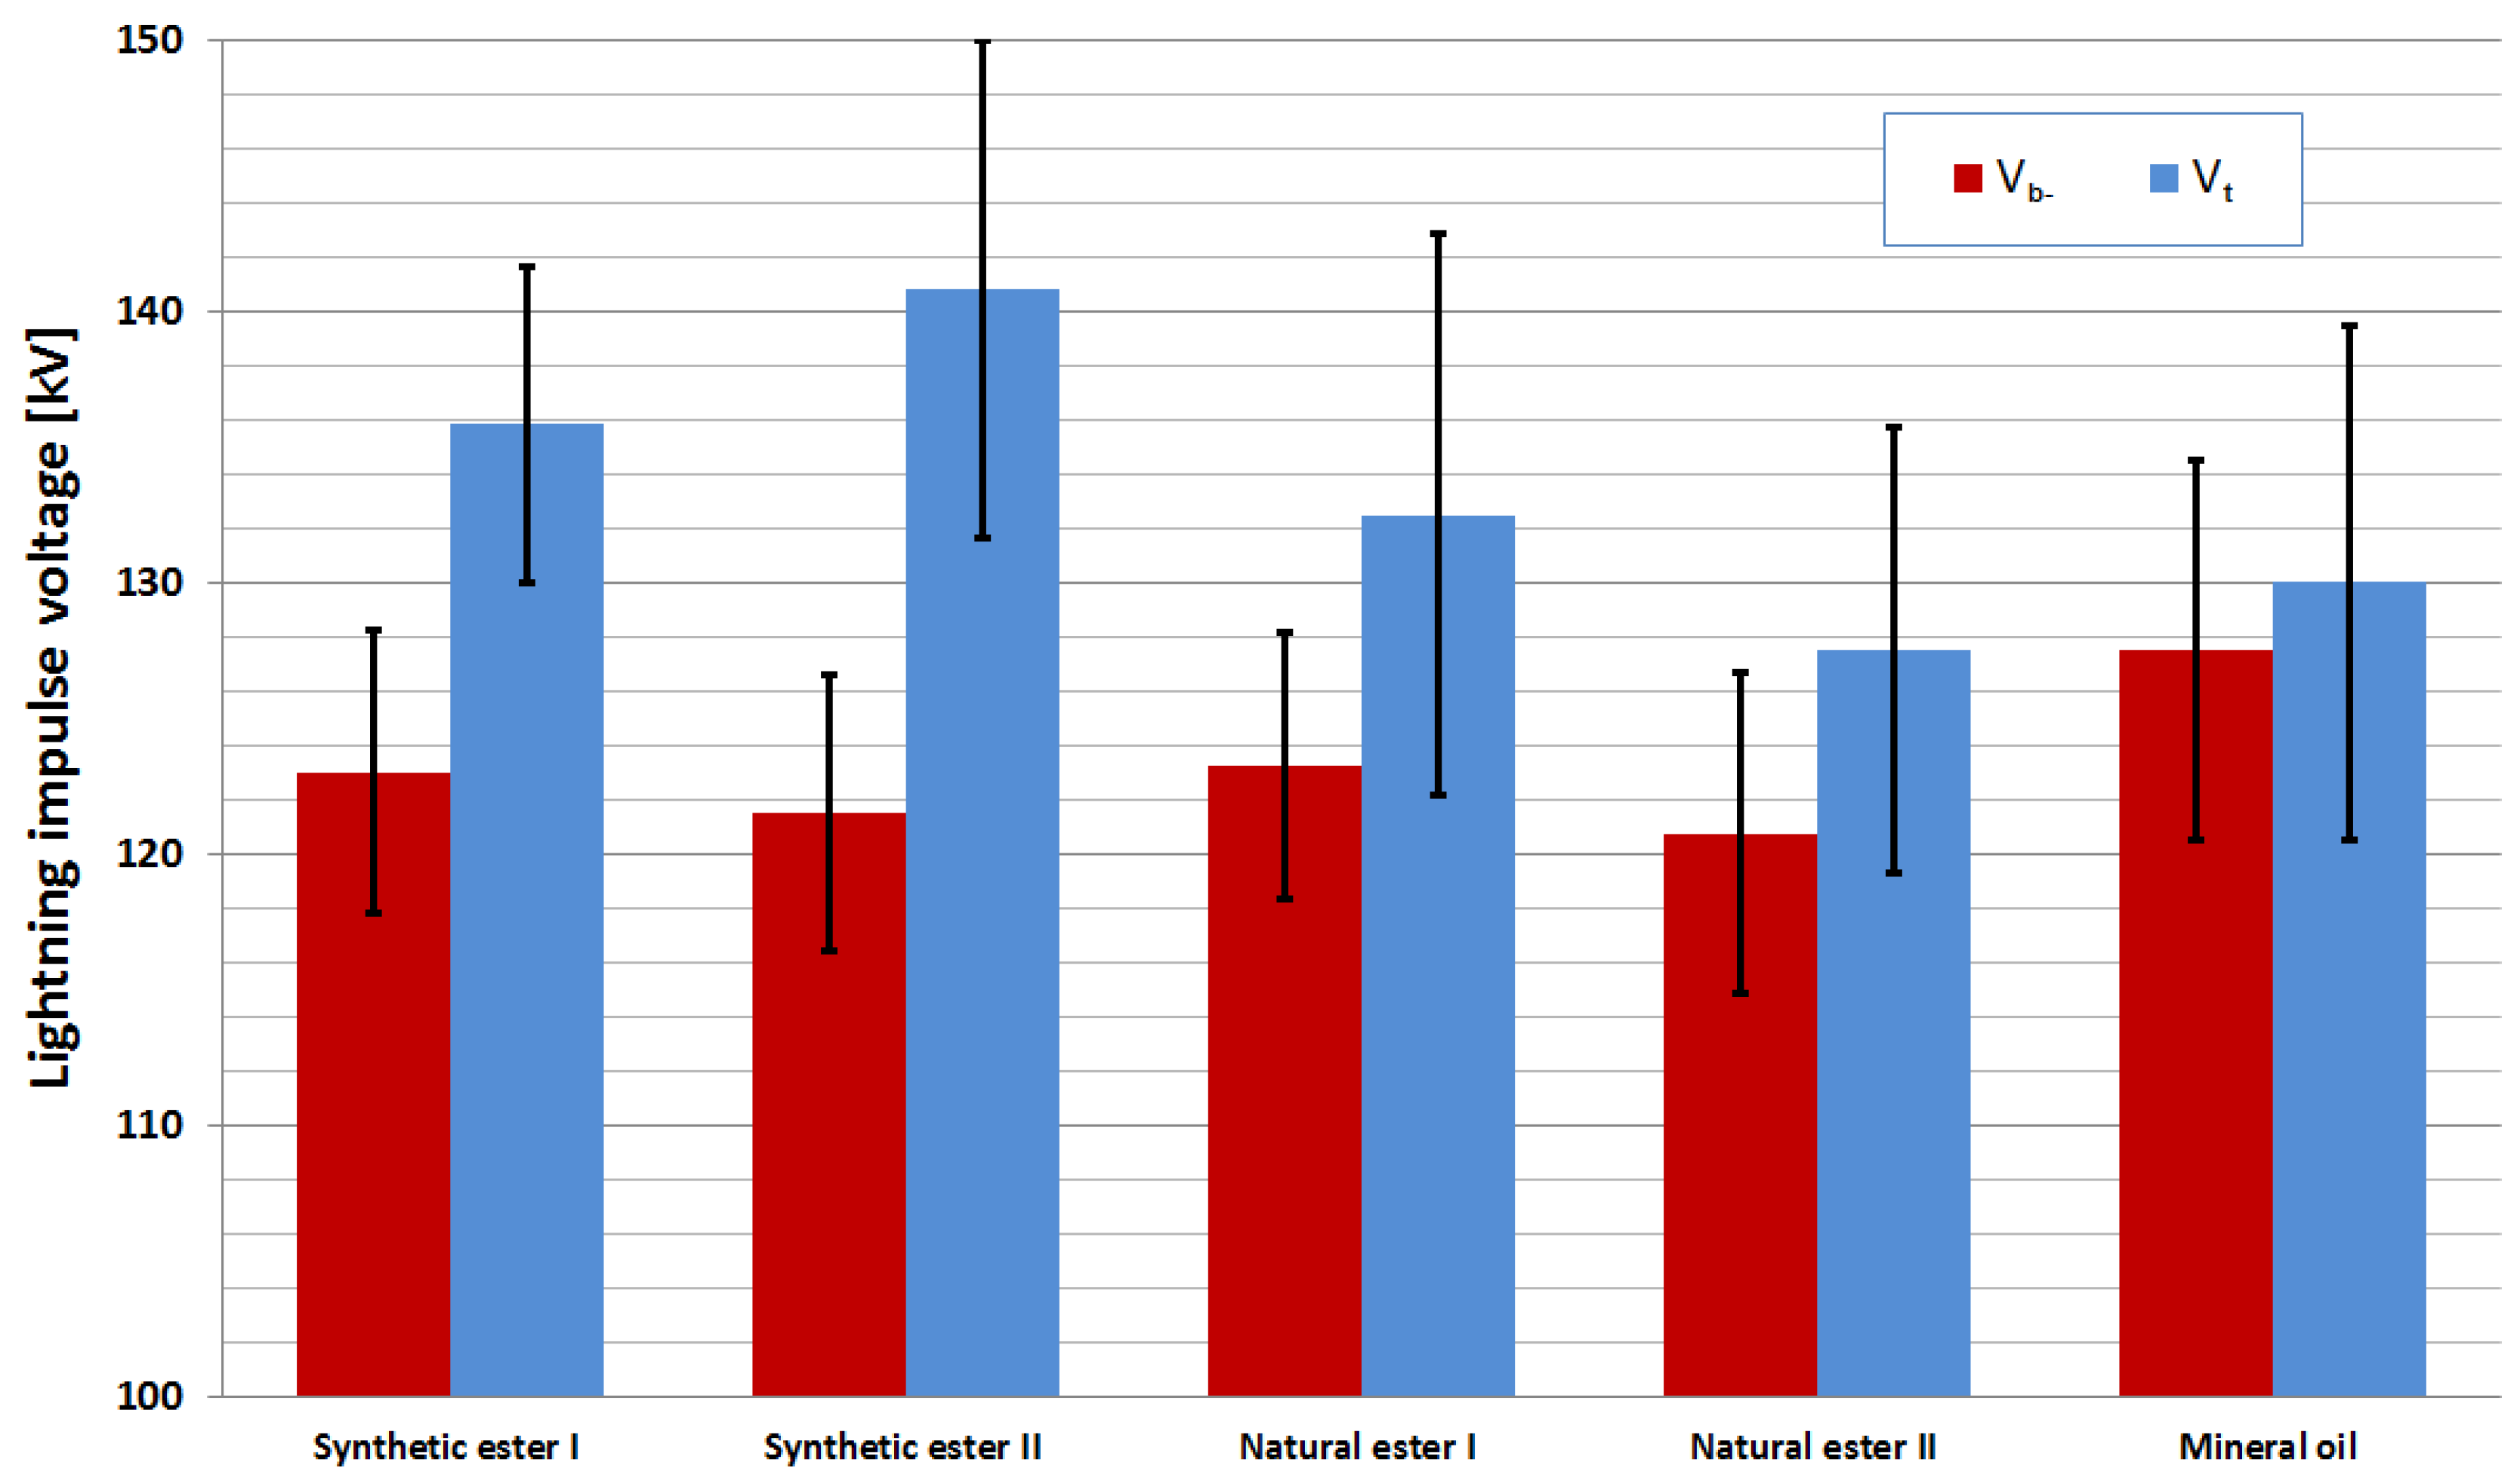
The results from the table are also presented in graphical form in
Figure 4.
Comparing the results concerning the threshold value of voltage for streamer inception below the insulating barrier with the values of the lightning impulse breakdown voltage obtained during the previous studies, it may be said that, in all cases, the values of
Vt are higher than the corresponding values of
Vb- (the
Vt/
Vb- ratio quoted in
Table 2 is, in all cases, much higher than 1). Hence, the conclusion in this field is not surprising—the insulating barrier prevents the breakdown which would certainly take place at voltage levels equal to
Vt, or close to this value. This applies to the same extent to all the liquids tested. Nevertheless, comparing the distinctive liquids between each other there are obvious differences in the values of evaluated
Vt, which are confirmed by the individual
Vt/
Vb- ratios. The best properties mean the best interaction of a given liquid with the pressboard plate in terms of lightning strength is shown by synthetic ester II. The next, in turn, are synthetic ester I and natural ester I. In the case of mineral oil and natural ester II, the properties are similar. Comparing the real value of
Vt, mineral oil has better properties, but looking at the
Vt/
Vb- ratio, natural ester II seems to be better. Simply, it may be concluded that the liquids of higher electrical permittivity (both synthetic esters tested) behave better under the conditions of the experiment. Simultaneously, it is important to point out that, in any of the liquids tested, breakdown was not noticed. Thus, the improvement of the electrical strength of the insulating system analyzed took place in a similar range—the lightning breakdown voltage of the system increased from around 125 kV, up to 180 kV. It may be supposed that the reason for this is the more favorable electrical field distribution in the synthetic ester-pressboard insulating system than in the case of mineral oil-pressboard systems. Higher electrical permittivity of the synthetic esters, which is closer to the electrical permittivity of the pressboard, causes lower stresses on the border of the pressboard and liquid. Hence, the lower the electrical stress is, the higher the value of the voltage that is needed to initiate streamers below the pressboard barrier.
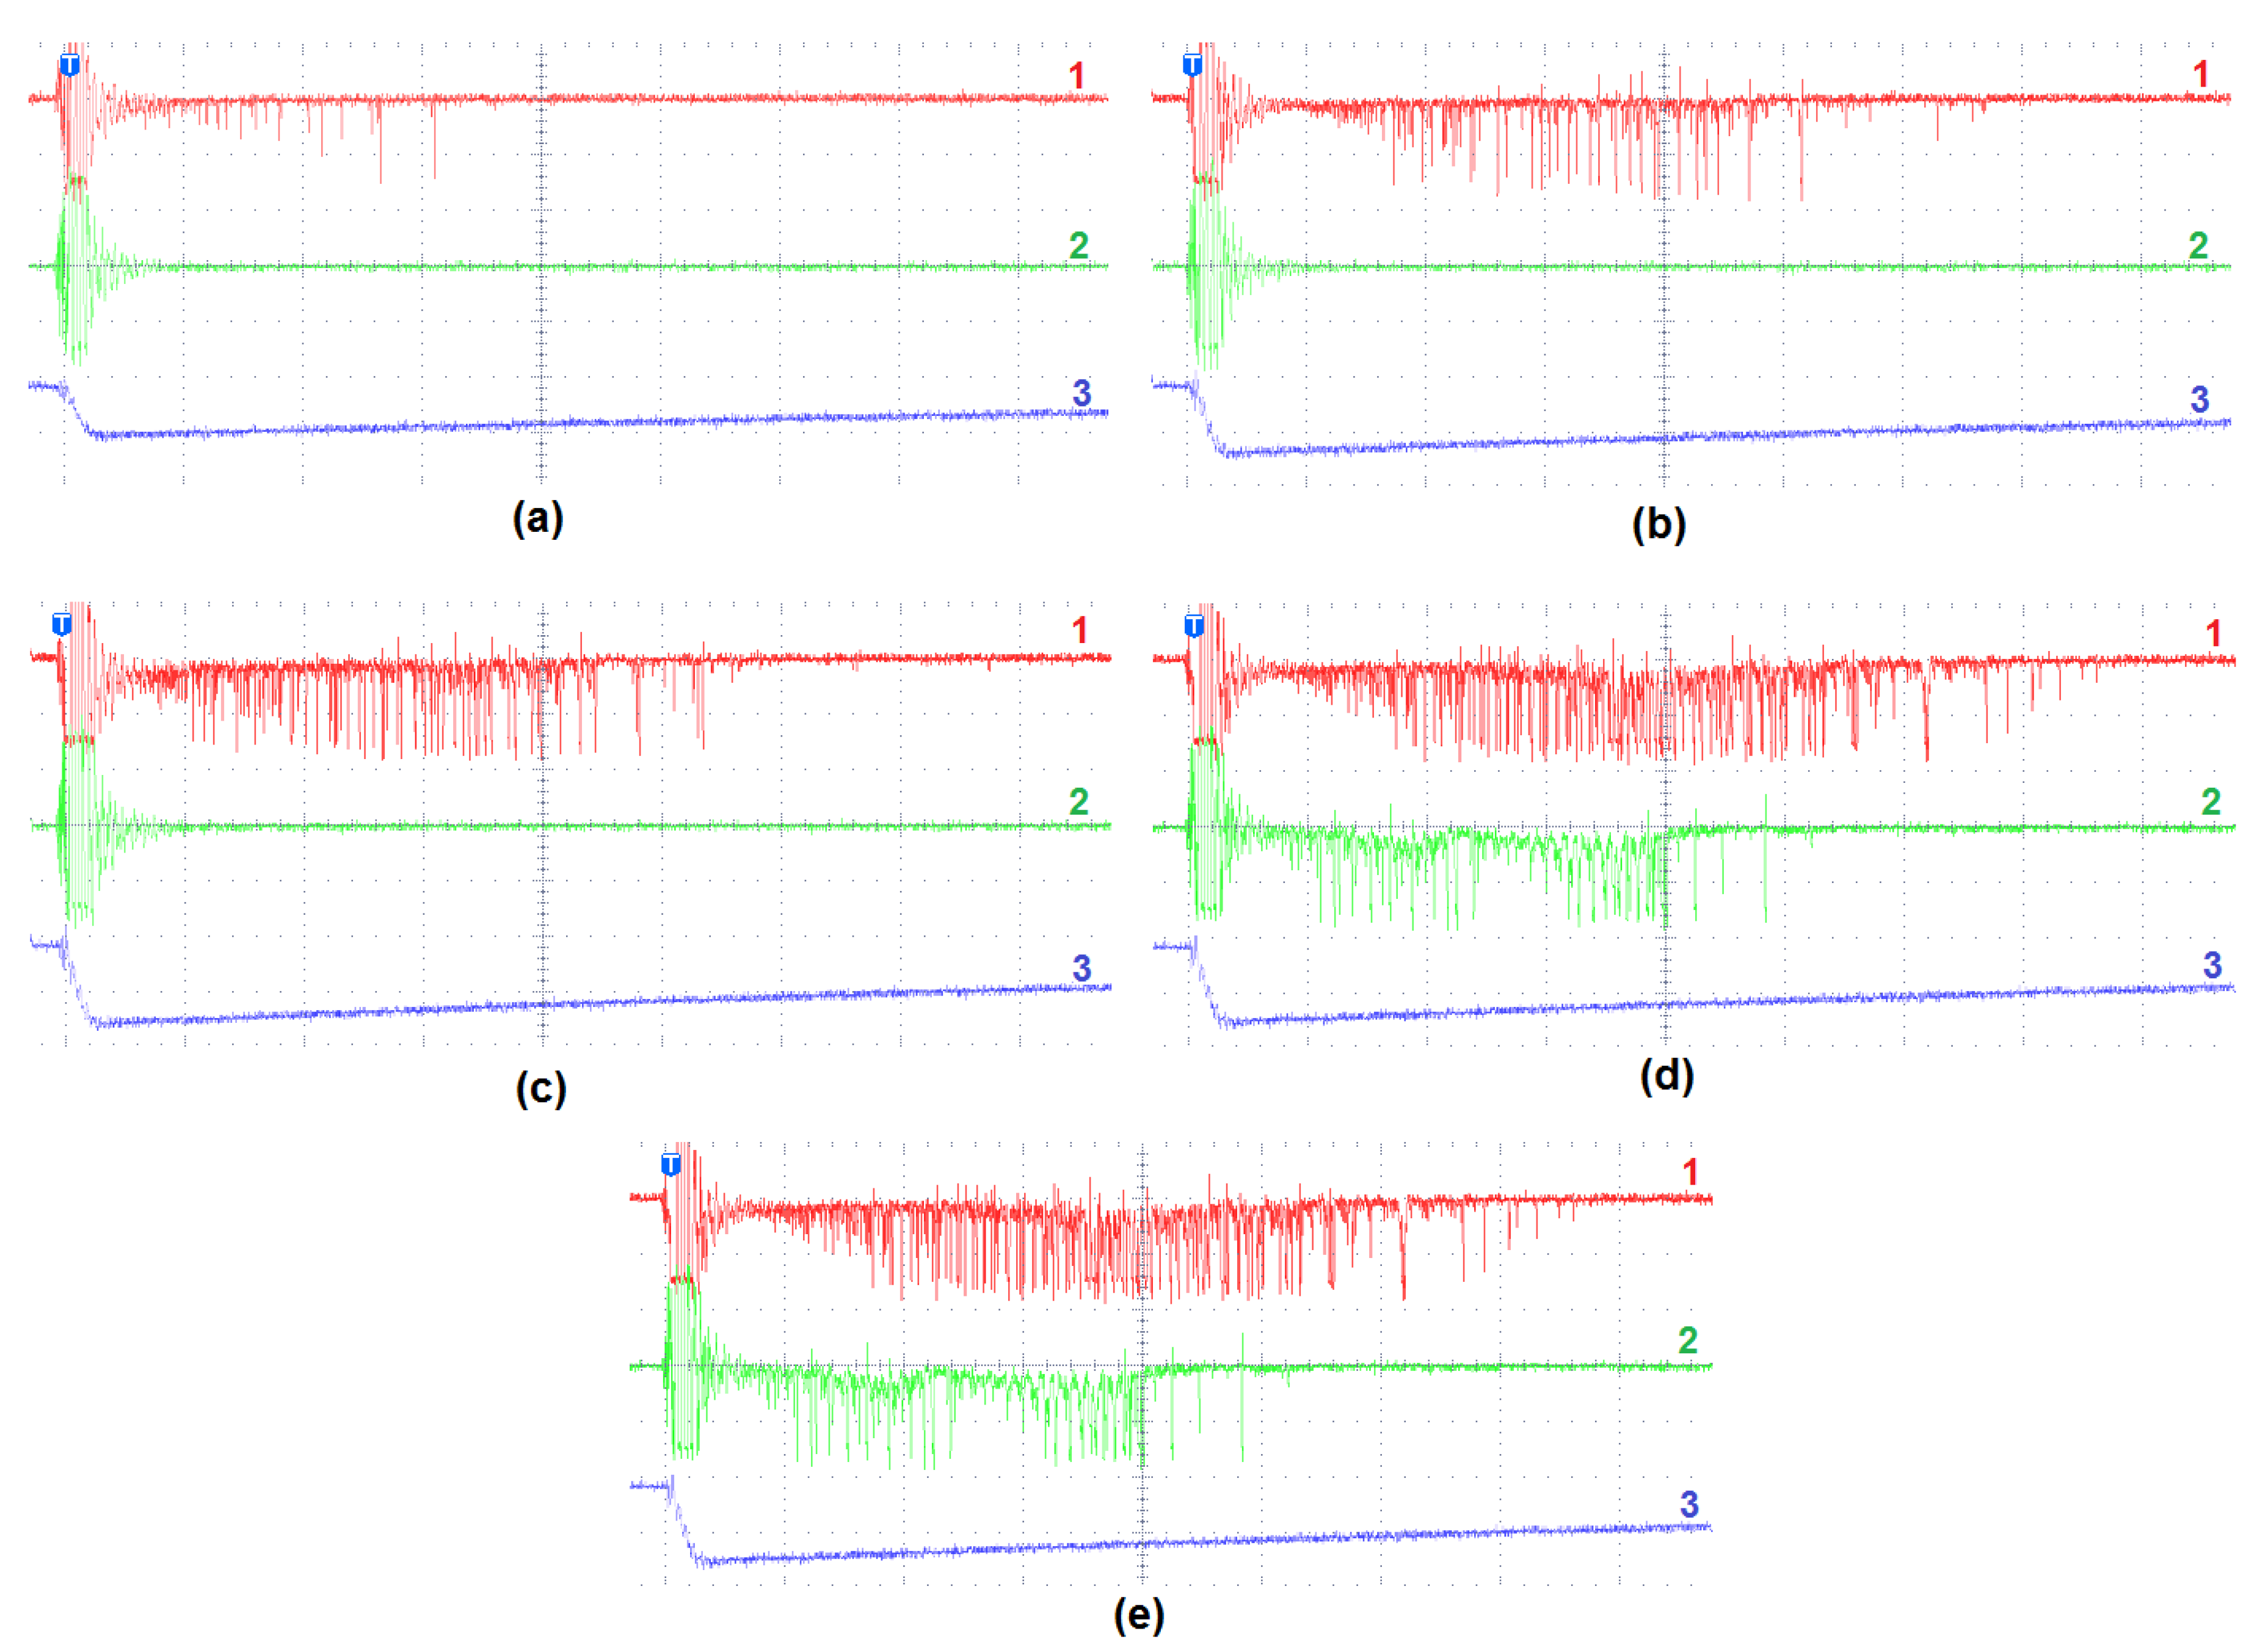
The next part of the study concerns the analysis of the light oscillograms. As was mentioned above, the oscillograms were registered at each voltage level. In general, for each of the liquids tested, the sequence was such that, for the first few levels, the voltage light signal (discrete pulses increasing in time) was registered only by the PMT placed above the insulating plate. After reaching a given voltage level (meaning
Vt) the pulses started to also appear in the course connected with the second PMT (channel No. 2). In the case of both channels, with an increase of the voltage level, the frequency of light pulses also increased. The sequence of the oscillograms registered with the voltage increase is shown in
Figure 5 and the example chosen is the synthetic ester II.
The appearance of the streamers on the lower side of the insulating barrier results from the conditions which occurred in the space between barrier and grounded sphere after exceeding a given value of the testing voltage. These conditions were forced by electrical field stress in the mentioned space, which enabled the streamer initiation. At lower values of the testing voltage it was not possible to initiate the streamers below the insulating barrier because the distance between this area and the high-voltage point electrode was too long and the geometric electrical field resulting from the electrode configuration and the applied voltage was too low. In such conditions even the space charge from the discharge developed above the insulating barrier did not disturb the field strongly enough to cause streamer initiation in the area close to the sphere electrode. For the higher values of the testing voltages, when the light pulses are visible in course No. 2 connected with the PMT 2 placed below the insulating barrier, the geometric electrical field stress existing below the insulating plate is high enough, and by deformation of this field distribution by the appearance of the space charge it becomes sufficient for ionization processes, initiating streamer development (because of the high value of the local electrical field the streamers started to develop at the weak points occurring in the liquid volume). Thus, for lower testing voltages, although the streamers developed above the barrier, none of the phenomena were observed below it. Only by increasing the voltage, which causes a proportional increase in the value of the electric field stress in the entire space between the point high voltage (HV) electrode and the grounded sphere, the discharge propagation was noticed below the pressboard barrier. The next voltage levels strengthen the phenomena, which was confirmed by the more intense light registered by the PMTs. The above-presented considerations concern, to the same extent, all the liquids tested.
What is additionally interesting in the described situation is that the signal registered by the PMT 2 includes some kind of continuous state visible, for example, in
Figure 5d,e. An explanation of this fact may be the effect of the space charge which accumulated on the surface or inside the pressboard plate. When the electrical field affects the space around the plate and, of course, the plate itself, it is possible to excite this space charge for ionization processes, which is reflected in the emitted, and then registered, light.
What is also important to point out is that, in all cases and for all ranges of the testing voltage applied, the streamers always propagated as the slow-type of discharge. The time of streamer development was relatively long and the phenomena characteristics for the fast-type of discharges as in [
17,
18,
19,
20,
21,
26] were not noticed.
The comparative assessment of the liquids tested may be done when we consider the set of the oscillograms for distinctive liquids, which were registered at the same voltage levels. Such a comparison is made in
Figure 6 and
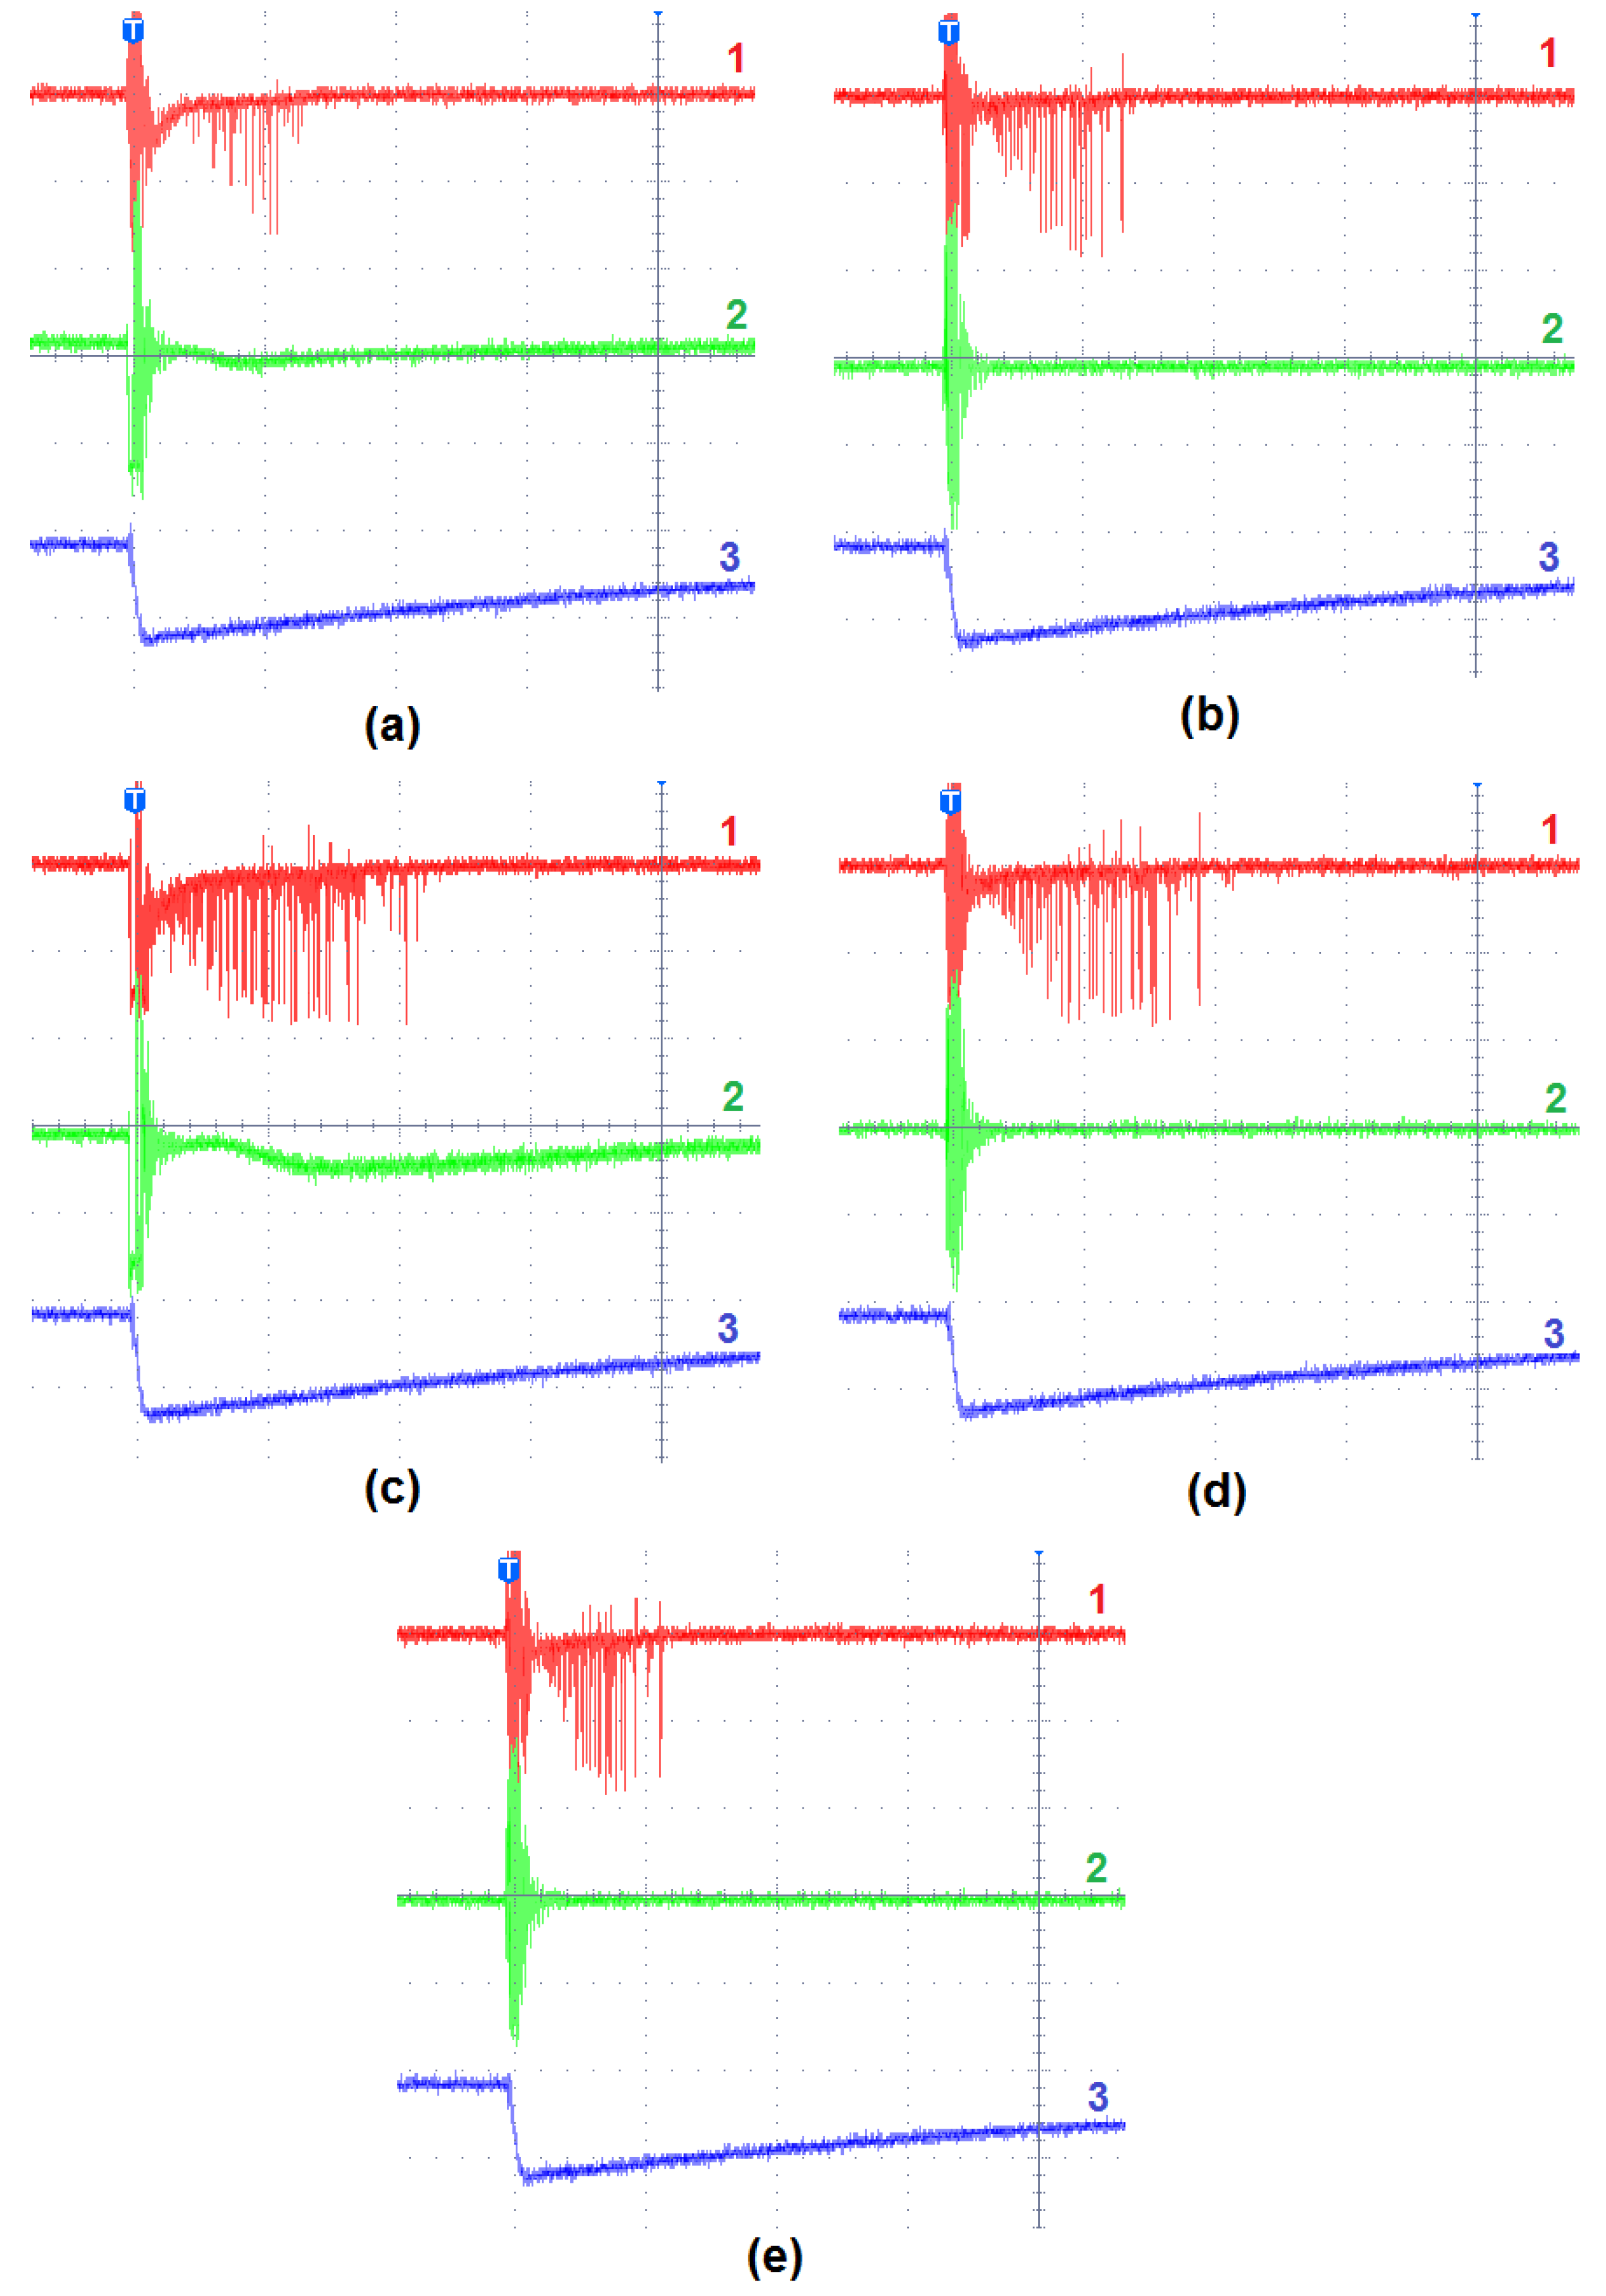
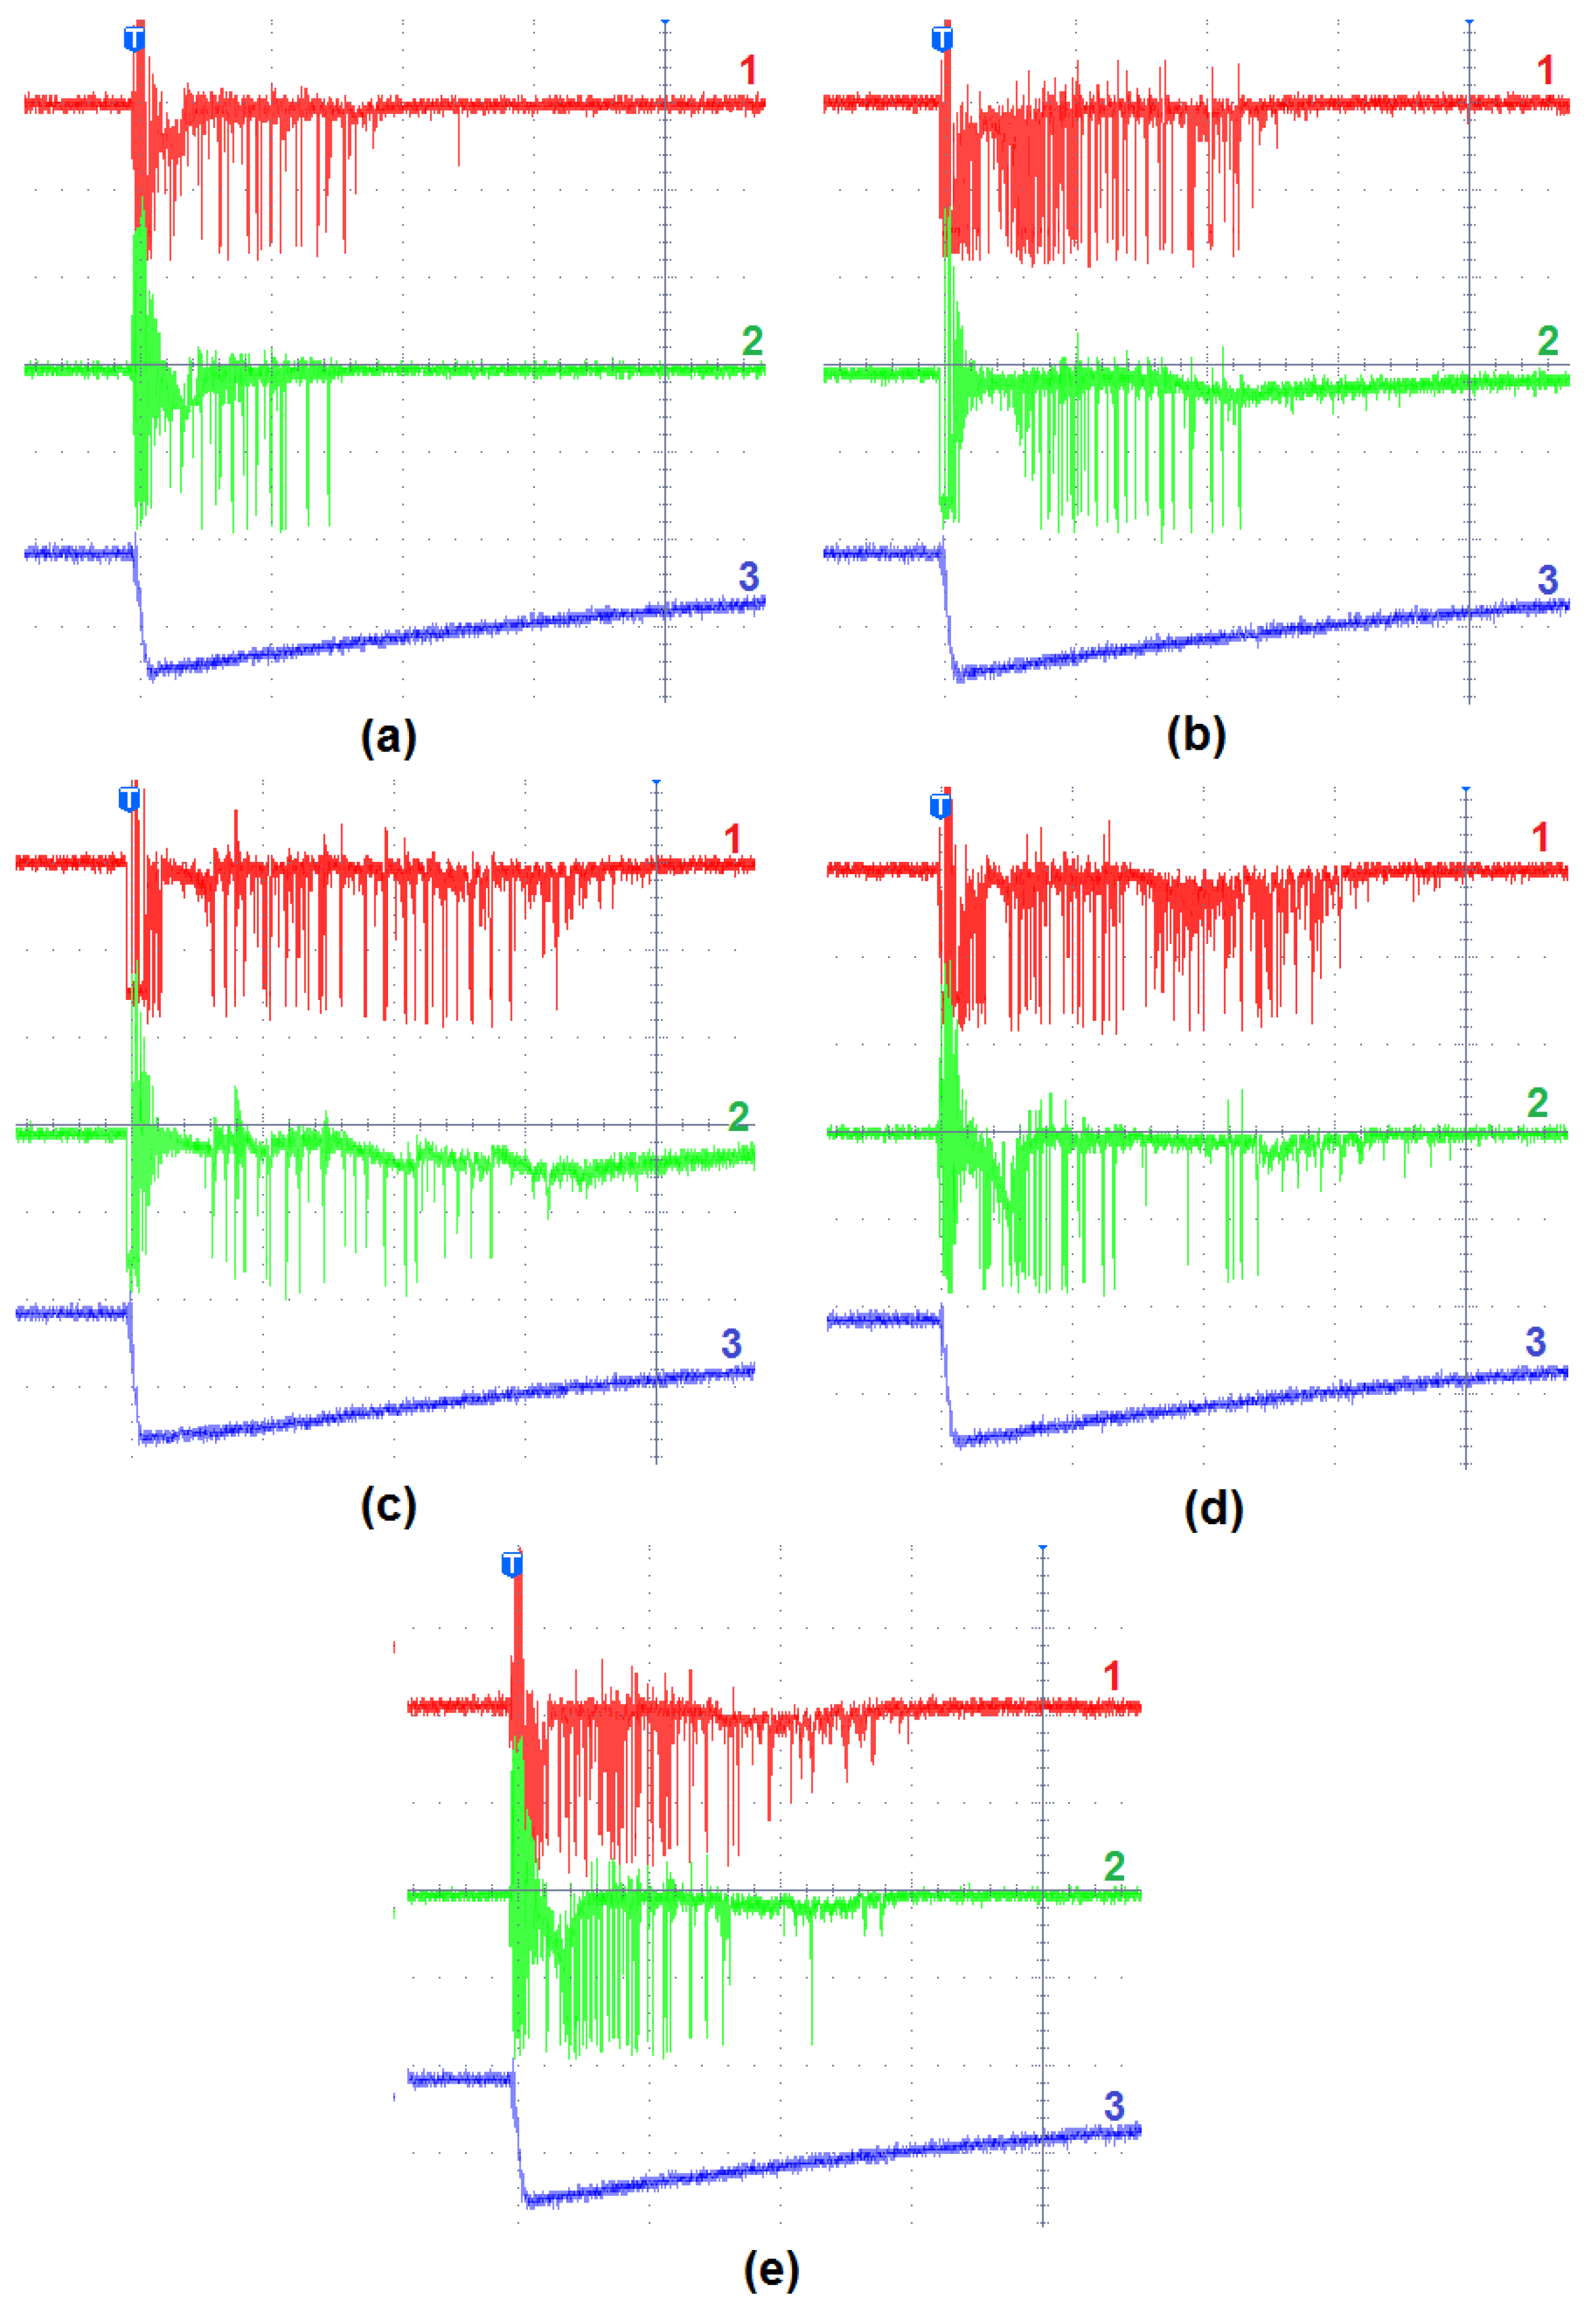
Figure 7, respectively, for two cases: when streamers developed only above the insulating barrier and when the streamers were observed on both sides.
In the first case, that is, for the oscillograms presented in
Figure 6, the main observations are identical to those noticed during the studies in the point-to-sphere electrode system without an insulating barrier [
15,
16]. The difference between the esters and the mineral oil is that in mineral oils the light pulses are characterized by lower peak values and a slightly lower frequency. More detailed analysis allowed formulating the statement that, in the case of both synthetic esters, the discharges propagate longer than in the case of the natural esters tested and the mineral oil. When we set together the oscillograms registered at the same value of the testing voltage at, for example, 125 kV, as presented in
Figure 6, the average time of discharge development for both synthetic esters is ca. 20 μs, while the same time corresponding with natural esters and mineral oil is 12–14 μs. On this basis it may be concluded that the conditions for streamer propagation (lengthening of the streamer channels) under the conditions of the experiment, are slightly better in the case of synthetic esters.
In turn, comparing with each other the oscillograms from
Figure 7, the conclusions are, in a sense, consistent with the observations based on
Figure 6. The time of discharge development in mineral oil is the shortest. A slightly longer time is noticed for both natural esters, while the longest time concerns the synthetic esters tested. Assessing, however, the waveforms registered by the PMT placed above and below the insulating barrier, it may be noticed that there is some correlation between the intensity of the light pulses registered for both sides. Thus, there is also a correlation between the processes occurring above and below the barrier after exceeding a given threshold value of the testing voltage. The typical waveforms are characterized by similar frequencies and peak values independently whether the streamers develop above or below the pressboard plate. This is, in fact, similarly visible for all the liquids tested. Hence, it may be said that the electrical field stress above the barrier (mainly resulting from the applied voltage and the radius of curvature of the HV point electrode) is very close in value to the electrical field stress below the barrier, which is disturbed by the existing space charge. However this conclusion is not unequivocal, because in some cases the phenomena occurring below the barrier, represented by the light pulses, are less intense. The pulses are less frequent and have lower peak values.
In conclusion, independently of the liquid type, it may be stated that insulating pressboard barriers effectively prevent the development of the discharges leading to breakdown. Probably, the discharges propagate in both areas in the direction of the insulating plate and accumulate on its surface. Due to the high electrical strength of the pressboard, the intensity of the discharges in all cases are too low to cause the formation of a breakdown channel. At least up to a peak value of 180 kV of the standard lightning impulse voltage of negative polarity, such breakdown is not possible. Thus, all the liquids tested, although the existing differences in the lightning impulse breakdown voltages determined using the IEC 60897 standard, as well as the differences in the threshold value of the voltage at which the streamers started to develop below the insulating barrier (Vt), behaved similarly under the conditions of the experiment, allowing for an efficient stopping of the formation of the discharge of a breakdown nature.


