
Study on the Influence of Connection Structure between Batteries on Battery Pack Performance


1
School of Mechanical and Electrical Engineering, China University of Petroleum (East China), Qingdao 266580, China
2
National Engineering Research Center of Marine Geophysical Prospecting and Exploration and Development Equipment, China University of Petroleum (East China), Qingdao 266580, China
*
Author to whom correspondence should be addressed.
Electronics 2024, 13(5), 817; https://doi.org/10.3390/electronics13050817
Submission received: 25 December 2023
/
Revised: 10 February 2024
/
Accepted: 12 February 2024
/
Published: 20 February 2024
(This article belongs to the Section Electrical and Autonomous Vehicles)
Abstract
:The primary challenge to the commercialization of any electric vehicle is the performance management of the battery pack. The performance of the battery module is influenced by the resistance of the inter-cell connecting plates (ICCP) and the position of the battery module posts (BMP). This study investigates the impact of different connection structures between battery cells on the performance of lithium-ion batteries. A parallel-connected battery model is constructed by connecting a given number of battery cells in parallel, and this model is used to examine the battery connection structure. We discover the effect of the connection structure on the battery pack’s consistency, the development law of the inconsistency of the conventional connection structure after constant current discharge, the scheme for optimizing the connection structure, and the improvement in the battery pack’s performance by the improved connection structure. The performance of the improved connection structure is verified by experiments. This structure showcases a capacity decay of under 5% after 350 cycles and minimal attenuation after 300 charge/discharge cycles.
1. Introduction
The worldwide electricity demand will be over 60 trillion kWh by 2050. With the rise in electricity demand, there are concerns about the reliability of the grid, the use of fossil fuels, and related carbon emissions. The development of electric vehicles to decrease dependence on foreign oil and the increased deployment of renewable energy resources are becoming more prominent [1,2,3,4,5]. The notion that inexpensive and reliable electricity is critical for economic development underpins these considerations [6,7]. EES (electrical energy storage) is incapable of addressing all of these issues. However, energy storage is a well-established method for increasing grid dependability and utilization [8,9]. Mechanical, electrical, chemical, and electrochemical energy storage technologies are the four types of energy storage technologies accessible for large-scale applications [10]. Pollution-free operation, excellent round trip efficiency, adjustable power and energy characteristics to satisfy diverse grid functions, long cycle life, and cheap maintenance are all advantages of electrochemical energy storage [11,12]. For the integration of renewable resources, batteries are an excellent energy storage technology. They are well suited for use at distributed locations because of their compact size. Limited to the voltage and capacity of the lithium-ion battery, a battery is composed of several electrochemical cells that are connected in series and/or in parallel [10,13,14,15].
Even if it is the same batch of lithium-ion batteries, metrics such as internal resistance, capacity, the initial state of charge (SOC), and other parameters are prone to variance due to the process technology of cell manufacturing [16,17,18,19,20,21]. The battery cell methodical and technological evaluation cannot be directly applied to the battery pack issue [22]. The performance of a Li-ion battery pack is worse than that of a single battery cell, as previously observed in the literature [20,23,24], which is often attributable to variances among the battery cells. Many academics have concentrated on battery cell inconsistencies and safety in recent years [25]. The worse the consistency of the battery pack after the battery cells are grouped, the greater the impact on the performance of the battery pack. The battery pack’s inconsistency once the battery cells are grouped will cause problems with the battery pack’s performance, longevity, and safety [24]. Zheng et al. [26] pointed out a SOC strategy to accurately identify cell SOC inconsistency by intermittently reducing pack SOC to 30% during HEV operation. Wang et al. [27] pointed out that inter-cell connection plate resistance causes an unequal current flow among the battery cells. The battery cell directly connected to the battery module posts is the first one to reach its end of discharge (EOD) voltage. During the discharge process, it also displays the lowest terminal voltage and SOC. The battery cell that is directly attached to the battery module posts is more likely to go into deep discharge. Therefore, it has a higher aging rate.
In this paper, a first-order RC battery model is developed in MATLAB (2022)/Simulink, and its correctness is verified by experiments. A parallel-connected battery model is constructed by connecting a given number of battery cells in parallel, and this model is used to examine the battery connection structure. We discover the effect of the connection structure on the battery pack’s consistency, the development law of the inconsistency of the conventional connection structure after constant current discharge, the scheme for optimizing the connection structure, and the improvement in the battery pack’s performance by the improved connection structure. The performance of the improved connection structure is verified by experiments.
2. Modeling and Verification
2.1. Battery and Experimental Equipment Parameters
The ternary lithium-ion battery from Tianjin Qinxin New Energy Research Institute was selected as the research object, and the parameters of the battery are shown in Table 1.
In the experiment, a programmable temperature and humidity chamber was used to control the temperature and humidity parameters of the battery test, a power battery performance test platform was used to achieve high-precision charge and discharge control of the battery, and a high-precision data acquisition device was used to collect the voltage signal of the battery in real-time. The basic parameters of the test equipment are shown in Table 2.
2.2. Battery Equivalent Circuit Model
The single-cell battery model is the basis of the battery pack model, so the selection of the single-cell battery model is very important. The research content does not involve in-depth research on the electrochemical mechanism and does not need to consider the complex changes in the battery microstructure. The focus is on the external characteristics of the battery’s terminal voltage, current, and other physical quantities, so the equivalent circuit model is selected.
The main principles that need to be considered when modeling the single-cell battery equivalent circuit model are:
- (1)
- To try to combine with the battery’s chemical reaction mechanism and select model parameters with relevant meanings;
- (2)
- The model should be able to reflect the battery’s characteristics more accurately, have higher calculation accuracy, and be able to adapt to different environments and working conditions;
- (3)
- Within the design requirements, the single-cell battery model should be as simple as possible, simplify the calculation process, and improve the usability of the model.
There are many related studies on the single-cell equivalent circuit model, mainly including the Rint model, Thevenin model, and PNGV model [28,29,30]. Tarun pointed out that the first-order or second-order RC module equivalent circuit model is more feasible, and the accuracy is within a reasonable range [31]. The first-order RC model is enough to solve most industrial-related problems. The single-cell model needs to be used as the basic module of series and parallel connection. After considering the calculation amount and accuracy, the first-order Thevenin model was adopted.
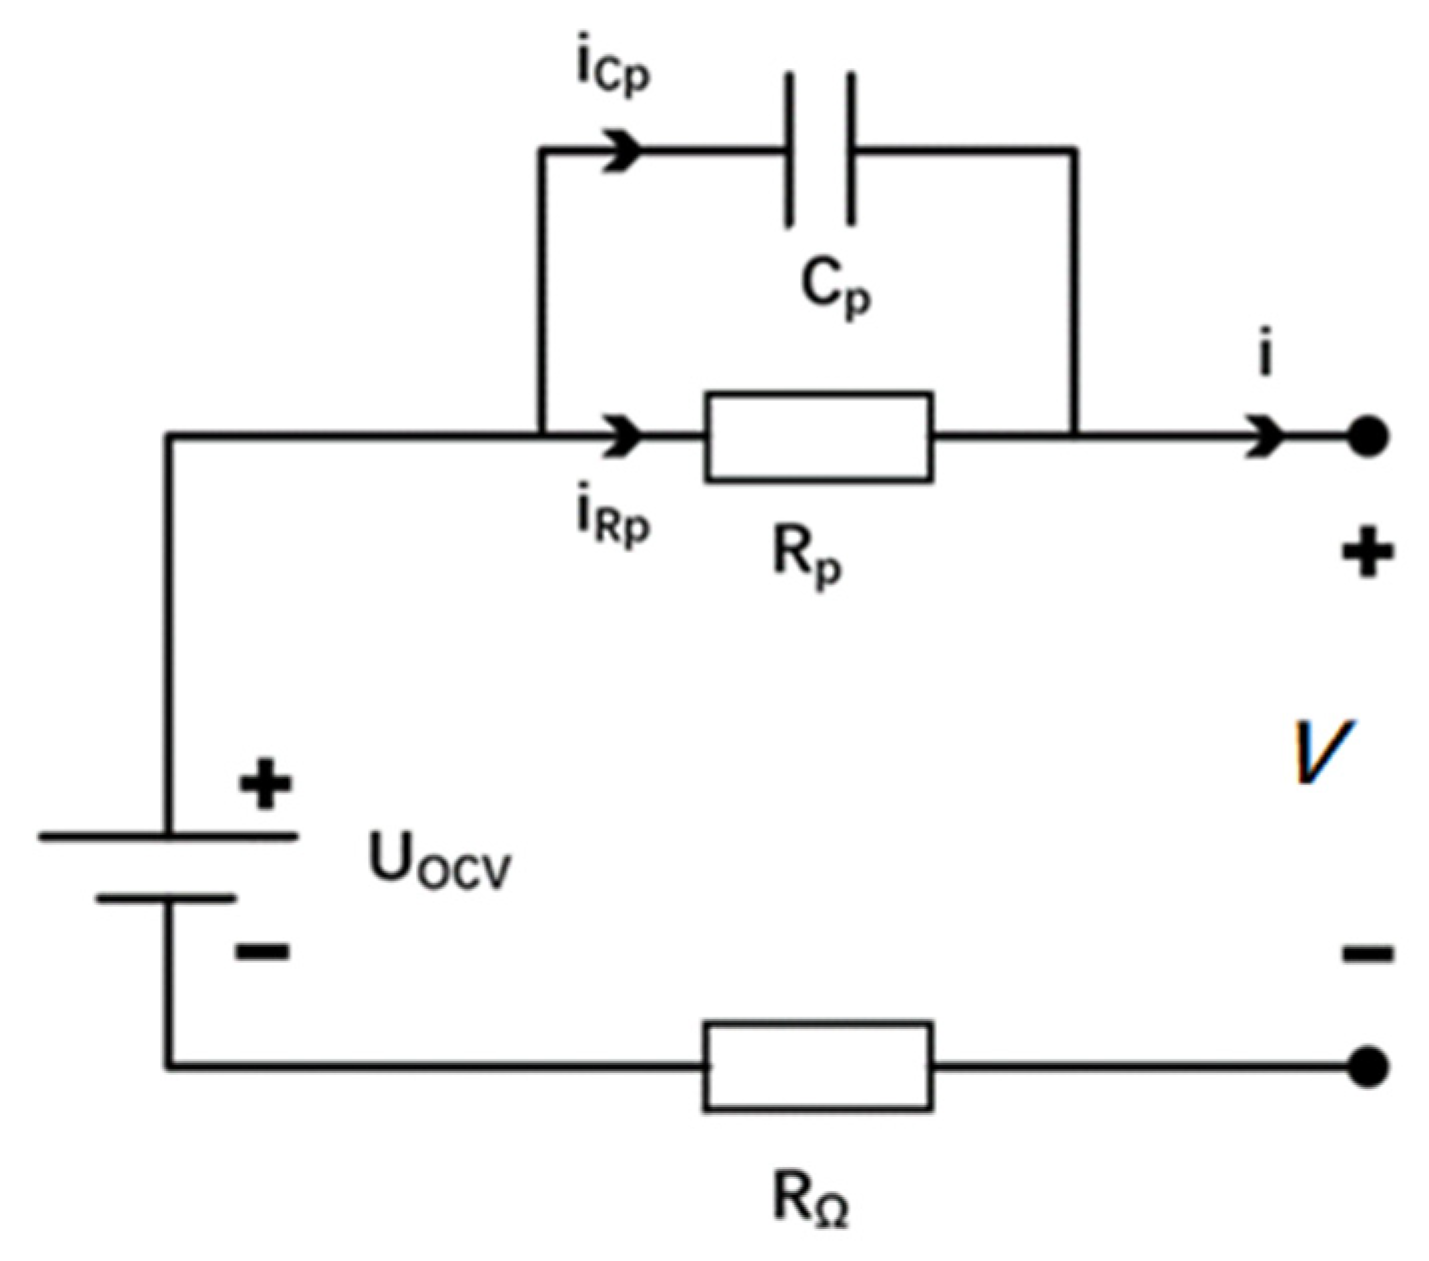
The equivalent circuit diagram of the first-order RC model is shown in Figure 1. RΩ is the ohmic internal resistance of the battery, Cp is the polarization capacitor, Rp is the polarization resistance, and RΩ, Cp, Rp, and other parameters are related to the battery SOC, temperature, aging degree, etc. For the battery equivalent circuit model, the battery terminal voltage expression can be obtained by Kirchhoff’s law:
where V represents the terminal voltage of the lithium-ion battery, UOCV represents the open circuit voltage of the battery, UΩ represents the voltage of the ohmic resistance, and Up represents the voltage of the first-order RC network. For the RC network, there is:
where I is the working current of the single-cell battery, the current is positive for charging, and the current is negative for discharging.
Solving Equation (2) gives:
The battery terminal voltage can be obtained by solving Equations (3) and (1) together:
The parameters UOCV, RΩ, Rp, Cp, etc., in the equivalent circuit model are generally unknown and need to be obtained in advance. A more convenient method is offline identification. The data required for identification are obtained by performing relevant tests on the battery [23].
2.3. Battery Model Parameter Identification
2.3.1. SOC Calculation and Capacity Correction
The ampere-hour integral method is utilized to estimate the SOC (of the battery):
where SOC(k) and , respectively, represent the state of charge and working current of the cell at k time. When it is positive, it means charging, and when it is negative, it means discharging. C is the rated capacity of the battery, η is the charge and discharge efficiency of the battery, and T is the discrete time.
2.3.2. OCV-SOC Curve Identification
The value of the Open Circuit Voltage (OCV) of the battery is affected by the SOC of the battery, and there is a certain correspondence between the two parameters. The principle of estimating SOC by the battery equivalent circuit model is realized by the correspondence between the value of OCV and SOC of the battery, so it is necessary to obtain the correspondence curve of OCV-SOC in advance.
To obtain the OCV-SOC relationship, the method of constant-current discharge under the low-multiplication working condition of the battery is adopted, in which the battery is fully charged, and the battery is discharged to the cutoff voltage of the battery several times with a certain amount of discharge and the same discharge multiplication rate. There is a polarization effect inside the battery, making the apparent internal resistance of the battery a changing quantity, and the test equipment can only measure the terminal voltage of the battery when the battery is just discharged, the terminal voltage of the battery is not equal to the open-circuit voltage of the battery, and it is necessary to wait for the disappearance of the polarization effect of the battery before it can be considered as equal to the open-circuit voltage of the battery, and the polarization effect is generally eliminated by the method of static discharge. The specific steps of the designed experiment are:
- (1)
- Place a single ternary lithium-ion battery in a constant temperature and humidity chamber at an ambient temperature of 25 °C for 2 h;
- (2)
- Use a constant-current discharge of a single cell at a discharge rate of 0.5 C to a cutoff voltage of 3.0 V. The battery is then discharged at a rate of 0.5 C for 2 h;
- (3)
- Leave the single-cell battery to stand for 2 h, after the battery is stabilized, fill the battery with standard charging requirements;
- (4)
- Perform constant current discharge of the battery for a duration of 12 min with a discharge multiplication rate of 0.5 C. After the battery has been fully rested (1 h) [30], use high-precision acquisition equipment to collect the open-circuit voltage;
- (5)
- Repeat step (4) until the battery voltage reaches a cutoff voltage of 3.0 V.
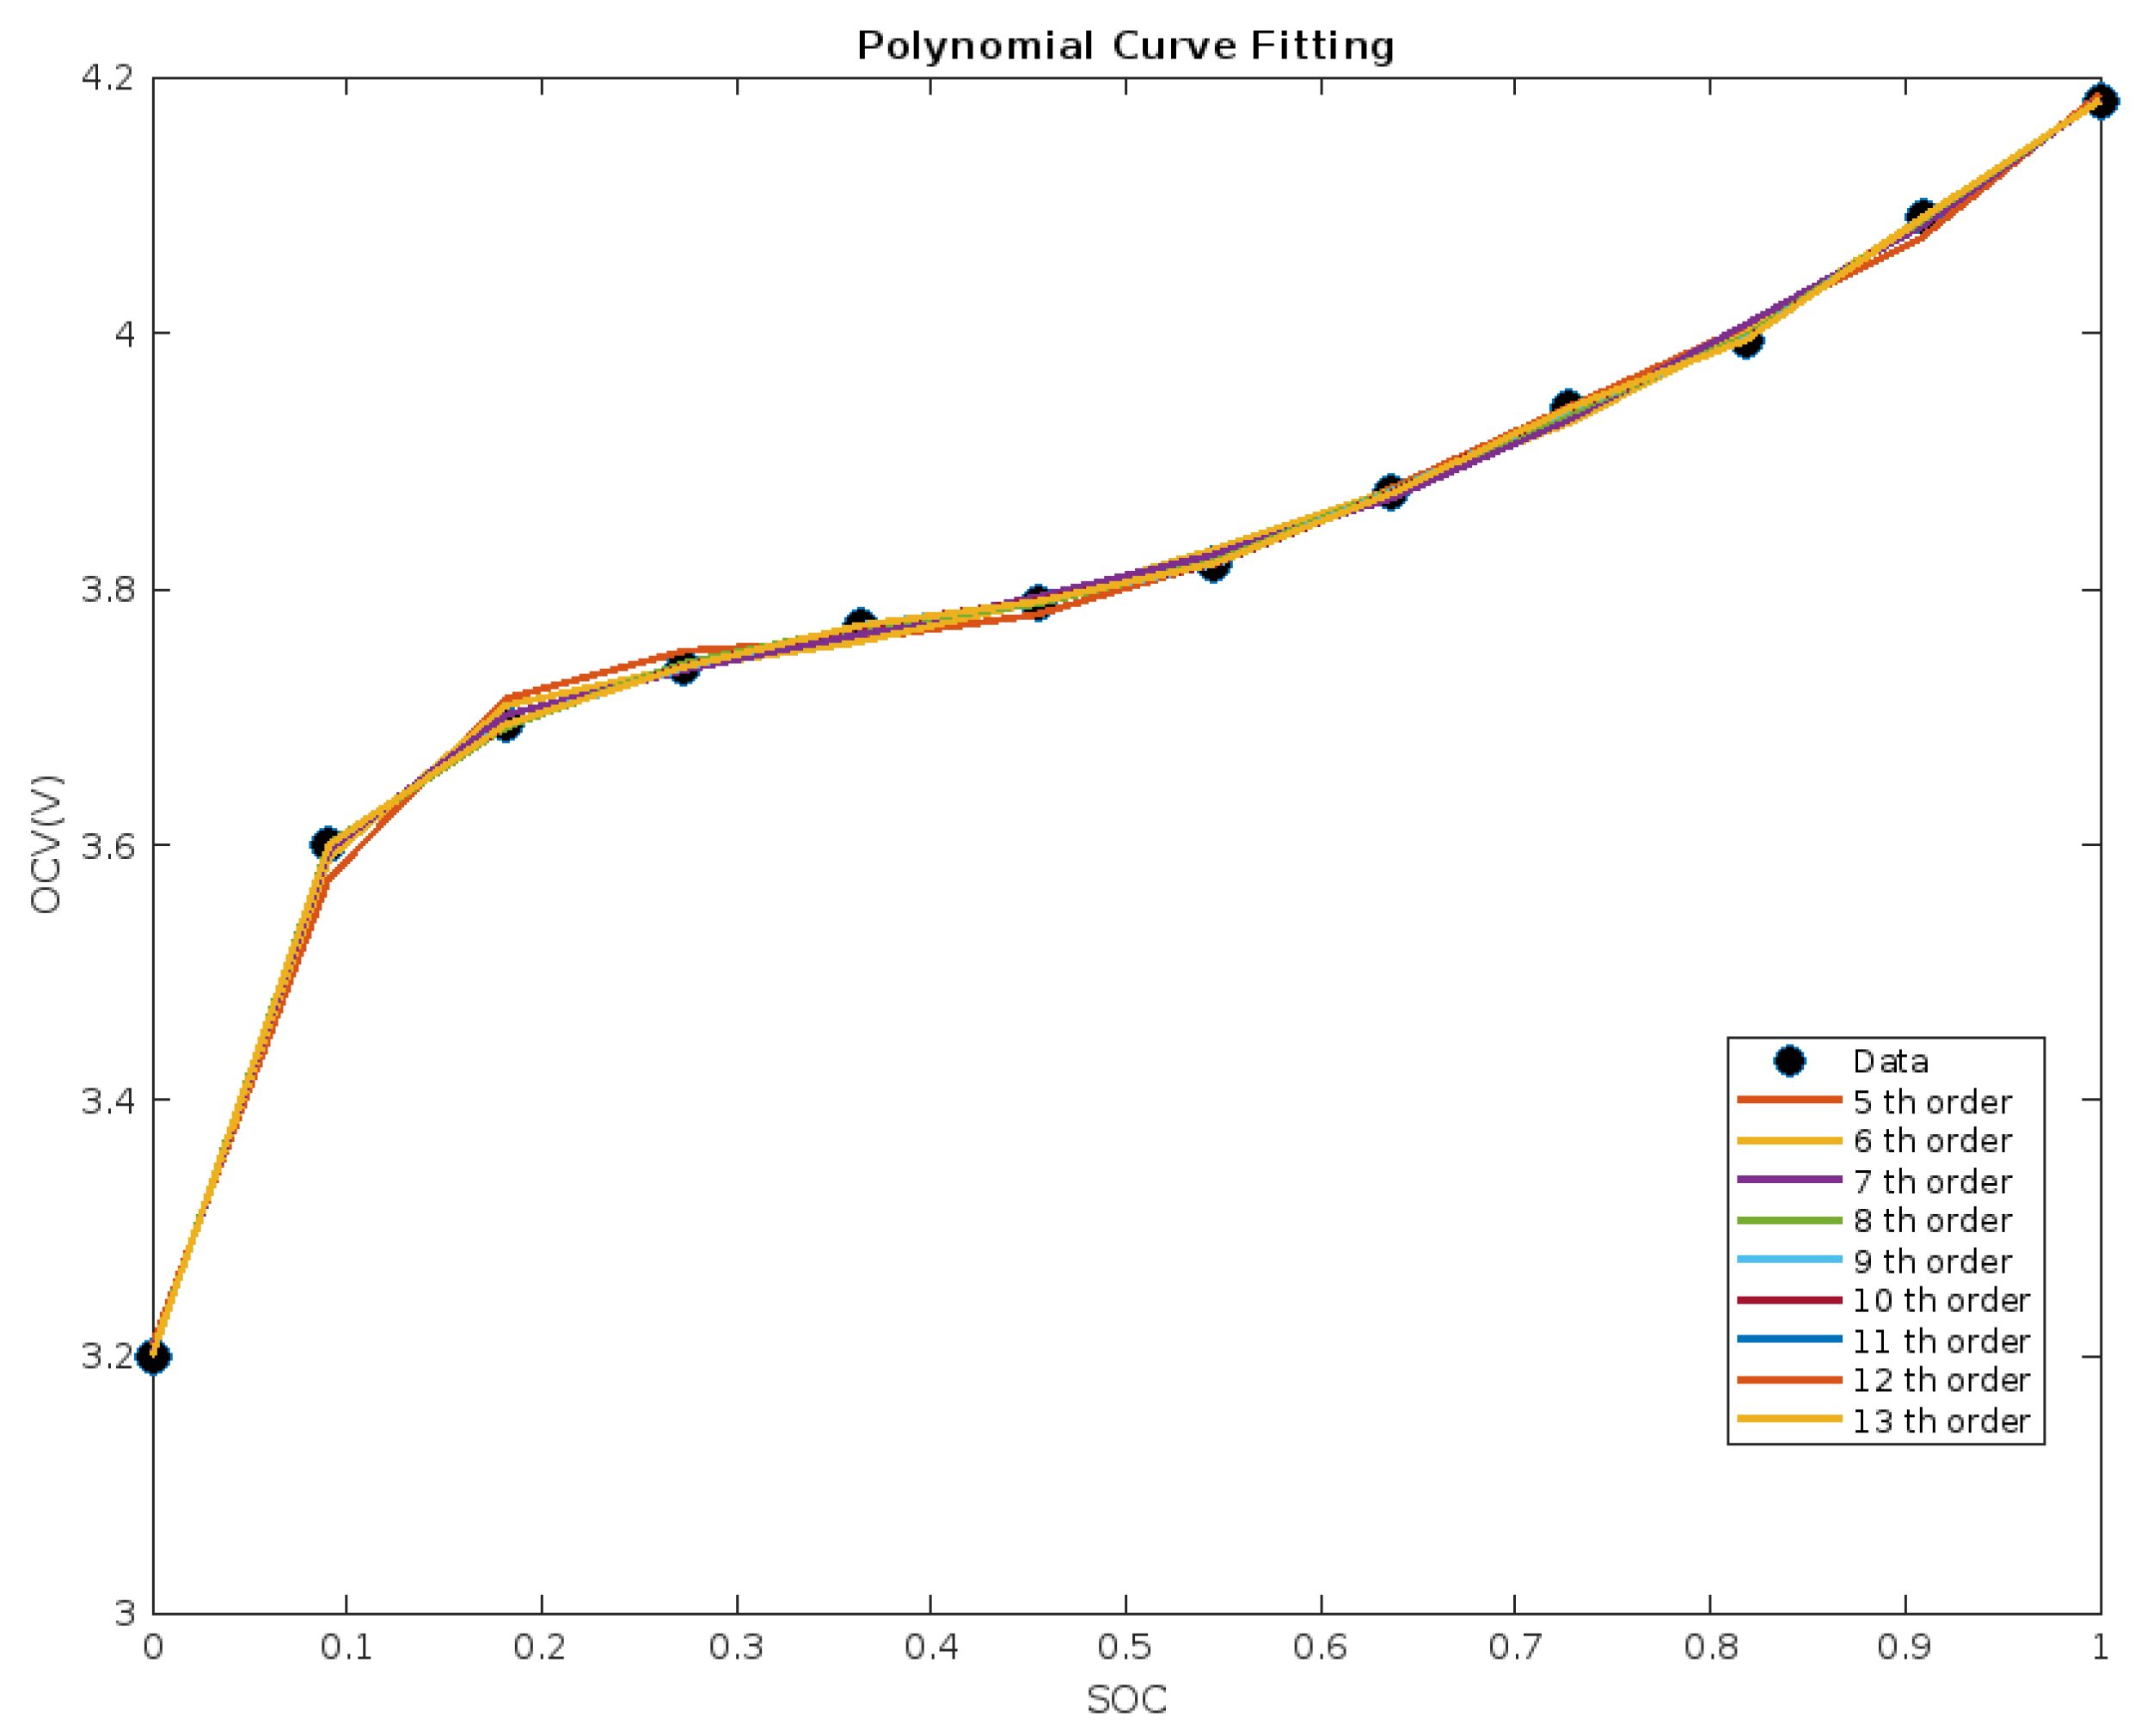
To describe the complete OCV-SOC relationship curve with a single function, the mathematical method provided by Matlab was used to fit a polynomial to the test results, as shown in Figure 2. It can be seen from the results that the fitting R2 increases with the increase of the order, and the root mean square error of the fitting decreases with the increase of the order, which shows that the fitting effect increases with the increase of the order. However, when the order reaches 13, the fitting R2 is very close to 1, and the root mean square error of fitting is very close to 0, which shows that the fitting effect is very good. Therefore, we use 13th order polynomial fitting, and its R2 is close to 1 and RMSE is close to 0, which meets the requirement of a 95% confidence interval.
When the 13th order linear fitting was used, a better fitting effect was obtained, which was able to better represent the SOC-OCV relationship, and the fitted expression is as follows [32]:
where x is the SOC of a single cell and f(x) is the open-circuit voltage of a single cell in V. Coefficients of polynomial equations fitted by SOC-OCV as shown in Table 3.
2.3.3. Identification of Ohmic Internal Resistance and RC Parameters
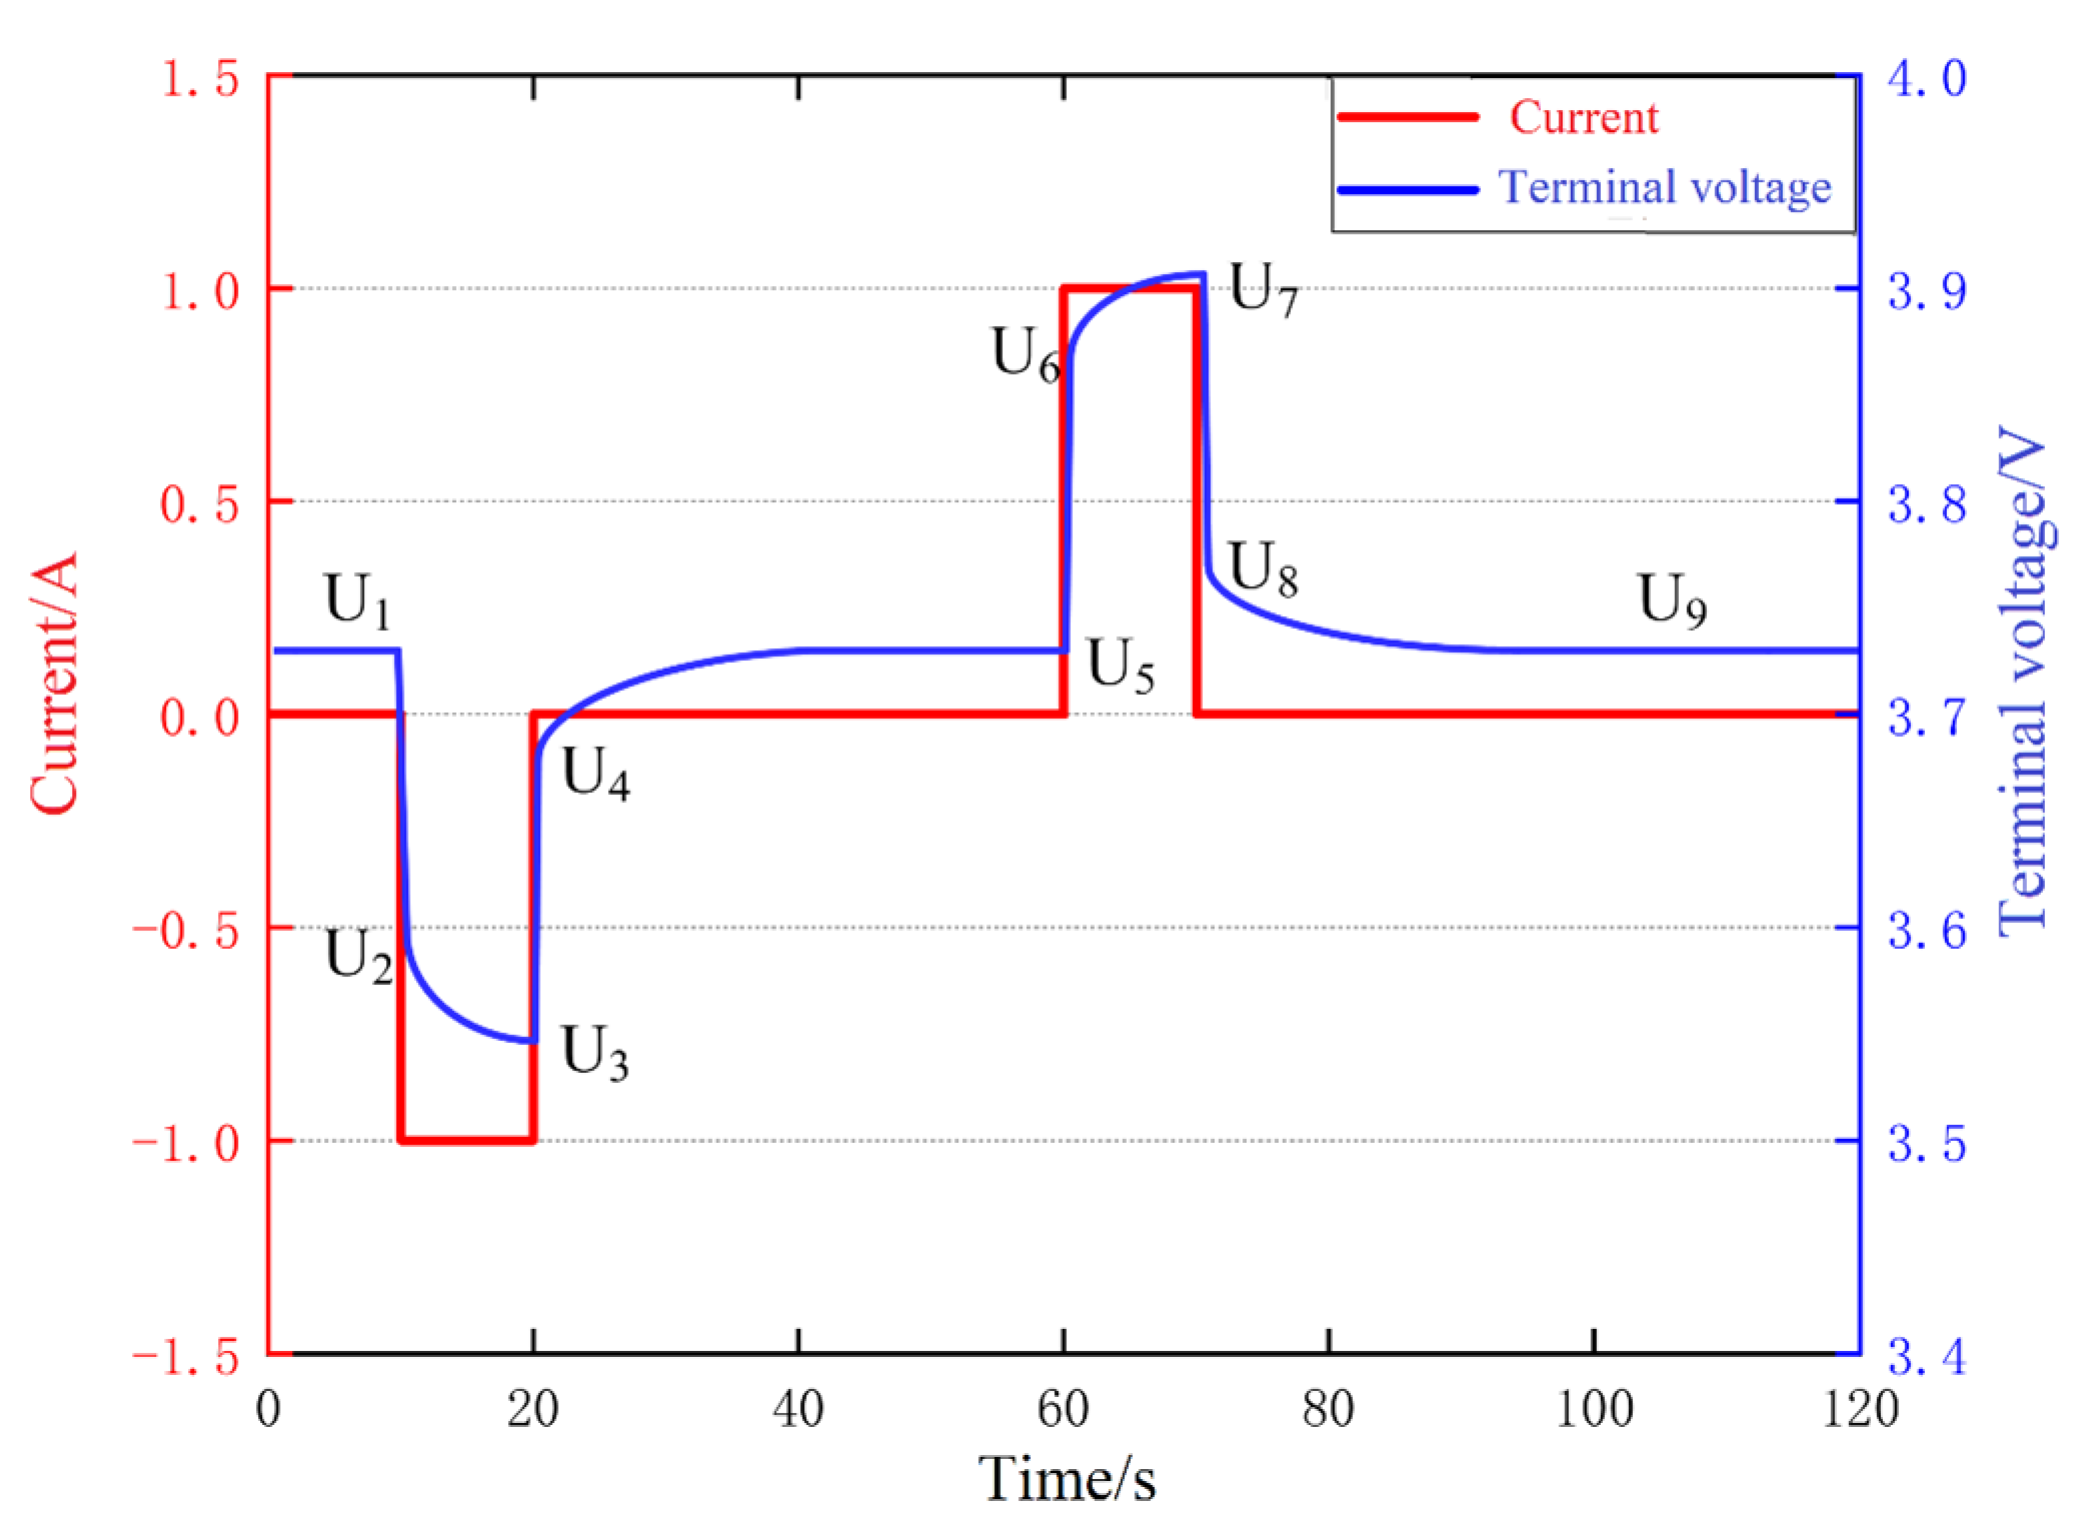
The parameters of RΩ, Rp, and Cp of a single cell are linked to the SOC state of the battery, the battery temperature, and the charging and discharging currents, etc., which makes the parameters of RΩ, Rp, and Cp of a single cell change along with these parameters, and this is a dynamic value [30]. To simplify the study, the effects of temperature and current on RΩ, Rp, and Cp were not considered, and only the effects of SOC on RΩ, Rp, and Cp were studied. The parameters of RΩ, Rp, and Cp of a single cell were identified using Hybrid Pulse Power Characterization (HPPC) experiments [33]. The battery parameters are identified using HPPC and the identification process is shown in Figure 3.
U1–U4 discharge pulse process in Figure 3 (duration 10 s): under the excitation of a 10 s discharge pulse, the terminal voltage of the battery falls rapidly from U1 to U2, which is due to the polarization phenomenon inside the battery, and because of the rapid fall time, the voltage drop from U1 to U2 is considered to be mainly caused by ohmic polarization. The U2–U3 stage, on the other hand, has a slower voltage drop, which is more similar to the changes corresponding to its electrochemical polarization and concentration polarization when the battery is continuously discharged, and therefore it is considered that this stage is the total effect of the two polarization effects. At the end of discharge, U3 rises to U4 with a very fast rate of increase, similar to the voltage drop caused by ohmic polarization during discharge, so it is considered that this stage is the effect of the disappearance of ohmic internal resistance. Since there will be errors in testing, which will have an impact on the calculation accuracy, the average value of the ohmic internal resistance of the two stages is chosen to calculate the battery’s ohmic internal resistance. The formula for calculating the battery ohmic internal resistance is shown in (7).
U4–U5 resting process in Figure 3 (duration 40 s): in this stage, the battery is in a resting process and there is no external input. This stage is mainly for obtaining the RC parameters, which can be obtained using the fitting method. The response is shown in Equation (8).
where Up indicates the process and trend of voltage change when the battery is stationary (current is 0) and the battery polarization effect subsides, Up(0) is the value of the polarization voltage at the moment of 0, and τ is the time constant, which satisfies Equation (9), and the open-circuit voltage UOCV is a constant value when it is stationary, combining Equations (8)–(10) to get the value of the first-order RC parameter.
In the HPPC test standard, there are detailed requirements for SOC test points, which need to be set every 10%. The detailed experimental procedure is as follows:
- (1)
- A single Li-ion battery is placed in a constant temperature and humidity chamber at an ambient temperature of 25 °C for 2 h;
- (2)
- Use a 0.5 C discharge multiplier on a single battery constant current discharge to the cut-off voltage of 3.0 V, leave the battery for 2 h, to be stable after the battery to the standard charging requirements of the battery full, leave the battery for 1 h;
- (3)
- Discharge the battery at a discharge multiplication rate of 0.5 C with a pulse discharge of 10 s and then leave it for 40 S. After the battery has been left to stand still, charge the battery at a discharge multiplication rate of 0.5 C with a pulse charge of 10 s, and then leave it for 40 s. Real-time collection of the battery terminal voltage is carried out in the whole process;
- (4)
- Discharge the battery at a constant discharge multiplication rate to the next SOC test point, fully rest the battery, and then repeat step 3 and stop after completing all test points.
Calculate the experimental data to obtain the identified parameters for each SOC test point as shown in Table 4.
2.4. Validation of the Validity of the Monolithic Model
The RΩ, Rp, and Cp at different SOC were obtained by HPPC test, and the relationship between OCV and SOC was obtained by conventional discharge test and fitted using Matlab, and the simulation model of the battery can be built in Simulink. The battery simulation model uses the ampere-time integration method to obtain the current SOC value of the battery, and the relevant parameters of the battery at different SOC values are obtained by checking the table.
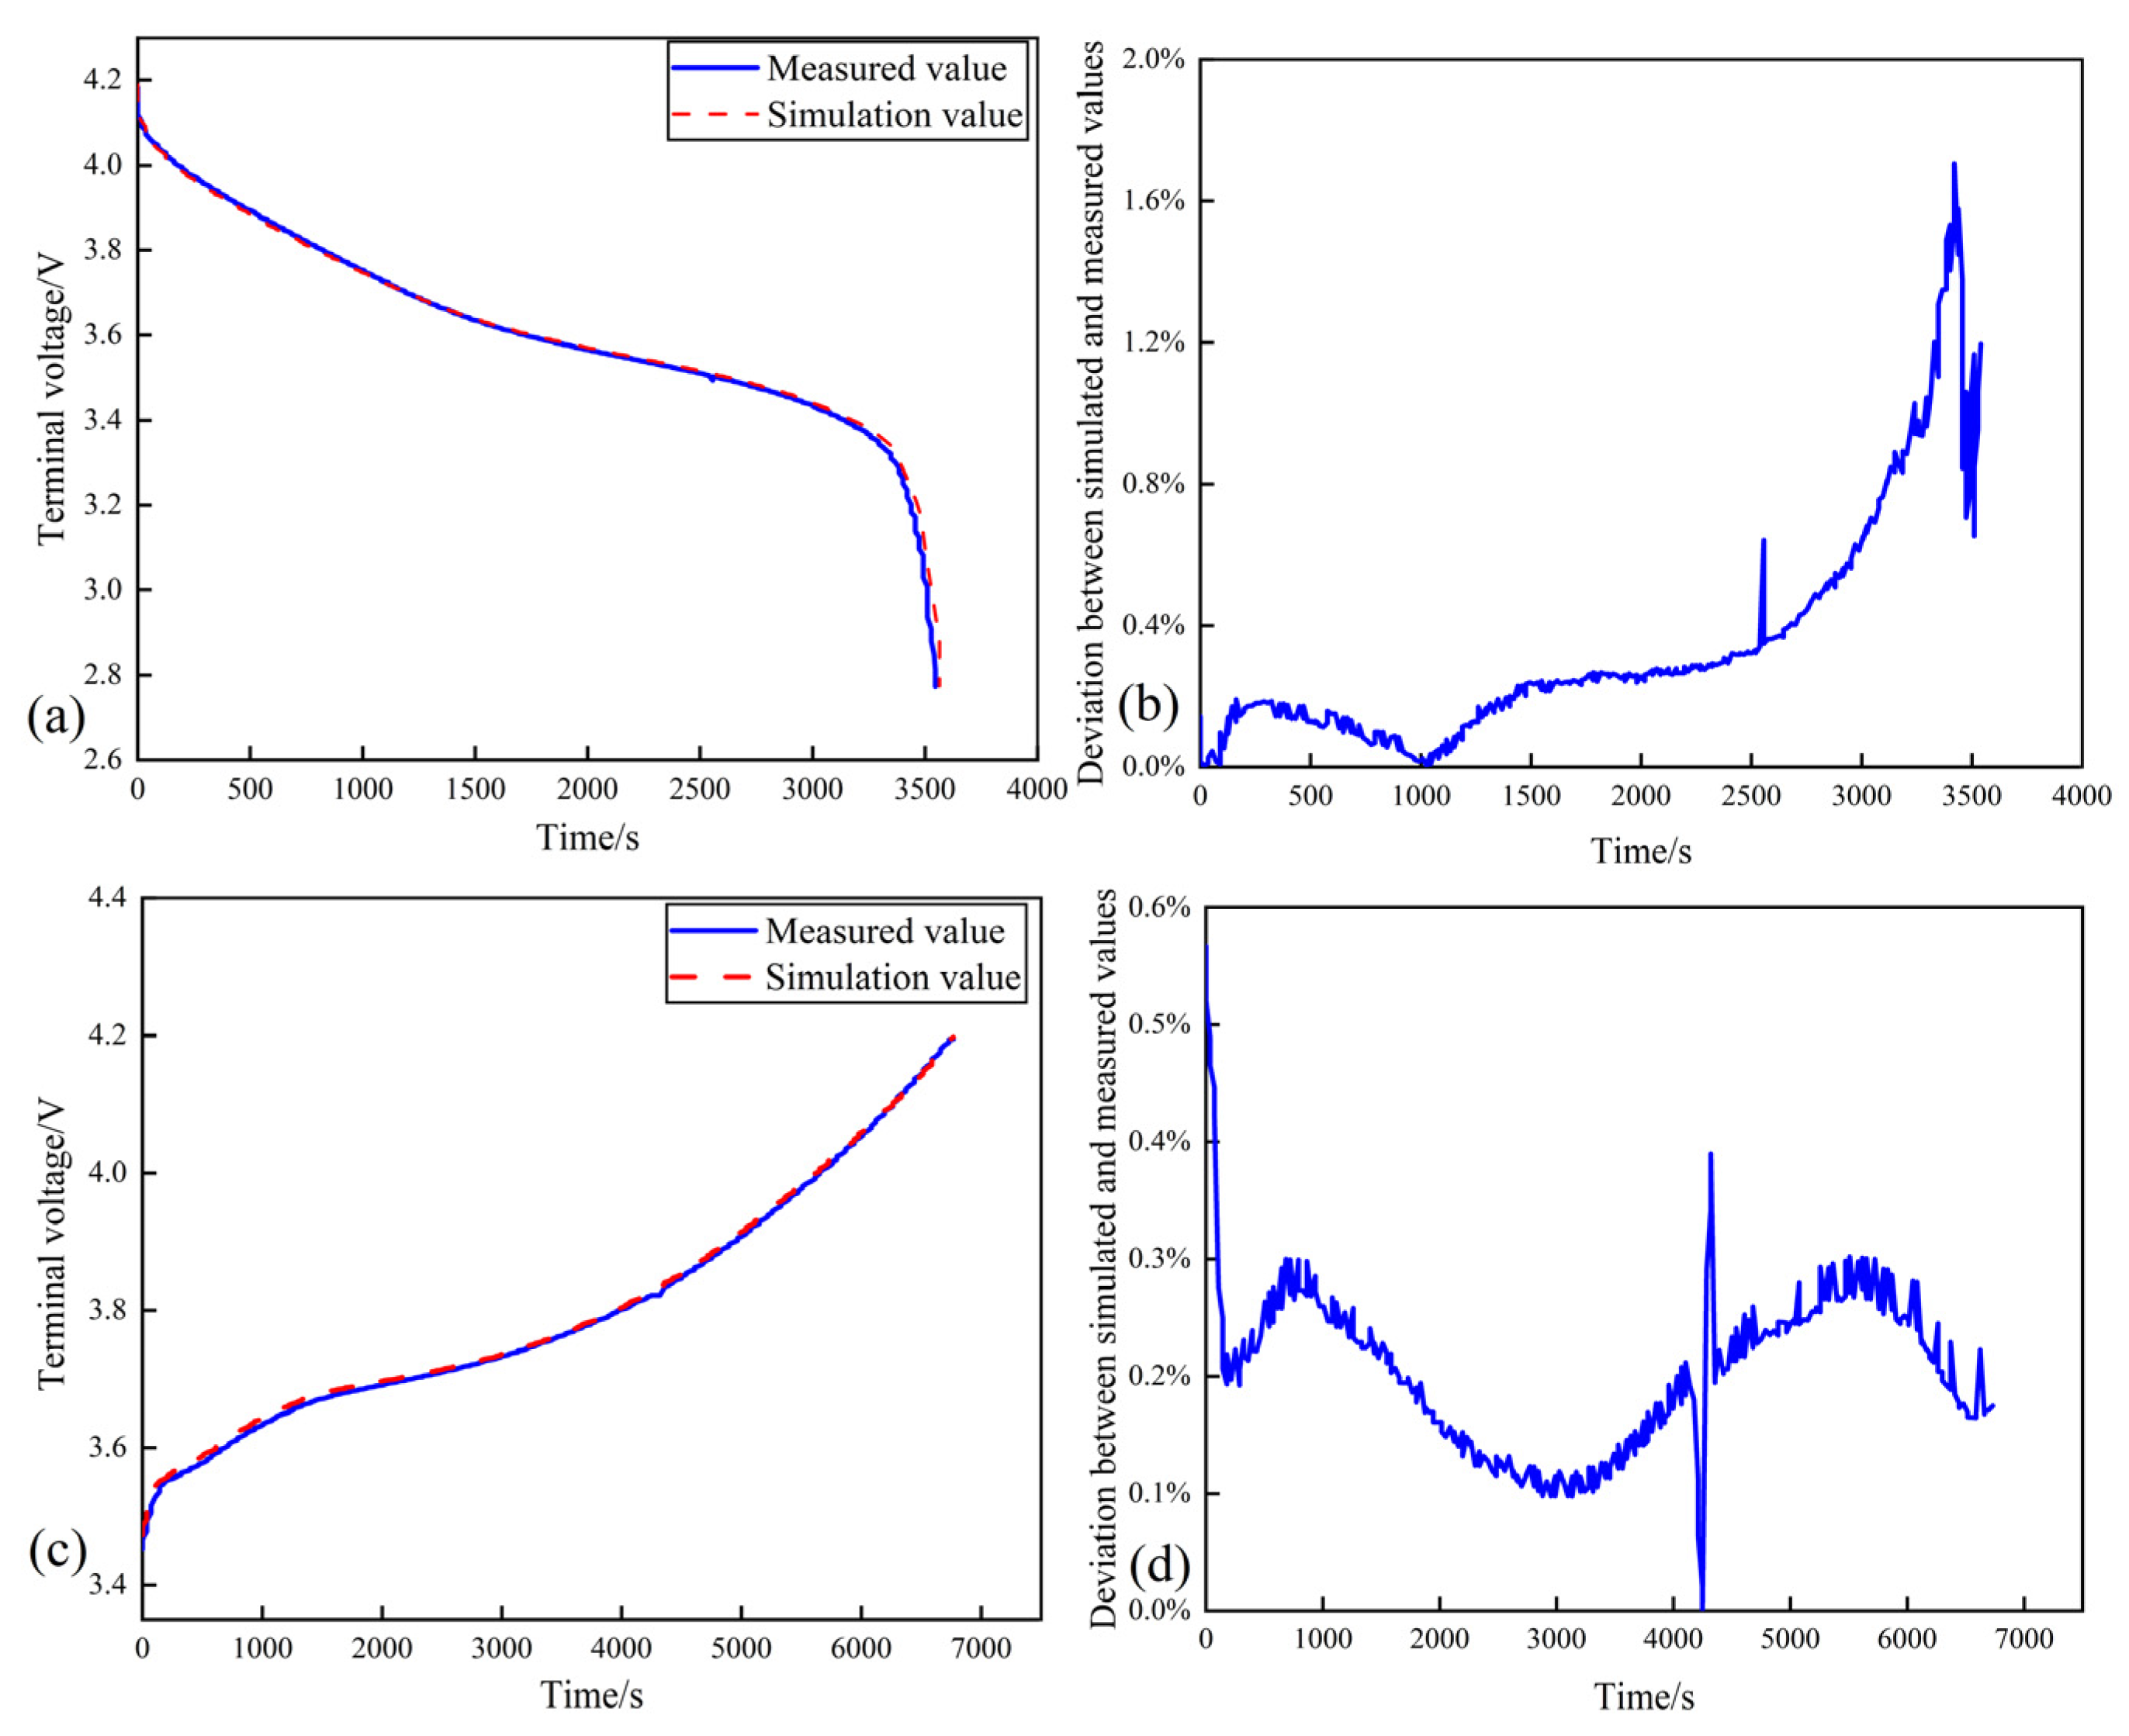
After the single-cell battery model is built, the accuracy of the model needs to be verified, and the constant temperature and humidity box and battery test platform can be used to test the single-cell battery. The idea of model verification is to input the actual collected battery current conditions into the simulation model under the condition of constant current charge and discharge, the difference between the calculated end voltage and the measured end voltage was compared, and the accuracy of the model was evaluated by the difference between the calculated end voltage and the measured end voltage. As shown in Figure 4, the error between the simulated end voltage and the experimental measurement is less than 2%, and the battery constructed with the battery parameters obtained by the offline identification method meets the required accuracy of the study.
2.5. Parallel-Connected One-Order RC Model
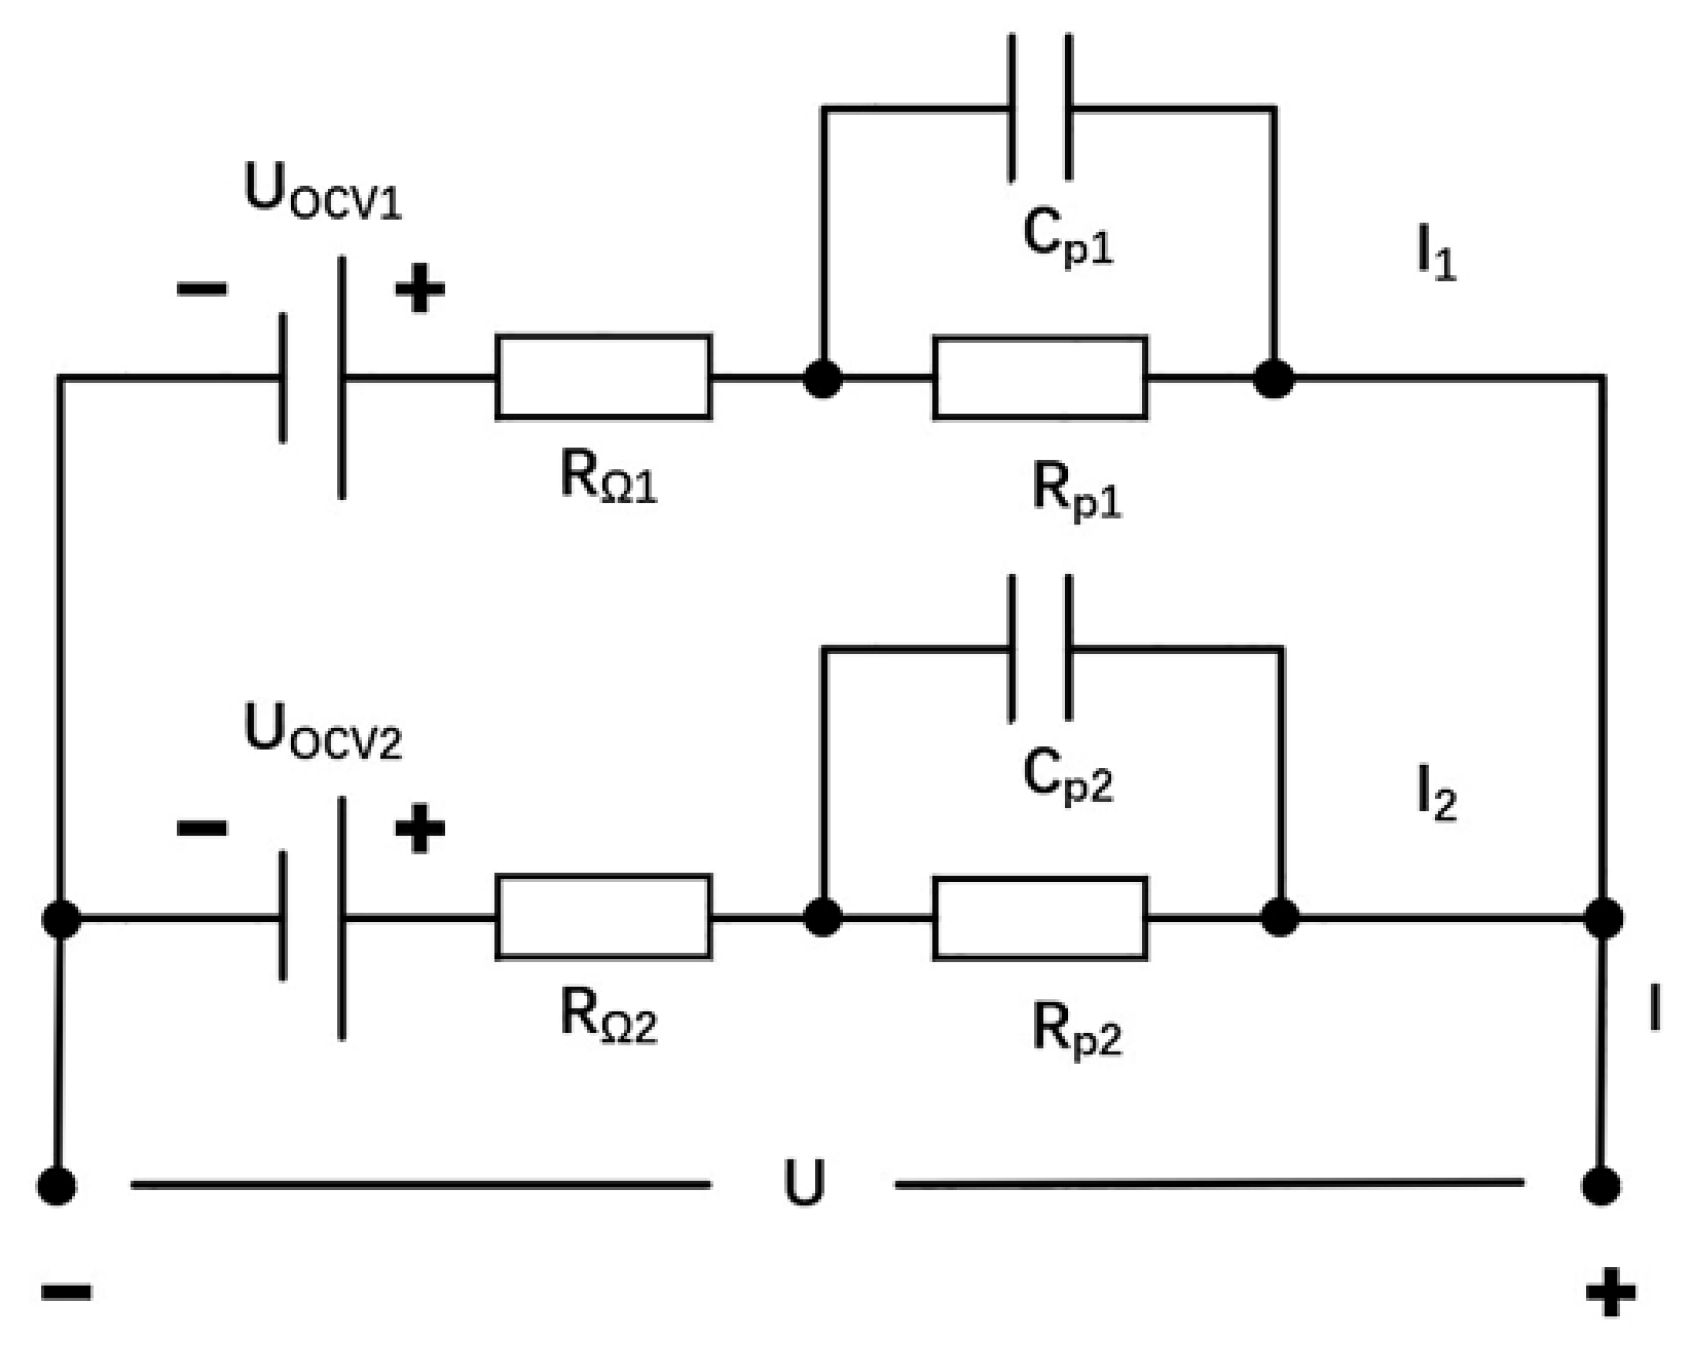
Battery packs with parallel-connected lithium-ion battery cells are modeled for simulation. The equivalent circuit model is created by two parallel-connected cells as shown in Figure 5.
Where I is the main current, I1 and I2 are the branch currents, and k is the serial number of the parallel-connected cell, which can be obtained by Kirchhoff’s current law:
In the same way, the k × k matrix expression is obtained after sorting out the branch current calculation equation:
where there are and a total of 2k unknowns in the parallel-connected battery model, Equation (15) has k equations, and Equation (16) polarization voltage state differential equation has k equations, which can be solved immediately.
where Upk is the polarization voltage at the k-th time step, Upk−1 is the polarization voltage at the previous time step, Ik is the current at the k-th time step, Rpk and Cpk are the polarization resistance and capacitance at the k-th time step, respectively, and Δt is the time interval between two consecutive time steps.
3. Connection Structure on the Battery Pack Performance Impact Study
Single-cell batteries usually need to be paralleled into a battery pack to expand their capacity for use, and the factors affecting the performance of the battery pack in the process of paralleling into a battery pack are not only the differences in the parameters of single cells but also the connection structure between single cells. Different connection structures of the battery pack pole to every single cell of different resistance values of the connecting piece, which affects the branch circuit current distribution, which in turn leads to the small resistance value of the connecting piece of the single cell overcharging and over-discharging and accelerated aging, reducing the consistency of the single cell parameters within the battery pack, resulting in a decline in the performance of the battery pack. This section uses the model to study the impact of the battery connection structure on the performance of the parallel battery pack, discusses two methods to improve the consistency of the battery pack, and experimentally verifies the improved connection structure on the battery pack performance.
3.1. Simulation Analysis of Conventional Connection Structure of Battery Packs
3.1.1. Battery Pack Model Considering Connection Structure
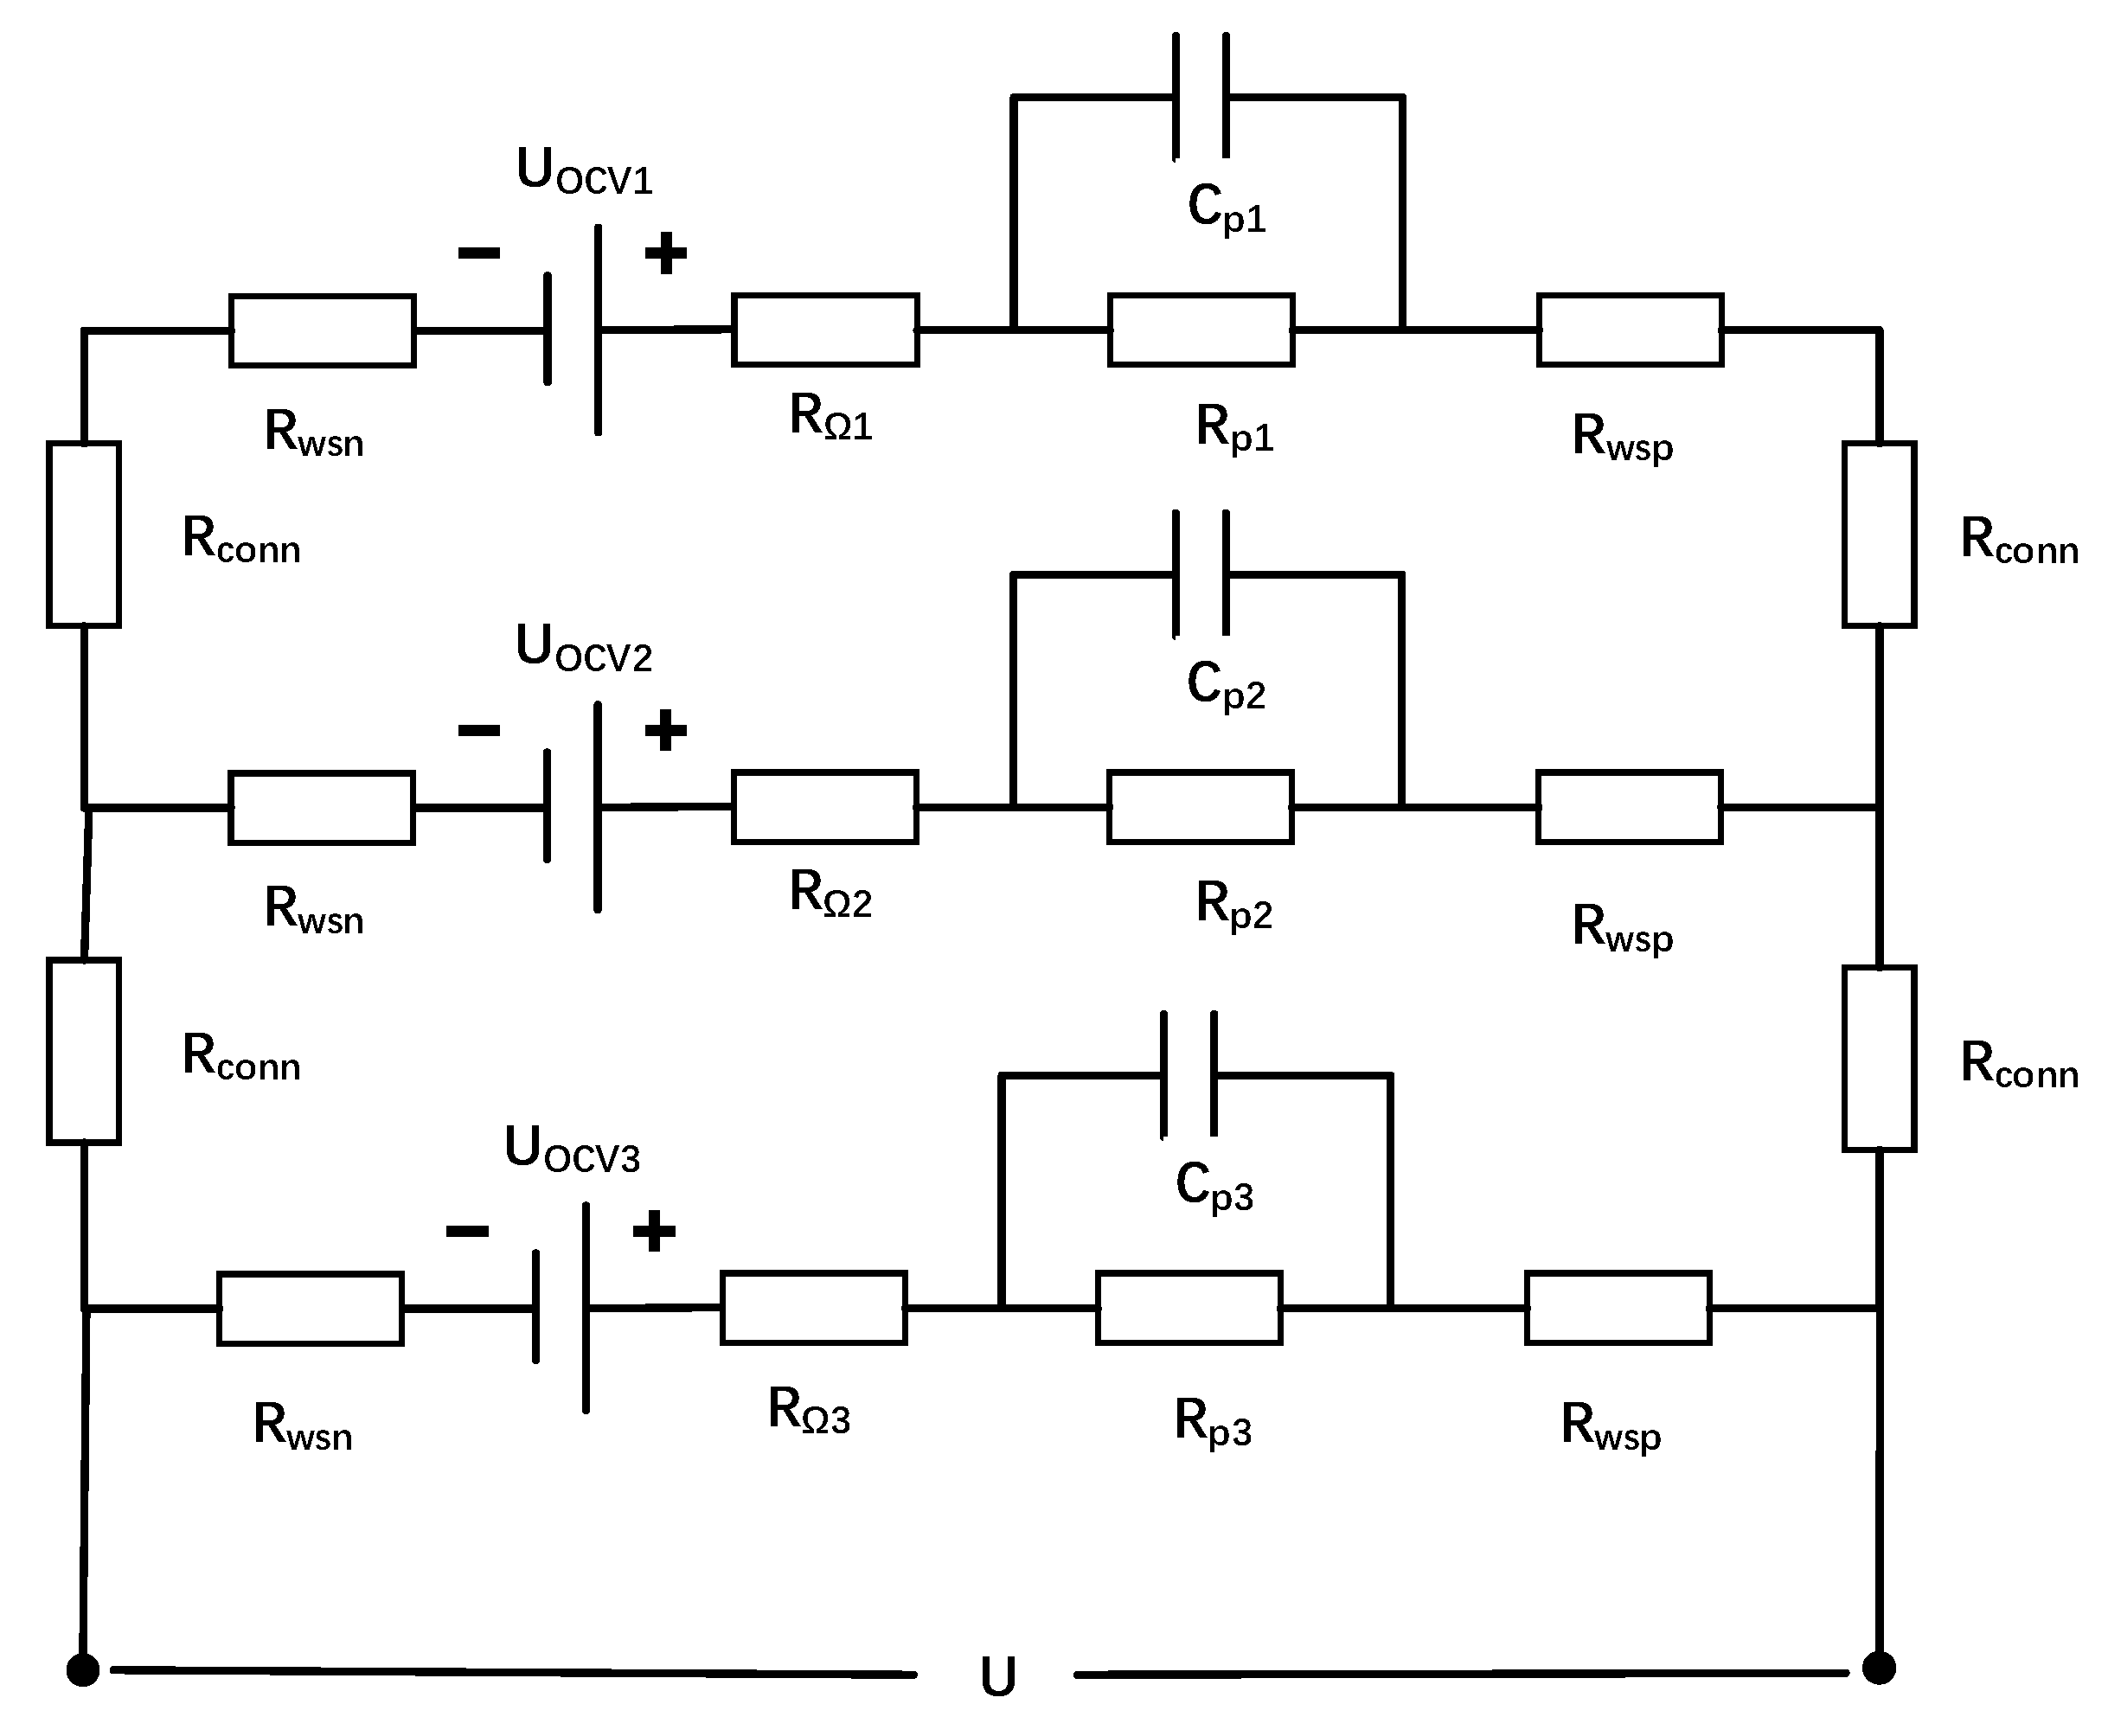
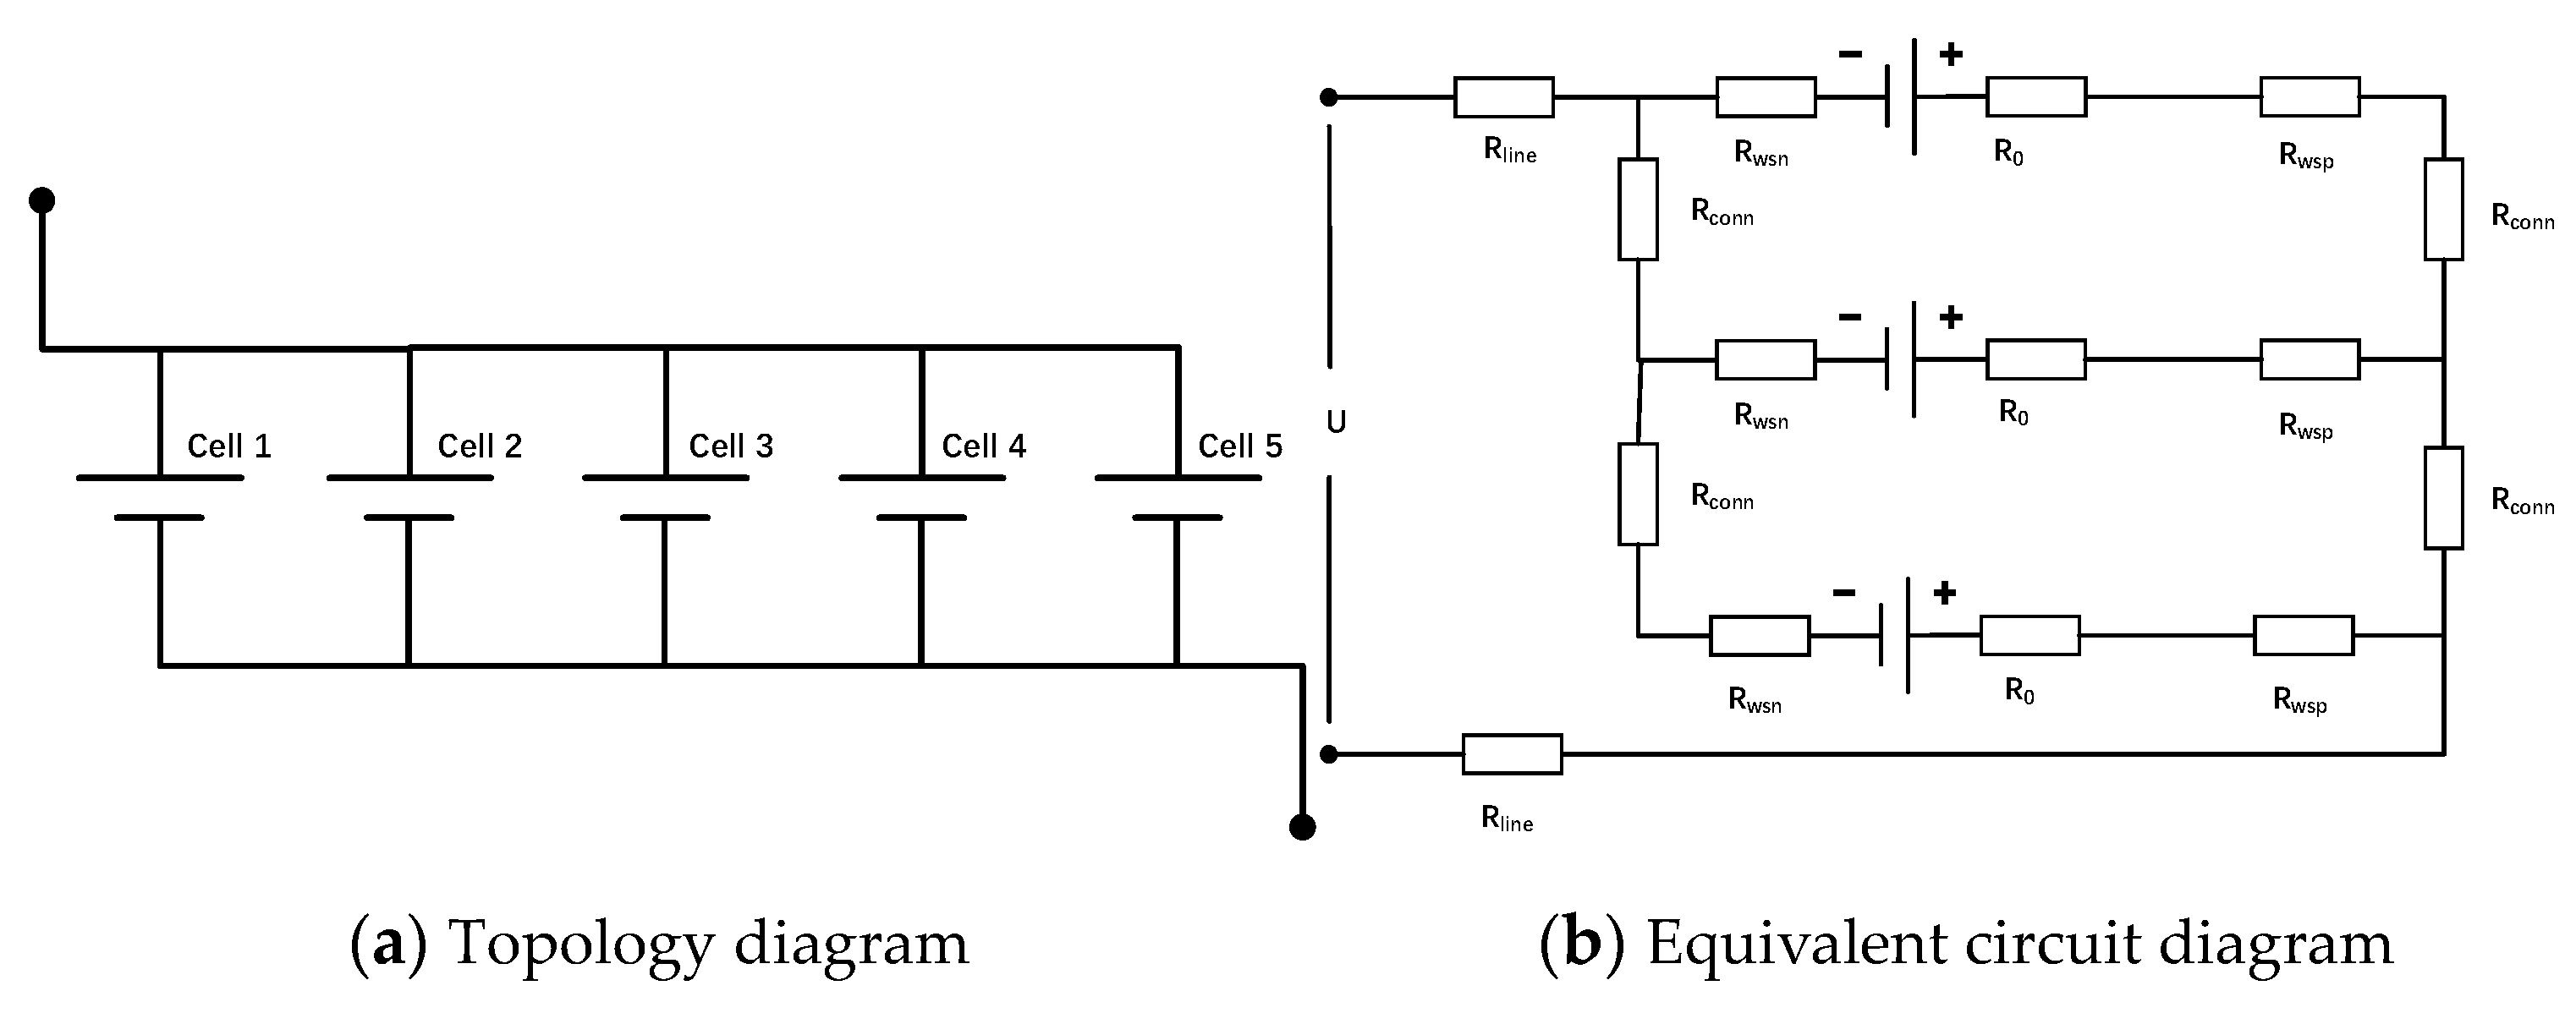
The topology of three single cells connected in parallel is shown in Figure 6, and the positive tab weld resistance Rwsp, the negative tab weld resistance Rwsn, and the connection tab resistance Rconn are added to the original parallel battery pack model.
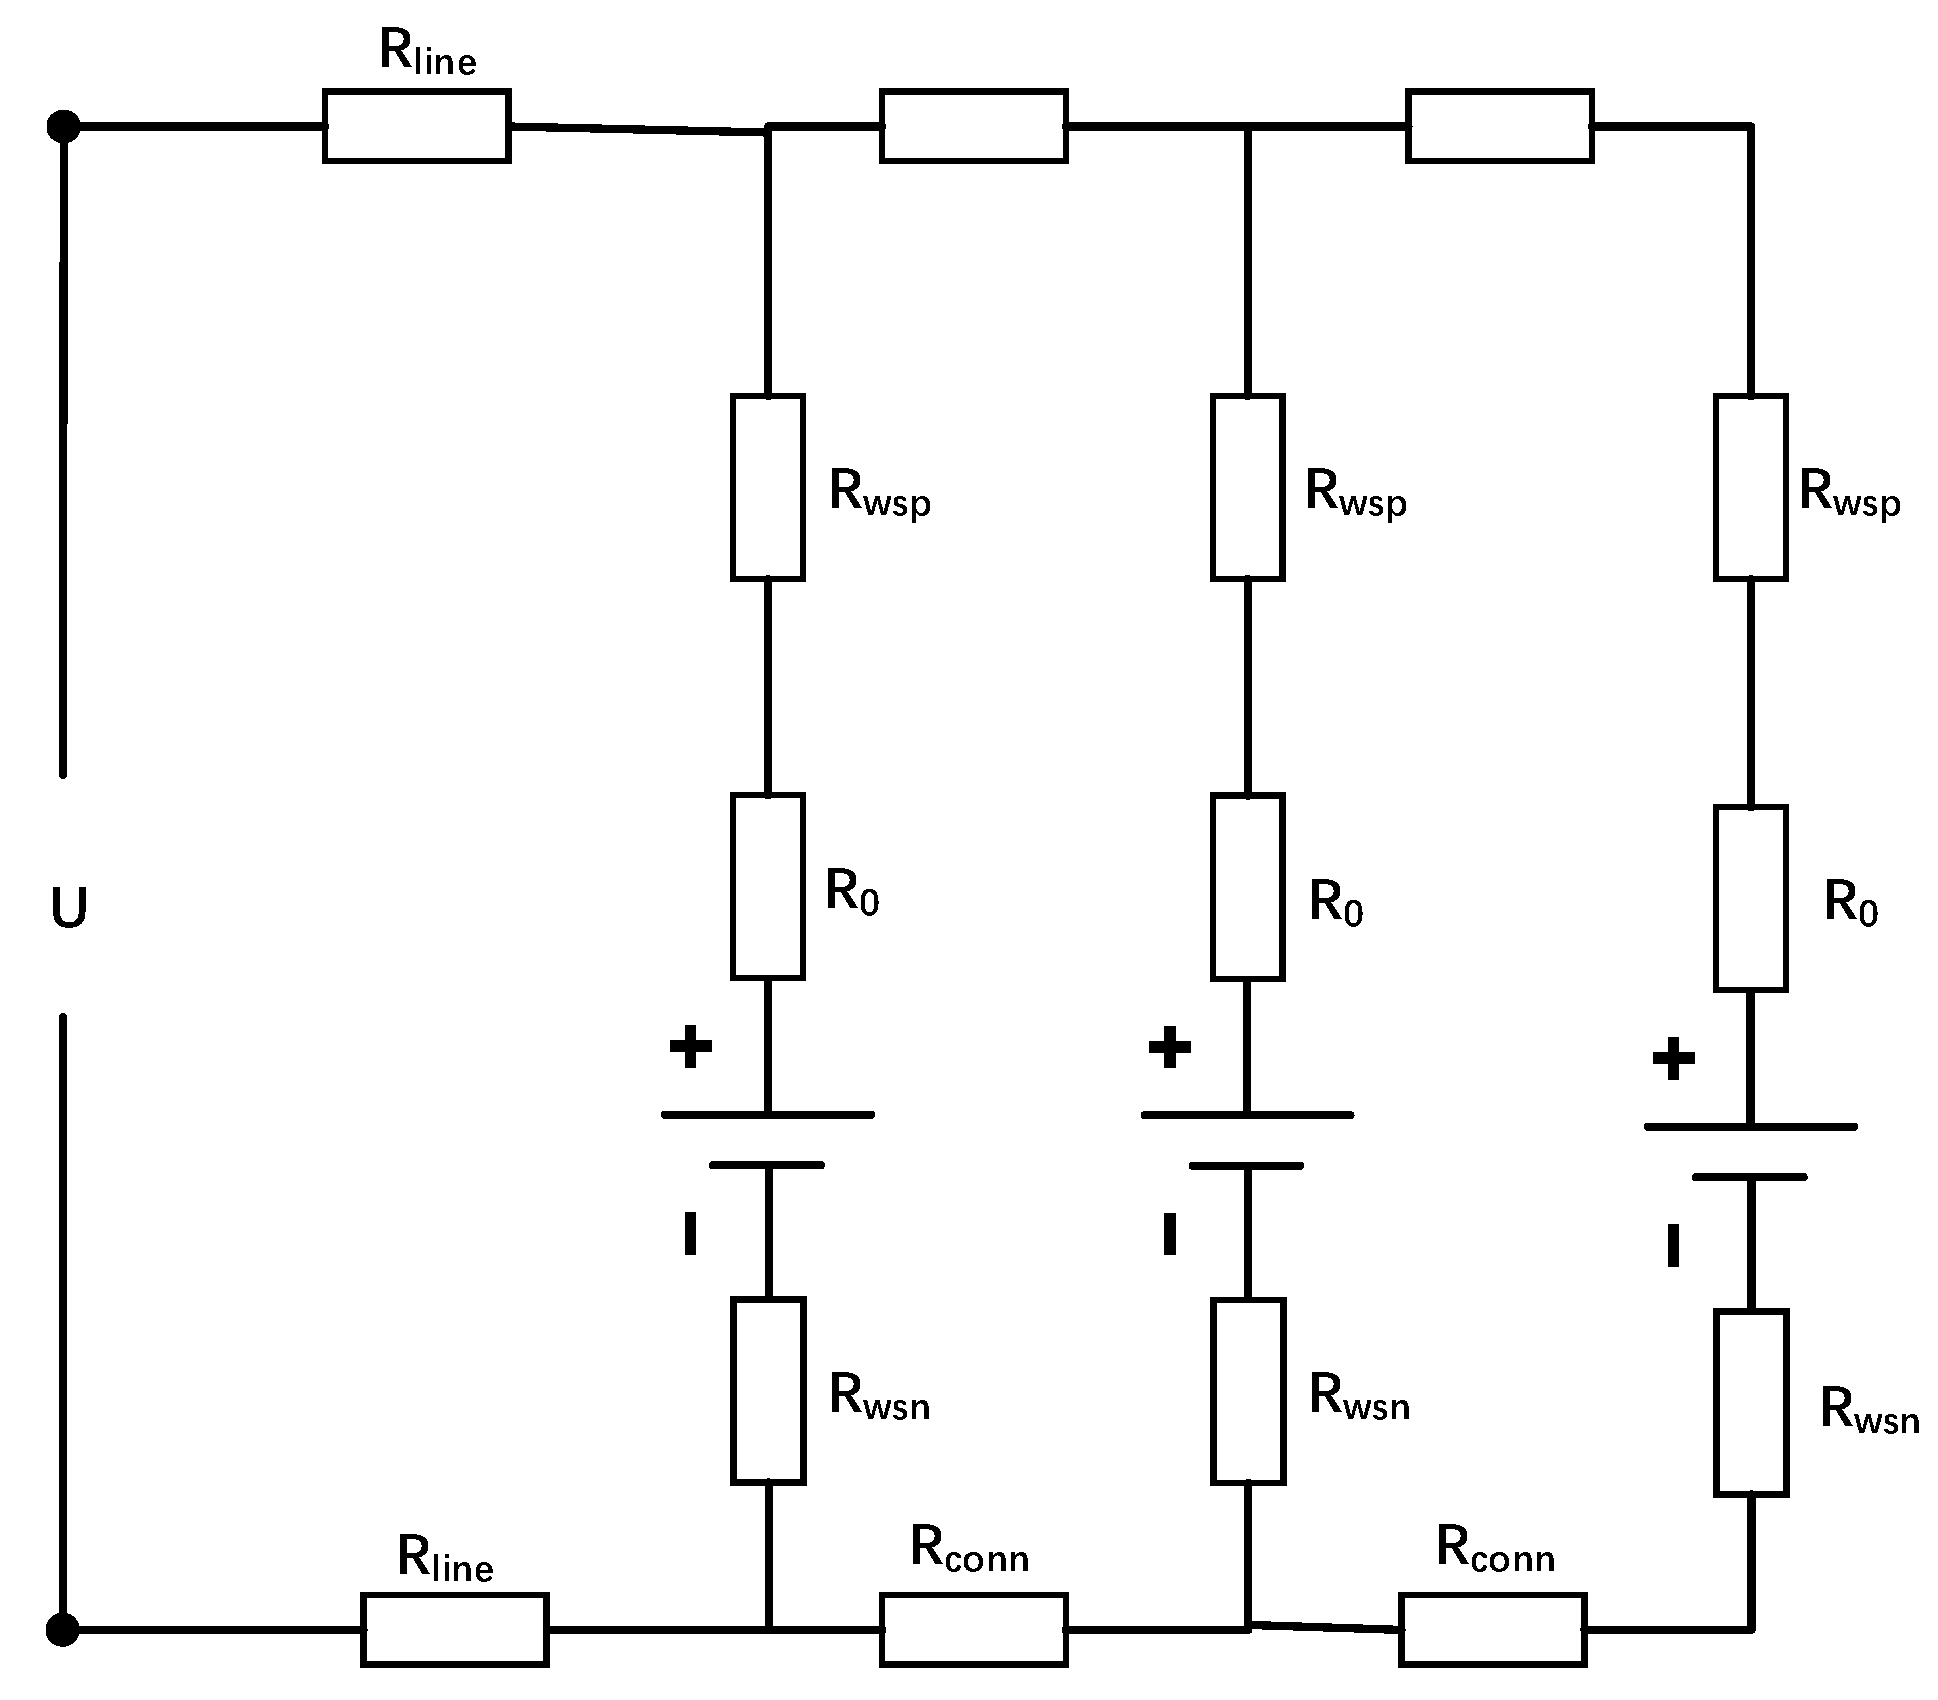
A commonly used parallel battery pack connection is connected to a battery monomer. Different connection methods have a certain impact on the consistency of the battery. Different connection methods lead to each single cell being connected to the total connecting piece of different resistance values, for the convenience of expression, set the ith single cell internal resistance for R0 and connecting line resistance for Rline. The actual simulation is still by the first-order RC model calculation. Then, the single-side connection circuit diagram of three single batteries connected in parallel is shown in Figure 7.
Then the current through the left single cell is
The current through the intermediate cell is
The current through the right battery is
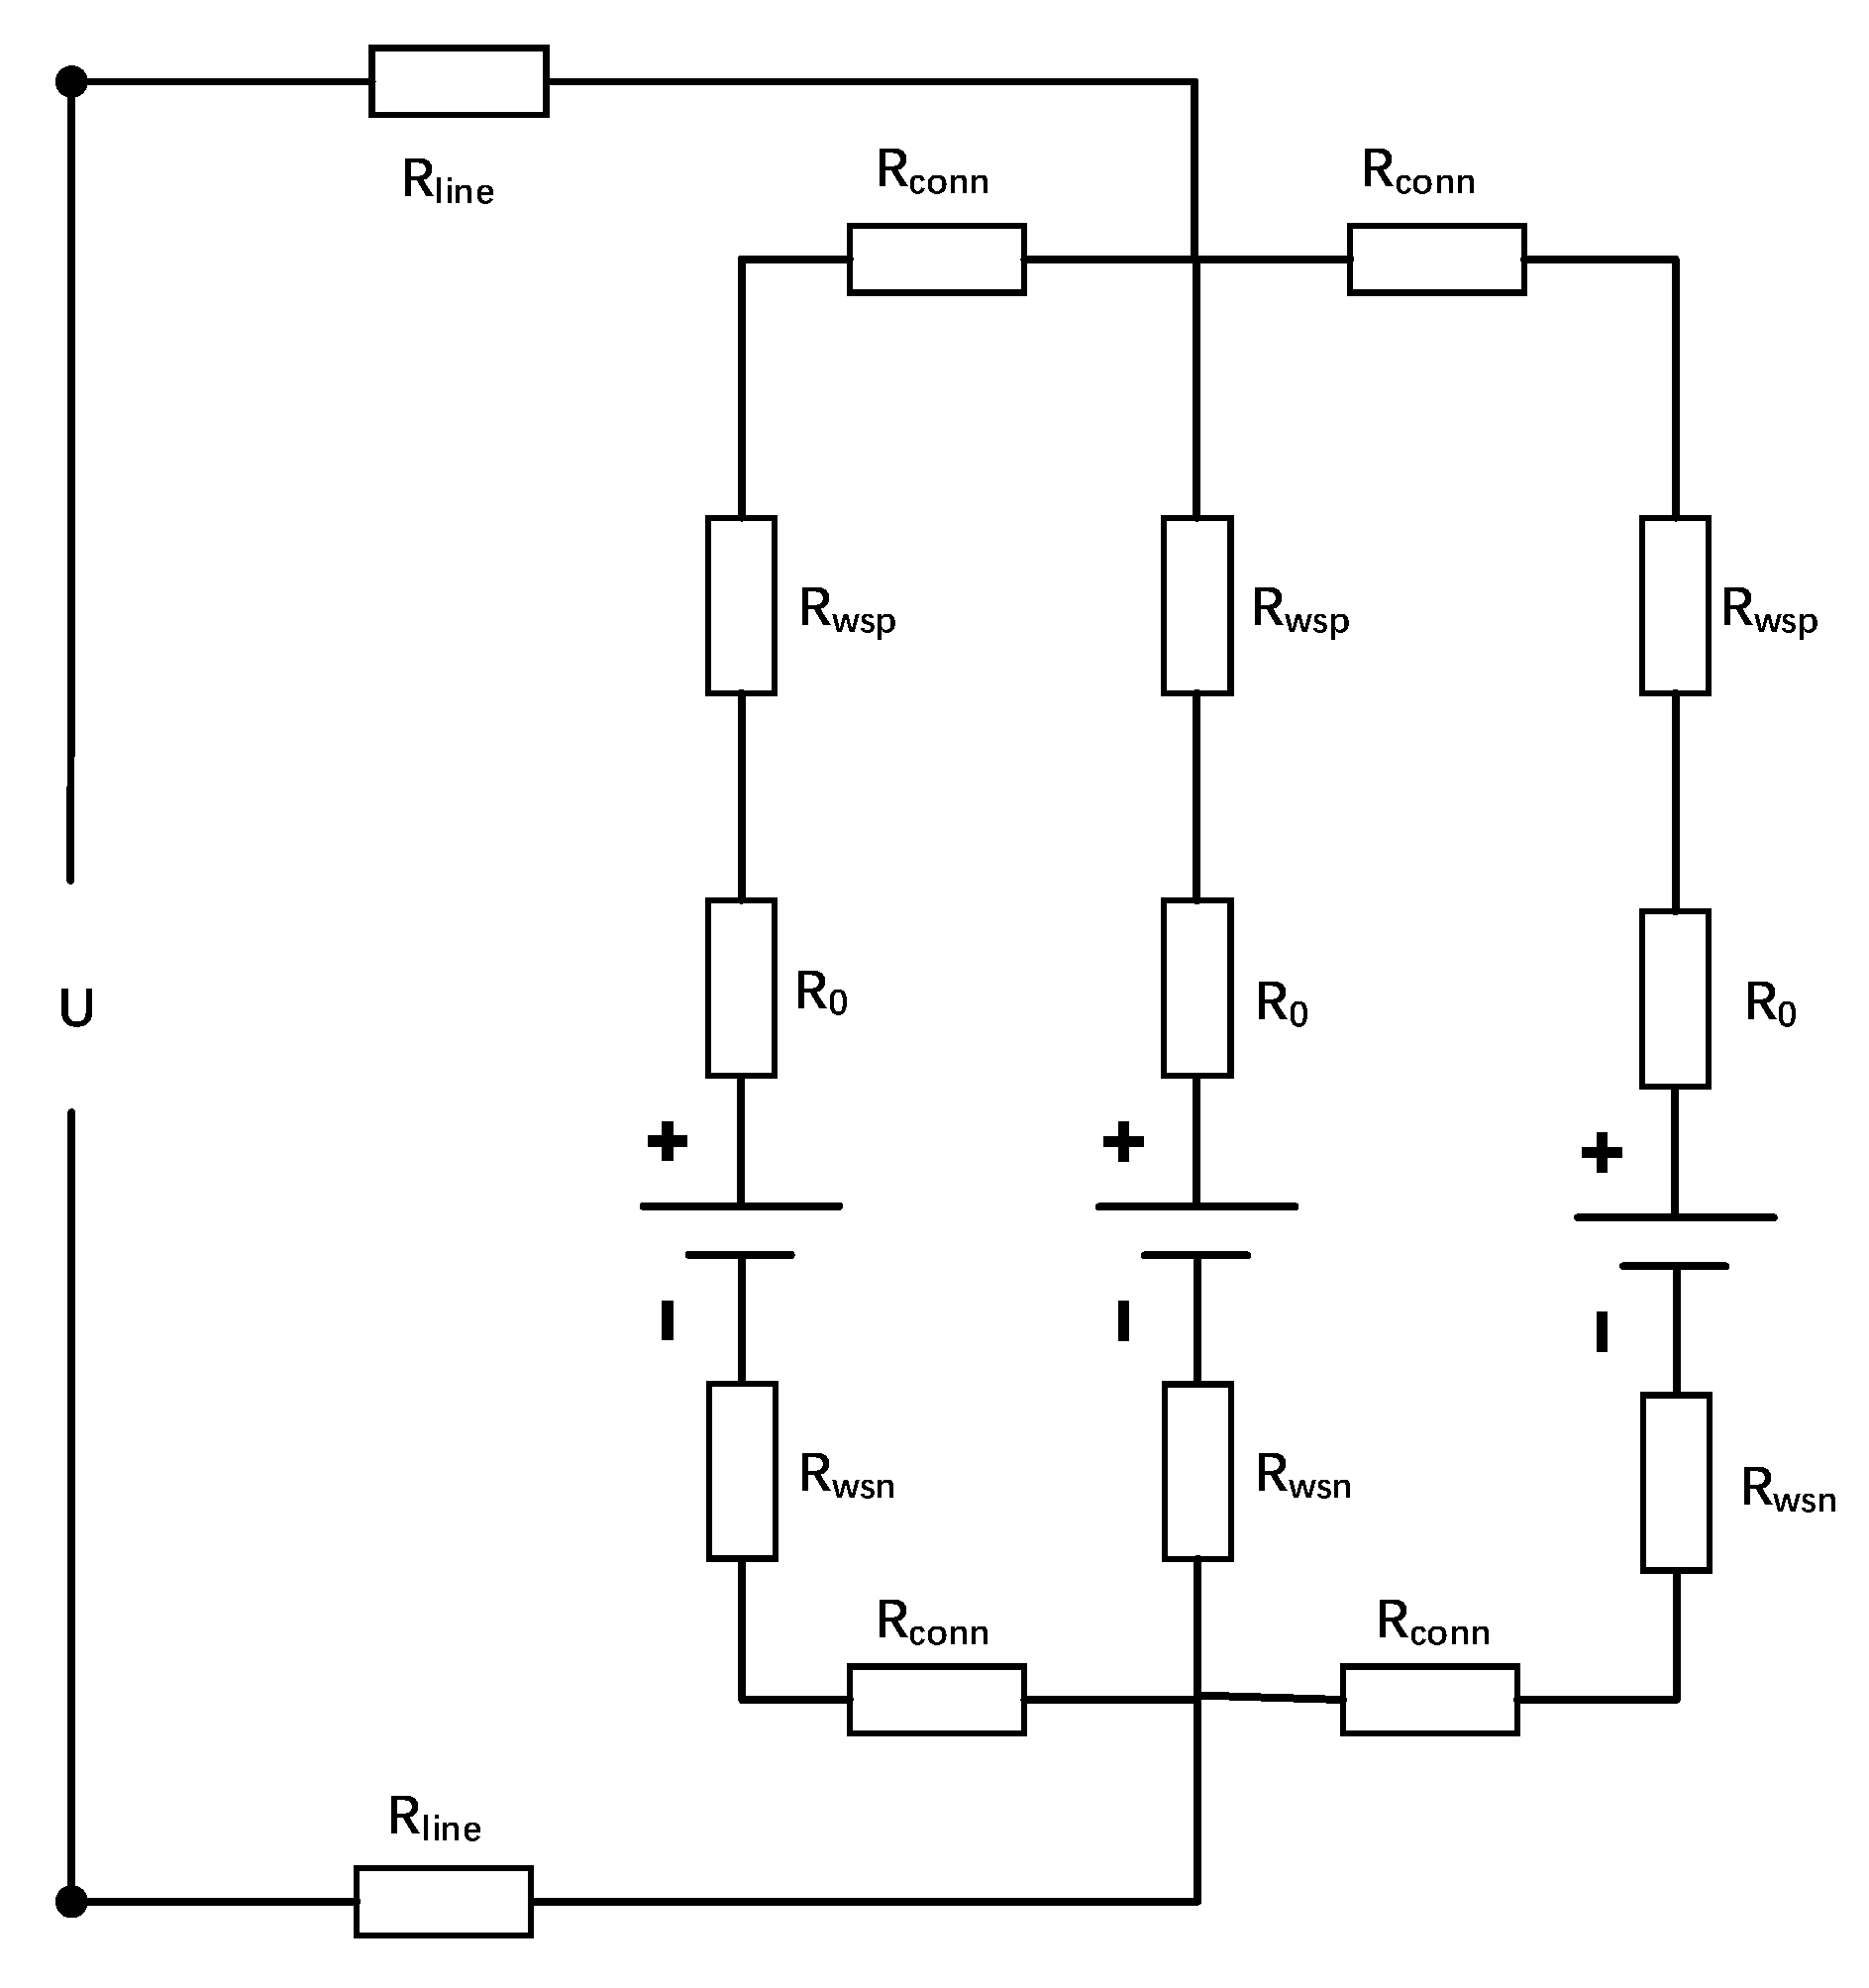
That is, the left monomer resistance is the smallest, the current passes through the largest, to the right, away from the battery pack pole column, and the current decreases in turn. And the center connection structure is shown in Figure 8.
Then, the current through the left single cell is
The current through the intermediate cell is
The current through the right cell is
That is, the middle monomer has the smallest resistance and passes the largest current, and the current decreases sequentially towards the sides, away from the battery pack poles.
As can be seen in the above conventional connection structure of the current distribution law, the largest single battery in the current is used for the direct connection to the battery pack pole post and the single battery and the battery pack pole distance are inversely proportional to the relationship between the two. This phenomenon is caused by the battery pole post and the length of the single battery connecting piece being different, so each single battery connecting piece of resistance value is different. Now regarding electric vehicle power batteries, in pursuit of longer range, most of them use higher energy density ternary lithium-ion batteries. Ternary lithium-ion batteries, due to process problems, can only be made into 18,650 and other small-capacity packages. In order to meet the high-capacity demand for power batteries, dozens or hundreds of single-units are needed in parallel together, such as Tesla’s Model S, which uses 74 single-unit batteries connected in parallel. Common materials for battery connectors include nickel-plated steel strips, pure nickel strips, and nickel-plated copper strips, with nickel-plated steel strips being the most widely used because of their low cost and easy welding. The current more cutting-edge form of the connection piece is the use of copper and aluminum, two metals welded together, with direct contact with the positive and negative electrodes for the copper, an aluminum sheet covered with protrusions on the aluminum sheet as a voltage, and temperature sampling points. Schmidt et al. [34] measured the contact resistance of an aluminum–aluminum connection on a single connection piece with an area of 15.71 mm2 RAl-AI = 250 μΩ, and the contact resistance of Rwsp and Rwsn was set to 250 μΩ. Assuming that the connecting tab resistance Rconn is 200 μΩ, with 74 single cells connected in parallel using a one-sided connection, the resistance of the connecting tab farthest away from the pole post of a single cell is higher than that of the single cell closest to the pole post by 29.6 mΩ, whereas the internal resistance of a single cell is less than 20 mΩ, and that of the high-power discharge type is even lower than 1 mΩ, which can be seen in the traditional connection structure. This shows that the current imbalance brought by the traditional connection structure is quite considerable. On the one hand, the current imbalance accelerates the increase of SOC deviation between single cells, the consistency of the battery pack continues to deteriorate, and the performance of the battery pack decreases; on the other hand, the current imbalance leads to a larger current through the single cell, meaning it is easy to overcharge and overflow, accelerating the aging of the battery, which leads to the shortening of the life of the battery pack.
3.1.2. Conventional Connection Structure Simulation Analysis
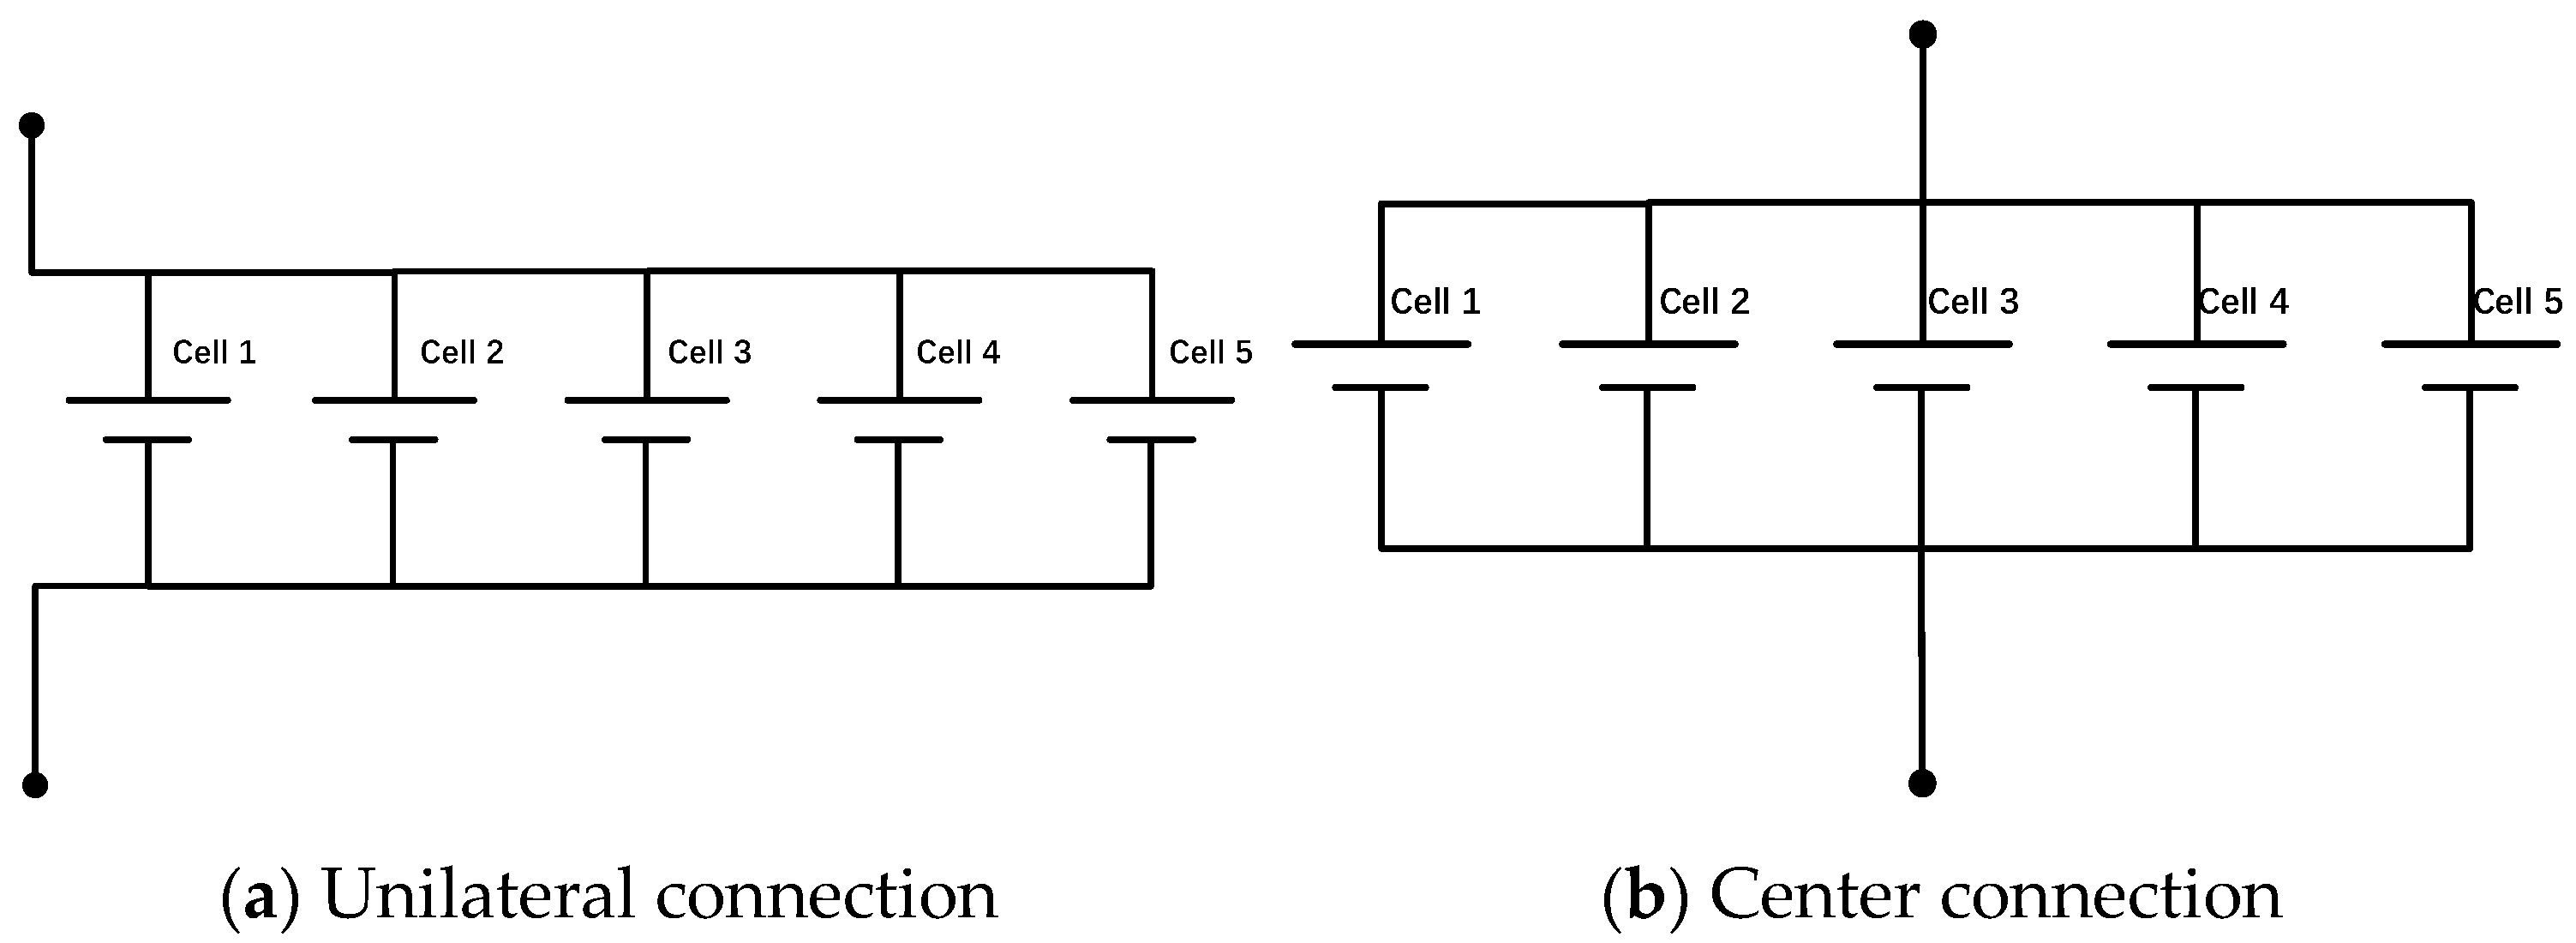
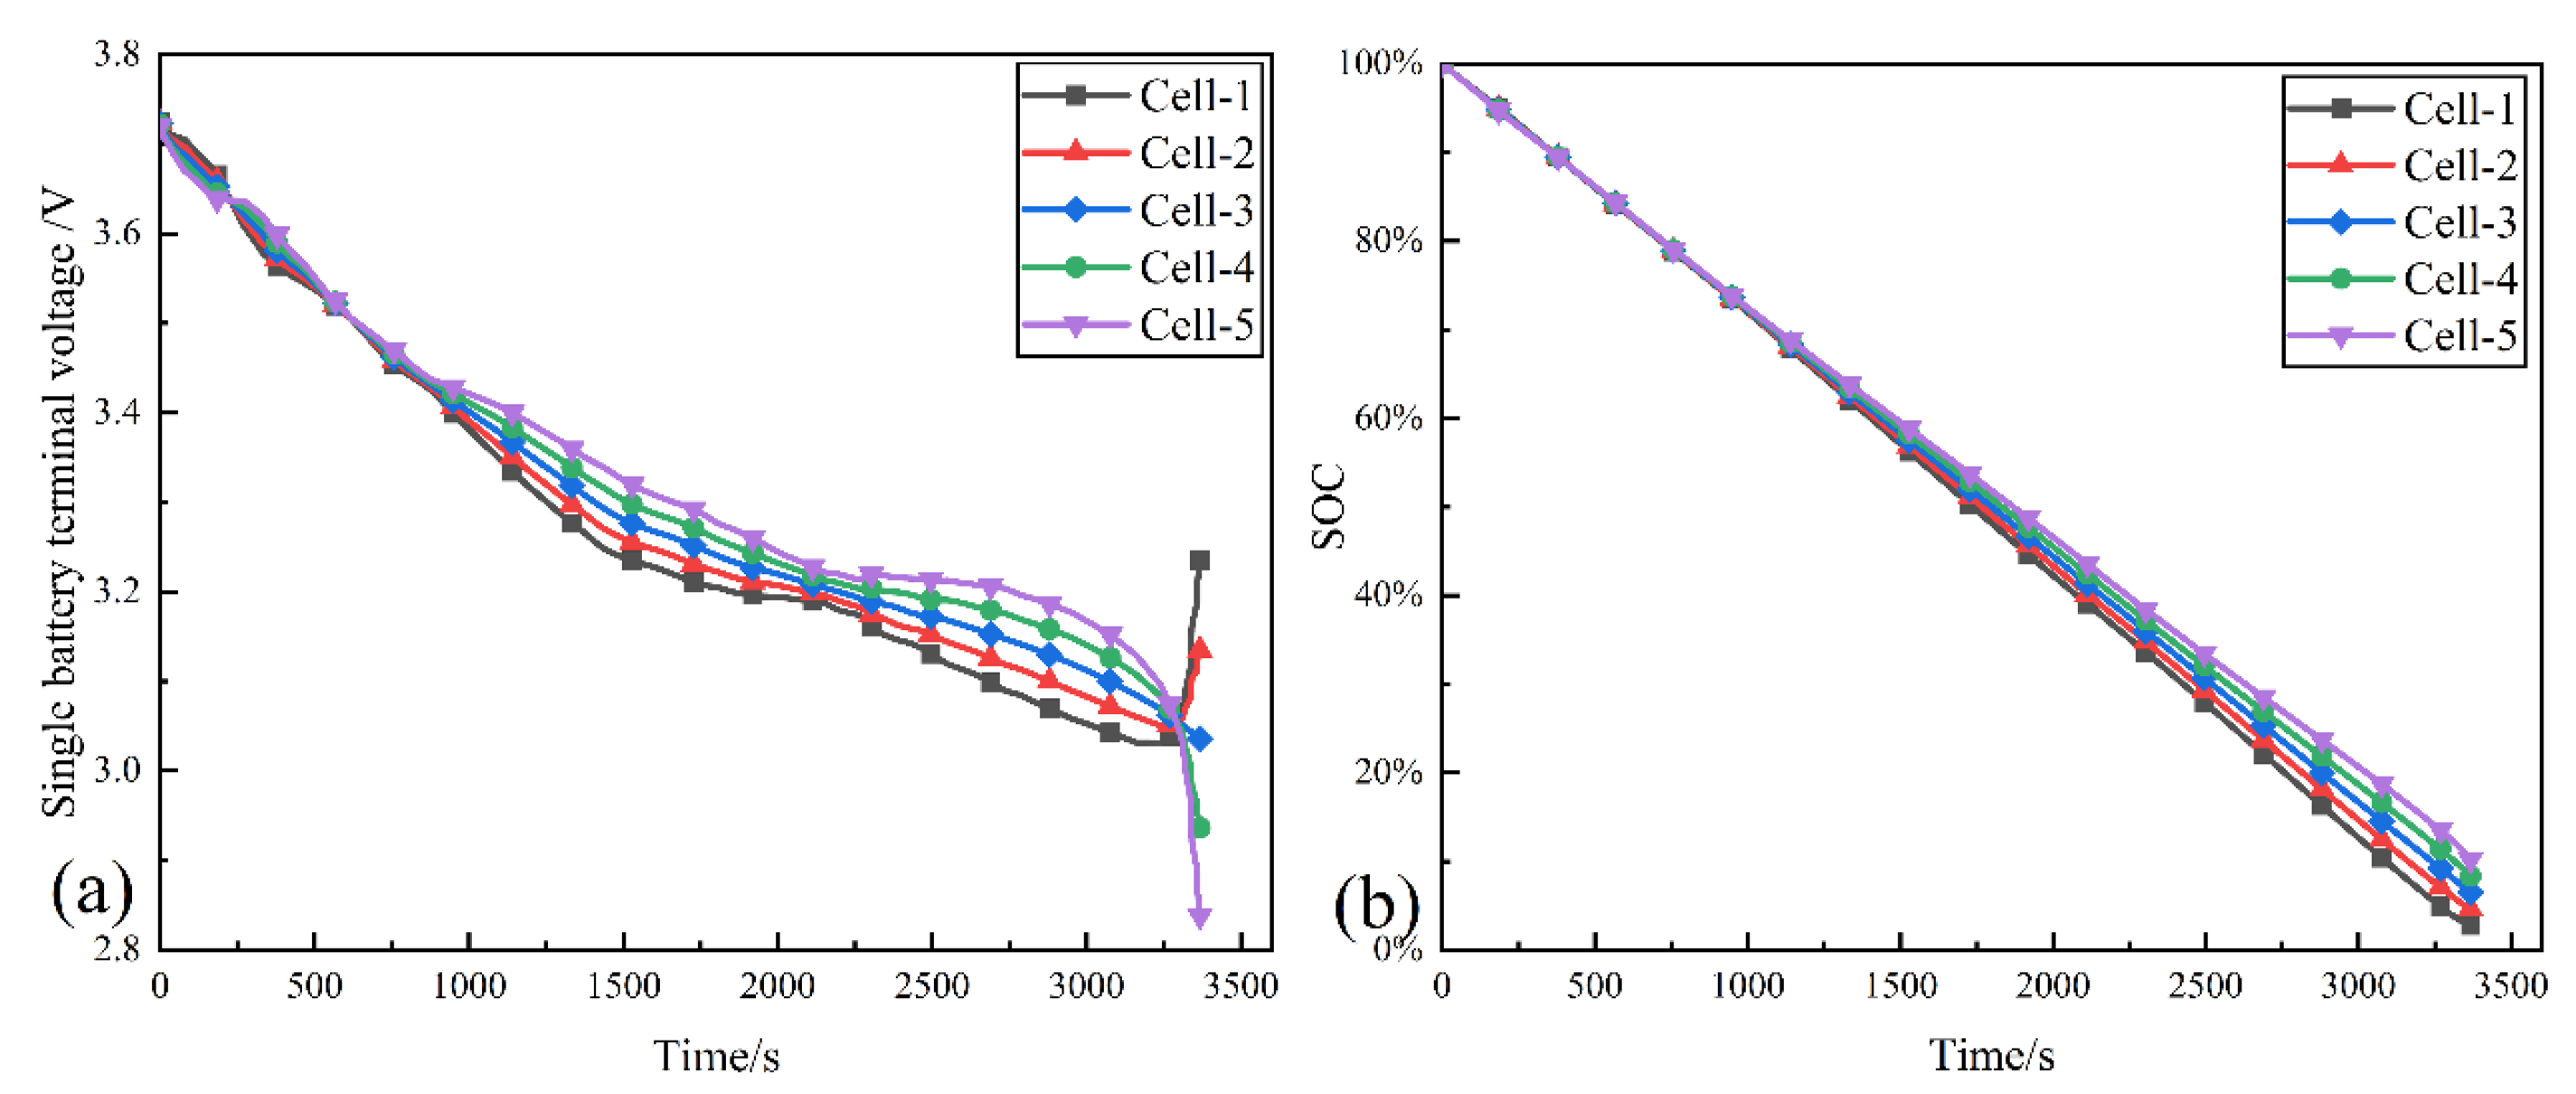
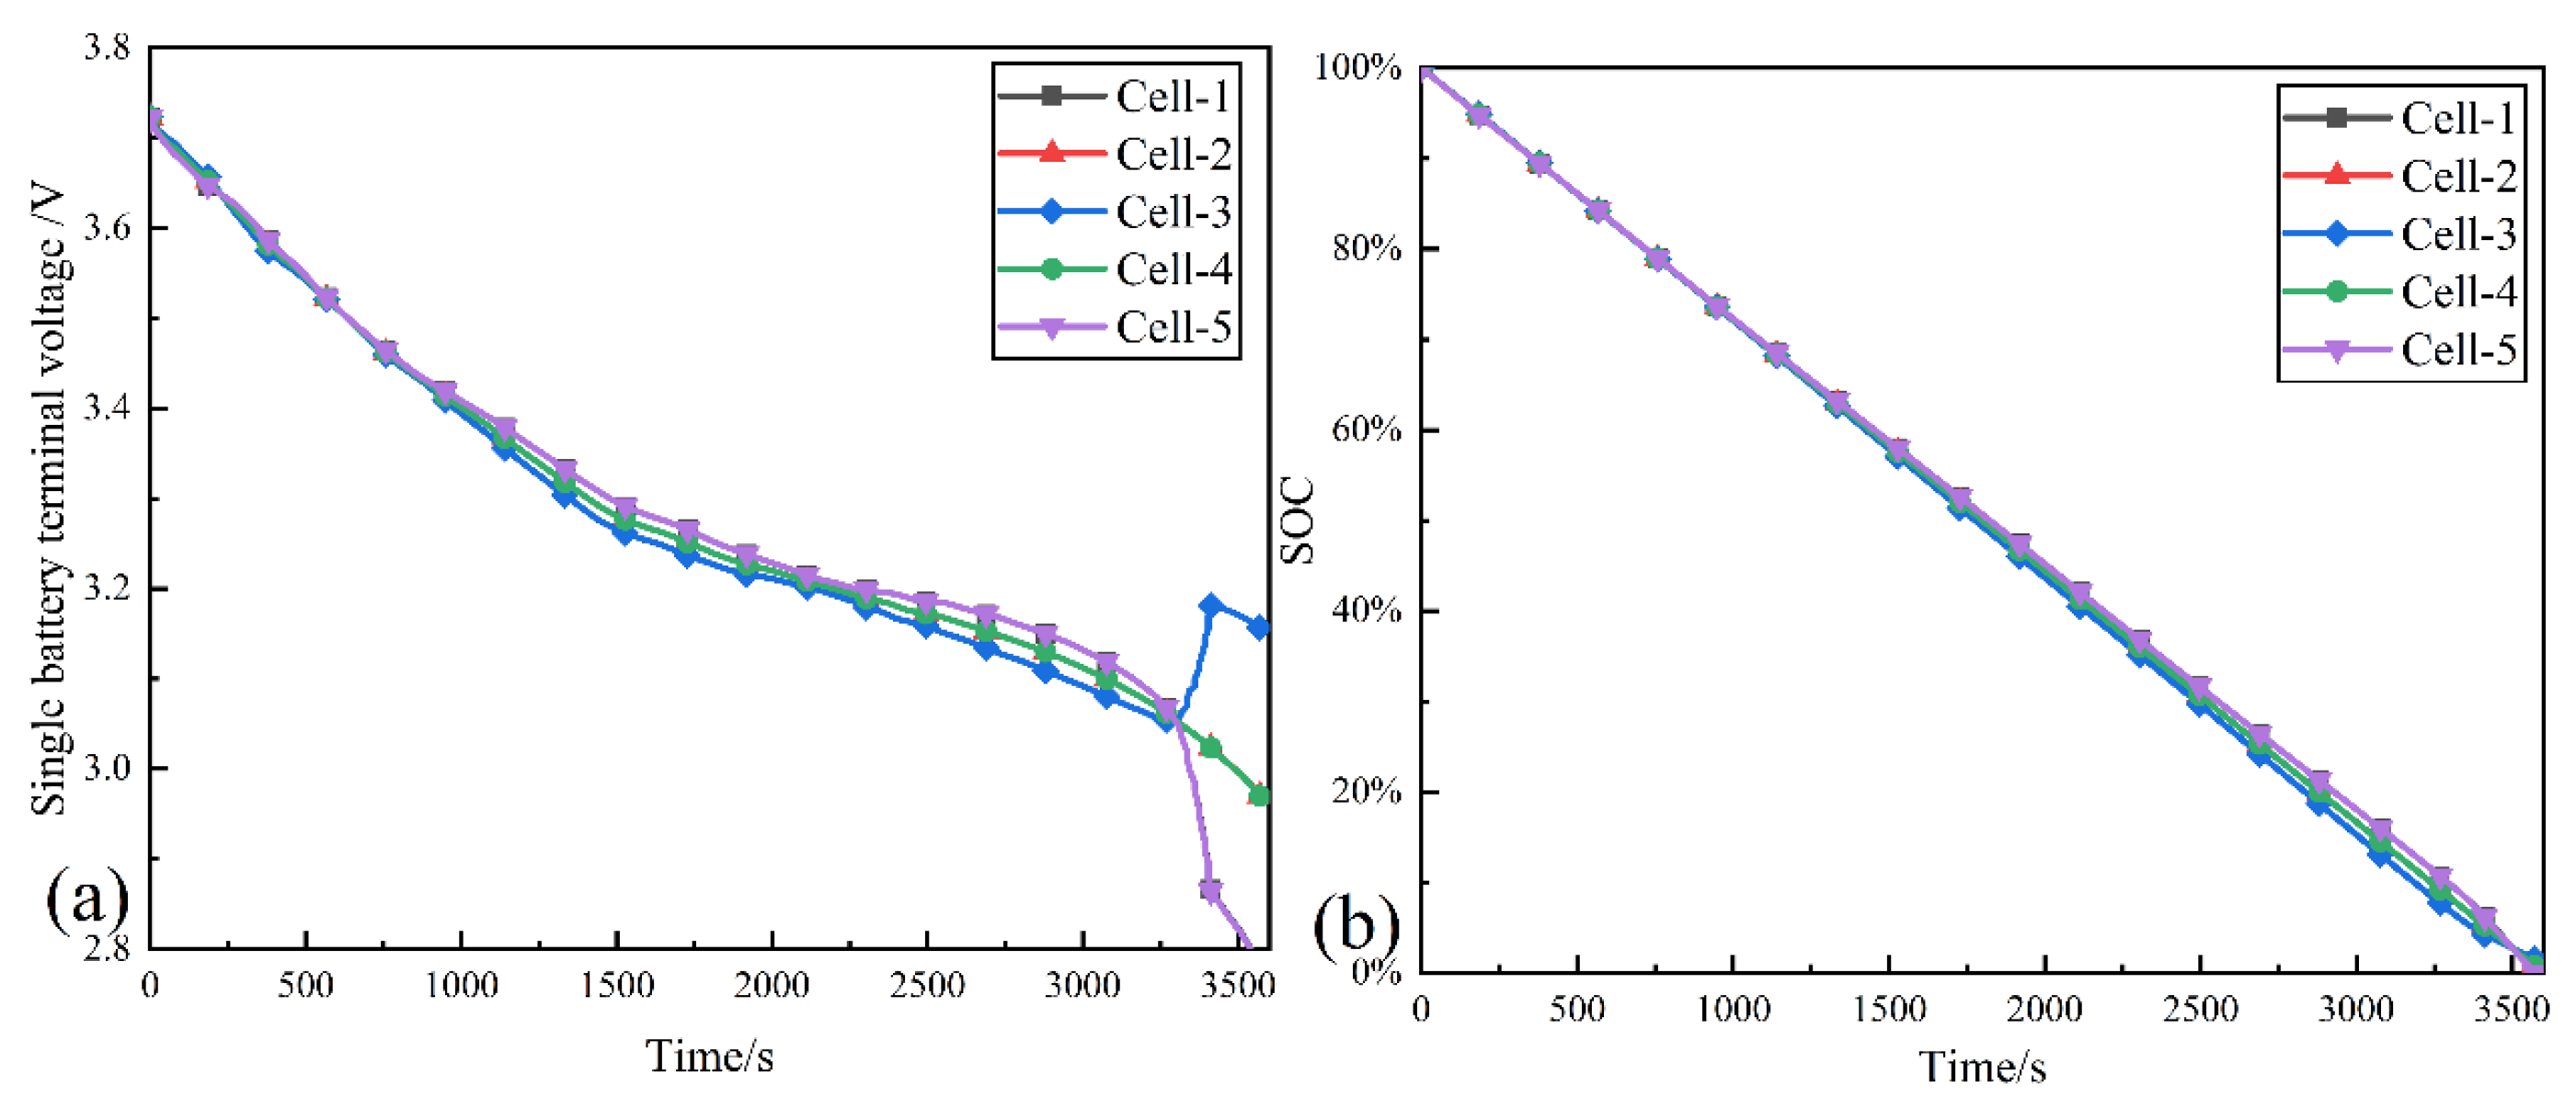
Considering that the battery model of the connection structure is increased by ohmic resistance compared with the developed model, and the connection structure is a fixed value after it is determined, the ohmic internal resistance is modified on the first-order RC battery model, and the ohmic internal resistance of each single unit is adjusted according to the connection structure. Using the battery simulation model with five single batteries connected in parallel, the effect of the two connection structures on the terminal voltage of the parallel battery pack and the SOC of the single batteries during the constant current discharge process is simulated and analyzed, and the battery numbers are shown in Figure 9, and the simulation results are shown in Figure 10 and Figure 11.
Comparing Figure 10a and Figure 11a, it can be seen that before the end of the discharge period, the farther away the current is from the battery pole post, the higher the terminal voltage of the single cell. The reason is that the farther away from the battery pole post, the higher the resistance of the connecting tabs, and the initial SOC is the same when the OCV is the same, the parallel voltage is the same, and the voltage drop caused by the resistance of the connecting tabs of each single cell in conjunction with the ohmic internal resistance is the same, and the higher the value of connecting tabs’ resistance is, the smaller the current is. At the end of discharge, combined with Figure 10b and Figure 11b, it can be seen that the circuit fluctuates because the SOC of the single cell close to the pole columns is the first to drop to a very low level, and the low SOC ohmic internal resistance and the polarization internal resistance increase sharply, and the current decreases.
A comparison of the two connection structures’ end voltage changes shows that the center connection structure has a smaller voltage difference than the single-side connection structure, with a smaller sudden change at the end, a more stable power performance, and a less severe degree of battery overcurrent and over-discharge. Table 5 shows the SOC value of each single cell at the end of the discharge of single cells with different connection structures. From the data in the table, it can be seen that the SOC of the battery group at the end of discharge of the center-connected structure is 0.6%, the SOC of the battery group at the end of discharge of the unilateral-connected structure is 6.1%, and the center-connected structure has a higher energy utilization rate. The maximum difference in SOC between single cells of the center-connected structure is 1.5%, and the maximum difference in SOC between single cells of the unilateral-connected structure is 8%, which means that the center-connected structure is also significantly better than the unilateral-connected structure in terms of the consistency of the battery pack. It can be seen that the central connection structure with a smaller difference in resistance value of each single cell connecting piece makes better use of the capacity, and the working conditions of each single cell are more stable, with better performance and longer service life. On the other hand, from the point of view of battery management, the battery management system monitors the voltage of the single cell connected to the battery poles, which is the charging and discharging cut-off benchmark, and the energy of the rest of the single cell is not fully utilized, which will reduce the capacity of the battery pack. Therefore, the use of the center connection and other connectors with small resistance differences can reduce the current fluctuation of the single cell at the end of charging and discharging in the parallel battery pack, and at the same time reduce the difference in the SOC between single cells, inhibit overcharge and over-discharge of single cells, and improve the energy efficiency and consistency of the battery pack, thus improving the performance of the battery pack.
3.2. Optimisation Analysis of Battery Pack Connection Structure
From the above discussion, it can be seen that controlling the difference in the resistance value of the connecting tabs of each single cell as well as the size of the resistance value can improve the consistency of the cells, which in turn improves the performance of the battery pack. Given the problems existing in the two conventional connection structures, there are two existing improvement ideas; one is to use a new connection method, such as the diagonal connection method recently proposed by foreign [34], the other idea is to adjust the resistance values of the battery and the connecting piece to achieve resistance matching. In this section, simulation analysis is carried out on these two ideas.
3.2.1. Simulation Analysis of Diagonal Connection Structure
The topology and equivalent connection circuit diagram of the diagonal connection are shown in Figure 12.
Then, the current through the left single cell is
The current through the intermediate cell is
The current through the right cell is
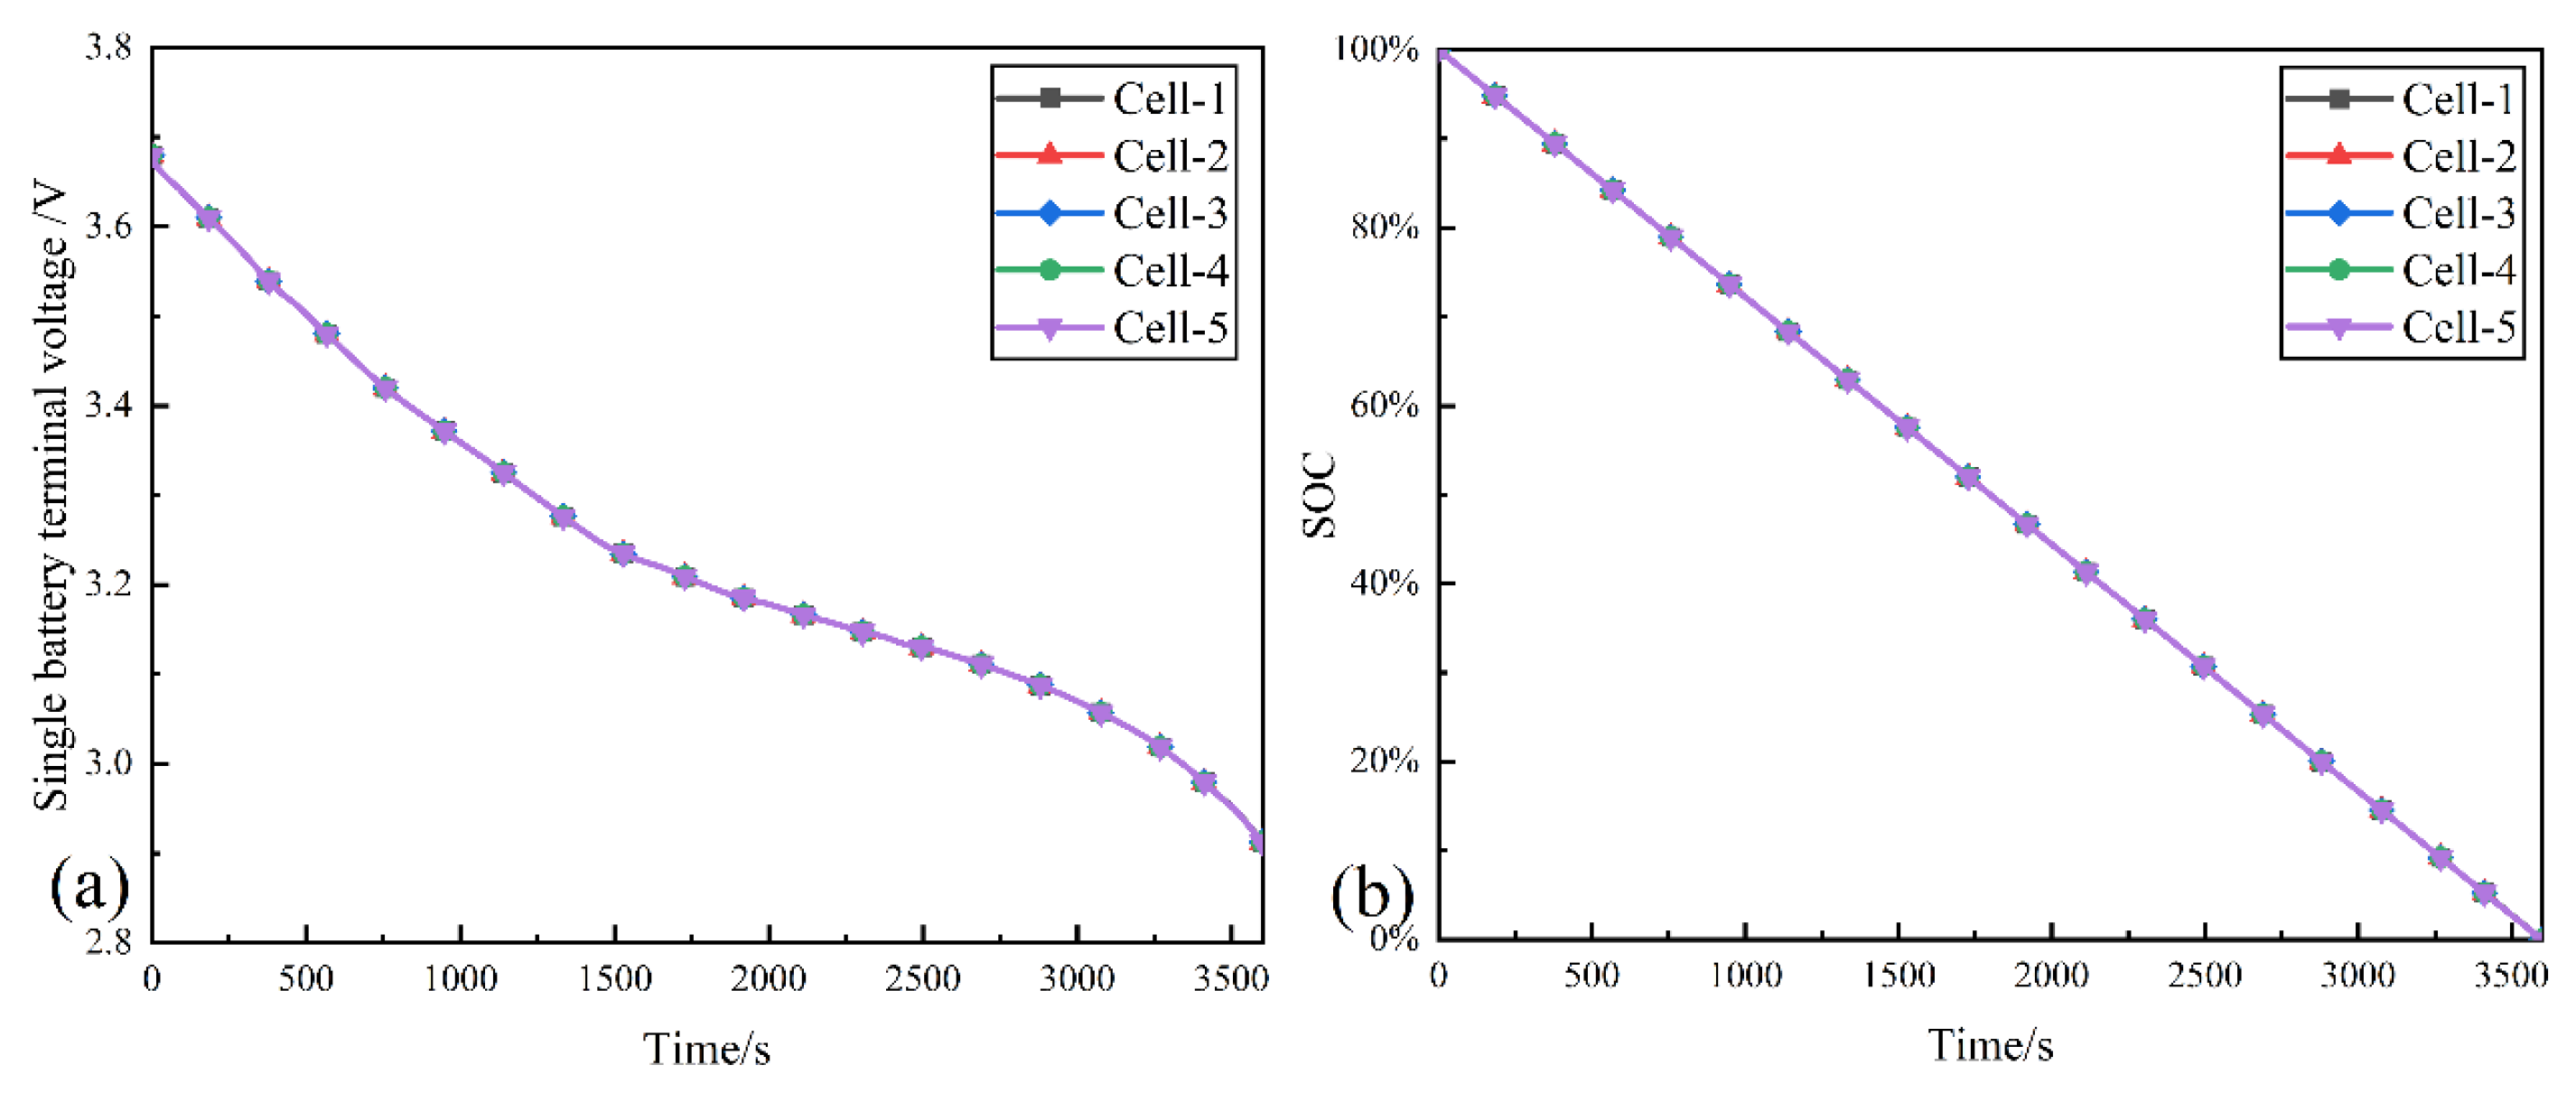
That is, the current through each single cell is equal because the sum of the lengths of the connecting tabs connecting the positive and negative cells of each single cell is the same. This connection structure has been mentioned by several foreign scholars, but it has not been experimentally verified, and there is still no relevant research published in China. Figure 13 shows the relevant simulation results of this connection structure.
It can be seen that this connection structure can be a better solution to the problem of the uneven resistance value of the single-cell connecting piece, but it brings a new problem in that a large number of single cells are connected with a large value of connection resistance. Taking Tesla’s Model S as an example, the resistance value of each single cell connecting piece when 74 single cells are connected in parallel is as high as 29.6 mΩ, and the voltage drop can reach several tens of mV, which has a large impact on the discharge performance of the battery, and at the same time, the thermal effect of resistance brought about by the higher resistance value will also result in the shortening of the battery life, so the connection structure of the battery still needs to continue to be improved.
3.2.2. Simulation Analysis of Resistance Matching of Connecting Tabs
Although the diagonal connection structure can effectively reduce the difference in the resistance value of the battery connecting tabs, the engineering application involves the design of the production line, process stability, and other issues, so the latest connection structure may not be able to be put into use in time, but even if the connection structure is fixed, we can also consider improving the consistency of the battery pack by limiting the value of the connecting tabs resistance.
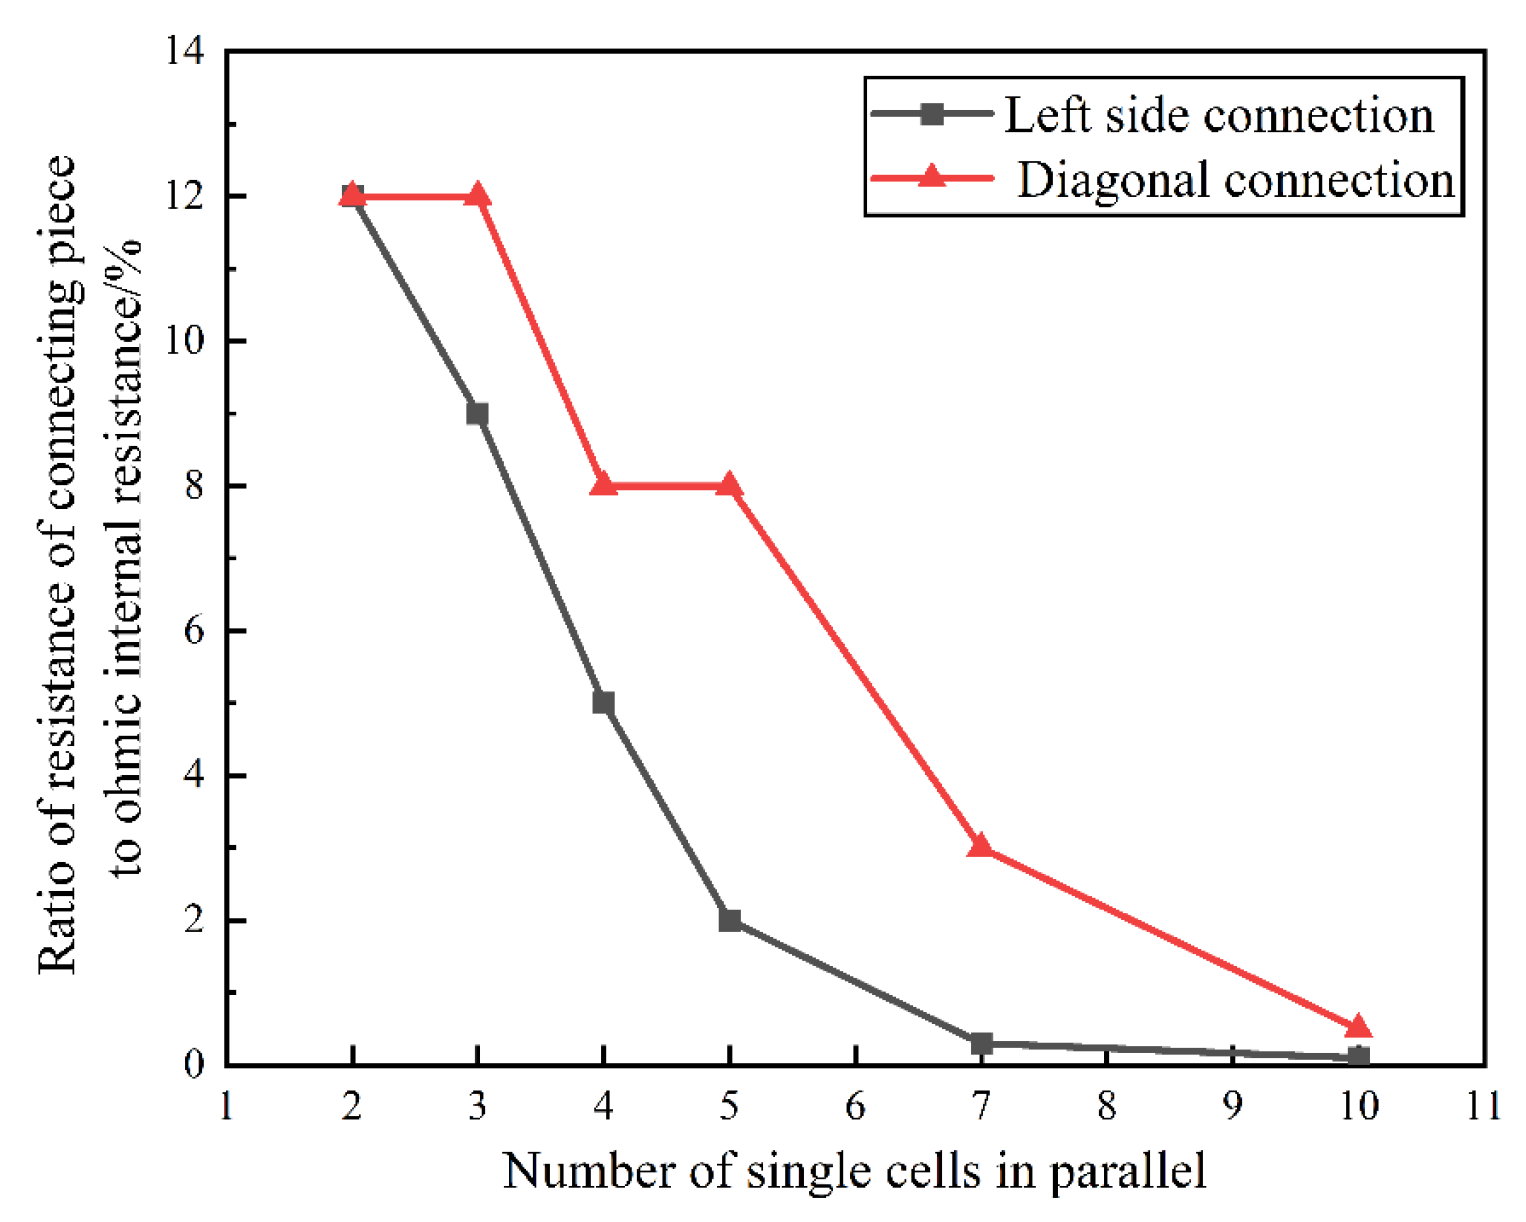
For different numbers of single cells connected in parallel to the battery pack, to ensure that the maximum deviation of the SOC between single cells is 5% as the goal, it is necessary to conduct a simulation to find the maximum value of the resistance of the connecting piece of resistance and ohmic resistance ratio. Cell-1 is for the left side of the connecting structure of the parallel connection, Cell-2 is for the center of the connecting structure of the parallel connection, and the results of the simulation are shown in Figure 14. It can be seen that as the number of parallel connections of the number of single units increases, the resistance of the connecting piece of the resistance value of the requirements of the gradual increase in value, along with the number of single units connected to the parallel connection. After the number of monomers on one side of the connection structure exceeds seven, it is necessary that the resistance value of the connecting piece is not higher than 1% of the internal resistance of the battery, and the ratio of the center-connected structure decreases more slowly. The battery ratio of the center-connected structure shows a stepwise decrease, because when designing for an even number of monomers connected in parallel, the center-connected structure takes any one of the two monomers in the middle, and then the maximum difference in the resistance value of the connecting piece is similar to that of an odd number of monomers, and the simulation results are therefore similar. Because of the unilateral connection structure, every time the number of monomers increases, it will bring an increase in the maximum difference of the resistance of the connecting piece of the monomer battery, so the ratio continues to decline. Therefore, it is suggested that, when using the single-side connection structure, the number of parallel monomers should not be more than seven as far as possible, and the influence of the connection structure on the consistency of the battery pack can be reduced by adjusting the resistance value of the connecting tabs; when using the central connection structure, an odd number of monomers can be considered, which can obtain a larger capacity without destroying the consistency.
3.3. Experimental Verification of Simulation Results of Battery Packs with Different Connection Structures
To verify the simulation analysis of the connection structure, a parallel battery pack cycle experiment was designed, and life cycle experiments were carried out on the parallel battery packs with a central connection structure and diagonal connection structure, and the capacity retention rate, constant current ratio, and other performance indexes were analyzed under different connection structures. To exclude the interference of other factors on the aging of the batteries, the battery packs with the central connection structure were disassembled and analyzed, and the decline rule of the single cells at different positions was investigated. The decline law was studied, and the conclusions of the simulation analyses were verified.
3.3.1. Experimental Design
Taking the number of parallel-connected batteries of the Tesla Model S as a reference, the experimental object is two battery packs made of 72 single cells connected in parallel. The battery pack performance parameters are shown in Table 6.
The test equipment used in the experimental process is the same as that used in the battery model parameter identification experiments and will not be repeated here. The experimental steps are as follows:
- (1)
- 1 C constant-current charging to 3.65 V, then constant-voltage charging to a cutoff current of 100 mA;
- (2)
- Stand it for 10 min;
- (3)
- 1 C constant current discharge to 2 V;
- (4)
- Stand it for 10 min;
- (5)
- Repeat steps 1–4 until 300 cycles are completed.
3.3.2. Analysis of Experimental Results
The parallel battery pack single-cell terminal voltage is the same and the current detection of the branch circuit has no mature commercial equipment, so the total voltage and current should not be used as an analysis index. Simulation analysis shows that different connection structures will lead to uneven distribution of battery branch current, and uneven current distribution will lead to overcharging and over-discharging, accelerating the aging of part of the single-cell batteries, resulting in a decrease in capacity and charging speed and an increase in internal resistance of the battery. Therefore, in this experiment, capacity retention rate and constant current ratio are used to evaluate the performance, and the battery pack is disassembled to study the decline of parallel single cells in different locations.
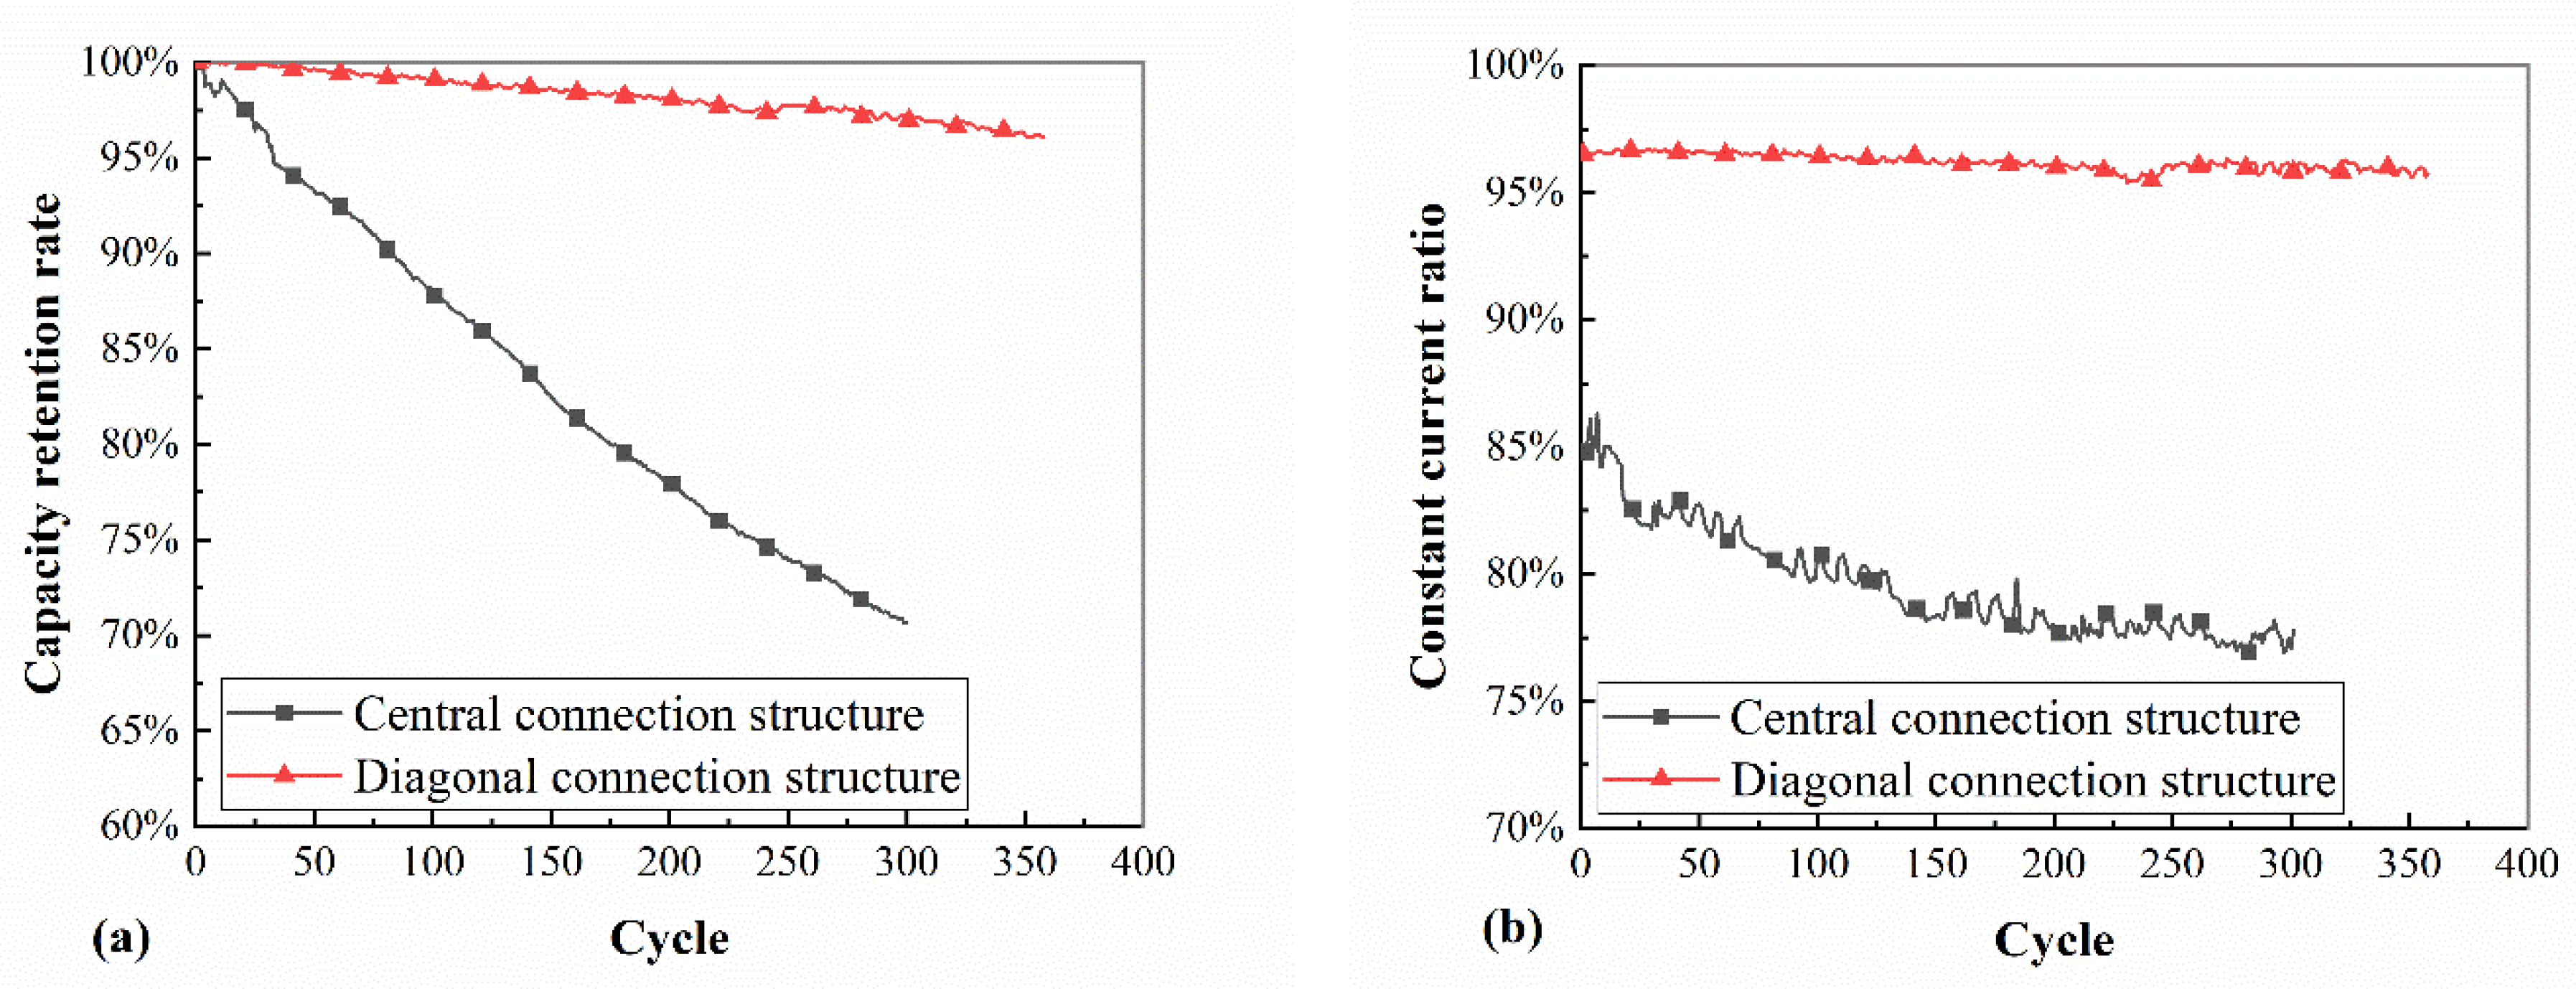
The capacity retention rate is the ratio of the existing capacity of the battery pack to the initial capacity, which represents the change in the ability of the battery to carry energy; the constant current ratio is the percentage of the constant current charging time to the total charging time, which represents the change in the ability of the battery to charge, and both of them are important indexes for evaluating the performance of the battery in use. As shown in Figure 15, the curves of the battery performance with the number of cycles under the two connection structures show the changes in capacity retention rate and constant current ratio with the number of cycles for the two connection structures.
From Figure 15a, it can be seen that the capacity degradation rate of both center-connected and diagonally-connected battery packs is relatively stable, and the cycle life of the selected cells is more than 1500 cycles, while the capacity retention rate of the center-connected battery pack decreases to 80% in 175 cycles, the capacity degradation in 300 cycles reaches 30%, and the capacity degradation of the diagonally-connected battery pack decreases to less than 5% after 350 cycles. From Figure 15b, it can be seen that the constant current ratio of the diagonal connection is very stable, with only 1% degradation after 300 cycles, while the initial constant current ratio of the center-connected battery is lower than that of the diagonal-connected battery, and the constant current ratio continues to decline. There are two main reasons for the decrease in the constant current ratio, one is that the constant current ratio will decrease after the aging of a single cell, and the other is that the constant current ratio will decrease when the consistency of the battery pack deteriorates. The diagonal connection structure can maintain a high constant current ratio that is unchanged, which on the one hand verifies the reliability of the battery decline degree in Figure 15a, and on the other hand, indicates that the diagonal connection structure connecting piece resistance consistency is better, which is consistent with the simulation results.
Due to the large performance gap between the two experimental groups, many factors can lead to the accelerated rate of battery pack decline; for example, there may be an abnormal single cell that has passed the grouping screening by fluke, and it is known from the study that the abnormal single cell can also have a large negative impact on the consistency of the battery pack. To exclude the influence of these factors on the experimental results, the center-connected structure of the battery pack was disassembled to measure the internal resistance, terminal voltage, and capacity of every single cell, and part of the single cell was disassembled to check the degree of aging of the pole piece.
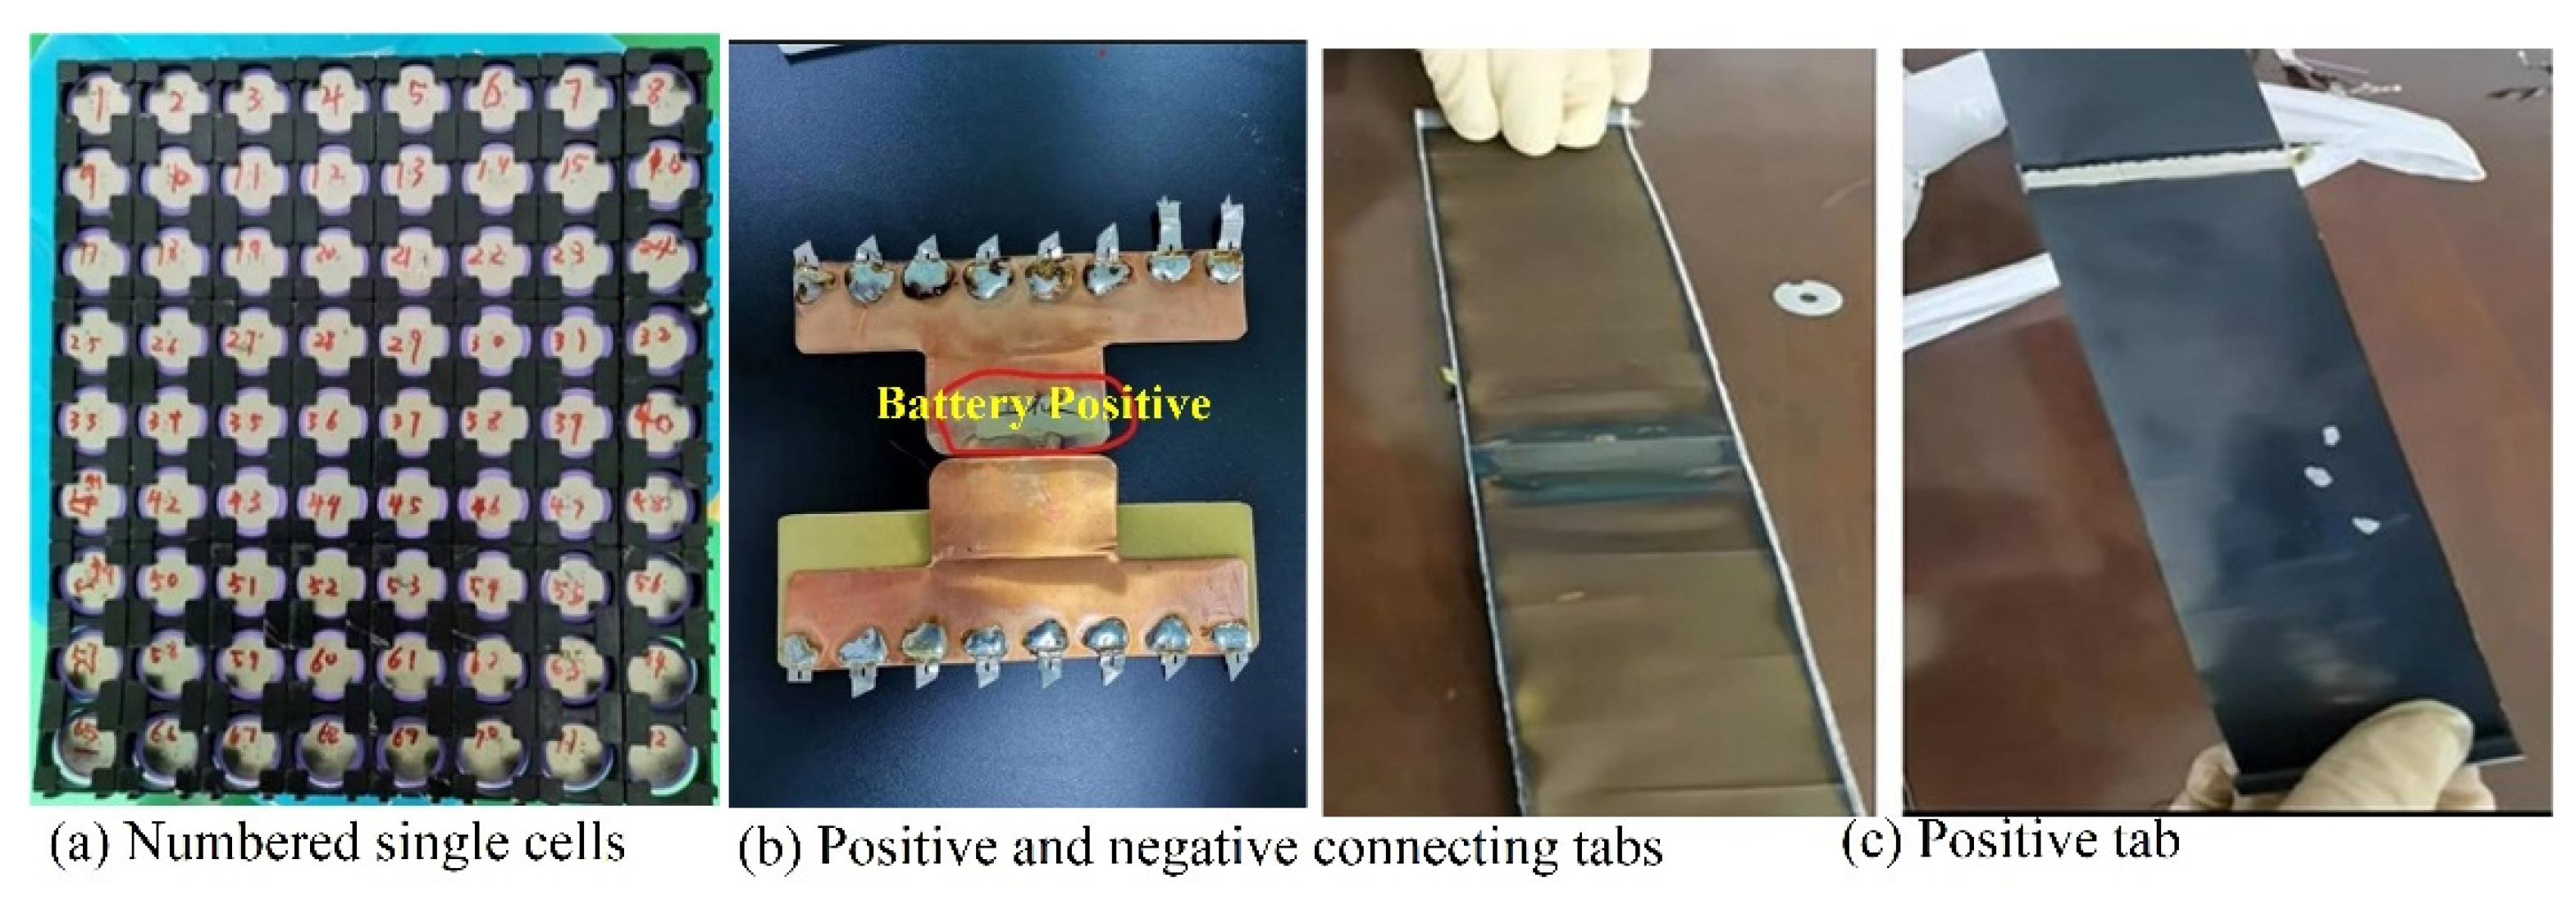
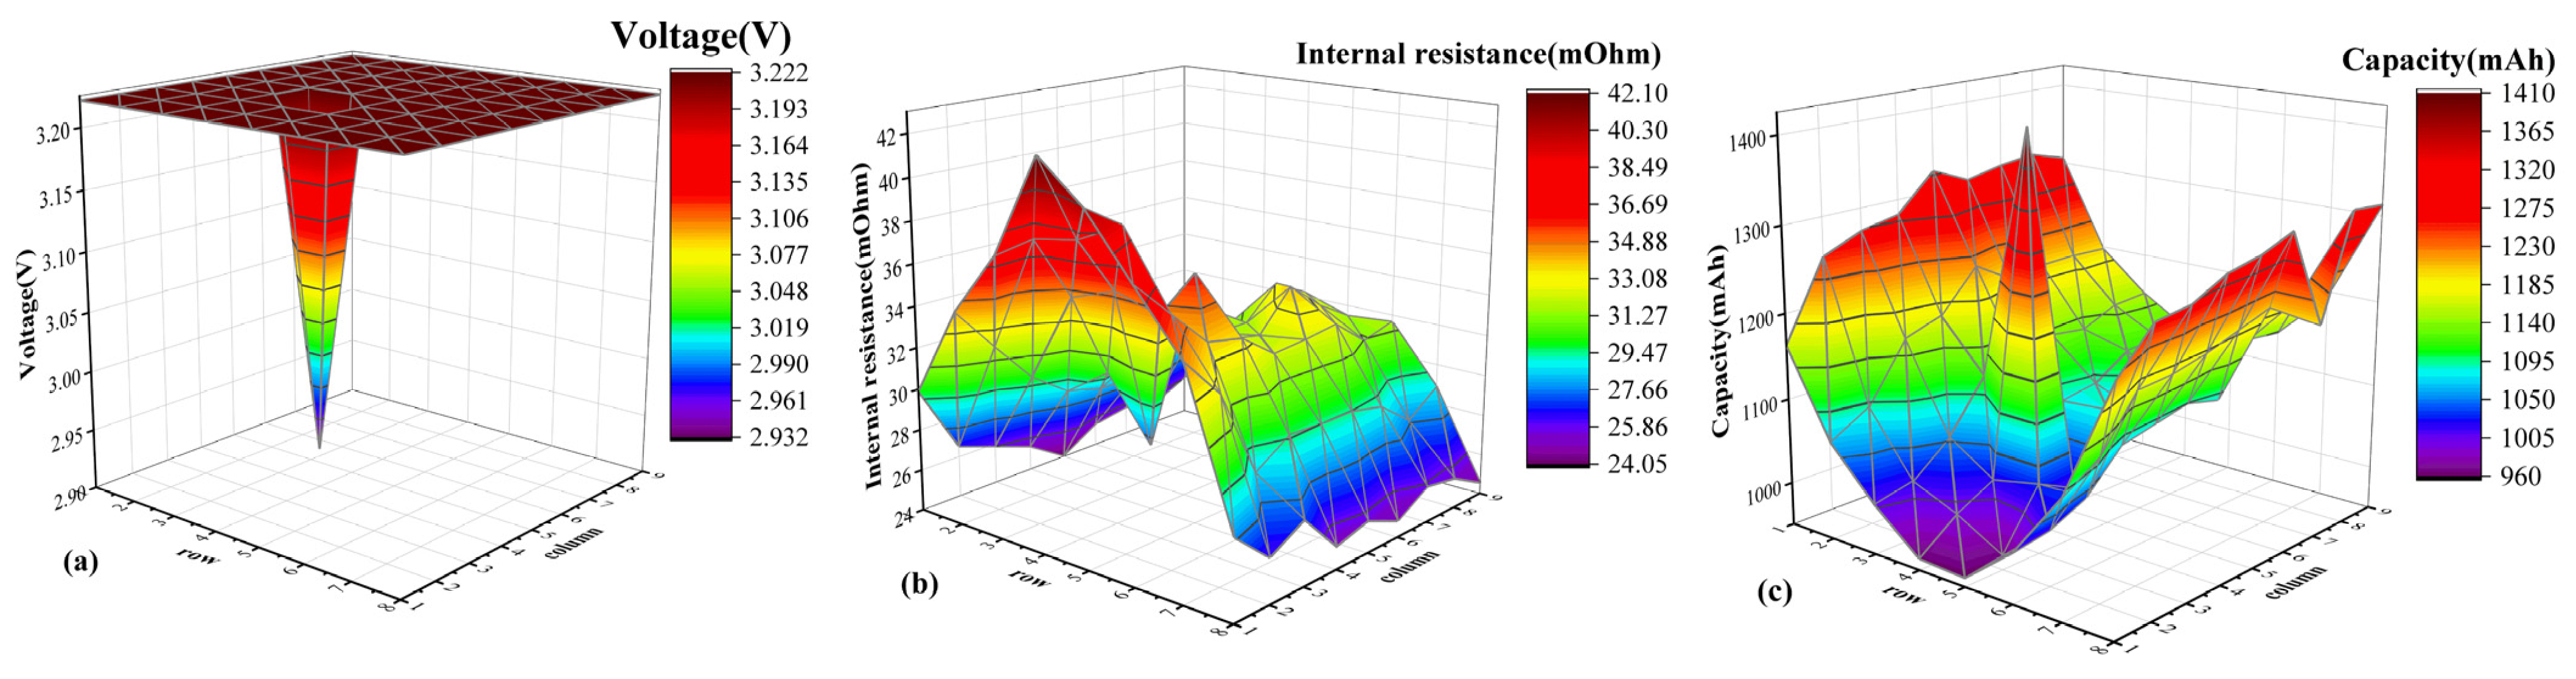
Figure 16 shows the photographs of the battery pack of the center-connected structure. Seventy-two single cells are numbered sequentially in Figure 16a, and the positive and negative connecting pieces are shown in Figure 16b. Figure 17a shows the distribution of the internal resistance of the single cell, the bottom coordinates of which correspond to the numbering of the single cell in Figure 16a, and it can be seen that the internal resistance of the single cell is greater the closer it is to the positive electrode collector, and the closer it is to the center line of the battery pack, the greater the internal resistance is. In Figure 16b, the oxidation traces of the positive electrode collector are obvious, which indicates that the temperature of the contact point is high during the cycling process, and the reason for the larger internal resistance near the positive electrode collector is that the high temperature accelerates the aging of the single cell. The closer to the middle line of the battery pack, the higher the internal resistance, which verifies the results of the previous simulation. That is, in the central connection structure, the battery closest to the middle line is prone to overcharge and over-discharge, and the aging speed is faster than the other single batteries. Figure 16c shows the disassembly of the pole piece of batteries No. 1 and No. 5, and it can be seen that the uniformity of the pole piece of battery No. 5 on the left side is much lower than that of battery No. 1 on the right side, the battery aging degree is higher, and the disassembly results of the rest of the single batteries close to the center line are similar.
Figure 17b shows that there is a single cell with abnormal voltage in the middle of the battery pack, and after taking out the single cell for testing, it is found that its voltage and internal resistance are lower than that of the surrounding cells, there may be an internal micro short circuit, and it is difficult to determine the time of the appearance of the micro short circuit, but after the battery is formed into a battery pack, the abnormal single cell will accelerate the aging of the surrounding single cells, which will have a bad effect on the consistency of the battery pack. Figure 17c shows that, on the one hand, it illustrates the influence of the abnormal monomer on the surrounding monomers, and on the other hand, the capacity of the battery near the center line is lower, and the higher capacity around it indicates that the aging degree of the center line part is higher, which corroborates the previous simulation analysis of the center connection structure.
4. Conclusions
In this paper, a first-order RC battery model is developed in MATLAB (2022)/Simulink, and its correctness is verified by experiments. Based on this model, a model of a battery pack with multiple parallel-connected cells is established. Through the simulation of the battery pack model, the effects of different connection structures on the state parameters such as the current flowing through the battery cell, the SOC of the battery cell, and the terminal voltage are analyzed during the constant current discharge process. The conclusions of this paper are as follows:
- (1)
- The current between the cells will be different due to the existence of the resistance of the connecting plate. The closer the battery cell is to the pole, the smaller its connecting plate resistance, the greater the current passing through it, and the easier it is to reach the aging state first.
- (2)
- The terminal voltage and SOC changes of each battery cell of the diagonal-connection structure have a higher degree of fitting over time and better consistency. The experimental verification shows that the capacity of the diagonal-connection structure decays by less than 5% after 350 cycles, its constant current ratio is very stable, and the attenuation of 300 charge/discharge cycles is only 1%.
Author Contributions
H.Z.: Investigation, Writing—original draft, Visualization. Y.Z.: Methodology, Investigation. L.H.: Acquisition and interpretation of data, Resources. J.S.: Conceptualization, Supervision. Z.H.: Writing—translation. All authors have read and agreed to the published version of the manuscript.
Funding
This research was funded by the Key R&D Program of Shandong Province, China (Major Scientific and Technological Innovation Project), grant number 2022CXGC020402 and Shandong Natural Science Foundation Project, grant number ZR2020QE298.
Data Availability Statement
Data will be made available on request.
Conflicts of Interest
The authors declare that they have no known competing financial interests or personal relationships that could have appeared to influence the work reported in this paper.
References
- Wang, Y.; Cai, H.; Hu, X.; Liu, P.; Yan, Q.; Cheng, Y. Data-driven method for estimating emission factors of multiple pollutants from excavators based on portable emission measurement system and online driving characteristic identification. Sci. Total Environ. 2024, 912, 169472. [Google Scholar] [CrossRef]
- Luo, M.; Lin, X.; Feng, J.; Ling, Z.; Zhang, Z.; Fang, X. Fast Self-Preheating System and Energy Conversion Model for Lithium-Ion Batteries under Low-Temperature Conditions. J. Power Sources 2023, 565, 232897. [Google Scholar] [CrossRef]
- Wang, Y.; Zhang, X.; Chen, Z. Low Temperature Preheating Techniques for Lithium-Ion Batteries: Recent Advances and Future Challenges. Appl. Energy 2022, 313, 118832. [Google Scholar] [CrossRef]
- Li, Y.; Tang, W.; Chen, Y.; Liu, J.; Lee, C.F. Potential of Acetone-Butanol-Ethanol (ABE) as a Biofuel. Fuel 2019, 242, 673–686. [Google Scholar] [CrossRef]
- Li, Y.; Tang, W.; Abubakar, S.; Wu, G. Construction of a Compact Skeletal Mechanism for Acetone–n–Butanol–Ethanol (ABE)/Diesel Blends Combustion in Engines Using a Decoupling Methodology. Fuel Process. Technol. 2020, 209, 106526. [Google Scholar] [CrossRef]
- Dunn, B.; Kamath, H.; Tarascon, J.-M. Electrical Energy Storage for the Grid: A Battery of Choices. Science 2011, 334, 928–935. [Google Scholar] [CrossRef]
- Wang, Y.; Yin, W.; Yan, Q.; Cheng, Y. Emission Characteristics of Particulate Matter Emitted by Typical Off-Road Construction Machinery. Environ. Sci. Pollut. Res. 2022, 29, 44220–44232. [Google Scholar] [CrossRef]
- Kim, J.; Oh, J.; Lee, H. Review on Battery Thermal Management System for Electric Vehicles. Appl. Therm. Eng. 2019, 149, 192–212. [Google Scholar] [CrossRef]
- Thackeray, M.M.; Wolverton, C.; Isaacs, E.D. Electrical Energy Storage for Transportation—Approaching the Limits of, and Going beyond, Lithium-Ion Batteries. Energy Environ. Sci. 2012, 5, 7854. [Google Scholar] [CrossRef]
- Tarascon, J.-M.; Armand, M. Issues and Challenges Facing Rechargeable Lithium Batteries. Nature 2001, 414, 359–367. [Google Scholar] [CrossRef]
- Baumann, M.; Wildfeuer, L.; Rohr, S.; Lienkamp, M. Parameter Variations within Li-Ion Battery Packs–Theoretical Investigations and Experimental Quantification. J. Energy Storage 2018, 18, 295–307. [Google Scholar] [CrossRef]
- Brand, M.J.; Kolp, E.I.; Berg, P.; Bach, T.; Schmidt, P.; Jossen, A. Electrical Resistances of Soldered Battery Cell Connections. J. Energy Storage 2017, 12, 45–54. [Google Scholar] [CrossRef]
- Offer, G.J.; Yufit, V.; Howey, D.A.; Wu, B.; Brandon, N.P. Module Design and Fault Diagnosis in Electric Vehicle Batteries. J. Power Sources 2012, 206, 383–392. [Google Scholar] [CrossRef]
- Duan, B.; Li, Z.; Gu, P.; Zhou, Z.; Zhang, C. Evaluation of Battery Inconsistency Based on Information Entropy. J. Energy Storage 2018, 16, 160–166. [Google Scholar] [CrossRef]
- Feng, F.; Hu, X.; Liu, K.; Che, Y.; Lin, X.; Jin, G.; Liu, B. A Practical and Comprehensive Evaluation Method for Series-Connected Battery Pack Models. IEEE Trans. Transp. Electrif. 2020, 6, 391–416. [Google Scholar] [CrossRef]
- Baumhöfer, T.; Brühl, M.; Rothgang, S.; Sauer, D.U. Production Caused Variation in Capacity Aging Trend and Correlation to Initial Cell Performance. J. Power Sources 2014, 247, 332–338. [Google Scholar] [CrossRef]
- Kenney, B.; Darcovich, K.; MacNeil, D.D.; Davidson, I.J. Modelling the Impact of Variations in Electrode Manufacturing on Lithium-Ion Battery Modules. J. Power Sources 2012, 213, 391–401. [Google Scholar] [CrossRef]
- Dubarry, M.; Vuillaume, N.; Liaw, B.Y. Origins and Accommodation of Cell Variations in Li-Ion Battery Pack Modeling. Int. J. Energy Res. 2010, 34, 216–231. [Google Scholar] [CrossRef]
- Roscher, M.A.; Bohlen, O.S.; Sauer, D.U. Reliable State Estimation of Multicell Lithium-Ion Battery Systems. IEEE Trans. Energy Convers. 2011, 26, 737–743. [Google Scholar] [CrossRef]
- Wang, Y.; Zhao, Y.; Zhou, S.; Yan, Q.; Zhan, H.; Cheng, Y.; Yin, W. Impact of Individual Cell Parameter Difference on the Performance of Series–Parallel Battery Packs. ACS Omega 2023, 8, 10512–10524. [Google Scholar] [CrossRef]
- Wang, Y.; Liu, P.; Jin, X.; Zhang, K.; Cheng, Y.; Yin, W. Design and Experiment of a Novel Stepwise Preheating System for Battery Packs Coupled with Non-Dissipative Balancing Function Based on Supercapacitors. J. Energy Storage 2023, 66, 107444. [Google Scholar] [CrossRef]
- Zheng, Y.; Han, X.; Lu, L.; Li, J.; Ouyang, M. Lithium Ion Battery Pack Power Fade Fault Identification Based on Shannon Entropy in Electric Vehicles. J. Power Sources 2013, 223, 136–146. [Google Scholar] [CrossRef]
- Wang, L.; Cheng, Y.; Zou, J. Battery Available Power Prediction of Hybrid Electric Vehicle Based on Improved Dynamic Matrix Control Algorithms. J. Power Sources 2014, 261, 337–347. [Google Scholar] [CrossRef]
- Wang, L.; Pan, C.; Liu, L.; Cheng, Y.; Zhao, X. On-Board State of Health Estimation of LiFePO4 Battery Pack through Differential Voltage Analysis. Appl. Energy 2016, 168, 465–472. [Google Scholar] [CrossRef]
- Kim, G.-H.; Smith, K.; Ireland, J.; Pesaran, A. Fail-Safe Design for Large Capacity Lithium-Ion Battery Systems. J. Power Sources 2012, 210, 243–253. [Google Scholar] [CrossRef]
- Zheng, Y.; Ouyang, M.; Lu, L.; Li, J.; Han, X.; Xu, L.; Ma, H.; Dollmeyer, T.A.; Freyermuth, V. Cell State-of-Charge Inconsistency Estimation for LiFePO4 Battery Pack in Hybrid Electric Vehicles Using Mean-Difference Model. Appl. Energy 2013, 111, 571–580. [Google Scholar] [CrossRef]
- Su, H.; Zhang, H.; Tang, X.; Jing, Y. Influence of Connecting Plate Resistance upon LiFePO4 Battery Performance. Appl. Energy 2015, 147, 353–360. [Google Scholar] [CrossRef]
- Hu, X.; Li, S.; Peng, H. A Comparative Study of Equivalent Circuit Models for Li-Ion Batteries. J. Power Sources 2012, 198, 359–367. [Google Scholar] [CrossRef]
- He, H.; Xiong, R.; Fan, J. Evaluation of Lithium-Ion Battery Equivalent Circuit Models for State of Charge Estimation by an Experimental Approach. Energies 2011, 4, 582–598. [Google Scholar] [CrossRef]
- Wang, Y.; Cheng, Y.; Xiong, Y.; Yan, Q. Estimation of Battery Open-Circuit Voltage and State of Charge Based on Dynamic Matrix Control-Extended Kalman Filter Algorithm. J. Energy Storage 2022, 52, 104860. [Google Scholar] [CrossRef]
- Huria, T.; Ceraolo, M.; Gazzarri, J.; Jackey, R. High Fidelity Electrical Model with Thermal Dependence for Characterization and Simulation of High Power Lithium Battery Cells. J. Power Sources 2012, 1–8. [Google Scholar] [CrossRef]
- Wang, Y.; Yin, W.; Yan, Q.; Cheng, Y. Impact of Sensor Accuracy of Battery Management System on SOC Estimation of Electric Vehicle Based on EKF Algorithm. In Proceedings of the 2021 5th CAA International Conference on Vehicular Control and Intelligence (CVCI), Tianjin, China, 29–31 October 2021; pp. 1–6. [Google Scholar] [CrossRef]
- Wang, Y.; Hu, X.; Deng, X.; Cheng, Y.; Yin, W. Design and experiment of a low-temperature charging preheating system for power battery packs with an integrated dissipative balancing function. J. Power Sources 2023, 588, 233740. [Google Scholar] [CrossRef]
- Kim, J.; Shin, J.; Chun, C.; Cho, B.H. Stable configuration of a li-ion series battery pack based on a screening process for improved voltage/SOC balancing. IEEE Trans. Power Electron. 2012, 27, 411–424. [Google Scholar] [CrossRef]
Figure 1.
The Thevenin model of the single battery cell.

Figure 2.
OCV-SOC curve.

Figure 3.
HPPC process of recognizing parameters.

Figure 4.
Experimental validation of battery simulation model. (a) Battery terminal voltage under constant current discharge condition, (b) deviation between simulated and experimental values under constant current charging condition, (c) battery terminal voltage under constant current charging condition, (d) deviation between simulated and experimental values under constant current charging condition.

Figure 5.
Equivalent circuit model of two parallel-connected cells.

Figure 6.
Topology of a parallel battery pack considering the connection structure.

Figure 7.
Equivalent circuit diagram for unilateral connection.

Figure 8.
Equivalent circuit diagram for connecting to center.

Figure 9.
Topology of two common types of connections.

Figure 10.
(a) Terminal voltage, (b) SOC. Simulation results of constant current discharge of each single cell with a single side connection structure.
Figure 10.
(a) Terminal voltage, (b) SOC. Simulation results of constant current discharge of each single cell with a single side connection structure.

Figure 11.
(a) Terminal voltage, (b) SOC. Simulation results of constant current discharge of every single cell of the center-connected structure.
Figure 11.
(a) Terminal voltage, (b) SOC. Simulation results of constant current discharge of every single cell of the center-connected structure.

Figure 12.
Diagonal connection structure diagram.

Figure 13.
(a) Terminal voltage, (b) SOC. Simulation results of diagonally connected structures.

Figure 14.
Simulation results with different numbers of parallel-connected single cells.

Figure 15.
(a) Capacity retention rate; (b) constant current ratio. Curves of battery performance with cycle times under two connection structures.
Figure 15.
(a) Capacity retention rate; (b) constant current ratio. Curves of battery performance with cycle times under two connection structures.

Figure 16.
Structural disassembly of the battery.

Figure 17.
Spatial distribution of performance parameters of battery packs (central connection structure).
Figure 17.
Spatial distribution of performance parameters of battery packs (central connection structure).


Table 1.
The main technical parameters of the single-cell battery model.
| Parameter | Specification |
|---|---|
| Material | Ternary lithium-ion battery |
| Size | Diameter 18 mm, height 65 mm |
| Mass | 44 g |
| Nominal capacity | 2 Ah |
| Nominal voltage | 3.7 V |
| Cut-off voltage | Charging: 4.2 V Discharging: 2.75 V |
| Temperature range | Charging: 0~60 °C Discharging: −20~60 °C |
| Maximum continuous current | 5 C |
| Internal resistance | ≤20 mΩ |
Table 2.
Main technical parameters of related test equipment.
| Equipment | Model | Specification |
|---|---|---|
| Programmable temperature cycling test chamber | Y70-1-DZ | Programmable temperature range: −60 °C~150 °C (±0.1 °C) Temperature fluctuation: ≤±0.5 °C Temperature resolution: 0.01 °C |
| Power battery performance test platform | S08-5-100-DZ | Voltage: 0~5 V (0.1%FS) Current: 500 mA~100 A (0.1%FS) |
| Power battery performance test platform | BTS550C8 | Voltage: 0~5 V (0.1%FS) Current: 150 mA~50 A (0.1%FS) |
| Dynamic signal acquisition card | ART-USB8812 | Channel number: 4 Resolution: 24-bit Input range: ±11 V, ±5.5 V Sampling mode: Synchronous acquisition Sampling frequency: 8 Hz~216 kHz Input impedance: 1 MΩ |
Table 3.
Coefficients of polynomial equations fitted by SOC-OCV.
| Coefficient | Value |
|---|---|
| a | −1.06 × 10⁴ |
| b | 1.15 × 10⁵ |
| c | −5.60 × 10⁵ |
| d | 1.60 × 10⁶ |
| e | −2.88 × 10⁶ |
| f | 4.21 × 10⁶ |
| g | −4.06 × 10⁶ |
| h | 2.61 × 10³ |
| i | −1.13 × 10⁶ |
| j | 3.16 × 10⁵ |
| k | −5.58 × 10⁴ |
| l | 5.58 × 10³ |
| m | −2.42 |
| n | 3.2 |
Table 4.
Parameters of each SOC point of single cell.
| SOC | R0/mΩ | Rp/mΩ | Cp/kF |
|---|---|---|---|
| 0 | 5.825 | 7.925 | 3.043 |
| 0.1 | 4.225 | 9.275 | 3.660 |
| 0.2 | 3.450 | 3.325 | 9.033 |
| 0.3 | 3.075 | 3.325 | 16.063 |
| 0.4 | 3.025 | 3.325 | 19.771 |
| 0.5 | 2.975 | 3.325 | 21.292 |
| 0.6 | 2.975 | 3.325 | 16.742 |
| 0.7 | 2.925 | 3.325 | 14.654 |
| 0.8 | 2.925 | 2.925 | 19.229 |
| 0.9 | 2.925 | 2.925 | 18.287 |
Table 5.
The SOC of each battery cell at the end of the simulation for different connection structure methods.
Table 5.
The SOC of each battery cell at the end of the simulation for different connection structure methods.
| Connection Structure Method | Average SOC/% | SOC of Cell1/% | SOC of Cell2/% | SOC of Cell3/% | SOC of Cell4/% | SOC of Cell5/% |
|---|---|---|---|---|---|---|
| One-side connection structure | 6.47 | 2.76 | 4.61 | 6.47 | 8.32 | 10.18 |
| Central-connection structure | 0.67 | 0.14 | 0.83 | 1.53 | 0.81 | 0.06 |
Table 6.
Battery pack Parameters.
| Parameters | Value |
|---|---|
| Materials for positive electrodes | LiFePO4 |
| Rated capacity | 110 Ah |
| Rated voltage | 3.2 V |
| Internal resistance | 2.1 mΩ |
| Battery cell group requirements | Internal resistance: 13–15 mΩ, Voltage: 3.2–3.3 V |
Disclaimer/Publisher’s Note: The statements, opinions and data contained in all publications are solely those of the individual author(s) and contributor(s) and not of MDPI and/or the editor(s). MDPI and/or the editor(s) disclaim responsibility for any injury to people or property resulting from any ideas, methods, instructions or products referred to in the content. |
© 2024 by the authors. Licensee MDPI, Basel, Switzerland. This article is an open access article distributed under the terms and conditions of the Creative Commons Attribution (CC BY) license (https://creativecommons.org/licenses/by/4.0/).
Share and Cite
MDPI and ACS Style
Zhang, H.; Zhang, Y.; Huang, L.; Song, J.; Huang, Z. Study on the Influence of Connection Structure between Batteries on Battery Pack Performance. Electronics 2024, 13, 817. https://doi.org/10.3390/electronics13050817
AMA Style
Zhang H, Zhang Y, Huang L, Song J, Huang Z. Study on the Influence of Connection Structure between Batteries on Battery Pack Performance. Electronics. 2024; 13(5):817. https://doi.org/10.3390/electronics13050817
Chicago/Turabian StyleZhang, Hao, Yanting Zhang, Lumeng Huang, Jianfeng Song, and Zhangcong Huang. 2024. "Study on the Influence of Connection Structure between Batteries on Battery Pack Performance" Electronics 13, no. 5: 817. https://doi.org/10.3390/electronics13050817
Note that from the first issue of 2016, this journal uses article numbers instead of page numbers. See further details here.