

Methodical Approach to Proactivity Using a Digital Twin of Production Process


Institute of Applied Informatics, Automation and Mechatronics, Faculty of Material Science and Technology in Trnava, Slovak University of Technology in Bratislava, 91724 Trnava, Slovakia
*
Author to whom correspondence should be addressed.
Electronics 2023, 12(15), 3335; https://doi.org/10.3390/electronics12153335
Submission received: 20 June 2023
/
Revised: 29 July 2023
/
Accepted: 2 August 2023
/
Published: 4 August 2023
(This article belongs to the Special Issue Advances in Human-Machine Interaction, Artificial Intelligence, and Robotics)
Abstract
:Real-time simulation and digital twin (DT) as a part of Industry 4.0 are becoming increasingly relevant, especially when considering production cycles. Most issues with production cycles arise from having a demand for customized production orders, while having nonmodular production lines with a medium-to-high complexity in the decision-making process. All these conditions lead to a possibility of unpredictable consequences. Being able to predict behavior and possible failure scenarios before the production starts has proven to save both costs and time. With an introduction of a new ISO standard which is solely focused on DT creation and sets a starting point for future research, researchers are finally able to focus on creating DT prototypes built for specific scenarios while maintaining the core concepts. This paper focuses on proposing strategies for DT and real-time simulation integration into production cycles, based on the new standards, which can be generalized and applied on a multitude of different systems with minimal changes. The proposed solutions offer different levels of human interaction with the Human–Machine Interfaces used in Cyber–Physical Systems created as a part of DT. Applicability of the solution has been verified based on the results of experiments carried out on the WITNESS Horizon simulation platform with utilization of the custom Order Manipulation Interface (OMI) application.
1. Introduction
The digital twin (DT) is one of the basic components of the Industry 4.0 concept. It is clear from this concept that DT is influenced by its connection with other core components such as Cyber–Physical Systems (CPS), the Internet of Things (IoT), artificial intelligence (AI), machine learning (ML), Big Data and cloud solutions. All these technologies, from different points of view and at different levels of complexity, support or are related to Smart Manufacturing (SM) [1,2,3].
This article presents the possibility of using the current hot trend of digitization in the industrial environment—a digital twin with the aim of integrating the process of proactive simulation for the purpose of real-time analysis of incoming production orders. The task is to identify possible problems during the subsequent execution of orders in the production process itself, which will enable timely adoption of appropriate countermeasures.
The main idea and potential contribution of the article is the proposal of an original solution for data integration between the control MES and the simulation environment. It is a solution to a specific problem involving communication between the control MES created in the AVEVA InTouch environment, which ensures the control of a real Physical Production System—a hybrid production line AFB Factory, and a digital twin represented by a simulation model implemented in the WITNESS Horizon environment. The focus on such a combination of technologies is unique and not reported in the scientific literature. Our own custom Order Manipulation Interface created in MATLAB ensures the data transfer and order management in our solution.
In the introduction of the presented article, the reader will become acquainted with the standards for the implementation of a digital twin. Subsequently, the problem of data integration between MES and DT in the form of a simulation model is specified, and our proposed solution is presented in the form of the original Manual Order Rearrangement method. In the next section, the digital model representing DT is described in detail. In the experimental part, the feasibility of our proposal is declared based on four different experiments. At the end of the article, the fundamental advantages, but also the disadvantages of our solution, are presented, with an outline of the concept of Automated Order Rearrangement, which has the ambition to move the offered solution to a higher level.
The idea of the digital twin can be described as a digital model of a certain part or the entire production process. In production, we need the DT model to be used for process-level monitoring, i.e., physical and virtual entities as well as processes in real space and time, as DT allows us to create a detailed digital image with real data tracking. The connection of the physical and real environment makes it possible to optimize the activities of physical objects, continuous analysis of collected data, monitoring of the production process or its prediction. It also allows us to evaluate and maintain the operational capability of individual production equipment with utilization of predictive maintenance. Digital twin accelerates and facilitates decision-making processes in production. The use of DT in production helps to increase the overall efficiency of production, optimize processes and maximize the use of resources. On the other hand, it is necessary to take into account the fact that an enterprise will benefit from a digital twin depending on many factors. In particular, the amount of work, employees, software, systems and computers involved in the implementation of simulations causes this technology to generate very high costs. Modelling is an expensive issue, and only the profit from resultant optimization, which is never guaranteed in every case, is able to compensate for these costs.
Currently, we can say that the use of DT is mainly in the field of prototyping, which includes modeling, simulation, verification, evaluation and confirmation of a physical artifact using a simulation replica [4]. The role of digital twin is to create virtual models for physical objects that will be used to simulate their behavior [5]. Such models can reflect the state of physical entities via data sensing. These data are then used to predict, estimate and analyze dynamic changes in the production process. Thus, physical objects would respond to changes according to the optimized scheme provided by the simulation [6]. The mentioned models are able to collect data and communicate via SCADA and MES systems with other levels of company management to ensure an efficient and sustainable production. Collecting data from a real system is therefore a crucial prerequisite for the creation of DT.
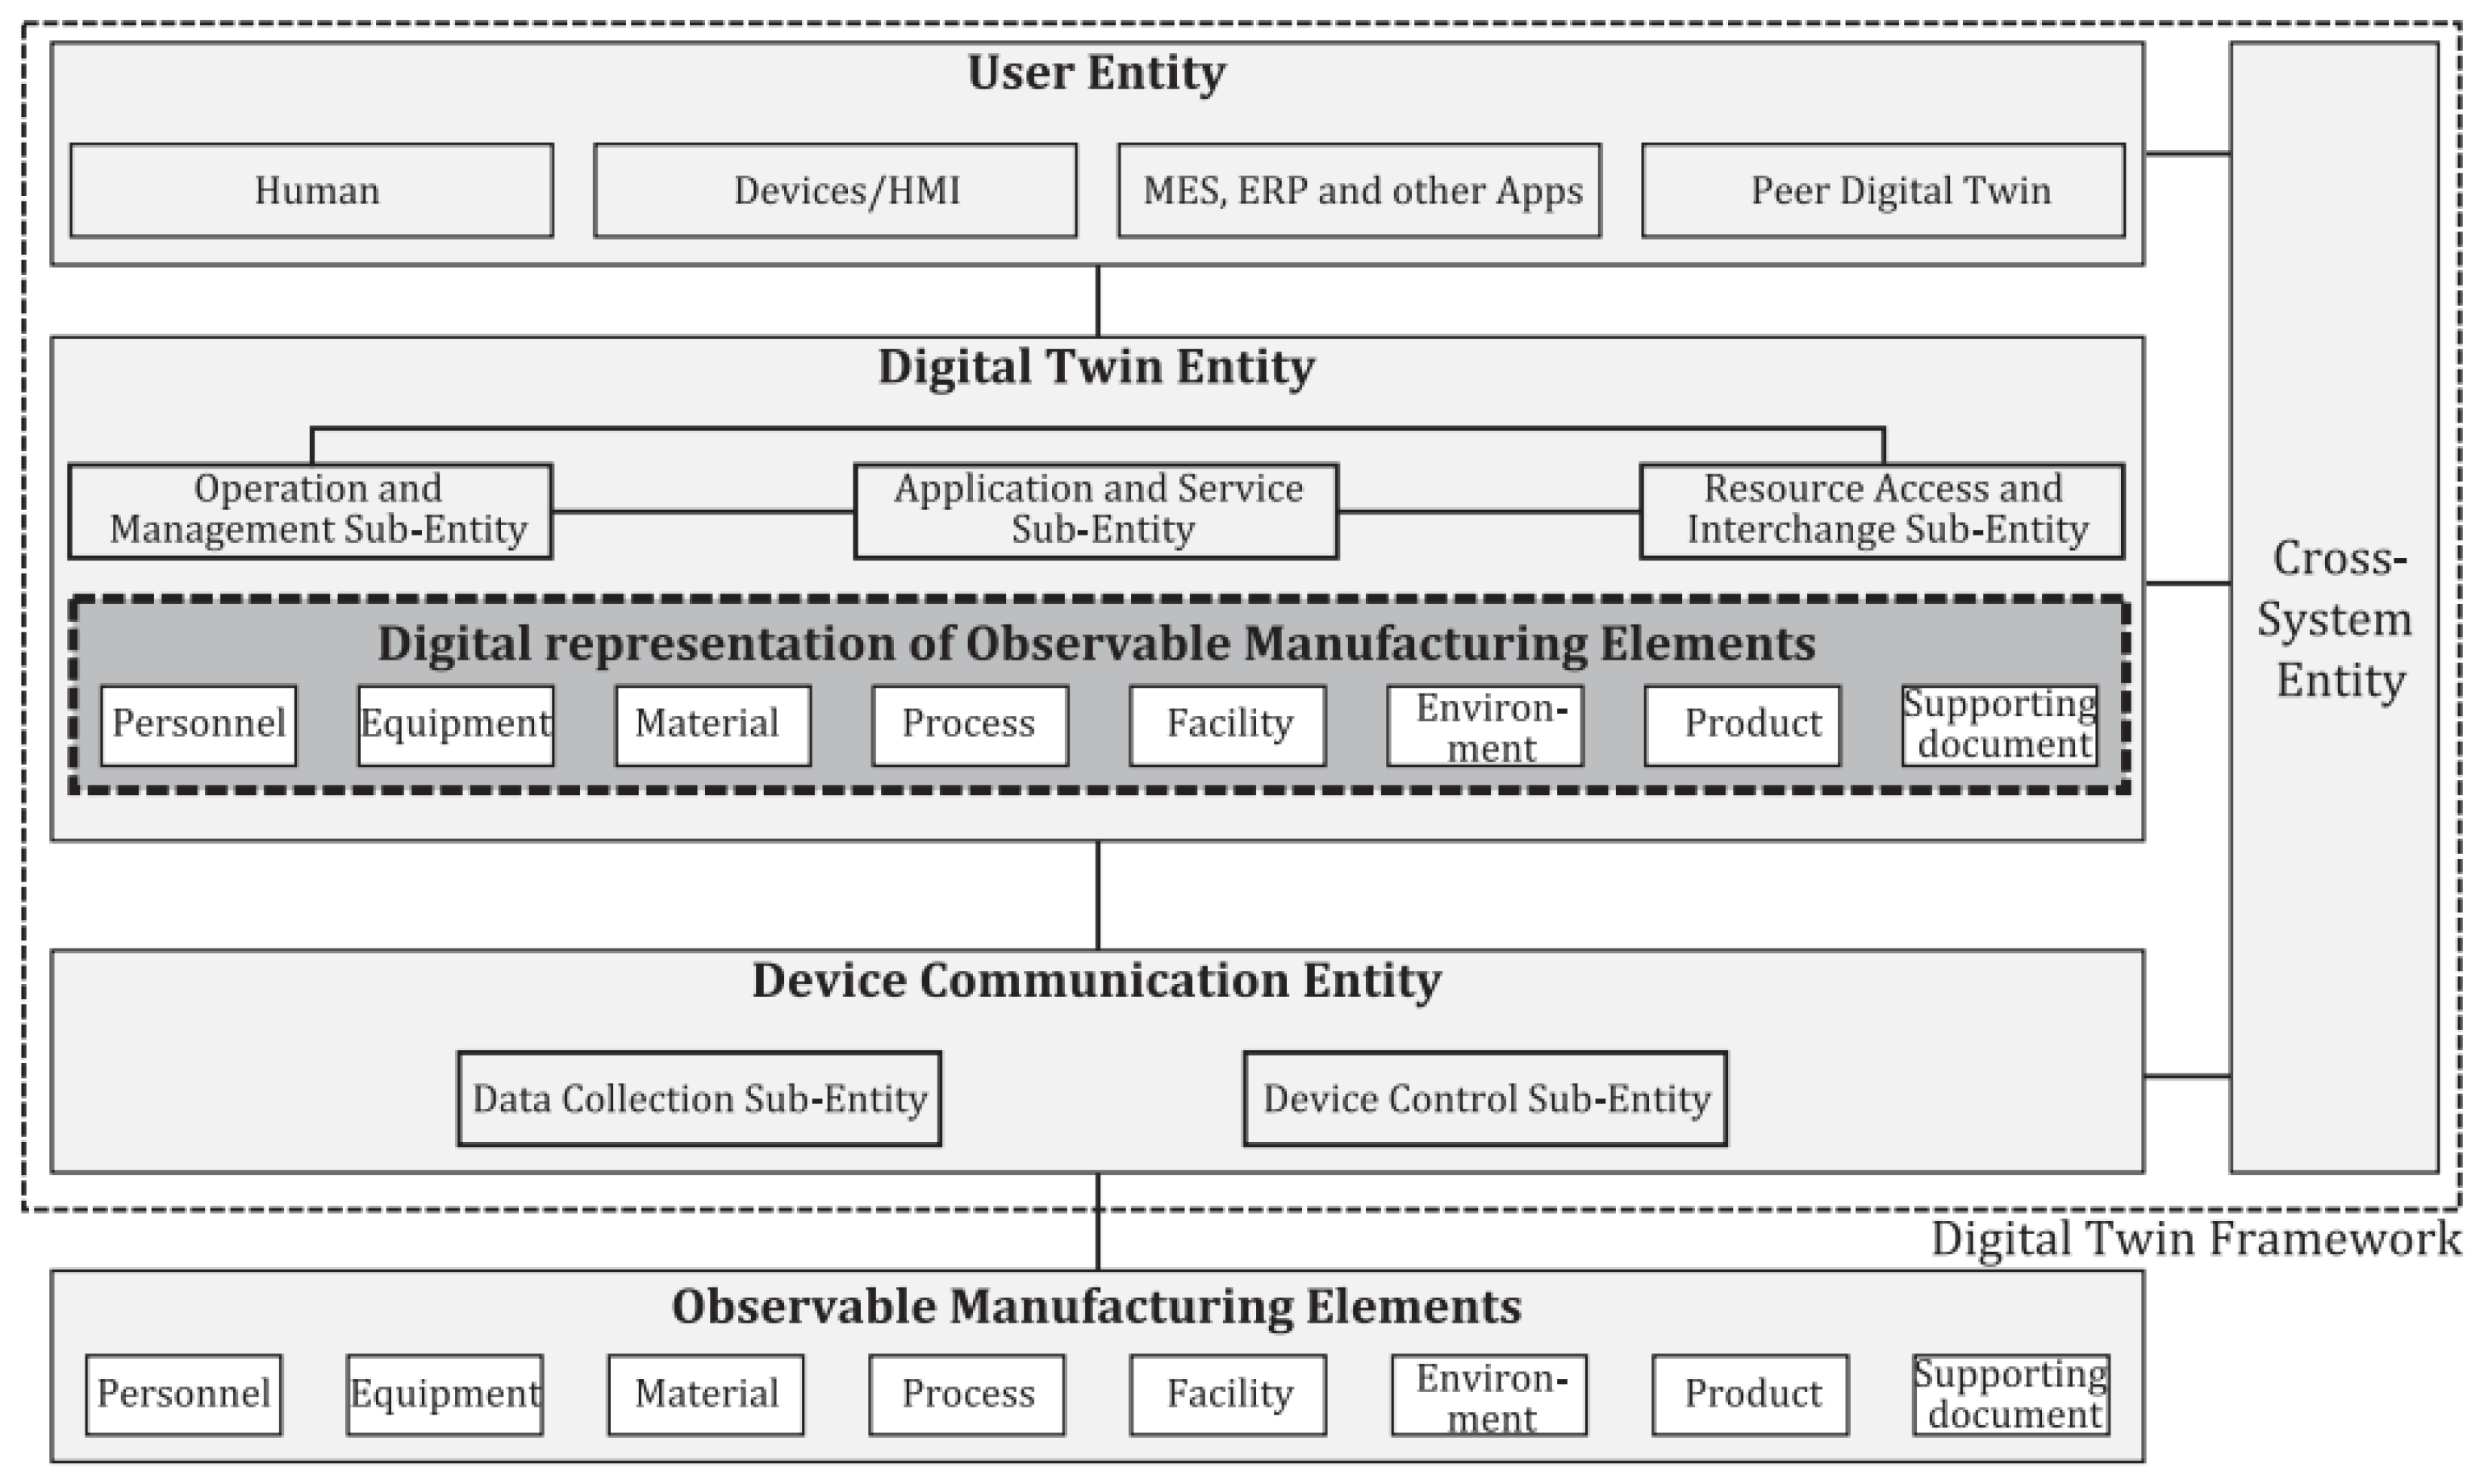
An International Standard ISO 23247 was defined and published in 2021. This standard deals with automation systems and integration and provides a digital twin implementation framework for manufacturing. According to this standard, the digital twin framework for manufacturing is fit for purpose digital representation of an observable manufacturing element (OME) with synchronization between the element and its digital representation [7]. According to this standard, we would be able to design a usable digital twin. The standard defines that digital representation of OMEs can include both static and dynamic information, as is shown in Figure 1. Information that does not change during the manufacturing process is classified as static. For example, the serial number of a piece of material is static. However, the shape of the material, if it changes during manufacturing processes, is dynamic [8].
Thus, a digital twin can persist throughout the life cycle of a physical system to enable continuity of information, better communication across life-cycle stages, and continuous documentation of the physical system [9].
Commercial solutions of digital twins for manufacturing plants are commonly based on data-driven models that have been created based on data measured in the enterprises for which they are intended [10,11]. Digital twin designed in this way, based on real production data, relies on black-box models that are built to capture the relationships between production input and output parameters. These systems can also be used to obtain production forecasts or to detect certain production anomalies. We can say that such DTs require expert supervision and are therefore more difficult to expand [12]. Data-driven DT applications are fully dependent on data obtained from the process level of manufacturing control and from monitoring systems to provide information about the current state of the manufacturing process [13].
New trends in the digitization of industry have led to the development of a simulation-based digital twin (SBDT). This method uses a simulation of a first-principles model (FPM) to capture the dynamics of production. The essence of this solution is that the simulation model—first-principles model of the device—is run in parallel with the production process. Then, the dynamic model parameter estimation methods adjust the model results by comparing the measurements from the production process with the results obtained by the model, thus ensuring that the simulated state is constantly adapting to the current state of production. So, the basic FPM SBDT is continuously synchronized with the operating device. The advantage of such models is that they provide us with measured information about the production process. We can further process such data and use them in the prediction towards production, also for offline and online optimization of production. Of course, the data are also stored in data warehouses where, after processing, we can look for various knowledge that can later be used in the production process [12,13,14].
There are many articles which show some knowledge about digital twins. Carvalho and da Silva in 2021 published the systematic literature review Sustainability Requirements of Digital Twin-Based Systems [14]. DT is closely related with virtual reality like that stated in 2023 by Spyrou et al. in Virtual Reality-Based Digital Twins [15]. Some articles deal with the utilization of special algorithms for simulation models used in the DT environment [16]. Liu and Zhang in 2023 presented in their paper how to apply digital twins in the automotive industry [17]. It is really necessary to take into consideration the connection between DT and Big Data Towards Smart Manufacturing and Industry 4.0 [2].
Currently, in the process of implementing the Industry 4.0 concept, we encounter the concept of Smart Manufacturing. Smart Manufacturing represents a collaborative, fully integrated manufacturing system that responds in real time to meet the changing conditions and demands in the factory, in the supply network, and in the needs of the customers [18]. Digital twins of manufacturing applications are used in Smart Manufacturing for modeling and simulation, data analysis and optimization to ensure the optimization of such manufacturing. The abovementioned ISO 23247 standard is intended to facilitate the implementation of digital twin. The recent article of Shao from 2021 shows how the ISO 23247 standard can be implemented for different manufacturing applications [19].
2. Methodology
The first and the most important question to arise from the initial analysis of the issue presented in this paper has been the highest achievable level of data integration between the MES system and the simulation platform of choice. These entities are located on the opposing ends of the communication pipeline. The level of data formatting variance they provide, or can understand and interpret, often depends on the individual software. In this paper, we focus on proposing strategies for breaching this gap without the need of any major formatting being done by humans.
The proposed solution is focused on achieving different degrees of automation for data flow between the physical and digital entity. The solution is in accordance with the ISO 23247-1 standard and represents an approach to DT creation, which can be generalized and therefore applied to a wider variety of production systems with minor adjustments based on the requirements of the problem at hand. As every production system is different, areas that require adjustments include data acquisition methods, data processing methods, digital model (DM) adjustments and bridging interfaces. It is important to note that our solution is aimed at achieving proactivity in production; therefore, only the current status of the physical production line is needed to yield valid results. The solution discussed in this paper is proposed with the goal of making production more efficient through an adjustment and management of incoming production orders.
Manual Order Rearrangement—MOR
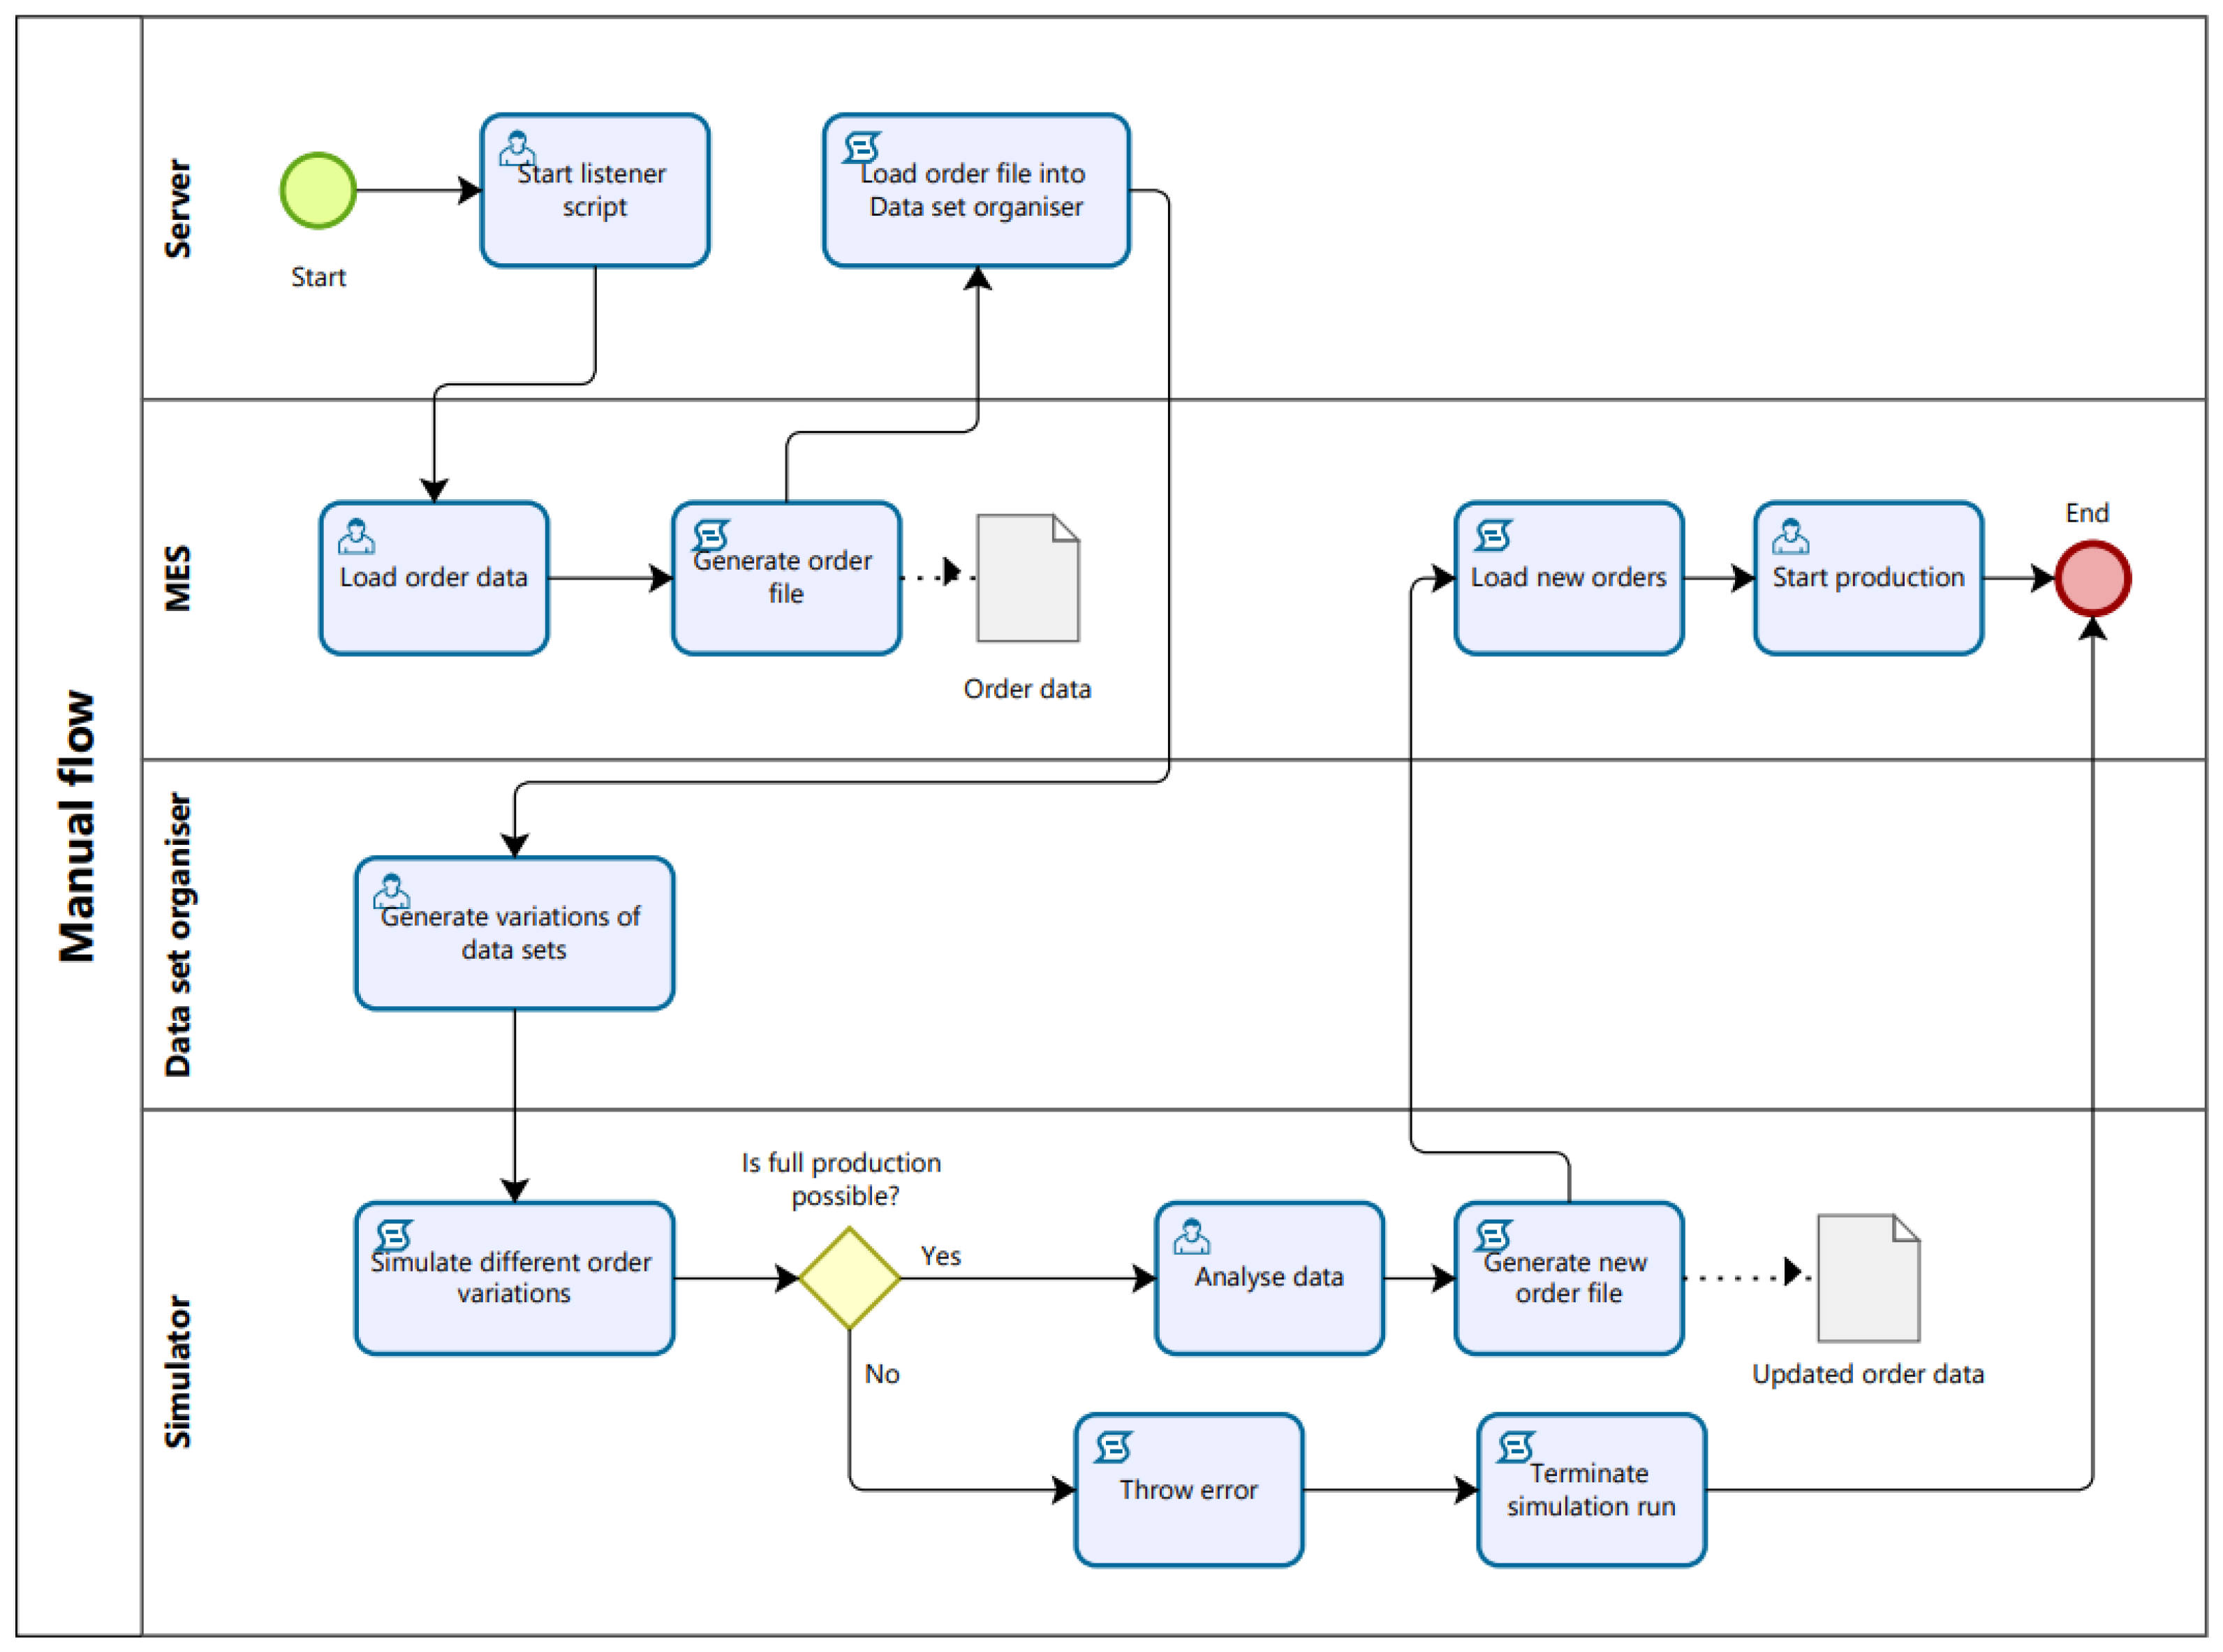
This method we proposed revolves around being partially automated with certain operations being handled by an operator through different instances of custom data processing interfaces built specifically for this method. This method can be applied to production control, provided there are three major components with at least three minor bridging interfaces between these components. The existence of an MES with a possibility of MES data access is the first requirement that needs to be met. The MES stores all the production data used for transfer between itself and the simulator of choice. Aside from storing the data, the MES also contains an interface for production order management in which an operator can load specific orders from the database and start the production process. As the production orders are loaded into MES, a file containing the order data is generated and sent to the PC for further processing and simulation. This process is handled by a custom script implemented into the MES for this specific operation, and it happens before the production starts. The second major component required for this method to work is the Order Manipulation Interface (OMI), which an operator can use to ensure that the data are interpreted correctly. It is also possible to generate a large number of variations within this software to ensure optimal simulation outcomes. As the operator has full control over data within said software, the OMI also becomes the last control point before sending all the data into the simulation process. The last major component required for this method is the production process simulator loaded with a DM of the corresponding physical production system (PPS). It is quite obvious that a fundamental condition and essence of DT and PPS connection is the ability of two-way data transfer between them. Process data are gradually loaded into the simulator in the form of production orders, which contain all the necessary data for simulation. The data provided consist of a number of products required to be made of each type as well as their arrival time into the production system. The simulator then runs all the variations provided by the operator and signals the ability or inability of the production order to be carried out fully. After the simulation ends, full statistics data are provided to the operator in addition to the simulation log containing raw simulation data for further analysis as well as order data preformatted for import into MES. Afterwards, the simulation data are analyzed in detail, and the best outcome is chosen and imported into the MES for production. MES loads the new simulated order and displays a prompt to the operator, who can then decide to start the production process.
The key to achieving proactivity in production using the MOR method is that all the simulation runs must be completed before the production is started (Figure 2).
It is also important to note that a simulation run is considered a success if all the inputted production orders have been fulfilled while none of the alarms have been set off during the simulation run. The alarms include a lack of resources in any of the tanks inside the model, an insufficient number of bottles for filling and predicted machine breakdowns. If any of the alarms are set off during the simulation or the model did not finish all of the orders within the preset amount of time, an appropriate message is displayed to the operator, and the simulation run is terminated.
3. Building a Digital Model
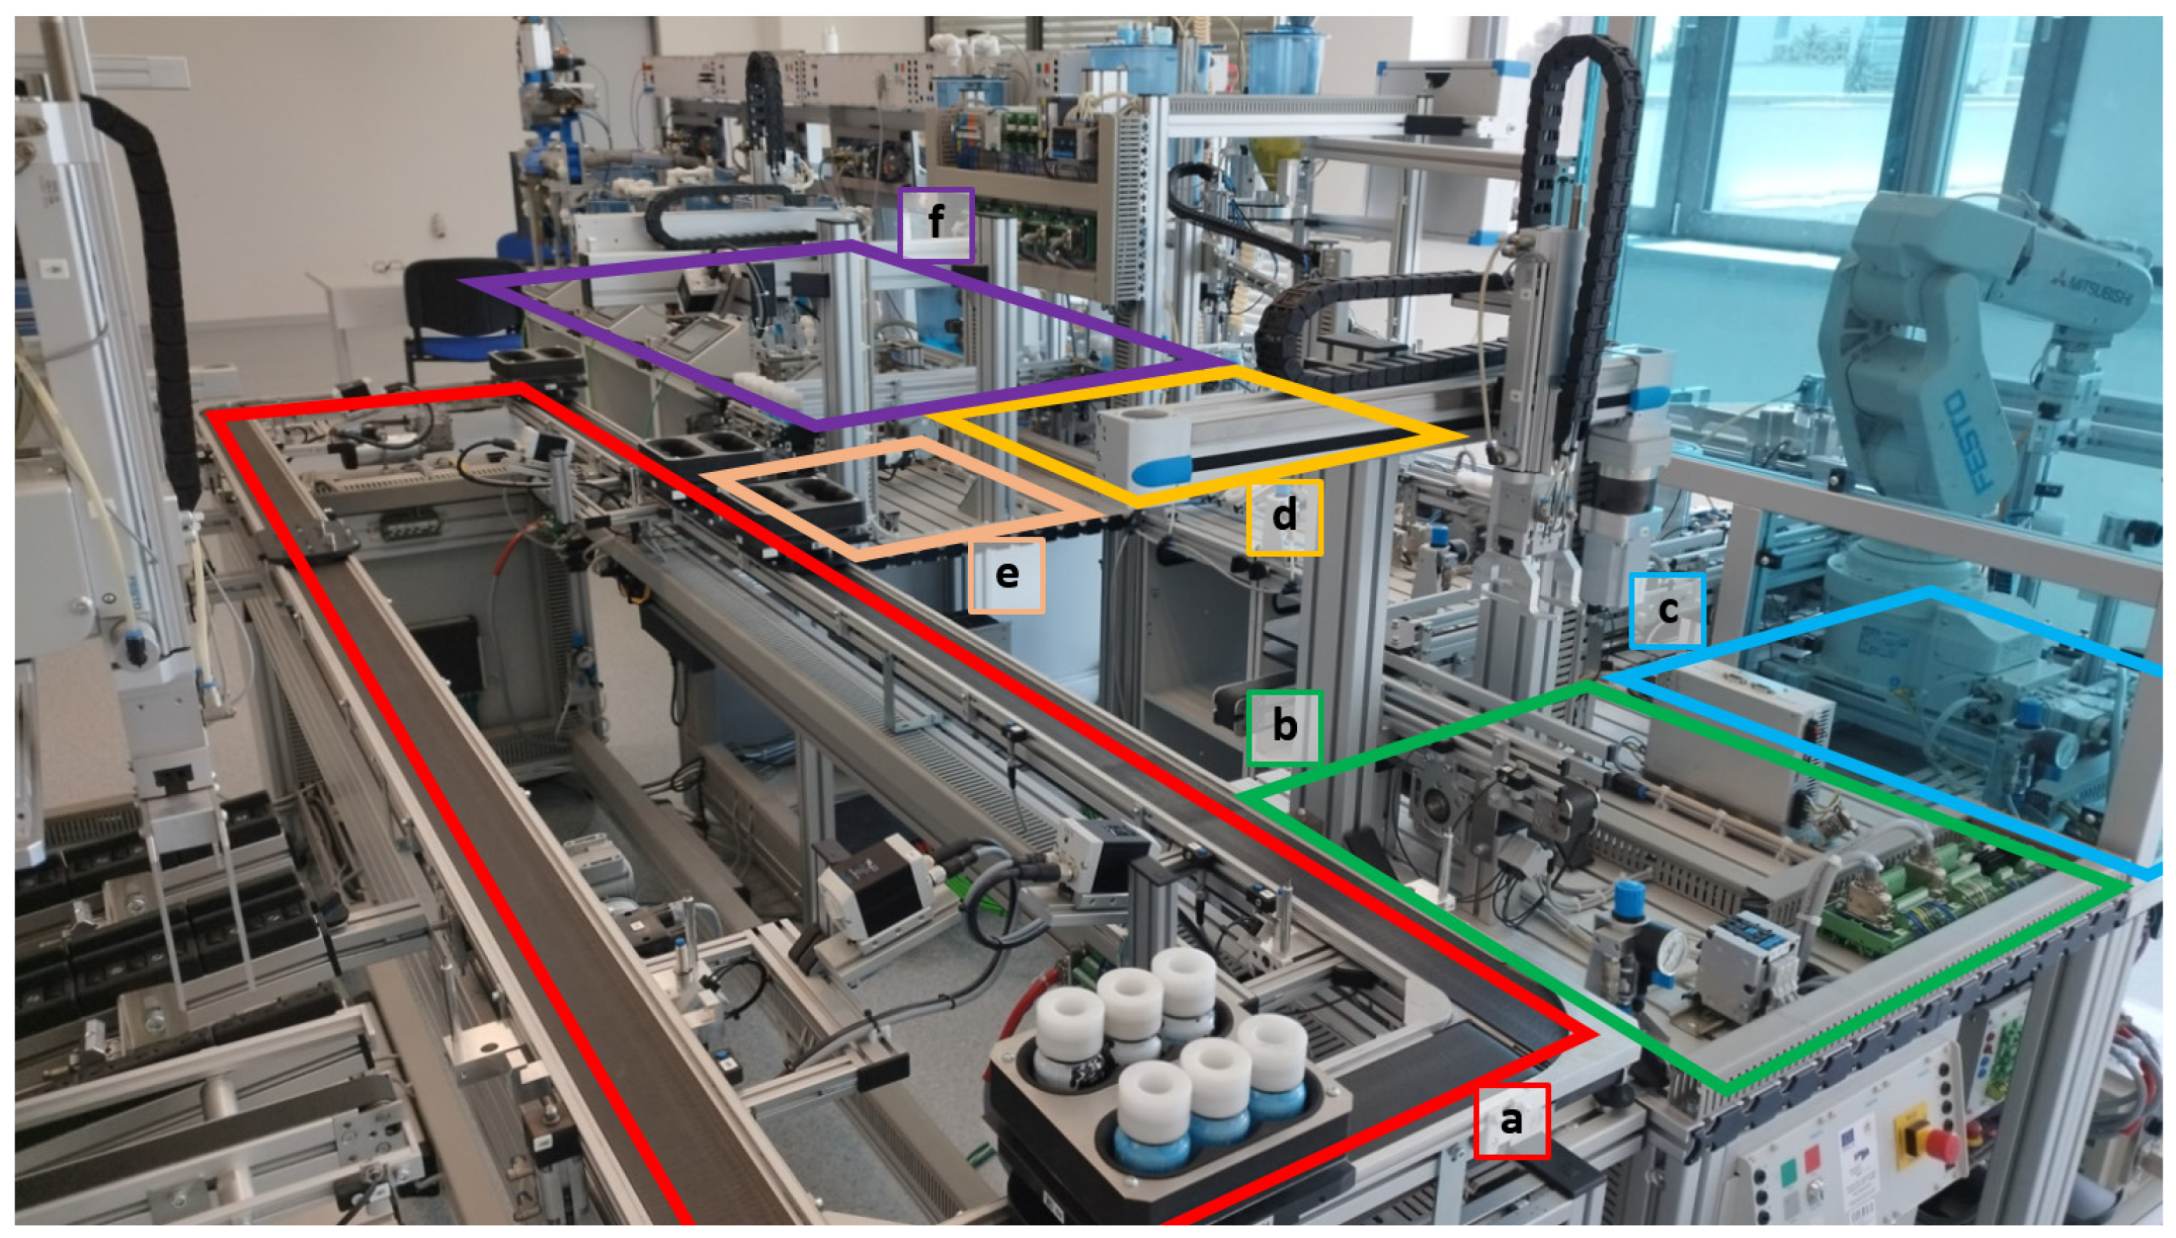
The DM used for these methods is fundamentally identical, barring the differences in input data processing, which are described further in this section. The DM contains various abstractions and substitutions for real-world processes while providing functionally identical results. The substitution of production processes allows the creation of different variations within individual machine tasks without the necessity to remove or add an entire workstation. The digital model is represented by a complex simulation model of a physical production system located in the Laboratory of Control Systems—Agro, Food & Beverage Factory (AFB Factory) by FESTO (Figure 3).
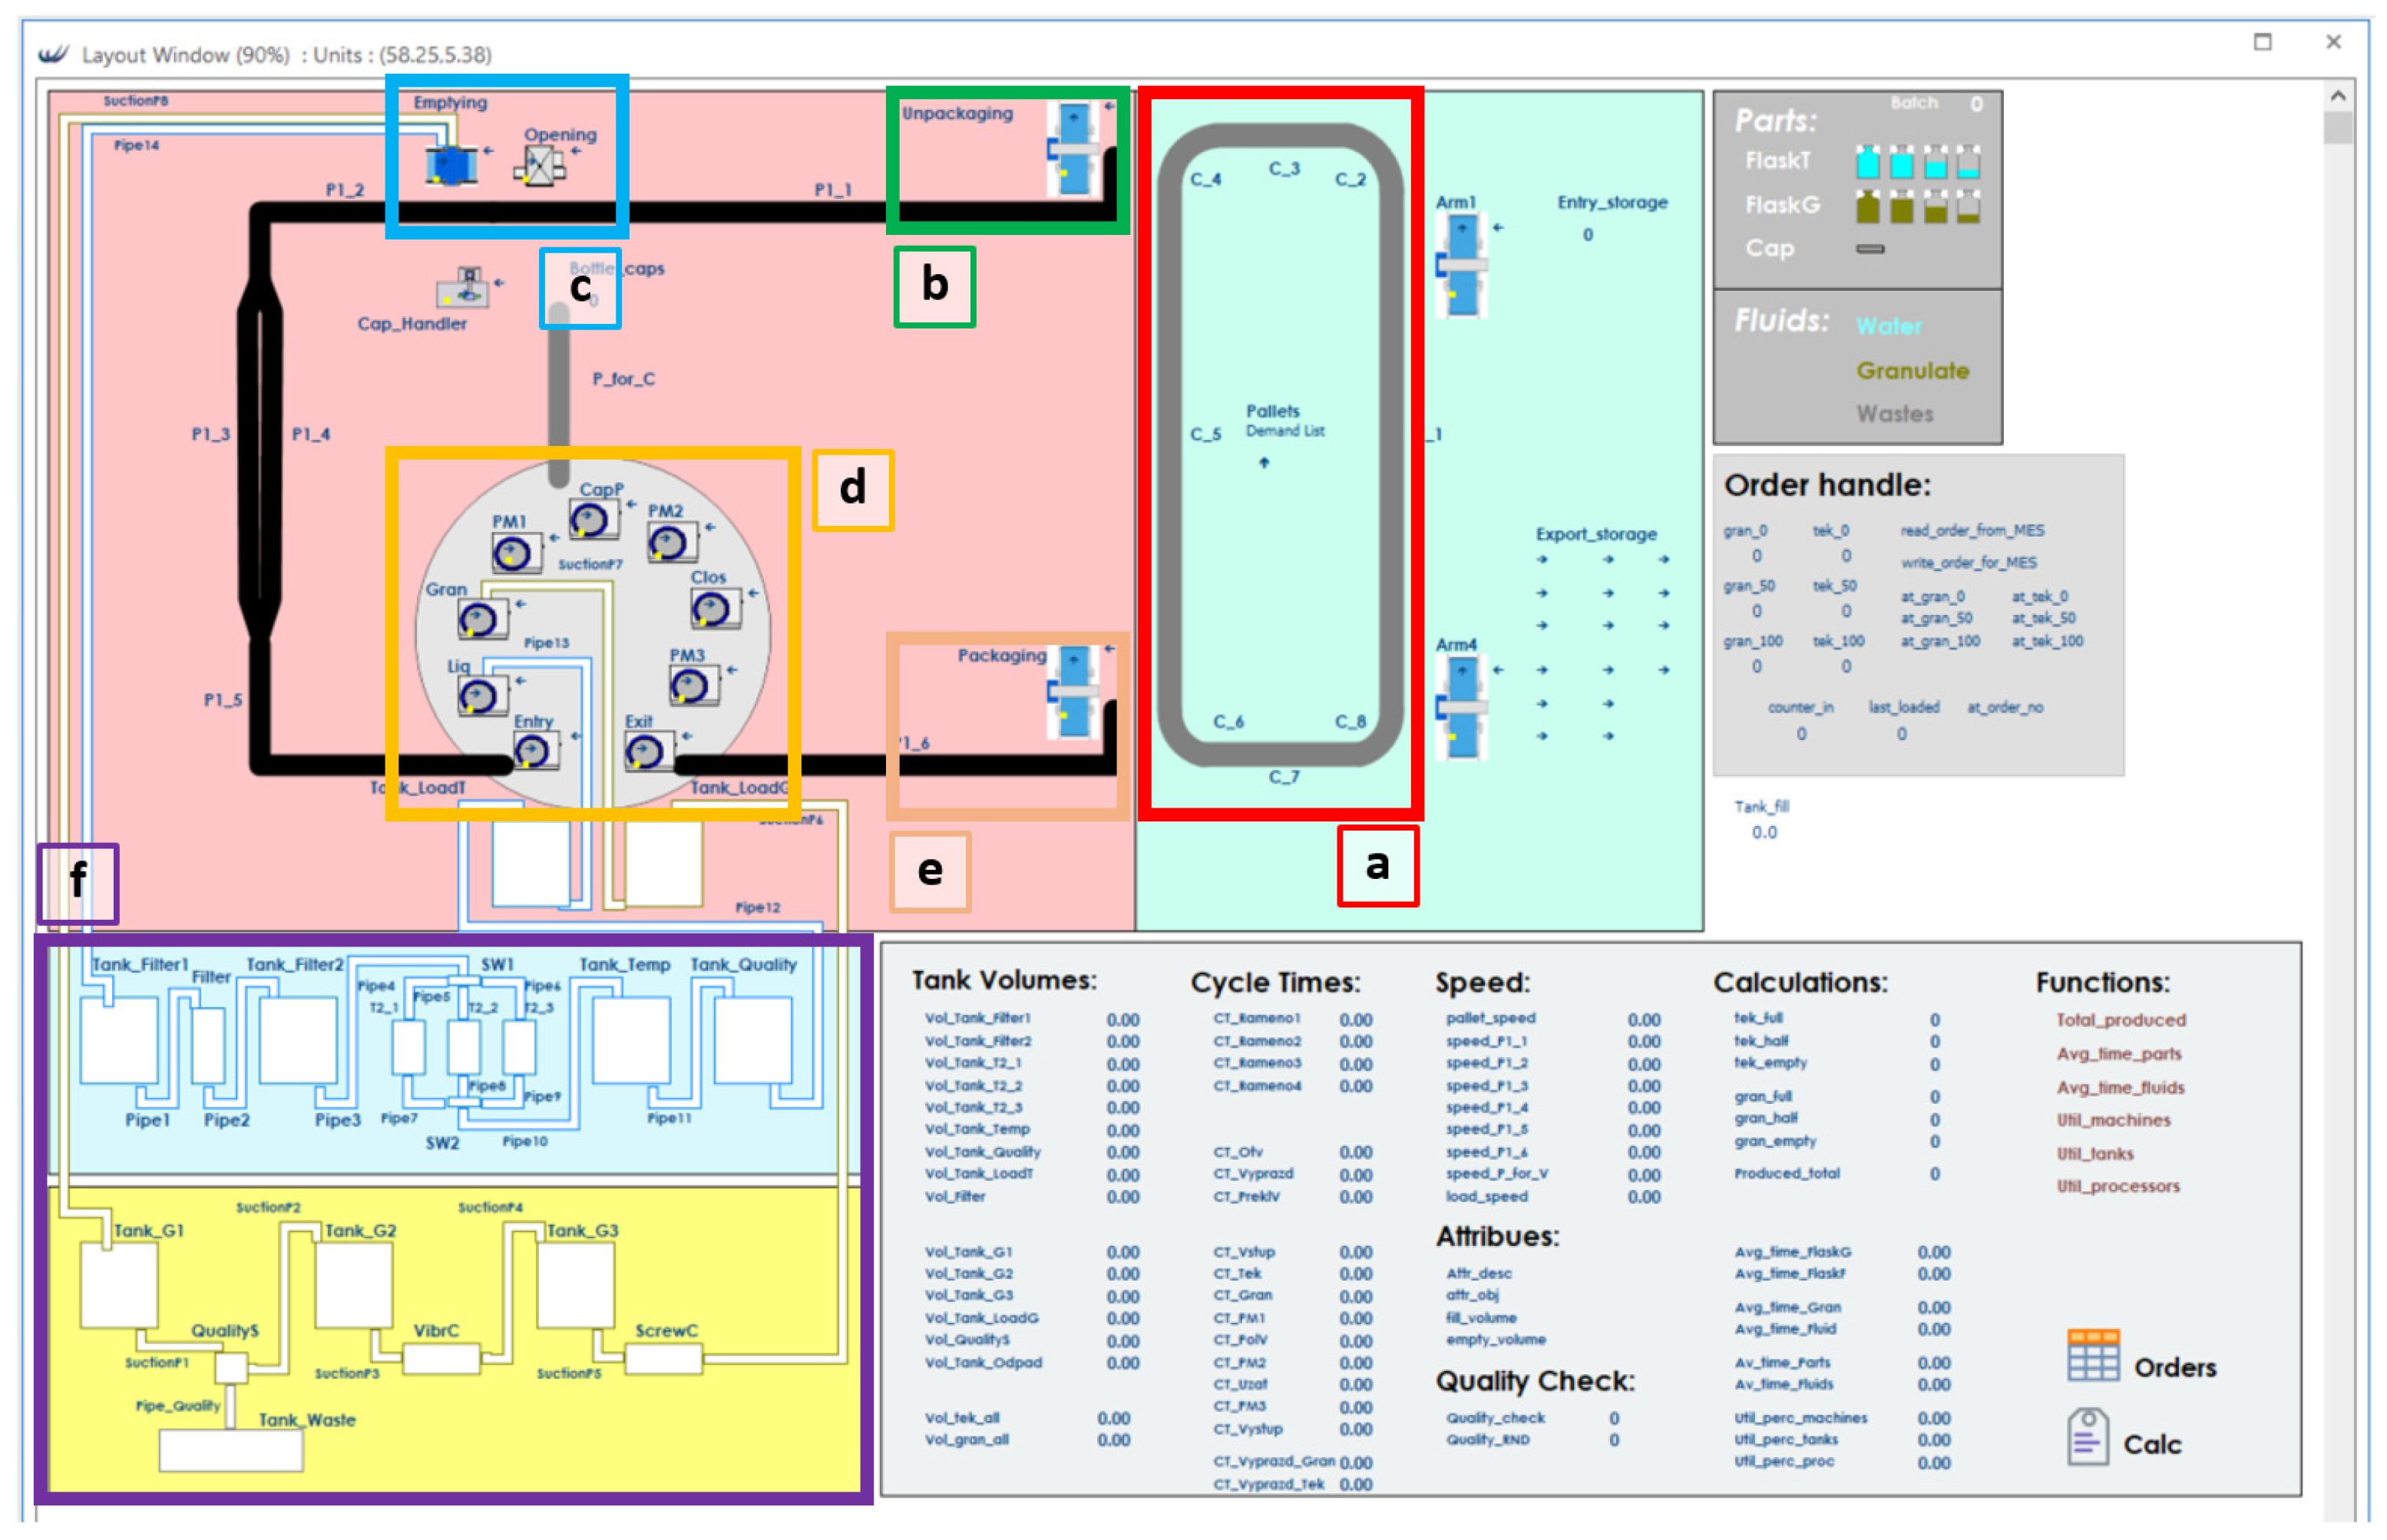
The simulation model, shown in Figure 4, was created in the WITNESS Horizon simulation platform and realistically reflects the entire closed hybrid production process provided by this automated production line.
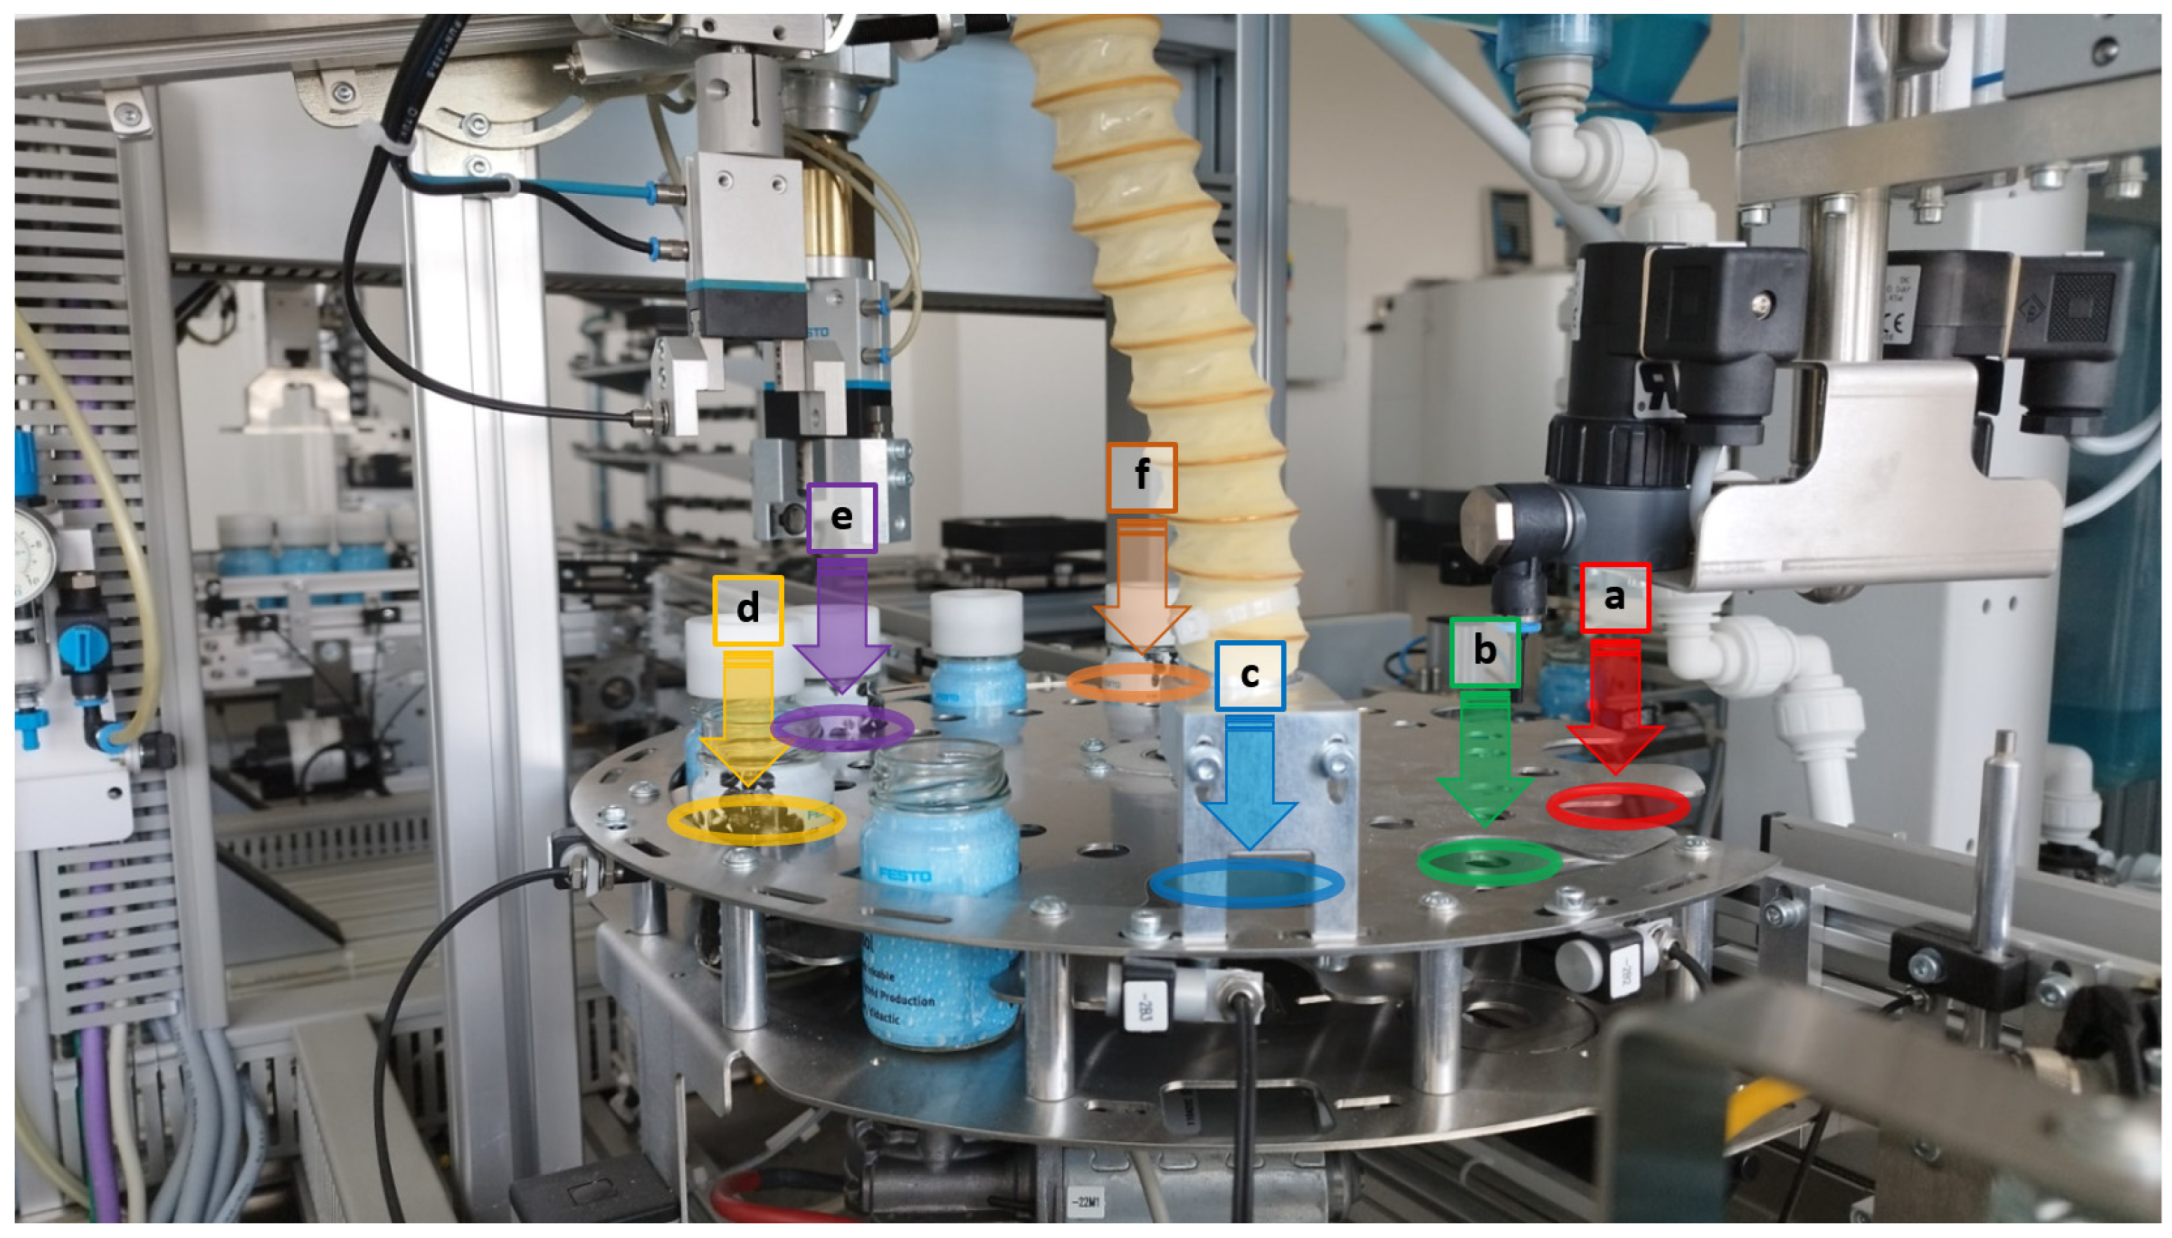
The model consists of two major parts. The first part is a discrete production model which is in accordance with the ISO 23247-1 standard, simulating the handling process for bottles filled with liquid or solid material. This section of the model contains bottle handling machines along with a transport system for moving the products between these machines. The best showcase for a substitution used in this section is the bottle filling machine, which is a single workstation in the physical production system—Filling Station of AFB Factory, and this filling workplace is shown in Figure 5.
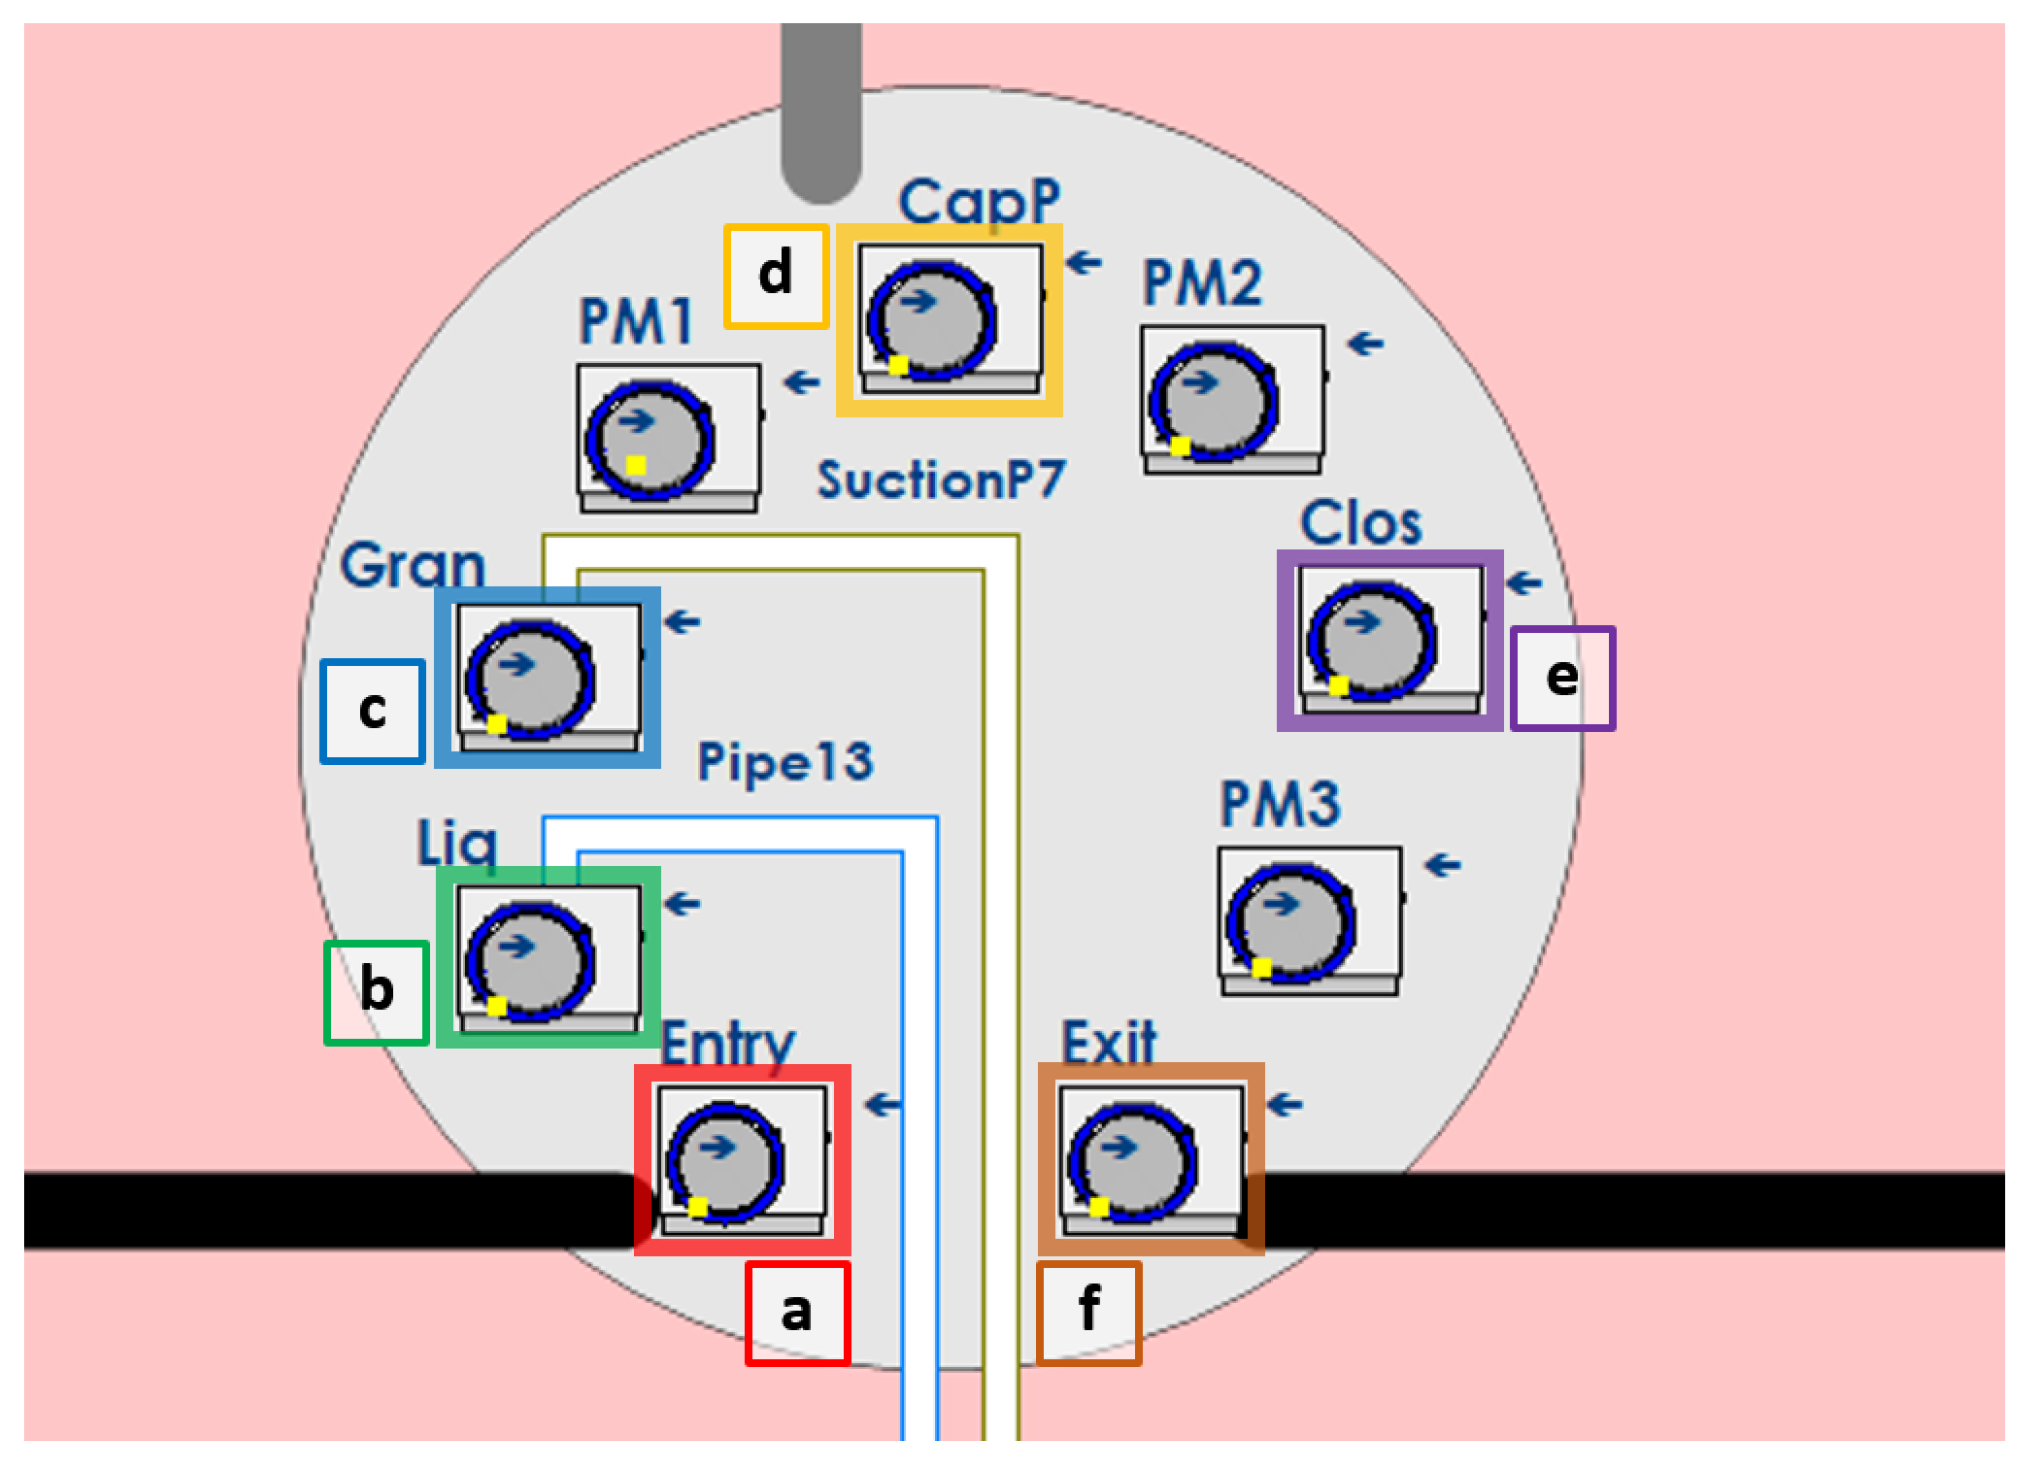
The workplace, physically realized as a rotating table supplemented by multiple industrial manipulators, is in digital form realized as a series of individual workstations, each representing a singular task carried out by this machine (Figure 6).
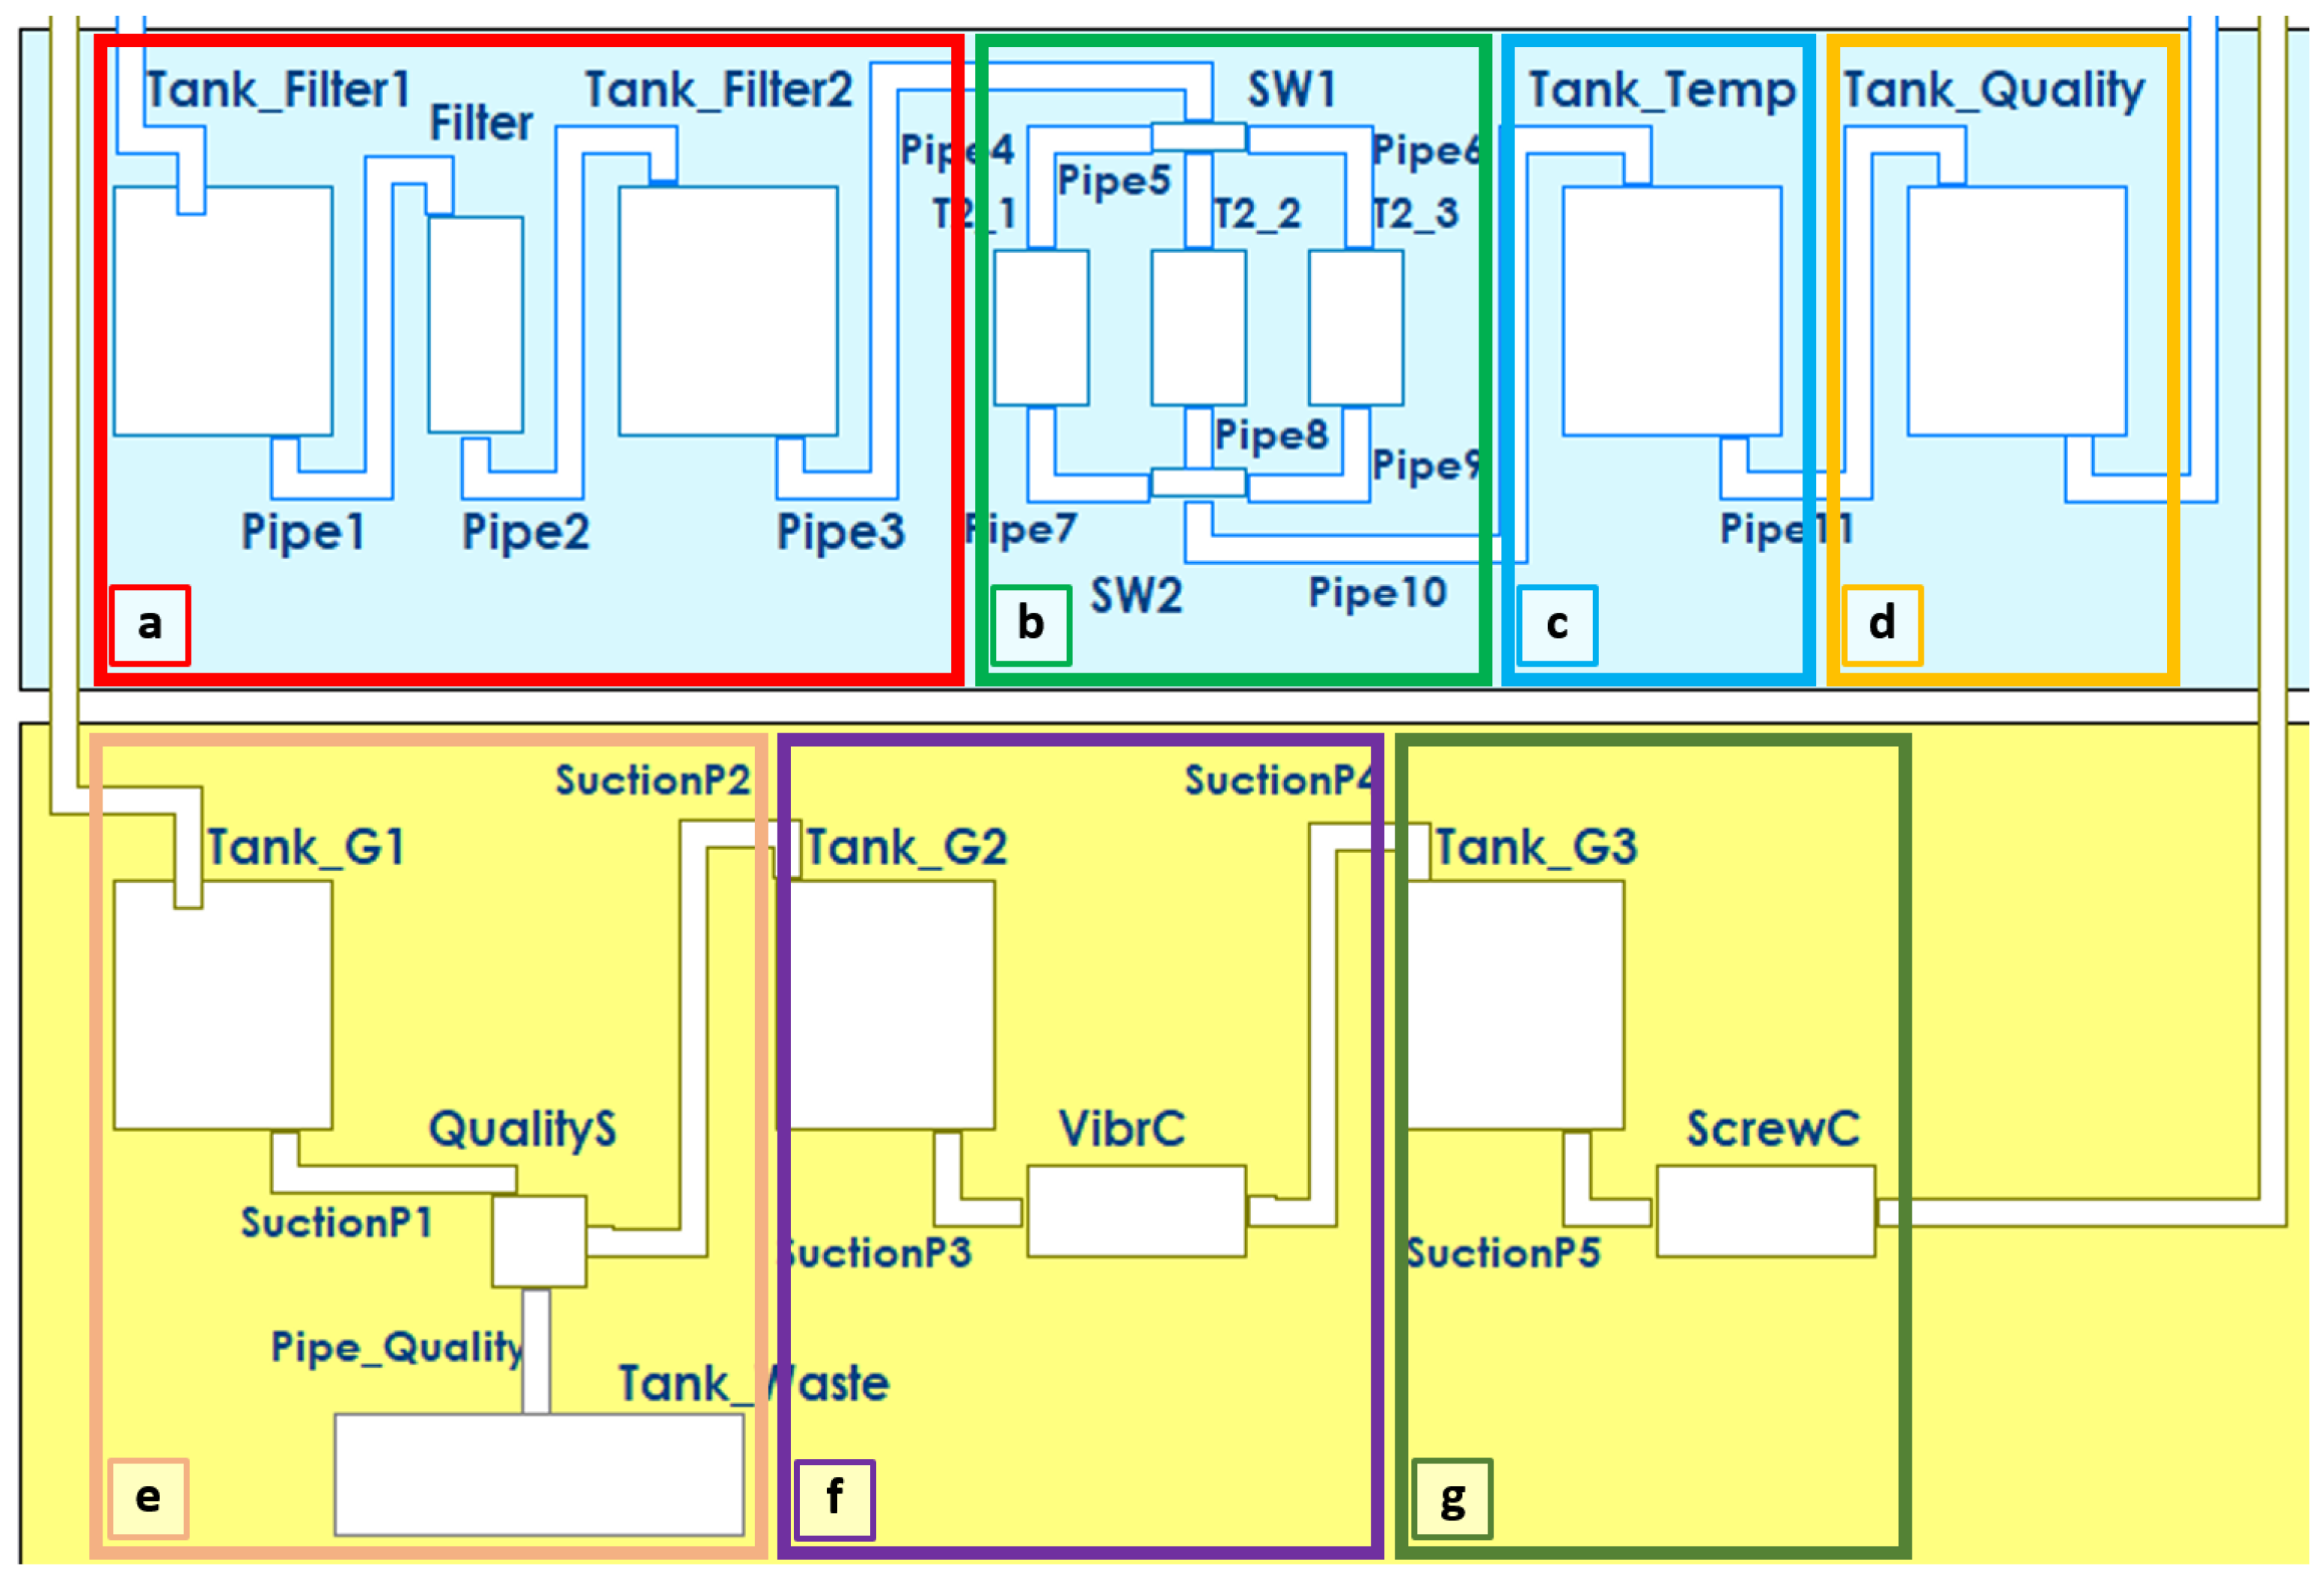
The other part of the model is a production preprocessing section which follows the ISO 15926-14 standard [20] for liquid handling with adjustments made for the specific PPS at our disposal. This section consists of two separate process lines.
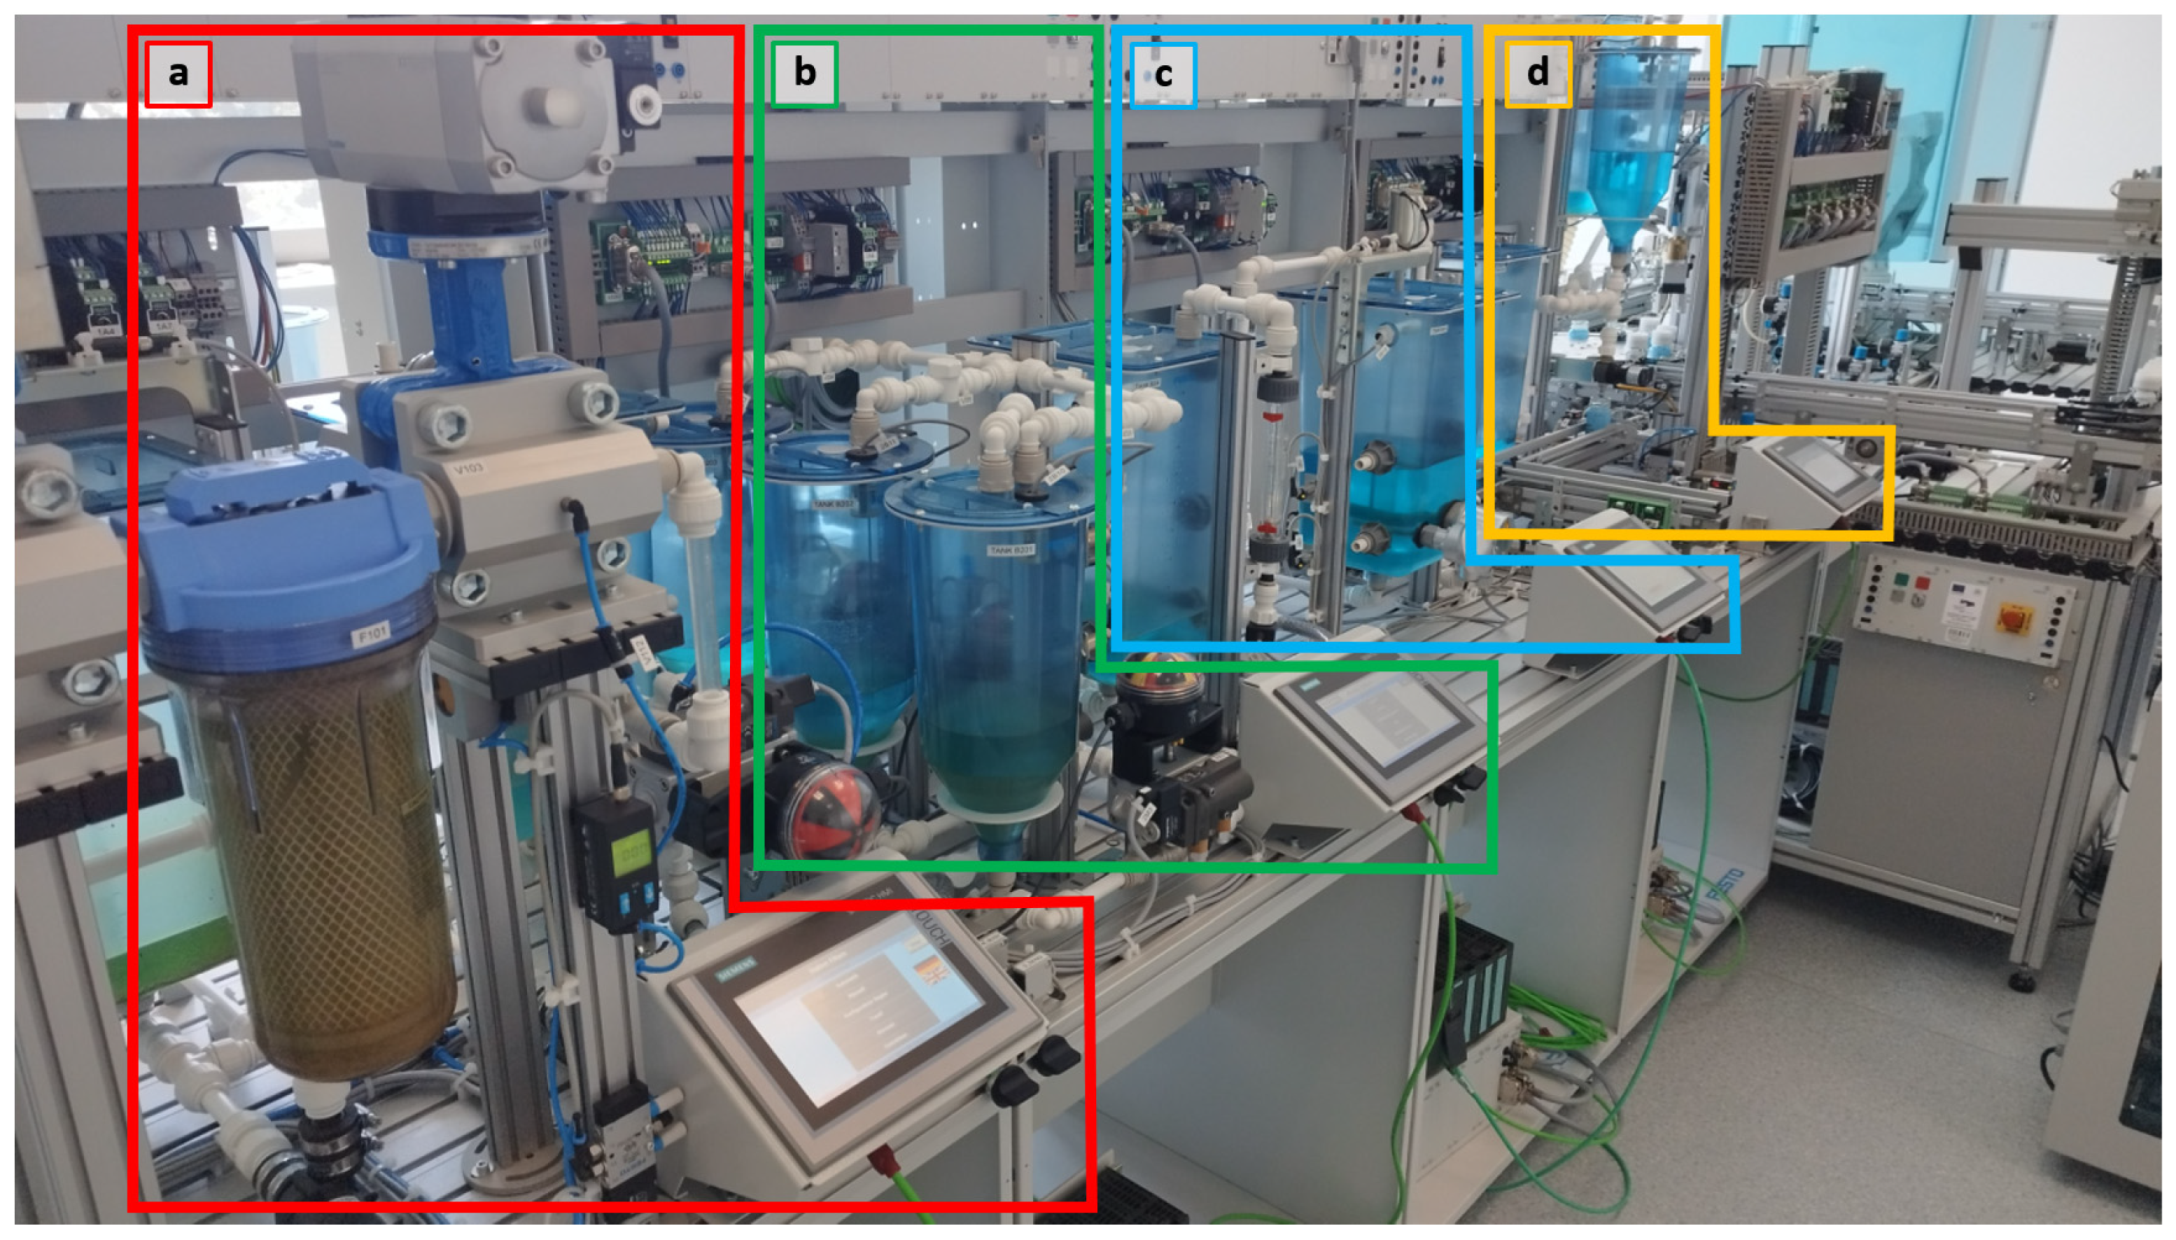
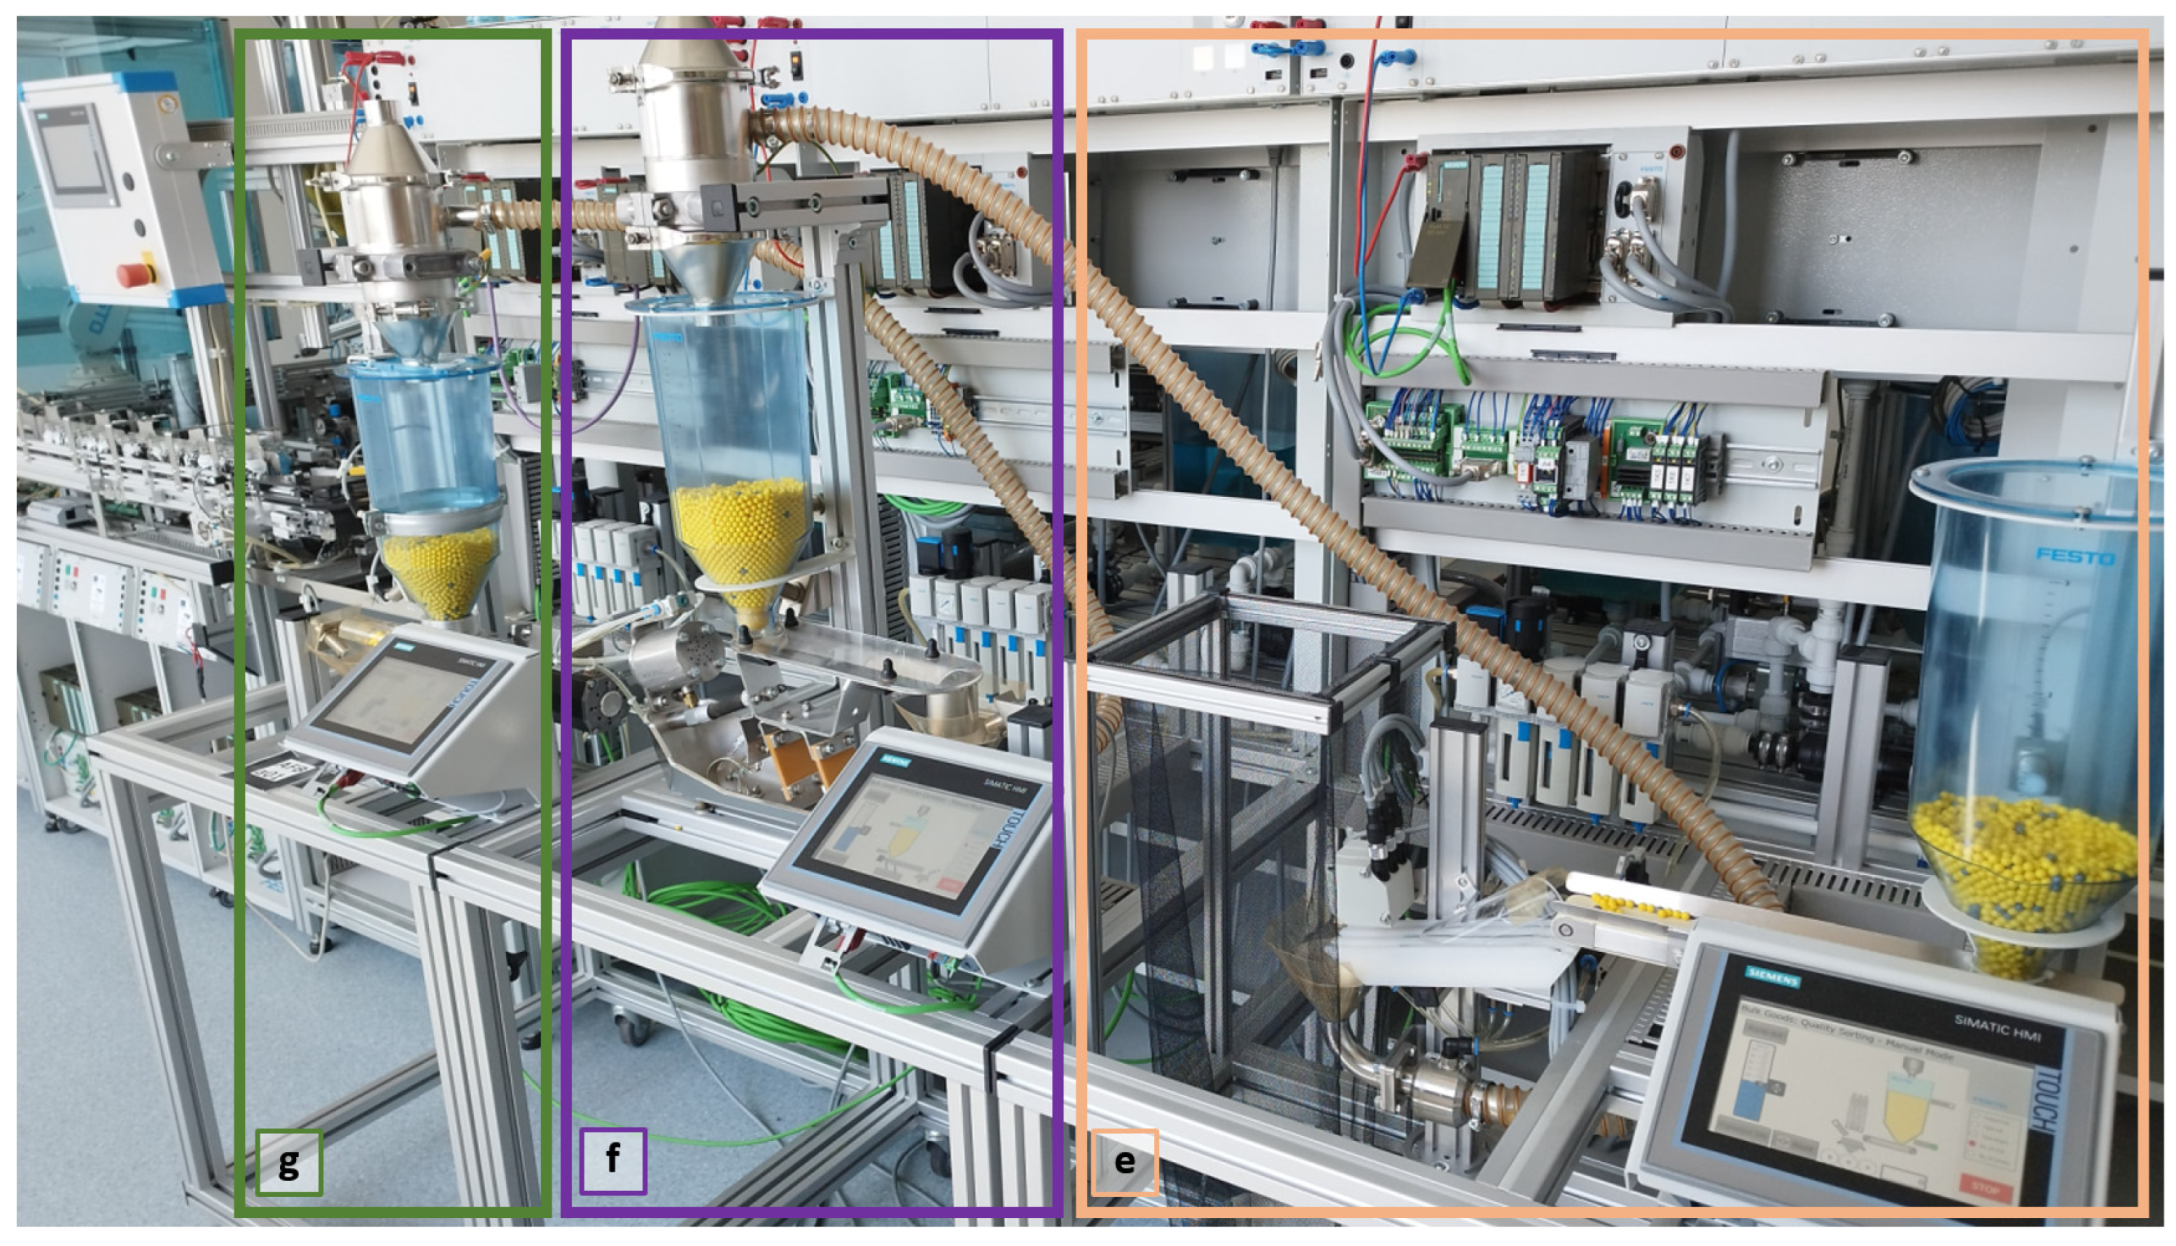
The blue process line in Figure 7 is a model of a liquid material filtration, mixing, heating and quality check process with various tanks and processing units connected by a series of pipelines (Figure 8).
The yellow process line in Figure 7 handles granulate material by filtering pieces of inappropriate size and quality (Figure 9). Both of these process lines feed liquid and solid material into the Filling Station in the main production process (Figure 5).
Data Integration between the MES and the Simulator
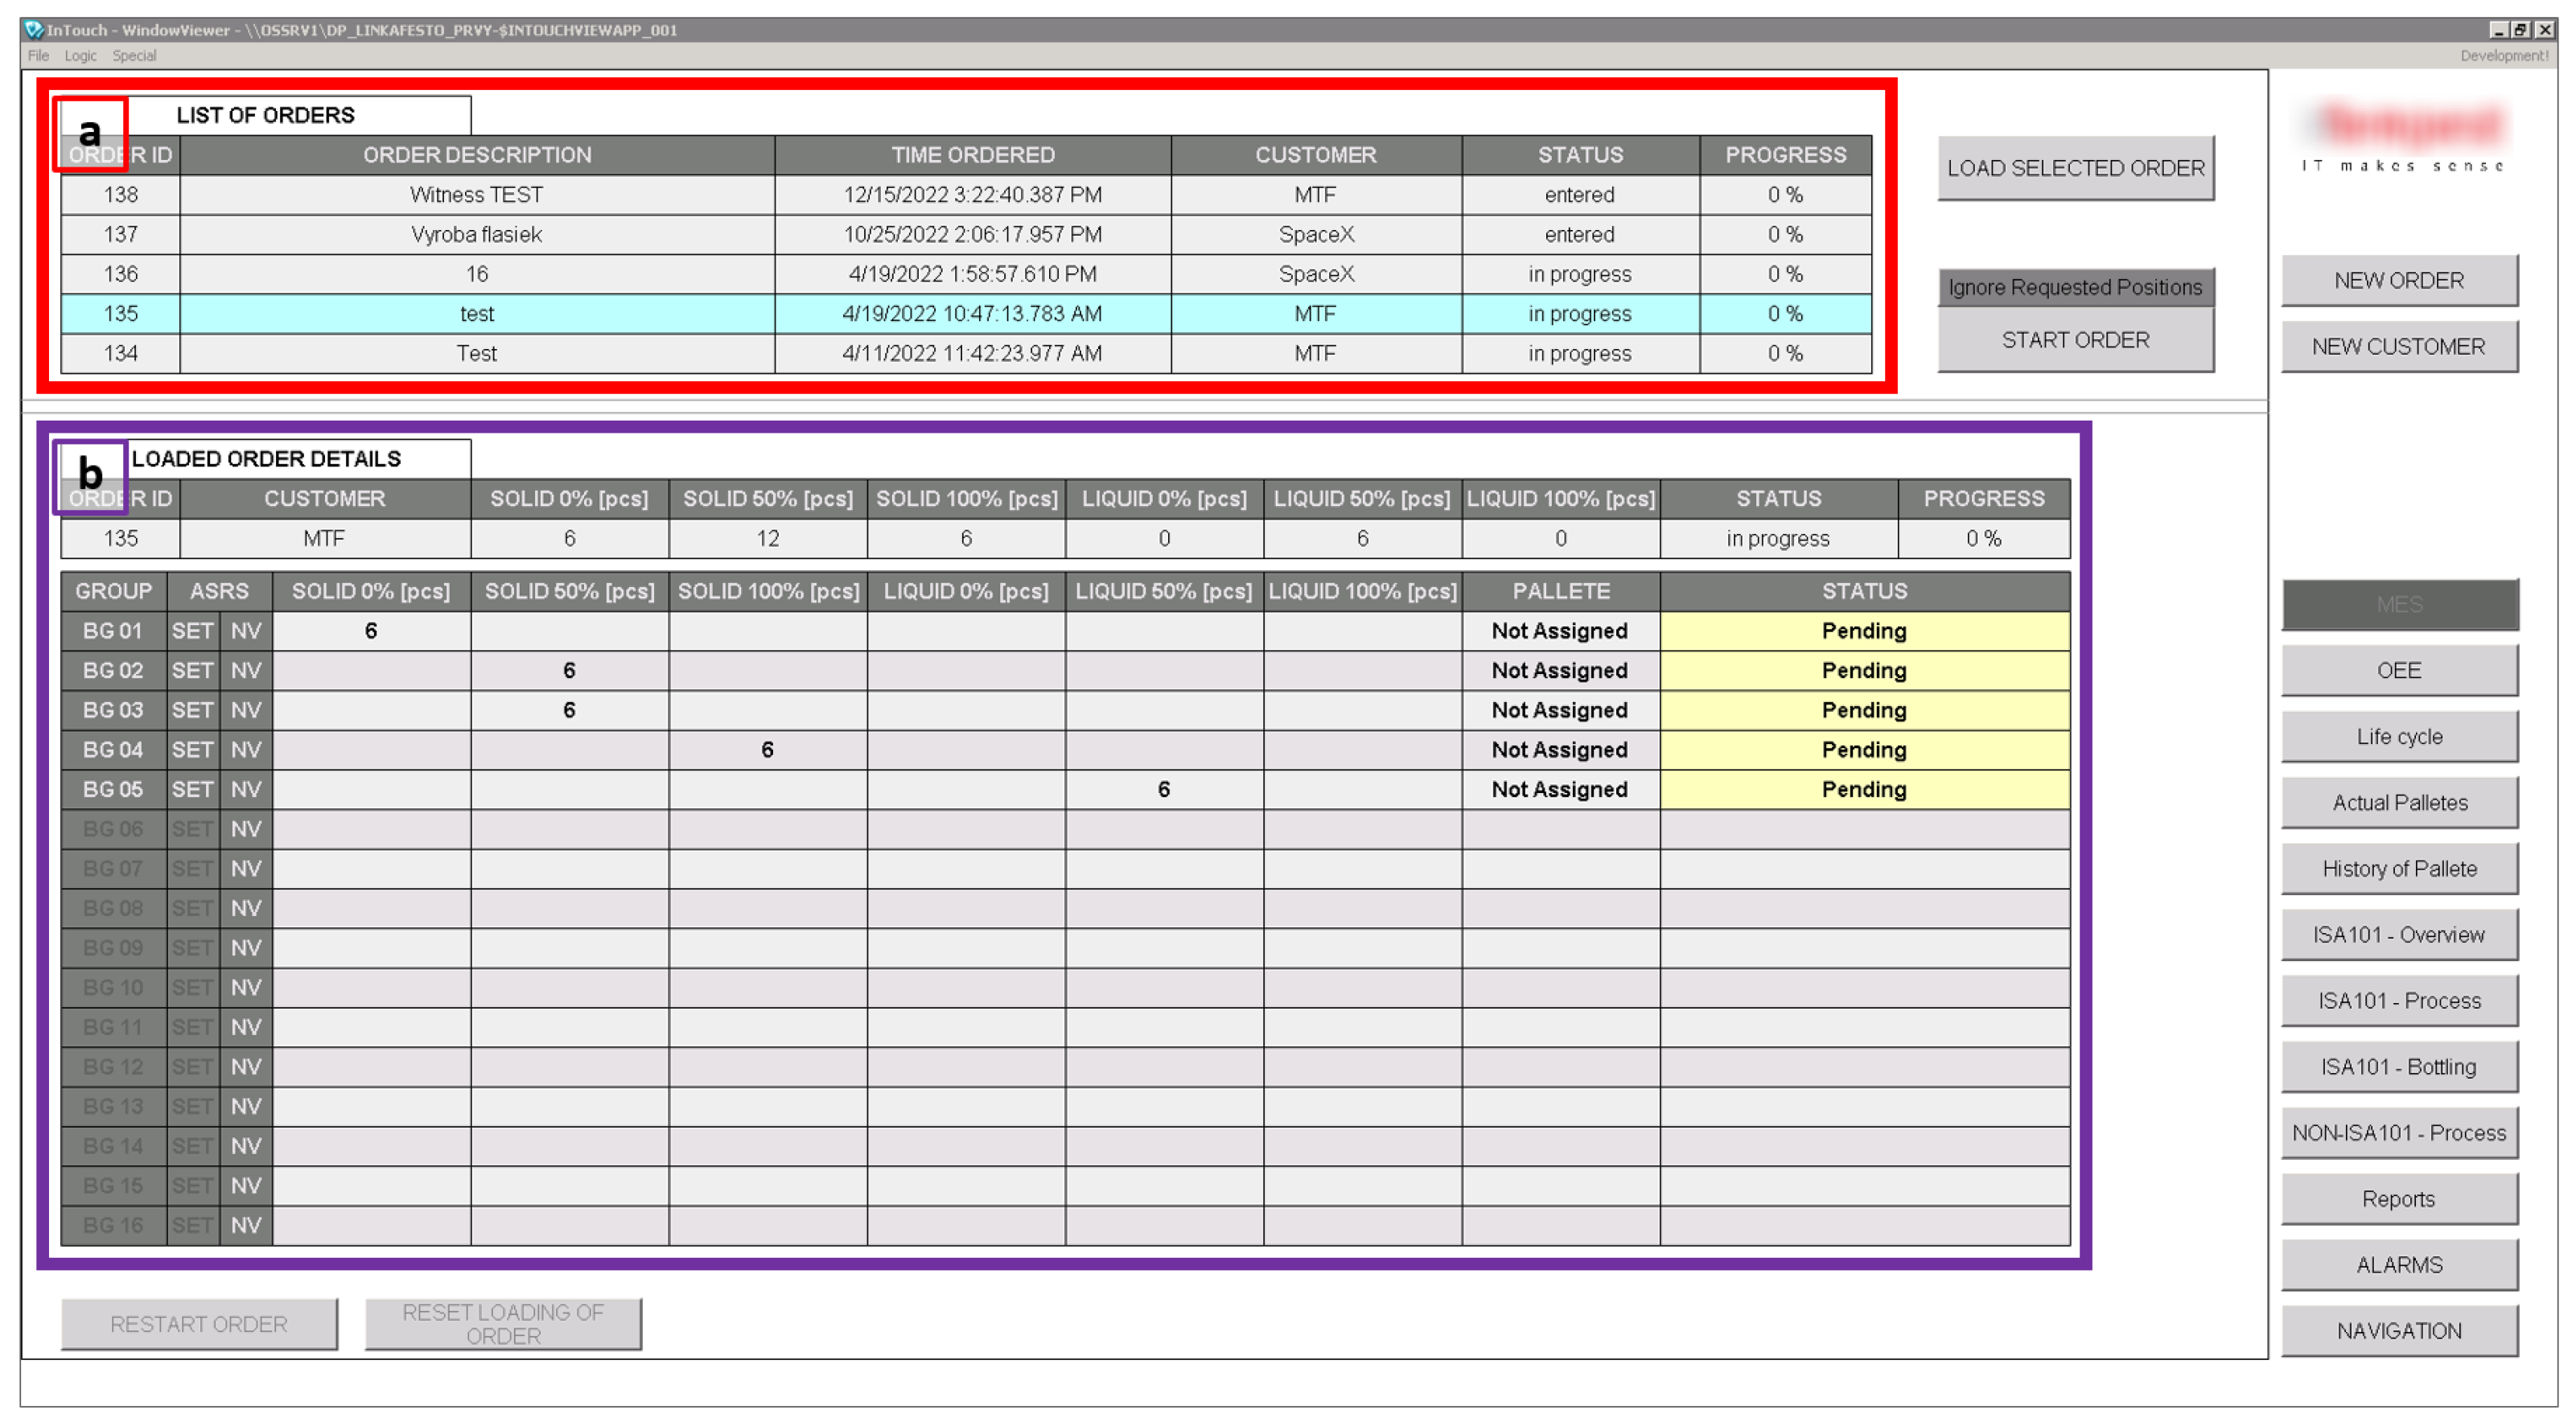
The production line AFB Factory allows to be controlled in two ways—autonomous mode, where production orders (required number of six-packs, number of bottles with liquid/solid material in each six-pack, amount of liquid/solid material in each bottle) are processed by the Filling Station control system (PLC), or in external mode, where the production orders are processed by the MES. In this case study, the external mode of production line control is used. All production orders are processed by the MES created in the AVEVA InTouch environment, which GUI is shown in Figure 10.
When it comes to data exchange between two systems, data integration is the first question that stands out almost immediately. For this problem, we proposed a method that simplifies the data format to a level which is accepted by both systems. Both MES (Figure 10) and the simulator are able to extract and read data from text or CSV files, with data being converted to numeric values, and depending on their position within their respective rows or columns, these values are interpreted accordingly.
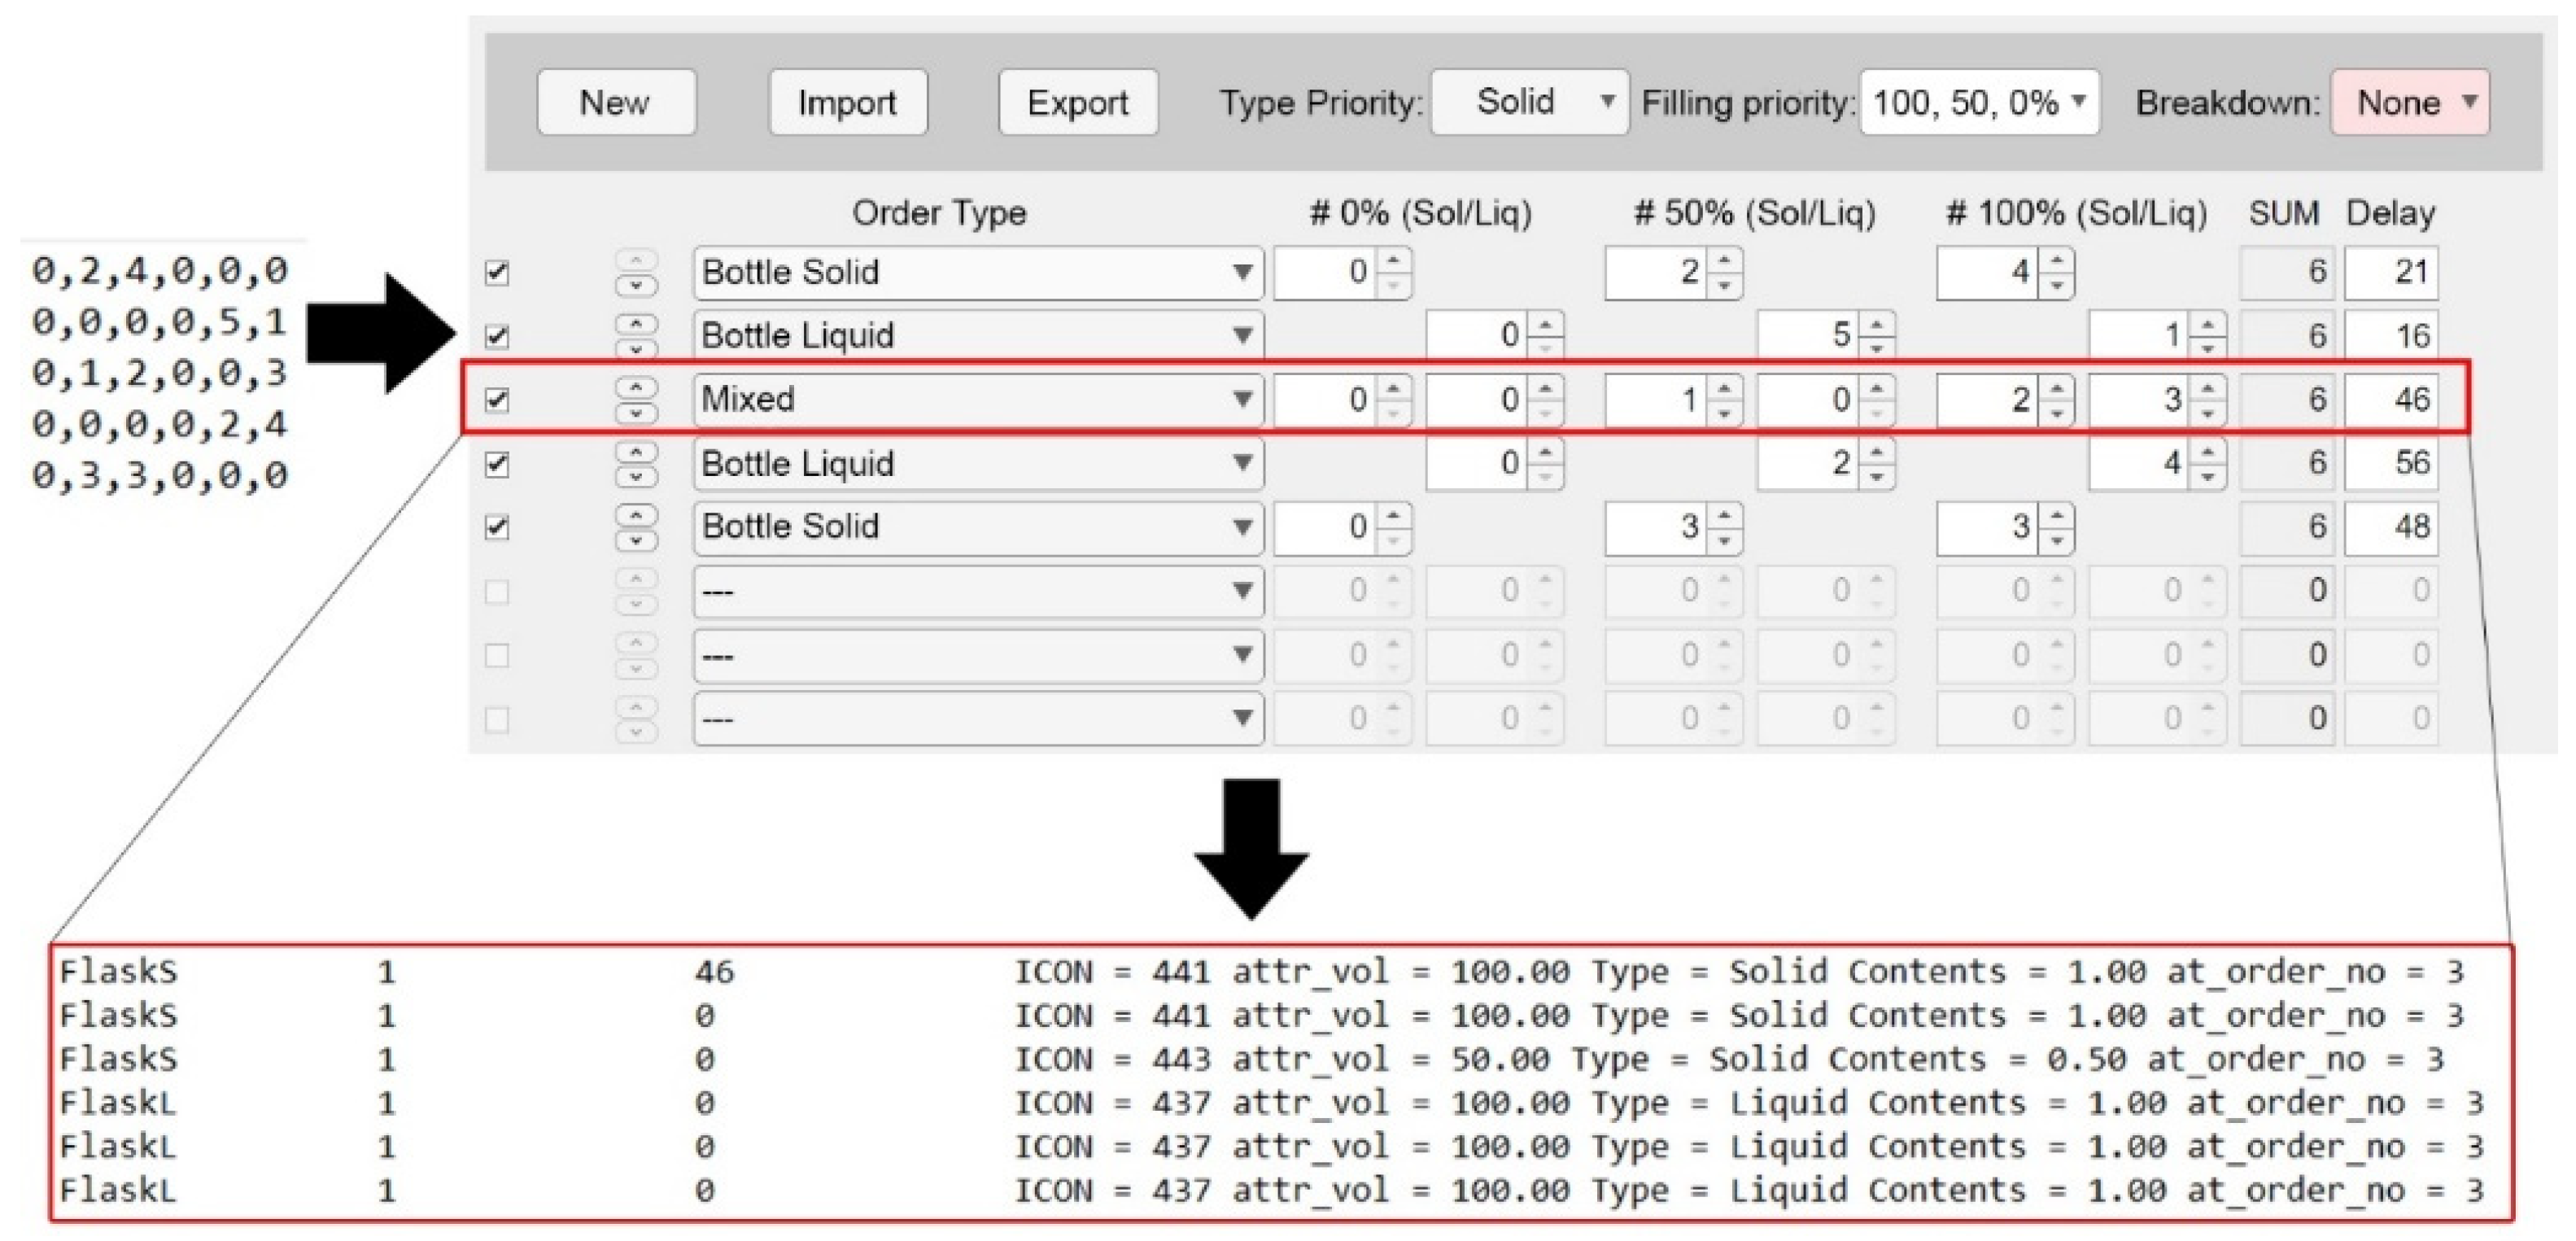
To ensure that these files are being shared within the system properly, it is important to establish and maintain a stable connection between the communicating entities. Our solution to this problem was to have both MES and the simulation platform on the same local network. Having the two platforms connected locally, it is possible to carry out the communication using interfaces from either of the methods mentioned in this section. The operator can access the data stored on the MES server or simulation platform using a remote desktop protocol (RDP) from the user PC. As all the files being shared and accessed by both entities are located in one of the shared folders on the local network, it is possible to run custom maintenance scripts in the background which monitor their creation and dispose of the unnecessary files. The data transformation and formatting were carried out by custom OMI application created in MATLAB as a MATLAB App. The custom OMI GUI interface and data format during the order transformation are shown in Figure 11.
4. Experiments and Results
As proof of our concepts, we decided to run a case study with the proposed MOR method and use it as a starting point for the AOR method in the future research and development. With the goal of simulating multiple different scenarios without the need of manipulating resources in the physical production system, we have emulated and used different status data for storage tanks alongside the initial data gathered from the PPS. Using emulated data has granted us an access to a multitude of different scenarios, which would have otherwise required long periods of time for setting up a PPS for the specific scenario. Monitoring the flow of data from the MES to the simulator and back to the MES has been set as a main goal of this case study. During the case study, we decided to focus on two important parameters of the entire process, the first one being the time it takes for the process of order reorganization and the immediate simulation to finish, and the second one being the ability to finish the production order successfully. The two selected parameters are also the key points of future optimization with the AOR method mentioned in this paper.
The first optimization parameter could formally be defined as
where:
X—full length of the simulation process including the use of OMI and data transfer between the interfaces and the simulator (in seconds);
N—number of orders;
O—time required for specifying singular order (in seconds);
e—human error (in seconds);
T—time required to transfer the order data between MES, interfaces and the simulator (in seconds);
sim—length of a simulation run (in seconds).
When taking the second parameter into consideration, it is binary in nature, but during a simulation run there are factors which influence its state, such as volume of resources remaining in the resource tanks. During the initiation process, we could define it as is shown in Box 1.
Box 1. Pseudocode of the parameter—an ability to finish the production order successfully
V1 = Volume_tank1 + Volume_tank2 + Volume_tank3 + Volume_MainTank
V2 = resources_in_pipes
R = requested_resources
if V1 > R OR V1 > R × 0.85 AND V2 > R × 0.15
Production = true;
else
Production = false;
end if
Our analysis of the production system has shown that the minimum amount of resources available in the storage tanks has to be higher than 85% of the resources requested in the production order, while the remaining 15% can be covered by the resources located in the pipelines of the production system. These values are reflected in the IF statement above.
The volume of resources in tanks is dynamically monitored during the simulation process. If at any point the volume of resources in the main tank reaches a sub 5% level, the simulation run is aborted, and an error is thrown.
After inputting the production orders in the MES, a text file containing the order data is created and loaded into the OMI. All the required order simulation attributes, such as content type, volume, number and real-time delay for every incoming order can be adjusted in the OMI, and every variation can be exported into an individual file. At export, the OMI offers an option to automatically run a simulation with preloaded resource and tank status data in the model. All the simulation data are logged into a file for postsimulation analysis. If the simulation process runs successfully, an export file is created which is then automatically loaded into the MES, and the production orders are updated within the order interface.
During the thorough testing phase of our proposed method, we carried out 4 experiments, while each of these individual sets were focused on a different aspect of the production process at hand. All the proposed experiments and their iterations have had a production requirement of 15 pallets with 6 products each, unless stated otherwise. The results of all the following experiments have been compared with the results from the existing physical system and have shown upwards of 97% match between the systems. The minor discrepancies between the results have been caused mainly by a human error while operating the physical production system among other smaller scale effects, such as multiple simultaneous processes running on the PC and others.
4.1. Experiment A
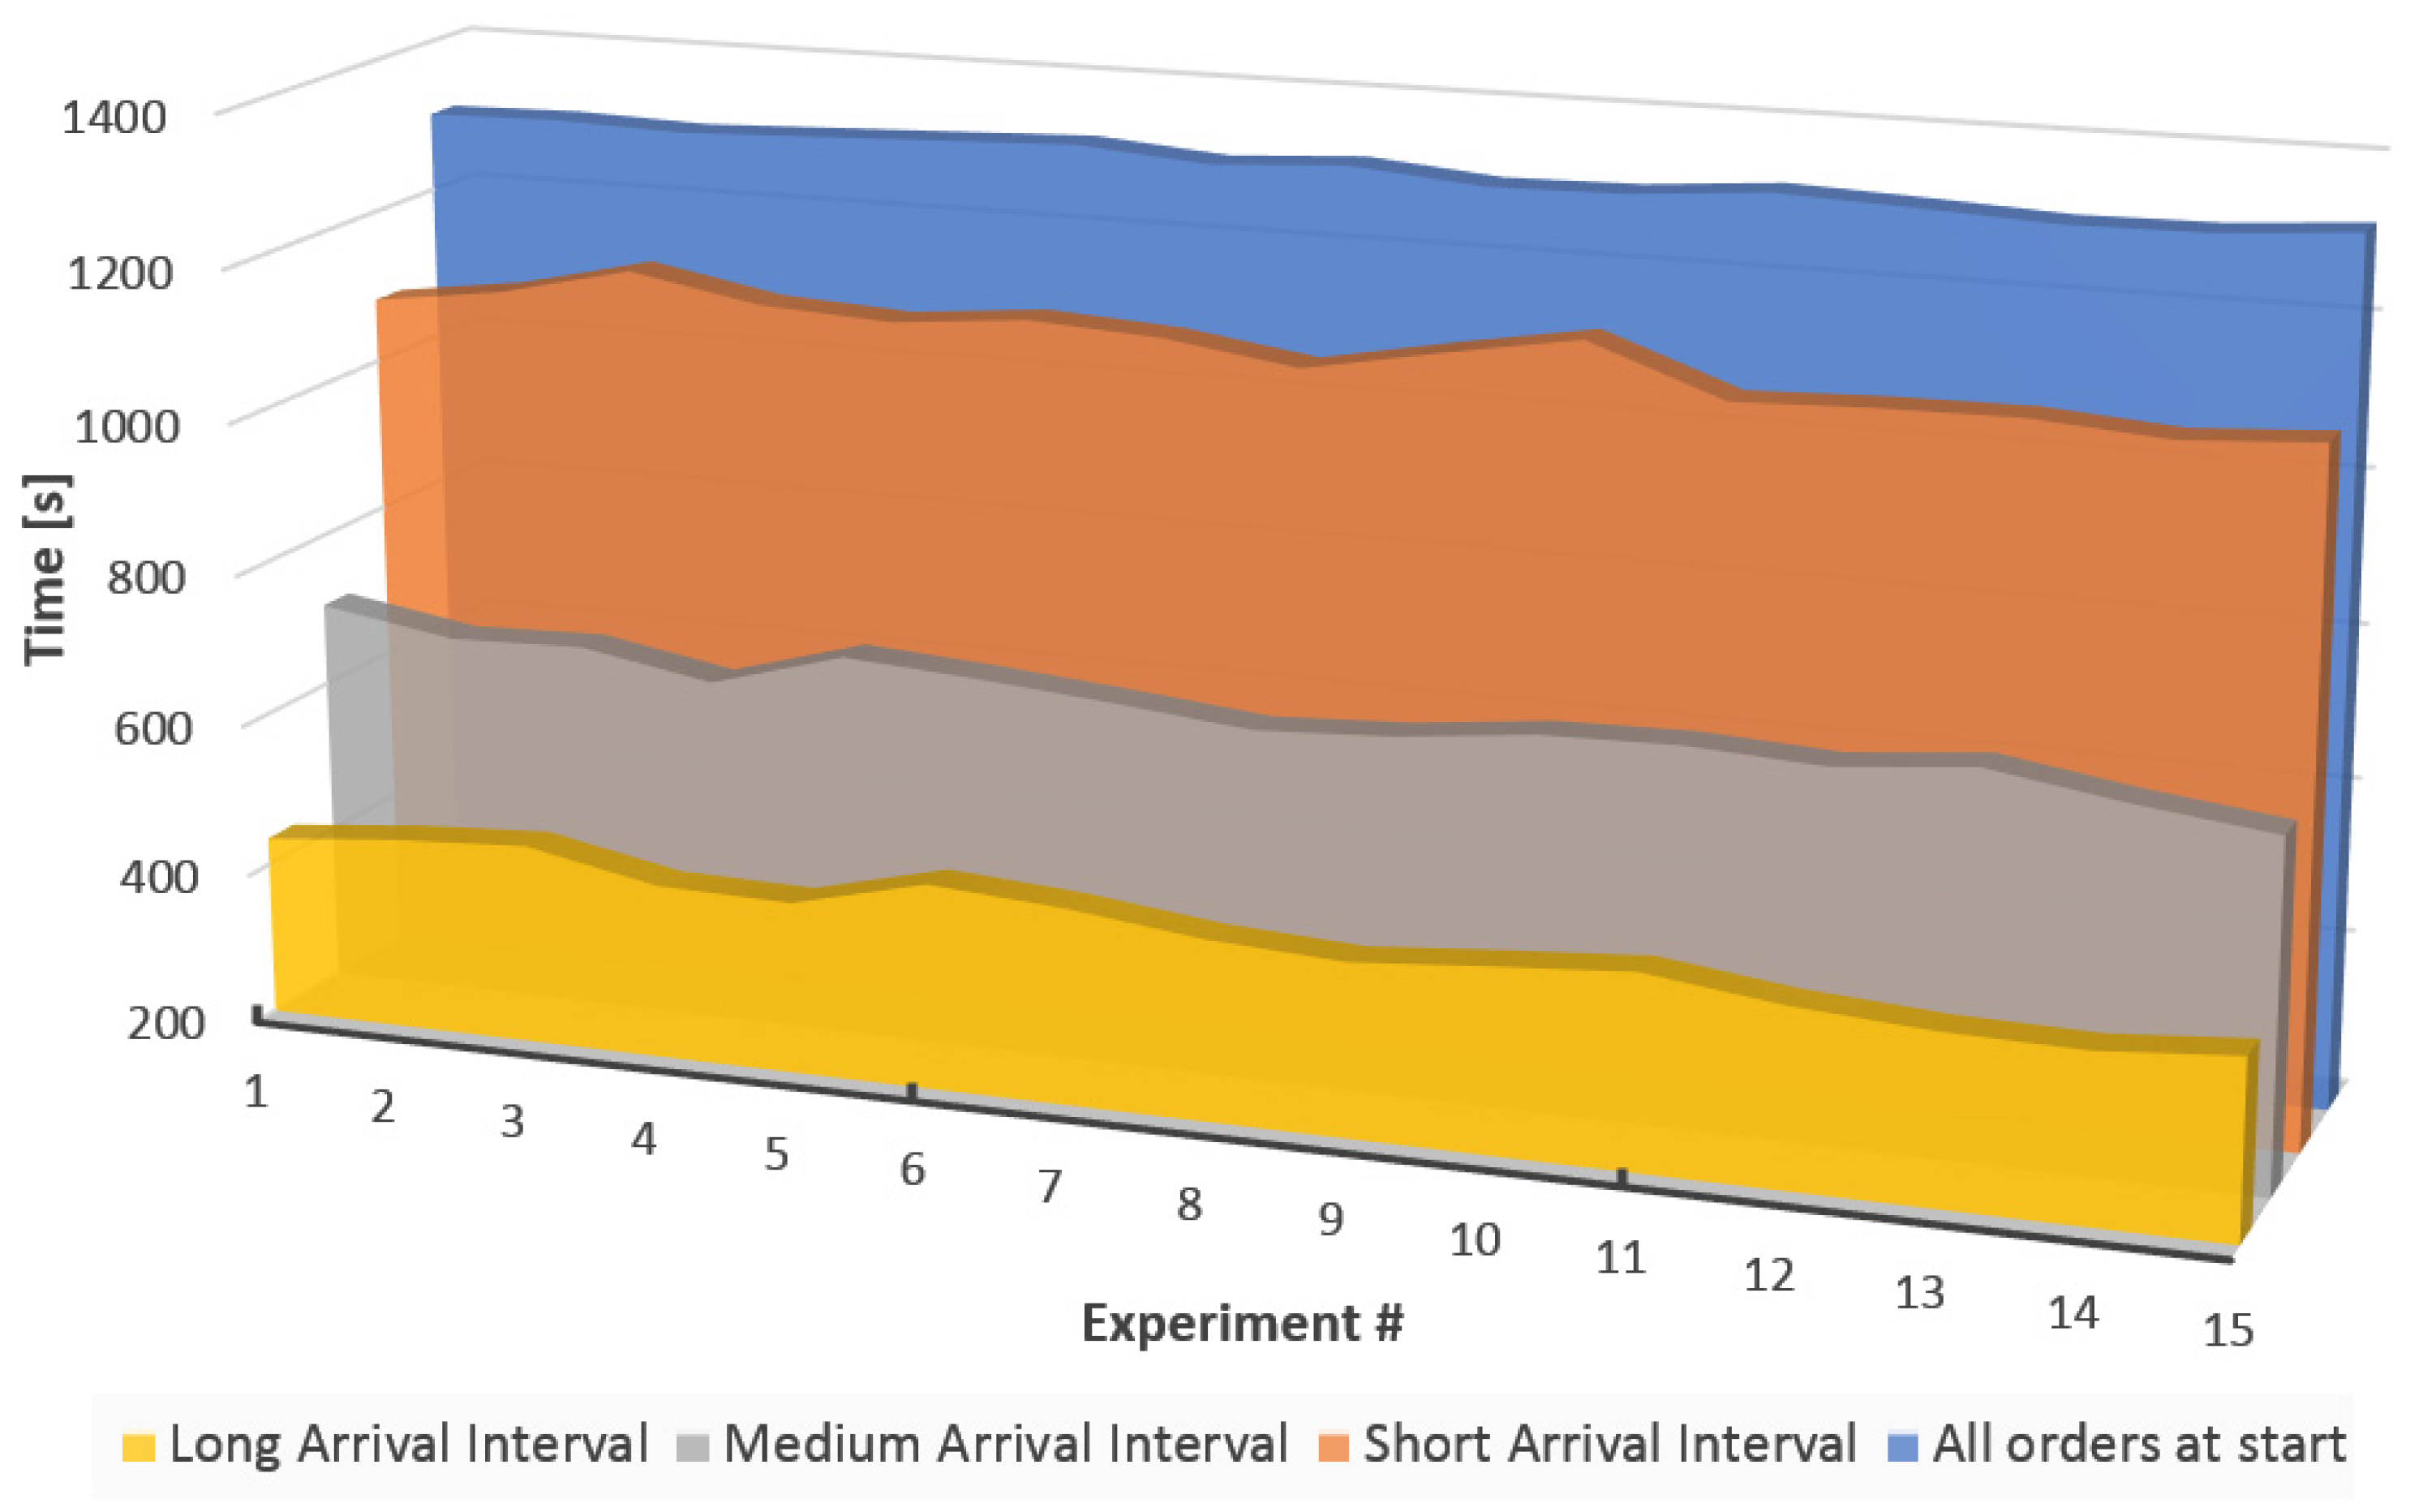
The first experiment consisted of 60 isolated iterations, divided into 4 categories. The input attribute we have iterated on was the arrival interval of production orders. The order arrival intervals specified in Table 1 are intervals between each individual order arriving in the production system, while the “All orders at start” scenario serves as a baseline scenario for Experiments A and B. The proposed categories for order arrival intervals are listed in Table 1.
Throughout this experiment, we have monitored the average time spent in the system for two types of products under different circumstances. The results of this experiment are shown in Figure 12. From the data presented in this figure, we have also deduced that prolonging the arrival interval for production orders directly impacts the average speed of production, which could also be an indicator of a bottleneck existing in the production system. When using the “All orders at start” scenario as a baseline, the arrival intervals between 20 and 60 s show a 14% decrease in the time required to finish a single product on average. When setting a time interval of arriving orders between 80 and 120 s, the results show up to 48% decrease in time spent in the system, while the slowest arrival intervals have shown up to 66.6% time-saving capability when compared to the baseline scenario.
While these results have shown incremental improvements, it was necessary to test the impact of these changes on the full production run, with a full production order in mind.
4.2. Experiment B
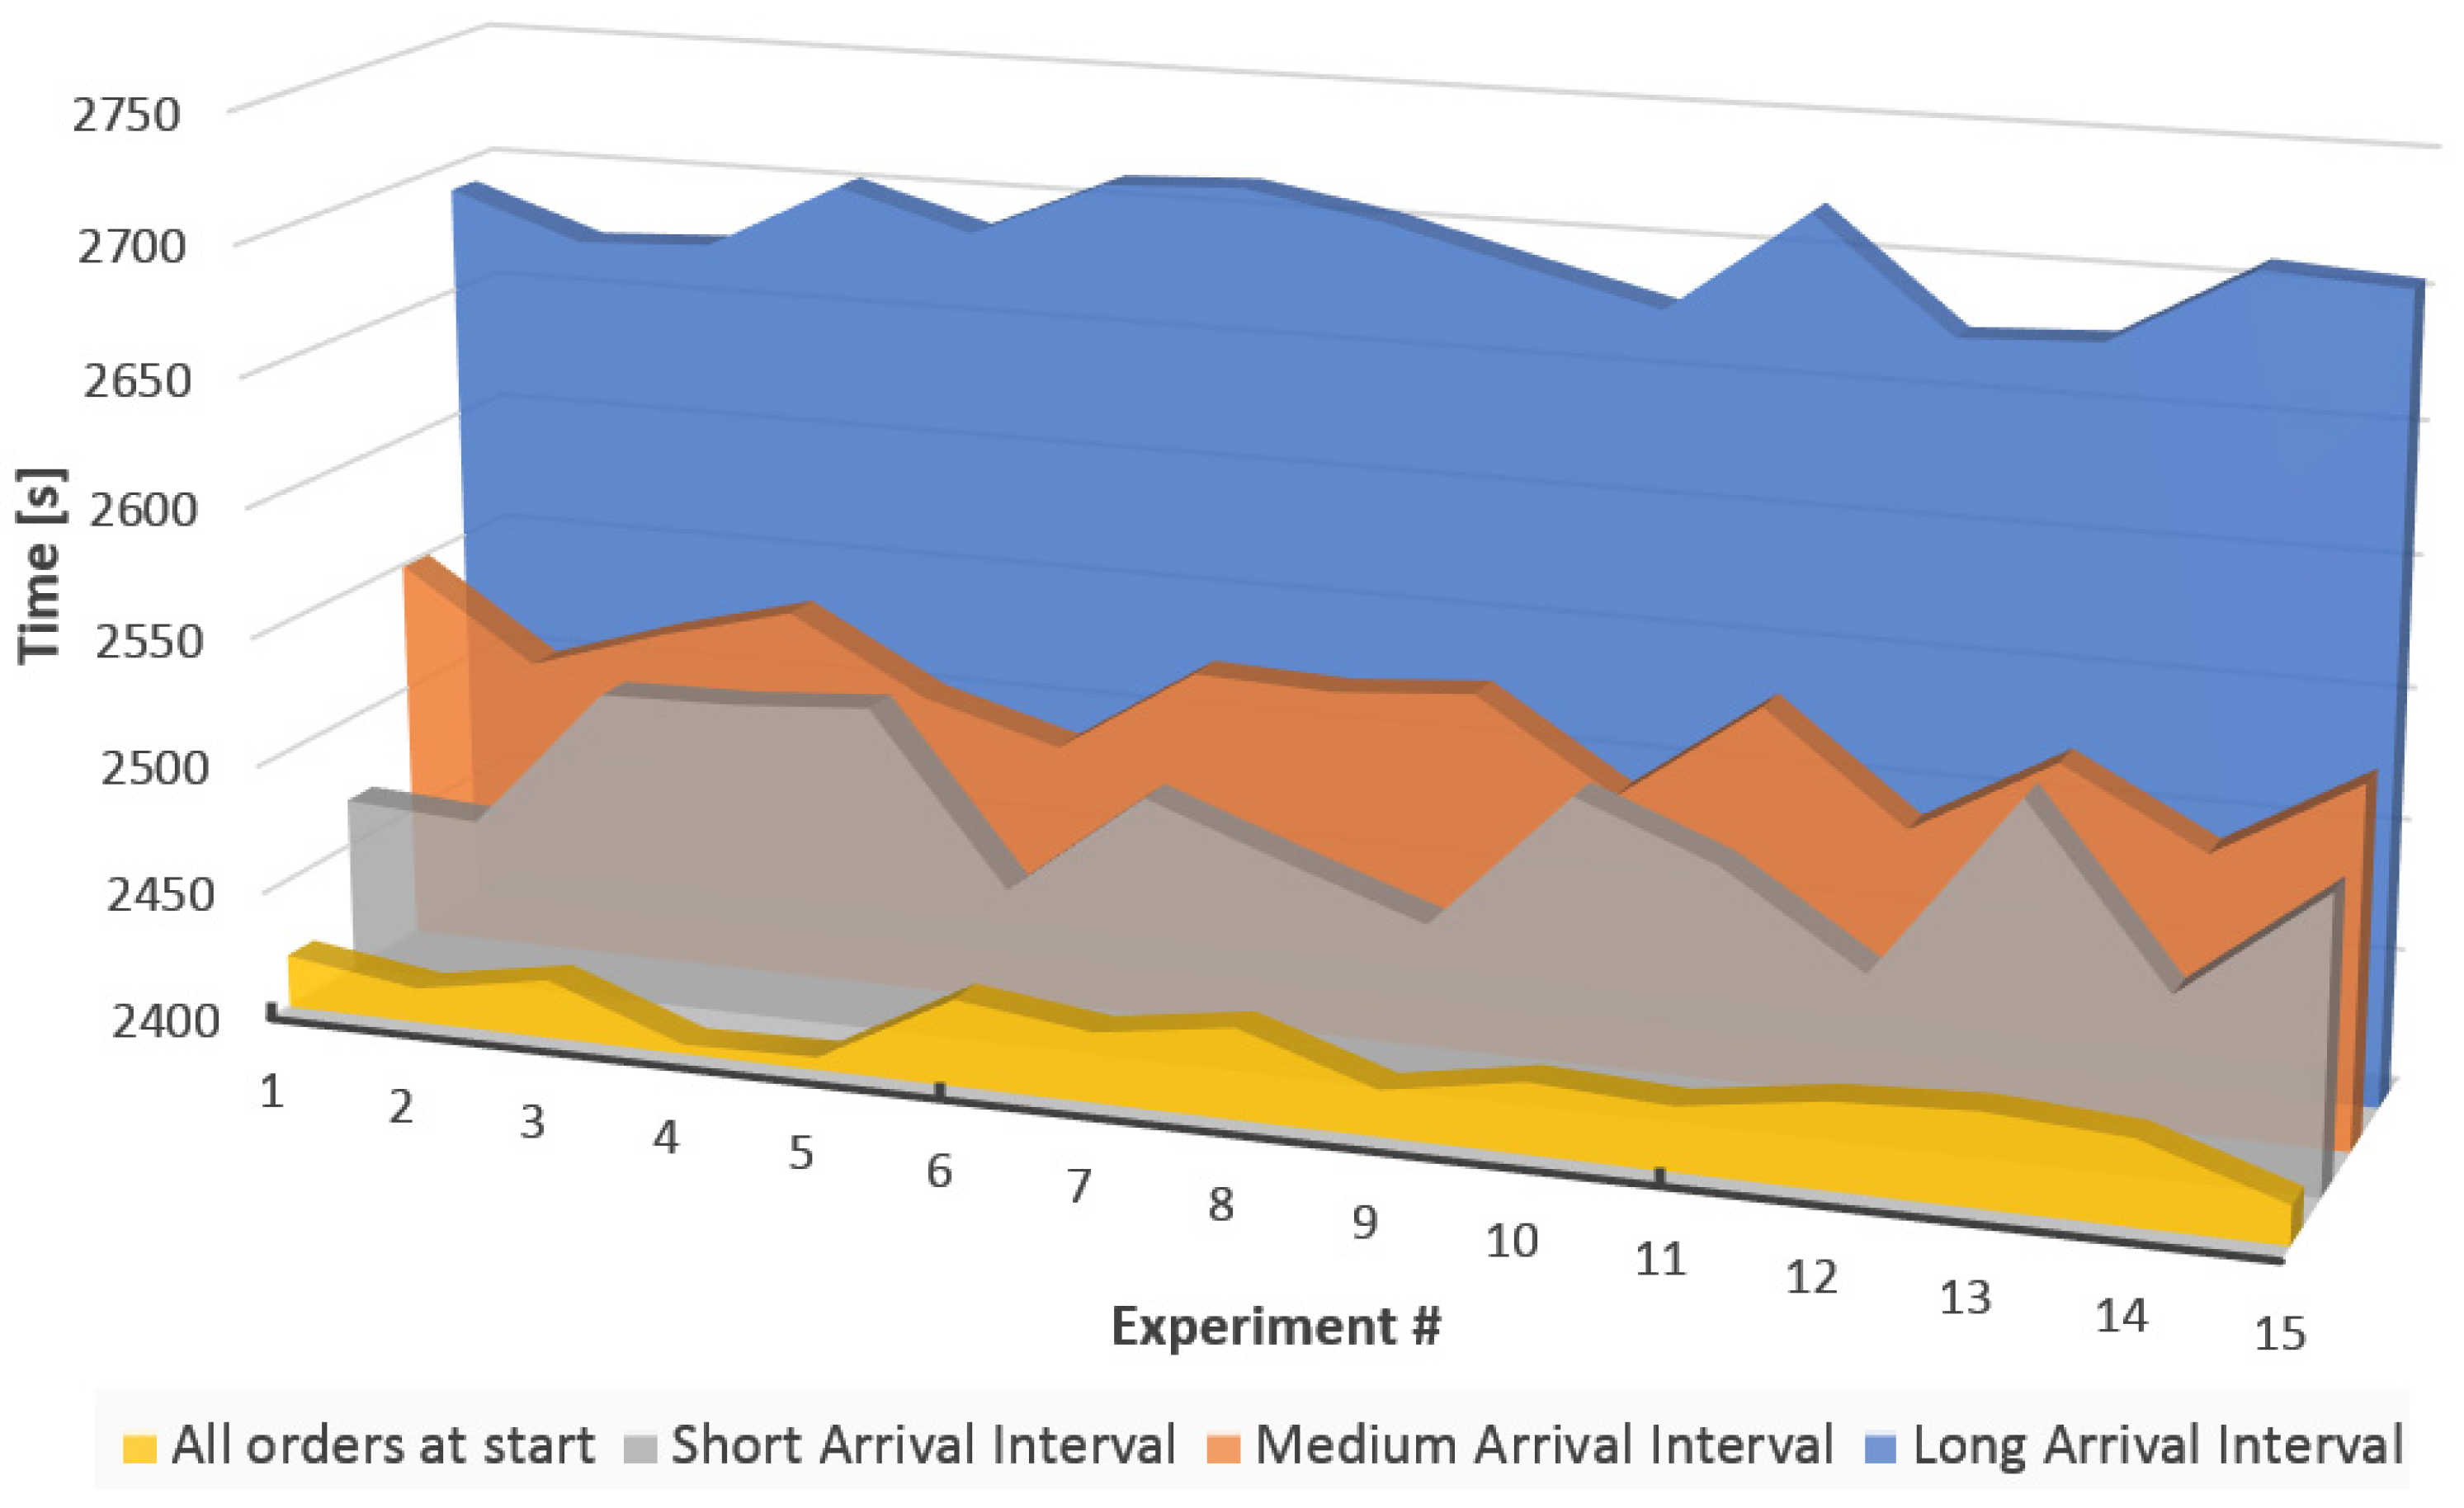
Following the results analysis of the first experiment and consideration of their effects on the full production cycle, we proposed the second experiment. During this experiment, the main focus was set on the impact of different order arrival intervals on the full length of the production process. The arrival intervals were divided into four categories in accordance with Table 1. The results of the second experiment are presented in Figure 13.
The results analysis of this experiment has shown that adjustments to order interval has an opposite effect on the full length of the production process, in contrast to the singular product results. While the long arrival intervals benefit the production of single products by cutting their production time down to a third, when compared to the baseline scenario, prolonged order arrival intervals increase the length of the entire production process by up to 10% on average. These results were expected, as the time differences between the short and long intervals can be up to eight times as long in the most extreme cases, which leads to a large accumulation of time the production system spends idle over the longer period. Interpretation of the results of this experiment can be subjective and vary based on the needs and requirements of any production system in question. Trying to find a good balance between the lower individual production times for products and the length of the production in its entirety is an approach worth considering.
4.3. Experiment C
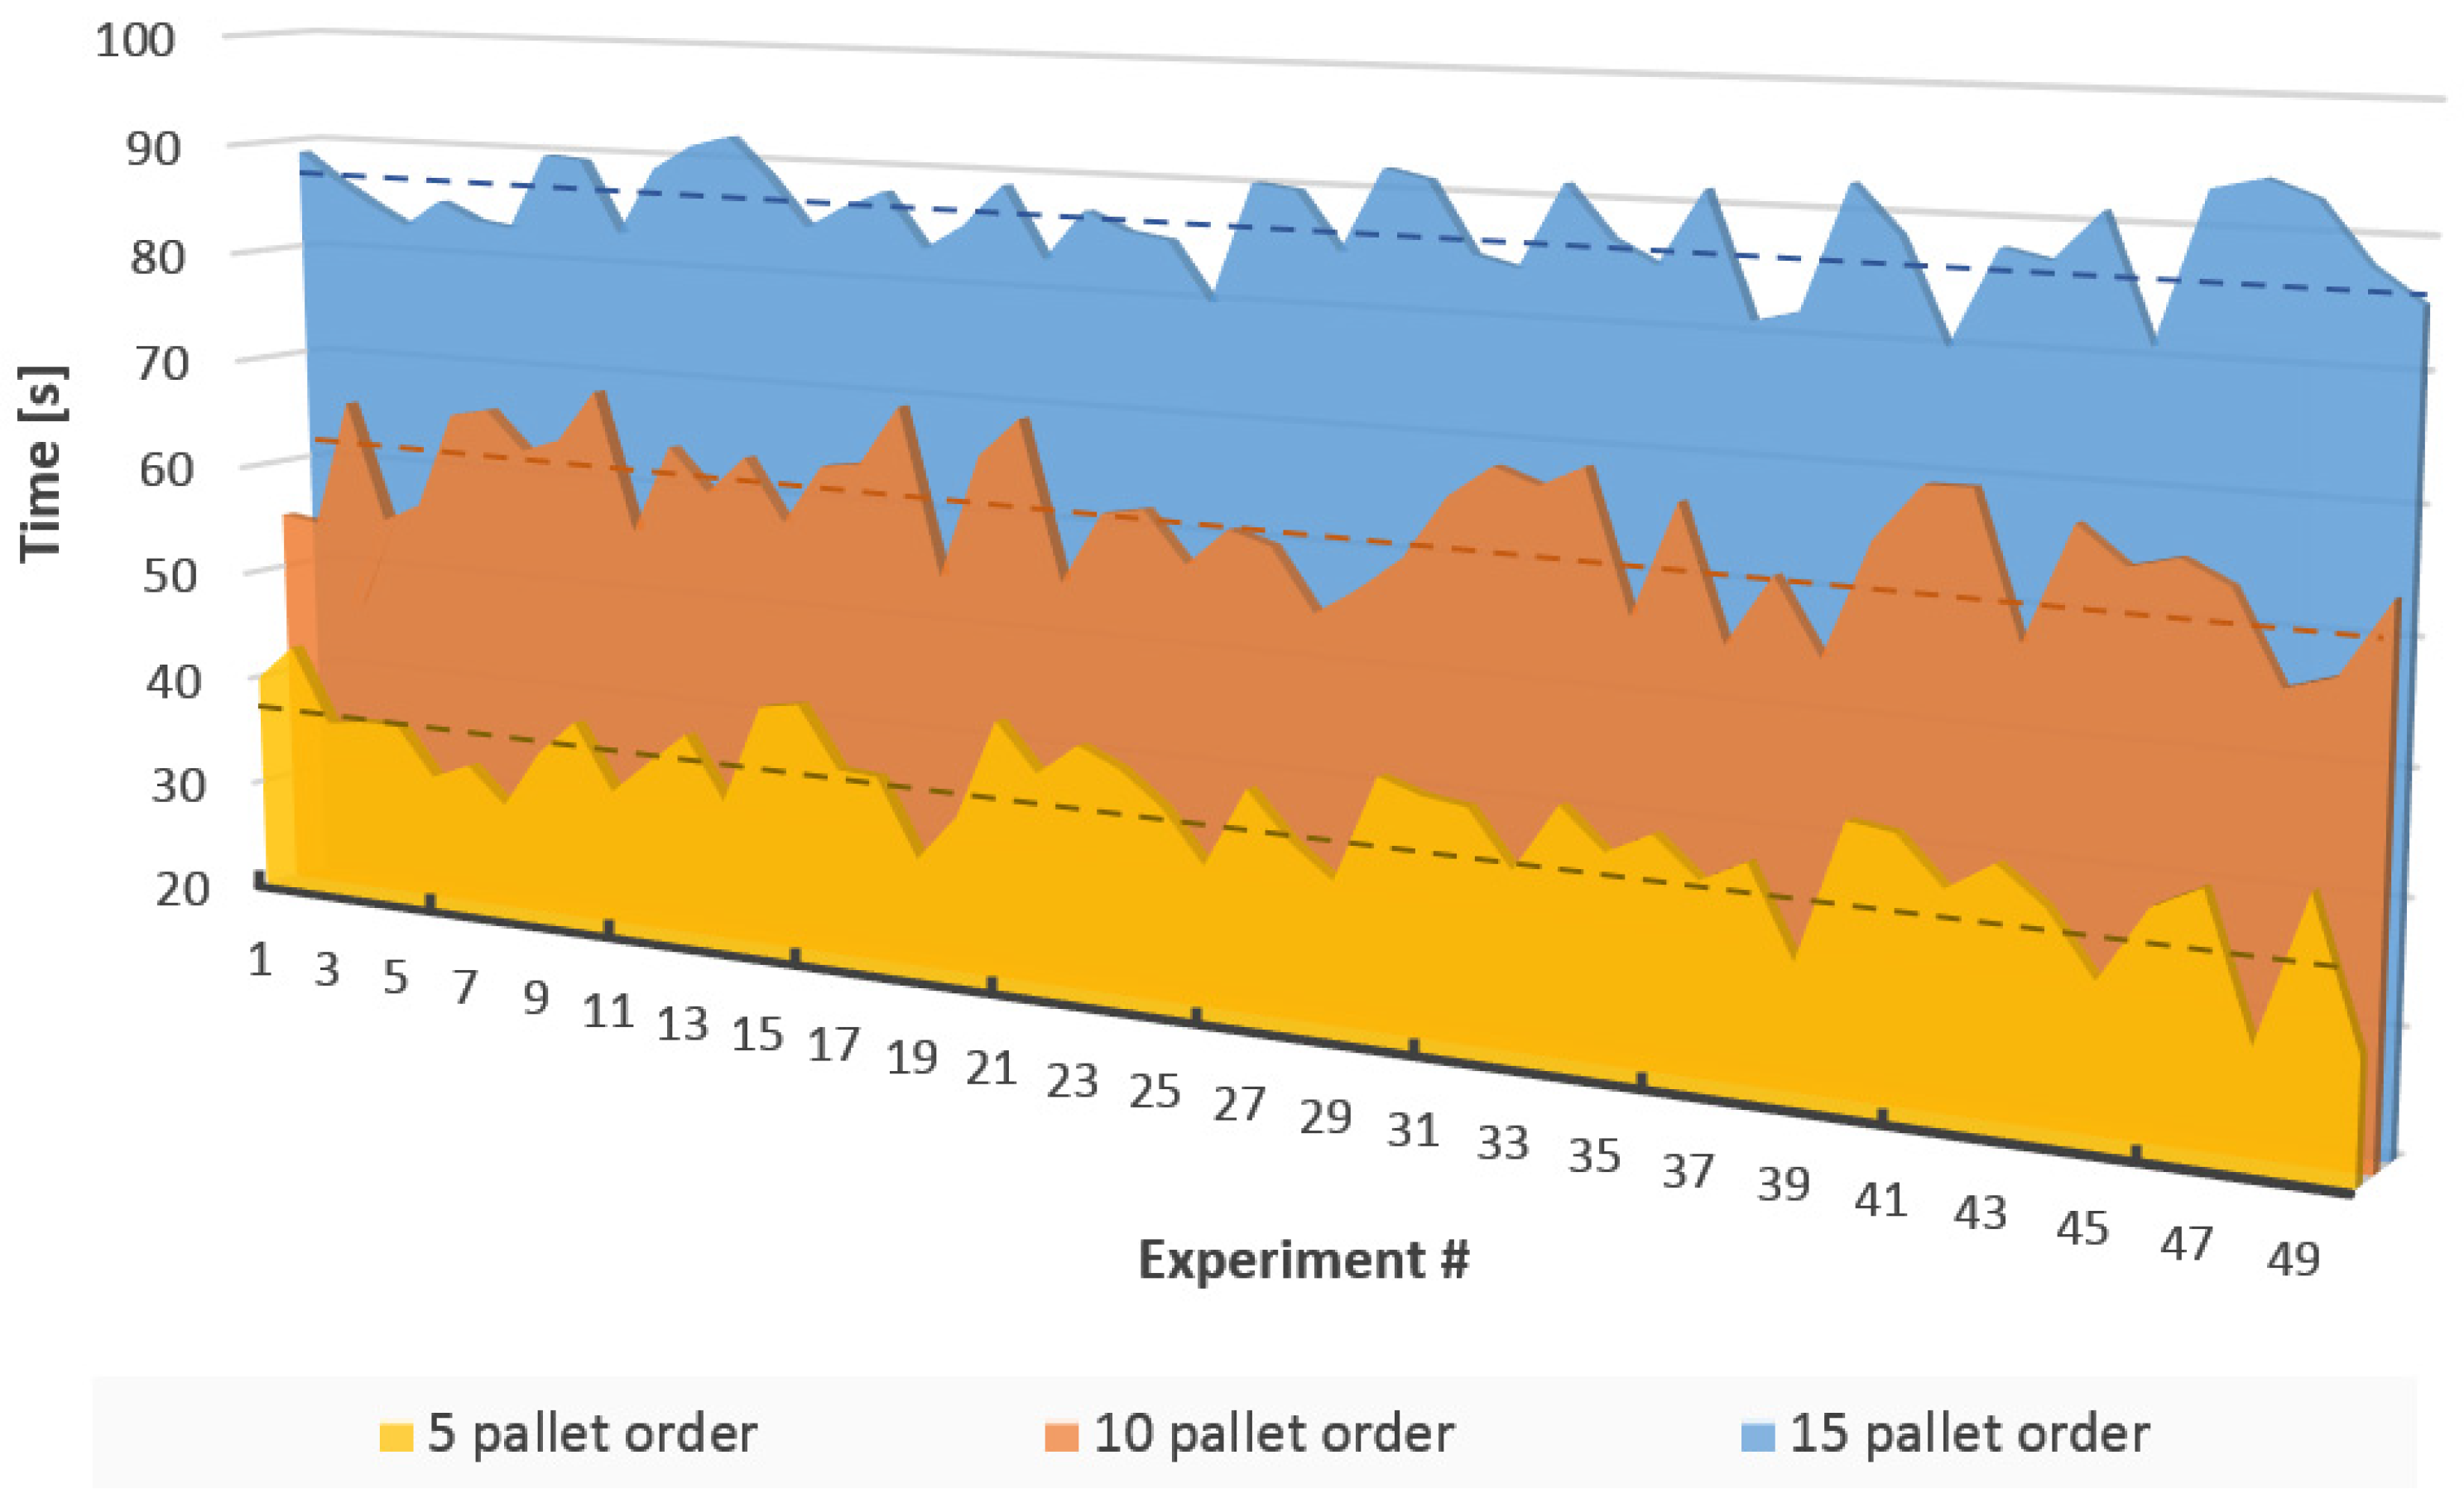
The focus of our third proposed experiment has been set on monitoring the time required for data exchange between MES and the simulation platform using the MOR method. A total of 150 iterations were proposed for this experiment, 50 for each of the three order types: 5-pallet, 10-pallet and 15-pallet orders. During this experiment, an operator has been involved while operating the OMI. The human error is reflected in the results of this experiment, largely caused by the lack of inconsistency during the order manipulation within OMI. The results of the third experiment are presented in Figure 14.
From the data shown in this figure, we have deduced that the time required to transfer data from MES to the simulation platform, run the simulation and then transfer data back to the MES scales linearly with the size of the incoming production orders, while being heavily impacted by the human factor in the process. The increasing time required for order management can be seen as a negative, especially while having the ability to create production orders larger than 15 pallets. The human factor in this process could start causing larger delays in production.
4.4. Experiment D
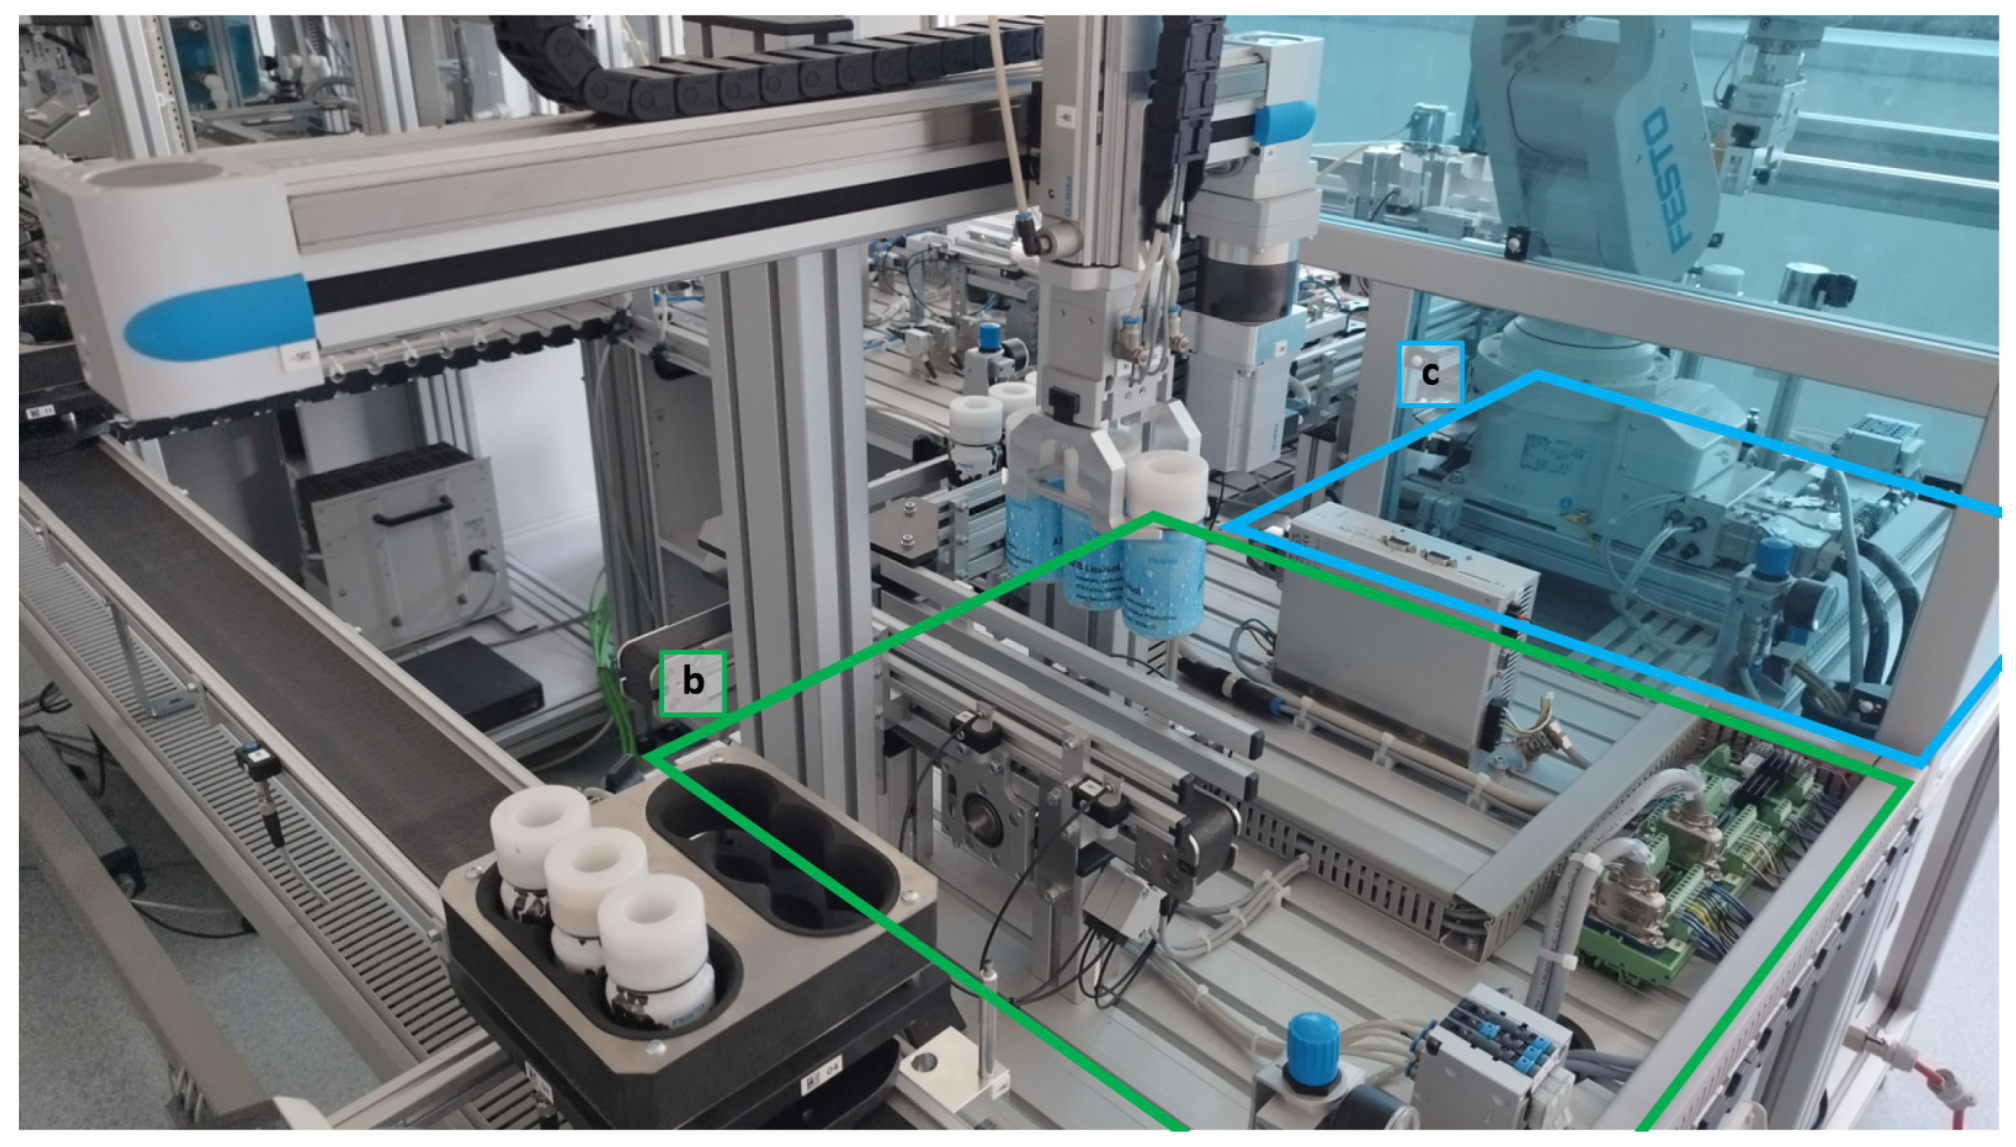
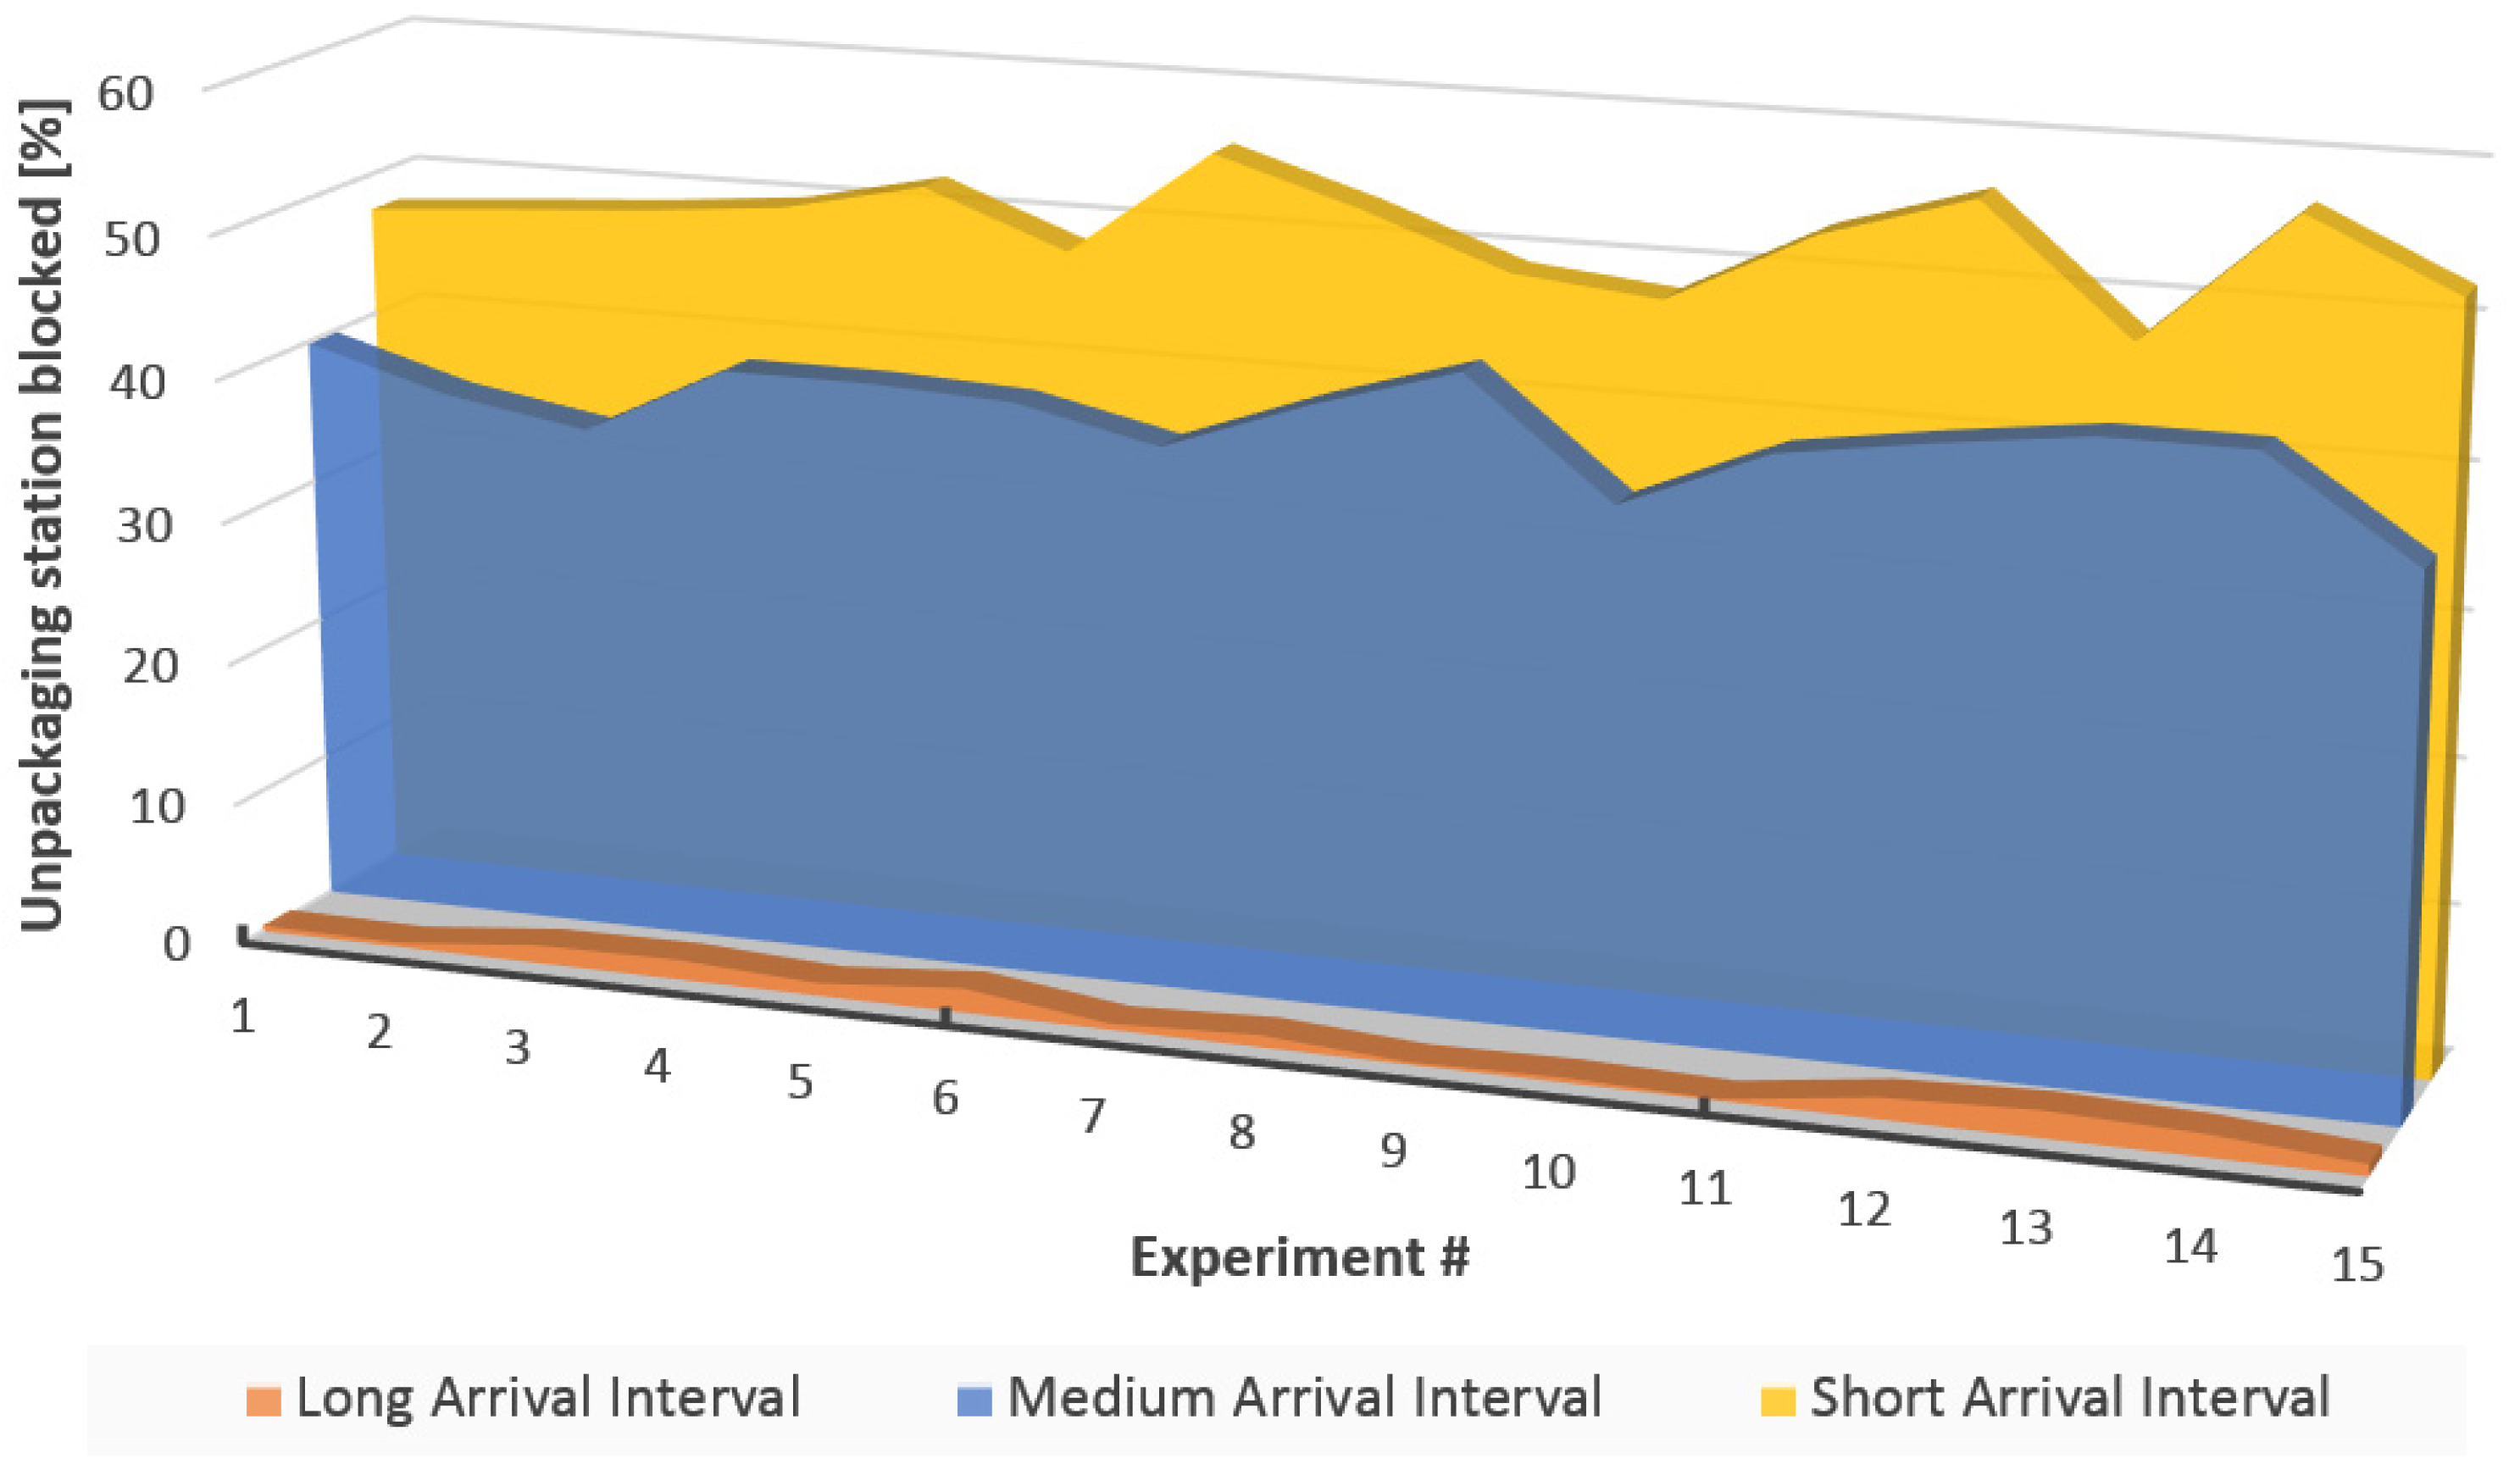
For the final experiment, we opted for testing the limit of a specific workstation in the physical production system, which we identified to be a spot in the system where the bottlenecking occurs. The workstation in question is the Unpackaging station (Figure 15), which removes pallets from the transport system and moves them to the Recycling station.
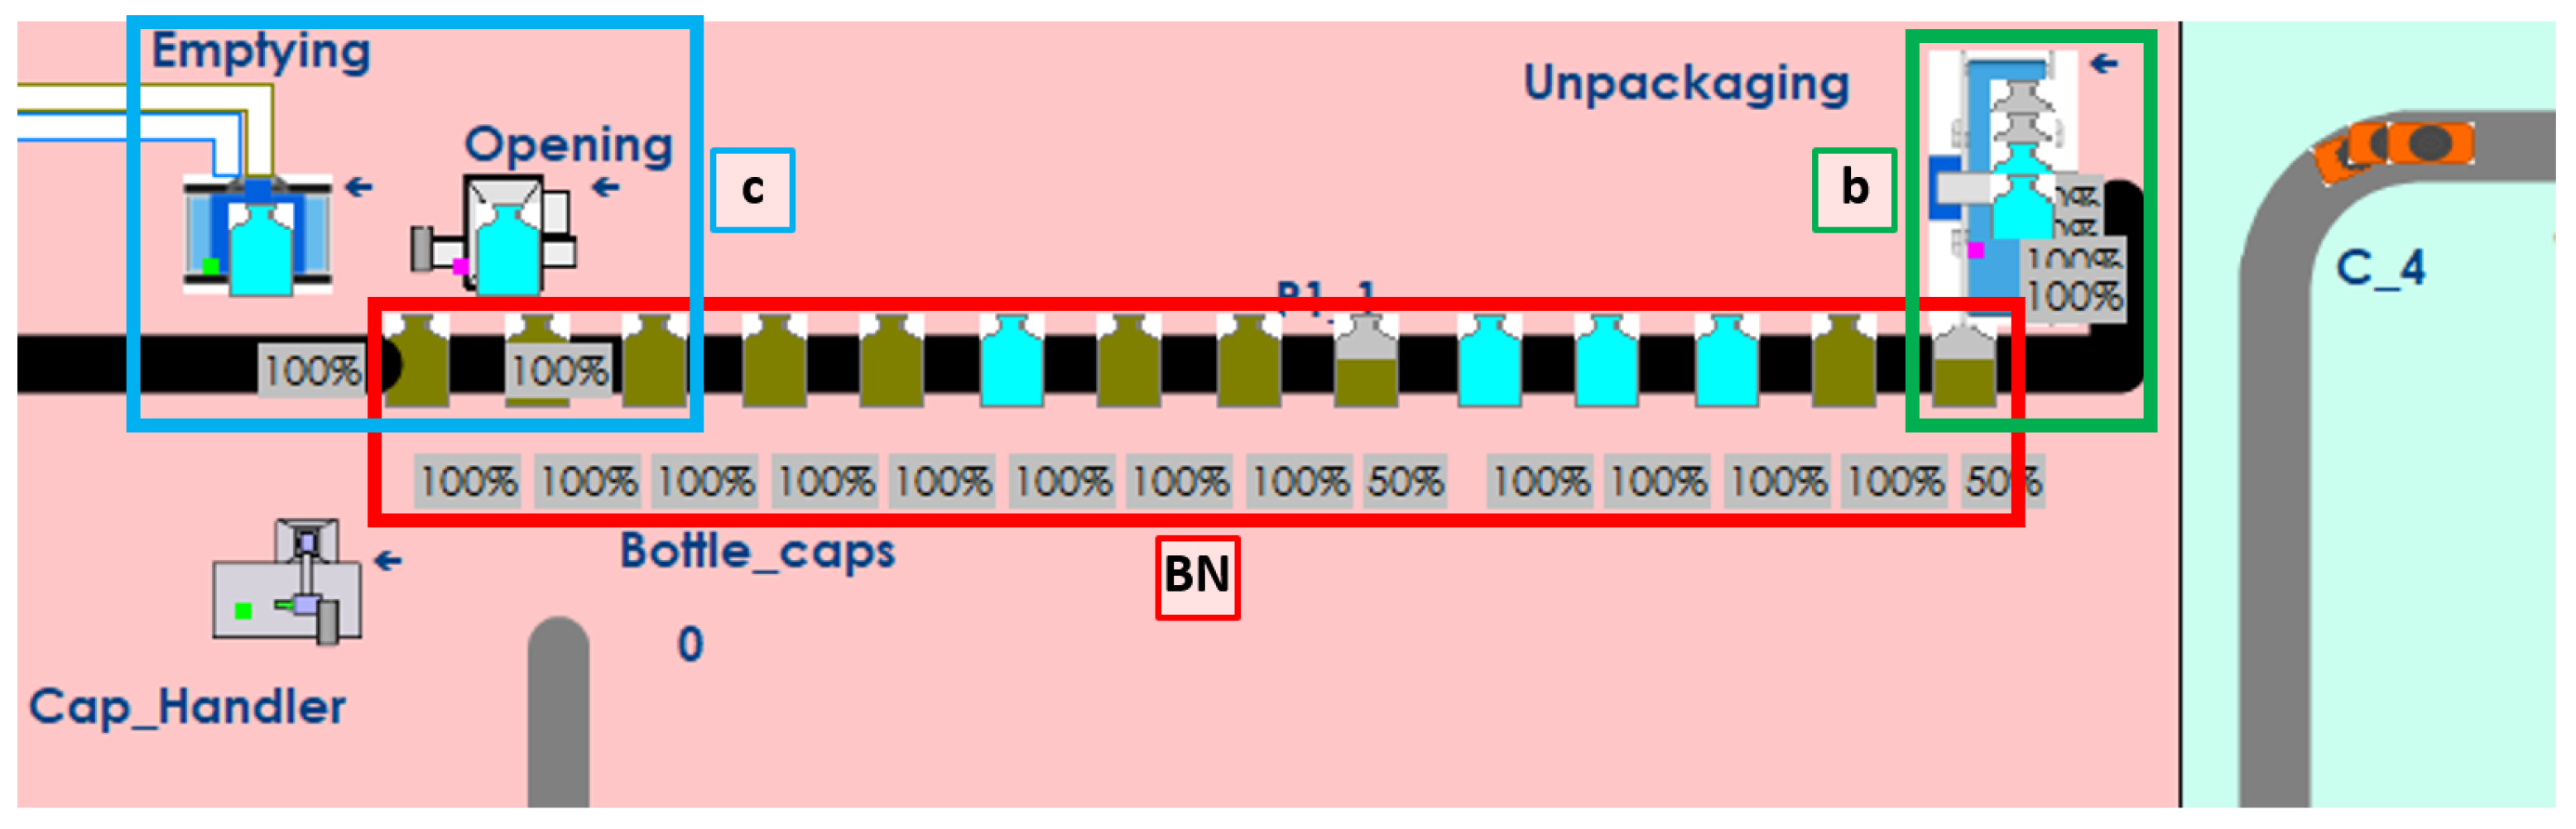
For this experiment, based on the submodel in Figure 16, we have only run iteration where the order arrival interval was greater than zero. This is due to the workstation having an almost 100% blockage rate with all the orders arriving instantly at the start of the production, locking up an entire production system and requiring manual handling of products. The remaining iterations of this experiment have shown that increasing the arrival interval leads to reducing the blockage ration of this workstation to near-null values. The problematic bottleneck presented in Figure 16, which was also a part of our previous research [21], is found to be caused by the recycling station. This station handles products individually and performs two different operations on each product, while the unpackaging station moves the products onto the conveyor belt in batches of three products at a time. There have been multiple solutions proposed as alternatives to manipulating the incoming work orders. These solutions include introducing a parallel identical recycling station, which would double the rate at which products flow through this section of the production system. Increasing storage capacities and adjusting the cycle times for different machines can also be viewed as potential alternatives to the solution. All of these mentioned alternatives have been deemed inefficient for the problem at hand but have not been discarded, in case of their requirement for future research.
The data presented in Figure 17 show that, with short arrival interval (described in Table 1), the block rates have stayed at roughly 50%. Having these intervals increased to medium length, the percentage did not improve very much, sitting at around a 40% block rate, but increasing the intervals a bit further has proven to make a much bigger difference, reducing the block rate of this workstation to 1.67% on average. The results of this experiment have brought up a possibility of a breakpoint existing and a possibility to further optimize the flow of production. This will be a matter of further research.
5. Conclusions and Future Research
This paper describes possibilities for integrating a production system with the WITNESS Horizon 23.0 simulation software. The solution mentioned in this paper was proposed with two main goals in mind. The first goal was to use a digital twin to analyze the production orders sent by the MES as well as to check their feasibility. The other goal was to research and test the maximum possible level of data integration between the MES and the simulation platform. The proposed solution does achieve these goals to different extents, while the benefits and disadvantages of its implementation can be obviously found.
The MOR—Manual Order Rearrangement—method, while being able to handle all the requests and meet all the requirements of data integration between the two systems, has shown clear disadvantages of incorporating a human element into the integration process, mainly in terms of execution speed and consistency, which has been caused by increasing the number of orders required to be processed at the same time. This method also comes with a downside of having the operator’s ability to instantly set the production in motion based on a simple inspection of the production system through an HMI.
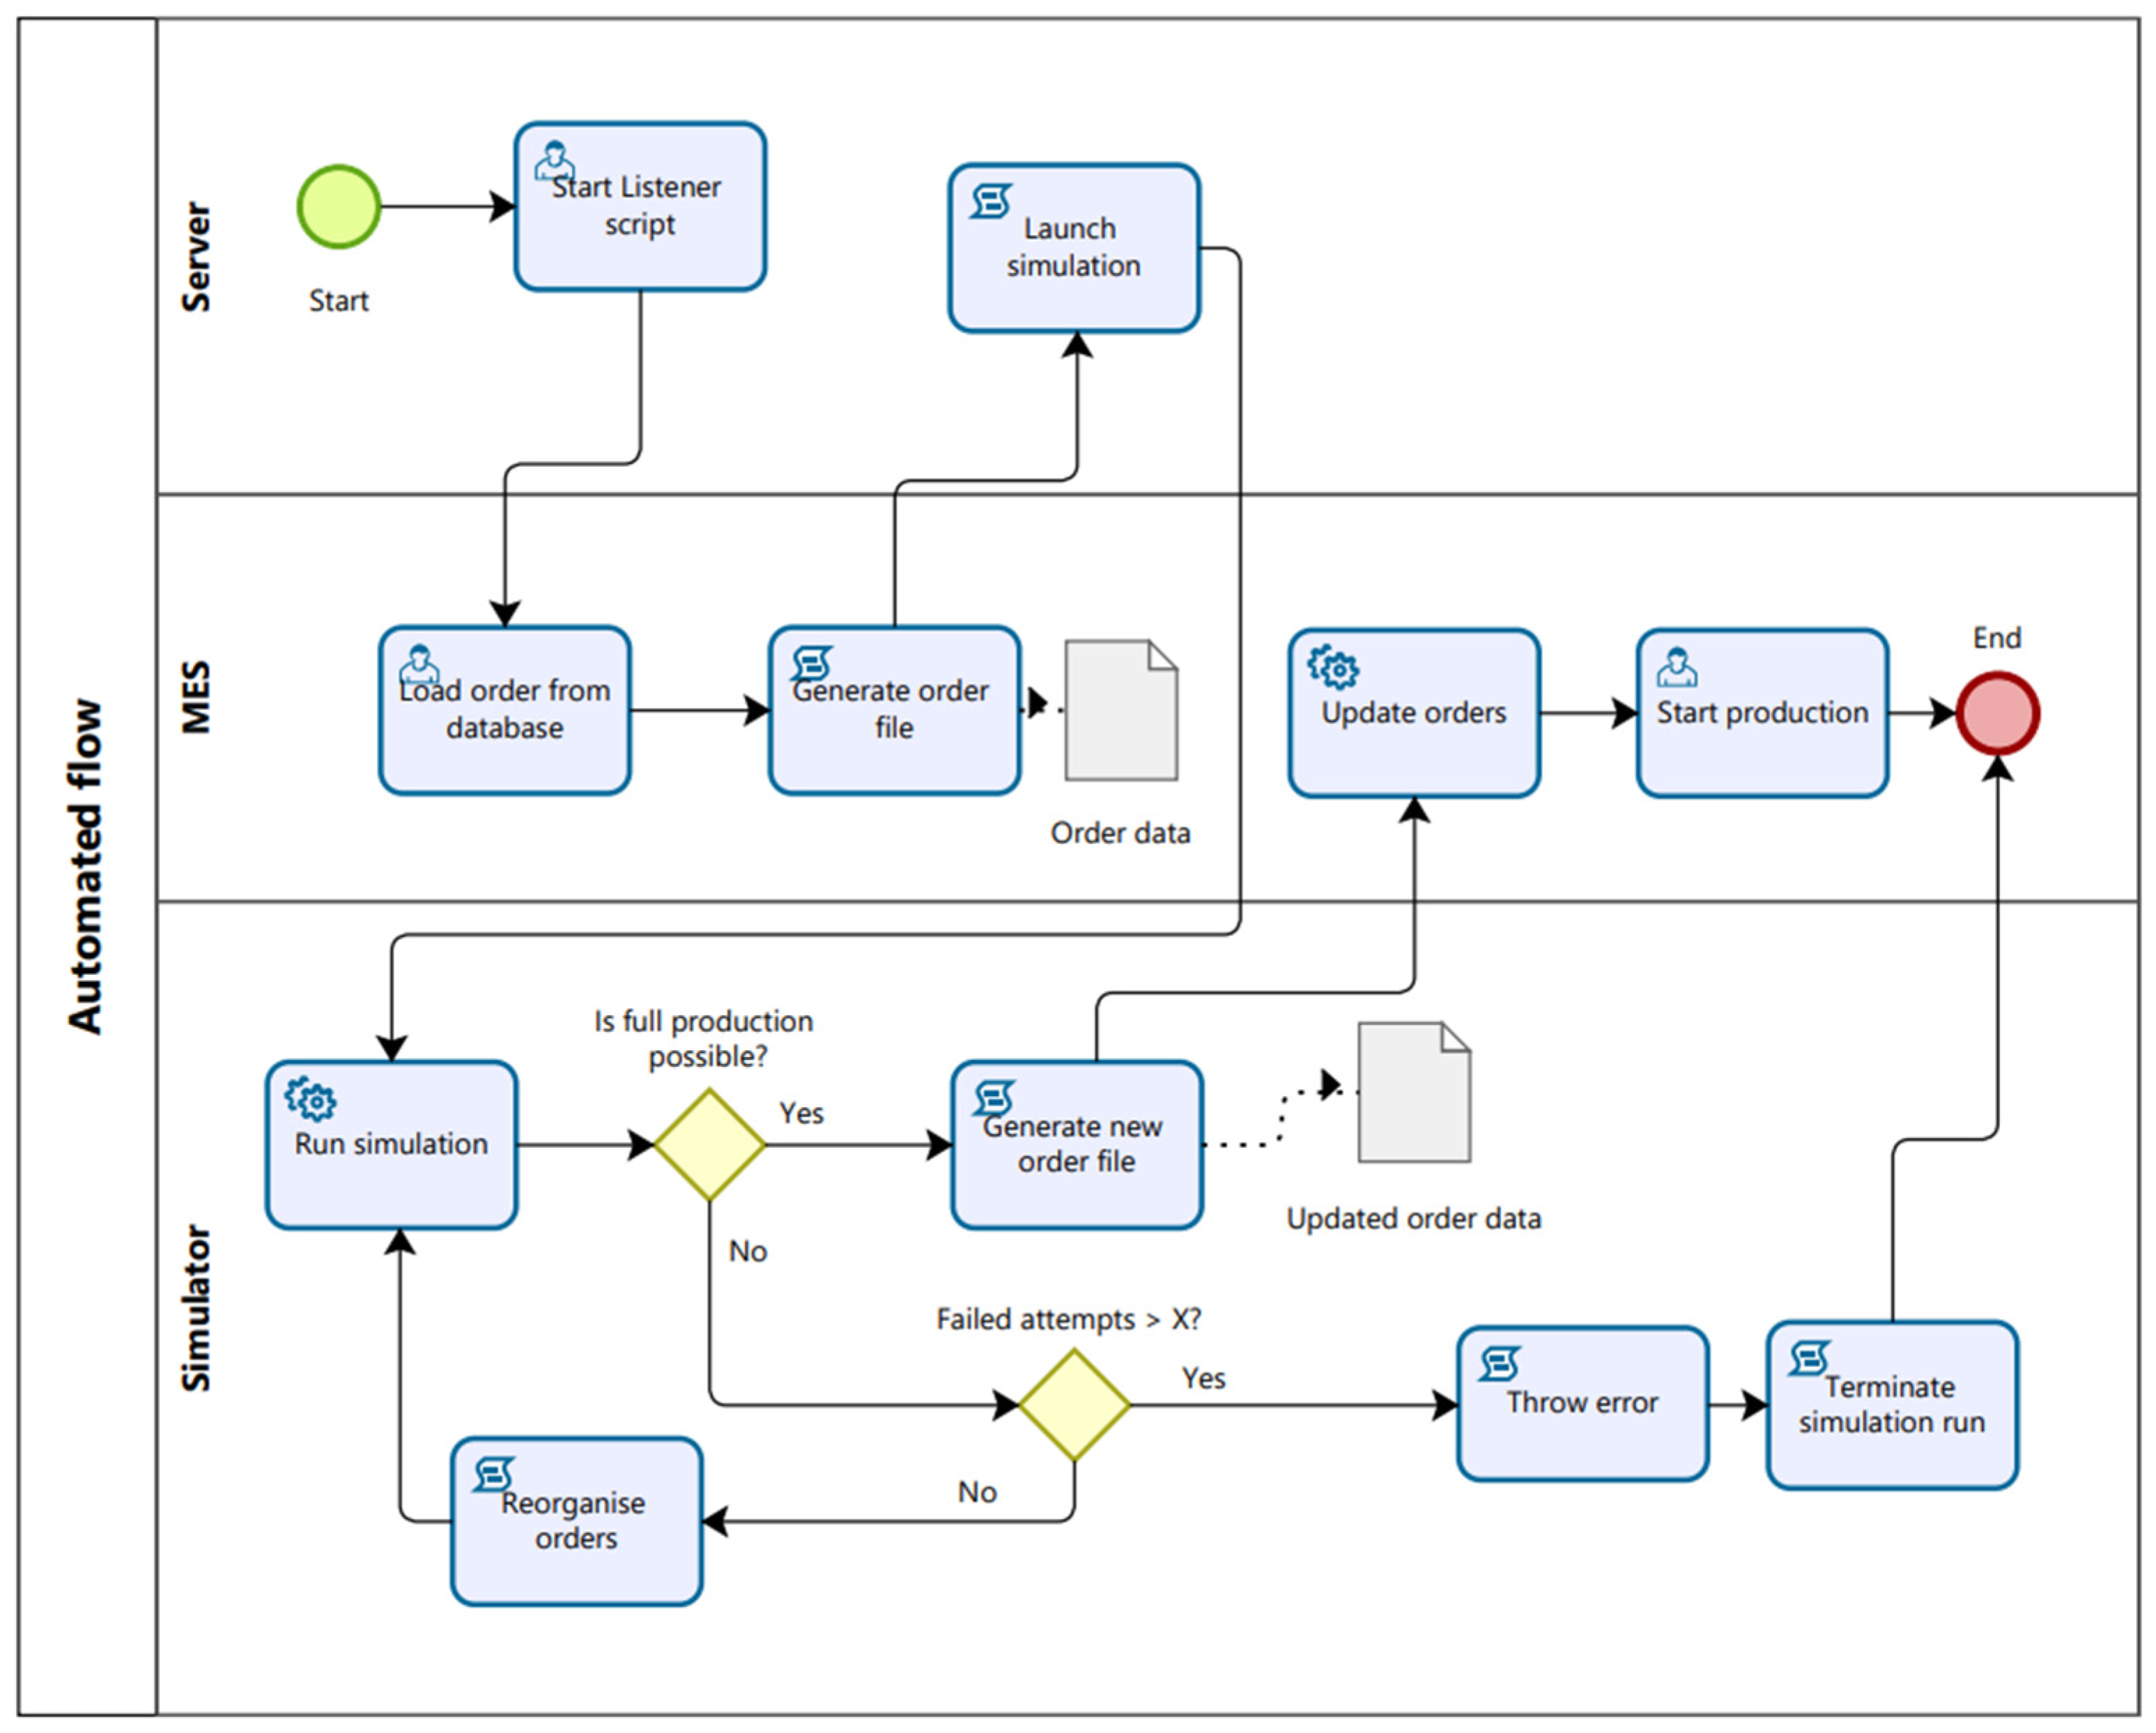
The disadvantages of the MOR method could be eliminated by a concept of AOR—Automated Order Rearrangement. This fully automated algorithm is aimed at achieving full integration between the PPS and the proposed DM. The main difference from the MOR method is the fact that all the important decision-making is shifted from the operator to the simulator itself. The level of automation proposed in this concept does not require the OMI as was needed in the MOR, but instead is replaced by a listener script, which runs on the server and monitors the creation of specific data files and performs further actions based on their type. The only point where the operator takes any actions is during the initiation process and starting the production process. All remaining actions are handled autonomously by the simulator and its bridging interfaces. The only operator task is to perform a final inspection of the production orders and proceed to initiate the production process (Figure 18).
Author Contributions
Conceptualization, F.B., P.V. and B.J.; formal analysis, P.V., B.J. and M.J.; funding acquisition, P.V.; investigation, F.B. and B.J.; methodology, F.B., P.V. and M.J.; project administration, P.V.; resources, P.V.; software, F.B.; supervision, P.V. and M.J.; validation, F.B.; visualization, M.J. and F.B; writing—original draft, F.B., B.J. and M.J.; writing—review and editing, P.V. and M.J. All authors have read and agreed to the published version of the manuscript.
Funding
This research was funded by the VEGA agency, grant number 1/0176/22 “Proactive control of hybrid production systems using simulation-based digital twin”. This research was funded by the KEGA agency, grant number 027STU-4/2022 “Integration of the requirements of practice in the automotive industry with the teaching of subjects within the study programs Process Automation and Informatization in Industry and Industrial Management”.
Data Availability Statement
Data sharing is not applicable to this article.
Conflicts of Interest
The authors declare no conflict of interest. The funders had no role in the design of the study; in the collection, analyses, or interpretation of data; in the writing of the manuscript; or in the decision to publish the results.
References
- Moyne, J.; Iskandar, J. Big Data Analytics for Smart Manufacturing: Case Studies in Semiconductor Manufacturing. Processes 2017, 5, 39. [Google Scholar] [CrossRef] [Green Version]
- Qi, Q.; Tao, F. Digital Twin and Big Data Towards Smart Manufacturing and Industry 4.0: 360 Degree Comparison. IEEE Access 2018, 6, 3585–3593. [Google Scholar] [CrossRef]
- Jia, W.; Wang, W.; Zhang, Z. From Simple Digital Twin to Complex Digital Twin Part II: Multi-Scenario Applications of Digital Twin Shop Floor. Adv. Eng. Inform. 2023, 56, 101915. [Google Scholar] [CrossRef]
- Hartmann, D.; Van der Auweraer, H. Digital Twins. In Progress in Industrial Mathematics: Success Stories; Cruz, M., Parés, C., Quintela, P., Eds.; Springer International Publishing: Cham, Switzerland, 2021; pp. 3–17. [Google Scholar]
- Hochhalter, J.D. Coupling Damage-Sensing Particles to the Digital Twin Concept; NASA/TM; National Aeronautics and Space Administration, Langley Research Center: Hampton, VA, USA, 2014.
- Rosen, R.; von Wichert, G.; Lo, G.; Bettenhausen, K.D. About The Importance of Autonomy and Digital Twins for the Future of Manufacturing. IFAC-PapersOnLine 2015, 48, 567–572. [Google Scholar] [CrossRef]
- ISO 23247-1; Automation Systems and Integration—Digital Twin Framework for Manufacturing—Part 1: Overview and General Principles. International Organization for Standardization: Geneva, Switzerland, 2021.
- ISO 23247-1; Automation Systems and Integration—Digital Twin Framework for Manufacturing—Part 3: Digital Representation of Manufacturing Elements. International Organization for Standardization: Geneva, Switzerland, 2021.
- Shao, G.; Hightower, J.; Schindel, W. Credibility Consideration for Digital Twins in Manufacturing. Manuf. Lett. 2023, 35, 24–28. [Google Scholar] [CrossRef]
- Brenner, B.; Hummel, V. Digital Twin as Enabler for an Innovative Digital Shopfloor Management System in the ESB Logistics Learning Factory at Reutlingen—University. Procedia Manuf. 2017, 9, 198–205. [Google Scholar] [CrossRef]
- Pantelides, C.C.; Renfro, J.G. The Online Use of First-Principles Models in Process Operations: Review, Current Status and Future Needs. Comput. Chem. Eng. 2013, 51, 136–148. [Google Scholar] [CrossRef]
- Martínez, G.S.; Sierla, S.; Karhela, T.; Vyatkin, V. Automatic Generation of a Simulation-Based Digital Twin of an Industrial Process Plant. In Proceedings of the IECON 2018—44th Annual Conference of the IEEE Industrial Electronics Society, Washington, DC, USA, 21–23 October 2018. [Google Scholar]
- Martínez, G.S.; Karhela, T.A.; Ruusu, R.J.; Sierla, S.A.; Vyatkin, V. An Integrated Implementation Methodology of a Lifecycle-Wide Tracking Simulation Architecture. IEEE Access 2018, 6, 15391–15407. [Google Scholar] [CrossRef]
- Carvalho, R.; da Silva, A.R. Sustainability Requirements of Digital Twin-Based Systems: A Meta Systematic Literature Review. Appl. Sci. 2021, 11, 5519. [Google Scholar] [CrossRef]
- Spyrou, O.; Hurst, W.; Verdouw, C. Virtual Reality-Based Digital Twins: A Case Study on Pharmaceutical Cannabis. Big Data Cogn. Comput. 2023, 7, 95. [Google Scholar] [CrossRef]
- Nica, E.; Popescu, G.H.; Poliak, M.; Kliestik, T.; Sabie, O.-M. Digital Twin Simulation Tools, Spatial Cognition Algorithms, and Multi-Sensor Fusion Technology in Sustainable Urban Governance Networks. Mathematics 2023, 11, 1981. [Google Scholar] [CrossRef]
- Liu, J.; Zhang, K. Design and Simulation Debugging of Automobile Connecting Rod Production Line Based on the Digital Twin. Appl. Sci. 2023, 13, 4919. [Google Scholar] [CrossRef]
- What Is Smart Manufacturing?—Definition from WhatIs.Com. Available online: https://www.techtarget.com/iotagenda/definition/smart-manufacturing-SM (accessed on 20 June 2023).
- Shao, G. Use Case Scenarios for Digital Twin Implementation Based on ISO 23247; NIST: Gaithersburg, MD, USA, 2021.
- ISO 15926-2:2003; Industrial Automation Systems and Integration—Integration of Life-Cycle Data for Process Plants Including Oil and Gas Production Facilities—Part 2: Data Model. International Organization for Standardization: Geneva, Switzerland, 2003.
- Burčiar, F.; Važan, P. Integration of a Digital Twin into Production Line Control. In Cybernetics Perspectives in Systems; Silhavy, R., Ed.; Springer International Publishing: Cham, Switzerland, 2022; pp. 302–311. [Google Scholar] [CrossRef]
Figure 1.
Types of OMEs in reference architecture [8].
Figure 1.
Types of OMEs in reference architecture [8].

Figure 2.
Conceptual model for a manual data flow approach.

Figure 3.
Agro, Food & Beverage Factory (AFB Factory) by FESTO—(a) conveyor; (b) unpackaging; (c) recycling; (d) filling; (e) packaging; (f) preprocessing.
Figure 3.
Agro, Food & Beverage Factory (AFB Factory) by FESTO—(a) conveyor; (b) unpackaging; (c) recycling; (d) filling; (e) packaging; (f) preprocessing.

Figure 4.
Simulation model of AFB Factory—(a) conveyor; (b) unpackaging; (c) recycling; (d) filling; (e) packaging; (f) preprocessing.
Figure 4.
Simulation model of AFB Factory—(a) conveyor; (b) unpackaging; (c) recycling; (d) filling; (e) packaging; (f) preprocessing.

Figure 5.
Filling Station of AFB Factory—(a) bottle entry; (b) liquid filling; (c) granulate filling; (d) cap placing; (e) cap closing; (f) bottle exit.
Figure 5.
Filling Station of AFB Factory—(a) bottle entry; (b) liquid filling; (c) granulate filling; (d) cap placing; (e) cap closing; (f) bottle exit.

Figure 6.
Simulation model—substitution for a Filling Station—(a) bottle entry; (b) liquid filling; (c) granulate filling; (d) cap placing; (e) cap closing; (f) bottle exit.
Figure 6.
Simulation model—substitution for a Filling Station—(a) bottle entry; (b) liquid filling; (c) granulate filling; (d) cap placing; (e) cap closing; (f) bottle exit.

Figure 7.
Digital model of material preprocessing stations—(a) liquid filtering; (b) liquid mixing; (c) liquid heating; (d) liquid quality check; (e) granulate quality control; (f) granulate cleaning; (g) granulate weighing.
Figure 7.
Digital model of material preprocessing stations—(a) liquid filtering; (b) liquid mixing; (c) liquid heating; (d) liquid quality check; (e) granulate quality control; (f) granulate cleaning; (g) granulate weighing.

Figure 8.
Liquid material preprocessing in AFB Factory—(a) liquid filtering; (b) liquid mixing; (c) liquid heating; (d) liquid quality check.
Figure 8.
Liquid material preprocessing in AFB Factory—(a) liquid filtering; (b) liquid mixing; (c) liquid heating; (d) liquid quality check.

Figure 9.
Solid material—granulate—preprocessing in AFB Factory—(e) granulate quality control; (f) granulate cleaning; (g) granulate weighing.
Figure 9.
Solid material—granulate—preprocessing in AFB Factory—(e) granulate quality control; (f) granulate cleaning; (g) granulate weighing.

Figure 10.
Intouch Manufacturing Execution System (MES)—(a) list of all orders; (b) orders details.

Figure 11.
Data transformation from CSV to simulation input using dedicated OMI.

Figure 12.
Effect of arrival intervals on production speed of individual products.

Figure 13.
Effect of arrival intervals on the length of the production process.

Figure 14.
Time required for data exchange between MES and simulation platform.

Figure 15.
Unpackaging Station of AFB Factory—(b) unpackaging; (c) recycling.

Figure 16.
Simulation model—bottleneck of AFB Factory—(b) unpackaging; (c) recycling; (BN) bottleneck.
Figure 16.
Simulation model—bottleneck of AFB Factory—(b) unpackaging; (c) recycling; (BN) bottleneck.

Figure 17.
Block rate percentage showcase for Unpackaging machine.

Figure 18.
Conceptual model of an automated data flow method proposal.


Table 1.
Production orders arrival intervals.
| Scenario Name | Time Interval [s] |
|---|---|
| All orders at start | 0 |
| Short Arrival Interval | 20–60 |
| Medium Arrival Interval | 80–120 |
| Long Arrival Interval | 130–170 |
Disclaimer/Publisher’s Note: The statements, opinions and data contained in all publications are solely those of the individual author(s) and contributor(s) and not of MDPI and/or the editor(s). MDPI and/or the editor(s) disclaim responsibility for any injury to people or property resulting from any ideas, methods, instructions or products referred to in the content. |
© 2023 by the authors. Licensee MDPI, Basel, Switzerland. This article is an open access article distributed under the terms and conditions of the Creative Commons Attribution (CC BY) license (https://creativecommons.org/licenses/by/4.0/).
Share and Cite
MDPI and ACS Style
Burčiar, F.; Važan, P.; Juhásová, B.; Juhás, M. Methodical Approach to Proactivity Using a Digital Twin of Production Process. Electronics 2023, 12, 3335. https://doi.org/10.3390/electronics12153335
AMA Style
Burčiar F, Važan P, Juhásová B, Juhás M. Methodical Approach to Proactivity Using a Digital Twin of Production Process. Electronics. 2023; 12(15):3335. https://doi.org/10.3390/electronics12153335
Chicago/Turabian StyleBurčiar, Fedor, Pavel Važan, Bohuslava Juhásová, and Martin Juhás. 2023. "Methodical Approach to Proactivity Using a Digital Twin of Production Process" Electronics 12, no. 15: 3335. https://doi.org/10.3390/electronics12153335
Note that from the first issue of 2016, this journal uses article numbers instead of page numbers. See further details here.