


Consumer Subjective Impressions in Virtual Reality Environments: The Role of the Visualization Technique in Product Evaluation

 , , and
Abstract
:1. Introduction
2. Related Work
3. Research Aim and Hypotheses
4. Materials and Methods
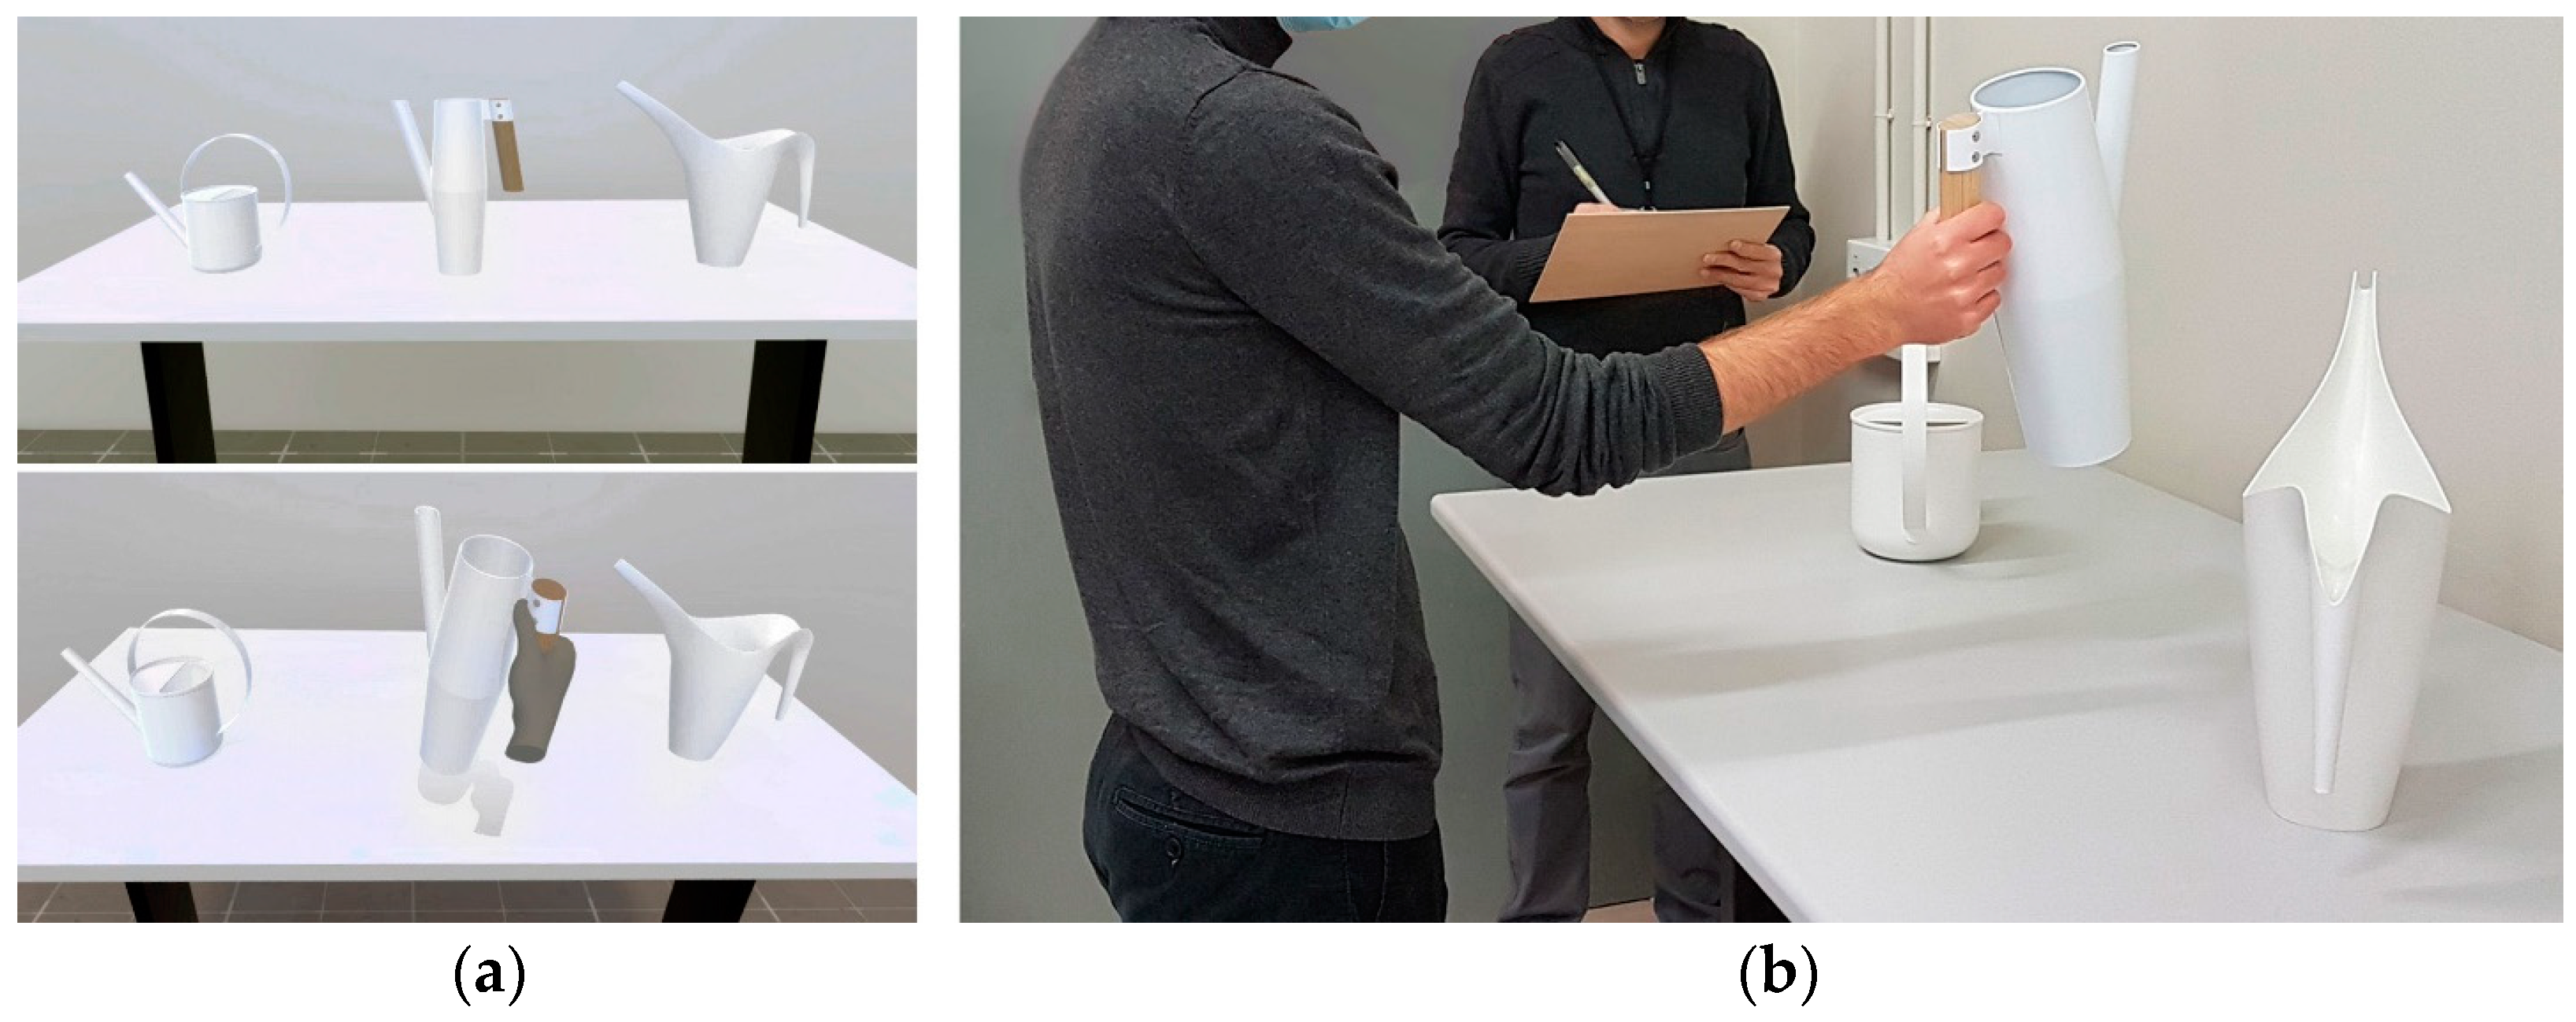
4.1. Case Study I
4.2. Case Study II
4.3. Product Evaluation
4.4. Materials
4.5. Sample
4.6. Experimental Protocol
- First case study:
- •
- R1. The participant entered the room. They were explained that they would see a table with four designs of a watering can, which they should touch with their hands gently (not lift them).
- •
- R2 or R3. Before entering the room, the researcher helped the participant put on the VR headset and helped them enter the room. They were instructed to look and move their hands in front of the viewer to familiarize themselves with their avatar. Similar to R1, the researcher explained that they would see a table with four products, which they should touch with their hands gently and not lift them.
- Second case study:
- •
- R1. The participant entered the room. They were explained that they would see a table and on it there were three watering cans, which they should pick up by the handle, lift them and move them in space.
- •
- R2. Before entering the room, the researcher helped the participant put on the VR headset and helped them enter the room. They were instructed to look and move their hands in front of the viewer to familiarize themselves with their avatar. They were explained that they would see a virtual room with a table and on it there were three watering cans, which they should pick up by the handle, lift them and move them in space.
5. Results
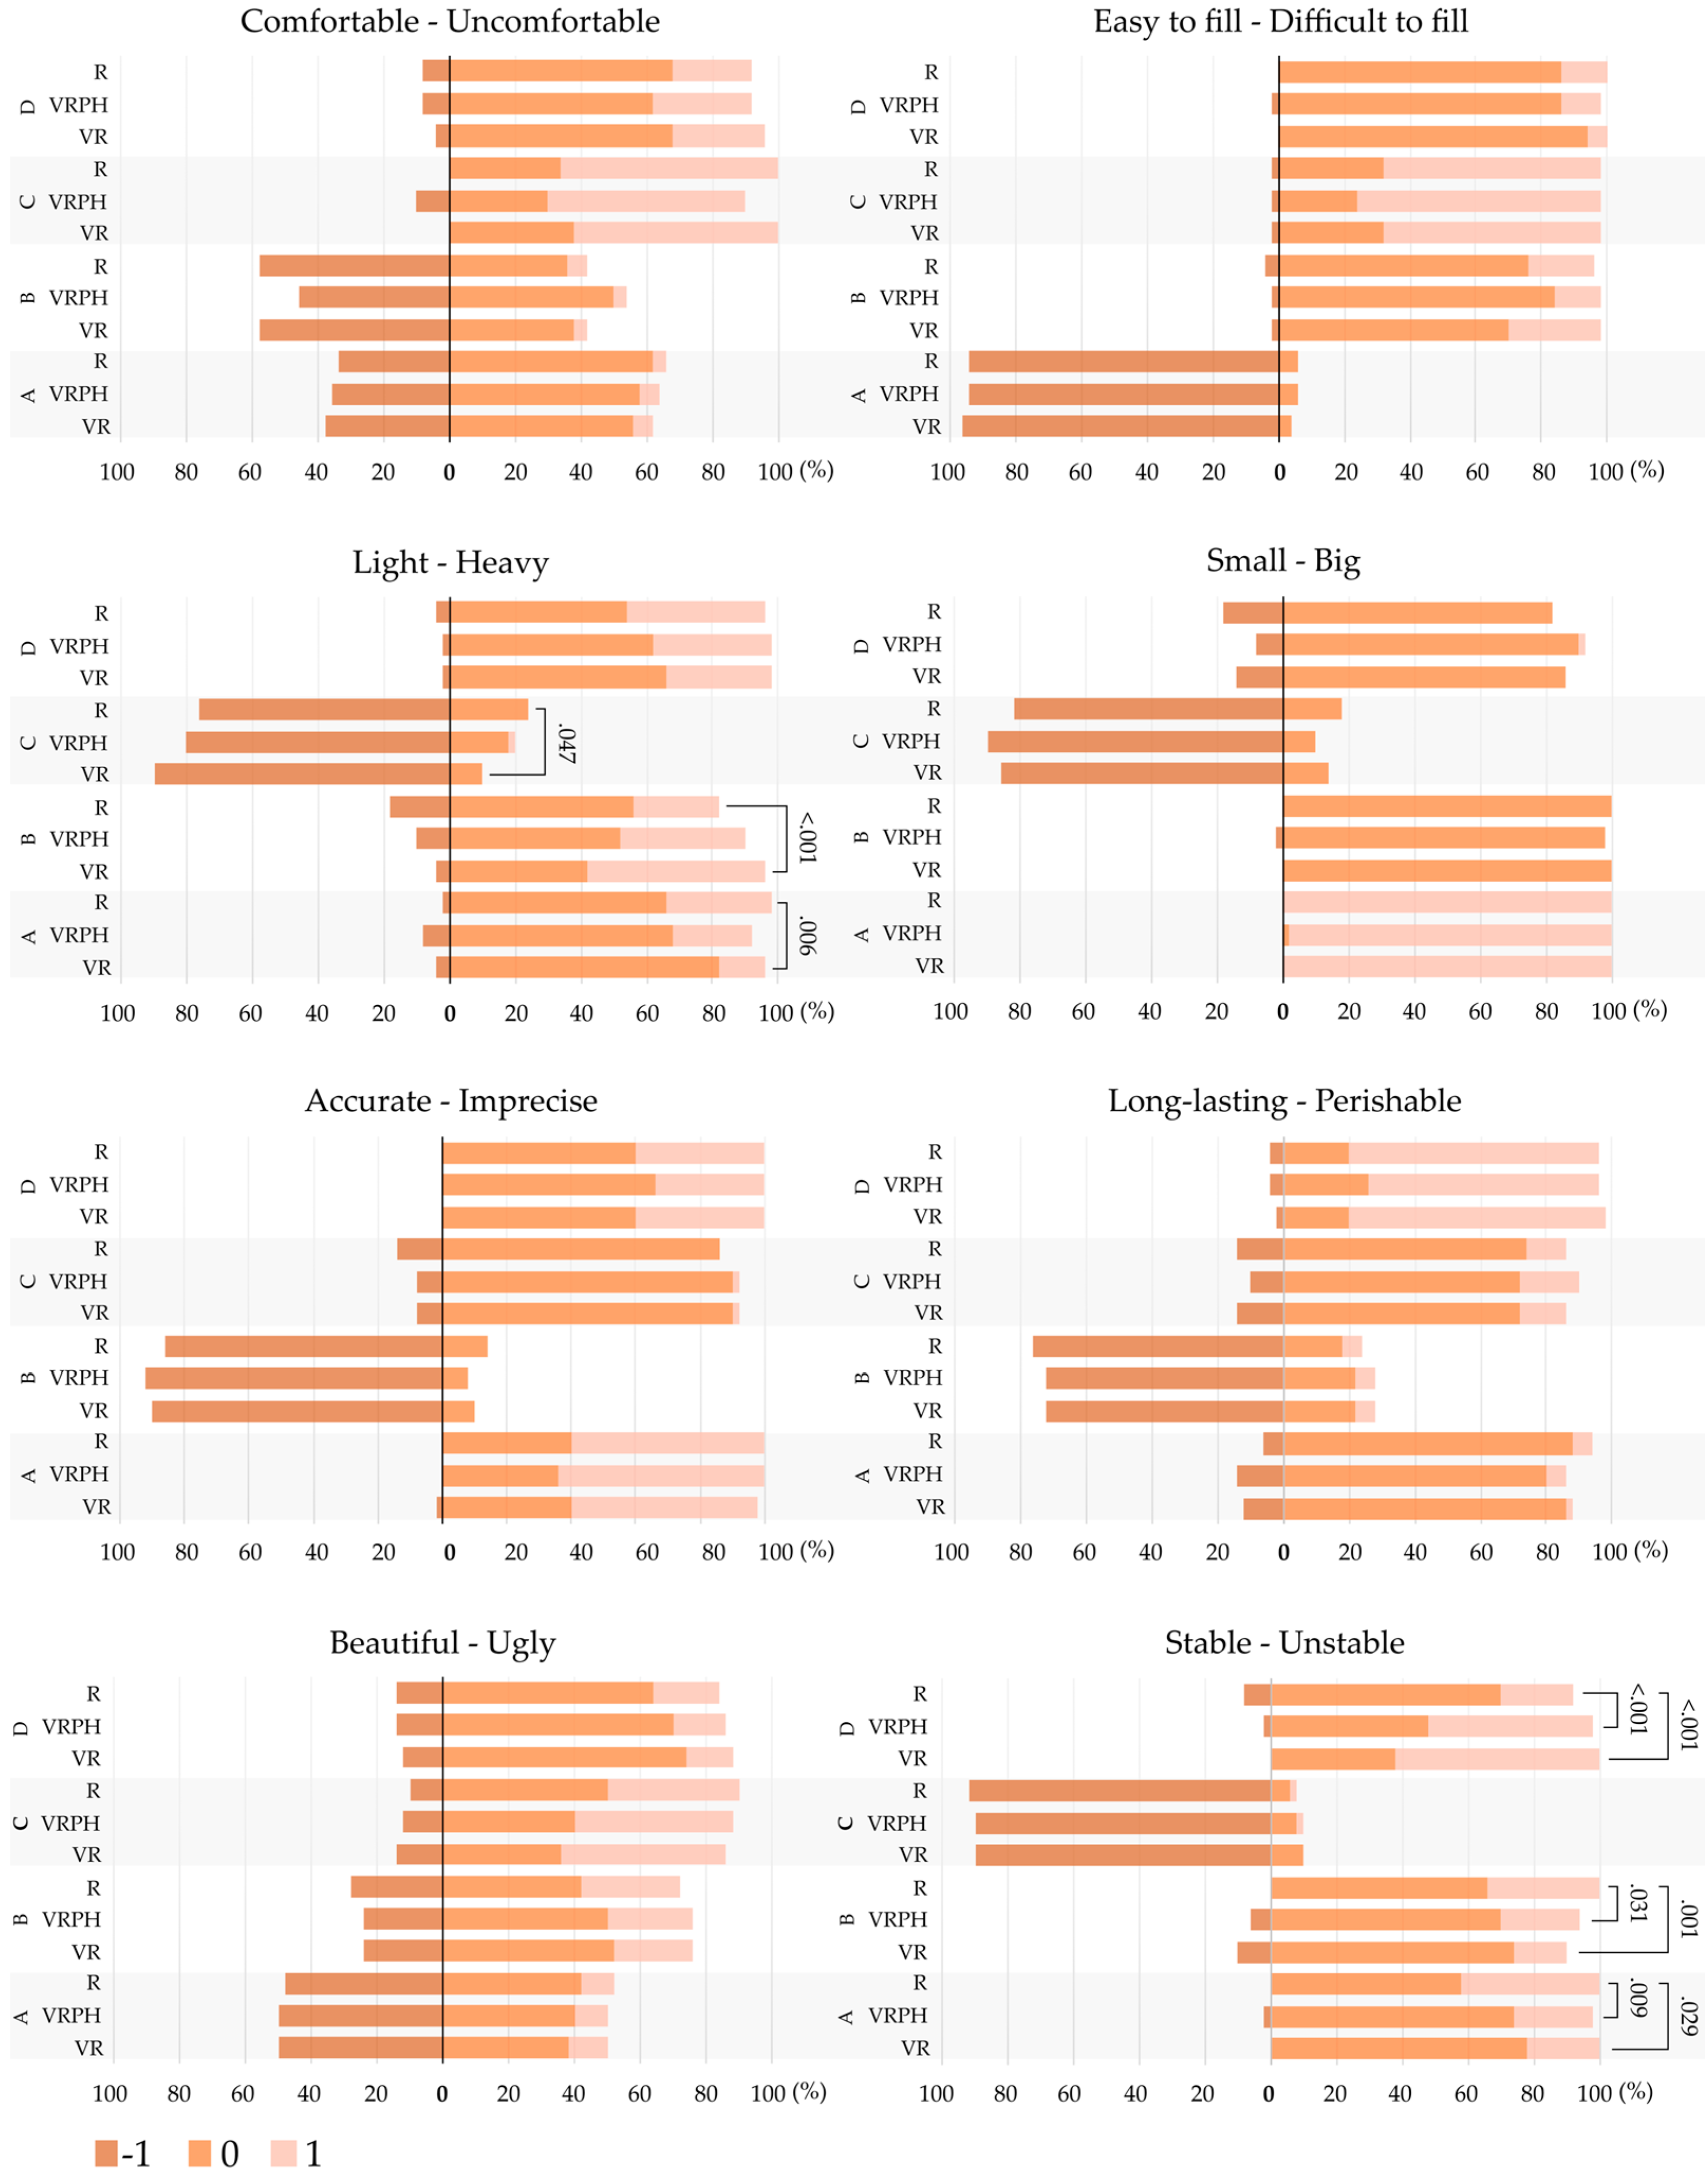
5.1. Case Study I
5.2. Case Study II
6. Discussion
7. Conclusions
Author Contributions
Funding
Informed Consent Statement
Data Availability Statement
Acknowledgments
Conflicts of Interest
References
- Chen, Y. Neurological effect of the aesthetics of product design on the decision-making process of consumers. NeuroQuantology 2018, 16, 501–506. [Google Scholar] [CrossRef] [Green Version]
- Cooper, R.G. The drivers of success in new-product development. Ind. Mark. Manag. 2019, 76, 36–47. [Google Scholar] [CrossRef]
- Palacios-Ibáñez, A.; Pirault, S.; Ochando-Marti, F.; Contero, M.; Camba, J.D. An Examination of the Relationship between Visualization Media and Consumer Product Evaluation. IEEE Trans. Vis. Comput. Graph. 2023, 1–15. [Google Scholar] [CrossRef] [PubMed]
- Jiang, Z.; Benbasat, I. Investigating the influence of the functional mechanisms of online product presentations. Inf. Syst. Res. 2007, 18, 454–470. [Google Scholar] [CrossRef] [Green Version]
- Hornsey, R.L.; Hibbard, P.B.; Scarfe, P. Size and shape constancy in consumer virtual reality. Behav. Res. Methods 2020, 52, 1587–1598. [Google Scholar] [CrossRef]
- Yoo, J.; Kim, M. The effects of online product presentation on consumer responses: A mental imagery perspective. J. Bus. Res. 2014, 67, 2464–2472. [Google Scholar] [CrossRef]
- Ludlow, B.L. Virtual Reality: Emerging Applications and Future Directions. Rural. Spec. Educ. Q. 2015, 34, 3–10. [Google Scholar] [CrossRef]
- Aziz, H. Virtual Reality Programs Applications in Healthcare. J. Heal. Med. Inform. 2018, 9, 305. [Google Scholar] [CrossRef]
- Meta: Introducing Meta: A Social Technology Company. Available online: https://about.fb.com/news/2021/10/facebook-company-is-now-meta/ (accessed on 25 February 2022).
- Berni, A.; Borgianni, Y. Applications of Virtual Reality in Engineering and Product Design: Why, What, How, When and Where. Electronics 2020, 9, 1064. [Google Scholar] [CrossRef]
- Shapes Corp. Quest Pro update with eye and face tracking for avatars, colored MR and stylus. Available online: https://www.shapesxr.com/post/new-avatars-eye-and-mouth-tracking-color-passthrough-stylus-and-more (accessed on 3 July 2023).
- Corporation, M. Microsoft Maquette. Available online: https://apps.microsoft.com/store/detail/microsoft-maquette/9NGD2SNL8Z4W?hl=en-us&gl=us (accessed on 3 July 2023).
- Cecil, J.; Kanchanapiboon, A. Virtual engineering approaches in product and process design. Int. J. Adv. Manuf. Technol. 2007, 31, 846–856. [Google Scholar] [CrossRef]
- Ottosson, S. Virtual reality in the product development process. J. Eng. Des. 2002, 13, 159–172. [Google Scholar] [CrossRef]
- Ye, J.; Campbell, R.I.; Page, T.; Badni, K.S. An investigation into the implementation of virtual reality technologies in support of conceptual design. Des. Stud. 2006, 27, 77–97. [Google Scholar] [CrossRef]
- Bordegoni, M. Product Virtualization: An Effective Method for the Evaluation of Concept Design of New Products. In Innovation in Product Design; Bordegoni, M., Rizzi, C., Eds.; Springer: London, UK, 2011; pp. 117–141. [Google Scholar] [CrossRef]
- Hannah, R.; Joshi, S.; Summers, J.D. A user study of interpretability of engineering design representations. J. Eng. Des. 2012, 23, 443–468. [Google Scholar] [CrossRef]
- Ye, J.; Badiyani, S.; Raja, V.; Schlegel, T. Applications of Virtual Reality in Product Design Evaluation. In Human-Computer Interaction; HCI Applications and Services; Springer: Berlin/Heidelberg, Germany, 2007; pp. 1190–1199. [Google Scholar] [CrossRef]
- Chu, C.-H.; Kao, E.-T. A Comparative Study of Design Evaluation with Virtual Prototypes Versus a Physical Product. Appl. Sci. 2020, 10, 4723. [Google Scholar] [CrossRef]
- Palacios-Ibáñez, A.; Alonso-García, M.; Contero, M.; Camba, J.D. The influence of hand tracking and haptic feedback for virtual prototype evaluation in the product design process. J. Mech. Des. 2022, 145, 041403. [Google Scholar] [CrossRef]
- Galán, J.; Felip, F.; García-García, C.; Contero, M. The influence of haptics when assessing household products presented in different means: A comparative study in real setting, flat display, and virtual reality environments with and without passive haptics. J. Comput. Des. Eng. 2021, 8, 330–342. [Google Scholar] [CrossRef]
- Lindeman, R.W.; Sibert, J.L.; Hahn, J.K. Hand-held windows: Towards effective 2D interaction in immersive virtual environments. In Proceedings of the IEEE Virtual Reality (Cat. No. 99CB36316), Houston, TX, USA, 13–17 March 1999; pp. 205–212. [Google Scholar] [CrossRef] [Green Version]
- Insko, B.E. Passive Haptics Significantly Enhances Virtual Environments; The University of North Carolina at Chapel Hill: Chapel Hill, NC, USA, 2001. [Google Scholar]
- Jerald, J. What Is Virtual Reality? In The VR Book; Association for Computing Machinery: New York, NY, USA, 2015; p. 9. [Google Scholar] [CrossRef]
- Voigt-Antons, J.-N.; Kojic, T.; Ali, D.; Moller, S. Influence of Hand Tracking as a Way of Interaction in Virtual Reality on User Experience. In Proceedings of the 2020 Twelfth International Conference on Quality of Multimedia Experience (QoMEX), Athlone, Ireland, 26–28 May 2020; IEEE: Athlone, Ireland, 2020; pp. 1–4. [Google Scholar] [CrossRef]
- Artacho-Ramírez, M.A.; Diego-Mas, J.A.; Alcaide-Marzal, J. Influence of the mode of graphical representation on the perception of product aesthetic and emotional features: An exploratory study. Int. J. Ind. Ergon. 2008, 38, 942–952. [Google Scholar] [CrossRef]
- Palacios-Ibáñez, A.; Ochando-Martí, F.; DCamba, J.; Contero, M. The influence of the visualization modality on consumer perception: A case study on household products. In Proceedings of the 13th International Conference on Applied Human Factors and Ergonomics, New York, NY, USA, 24–28 July 2022; Amic, G.H., Ed.; pp. 160–166. [Google Scholar] [CrossRef]
- Galán, J.; García-García, C.; Felip, F.; Contero, M. Does a presentation Media Influence the Evaluation of Consumer Products? A Comparative Study to Evaluate Virtual Reality, Virtual Reality with Passive Haptics and a Real Setting. Int. J. Interact. Multimed. Artif. Intell. 2021, 6, 196. [Google Scholar] [CrossRef]
- Felip, F.; Galán, J.; García-García, C.; Mulet, E. Influence of presentation means on industrial product evaluations with potential users: A first study by comparing tangible virtual reality and presenting a product in a real setting. Virtual Real. 2019, 24, 439–451. [Google Scholar] [CrossRef]
- Rodríguez-Parada, L.; Pardo-Vicente, M.-Á.; Sánchez-calle, A.; Pavón-Domínguez, P. Conceptual Design Using Virtual Reality: Case Study with Portable Light. In Lecture Notes in Mechanical Engineering; Springer: Berlin/Heidelberg, Germany, 2022; pp. 81–90. [Google Scholar] [CrossRef]
- Bordegoni, M.; Carulli, M. Evaluating Industrial Products in an Innovative Visual-Olfactory Environment. J. Comput. Inf. Sci. Eng. 2016, 16, 1–9. [Google Scholar] [CrossRef] [Green Version]
- Martínez-Navarro, J.; Bigné, E.; Guixeres, J.; Alcañiz, M.; Torrecilla, C. The influence of virtual reality in e-commerce. J. Bus. Res. 2019, 100, 475–482. [Google Scholar] [CrossRef]
- Jiang, Z.; Benbasat, I. The effects of presentation formats and task complexity on online consumers’ product understanding. MIS Q. Manag. Inf. Syst. 2007, 31, 475–500. [Google Scholar] [CrossRef] [Green Version]
- Söderman, M. Comparing Desktop Virtual Reality with handmade sketches and real products exploring key aspects for end-users’ understanding of proposed products. J. Des. Res. 2002, 2, 7–26. [Google Scholar] [CrossRef]
- Söderman, M. Virtual reality in product evaluations with potential customers: An exploratory study comparing virtual reality with conventional product representations. J. Eng. Des. 2005, 16, 311–328. [Google Scholar] [CrossRef]
- Palacios-Ibáñez, A.; Navarro-Martínez, R.; Blasco-Esteban, J.; Contero, M.; Camba, J.D. On the application of extended reality technologies for the evaluation of product characteristics during the initial stages of the product development process. Comput. Ind. 2023, 144, 103780. [Google Scholar] [CrossRef]
- Azmandian, M.; Hancock, M.; Benko, H.; Ofek, E.; Wilson, A.D. Haptic Retargeting: Dynamic Repurposing of Passive Haptics for Enhanced Virtual Reality Experiences. In Proceedings of the 2016 CHI Conference on Human Factors in Computing Systems, San Jose, CA, USA, 7–12 May 2016; ACM: New York, NY, USA, 2016; pp. 1968–1979. [Google Scholar] [CrossRef]
- Forbes, T.; Barnes, H.; Kinnell, P.; Goh, M. A Study into the Influence of Visual Prototyping Methods and Immersive Technologies on the Perception of Abstract Product Properties. In Proceedings of the DS 91: Proceedings of NordDesign 2018, Linköping, Sweden, 14–17 August 2018. [Google Scholar]
- Finn, A.; Louviere, J.J. Determining the Appropriate Response to Evidence of Public Concern: The Case of Food Safety. J. Public Policy Mark. 1992, 11, 12–25. [Google Scholar] [CrossRef]
- Luce, R.D. Individual Choice Behavior: A Theoretical Analysis; John Wiley & Sons: New York, NY, USA, 1959. [Google Scholar]
- Luce, R.D. Preference, utility, and subjective probability. Handb. Math. Psychol. 1965, 3, 235–406. [Google Scholar]
- Marley, A.A.J. Some probabilistic models of simple choice and ranking. J. Math. Psychol. 1968, 5, 333–355. [Google Scholar] [CrossRef] [Green Version]
- Helson, H. Adaptation-Level Theory: An experimental and systematic approach to behavior; Harper and Row: New York, NY, USA, 1964. [Google Scholar]
- Marley, A.A.J.; Louviere, J.J. Some probabilistic models of best, worst, and best-worst choices. J. Math. Psychol. 2005, 49, 464–480. [Google Scholar] [CrossRef]
- Faul, F.; Erdfelder, E.; Lang, A.G.; Buchner, A. G*Power 3: A flexible statistical power analysis program for the social, behavioral, and biomedical sciences. Behav. Res. Methods. 2007, 39, 175–191. [Google Scholar] [CrossRef]
- Higgins, J.J.; Blair, R.C.; Tashtoush, S. The Aligned Rank Transform Procedure. Conf. Appl. Stat. Agric. 1990. [Google Scholar] [CrossRef] [Green Version]
- Mansouri, H.; Paige, R.L.; Surles, J.G. Aligned rank transform techniques for analysis of variance and multiple comparisons. Commun. Stat. Theory Methods 2004, 33, 2217–2232. [Google Scholar] [CrossRef]
- Wobbrock, J.O.; Findlater, L.; Gergle, D.; Higgins, J.J. The aligned rank transform for nonparametric factorial analyses using only anova procedures. In Proceedings of the 2011 Annual Conference on Human Factors in Computing Systems—CHI ’11, Vancouver, BC, Canada, 7–12 May 2011; p. 143. [Google Scholar] [CrossRef] [Green Version]
- Singh, G.; Ellis, S.R.; Swan, J.E. The Effect of Focal Distance, Age, and Brightness on Near-Field Augmented Reality Depth Matching. IEEE Trans. Vis. Comput. Graph. 2020, 26, 1385–1398. [Google Scholar] [CrossRef] [Green Version]
- Jordan, P.W. Designing Pleasurable Products: An Introduction to the New Human Factors; CRC Press: Boca Raton, FL, USA, 2002. [Google Scholar]
- O’Keefe, R.M.; McEachern, T. Web-based Customer Decision Support Systems. Commun. ACM 1998, 41, 71–78. [Google Scholar] [CrossRef]
- Ant Ozok, A.; Komlodi, A. Better in 3D? an empirical investigation of user satisfaction and preferences concerning two-dimensional and three-dimensional product representations in business-to-consumer e-commerce. Int. J. Hum. Comput. Interact. 2009, 25, 243–281. [Google Scholar] [CrossRef]
- Hsu, C.C.; Fann, S.C.; Chuang, M.C. Relationship between eye fixation patterns and Kansei evaluation of 3D chair forms. Displays 2017, 50, 21–34. [Google Scholar] [CrossRef]
- Liu, X.; Yang, S. Study on product form design via Kansei engineering and virtual reality. J. Eng. Des. 2022, 33, 412–440. [Google Scholar] [CrossRef]
- Perez Mata, M.; Ahmed-Kristensen, S.; Brockhoff, P.B.; Yanagisawa, H. Investigating the influence of product perception and geometric features. Res. Eng. Des. 2017, 28, 357–379. [Google Scholar] [CrossRef]
- Achiche, S.; Maier, A.; Milanova, K.; Vadean, A. Visual Product Evaluation: Using the Semantic Differential to Investigate the Influence of Basic Geometry on User Perception. In Systems, Design, and Complexity; American Society of Mechanical Engineers: New York, NY, USA, 2014; Volume 11, pp. 1–10. [Google Scholar] [CrossRef]


| Product Model | ||||
|---|---|---|---|---|
| A (Vattenkrasse) | B (Chilifrukt) | C (Bittergurka) | D (Förenlig) | |
 |  |  |  | |
| Material | Metal | Glass | Metal, Wood | Metal |
| Capacity (L) | 0.9 | 1.2 | 2 | 1.5 |
| Weight (g) | 240 | 385 | 480 | 660 |
| Height (cm) | 16 | 21 | 30.5 | 26 |
| Base diameter (cm) | 11.5 | - | 8.5 | 8 |
| Base area (cm2) | 103.82 | 126.82 | 56.72 | 50.24 |
| Price (€) | 15 | 12 | 12 | 9 |
| R1 (R) | R2 (VR) | R3 (VRPH) | |
|---|---|---|---|
| Visual stimulus | Light beige floor, light gray walls, light gray table, four watering cans | ||
| Physical stimulus | Four watering cans | None | Four watering cans |
| Actions: Touch | Yes | Yes (virtual) | Yes |
| Avatar | No (real hands) | Yes (virtual hands) | Yes (virtual hands) |
| HMD | None | Oculus Quest 2 | Oculus Quest 2 |
| Product Model | |||
|---|---|---|---|
| A (Förenlig) | B (Bittergurka) | C (PS 2002) | |
 |  |  | |
| Material | Metal | Metal, Wood | Plastic |
| Capacity (L) | 1.5 | 2 | 1.2 |
| Weight (g) | 660 | 480 | 90 |
| Height (cm) | 26 | 30.5 | 32 |
| Base diameter (cm) | 8 | 8.5 | - |
| Base area (cm2) | 50.24 | 56.72 | 54.24 |
| Price (€) | 9 | 12 | 1.5 |
| R1 (R) | R2 (VR) | ||
|---|---|---|---|
| Visual stimulus | Light beige floor, light gray walls, very light gray table, three watering cans. | ||
| Physical stimulus | Three watering cans | None | |
| Actions: Touch | Catch | Yes | Yes (virtual) |
| Lifting | Yes | Yes (virtual) | |
| Move | Yes | Yes (virtual) | |
| Avatar | No (real hands) | Yes (virtual hands) | |
| HMD | None | Oculus Quest 2 | |
| Product Features | Adjective (Best) | Adjective (Worst) | |
|---|---|---|---|
| P1 | Grip comfort | Comfortable | Uncomfortable |
| P2 | Ease of filling | Easy to fill | Difficult to fill |
| P3 | Weight | Light | Heavy |
| P4 | Filling capacity | Small | Big |
| P5 | Irrigation precision | Accurate | Imprecise |
| P6 | Shelf life | Long-lasting | Perishable |
| P7 | Aesthetics | Beautiful | Ugly |
| P8 | Stability | Stable | Unstable |
| A | B | C | D | ||||||||||
|---|---|---|---|---|---|---|---|---|---|---|---|---|---|
| VR | VRPH | R | VR | VRPH | R | VR | VRPH | R | VR | VRPH | R | ||
| Comfortable– Uncomfortable | M | −0.32 | −0.30 | −0.30 | −0.54 | −0.42 | −0.52 | 0.62 | 0.50 | 0.66 | 0.24 | 0.22 | 0.16 |
| Mdn | 0.00 | 0.00 | 0.00 | −1.00 | 0.00 | 1.00 | 1.00 | 1.00 | 1.00 | 0.00 | 0.00 | 0.00 | |
| SD | 0.59 | 0.58 | 0.54 | 0.58 | 0.58 | 0.61 | 0.49 | 0.68 | 0.48 | 0.52 | 0.58 | 0.55 | |
| Easy to fill– Difficult to fill | M | −0.96 | −0.94 | −0.94 | 0.26 | 0.12 | 0.16 | 0.64 | 0.72 | 0.64 | 0.06 | 0.10 | 0.14 |
| Mdn | −1.00 | −1.00 | −1.00 | 0.00 | 0.00 | 0.00 | 1.00 | 1.00 | 1.00 | 0.00 | 0.00 | 0.00 | |
| SD | 0.20 | 0.24 | 0.24 | 0.49 | 0.39 | 0.47 | 0.53 | 0.50 | 0.53 | 0.24 | 0.36 | 0.35 | |
| Light– Heavy | M | 0.10 | 0.16 | 0.30 | 0.50 | 0.28 | 0.08 | −0.90 | −0.78 | −0.76 | 0.30 | 0.34 | 0.38 |
| Mdn | 0.00 | 0.00 | 0.00 | 1.00 | 0.00 | 0.00 | −1.00 | −1.00 | −1.00 | 0.00 | 0.00 | 0.00 | |
| SD | 0.42 | 0.55 | 0.51 | 0.58 | 0.64 | 0.67 | 0.30 | 0.47 | 0.43 | 0.51 | 0.52 | 0.57 | |
| Small– Big | M | 1.00 | 0.98 | 1.00 | 0.00 | −0.02 | 0.00 | −0.86 | −0.90 | −0.82 | −0.14 | −0.06 | −0.18 |
| Mdn | 1.00 | 1.00 | 1.00 | 0.00 | 0.00 | 0.00 | −1.00 | −1.00 | −1.00 | 0.00 | 0.00 | 0.00 | |
| SD | 0.00 | 0.14 | 0.00 | 0.00 | 0.14 | 0.00 | 0.35 | 0.30 | 0.39 | 0.35 | 0.31 | 0.39 | |
| Accurate– Imprecise | M | 0.56 | 0.64 | 0.60 | −0.90 | −0.92 | −0.86 | −0.06 | −0.06 | −0.14 | 0.40 | 0.34 | 0.40 |
| Mdn | 1.00 | 1.00 | 1.00 | −1.00 | −1.00 | −1.00 | 0.00 | 0.00 | 0.00 | 0.00 | 0.00 | 0.00 | |
| SD | 0.54 | 0.49 | 0.50 | 0.30 | 0.27 | 0.35 | 0.31 | 0.31 | 0.35 | 0.50 | 0.48 | 0.50 | |
| Long-lasting– Perishable | M | −0.10 | −0.08 | 0.00 | −0.66 | −0.66 | −0.70 | 0.00 | 0.08 | −0.02 | 0.76 | 0.66 | 0.72 |
| Mdn | 0.00 | 0.00 | 0.00 | −1.00 | −1.00 | −1.00 | 0.00 | 0.00 | 0.00 | 1.00 | 1.00 | 1.00 | |
| SD | 0.36 | 0.44 | 0.35 | 0.59 | 0.59 | 0.58 | 0.54 | 0.53 | 0.52 | 0.48 | 0.56 | 0.54 | |
| Beautiful– Ugly | M | −0.38 | −0.40 | −0.38 | 0.00 | 0.02 | 0.02 | 0.36 | 0.36 | 0.30 | 0.02 | 0.02 | 0.06 |
| Mdn | −0.50 | −0.50 | 0.00 | 0.00 | 0.00 | 0.00 | 0.50 | 0.00 | 0.00 | 0.00 | 0.00 | 0.00 | |
| SD | 0.70 | 0.67 | 0.67 | 0.70 | 0.71 | 0.77 | 0.72 | 0.69 | 0.65 | 0.52 | 0.55 | 0.59 | |
| Stable– Unstable | M | 0.22 | 0.22 | 0.42 | 0.06 | 0.18 | 0.34 | −0.90 | −0.88 | −0.90 | 0.62 | 0.48 | 0.14 |
| Mdn | 0.00 | 0.00 | 0.00 | 0.00 | 0.00 | 0.00 | −1.00 | −1.00 | −1.00 | 1.00 | 0.50 | 0.00 | |
| SD | 0.42 | 0.47 | 0.50 | 0.51 | 0.52 | 0.48 | 0.30 | 0.39 | 0.36 | 0.49 | 0.54 | 0.54 | |
| A | B | C | D | ||||||||||
|---|---|---|---|---|---|---|---|---|---|---|---|---|---|
| VR | VRPH | R | VR | VRPH | R | VR | VRPH | R | VR | VRPH | R | ||
| Like | M | −0.48 | −0.44 | −0.38 | −0.22 | −0.20 | −0.16 | 0.38 | 0.32 | 0.24 | 0.32 | 0.32 | 0.30 |
| Mdn | −0.00 | −0.00 | −0.50 | 0.00 | 0.00 | 0.00 | 0.00 | 0.00 | 0.00 | 0.00 | 0.00 | 0.00 | |
| SD | 0.61 | 0.64 | 0.70 | 0.65 | 0.67 | 0.65 | 0.64 | 0.59 | 0.66 | 0.55 | 0.62 | 0.61 | |
| Purchase decision | M | 0.06 | 0.08 | 0.12 | 0.06 | 0.04 | 0.04 | 0.32 | 0.30 | 0.24 | 0.34 | 0.36 | 0.34 |
| Mdn | 0.00 | 0.00 | 0.00 | 0.00 | 0.00 | 0.00 | 0.00 | 0.00 | 0.00 | 0.00 | 0.00 | 0.00 | |
| SD | 0.24 | 0.27 | 0.33 | 0.24 | 0.20 | 0.20 | 0.47 | 0.46 | 0.43 | 0.48 | 0.49 | 0.48 | |
| A | B | C | D | |||||||
|---|---|---|---|---|---|---|---|---|---|---|
| df | F | Sig. | F | Sig. | F | Sig. | F | Sig. | ||
| Comfortable–Uncomfortable | 2 | 0.081 | p = 0.922 | 1.550 | p = 0.218 | 1.290 | p = 0.280 | 0.649 | p = 0.525 | |
| Easy to fill–Difficult to fill | 0.197 | p = 0.822 | 2.370 | p = 0.099 | 0.940 | p = 0.394 | 1.370 | p = 0.258 | ||
| Light–Heavy | 3.470 | p = 0.035 | 7.780 | p < 0.001 | 3.400 | p = 0.038 | 0.600 | p = 0.551 | ||
| Small–Big | 1.000 | p = 0.372 | 1.000 | p = 0.372 | 1.090 | p = 339 | 2.330 | p = 0.102 | ||
| Accurate–Imprecise | 0.859 | p = 0.427 | 0.696 | p = 0.501 | 1.450 | p = 0.241 | 1.130 | p = 0.328 | ||
| Long-lasting–Perishable | 1.940 | p = 0.149 | 0.252 | p = 0.777 | 1.050 | p = 0.354 | 1.110 | p = 0.335 | ||
| Beautiful–Ugly | 0.035 | p = 0.966 | 0.045 | p = 0.956 | 0.804 | p = 0.450 | 0.282 | p = 0.755 | ||
| Stable–Unstable | 5.750 | p = 0.004 | 9.82 | p < 0.001 | 0.073 | p = 0.930 | 20.700 | p < 0.001 | ||
| Like | 1.140 | p = 0.325 | 0.270 | p = 0.764 | 1.830 | p = 0.166 | 0.062 | p = 0.940 | ||
| A | B | C | D | ||
|---|---|---|---|---|---|
| Light–Heavy | VR–VRPH | p = 0.664 | p = 0.122 | p = 0.133 | |
| VR–R | p = 0.006 | p < 0.001 | p = 0.047 | ||
| VRPH–R | p = 0.302 | p = 0.15 | p = 0.801 | ||
| Stable–Unstable | VR–VRPH | p = 0.995 | p = 0.158 | p = 0.144 | |
| VR–R | p = 0.029 | p < 0.001 | p < 0.001 | ||
| VRPH–R | p = 0.009 | p = 0.031 | p < 0.001 |
| A | B | C | |||||
|---|---|---|---|---|---|---|---|
| VR | R | VR | R | VR | R | ||
| Comfortable–Uncomfortable | M | −0.52 | −0.55 | 0.12 | 0.33 | 0.40 | 0.22 |
| Mdn | −1.00 | −1.00 | 0.00 | 0.00 | 1.00 | 0.00 | |
| SD | 0.70 | 0.76 | 0.79 | 0.64 | 0.68 | 0.76 | |
| Easy to fill–Difficult to fill | M | −0.73 | 0.01 | −0.10 | 0.10 | 0.84 | −0.12 |
| Mdn | −1.00 | 0.00 | 0.00 | 0.00 | 1.00 | 0.00 | |
| SD | 0.57 | 0.99 | 0.46 | 0.39 | 0.48 | 0.93 | |
| Light–Heavy | M | 0.03 | −0.61 | −0.73 | −0.28 | 0.70 | 0.90 |
| Mdn | 0.00 | −1.00 | −1.00 | 0.00 | 1.00 | 1.00 | |
| SD | 0.65 | 0.52 | 0.54 | 0.60 | 0.52 | 0.35 | |
| Small–Big | M | 0.97 | 0.87 | −0.25 | −0.30 | −0.72 | −0.57 |
| Mdn | 1.00 | 1.00 | 0.00 | 0.00 | −1.00 | −1.00 | |
| SD | 0.17 | 0.46 | 0.50 | 0.60 | 0.45 | 0.53 | |
| Accurate–Imprecise | M | 0.69 | 0.60 | −0.55 | −0.45 | −0.13 | −0.15 |
| Mdn | 1.00 | 1.00 | −1.00 | −1.00 | 0.00 | 0.00 | |
| SD | 0.50 | 0.58 | 0.58 | 0.68 | 0.80 | 0.80 | |
| Long-lasting–Perishable | M | 0.33 | 0.55 | 0.03 | −0.07 | −0.36 | −0.48 |
| Mdn | 0.00 | 1.00 | 0.00 | 0.00 | −1.00 | −1.00 | |
| SD | 0.75 | 0.58 | 0.80 | 0.74 | 0.77 | 0.77 | |
| Beautiful–Ugly | M | −0.22 | −0.10 | 0.01 | 0.10 | 0.21 | 0.00 |
| Mdn | 0.00 | 0.00 | 0.00 | 0.00 | 0.00 | 0.00 | |
| SD | 0.67 | 0.70 | 0.90 | 0.86 | 0.83 | 0.89 | |
| Stable–Unstable | M | 0.90 | 0.97 | −0.37 | −0.30 | −0.52 | −0.67 |
| Mdn | 1.00 | 1.00 | 0.00 | 0.00 | −1.00 | −1.00 | |
| SD | 0.39 | 0.17 | 0.55 | 0.52 | 0.59 | 0.47 | |
| A | B | C | |||||
|---|---|---|---|---|---|---|---|
| VR | R | VR | R | VR | R | ||
| Like | M | −0.27 | −0.16 | −0.15 | 0.06 | 0.42 | 0.09 |
| Mdn | 0.00 | 0.00 | 0.00 | 0.00 | 1.00 | 0.00 | |
| SD | 0.73 | 0.75 | 0.78 | 0.83 | 00.78 | 0.85 | |
| Purchase decision | M | 0.12 | 0.18 | 0.18 | 0.27 | 0.54 | 0.34 |
| Mdn | 0.00 | 0.00 | 0.00 | 0.00 | 1.00 | 0.00 | |
| SD | 0.33 | 0.39 | 0.39 | 0.45 | 0.50 | 0.48 | |
| df | A | B | C | |||||
|---|---|---|---|---|---|---|---|---|
| F | Sig. | F | Sig. | F | Sig. | |||
| Comfortable–Uncomfortable | Media | 2 | 0.040 | p = 0.841 | 2.010 | p = 0.161 | 3.530 | p = 0.065 |
| Background | 0.670 | p = 0.416 | 0.243 | p = 0.624 | 3.830 | p = 0.055 | ||
| Mixed | 16.100 | p < 0.001 | 0.223 | p = 0.638 | 11.384 | p < 0.001 | ||
| Easy to fill–Difficult to fill | Media | 125.460 | p < 0.001 | 14.500 | p < 0.001 | 213.984 | p < 0.001 | |
| Background | 223.000 | p < 0.001 | 7.320 | p = 0.009 | 86.600 | p < 0.001 | ||
| Mixed | 207.200 | p < 0.001 | 1.990 | p = 0.163 | 192.990 | p < 0.001 | ||
| Light–Heavy | Media | 57.450 | p < 0.001 | 53.183 | p < 0.001 | 7.780 | p = 0.007 | |
| Background | 53.700 | p < 0.001 | 54.700 | p < 0.001 | 3.100 | p = 0.083 | ||
| Mixed | 3.590 | p = 0.063 | 18.400 | p < 0.001 | 2.840 | p = 0.097 | ||
| Small–Big | Media | 2.670 | p = 0.107 | 0.454 | p = 0.503 | 6.990 | p = 0.010 | |
| Background | 2.600 | p = 0.112 | 1.890 | p = 0.174 | 6.380 | p = 0.014 | ||
| Mixed | 5.910 | p = 0.018 | 0.042 | p = 0.838 | 2.300 | p = 0.134 | ||
| Accurate–Imprecise | Media | 1.450 | p = 0.234 | 2.210 | p = 0.142 | 0.003 | p = 0.957 | |
| Background | 0.010 | p = 0.921 | 1.130 | p = 0.291 | 0.300 | p = 0.586 | ||
| Mixed | 0.520 | p = 0.473 | 4.300 | p = 0.042 | 1.910 | p = 0.171 | ||
| Long-lasting–Perishable | Media | 2.630 | p = 0.109 | 1.050 | p = 0.310 | 1.540 | p = 0.219 | |
| Background | 5.980 | p = 0.017 | 4.080 | p = 0.048 | 0.003 | p = 0.954 | ||
| Mixed | 0.210 | p = 0.648 | 1.360 | p = 0.248 | 1.540 | p = 0.219 | ||
| Beautiful–Ugly | Media | 4.290 | p = 0.042 | 2.640 | p = 0.109 | 3.430 | p = 0.068 | |
| Background | 0.020 | p = 0.884 | 0.181 | p = 0.672 | 0.151 | p = 0.699 | ||
| Mixed | 1.580 | p = 0.213 | 0.003 | p = 0.950 | 0.363 | p = 0.549 | ||
| Stable–Unstable | Media | 0.270 | p = 0.608 | 1.880 | p = 0.175 | 4.130 | p = 0.046 | |
| Background | 0.100 | p = 0.753 | 0.073 | p = 0.788 | 0.501 | p = 0.481 | ||
| Mixed | 0.210 | p = 0.650 | 4.950 | p = 0.029 | 3.660 | p = 0.060 | ||
Disclaimer/Publisher’s Note: The statements, opinions and data contained in all publications are solely those of the individual author(s) and contributor(s) and not of MDPI and/or the editor(s). MDPI and/or the editor(s) disclaim responsibility for any injury to people or property resulting from any ideas, methods, instructions or products referred to in the content. |
© 2023 by the authors. Licensee MDPI, Basel, Switzerland. This article is an open access article distributed under the terms and conditions of the Creative Commons Attribution (CC BY) license (https://creativecommons.org/licenses/by/4.0/).
Share and Cite
Palacios-Ibáñez, A.; Felip-Miralles, F.; Galán, J.; García-García, C.; Contero, M. Consumer Subjective Impressions in Virtual Reality Environments: The Role of the Visualization Technique in Product Evaluation. Electronics 2023, 12, 3051. https://doi.org/10.3390/electronics12143051
Palacios-Ibáñez A, Felip-Miralles F, Galán J, García-García C, Contero M. Consumer Subjective Impressions in Virtual Reality Environments: The Role of the Visualization Technique in Product Evaluation. Electronics. 2023; 12(14):3051. https://doi.org/10.3390/electronics12143051
Chicago/Turabian StylePalacios-Ibáñez, Almudena, Francisco Felip-Miralles, Julia Galán, Carlos García-García, and Manuel Contero. 2023. "Consumer Subjective Impressions in Virtual Reality Environments: The Role of the Visualization Technique in Product Evaluation" Electronics 12, no. 14: 3051. https://doi.org/10.3390/electronics12143051