
Impact of 3G and 4G Technology Performance on Customer Satisfaction in the Telecommunication Industry

 , , , ,
  ,
, 
Abstract
:1. Introduction
1.1. The Cellular Communication Evaluation and Technologies
1.1.1. 1G Technology
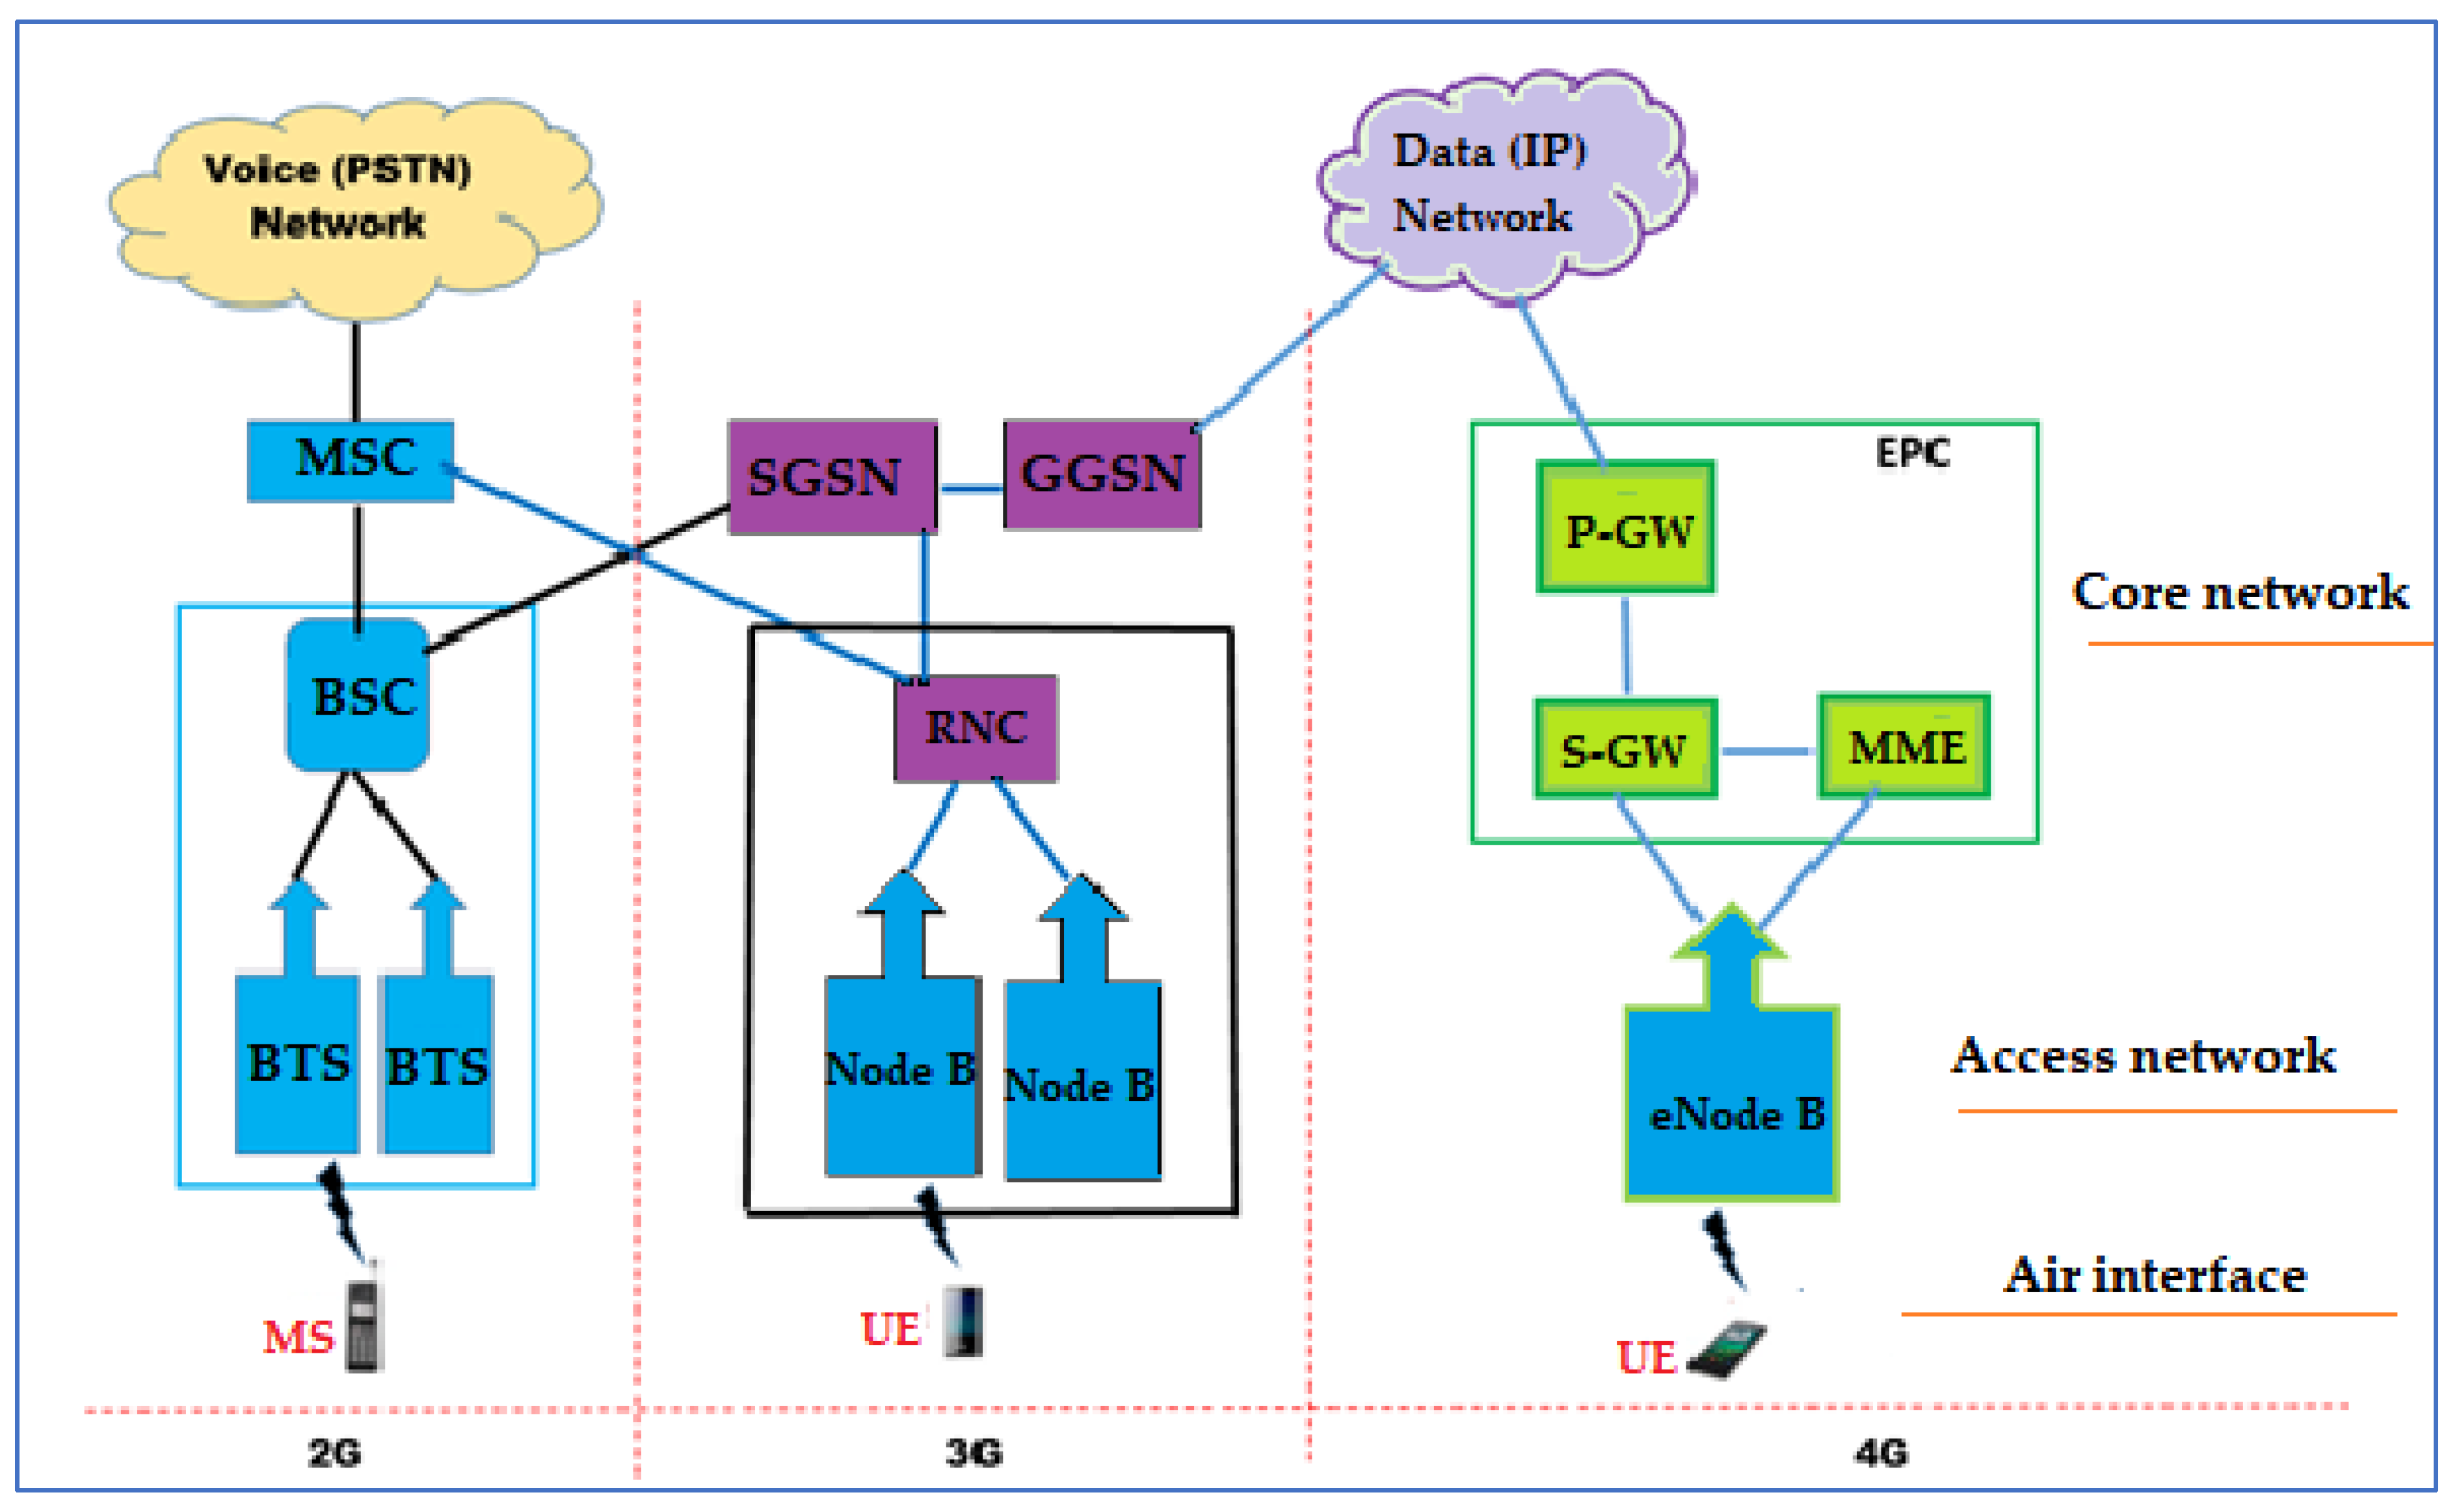
1.1.2. 2G Technology
1.1.3. 3G Technology
1.1.4. 4G Technology
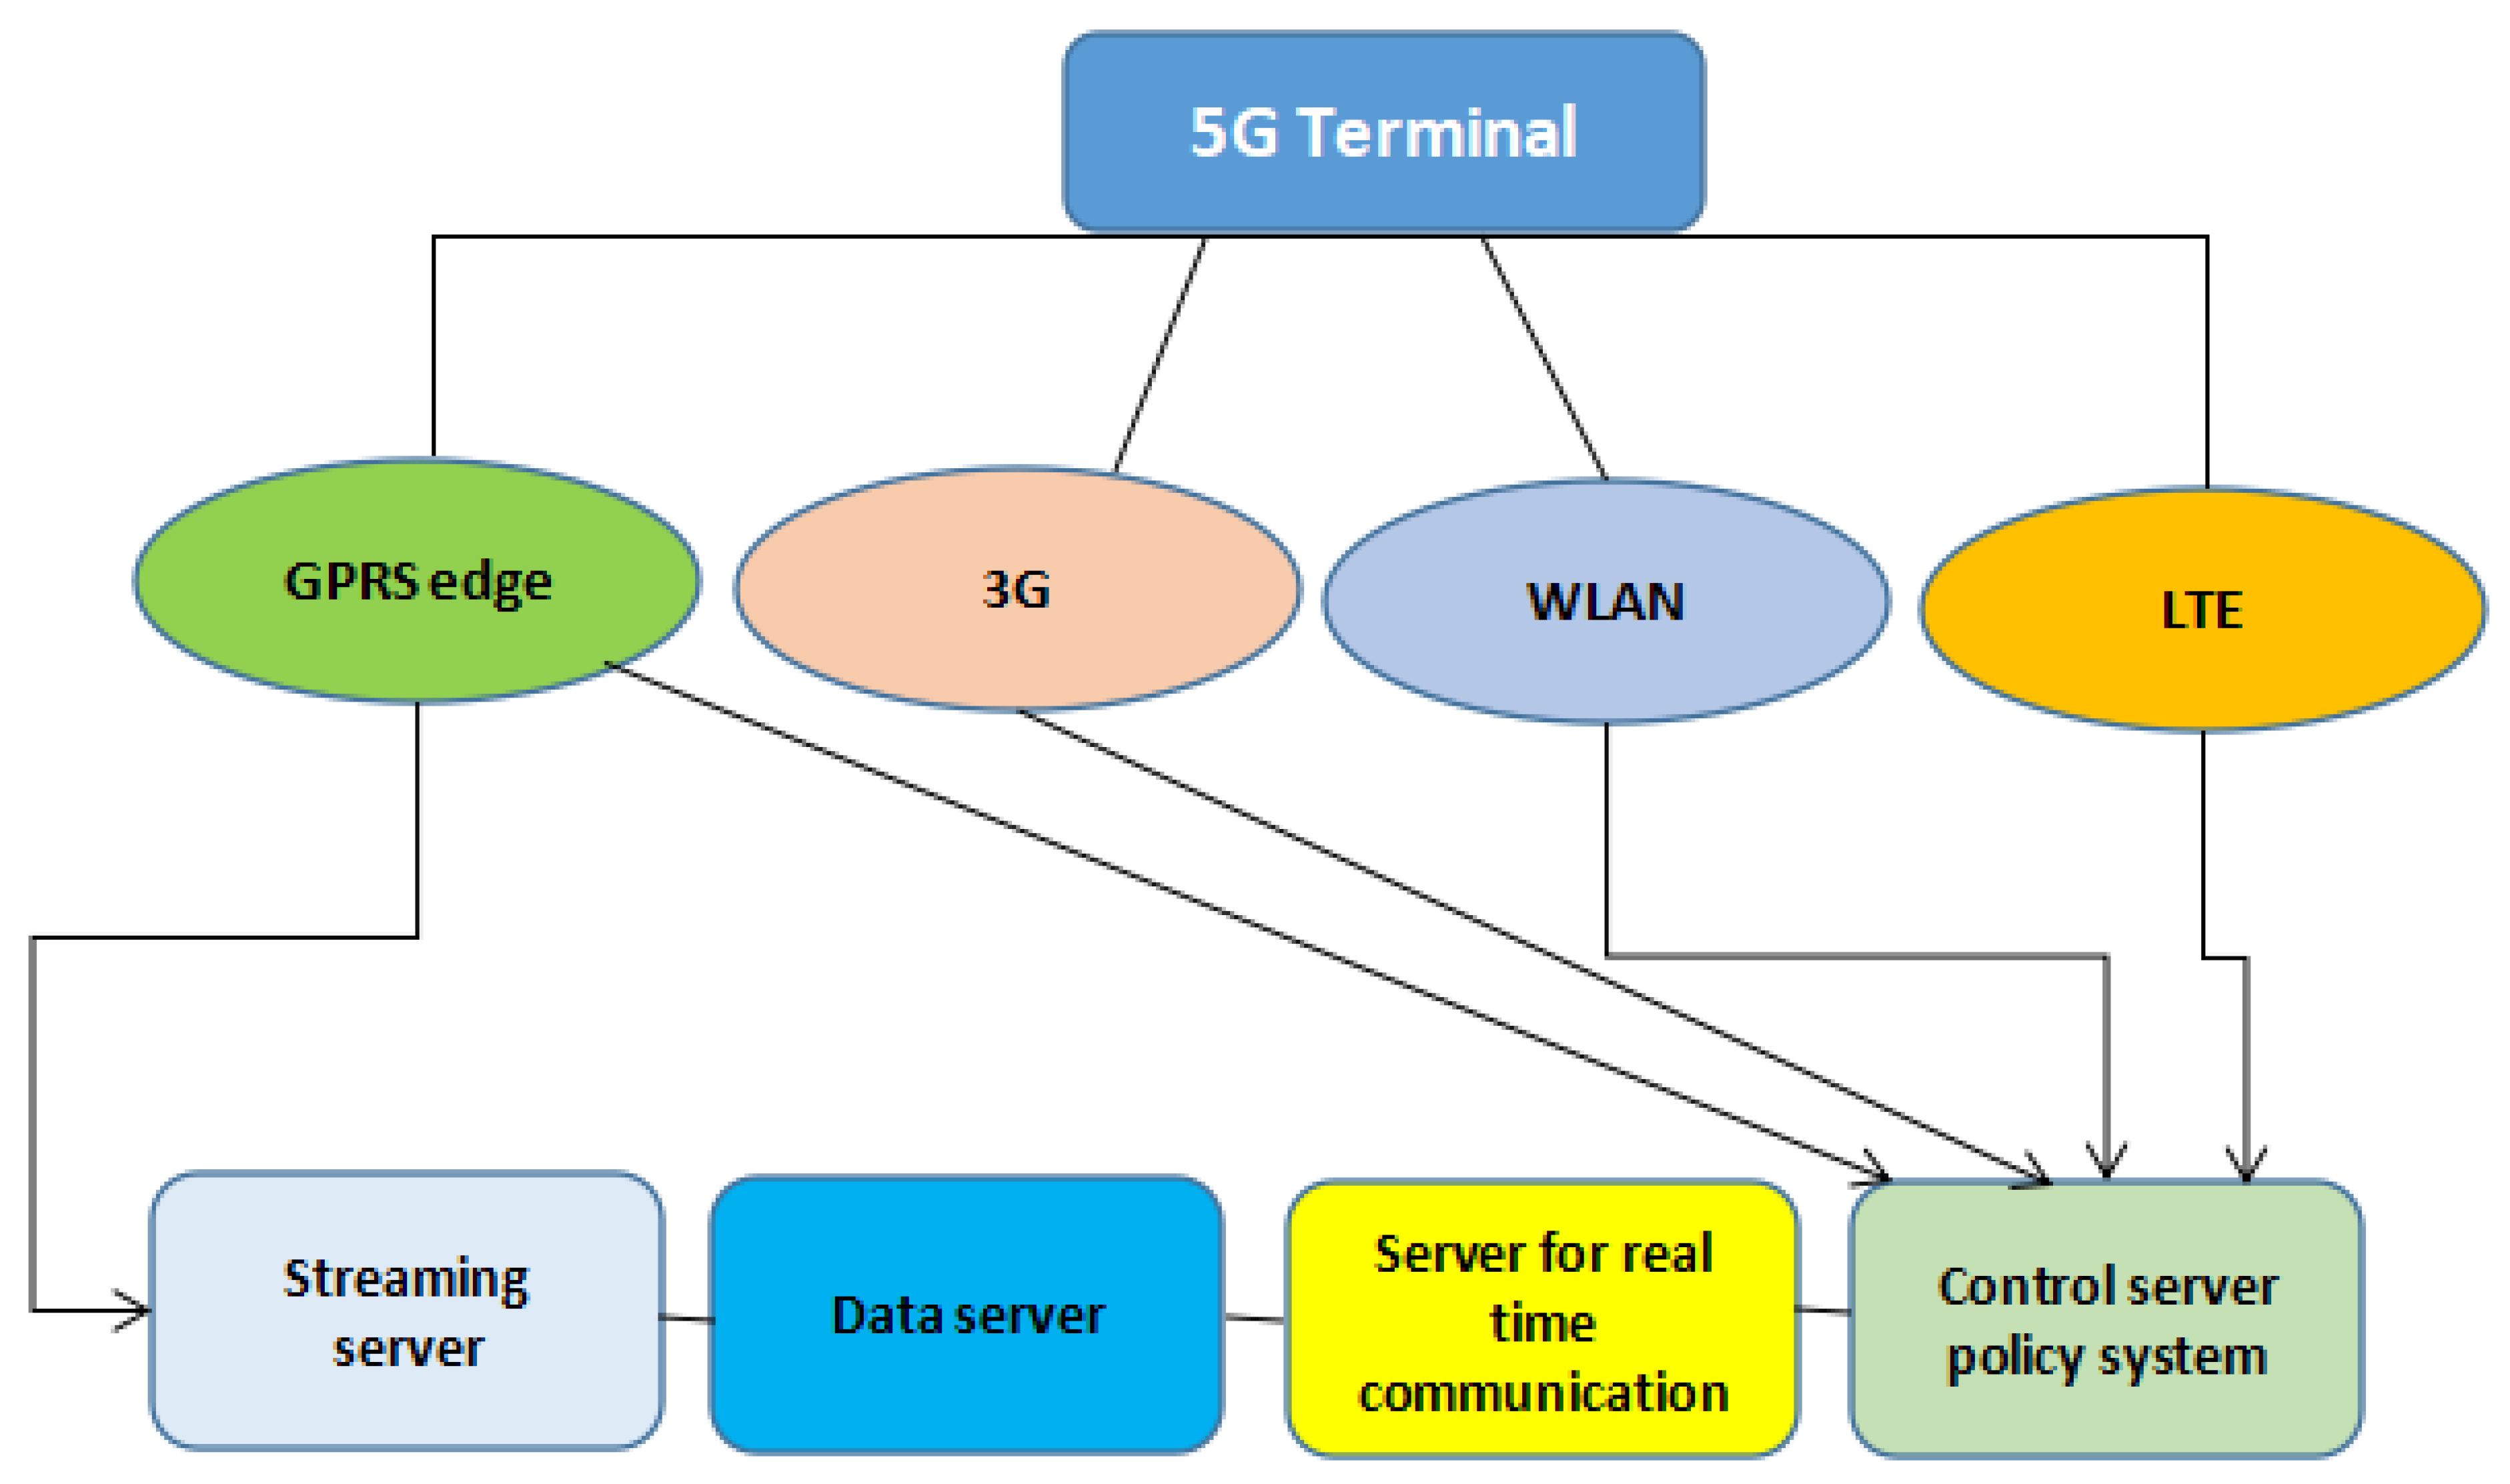
1.1.5. 5G Technology
1.2. Machine Learning (ML) Techniques for the Wireless Communications
1.3. Big Data Analysis in Wireless Communication
1.4. Contributions of Our Study
- ⮚
- Emphasizing the factors which increase customer value.
- ⮚
- How each player in the telecom industry can increase its market share?
- ⮚
- How to retain current customers and attract new customers?
- ⮚
- Why 5G is necessary to be introduced in Pakistan without any further delay.
- ⮚
- What technological advancement must need before implementing the 5G network in Pakistan?
2. Related Work
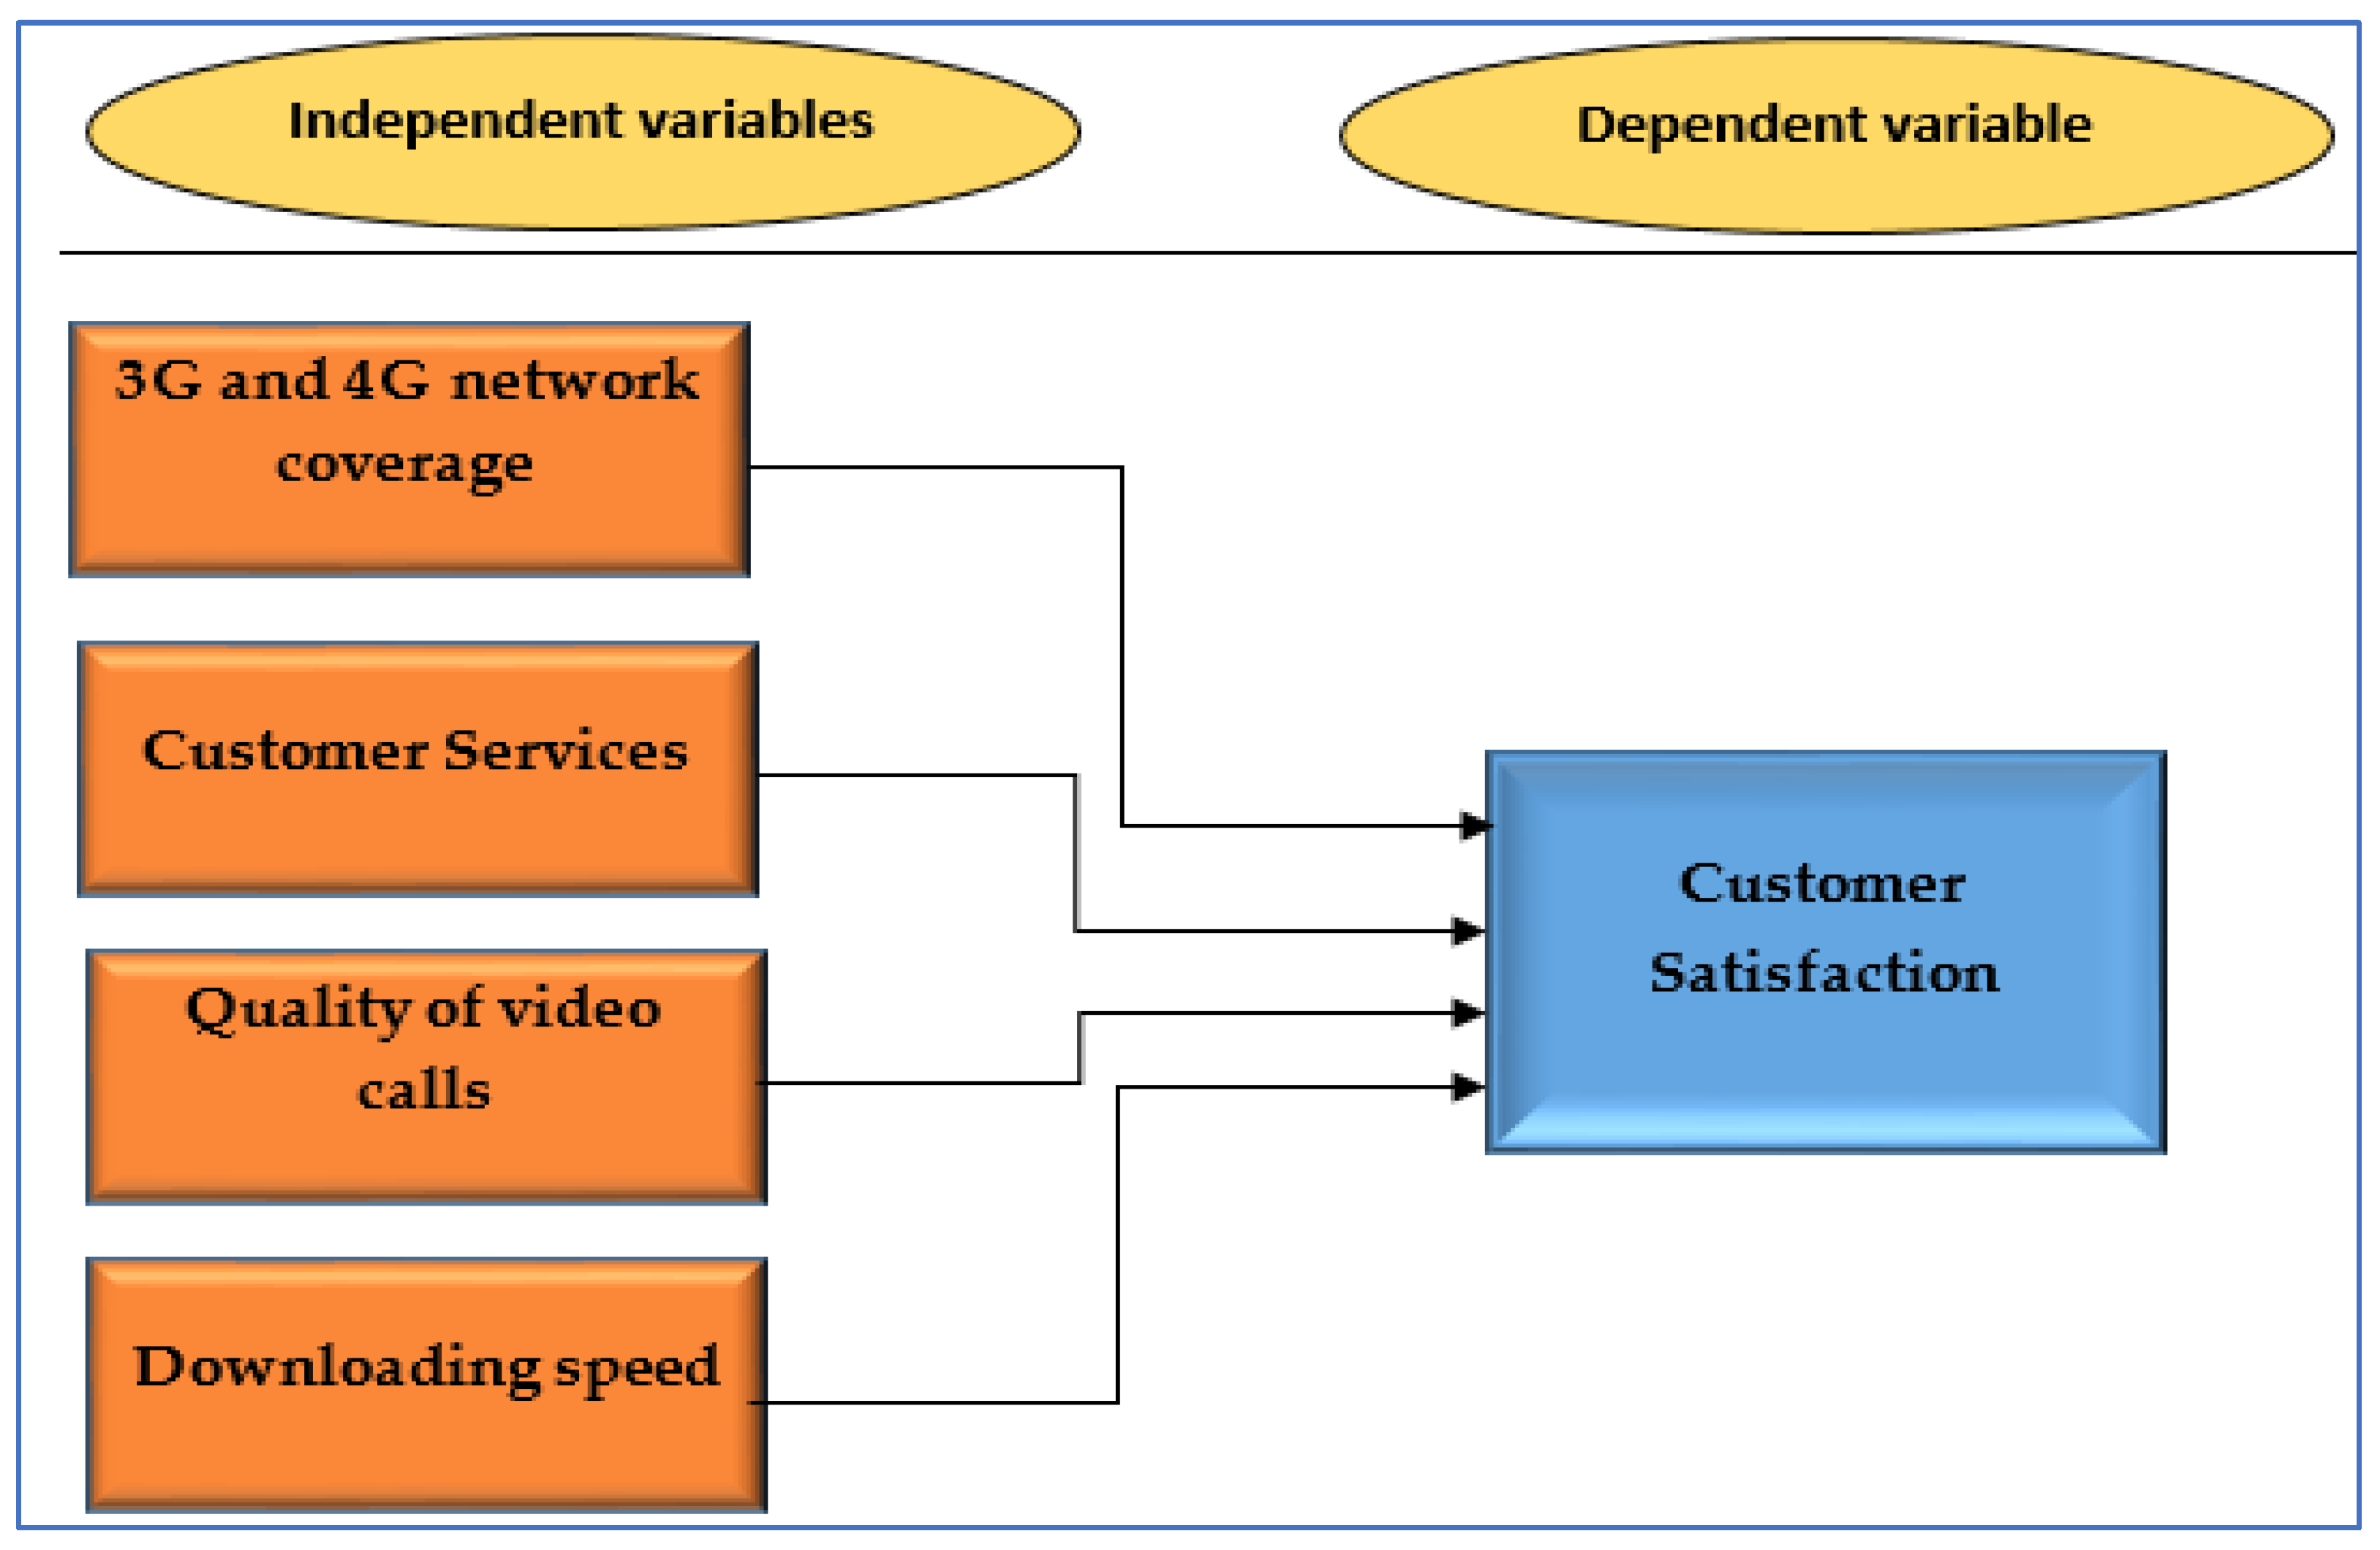
2.1. Theoretical Framework
2.2. Hypotheses of the Study
3. Research Methodology
3.1. Variables and Target Population
3.2. Questionnaire and Treatment of Scales
3.3. Data Collection Procedure
4. Results and Analysis
4.1. Descriptive Statistics
4.1.1. Demographics
- i.
- Gender
- ii.
- Age
- iii.
- Education
- iv.
- Network SIM Connection type
- v.
- Telecom Operators in Punjab, Pakistan
- vi.
- The city using the Internet
Gender
Age
Education
Network SIM Connection Type
Telecom Operators in Punjab Pakistan
Cities Using the Internet
4.2. Data Analysis Techniques (Data Screening)
4.3. Level of Analysis
4.4. Reliability and Validity
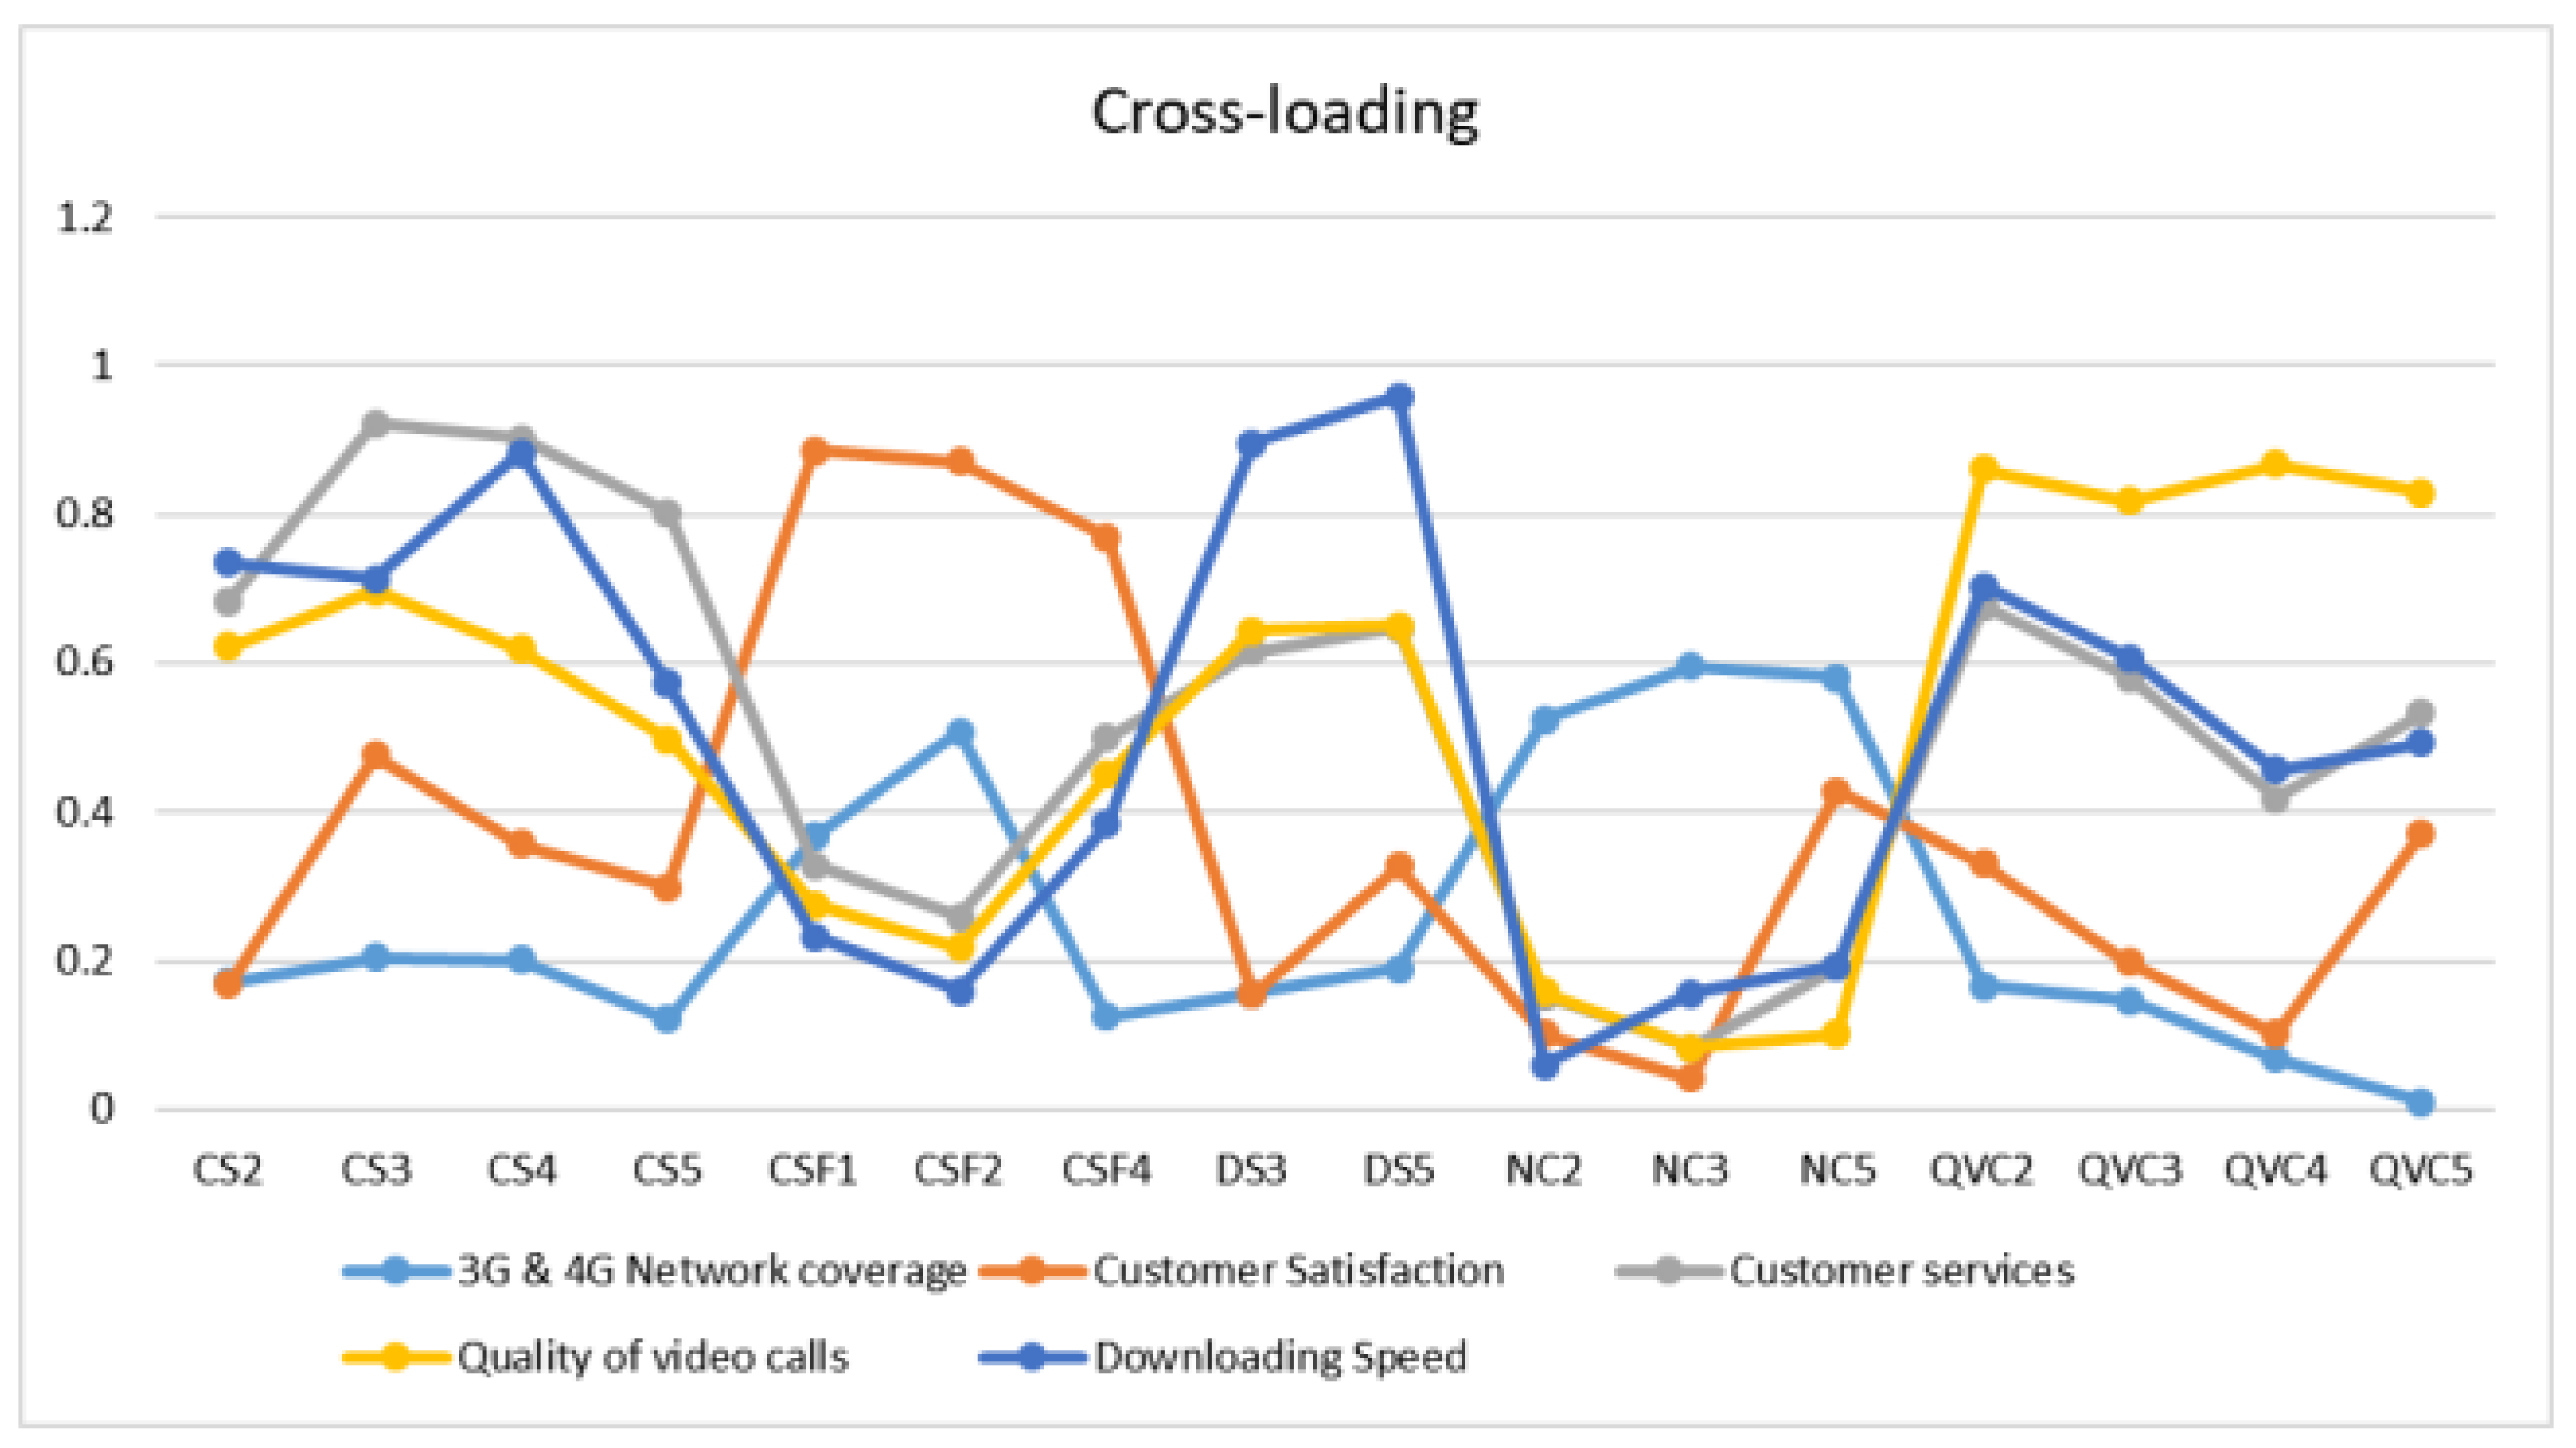
4.5. Discriminant Validity
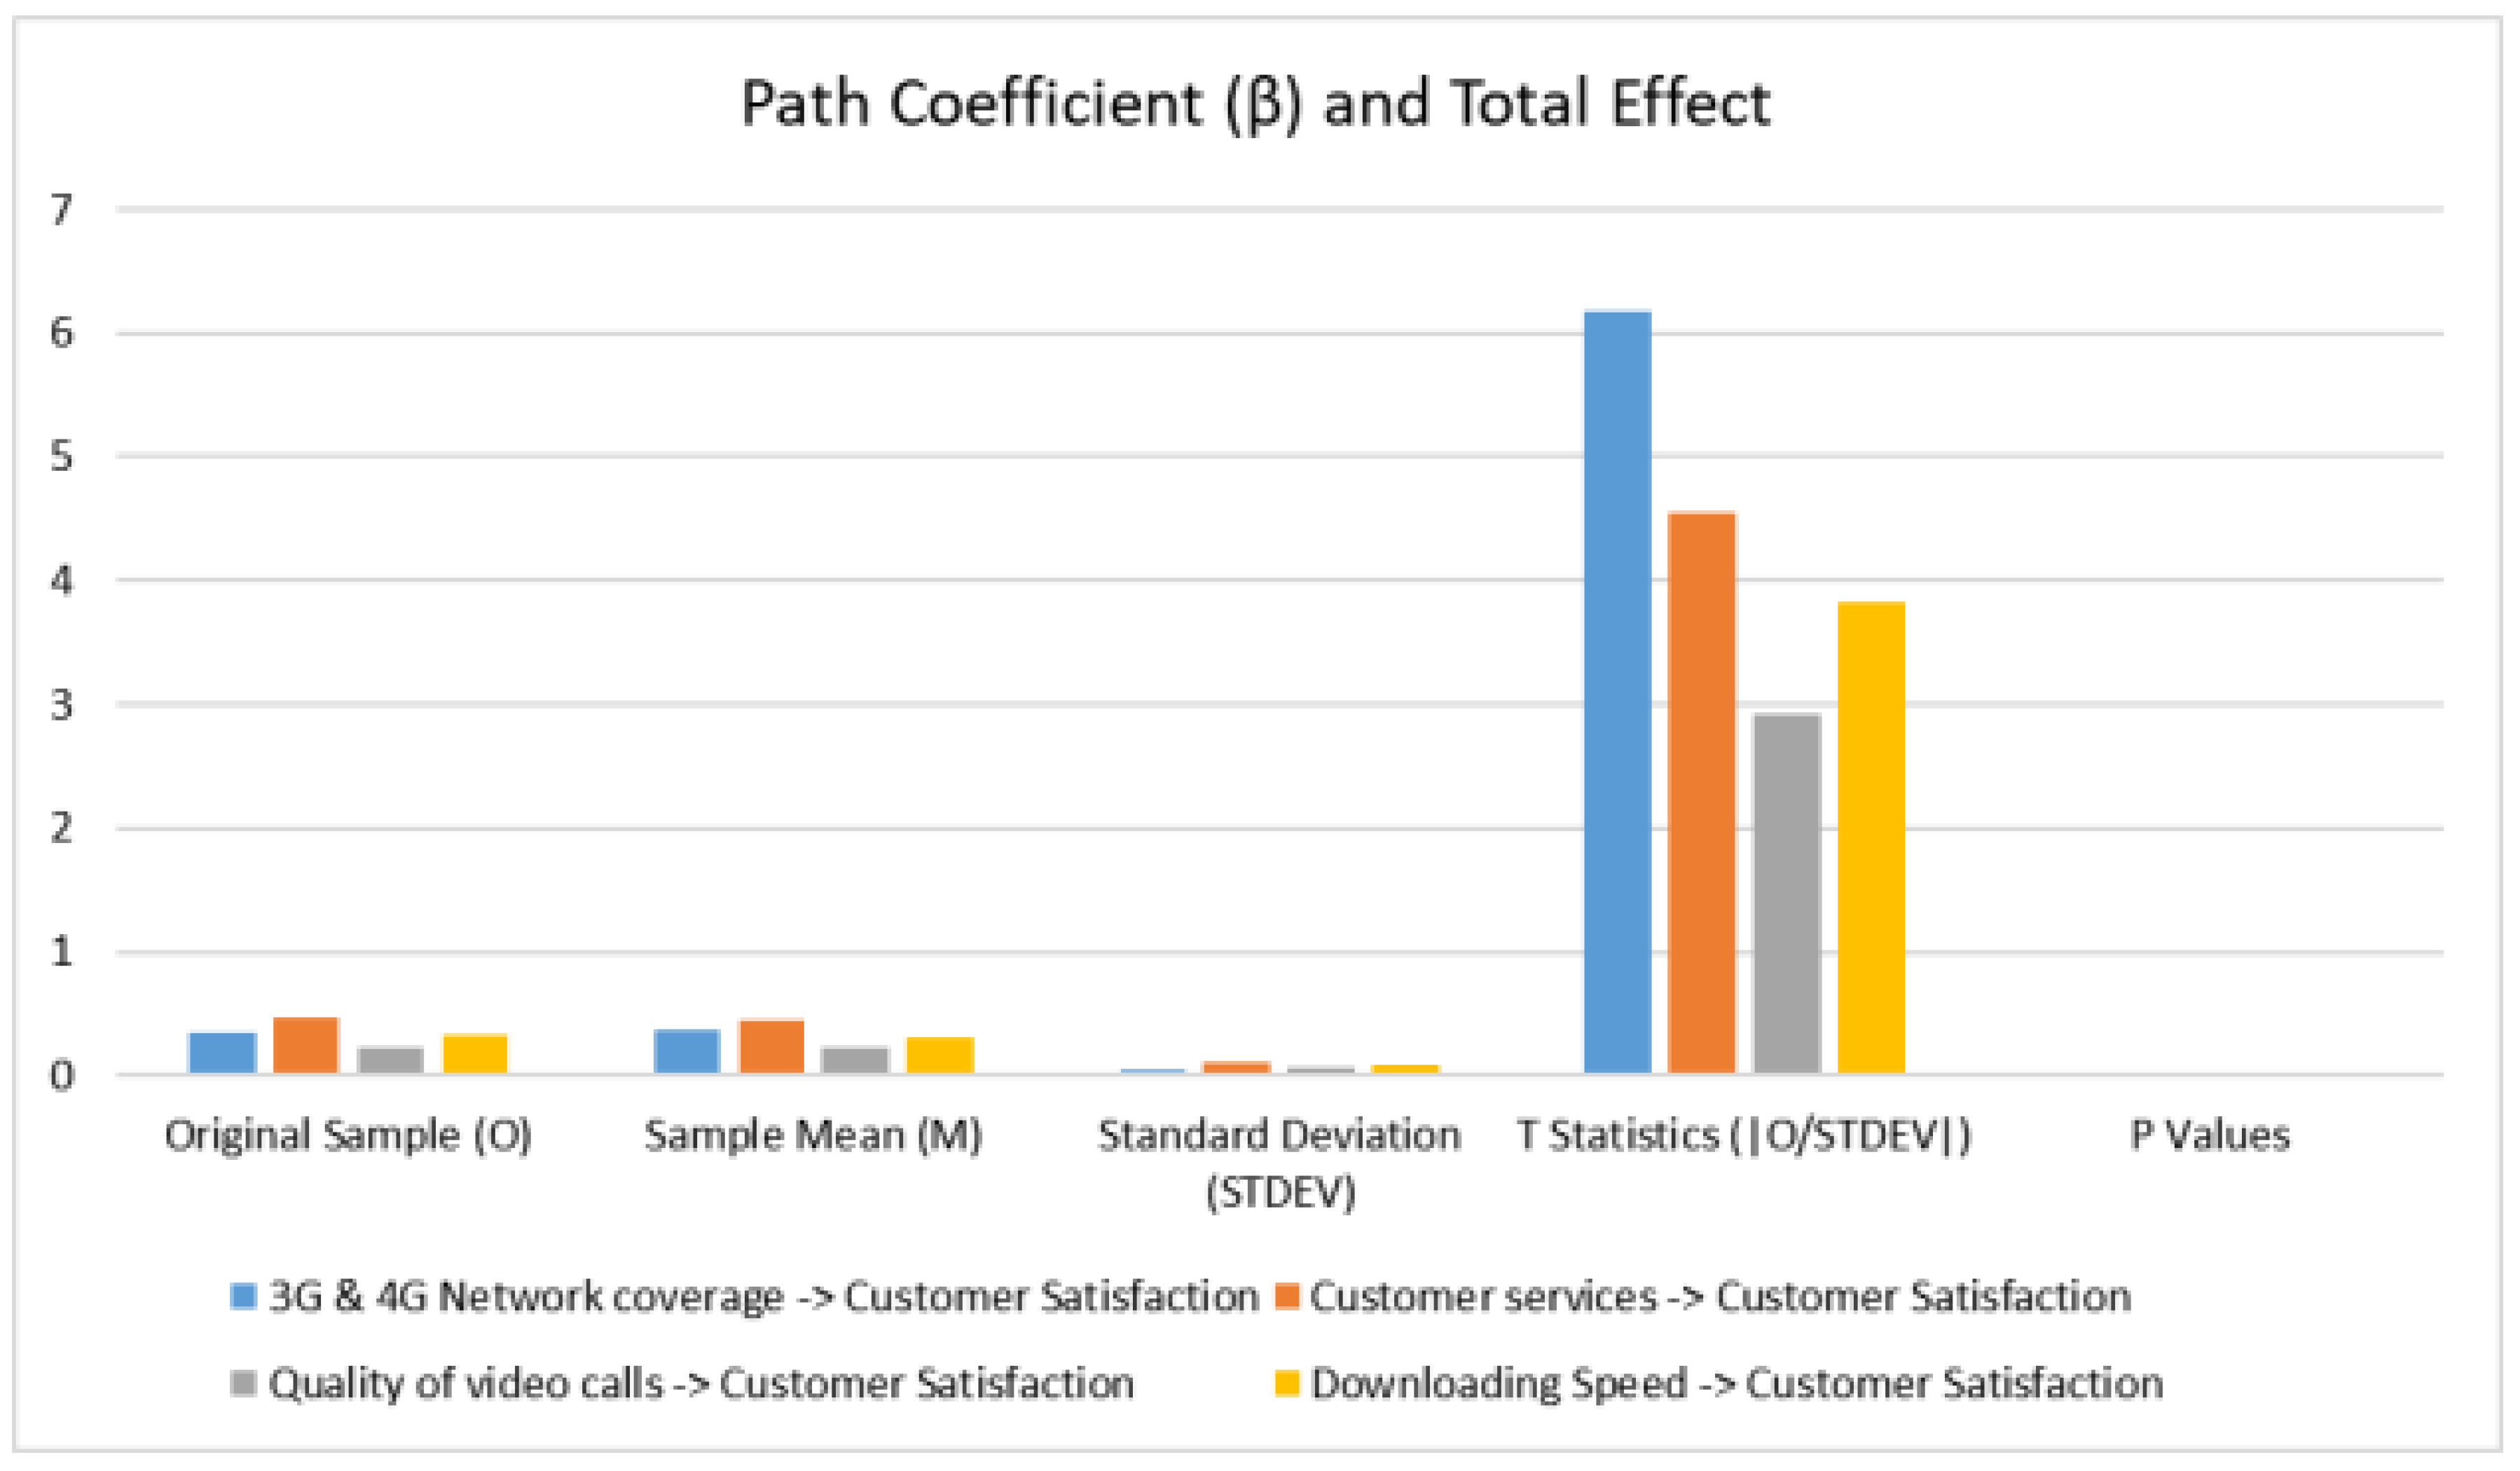
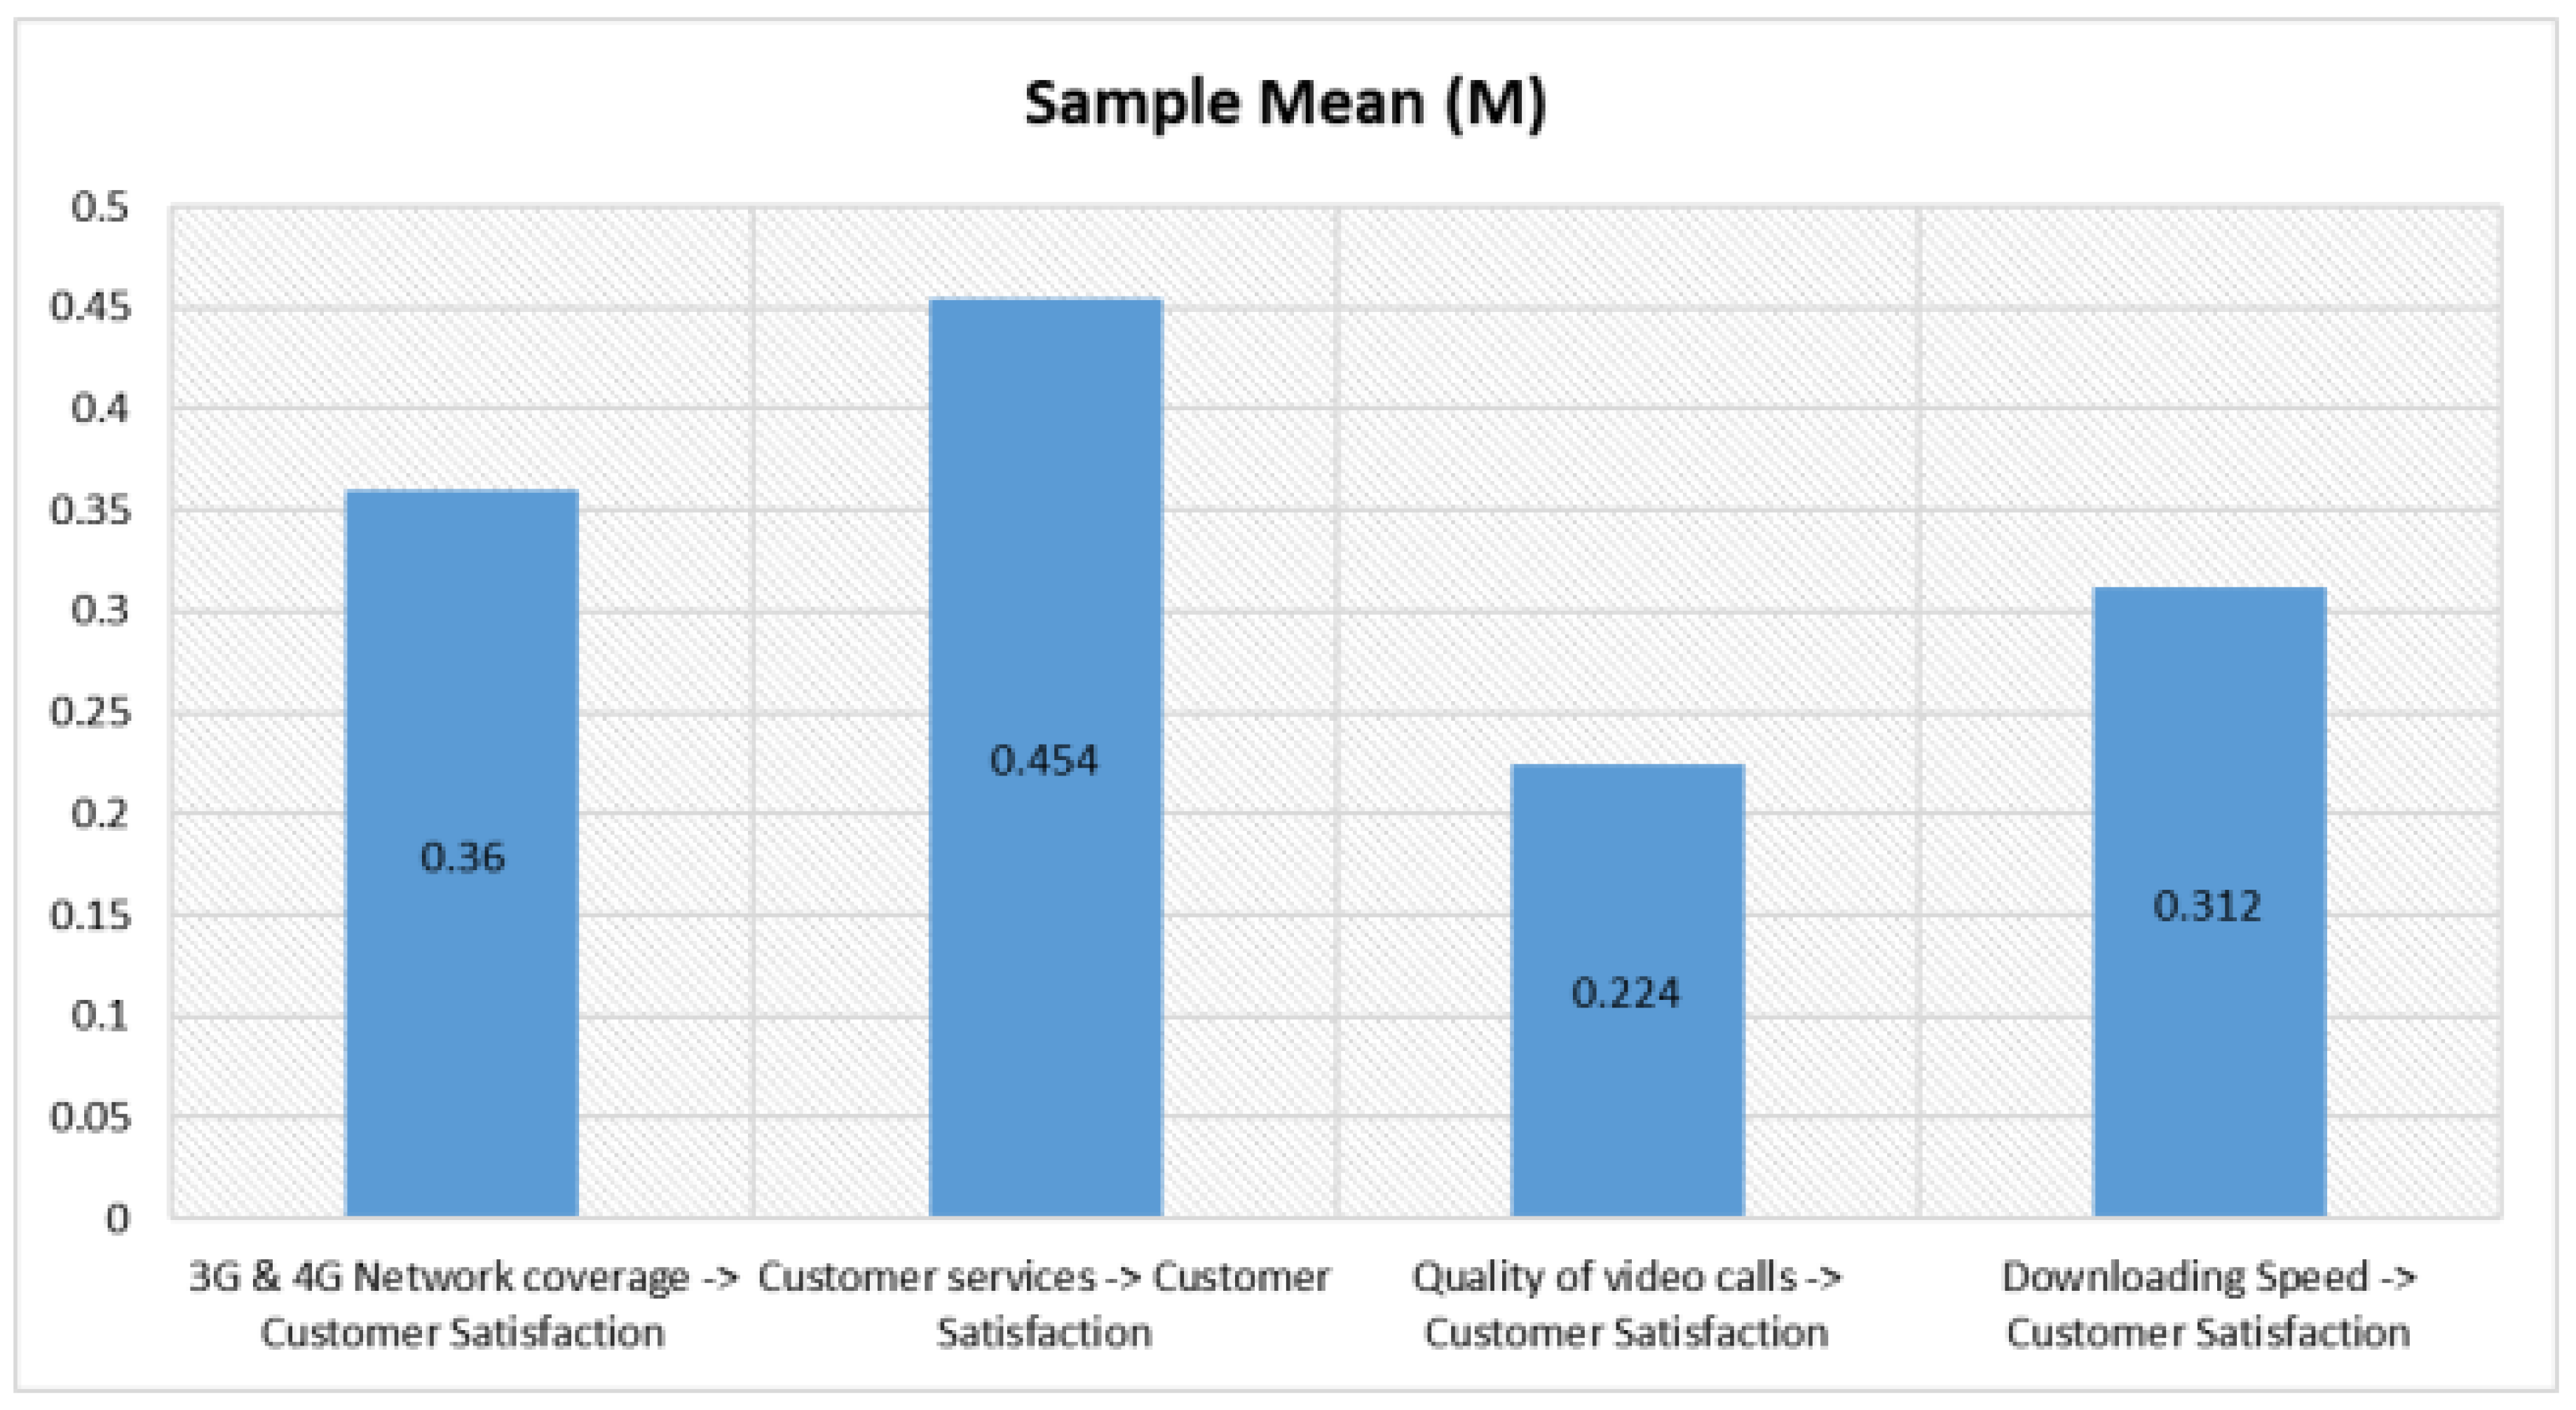
4.6. Path Coefficient (β)
5. Discussion
5.1. Conclusions
5.2. Future Research Directions
- Data collection in this study can be extended to the whole country with a high number of responses to make the results more reliable.
- This study can further extend the impact of 5G technology network performance on customer satisfaction in a different area because 5G is expected to come in the next couple of years.
- Another recommendation about this study is to extend this study compassion based on 3G and 4G services with different telecom operators who are providing the best services in the telecom sector
- We will also conduct our research study on 5G technology.
Author Contributions
Funding
Data Availability Statement
Acknowledgments
Conflicts of Interest
References
- Pakistan Telecommunication Authority. Telecom Indicators. Available online: https://www.pta.gov.pk/en/telecom-indicators (accessed on 18 July 2022).
- Jere, M.G.; Mukupa, A. Customer satisfaction and loyalty drivers in the Zambian mobile telecommunications industry. J. Bus. Retail Manag. Res. 2018, 13, 120–128. [Google Scholar] [CrossRef] [Green Version]
- Selelo, G.B.; Lekobane, K.R. Effects of service quality on customers satisfaction on Botswana’s mobile telecommunications industry. Arch. Bus. Res. 2017, 5, 212–228. [Google Scholar]
- Chee, V.S.; Husin, M.M. The Effect of Service Quality, Satisfaction and Loyalty toward Customer Retention in the Telecommunication Industry. Int. J. Acad. Res. Bus. Soc. Sci. 2020, 10, 55–71. [Google Scholar]
- Marvelous, M.; Asphat, M.; Malon, S.R. The influence of customer-based brand equity on customer satisfaction and brand loyalty: Evidence from South African Mobile Telecommunications Industry. Int. J. Bus. Manag. Stud. 2019, 11, 32–47. [Google Scholar]
- Gawas, A.U. An overview on evolution of mobile wireless communication networks: 1G–6G. Int. J. Recent Innov. Trends Comput. Commun. 2015, 3, 3130–3133. [Google Scholar]
- Pereira, V.; Sousa, T. Evolution of Mobile Communications: From 1G to 4G. Dep. Inform. Eng. Univ. Coimbra Port. 2004, 4, 20. [Google Scholar]
- Agarwal, A.; Misra, G.; Agarwal, K. The 5th generation mobile wireless networks-key concepts, network architecture and challenges. Am. J. Electr. Electron. Eng. 2015, 3, 22–28. [Google Scholar]
- Waleed, S.; Ullah, I.; Khan, W.U.; Rehman, A.U.; Rahman, T.; Li, S. Resource allocation of 5G network by exploiting particle swarm optimization. Iran J. Comput. Sci. 2021, 4, 211–219. [Google Scholar] [CrossRef]
- Khan, W.U.; Imtiaz, N.; Ullah, I. Joint optimization of NOMA-enabled backscatter communications for beyond 5G IoT networks. Internet Technol. Lett. 2021, 4, e265. [Google Scholar] [CrossRef]
- Mazhar, T.; Malik, M.A.; Haq, I.; Rozeela, I.; Ullah, I.; Khan, M.A.; Adhikari, D.; Ben Othman, M.T.; Hamam, H. The Role of ML, AI and 5G Technology in Smart Energy and Smart Building Management. Electronics 2022, 11, 3960. [Google Scholar] [CrossRef]
- Aldossari, S.M.; Chen, K.-C. Machine learning for wireless communication channel modeling: An overview. Wirel. Pers. Commun. 2019, 106, 41–70. [Google Scholar] [CrossRef]
- Jagannath, J.; Polosky, N.; Jagannath, A.; Restuccia, F.; Melodia, T. Machine learning for wireless communications in the Internet of Things: A comprehensive survey. Ad. Hoc. Netw. 2019, 93, 101913. [Google Scholar] [CrossRef] [Green Version]
- Li, C.; Cao, Z. Lora networking techniques for large-scale and long-term iot: A down-to-top survey. ACM Comput. Surv. (CSUR) 2022, 55, 1–36. [Google Scholar] [CrossRef]
- Lin, Y.; Song, H.; Ke, F.; Yan, W.; Liu, Z.; Cai, F. Optimal caching scheme in D2D networks with multiple robot helpers. Comput. Commun. 2022, 181, 132–142. [Google Scholar] [CrossRef]
- Guo, L.; Ye, C.; Ding, Y.; Wang, P. Allocation of centrally switched fault current limiters enabled by 5G in transmission system. IEEE Trans. Power Deliv. 2020, 36, 3231–3241. [Google Scholar] [CrossRef]
- Alsheikh, M.A.; Niyato, D.; Lin, S.; Tan, H.-P.; Han, Z. Mobile big data analytics using deep learning and apache spark. IEEE Netw. 2016, 30, 22–29. [Google Scholar] [CrossRef] [Green Version]
- Bi, S.; Zhang, R.; Ding, Z.; Cui, S. Wireless communications in the era of big data. IEEE Commun. Mag. 2015, 53, 190–199. [Google Scholar] [CrossRef] [Green Version]
- Huang, J.; Wang, C.-X.; Bai, L.; Sun, J.; Yang, Y.; Li, J.; Tirkkonen, O.; Zhou, M.-T. A big data enabled channel model for 5G wireless communication systems. IEEE Trans. Big Data 2018, 6, 211–222. [Google Scholar] [CrossRef] [Green Version]
- Stergiou, C.L.; Plageras, A.P.; Psannis, K.E.; Gupta, B.B. Secure machine learning scenario from big data in cloud computing via internet of things network. In Handbook of Computer Networks and Cyber Security; Gupta, B., Perez, G., Agrawal, D., Gupta, D., Eds.; Springer: Cham, Switzerland, 2020. [Google Scholar] [CrossRef]
- Mazhar, T.; Malik, M.A.; Mohsan, S.A.H.; Li, Y.; Haq, I.; Ghorashi, S.; Karim, F.K.; Mostafa, S.M. Quality of Service (QoS) Performance Analysis in a Traffic Engineering Model for Next-Generation Wireless Sensor Networks. Symmetry 2023, 15, 513. [Google Scholar] [CrossRef]
- Chang, Z.; Lei, L.; Zhou, Z.; Mao, S.; Ristaniemi, T. Learn to cache: Machine learning for network edge caching in the big data era. IEEE Wirel. Commun. 2018, 25, 28–35. [Google Scholar] [CrossRef]
- Qin, X.; Liu, Z.; Liu, Y.; Liu, S.; Yang, B.; Yin, L.; Liu, M.; Zheng, W. User OCEAN personality model construction method using a BP neural network. Electronics 2022, 11, 3022. [Google Scholar] [CrossRef]
- Hajar, M.A.; Alkahtani, A.A.; Ibrahim, D.N.; Al-Sharafi, M.A.; Alkawsi, G.; Iahad, N.A.; Darun, M.R.; Tiong, S.K. The Effect of Value Innovation in the Superior Performance and Sustainable Growth of Telecommunications Sector: Mediation Effect of Customer Satisfaction and Loyalty. Sustainability 2022, 14, 6342. [Google Scholar] [CrossRef]
- Shava, H. The relationship between service quality and customer satisfaction in the South African mobile network telecommunications industry. J. Int. Stud. 2021, 14, 70–83. [Google Scholar] [CrossRef]
- Shahzad, A.; Yaqub, R.M.S.; Di Vaio, A.; Hassan, R. Antecedents of customer loyalty and performance improvement: Evidence from Pakistan’s telecommunications sector. Util. Policy 2021, 70, 101208. [Google Scholar] [CrossRef]
- Mohammed, B.I.; Andavar, V. Customer Satisfaction towards Telecommunication mobile services: A case study in Asiacell Telecommunications in Sulaymaniyah city. Sci. J. Cihan Univ. Sulaimaniya 2022, 6, 173–184. [Google Scholar]
- Almuqren, L.; Cristea, A.I. Predicting STC Customers’ Satisfaction Using Twitter. IEEE Trans. Comput. Soc. Syst. 2022, 10, 204–210. [Google Scholar] [CrossRef]
- Al-Shammari, M.M.; AlShowaikh, A.F. Investigating user satisfaction of customer relationship management in a Telecommunications company in the kingdom of Bahrain. Int. J. Ebusiness Egovernment Stud. 2021, 13, 97–116. [Google Scholar]
- Shava, H. Service quality and customer satisfaction experience among south african mobile telecommunications consumers. Eurasian J. Bus. Manag. 2021, 9, 217–232. [Google Scholar] [CrossRef]
- Awadhi, J.; Obeidat, B.; Alshurideh, M. The impact of customer service digitalization on customer satisfaction: Evidence from telecommunication industry. Int. J. Data Netw. Sci. 2021, 5, 815–830. [Google Scholar]
- Shrivastava, N.; Limaye, M. A comparative study of customer satisfaction towards 4g service providers in bhopal division involving demographic variables. Int. J. Manag. (IJM) 2020, 11, 889–896. [Google Scholar]
- Ali, B.J.; Saleh, P.F.; Akoi, S.; Abdulrahman, A.A.; Muhamed, A.S.; Noori, H.N.; Anwar, G. Impact of Service Quality on the Customer Satisfaction: Case study at Online Meeting Platforms. In Ali, BJ, Saleh, Akoi, S., Abdulrahman, AA, Muhamed, AS, Noori, HN, Anwar, G. Impact of Service Quality on the Customer Satisfaction: Case study at Online Meeting Platforms. Int. J. Eng. Bus. Manag. 2021, 5, 65–77. [Google Scholar]
- Inegbedion, H.; Obadiaru, E. Modelling brand loyalty in the Nigerian telecommunications industry. J. Strateg. Mark. 2019, 27, 583–598. [Google Scholar] [CrossRef]
- Dhasan, D.; Kowathanakul, S. The impact of service quality, promotions and customer engagement in determining customer loyalty in the Thai mobile network industry. ABAC J. 2021, 41, 209–240. [Google Scholar]
- Laghari, A.A.; He, H.; Shafiq, M.; Khan, A. Application of quality of experience in networked services: Review, trend & perspectives. Syst. Pract. Action Res. 2019, 32, 501–519. [Google Scholar]
- Kubasu, K. Factors Influencing Customer Satisfaction with Services Offered by Safaricom Mobile Cellular Network; Strathmore University: Nairobi, Kenya, 2018. [Google Scholar]
- Khan, N.; Akram, M.U.; Shah, A.; Khan, S.A. Calculating customer experience management index for telecommunication service using genetic algorithm based weighted attributes. In Proceedings of the 2018 IEEE International Conference on Innovative Research and Development (ICIRD), Bangkok, Thailand, 11–12 May 2018; pp. 1–8. [Google Scholar]
- Mahrinasari, M.; Pandjaitan, D.H.R. Moderating role of “consumer characteristics” in the influence of customer satisfaction on loyalty. In The Future Opportunities and Challenges of Business in Digital Era 4.0; Routledge: Oxfordshire, UK, 2020; pp. 205–209. [Google Scholar]
- Mohammed, S.S.; Shahin, O. Service quality perspectives in telecommunication sector: Trust and loyalty investigation. Amazon. Investig. 2020, 9, 394–403. [Google Scholar] [CrossRef]
- Zhou, R.; Wang, X.; Shi, Y.; Zhang, R.; Zhang, L.; Guo, H. Measuring e-service quality and its importance to customer satisfaction and loyalty: An empirical study in a telecom setting. Electron. Commer. Res. 2019, 19, 477–499. [Google Scholar] [CrossRef]
- Chun, L.; Tham, J.; Azam, S.F. Corporate competence determining factors in china telecom industry in achieving customer satisfaction. Eur. J. Manag. Mark. Stud. 2019, 4. [Google Scholar] [CrossRef]
- Ali, F.; Rasoolimanesh, S.M.; Sarstedt, M.; Ringle, C.M.; Ryu, K. An assessment of the use of partial least squares structural equation modeling (PLS-SEM) in hospitality research. Int. J. Contemp. Hosp. Manag. 2018, 30, 514–538. [Google Scholar] [CrossRef] [Green Version]
- Coakes, S.J.; Steed, L.; Dzidic, P. SPSS 13.0 for Windows: Analysis without Anguish; John Wiley & Sons: Milton, QLD, Australia, 2006; 270p, ISBN 9780470809143 0470809140. [Google Scholar]
- Tabachnick, B.; Fidel, L. Using Multivarite Statistics; Allyn ve Bacon Inc.: Boston, MA, USA, 2001. [Google Scholar]
- Taber, K.S. The use of Cronbach’s alpha when developing and reporting research instruments in science education. Res. Sci. Educ. 2018, 48, 1273–1296. [Google Scholar] [CrossRef] [Green Version]
- Hair, J.F.; Ringle, C.M.; Sarstedt, M. PLS-SEM: Indeed a silver bullet. J. Mark. Theory Pract. 2011, 19, 139–152. [Google Scholar] [CrossRef]
- Hair, J.F., Jr.; Sarstedt, M.; Hopkins, L.; Kuppelwieser, V.G. Partial least squares structural equation modeling (PLS-SEM): An emerging tool in business research. Eur. Bus. Rev. 2014, 26, 106–121. [Google Scholar] [CrossRef]
- Cronbach, L.J. Coefficient alpha and the internal structure of tests. Psychometrika 1951, 16, 297–334. [Google Scholar] [CrossRef] [Green Version]
- Werts, C.E.; Linn, R.L.; Jöreskog, K.G. Intraclass reliability estimates: Testing structural assumptions. Educ. Psychol. Meas. 1974, 34, 25–33. [Google Scholar] [CrossRef]
- Nunnally, B. Psychometric Theory, 3rd ed.; McGraw Hill: New York, NY, USA, 1994. [Google Scholar]
- Tarhini, A.; Al-Busaidi, K.A.; Mohammed, A.B.; Maqableh, M. Factors influencing students’ adoption of e-learning: A structural equation modeling approach. J. Int. Educ. Bus. 2017, 10, 164–182. [Google Scholar] [CrossRef]
- Sarstedt, M.; Ringle, C.M.; Hair, J.F. Partial least squares structural equation modeling. In Handbook of Market Research; Springer: Cham, Switzerland, 2021; pp. 587–632. [Google Scholar]
- Götz, O.; Liehr-Gobbers, K.; Krafft, M. Evaluation of structural equation models using the partial least squares (PLS) approach. In Handbook of Partial Least Squares; Springer: Berlin/Heidelberg, Germany, 2010; pp. 691–711. [Google Scholar]


| Objective | Analysis | Results | Ref- |
|---|---|---|---|
| by examining the mediation effect of customer satisfaction and loyalty, to develop and validate a conceptual model of value innovation and its impact on firm performance and long-term growth. | The results of the empirical analysis were based on 304 respondents who completed a paper-based survey distributed to Yemeni mobile service providers’ employees using a convenience non-probability sampling technique. | The findings empirically validated the theoretical research model, confirming that value innovation promotes customer satisfaction and loyalty to boost company performance and long-term growth. | [21] |
| The research aims to find out whether service quality dimensions (tangibility, dependability, responsiveness, empathy, and assurance) predict customer satisfaction after controlling for customer characteristics such as gender, age, and educational level. | Self-administered questionnaires were used to collect primary data. A hierarchical regression analysis was carried out. | Age and education level made no unique contributions to the model, but customers’ gender made a statistically significant negative unique contribution. | [22] |
| Customer satisfaction, perceived service quality, perceived price fairness, perceived justice in service recovery, and relational bonds are examined in stayers and switchers in the telecom sector. | The PLS-SEM Approach was used to analyze the data. | There are significant differences in the antecedents of loyalty between the two groups (stayers and switchers). | [23] |
| The goal of this study is to determine customer satisfaction with Asiacell’s prepaid services. | For this study, a questionnaire was administered to 1740 randomly selected customers in various locations throughout SulayManiyah city. | It was discovered that the vast majority of Asiacell users were young customers who were satisfied with the prepaid mobile services provided by the Asiacell company in the city of Sulaymaniyah. | [24] |
| This study aims to mine Arabic tweets to assess customer satisfaction with a Saudi telecom company. | It was created using a corpus of Arabic tweets and a Python script that searches for real-time tweets that mention Telecom company using hashtags to continuously monitor the latest sentiments of Telecom customers. The machine-classifier and deep learning approach are trained on 20,000 randomly selected tweets from the dataset. | The satisfaction level for each service ranges from 31.50% to 49.25%. One of the proposed solutions is to use 5G to solve the “internet speed” issue, which had the lowest customer satisfaction (31.50%). | [25] |
| This research aims at how satisfied users are with a customer relationship management (CRM) system in Bahrain. | The data were analyzed using the partial least squares structural equation modeling (PLS-SEM) method. | Employees were highly satisfied with the CRM system, and there was a significant relationship between the selected variables and user satisfaction. | [26] |
| The research examined whether service quality and customer satisfaction differed depending on which mobile network operator the customer used. | To collect primary data from mobile network users, a self-administered questionnaire was used. The data were analyzed using descriptive and inferential statistics. | The customer’s mobile network operator had a significant impact on service quality and customer satisfaction levels. This study makes an academic contribution by revealing how South African consumers perceive mobile network service providers. | [27] |
| This study investigates the relationships between customer-perceived expectations, customer-perceived experience, and customer satisfaction in the United Arab Emirates digital telecommunications solution. | The validity of the suggested scales and the research model’s linkages were evaluated and validated using exploratory component analysis and multiple regression analysis. | The research discovered a strong correlation between customer expectation and customer experience, as well as the satisfaction of UAE residents using or engaging with digital telecommunications solutions, regardless of generation. | [28] |
| The purpose of this project was to assess the impact of technical and functional service quality on customer satisfaction and loyalty. | The collected data was calculated using three Excel software programs (covariance, correlation, and regression analysis). | Customer satisfaction and loyalty are affected by fulfillment and privacy issues. | [30] |
| To discuss the role of customer engagement in increasing customer loyalty. | A total sample of 798 prepaid and postpaid customers in Thailand were sampled using quota sampling. The t-Test, EFA, CFA, and SEM were used to analyze and test the data. | In terms of online customer engagement, there is a significant difference between prepaid and postpaid customers. | [32] |
| This study uses a genetic algorithm (GA) to weight service attributes based on survey data to calculate the customer experience management index (CEMI). | Minimizing the difference between calculated CEMI and survey CEMI optimizes attribute weights. | Network coverage, signal strength, and voice quality greatly impact customer satisfaction. | [34] |
| to investigate the role of consumer characteristics in the influence of customer satisfaction on loyalty in the Indonesian mobile phone service sector. | Utilizing a survey design, 400 respondents were selected using a non-probabilistic random sampling technique, and the obtained data were analyzed using SEM analysis. | The management of a telecommunications company should come up with good marketing plans by coming up with creative and innovative ways to improve service quality, such as using modern, integrated information technology with wide access network coverage to improve signal quality. | [36] |
| to examine the effect of functional and technological service quality on trust and loyalty in internet services. | The authors have collected data from 300 Internet users residing in various cities in the Iraqi Kurdistan Region. Using structural equation modeling, the data have been evaluated. | Functional quality has less of an impact on loyalty and trust than technical quality. Second, it was found that while functional quality indirectly affects loyalty but not trust, technical quality directly affects both trust and loyalty. | [37] |
| Objectives | Hypothesis |
|---|---|
| Relationship between customer satisfaction and the factors which impact CS | H1: 3G and 4G Network Coverage is associated with customer satisfaction. |
H2: Customer services are associated with customer satisfaction. | |
H3: Quality of video calls is associated with customer satisfaction. | |
H4: Downloading Speed is associated with customer satisfaction. |
| Measures | Items | Frequency | Percent | Valid Percent | Cumulative Percent | |
|---|---|---|---|---|---|---|
| Valid | Frequency statistics of Gender | Female | 65 | 21.6 | 21.6 | 21.6 |
| Male | 235 | 78.4 | 78.4 | 100 | ||
| Total | 300 | 100 | 100 | |||
| Valid | Frequency Statistics of Age | 15 to 20 | 83 | 27.6 | 27.6 | 27.6 |
| 21 to 25 | 83 | 27.6 | 27.6 | 55.2 | ||
| 26 to 30 | 65 | 21.6 | 21.6 | 76.8 | ||
| 31 to 35 | 41 | 13.6 | 13.6 | 90.4 | ||
| 35 to above | 28 | 9.6 | 9.6 | 100 | ||
| Total | 300 | 100 | 100 | |||
| Valid | Frequency Statistics for Education | Bachelors | 213 | 71 | 71 | 71 |
| Masters | 43 | 14.33 | 14.33 | 85.33 | ||
| PhD | 2 | 0.66 | 0.66 | 86 | ||
| Others | 42 | 14 | 14 | 100 | ||
| Total | 300 | 100 | 100 | 100 | ||
| Valid | Frequency Statistics for Connection | Post-Paid | 132 | 44 | 44 | 44 |
| Pre-Paid | 168 | 56 | 56 | 100 | ||
| Total | 300 | 100 | 100 | |||
| Valid | Frequency Statistics Telecom operator | Mobilink | 104 | 34.66 | 34.66 | 34.66 |
| Telenor | 59 | 19.67 | 19.67 | 54.33 | ||
| U-Fone | 80 | 26.67 | 26.67 | 81.00 | ||
| Zong | 57 | 19.00 | 19 | 100 | ||
| Total | 300 | 100 | 100 | |||
| Valid | Frequency Statistics of Cities using the Internet | Sahiwal | 22 | 7.33 | 7.33 | 7.33 |
| Multan | 166 | 55.33 | 55.33 | 62.66 | ||
| Khanewal | 19 | 6.33 | 6.33 | 68.399 | ||
| Toba Tek Singh | 13 | 4.33 | 4.33 | 73.32 | ||
| Bahawalpur | 30 | 10 | 10 | 83.32 | ||
| Sargodha | 22 | 7.33 | 7.33 | 90.65 | ||
| Other | 28 | 9.35 | 9.35 | 100 | ||
| Total | 300 | 100 | 100 |
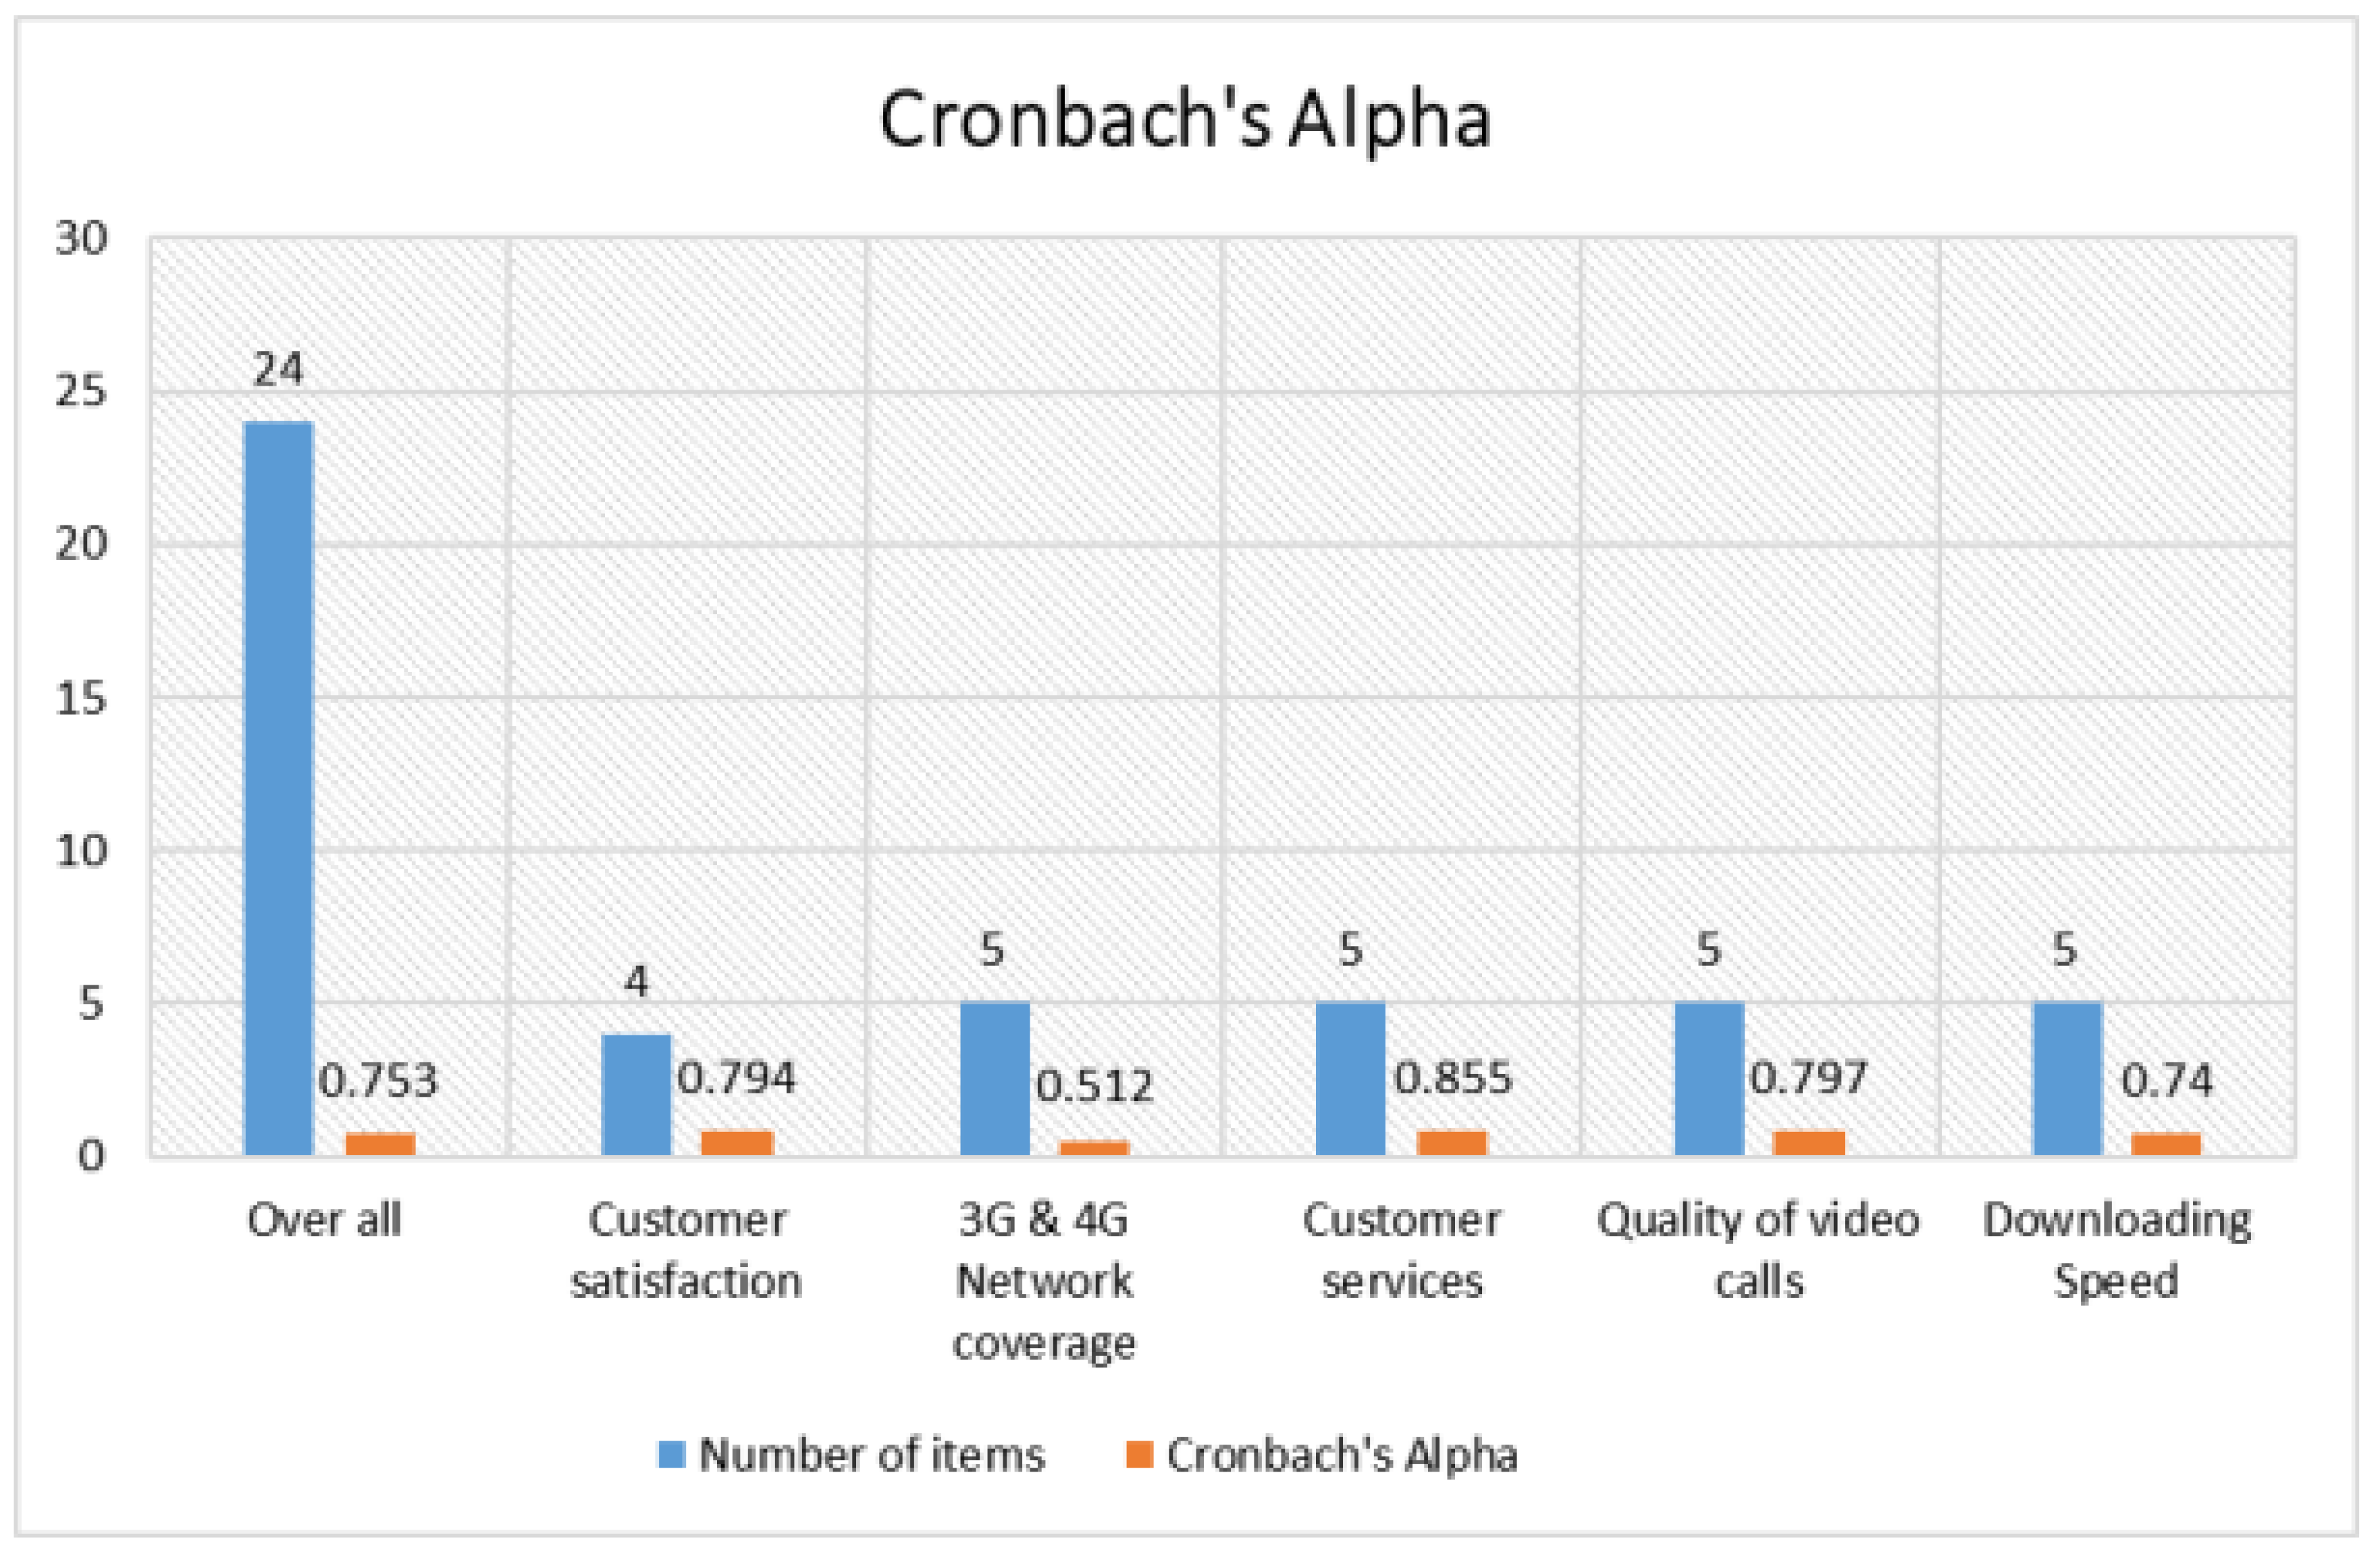
| Variables | Number of Items | Cronbach’s Alpha |
|---|---|---|
| Overall | 24 | 0.753 |
| Customer satisfaction | 4 | 0.794 |
| 3G and 4G Network coverage | 5 | 0.512 |
| Customer services | 5 | 0.855 |
| Quality of video calls | 5 | 0.797 |
| Downloading Speed | 5 | 0.74 |
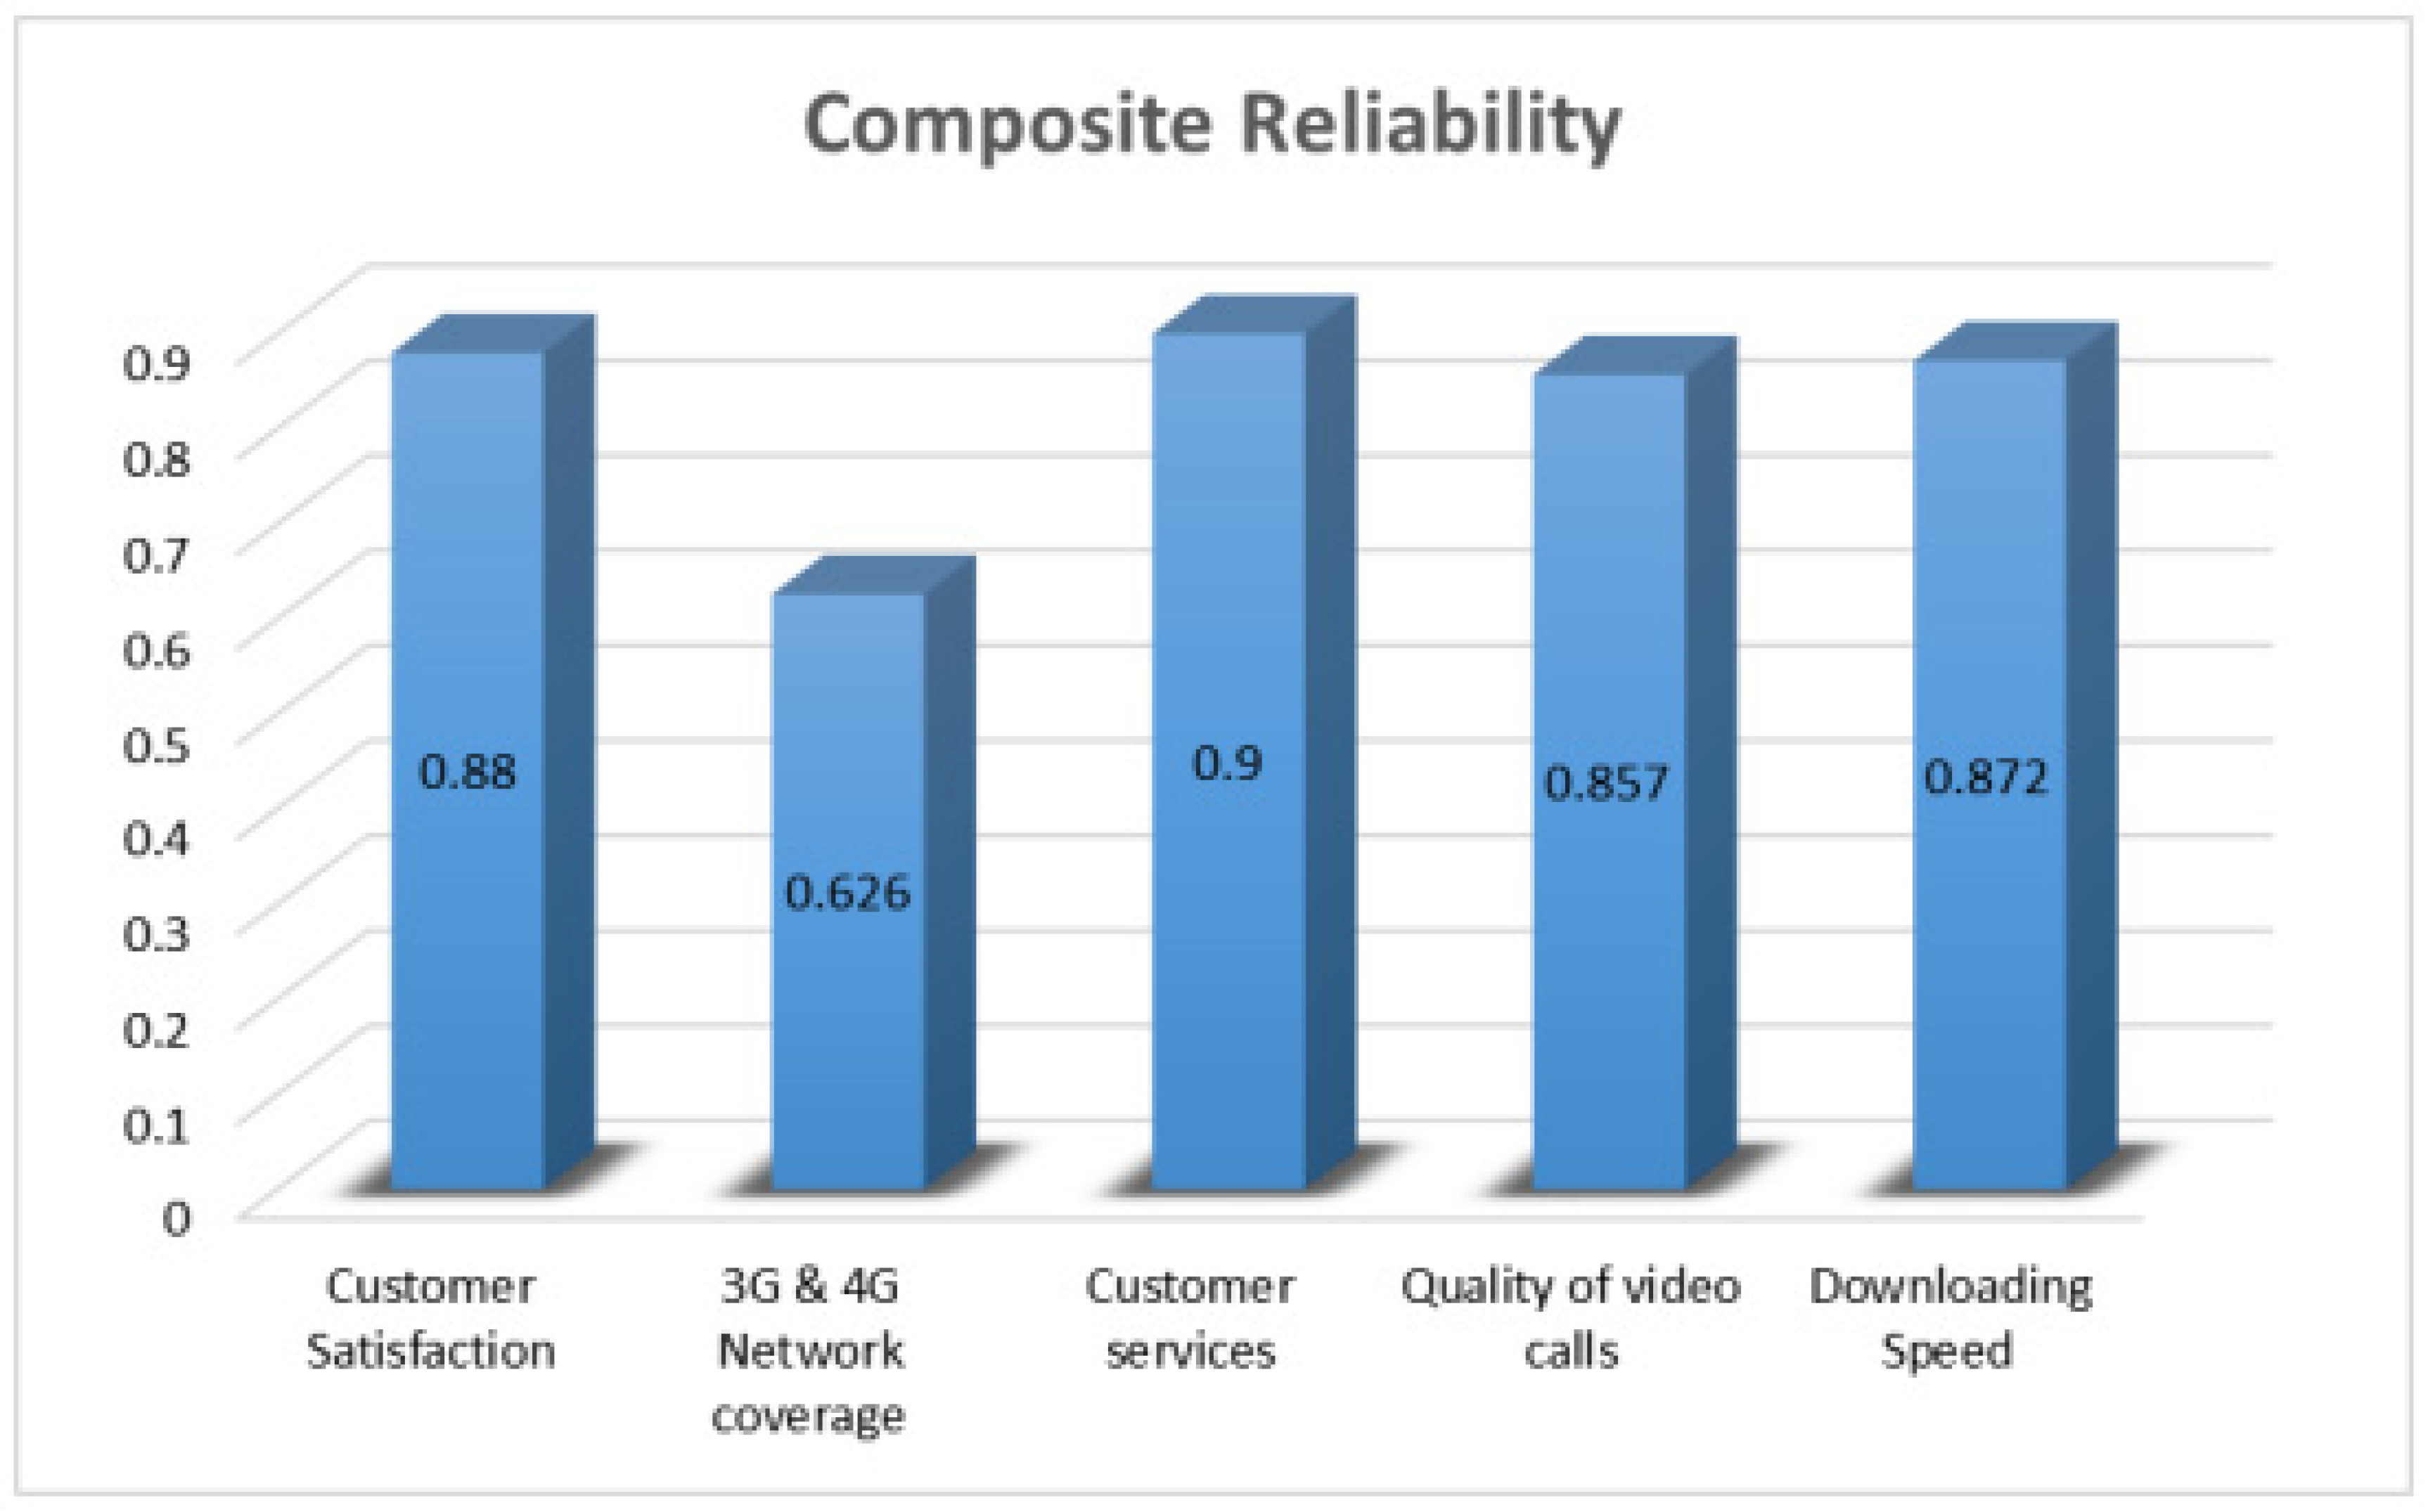
| Variables | Composite Reliability |
|---|---|
| Customer Satisfaction | 0.88 |
| 3G and 4G Network coverage | 0.626 |
| Customer services | 0.9 |
| Quality of video calls | 0.857 |
| Downloading Speed | 0.872 |
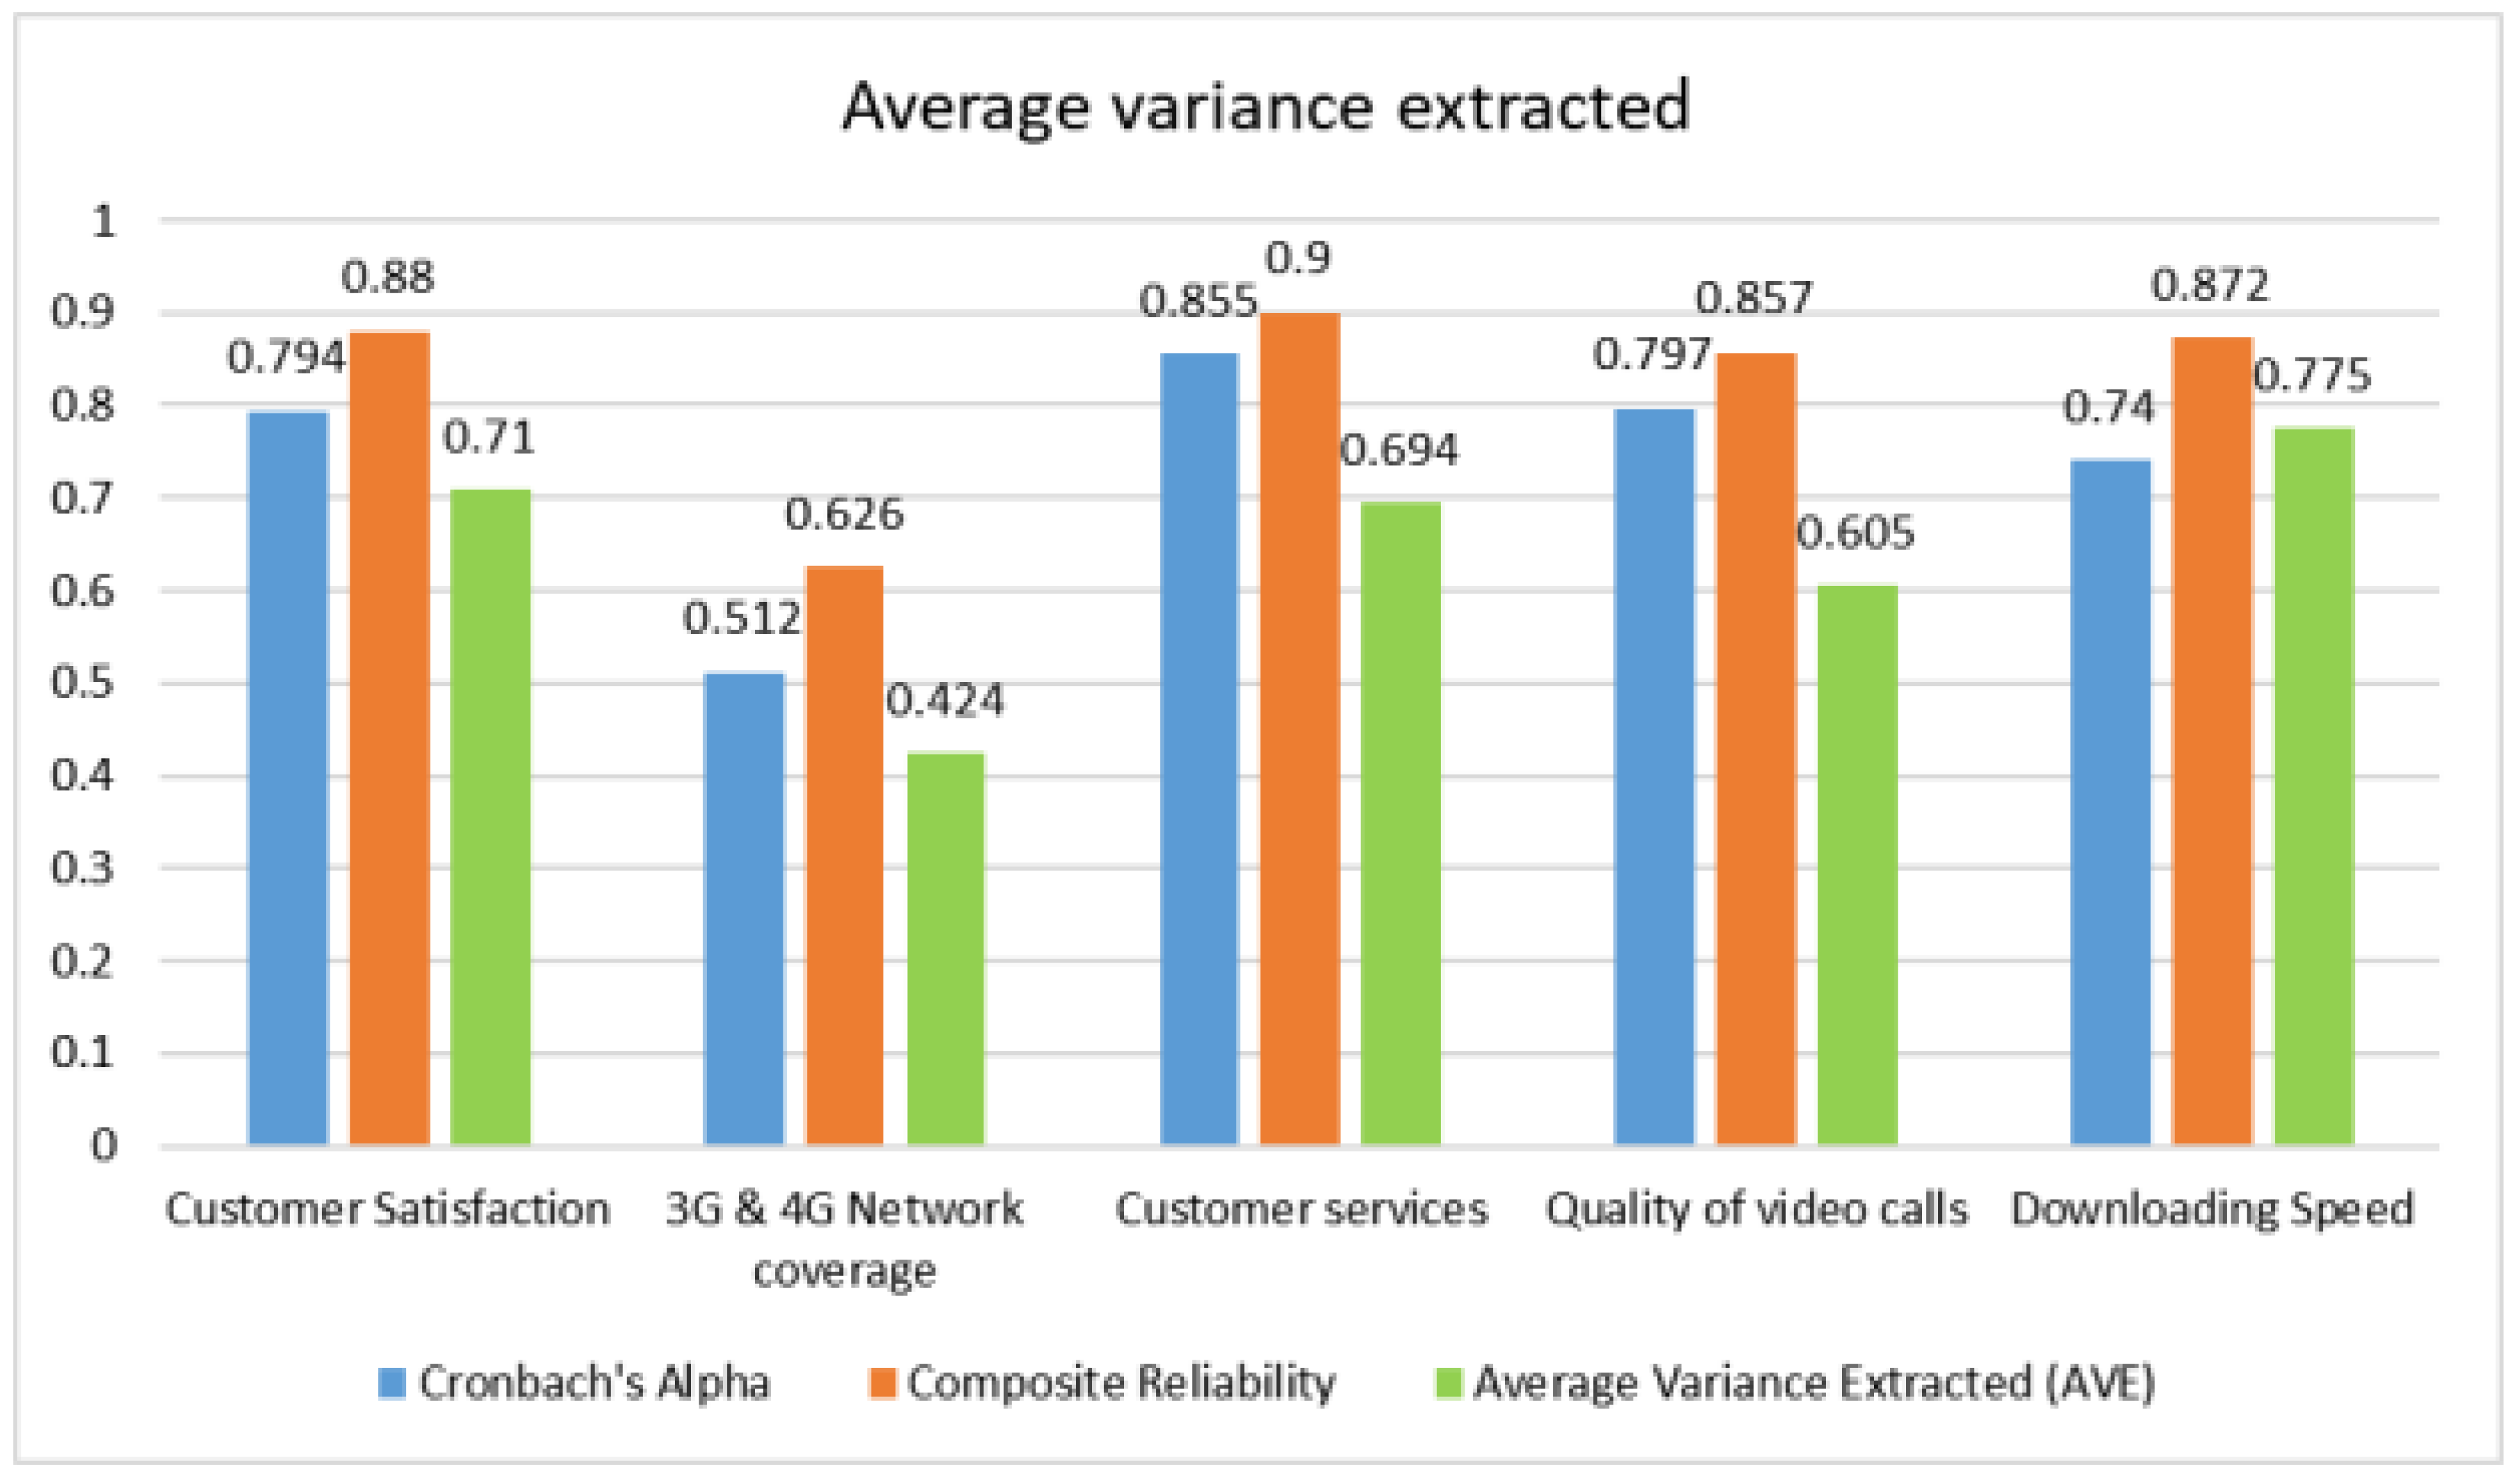
| Variables | Cronbach’s Alpha | Composite Reliability | Average Variance Extracted (AVE) |
|---|---|---|---|
| Customer Satisfaction 3G and 4G Network coverage | 0.794 0.512 | 0.88 0.626 | 0.710 0.424 |
| Customer services | 0.855 | 0.9 | 0.694 |
| Quality of video calls | 0.797 | 0.857 | 0.605 |
| Downloading Speed | 0.74 | 0.872 | 0.775 |
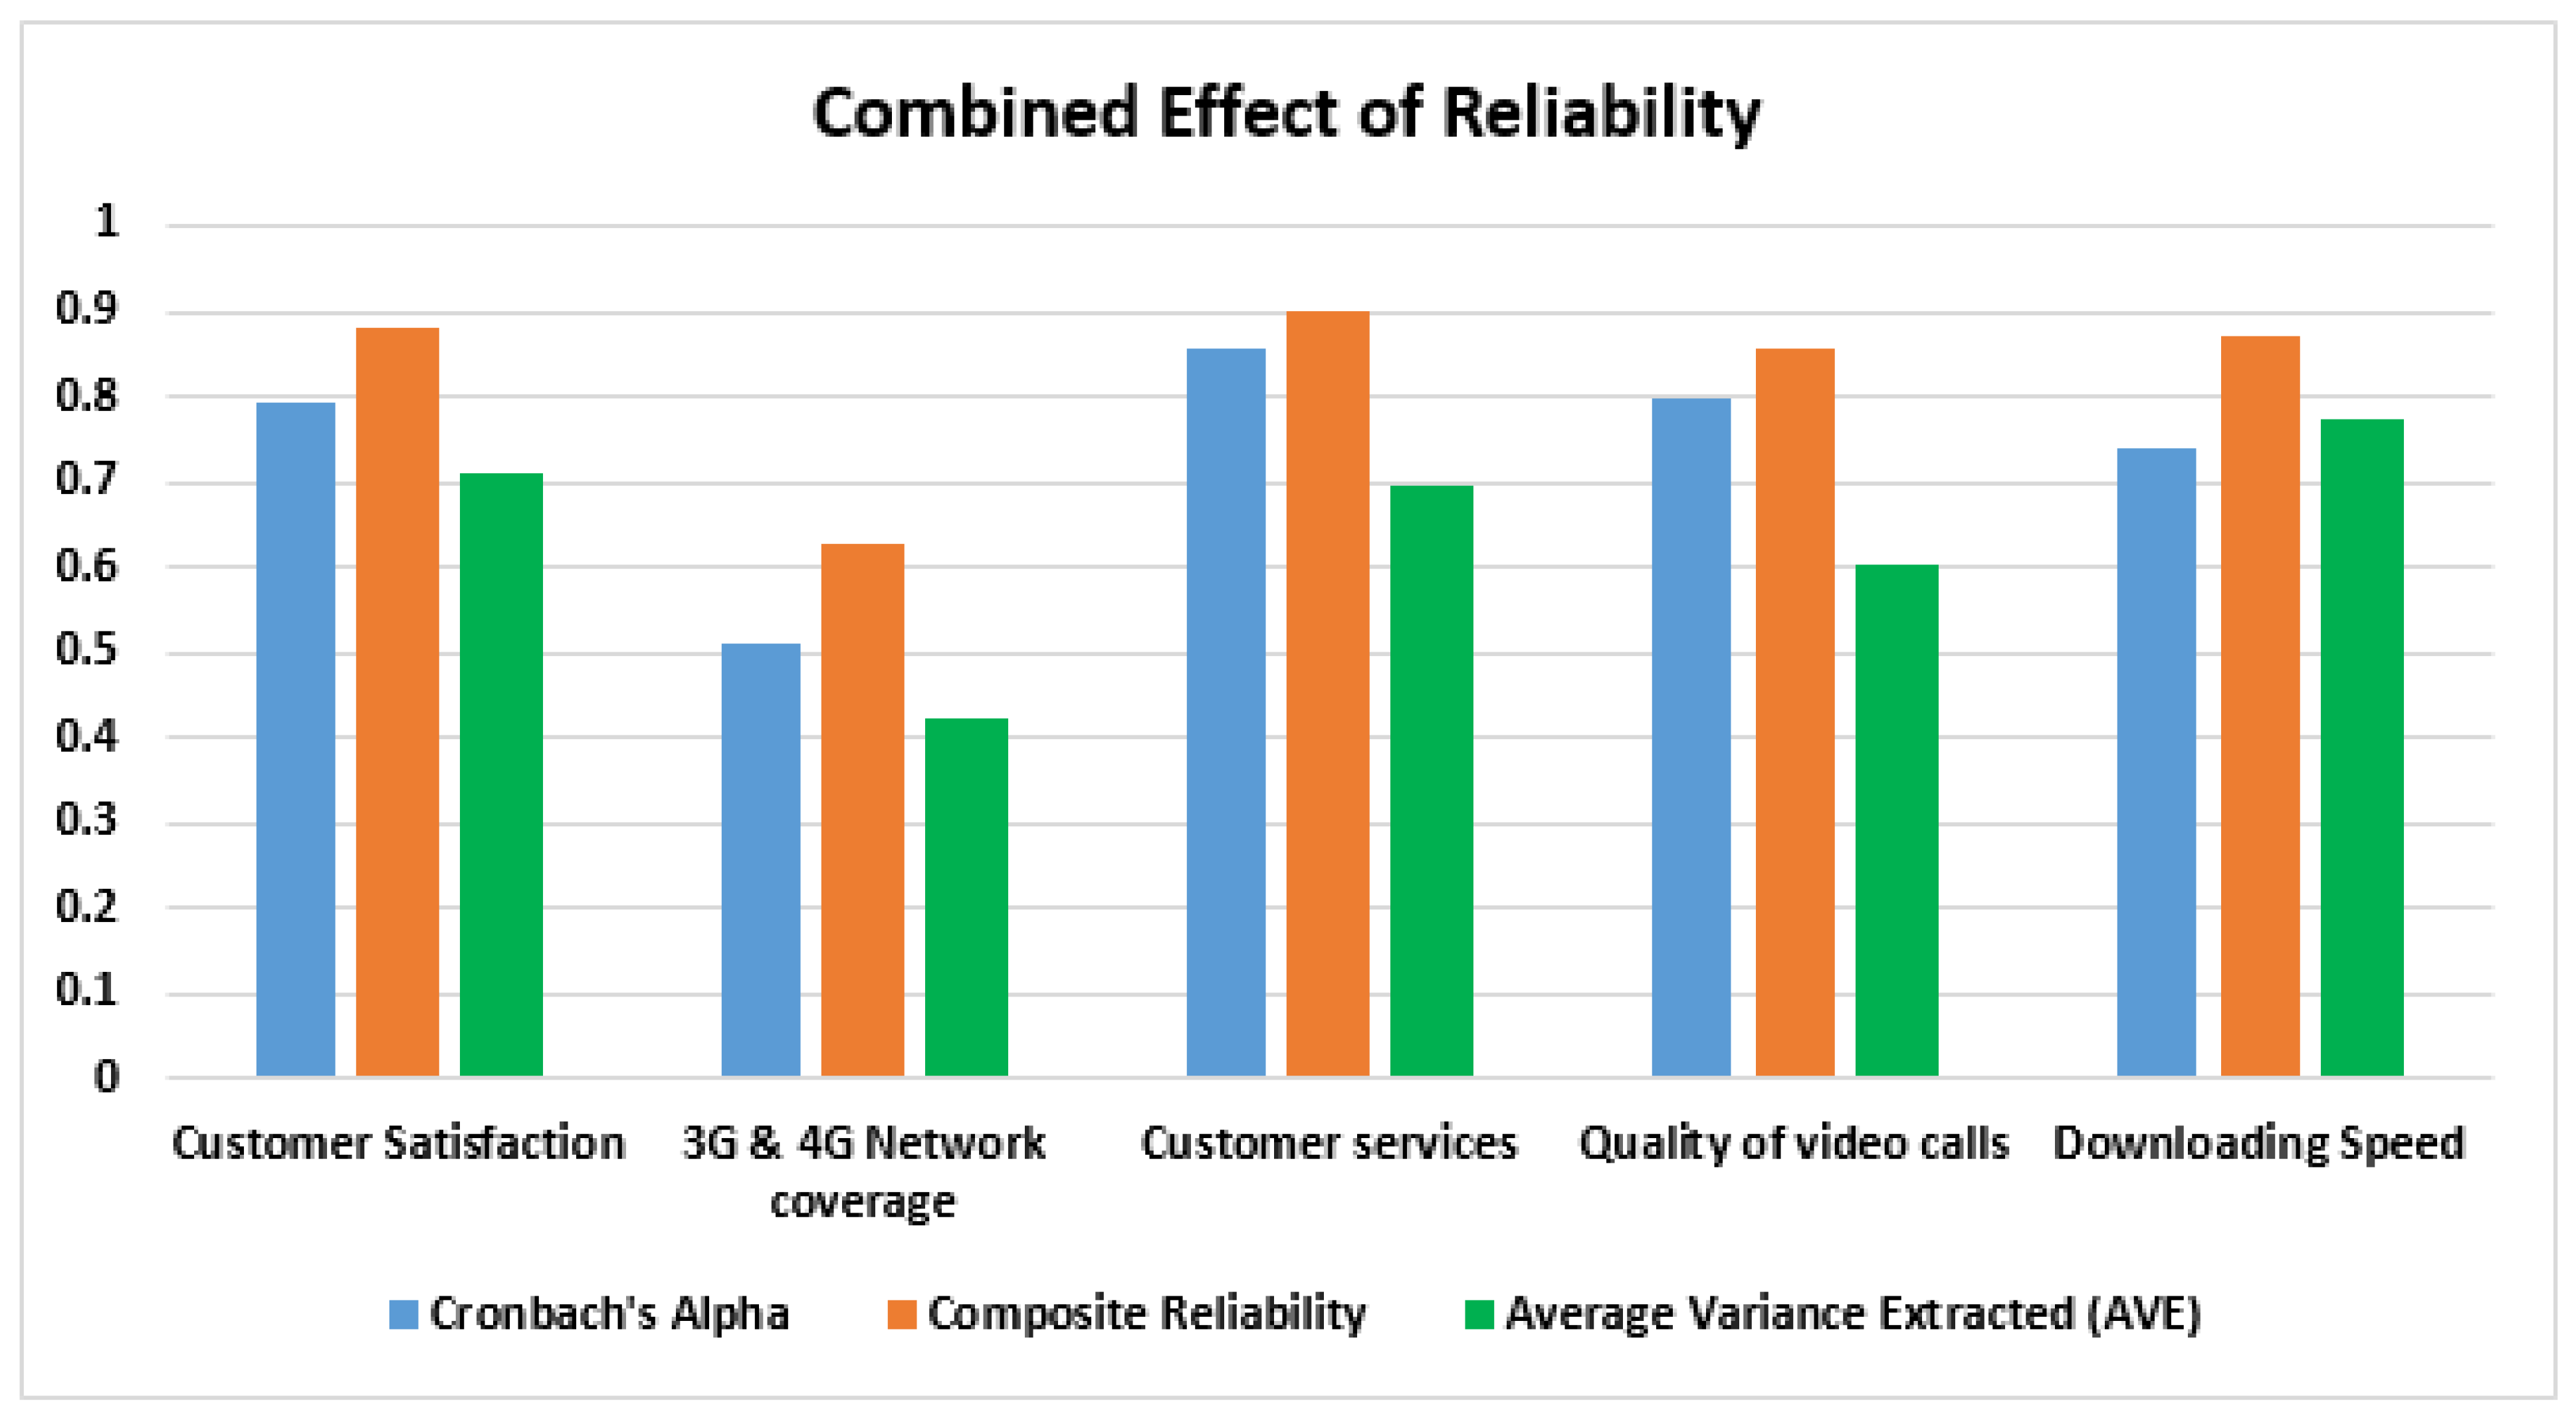
| Cronbach’s Alpha | Composite Reliability | Average Variance Extracted (AVE) | |
|---|---|---|---|
| Customer Satisfaction 3G and 4G Network coverage | 0.794 0.512 | 0.88 0.626 | 0.710 0.424 |
| Customer services | 0.855 | 0.9 | 0.694 |
| Quality of video calls | 0.797 | 0.857 | 0.605 |
| Downloading Speed | 0.74 | 0.872 | 0.775 |
| 3G and 4G Network Coverage | Customer Satisfaction | Customer Services | Quality of Video Calls | Downloading Speed | |
|---|---|---|---|---|---|
| CS2 | 0.684 | ||||
| CS3 | 0.922 | ||||
| CS4 | 0.903 | ||||
| CS5 | 0.802 | ||||
| CSF1 | 0.885 | ||||
| CSF2 | 0.87 | ||||
| CSF4 | 0.769 | ||||
| DS3 | 0.795 | ||||
| DS5 | 0.958 | ||||
| NC2 | 0.524 | ||||
| NC3 | 0.196 | ||||
| NC5 | 0.98 | ||||
| QVC2 | 0.861 | ||||
| QVC3 | 0.817 | ||||
| QVC4 | 0.567 | ||||
| QVC5 | 0.83 |
| 3G and 4G Network Coverage | Customer Satisfaction | Customer Services | Quality of Video Calls | Downloading Speed | |
|---|---|---|---|---|---|
| 3G and 4G Network coverage | 0.651 | ||||
| Customer satisfaction | 0.406 | 0.804 | |||
| Customer services | 0.21 | 0.423 | 0.803 | ||
| Quality of video calls | 0.117 | 0.366 | 0.722 | 0.778 | |
| Downloading Speed | 0.197 | 0.3 | 0.853 | 0.717 | 0.8 |
| 3G and 4G Network Coverage | Customer Satisfaction | Customer Services | Quality of Video Calls | Downloading Speed | |
|---|---|---|---|---|---|
| CS2 | 0.171 | 0.167 | 0.684 | 0.622 | 0.734 |
| CS3 | 0.204 | 0.477 | 0.922 | 0.696 | 0.713 |
| CS4 | 0.201 | 0.357 | 0.903 | 0.619 | 0.882 |
| CS5 | 0.121 | 0.299 | 0.802 | 0.497 | 0.572 |
| CSF1 | 0.366 | 0.885 | 0.328 | 0.276 | 0.233 |
| CSF2 | 0.508 | 0.87 | 0.259 | 0.217 | 0.16 |
| CSF4 | 0.125 | 0.769 | 0.5 | 0.449 | 0.383 |
| DS3 | 0.156 | 0.155 | 0.616 | 0.644 | 0.895 |
| DS5 | 0.189 | 0.327 | 0.647 | 0.651 | 0.958 |
| NC2 | 0.524 | 0.101 | 0.153 | 0.158 | 0.06 |
| NC3 | 0.596 | 0.041 | 0.084 | 0.083 | 0.156 |
| NC5 | 0.58 | 0.428 | 0.191 | 0.102 | 0.192 |
| QVC2 | 0.166 | 0.33 | 0.677 | 0.861 | 0.704 |
| QVC3 | 0.147 | 0.197 | 0.581 | 0.817 | 0.607 |
| QVC4 | 0.068 | 0.102 | 0.418 | 0.867 | 0.456 |
| QVC5 | 0.011 | 0.372 | 0.533 | 0.83 | 0.493 |
| Original Sample (O) | Sample Mean (M) | Standard Deviation (STDEV) | T Statistics (|O/STDEV|) | p Values | |
|---|---|---|---|---|---|
| 3G and 4G Network coverage -> Customer Satisfaction | 0.346 | 0.36 | 0.056 | 6.18 | <1% |
| Customer services -> Customer Satisfaction | 0.472 | 0.454 | 0.104 | 4.542 | <1% |
| Quality of video calls -> Customer Satisfaction | 0.221 | 0.224 | 0.076 | 2.913 | <1% |
| Downloading Speed -> Customer Satisfaction | 0.329 | 0.312 | 0.086 | 3.815 | <1% |
Disclaimer/Publisher’s Note: The statements, opinions and data contained in all publications are solely those of the individual author(s) and contributor(s) and not of MDPI and/or the editor(s). MDPI and/or the editor(s) disclaim responsibility for any injury to people or property resulting from any ideas, methods, instructions or products referred to in the content. |
© 2023 by the authors. Licensee MDPI, Basel, Switzerland. This article is an open access article distributed under the terms and conditions of the Creative Commons Attribution (CC BY) license (https://creativecommons.org/licenses/by/4.0/).
Share and Cite
Haq, I.; Soomro, J.A.; Mazhar, T.; Ullah, I.; Shloul, T.A.; Ghadi, Y.Y.; Ullah, I.; Saad, A.; Tolba, A. Impact of 3G and 4G Technology Performance on Customer Satisfaction in the Telecommunication Industry. Electronics 2023, 12, 1697. https://doi.org/10.3390/electronics12071697
Haq I, Soomro JA, Mazhar T, Ullah I, Shloul TA, Ghadi YY, Ullah I, Saad A, Tolba A. Impact of 3G and 4G Technology Performance on Customer Satisfaction in the Telecommunication Industry. Electronics. 2023; 12(7):1697. https://doi.org/10.3390/electronics12071697
Chicago/Turabian StyleHaq, Inayatul, Jahangeer Ahmed Soomro, Tehseen Mazhar, Ikram Ullah, Tamara Al Shloul, Yazeed Yasin Ghadi, Inam Ullah, Aldosary Saad, and Amr Tolba. 2023. "Impact of 3G and 4G Technology Performance on Customer Satisfaction in the Telecommunication Industry" Electronics 12, no. 7: 1697. https://doi.org/10.3390/electronics12071697