2. Related Work
Many studies have been reported using accelerometers (including gyroscopes), electromyography (EMG), and cameras (RGB cameras and RGB depth cameras) to observe and analyze tremor.
In a research report conducted by a research team at the Nagaoka University of Technology around the year 2000, for which an accelerometer was used for the time series conversion of motor symptoms, Kunimoto Shindo et al. aimed to estimate the severity and differentiation of a disease similar to Parkinson’s syndrome and essential tremor [
7]; Yukiyo Gondaira et al. (1998) aimed to perform a differential diagnosis and severity estimation of Parkinson’s disease and essential tremor [
8]; and Yoshinobu Matsumoto et al. (2001) aimed to conduct a frequency analysis of tremor acceleration information measured in the upper extremities of patients with Parkinson’s disease and essential tremor, for which effective parameters designed for use in a biofeedback system were extracted [
9]. These works reported that the time series of tremor intensity correlated with clinical scores and that it was difficult to discriminate disease using tremor frequency.
Additionally, the objective of a study by Roberto López-Blanco et al. (2019) was the quantitative assessment of resting tremor in patients with Parkinson’s disease using the gyroscope of a smartwatch worn on the wrist of patients with Parkinson’s disease [
10], wherein the authors calculated the average tremor intensity and the clinical score in the three-axis time series of observations using spearman’s rank correlation coefficient and reported that the average tremor intensity and the clinical score were correlated. According to the findings presented in [
7,
8,
9,
10] wherein accelerometers were used (including gyroscopes) were used, the differential diagnosis of Parkinson’s disease and essential tremor is similar in terms of the distribution frequency bands of each disease; it is a common view that identification using frequency information is difficult [
7,
8,
9]. However, since we can confirm that there is a correlation between the clinical score (severity) and the time series of tremor intensity [
8,
10], we hypothesize that tremor intensity can be used to estimate severity.
In [
11], which was reported by Jie Zhang et al. (2017), the authors aimed to investigate the value of electromyographic tremor analysis for the differential diagnosis of Parkinson’s disease and essential and physiological tremor using electromyography, for which the tremor frequency in Parkinson’s disease was about 4–6 Hz, the tremor frequency in essential tremor was about 5–8 Hz, and the frequency in physiological tremor was 6–12 Hz [
11] (p. 2). Additionally, it was reported that Parkinson’s disease and essential tremor are difficult to distinguish according to tremor frequency [
11] (p. 3).
In addition, in Zixiang Hu et al.’s study, in which the authors aimed to analyze the interference effects of tremor [
12] using a motion sensor and an electromyograph, the authors instructed patients to perform a specified trajectory of motion to analyze tremors during exercise and compared the differences in motion between Parkinson’s disease subjects and control subjects. The observation of motor symptoms using accelerometers and electromyographs [
11,
12] can be used to directly measure time series because the sensors are in contact with the patient, and they seem to encounter fewer measurement errors due to noise, which may cause the patient to become aware that they are being measured and cause a situation wherein motor symptoms do not appear. Therefore, in recent research, many studies have reported the measurement and analysis of this motor symptom using a camera, which is a type of non-contact measurement method.
There were three camera-based methods for observing motor symptoms in the hands of Parkinson’s disease. (1) using accelerometer and RGB camera [
13], (2) using depth camera [
14,
15], (3) using RGB camera [
5,
6,
16].
Stefan Williams et al. (2020) estimated tremor frequency via the optical flow of pixels in a video of motor symptoms using an accelerometer and an RGB camera, and an accelerometer was attached to a patient’s hand to allow for the comparison of measurements [
13]. The time series from each approach were analyzed using fast Fourier transform (FFT) and Bland–Altman analysis. The Altman analysis showed excellent agreement, with 36 of 37 videos (97%) showing a difference of less than 0.5 Hz between the computer vision and accelerometer readings and presenting levels of agreement and tremor amplitude. It was reported that there is no significant correlation between these two measures [
13] (pp. 71–74). Accordingly, we hypothesize that the estimated time series from a video shot by a smartphone can reproduce the time series obtained by a contact type device.
In a study by Ferraris Claudia et al. (2018), an RGB depth camera was used to acquire time series of motor symptoms occurring in a patient’s hand during an assessment of the three items of the MDS-UPDRS (3.4: finger tapping <FT>, 3.5: opening and closing <OC>, and 3.6: pronation and supination <PS>). The reported accuracy values (clinical score prediction) obtained via the cross-validation of five classifiers [
14] (p 16, Table 6) after extracting the features [
14] (p. 11) from each time series were 76%, 65%, and 58% for FT, OC, and PS, respectively [
14] (p.17).
Similarly, in a study [
15] conducted by Yan Pang et al. (2020), three-axis time series were obtained by stereoscopically capturing hand motor symptoms using two RGB cameras. To analyze the time series, the authors used the discrete wavelet transform to extract six features [
15] (p. 5,
Table 2) from each of the three input time series decomposed into five levels. The mean separability between severity in the control subjects and those with Parkinson’s disease was determined. The results showed that the mean separability of the five Parkinson’s disease patients was 0.411 with a standard deviation of 0.106. The correlation coefficient between the mean separability and UPDRS score was 0.9115, and the P value was 0.0312. Furthermore, they reported a mean separability of 0.179 with a standard deviation of 0.024 for two control subjects aged ≥60 years, whose features were clearly distinguishable from those of the Parkinson’s disease patients [
15] (p. 8).
Ferraris Claudia et al. (2018) and Yan Pang et al. (2020) believe that the three-dimensional analysis of motor symptoms is an effective method for the detailed analysis of motor symptoms. However, it is not a consumer-oriented method because the measurement equipment is bulky and special devices such as an RGB depth camera are used. We hypothesize that the RGB camera standardly installed in smartphones, which is widely used by consumers and does not require a large measurement device, can contribute to solving the above-mentioned problems. We also confirmed the results of a study that attempted an approach using a single camera.
In [
5] conducted by T. Hayashida et al. (2021), using one RGB camera, velocity and acceleration waveforms were obtained by differentiating the time series obtained by one RGB camera. Seven statistical features were obtained from each waveform. As a result, the authors reported that the average validation accuracy obtained using the five classifiers was 76.8% [
5].
In addition, in [
6] conducted by Takafumi Hayashida et al. (2022), which was a continuation of Ref. [
5], a time series was decomposed into five layers of wavelet coefficients, each feature value was obtained, and time series analysis was performed. As a result of analyzing the correlation using Pearson’s product correlation coefficient for each feature value and four classes of severity, the maximum correlation with severity was |r| = 0.65, while most of these values were reported to be around |r| = 0.60. They also reported that the maximum correlation with disease was |r| = 0.34. However, this method uses Pearson’s product correlation coefficient, which is used when combining quantitative and quantitative variables, even though the objects of analysis were quantitative and qualitative variables.
Finally, in a study by Rui Guo et al. (2022) concerning the quantitative assessment of tremor severity in patients with Parkinson’s disease [
16], a skeletal hand sequence was obtained from a video recorded by a single camera using a pre-trained hand pose estimation model. Clinical scores were estimated by the proposed tree-structure-guided GCN (TSG-GCN) [
16] (pp. 3–6). As a result, the authors achieved an accuracy rate of 73.71% and an acceptable accuracy rate of 99.20% in severity estimation (i.e., the probability that a true positive (TP) value includes a false negative (FN) value before and after determining the true value) [
16] (p. 7). In addition, they reported that the accuracy rate was 71.88% when tested with a dataset that was independent of the dataset at the time of learning [
16] (p. 7).
As described above, the camera-based time-series acquisition of motor symptoms [
5,
6,
16] is a more consumer-oriented approach than the accelerometer-and-electromyography-based approach described above. In the former, the patients themselves can determine the severity of their motor symptoms without travelling to a hospital or ascertain the disease they are likely afflicted with. Moreover, most of the studies presented focused on severity estimation and differential diagnosis between control subjects and those with Parkinson’s disease. A comprehensive diagnostic support system, including the necessary differentiation between Parkinson’s disease and essential tremor, has not yet been proposed.
3. Acquisition of Clinical Data and Time Series
Time series analysis involves the use of statistical methods to analyze patterns and trends in data that are collected over time. This can be particularly useful for the analysis of clinical data, where changes in a patient’s condition may be tracked over time using various types of measurements.
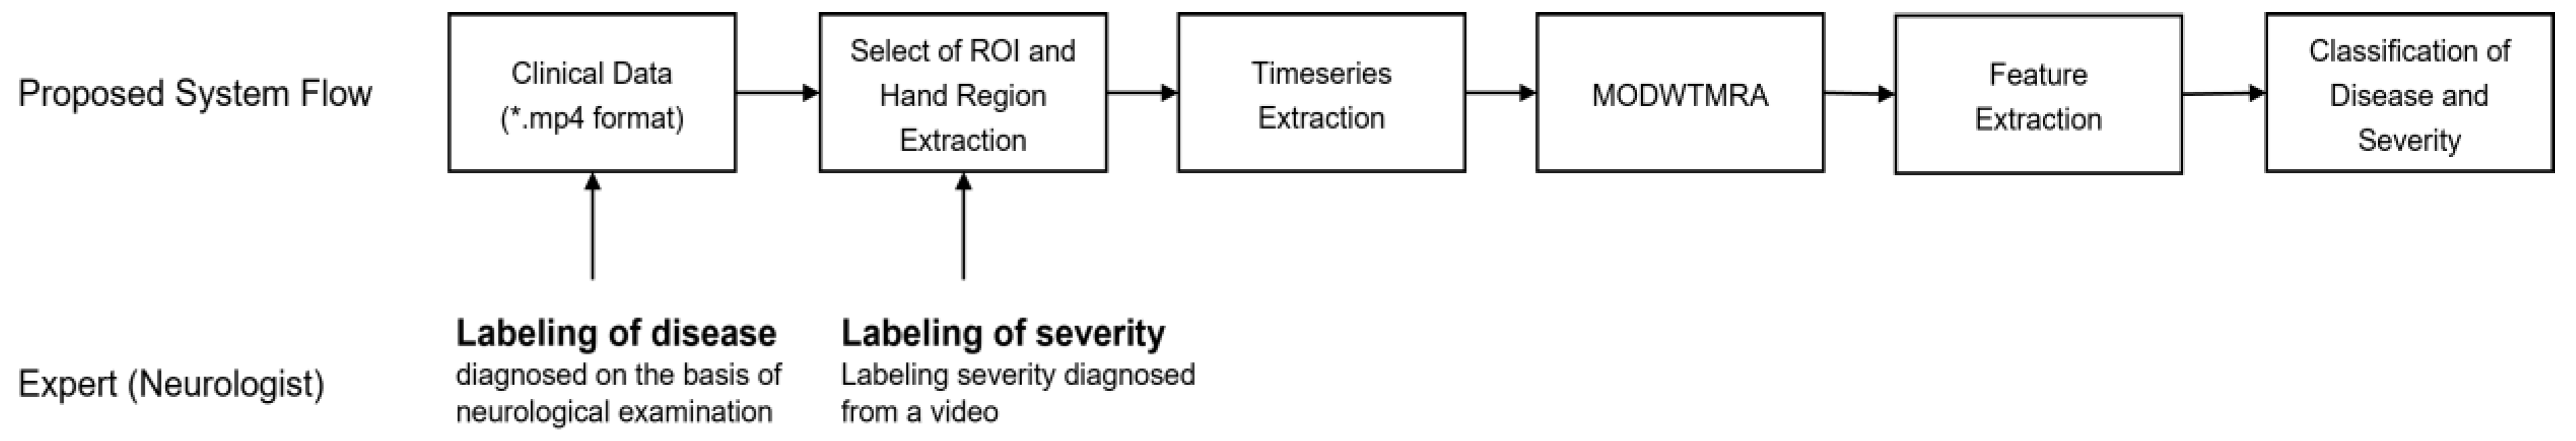
An algorithm flowchart for the proposed system is described in
Figure 1, including the following processes:
Collect clinical data using a smartphone’s built-in camera;
Pre-process the data by segmenting foreground and background images;
Execute labelling process and time series data transformation;
Extract statistical features from the time series data;
Visualize the importance of the extracted features;
Perform data classification using logistic regression model;
Estimate posterior probabilities using the SoftMax function.
The main contribution of this paper is the proposal of a system that can collect clinical data using a smartphone’s built-in camera, pre-process the data, extract statistical features, and classify the data using a logistic regression model. The proposed system can be used for medical diagnosis and monitoring. The broader contribution of this paper is the development of a system that can enable the remote monitoring of patients and provide timely feedback to medical professionals.
3.1. Acquisition of Clinical Data
The subjects of this study were 25 outpatients at the University of Miyazaki Hospital, 19 of whom were diagnosed with Parkinson’s disease (7 males/12 females), while the remaining 6 were diagnosed with essential tremor (4 males/2 females).
Table 1 shows the subjects’ information. In addition, the subjects were given an oral explanation of the purpose of this study, how the data would be obtained, and how they would be used, and their written consent was obtained. In consideration of the patients’ privacy, the data were processed so that individuals could not be identified. This study was approved by the Ethics Committee of the UNIVERSITY OF MIYAZAKI DEPARTMENT OF MEDICINE (protocol code: O-0577, 20 September 2019). The data collection period spanned from October 2020 to October 2022. Motor symptoms were recorded with MDS-UPDRS 3.15. Postural tremor of hands was assessed under the supervision of a neurologist designated as an intractable disease doctor.
The recording conditions are as follows. Videos were recorded for about 15 s at a resolution of 1920 × 1080 and a sampling frequency of 30 fps or 60 fps using a GoPro HERO5 or smartphone’s built-in camera. At this time, the camera was fixed, and the distance from the lens to the hand was about 30 cm. At the time of recording, a green, felt fabric was placed behind the hand to facilitate the extraction of the hand region.
3.2. Labeling Clinical Data
Each captured video was objectively evaluated by a neurologist designated as a disease-specific specialist with a score equivalent to the MDS-UPDRS Part III: Motor Examination (3.15: Postural tremor of the hand). MDS-UPDRS 3.15 is rated on a five-level scale, but the score used for correct labeling is a four-level scale ranging from zero to three. A four-level scale was used to eliminate the following ambiguous ratings in MDS-UPDRS 3.15.
| 3.15 | POSTUAL TREMOR OF HANDS |
| 0: | Normal: | No Tremor. |
| 1: | Slight: | Tremor is present but less than 1 cm in amplitude. |
| 2: | Mild: | Tremor is at least 1 cm but less than 3 cm in amplitude. |
| 3: | Moderate: | Tremor is at least 3 cm but less than 10 cm in amplitude. |
| 4: | Severe: | Tremor is at least 10 cm in amplitude. |
As shown above, the difference between MDS-UPDRS 3.15 scores of 0 and 1 is ambiguous, and it is possible that different evaluators will yield different evaluations. To avoid this, the four-level evaluation index used in the actual evaluation was a combination of the 0 and 1 scores from MDS-UPDRS 3.15. In addition, the correct labels for Parkinson’s disease and essential tremor were findings from a neurological examination conducted by a neurologist designated as an intractable disease doctor.
3.3. Acquisition of Time Series
The selection of the region of interest (ROI) for each captured video was performed by an expert in the field who had extensive clinical experience with the motor symptoms being evaluated. The expert manually identified the specific regions on the video frames that were most relevant to the motor symptoms under study, and these regions were marked as the regions of interest. To ensure the accuracy and consistency of the ROI selection procedure, a second expert was also involved in the process. The second expert reviewed and verified the ROI selections made by the first expert, and any discrepancies were discussed and resolved through consensus. The ROI was then used to trim the captured video data to remove any extraneous frames outside of the selected region. These trimmed data were then used as the input video to the system. Overall, the ROI selection process was performed with great care and attention to detail in order to ensure the accuracy and reliability of the data’s analysis. We believe that this rigorous approach to ROI selection helps strengthen the validity of our findings.
A region of interest (ROI) was manually created for each captured video, and trimming was performed according to the ROI. The data after trimming were used as the input video to the system. In addition, this research was processed using the technical computing language environment MATLAB (The MathWorks, Inc., Natrick, Massachusetts, USA; MATLAB Version 9.13.0.2105380 (R2022b), Update 2, The MathWorks, Inc., 2022. Computer Software.
www.mathworks.com/ accessed on 1 January 2022). Ref. [
5] was used as a reference for the method of acquiring motor symptoms as a time series from the input video.
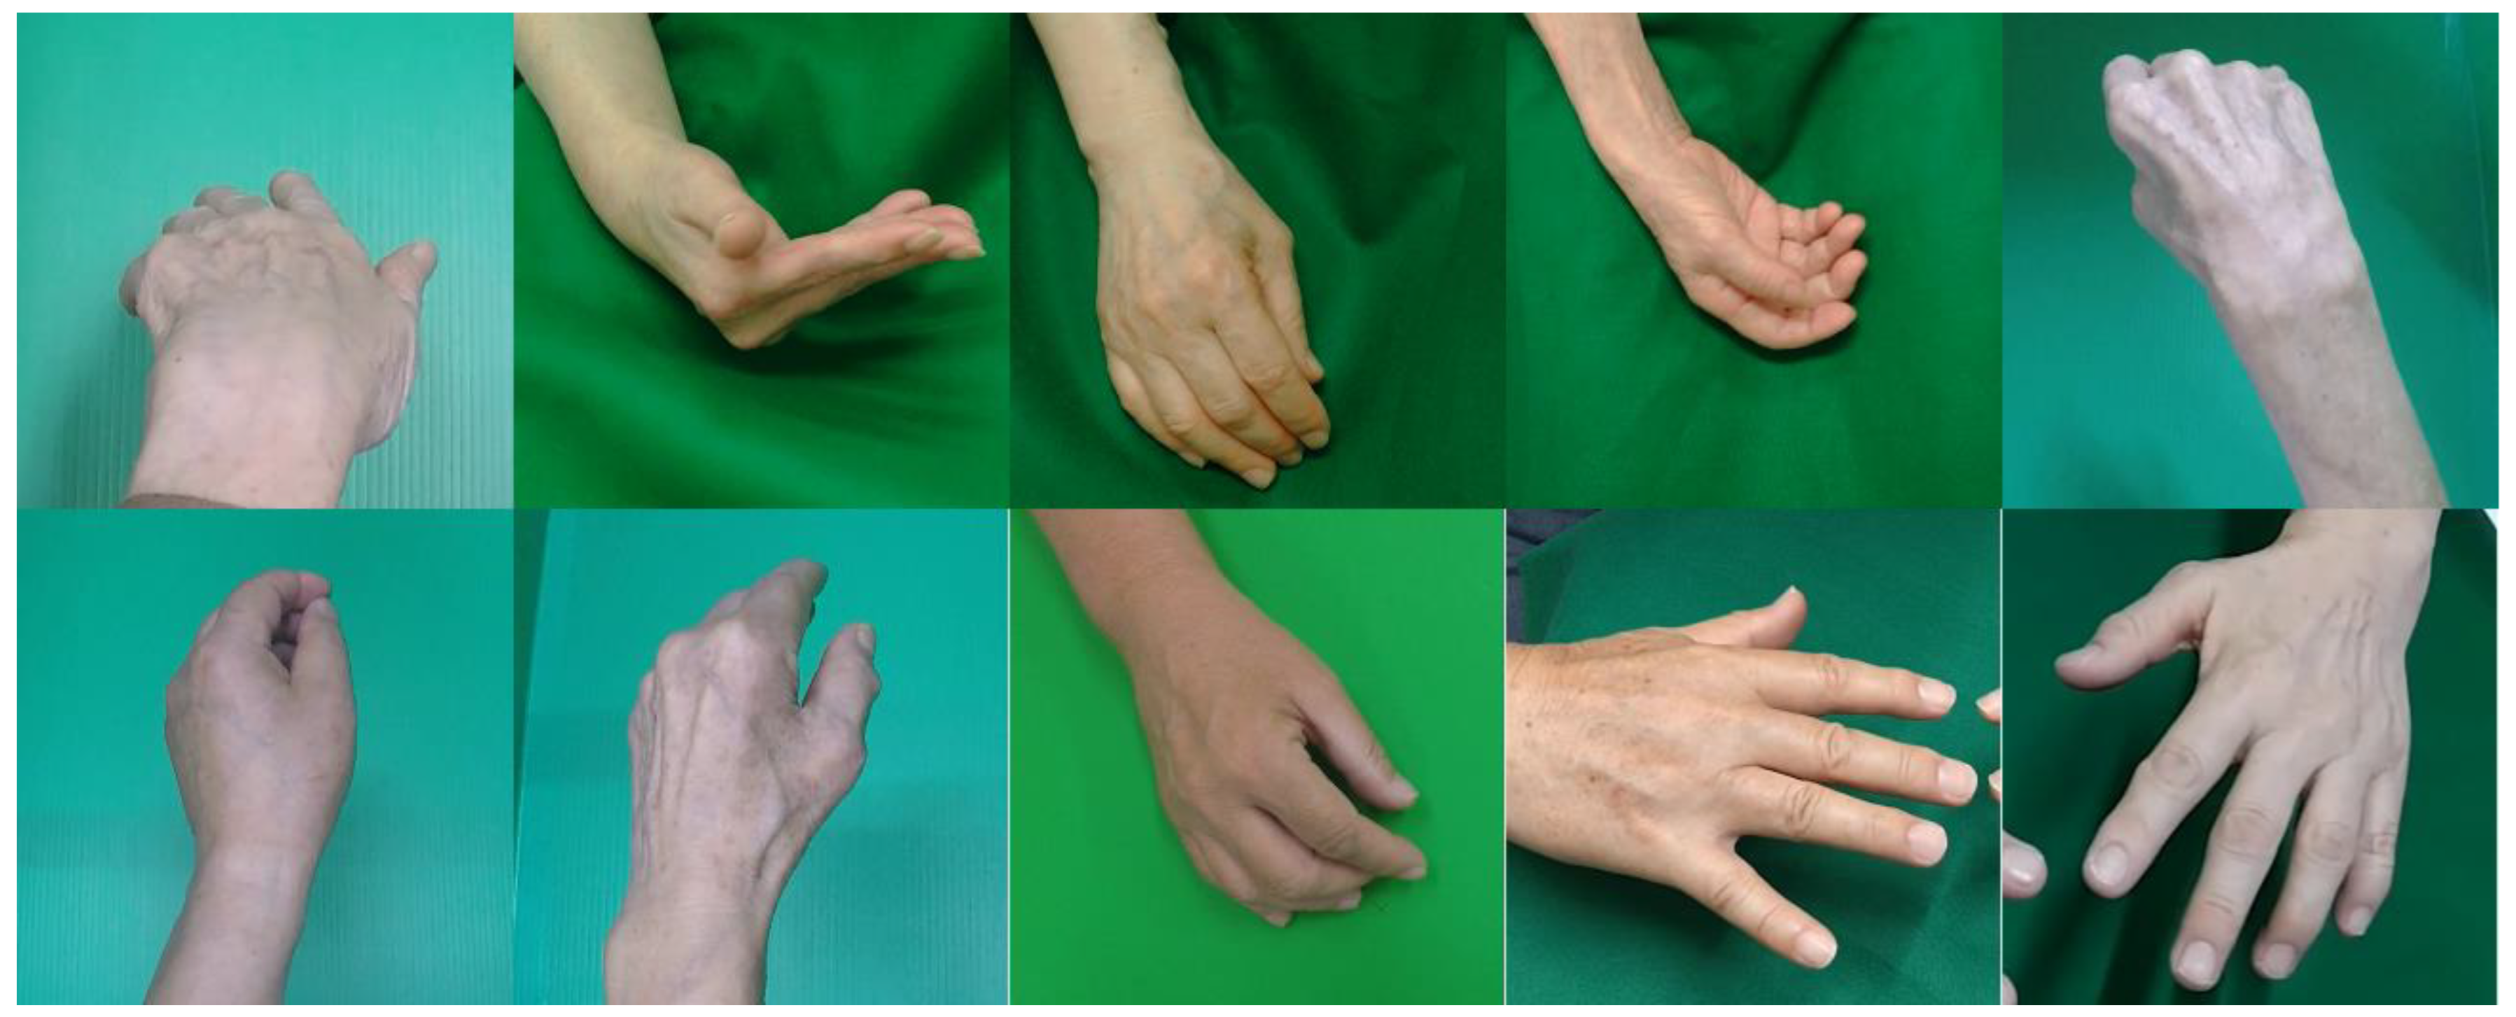
To extract the hand region for each image, we divided the input videos into image sequences. As an example,
Figure 2 shows the image sequences after processing.
We would like to clarify that the processing procedure referred to in
Figure 2 is the segmentation process, which is a method used to separate the foreground (hand) from the background in an input video. The image sequence in
Figure 2 shows the result of this segmentation process, where the hand is displayed as the foreground on a green background.
As can be seen in
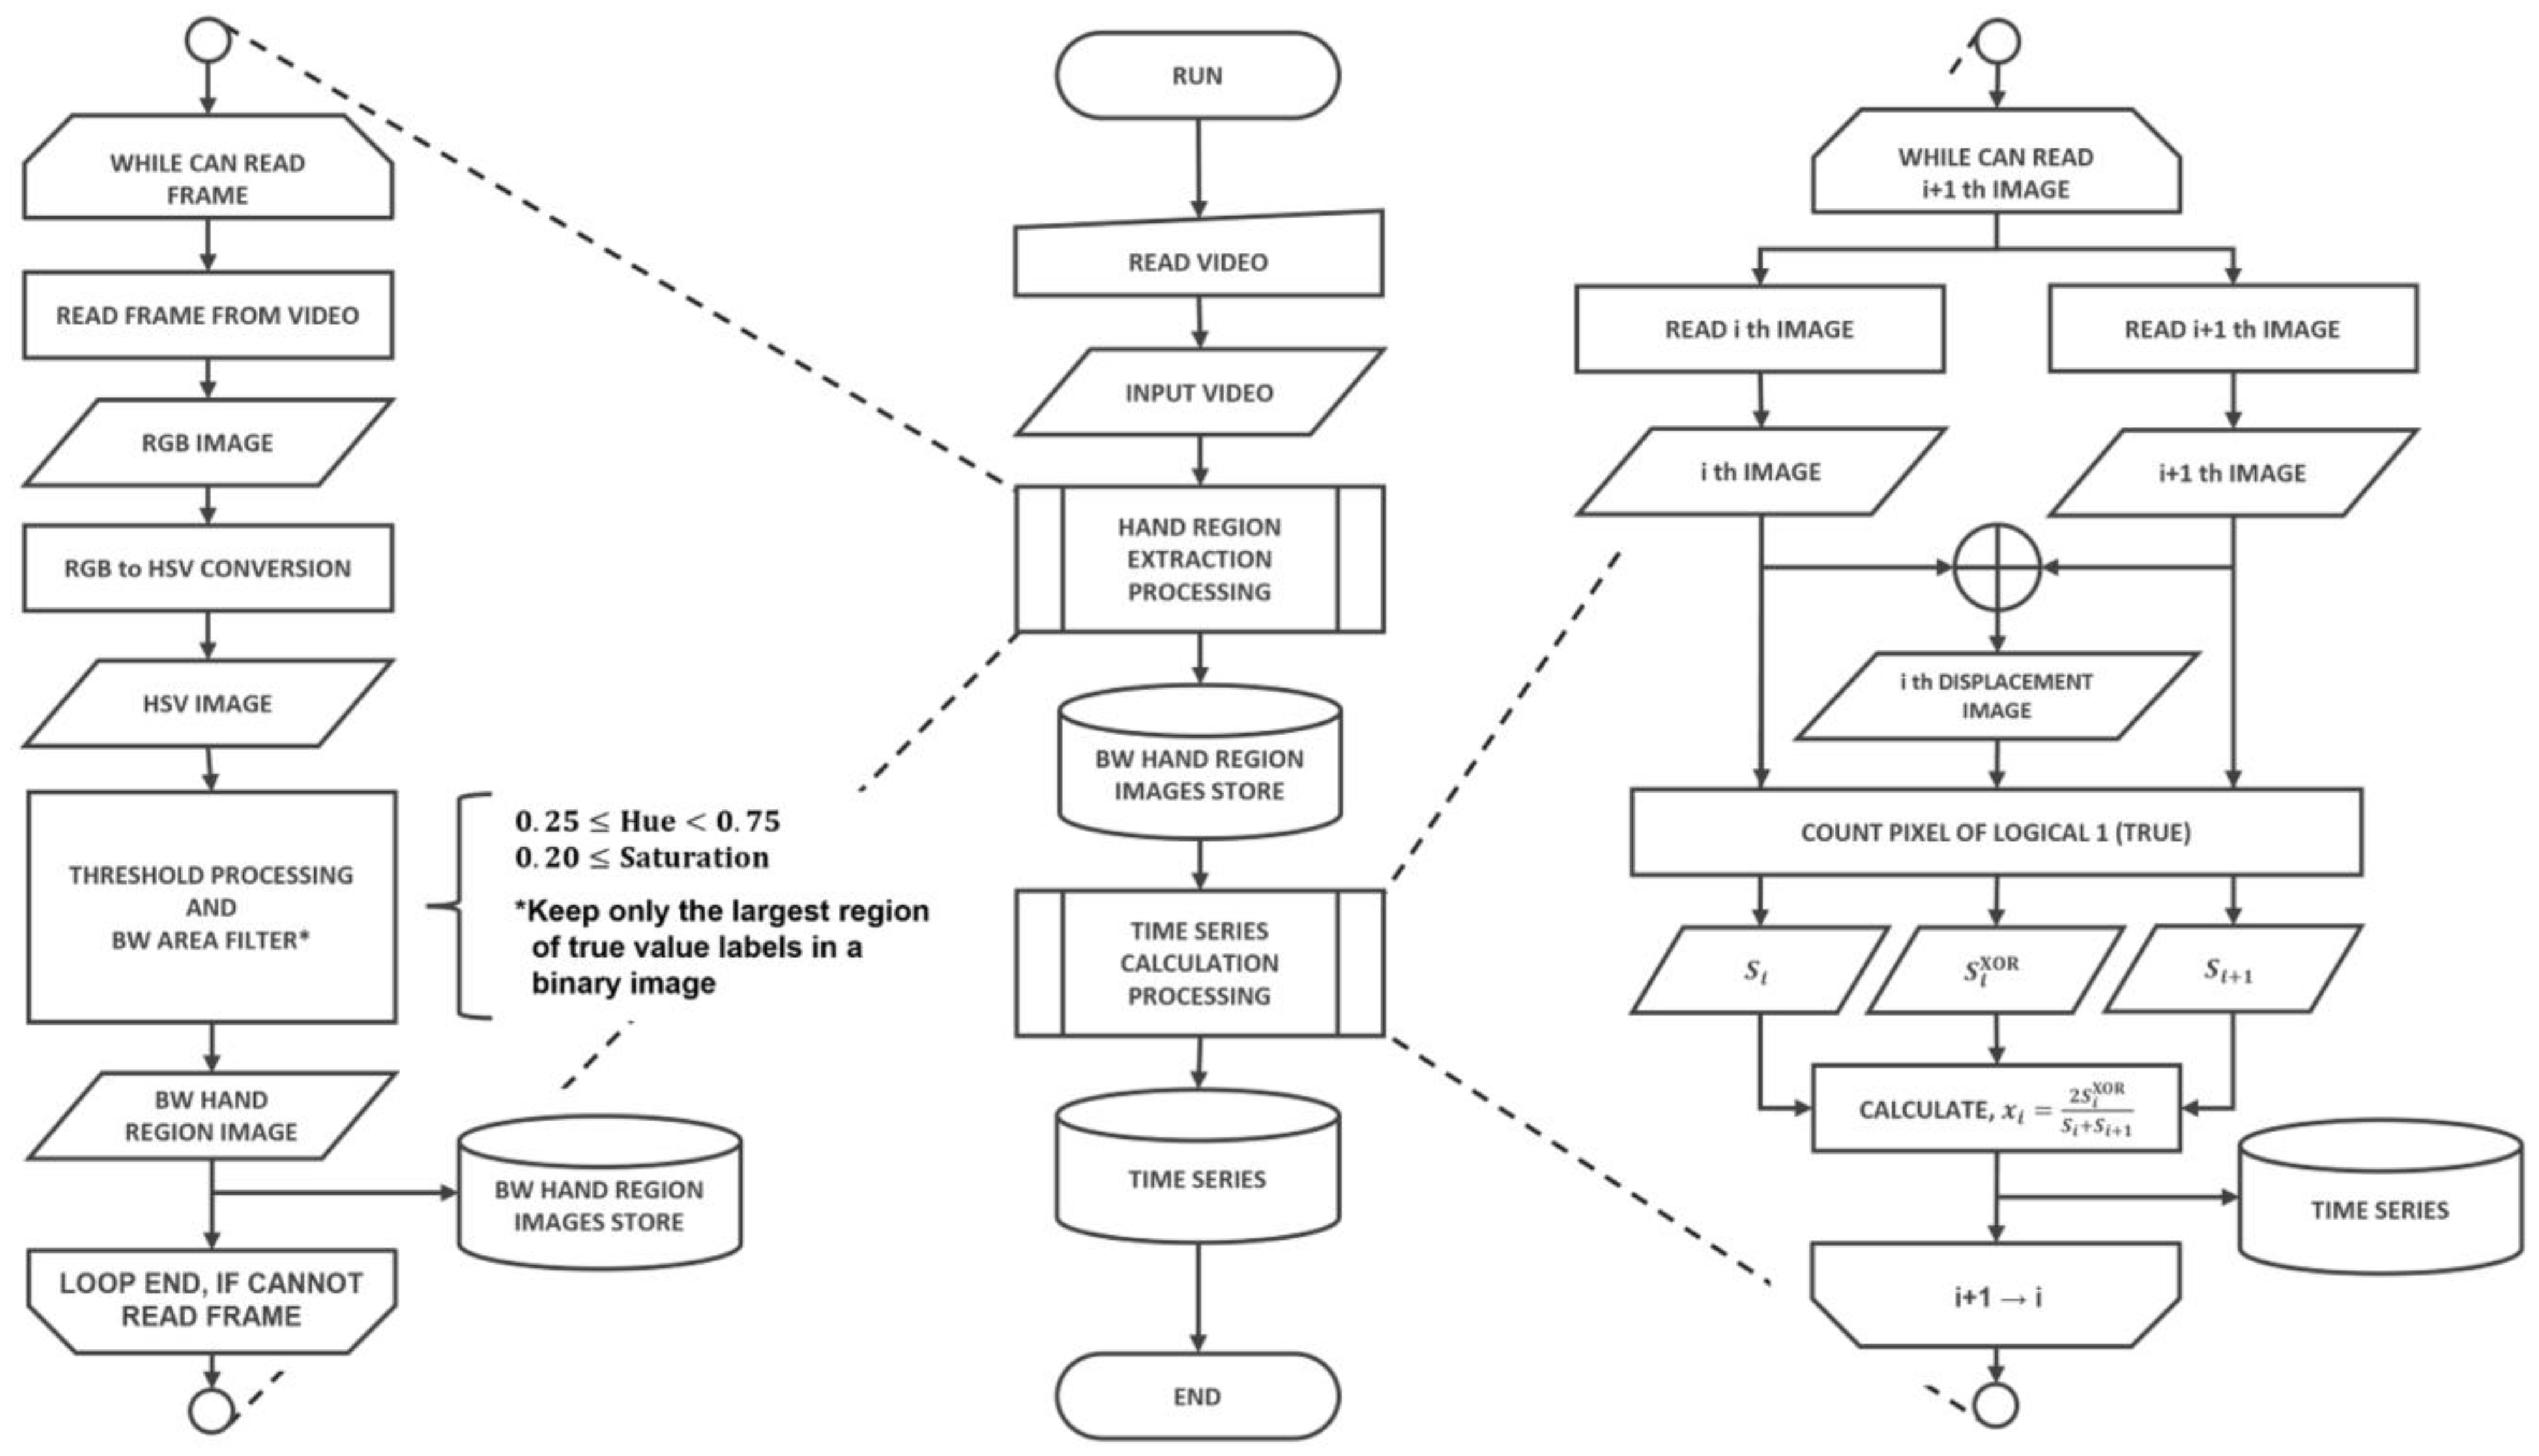
Figure 2, the image sequence after the segmentation process is an RGB image in which the hand is reflected as the foreground on the green background. To extract the hand region, the hand region was obtained by converting the image to the HSV color space, which can handle color expression more intuitively than the RGB color space, and manually setting the hue range of the background, as shown in
Figure 3.
Therefore, we set the thresholds for the hue range and saturation range of the background, for which we assumed that the foreground would not be included, as follows.
Using these threshold processing steps, the background area aside from the hand area is output. The hand region is extracted by logical negation (NOT). At this time, when a region other than the hand region was extracted, processing was performed so that only the largest region with a logical value of 1 remained. The exclusive OR was calculated for continuous binary images of the hand region. When the exclusive OR is calculated, an image of displacement (displacement amount) of the hand region between adjacent images is output.
The number of white pixels per frame of the binary image of the hand region and the number of white pixels per frame of the exclusive OR image are defined as follows:
To suppress the effect of hand size, the time series of motor symptoms was obtained by dividing the number of white pixels in the displaced image by the average number of white pixels in the binary image of the two-handed region. This process can be defined as follows:
where
n is the frame number.
When acquiring binary images of the hand region from the image sequence, the hand region could not be adequately extracted, and spike noise (values clearly different from other observed values) occurred in the time series. To remove this spike noise, we detected and removed abnormal values (outliers) using the Hampel classifier for the time series of motor symptoms. The Hampel identifier is a type of parametric method, specifically, an outlier detection method that assumes that the frequency distribution of sample values follows a normal distribution.
Most biological signals are non-stationary signals whose frequencies fluctuate over time. Therefore, the discrete Fourier transform (DFT), which assumes that the target of analysis is a stationary signal, is a frequency transform method that removes time information from the time series and is thus unsuitable for nonstationary signal analysis. Therefore, in this study, we decomposed the time series of motor symptoms into five levels using undecimated discrete wavelet transform, which is a kind of time–frequency transform. The decomposition level (resolution) of the time series used in this study was set at five due to the tremor frequency distribution and time series length. The mother wavelet used is the Daubechies (Db) orthogonal wavelet Db4, which was reported to have the highest accuracy in [
15]. A total of six time series were calculated from each video by combining the input time series and the wavelet coefficients of each level after multiresolution analysis (detailed coefficients—cD1, cD2, cD3, cD4, cD5; approximation coefficient—cA5).
While we realized that AI-based methods can be more efficient and faster, we chose to use the manual method of hue and saturation extraction in our research for several reasons. First, our focus was on evaluating the effectiveness of the overall system in detecting motor symptoms rather than the specific method of hue and saturation extraction. Second, we had limited resources and time available for this project and, therefore, opted for a simpler and more accessible method that could be performed using the tools and expertise available to us.
However, we will consider the use of AI-based methods in future studies. We acknowledge that these methods have the potential to improve the efficiency and accuracy of motor symptom detection, and we agree that they constitute a promising area of research in this field.
6. Discussion
The purpose of this study was to develop a support system for estimating the se-verity of tremor and achieve a differential diagnosis between Parkinson’s disease and essential tremor via the implementation of a smartphone application. Therefore, in this study, by analyzing the time series obtained by the non-contact acquisition method of motor symptoms using a single RGB camera [
14], we estimated the severity of tremor and examined the possibility of differentiating Parkinson’s disease from essential tremor. The elements required to achieve the research objectives are shown below.
A practical method for acquiring motor symptoms should be employed;
Do not interfere with a medical examination (regardless of location or whether short measurement times are used);
Find features (explanatory variables) that are highly significant in terms of severity prediction;
Find features (explanatory variables) that are highly significant in terms of disease prediction;
Create a learning model and output fuzziness;
Ensure reliability (high accuracy) of the classification results.
The degree to which each of these elements was achieved in this research is described below.
Regarding 1. In this study, an RGB camera was used to acquire motor symptoms. An RGB camera is a common device and a standard piece of equipment included in smartphones possessed by numerous individuals. Accordingly, we believe that the non-contact diagnostic support system proposed in this study has achieved this requirement.
Regarding 2. In relation to 1, the timeseries acquisition method of motor symptoms in this study is an original, non-contact, RGB-camera-employing method. By making the system proposed in this research an app that can be installed on smartphones, we believe that it may be possible to overcome the problem of being “anywhere”. There is a constraint that we have identified: we believe that a device cannot be capable of being used “anywhere” without overcoming the constraints of this background condition. In addition, the measurement time employed in this study was about 15 s. We believe that this does not interfere with examination, but we did not investigate the effect of the time series length of 15 s on the classification results. Therefore, it is necessary to investigate the effect of the recording time on the classification results in future studies. Therefore, we believe that element 2 has not been achieved.
Regarding 3. We found that there is a high degree of correlation (maximum rs = 0.73) between the correct labeling of severity and each explanatory variable, especially the feature values derived from the amplitude of the time series. Regarding the degree of importance, we believe that it is highly possible to classify disease and severity using the feature value derived from the amplitude of the time series. Therefore, we believe that element 3 has been achieved.
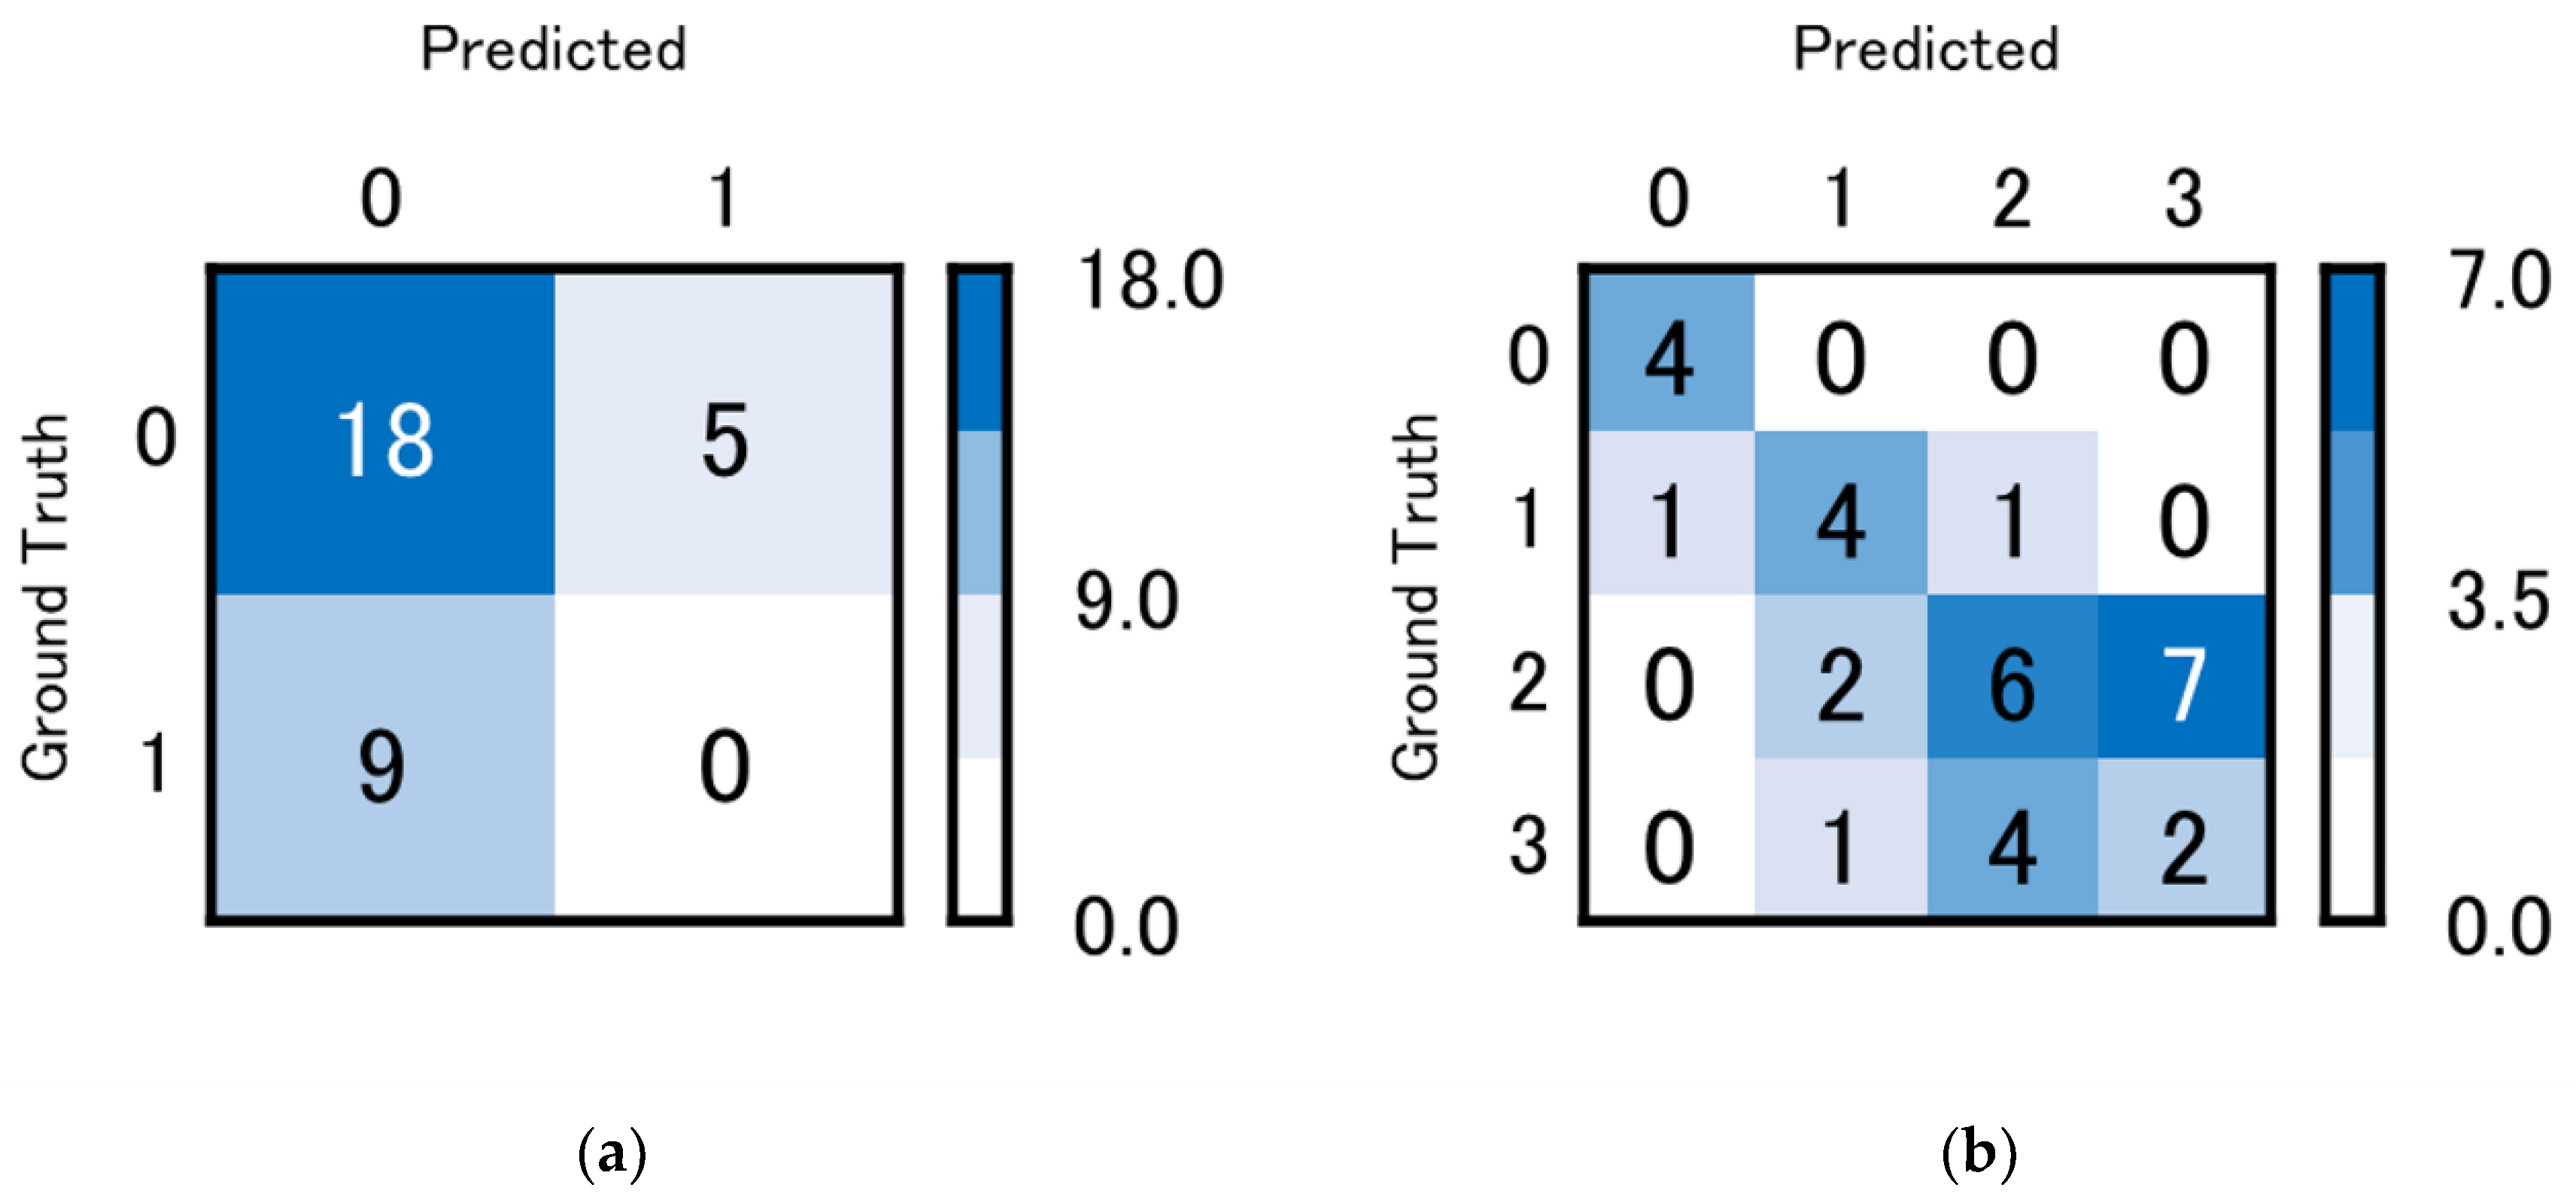
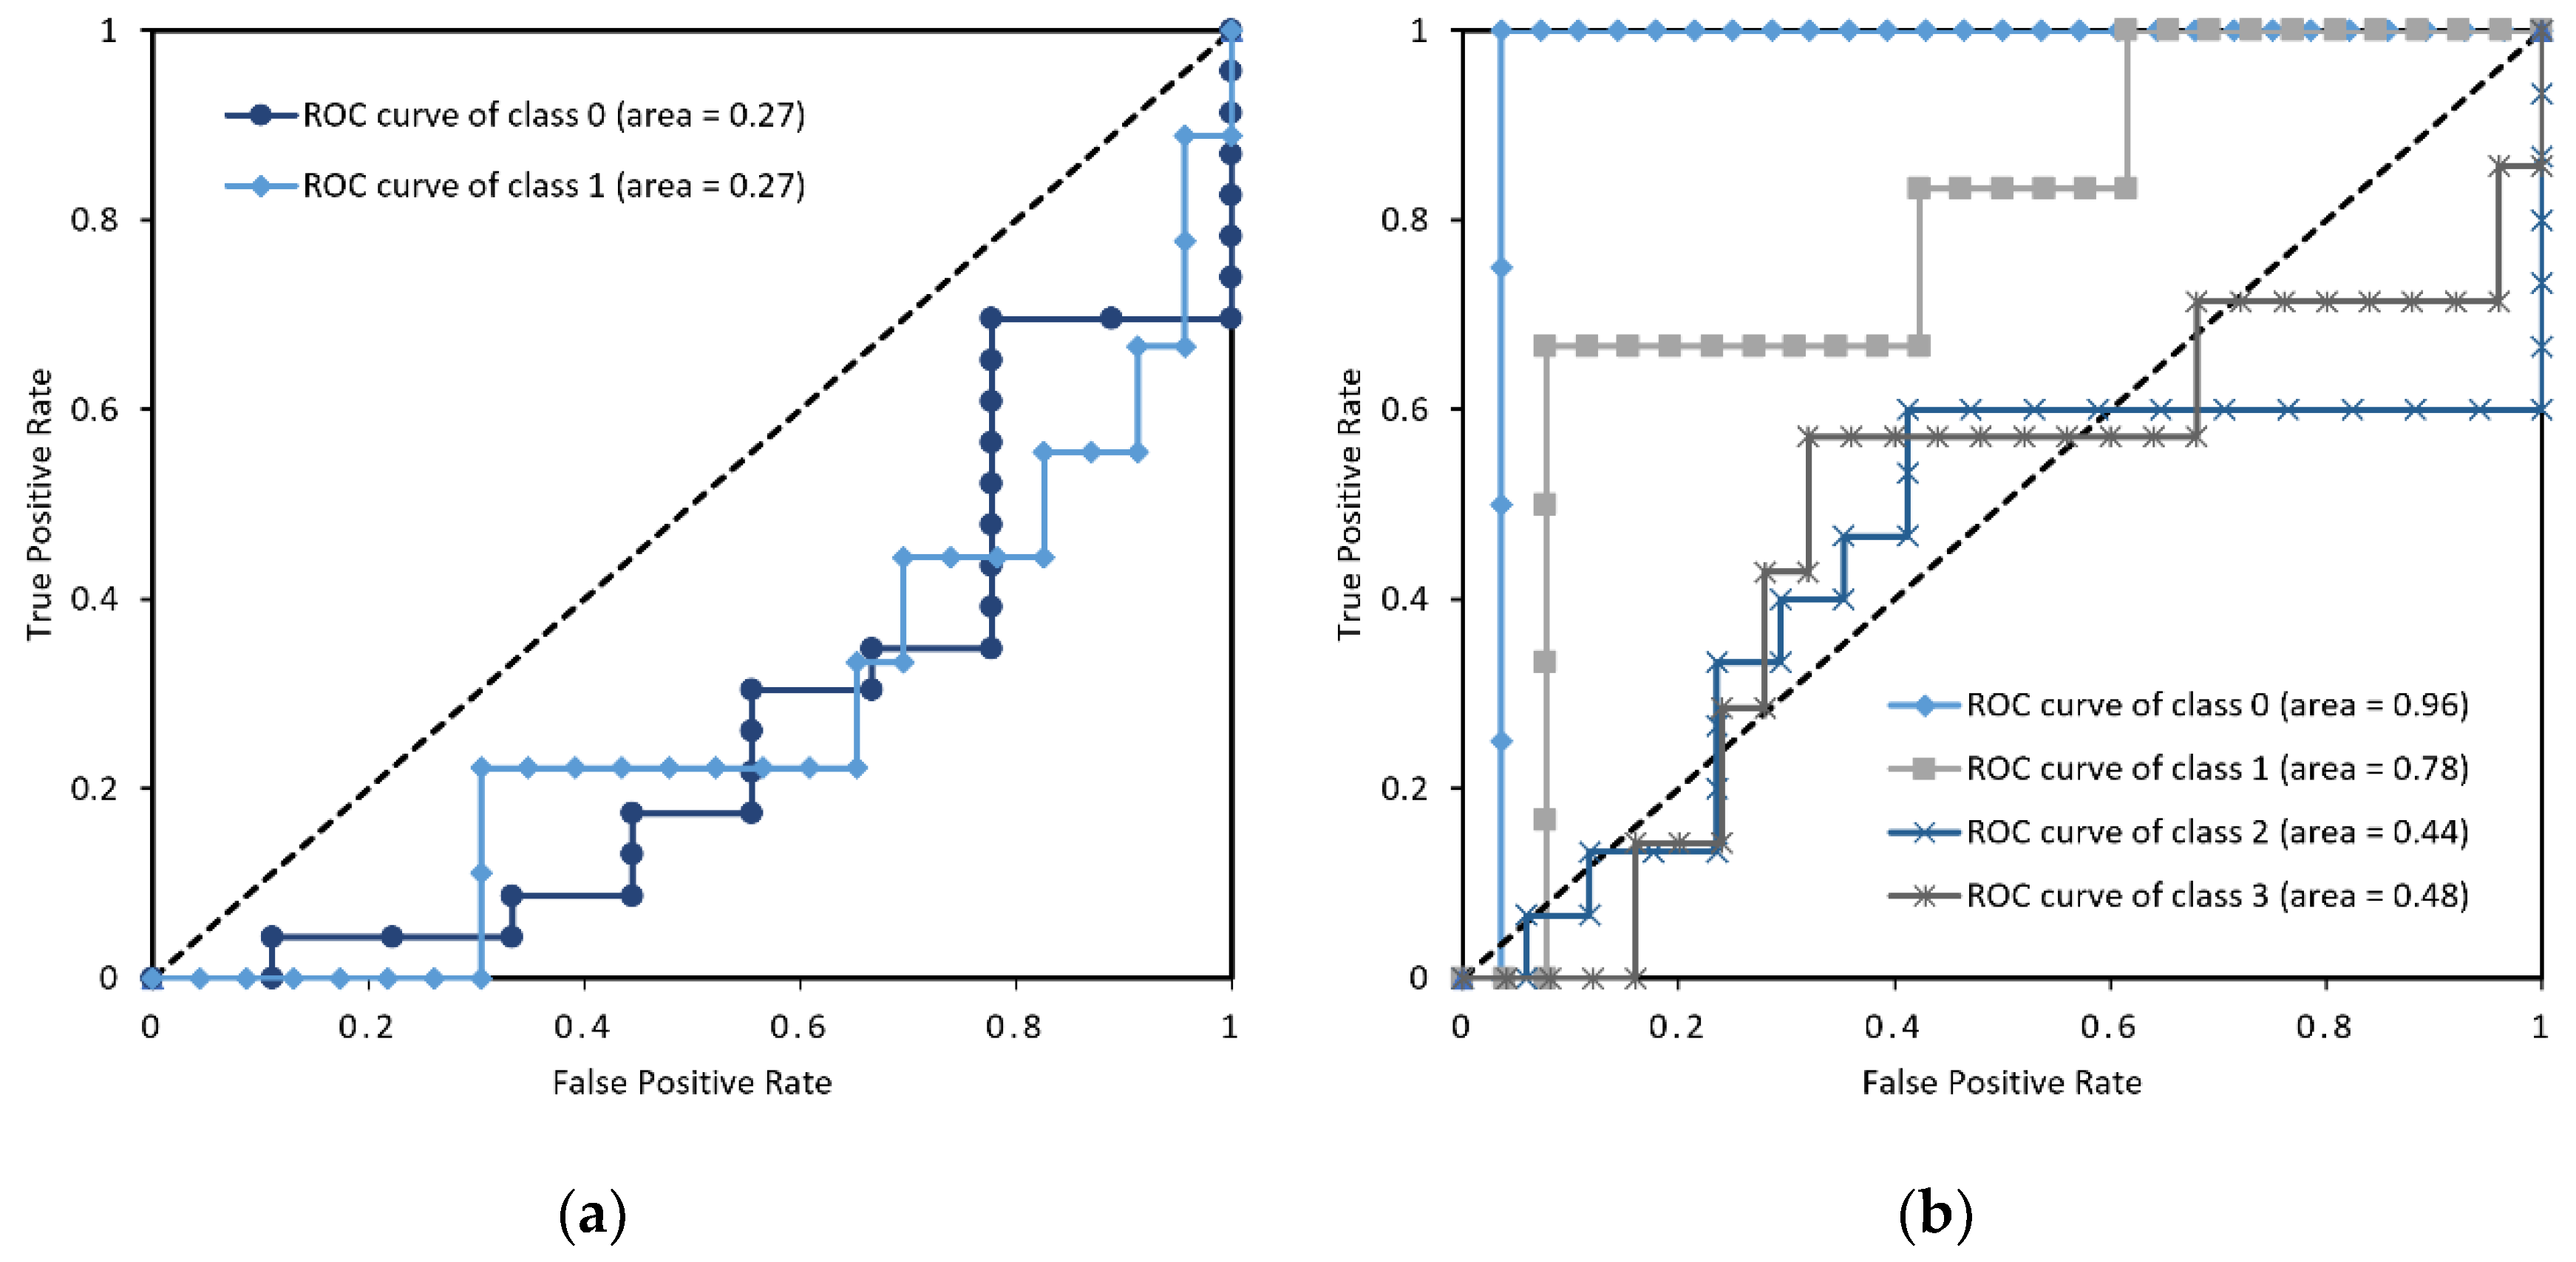
Regarding 4. No correlation was found between the correct labelling of disease and each explanatory variable. In addition, the prediction of the learning model was worse than random (class 0, 1; area = 0.27). There are three possible reasons for this.
First, the features do not adequately represent the characteristics of the disease.
Second, the parameters of the learning model are not optimal for discrimination.
Third, the learning model used for disease prediction is not a suitable method for disease prediction.
The first reason falls into the category of feature quantity engineering and could not be tackled in this study. We also think that it is necessary to reduce the dimensions of the features. This is because, as can be seen from
Table 3, for the rank correlation coefficient between each feature value and the objective variable, multicollinearity can be confirmed between many features. In this case, it is necessary to perform dimensionality reduction and feature selection. Specifically, there is a method called VIF (variance inflation factor) that excludes whichever variable has the lowest correlation coefficient and does not use the feature with multicollinearity as an explanatory variable. It is necessary to select features using an index for detecting multicollinearity between variables. We would like to address this point in our future work.
In addition, we were unable to express the periodic fluctuation characteristic of Parkinson’s disease. In addition to the periodic increase and decrease in amplitude, we were able to confirm the phenomenon of the temporary cessation of movement from the numerical data on Parkinson’s disease. As a future area of research, we believe that whether or not the shape features that appear in this time series can be reduced to feature values will be the key to disease discrimination.
Regarding the second reason for the poor prediction of the learning model, it must be noted that we could not optimize the parameters of the learning model in this study, and it cannot be said that the experiment was performed with the optimal learning model. Therefore, in future research, it will be necessary to optimize the parameters of the learning model and compare it with several methods (neural network, SVM (support vector machine), decision tree, etc.). Therefore, we believe that element 4 has not been achieved.
The third reason for the learning model’s poor outcome is that logistic regression, which is the classifier used in this experiment, is not suitable for disease prediction. As mentioned above, there is almost no correlation between the disease (objective variable) and each explanatory variable, and as the severity increases, the value of the explanatory variable increases as well (No proportional relationship). Logistic regression is a linear classification model that performs well when there is a proportional relationship between the objective function and the explanatory variables. To express objective variables and explanatory variables that cannot be expressed in a proportional relationship, it is necessary to select nonlinear classification models such as SVM, neural networks, and Naive Bayes. Therefore, we plan to use a linear classification model for severity prediction and a nonlinear model for disease prediction.
Regarding 5. In this study, the learning model was created using logistic regression. In addition, since the posterior probability can be output by inserting the SoftMax function in the output, we find that this element has been achieved.
Regarding 6. We acknowledge that our method did not achieve a high level of accuracy in distinguishing between Parkinson’s disease and essential tremor. One possible explanation for this failure is that the motor symptoms of Parkinson’s disease and essential tremor can be similar and, therefore, difficult to distinguish (even for expert doctors). Another possibility is that the limitations of our method, such as the manual extraction of hue and saturation and the potential impact of lighting conditions and camera positioning, may have contributed to the lower accuracy.
Specifically, it would be useful to evaluate the ability of expert doctors to distinguish between Parkinson’s disease and essential tremor based on the videos used in our study. However, we did not conduct such an analysis in our study. We will consider this idea in future research.
In this paper, we investigated whether two diseases can be distinguished by analyzing posture-related tremor features. However, our analysis did not reach a level of differentiation that could be applied clinically. In this study, depending on the interpretation of the degree of correctness, it was shown that the tremor quantification process was consistent with an actual qualitative evaluation, and the validity of the quantification method was verified. We suggest that changes over time in tremors, resting tremors, and tremors due to oral medication can be measured to quantitatively assess improvement in motor symptom severity.
On the other hand, deep learning has the potential to improve the accuracy of motor symptom detection by automatically memorizing complex patterns and relationships in large quantities of data. With deep learning, it is possible to train neural networks to recognize specific motor symptoms, such as tremor or bradykinesia, by feeding them a large dataset of labelled examples. By using deep learning techniques, it may be possible to overcome some of the limitations of traditional computer vision techniques, such as the need for manual feature extraction and the potential impact of lighting conditions and camera positioning. Deep learning can also improve the generalization of the system to new patients and conditions. Additionally, deep learning can potentially reduce the amount of data storage required for motor symptom detection by only storing the learned parameters of the neural network rather than the entire dataset. This attribute can be particularly useful for mobile applications and remote-monitoring systems wherein storage and bandwidth are limited.
However, deep learning also has its own limitations and challenges, such as the need for large quantities of labelled data and computational resources and potential issues regarding overfitting and interpretability. Nevertheless, it is an exciting area of research whose findings can be used to improve the accuracy and efficiency of motor symptom detection.
Not achieved in relation to 4. The learning model of this research does not produce accuracy sufficient for use at the practical level, and there is a need for improvement. As for the prospective addressal of these issues, we suggest the following:
Perform feature quantity engineering after time series extraction, and create optimal feature quantities for each objective variable;
Perform feature dimension reduction (feature selection) and select a classifier suitable for the objective variable;
Optimize classifiers’ hyperparameters;
Eliminate background condition constraints when extracting hand regions.
By addressing these issues in the above order, we would like to improve the accuracy of the classifier and develop a discrimination support system.

 ,
, 


