
Pixel-Level Fusion Approach with Vision Transformer for Early Detection of Alzheimer’s Disease


Center of Excellence Forest 4.0, Faculty of Informatics, Kaunas University of Technology, 44249 Kaunas, Lithuania
*
Author to whom correspondence should be addressed.
Electronics 2023, 12(5), 1218; https://doi.org/10.3390/electronics12051218
Submission received: 30 January 2023
/
Revised: 25 February 2023
/
Accepted: 27 February 2023
/
Published: 3 March 2023
Abstract
:Alzheimer’s disease (AD) has become a serious hazard to human health in recent years, and proper screening and diagnosis of AD remain a challenge. Multimodal neuroimaging input can help identify AD in the early mild cognitive impairment (EMCI) and late mild cognitive impairment (LMCI) stages from normal cognitive development using magnetic resonance imaging (MRI) and positron emission tomography (PET). MRI provides useful information on brain structural abnormalities, while PET data provide the difference between physiological and pathological changes in brain anatomy. The precision of diagnosing AD can increase when these data are combined. However, they are heterogeneous and appropriate, and an adequate number of features are required for AD classification. This paper proposed a multimodal fusion-based approach that uses a mathematical technique called discrete wavelet transform (DWT) to analyse the data, and the optimisation of this technique is achieved through transfer learning using a pre-trained neural network called VGG16. The final fused image is reconstructed using inverse discrete wavelet transform (IDWT). The fused images are classified using a pre-trained vision transformer. The evaluation of the benchmark Alzheimer’s disease neuroimaging initiative (ADNI) dataset shows an accuracy of 81.25% for AD/EMCI and AD/LMCI in MRI test data, as well as 93.75% for AD/EMCI and AD/LMCI in PET test data. The proposed model performed better than existing studies when tested on PET data with an accuracy of 93.75%.
1. Introduction
1.1. Background
Alzheimer’s disease (AD) is a chronic neurodegenerative disease that gradually destroys brain cells, resulting in memory and thinking skill loss, as well as the eventual loss of the ability to perform even the most fundamental duties. Patients with AD gradually develop dementia and lose physiological functions, eventually leading to death [1]. Around 55 million people worldwide have dementia, and more than 60% of them live in low- and middle-income countries [2]. This figure is expected to rise to 78 million in 2030 and 139 million in 2050, as the share of older people in the population increases in practically every country.
The pathophysiology of AD is still very complex to understand. Mild cognitive impairment (MCI) is an early stage of AD that occurs as a transition between normal aging and AD [3]. However, a mild cognitive impairment that will convert to AD may begin 20 years or more before any symptoms of AD appears. The phases of EMCI, MCI, and LMCI are when the condition has progressed to the point where it is impairing daily activities. Although AD cannot be cured, it can be slowed down in its early stages. As a result, early identification of AD is extremely desirable to improve patient quality of life and treatment trial outcomes.
Neuroimaging diagnosis has become the most intuitive and reliable way to diagnose AD due to the rapid advancement of neuroimaging technologies [4]. Several neuroimaging modalities, including structural magnetic resonance imaging (sMRI) [5,6,7], functional magnetic resonance imaging (fMRI) [8,9,10], fluorodeoxyglucose positron emission tomography (FDG-PET) imaging [11,12], and diffusion tensor imaging (DTI) [13] have been used successfully for an early and accurate diagnosis of AD. To evaluate the progression and phases of patients with MCI, some existing research has used a single modality successfully. For the classification between EMCI and cognitive normal (CN), using sMRI, the cortical, subcortical, and hippocampus subfields were found to be the most discriminating areas of the brain for AD [14,15,16,17]. Unfortunately, the scanned image is occasionally of poor quality due to focusing errors and noise. As a result, a quality evaluation method is required for practical use [18].
For fMRI, some features, such as occipital-mid-region, precentral-left, caudate-region, postcentral-left, and temporal-pole-mid-left are highlighted in the discrimination of EMCI and NC [19,20,21]. As for FDG- PET, the average relative cerebral glucose metabolic rate in the precuneus, superior temporal gyrus in both hemispheres, middle frontal gyrus and superior frontal gyrus, middle cingulate cortex, and the angular gyrus in the left hemisphere were examined [22,23]. Because single-modal neuroimaging only offers some and not all information about brain disorders, it may be insufficient for the classification of cognitively normal (CN), EMCI, LMCI, and AD people. Deep learning models could be generalized well and provide increased classification accuracy with the use of multi-modal neuro-imaging inputs. The alterations in brain structure can be seen in structural MRI scans of Alzheimer’s patients. PET is a type of functional imaging that can capture the functioning aspects of the brain to improve the ability to detect lesions. The combination of MRI and PET is a useful multi-modal neuro-imaging input that can provide more precise data for clinical diagnosis and treatment.
1.2. Deep Learning Methods for AD Recognition and Classification
Most common models in deep learning that have been tested to have good performance in biomedical image segmentation [24,25], medical diagnosis, and image classification [26,27,28] tasks are convolution neural network (CNNs). CNN has greatly been used in the classification of AD [29,30]. For example, Venugopalan et al. [31] presented multimodality intermediate feature level combinations by extracting intermediate features using a deep learning model, and the resulting features are concatenated and passed through a classification layer. However, the direct feature concatenation was not trained end-to-end, thereby not being integrated with the classification step. Sarraf and Tofighi [32]) fused sMRI and fMRI data to classify AD using LeNet-5 architecture and GoogleNet architecture. Their method was able to achieve a higher accuracy, but not on MCI stages. Abdelaziz et al. [33] utilized three stacked CNN models to extract meaningful features from PET, MRI, and genetic data. Extracted high-level features were sequentially concatenated together for AD multiclass classification. The proposed method provided missing features for each incomplete sample using linear interpolation to make the most of the dataset’s available samples and alleviated data heterogeneity from multimodal data. However, the classification accuracy for MCI stages was low. Jin et al. [34] proposed a hybrid three-stage deep learning framework to classify EMCI and LMCI with incomplete multimodal datasets in which the classification network was pre-trained via MRI and PET images. The multimodal data were fused, and the difference between fused data and those of real MRI and PET data were compared to help the classifier focus on regions for classification for better classification accuracy.
Although CNN has proven itself well in the above methods, it has always faced several challenges in AD classification. The CNN model has generalisation and overfitting problems in binary and multiclass classification [35]. The model can only achieve good diagnostic results under large and sufficient data, and the model must be deep enough to extract meaningful information. Forouzannezhad et al. [36] utilized a deep learning model to detect AD in its early stage using multimodal imaging, combining magnetic resonance imaging (MRI), positron emission tomography (PET), and standard neuropsychological test scores with a classification accuracy of 90.3% for binary classification of AD/EMCI. Forouzannezhad et al. [37] further utilized a probabilistic approach to fuse relevant features from MRI and PET for early detection of AD with 81.4% in EMCI/AD binary classification. Aqeel et al. [38] used long short-term memory (LSTM) to predict biomarkers (feature vectors) of AD patients after 6, 12, 21, 18, 24, and 36 months of MRI biomarkers from MRI and neuropsychological measurements (NM). These anticipated biomarkers are passed through layers of a fully coupled neural network (NN). The NN layers then determine whether these biomarkers generated by the LSTM belong to AD patients or MCI patients. The methodology was tested in the ADNI dataset, and an accuracy of 88.24% was achieved.
Several studies used vision transformer (ViT) for the classification of AD, and it has offered a lot of advantages in terms of robustness, efficiency, generalization, and transfer learning compared to CNN. ViTs are more data-efficient than CNNs, which means they can perform well even in relatively small amounts of data. A key advantage of ViTs is their ability to perform well on tasks where there is limited data available for training. This is because ViTs use self-attention mechanisms instead of convolutions, which allows them to process the entire image at once, rather than in smaller patches. To verify the effectiveness of ViT on multimodal data of neuroimaging data, several studies attempted and experimentally showed that ViT can achieve the same or even better performance than CNN. Sarraf et al. [39] utilised an optimised end-to-end pipeline vision transformer to classify AD stages using rs-fMRI and sMRI data. The proposed model classified AD stages with less complex architectures with relatively small amounts of data. Fused PET images, consisting of PET-AV45 and PET-FDG, were trained on ViT for the classification of AD stages [40]. The proposed model achieved a result comparable to CNN models. Kushol et al. [41] took advantage of the information from both the spatial and frequency domain of MRI images and proposed a fusion transformer model to fuse the function and structural information of MRI images. Experimental results showed that the fused information improved the classification accuracy of AD. Pan and Wang [42] proposed a cross-modal transformer to achieve a deep fusion of structural and functional information from fMRI and DTI images. The authors concluded that the proposed model could extract complementary information from fMRI and DTI, resulting in a higher precision of multimodal connectivity in the classification of AD than other multimodal fusion techniques [43].
1.3. Contribution, Novelty, and Research Questions
Although the fusion technique in the aforementioned studies is limited to DWT with ViT, transfer learning can easily be applied to the DWT neuroimaging fusion technique to provide optimisation that allows improved performance of fused images. To this end, this study proposed the AD diagnosis method using a pre-trained ViT model to extract and classify features from fused images from MRI and PET for early detection of AD. The fused image is achieved by harnessing wavelet decomposition and transfer learning using VGG16.
The proposed model consists of the following four modules:
- 1.
- Discrete wavelet decomposition module to generate one approximate coefficient and three detail coefficients of MRI and PET image;
- 2.
- VGG16 module to generate approximate image and three detail coefficients, which represent low frequency sub-band and high frequency, respectively;
- 3.
- Inverse wavelet transform module to generate fused images on the four bands generated;
- 4.
- Pre-trained ViT module that is used to extract and classify features (structural and functional) from fused image.
To guide our research, we formulate the following research questions:
- 1.
- How can MRI and PET data be effectively combined for the early detection of Alzheimer’s disease?
- 2.
- Can a ViT model be trained on the fused data for improved accuracy in the classification of Alzheimer’s disease stages (AD/EMCI and AD/LMCI)?
- 3.
- How does the proposed multimodal fusion approach compare with existing methods for the classification of Alzheimer’s disease stages?
- 4.
- Can the proposed ViT model generalise to new unseen data from the ADNI database for the classification of Alzheimer’s disease stages?
- 5.
- What are the limitations and potential improvements of the proposed multimodal fusion approach and the use of ViT for medical imaging data analysis?
The novelty of the paper lies in the proposed multimodal fusion approach based on fine-tuned vision transformer (ViT) for binary classification of AD stages using MRI and PET data. The approach involves fusing MRI and PET images with adequate preprocessing and image registration, as well as training a ViT model with the fused data to achieve high accuracy rates in identifying AD. This model outperforms existing multimodal models in generalizing well on PET data. The use of a ViT model to analyze medical imaging data is a novel approach in the field of AD research.
The main contributions of this study include:
- An image fusion technique has been proposed to fuse multimodal images for AD diagnosis, providing accurate diagnosis of AD to health professionals.
- Complementary information from MRI and PET images is incorporated using wavelet transform and transfer learning.
- Frequency and location information from MRI and PET images were captured.
- The proposed model is optimised using transfer learning, which improves the performance of the proposed model.
2. Methods
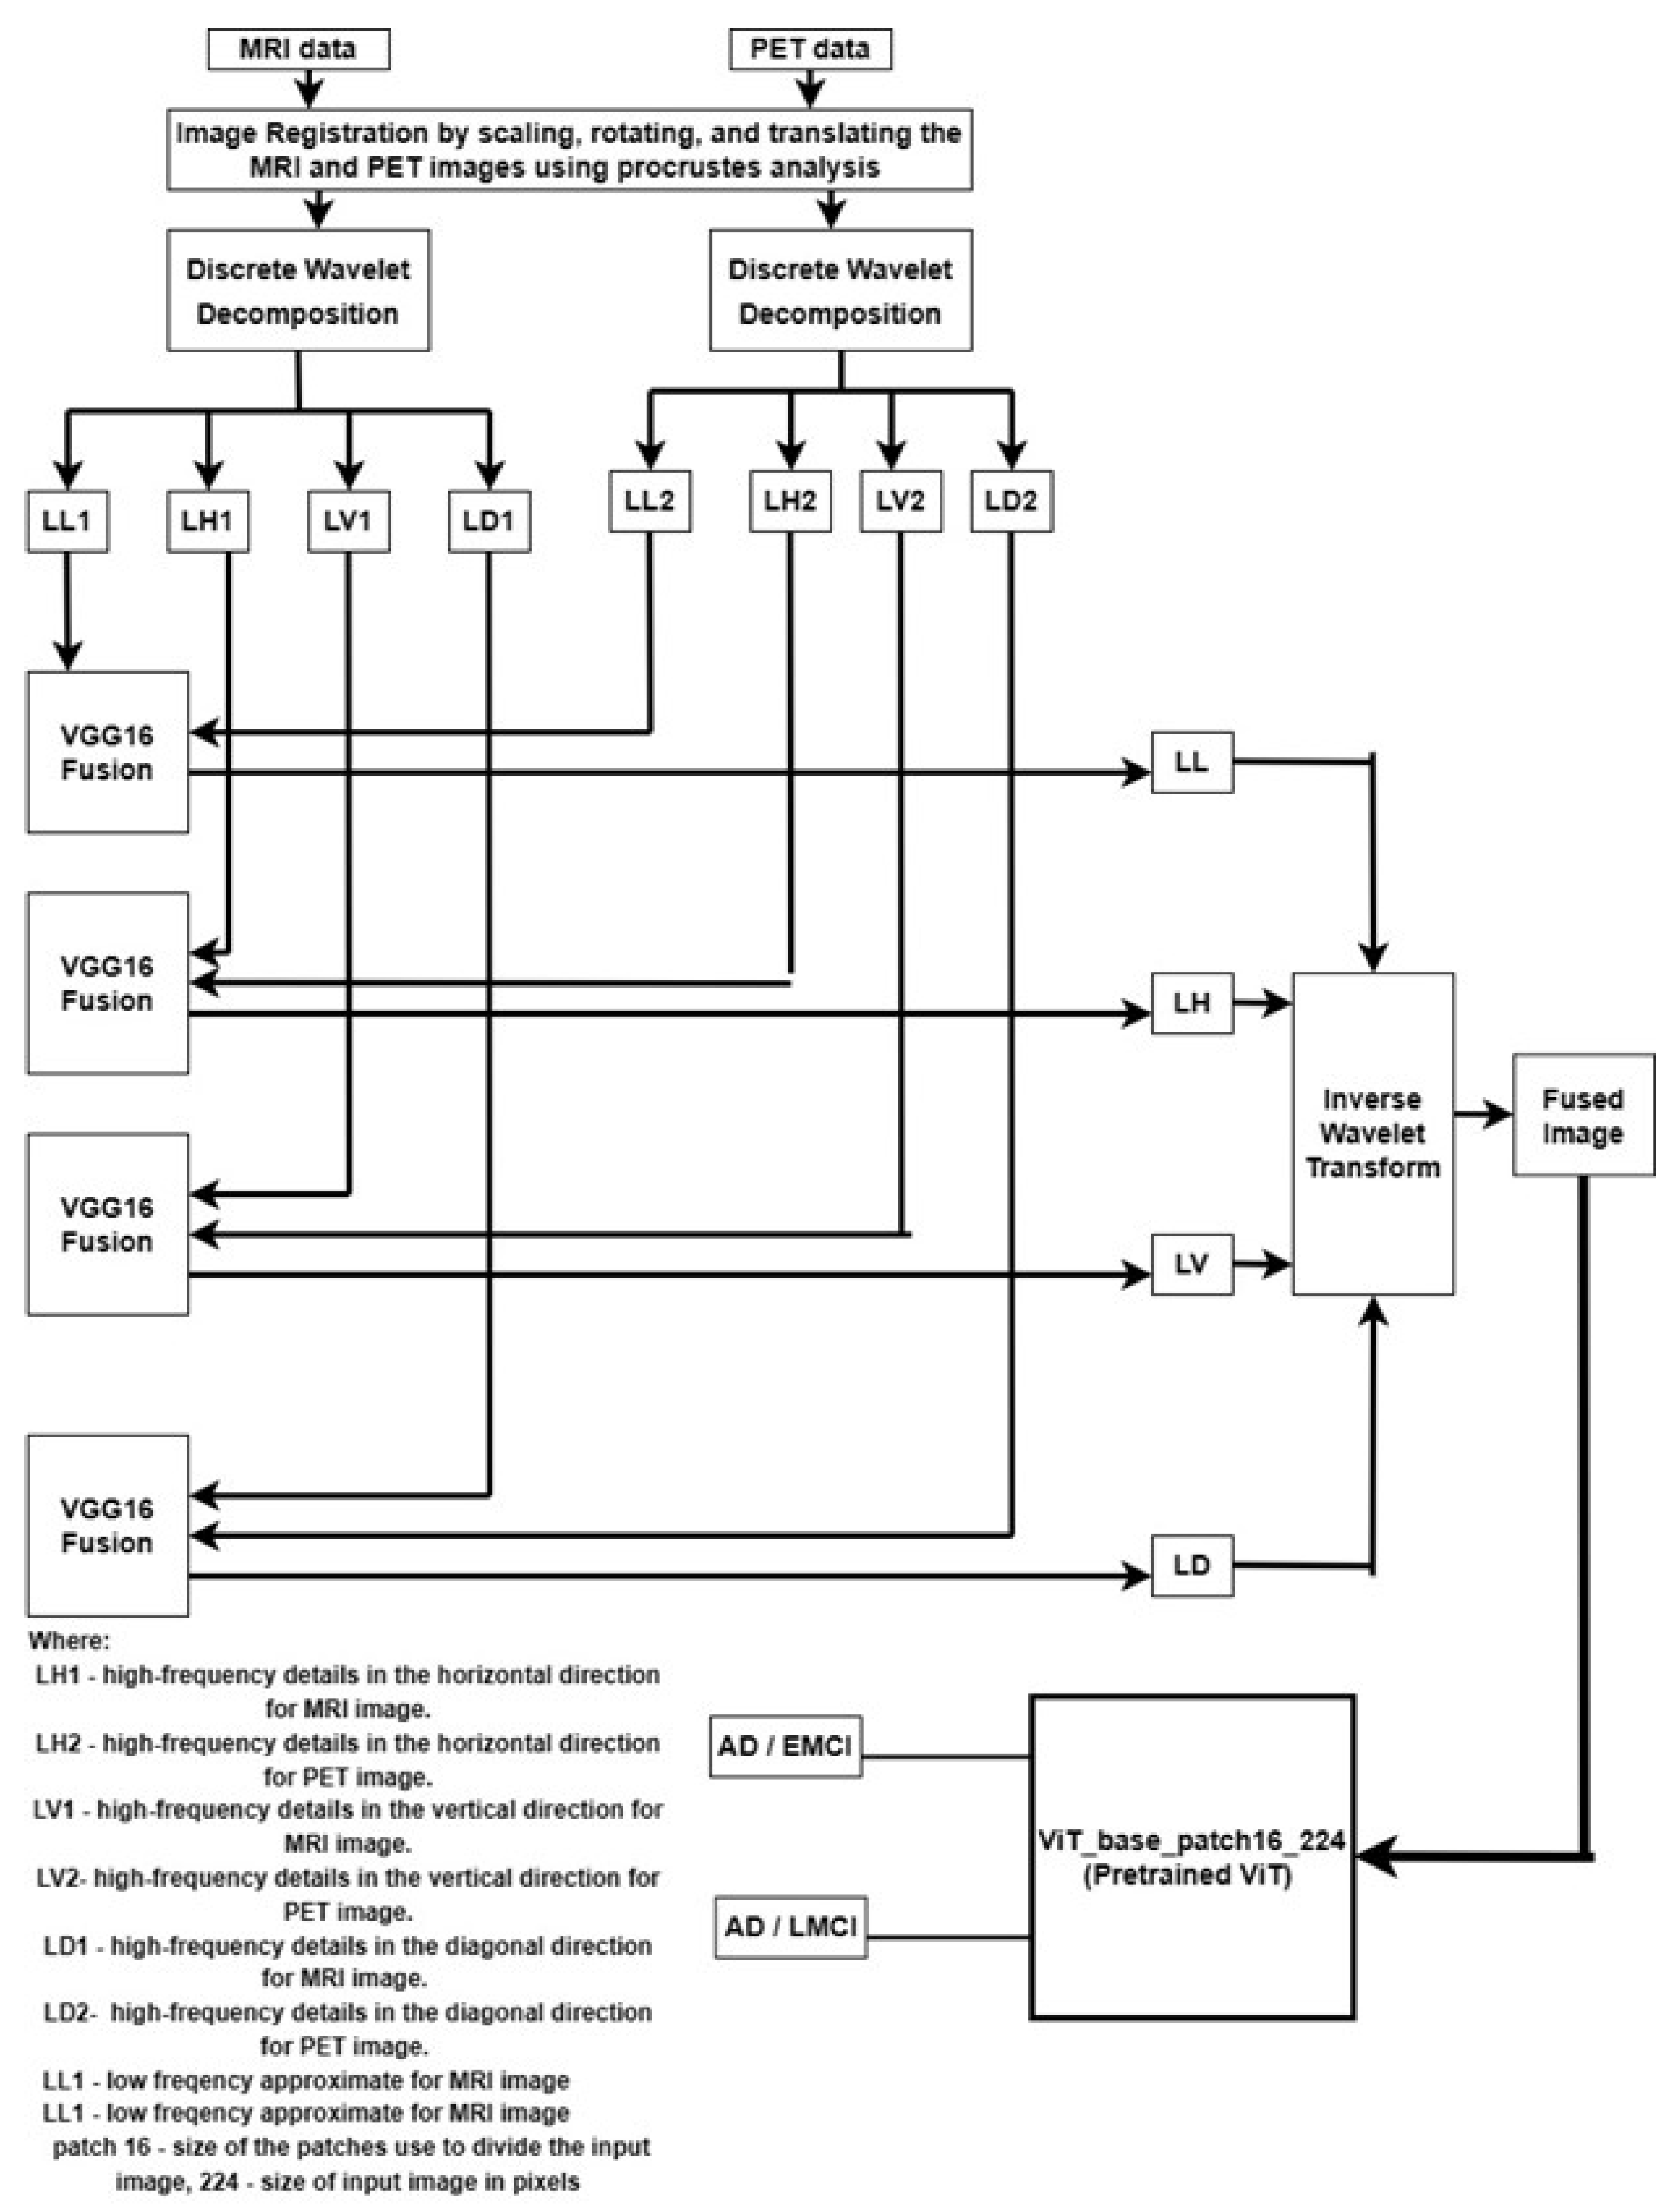
The proposed architecture for pixel level fusion multimodal vision transformer with transfer learning is represented in Figure 1.
2.1. Dataset
For experimental analysis, the image datasets of sMRI and FDG-PET images are used, and this is publicly available in the Alzheimer’s Disease Neuroimaging (ADNI) database. The sMRI and FDG-PET are both in grayscale and NIFTI format. Participants are selected from the ADNI2 baseline cohort for our experimental requirement. The age of the subjects ranges from 60 to 70 years old, including both males and females. Approximately 50 early EMCI and 50 LMCI participants were selected. T1-weighted volumes and 18F-FDG-PET images are taken for each participant for the study. The mini-mental state examination score(MMSE) of 16 and 26 with a Clinical Dement Rating (CDR) of 0.5 was set for selecting AD, and MMSE of 25 and 28 with a CDR of 0 was set for selecting EMCI participants.
2.2. Preprocessing
Before MRI and PET images can be successfully analyzed, they need to typically undergo some preprocessing steps to correct for various distortions and artifacts that can affect the quality of the images. Noise reduction and image registration of images are some of the preprocessing steps considered in this study. Noise reduction is applied to reduce the impact of noise on the images. MRI and PET consist of different information, therefore coregistration of both MRI and PET images is very important for optimal fusion.
2.3. Image Registration
Image registration can be used to align the functional information provided by PET with structural information provided by MRI. In this study, procrustes analysis [44], which is a statistical method, is used to align MRI and PET. This is achieved by scaling, rotating, and translating the images until they are optimally aligned. The procrustes analysis on MRI and PET is performed by initially indentifying the corresponding points in the two images. The identified points could be landmarks or features that are present in MRI and PET images. The transformation that aligns the two sets of points is done using singular value decomposition (SVD). The transformation is applied on a MRI image to align with a PET image, then the two images are aligned in a common coordinate system. The following is the mathematical formula for procrustes analysis for MRI and PET utilizing SVD:
where X and Y is the matrix representing MRI data, and PET data respectively, and are the singular vectors of the left for the MRI data and PET data, respectively. is the singular value matrix for MRI data, and is the singular value matrix for PET data. and are the right singular vectors for MRI and PET data, respectively.
The procrustes analysis is performed by finding the optimal rotation and scaling factors to align matrix X and matrix Y using equations
where R is the rotation matrix, P and Q are the scaling matrix, and T is the overall transformation matrix. The transformation matrix is finally applied to the MRI data to align it with the PET data using Equation (6).
2.4. Noise Reduction
Noise is introduced into MRI and PET images during the imaging process, resulting in a blurry appearance of the images. The presence of noise in the images can lead to inaccurate interpretation of the images, which could lead to incorrect diagnoses or treatment decisions. Reduction of noise from the images makes the images clearer and more detailed, thereby allowing for more accurate interpretation. Anisotropic diffusion filtering is used to reduce the noise fluctuations of the image [45], but it causes blurring of edges, and this could lead to loss of fine detail and accuracy in the image.
Therefore, we use the wavelet transform that overcomes this challenge by decomposing the image into different frequency bands. Wavelet transform has enabled a new field that utilizes a DWT equation to eliminate noise from an input image [46]. DWT highlights important features and eliminates noise. It works by decomposing an image into a series of small wavelets with localized functions that are used to represent different frequency components of the image. DWT divides the picture into four subbands (subimages), namely, LL, LH, LV, and LD, as follows: in its low frequency subband, LL is the approximate image of the input image; the LH subband extracts the horizontal features of the original image; the LV subband delivers vertical features; and the LD subband gives diagonal information.
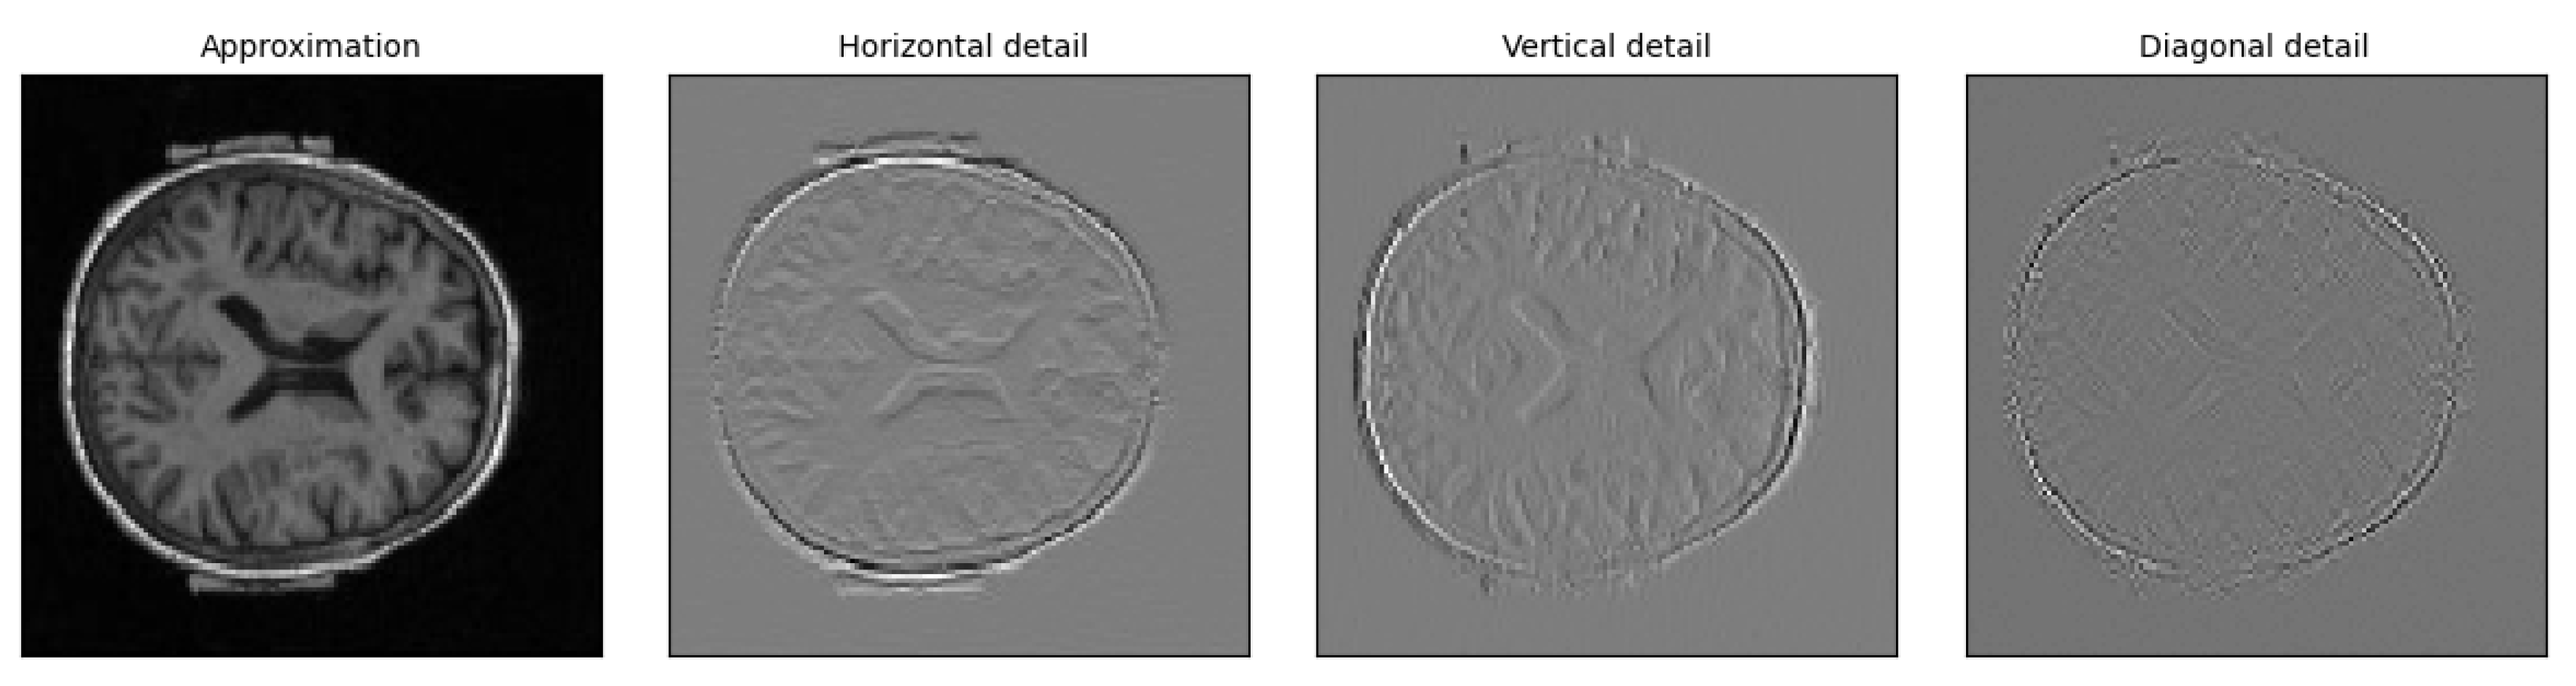
The result of the wavelet decomposition is a series of approximate coefficients for MRI and PET, known as LL1 and LL2, respectively, as depicted in Figure 1, three detail coefficients for MRI, known as LH1 (horizontal), LV1 (vertical), and LD1 (diagonal), as shown in Figure 1, and three detail coefficients for PET, known as LH2 (horizontal), LV2 (vertical), and LD2 (diagonal), as depicted in Figure 1. The horizontal, vertical, and diagonal detail coefficients represent the image features in different directions. In Figure 1, LL1 and LL2 are the approximation coefficients, which represent the low-frequency, coarse features of MRI and PET image, respectively, and provide a rough approximation of the original image. The three detail coefficients represent the high-frequency, fine features, which provide important information about the image, such as the presence of sharp edges or sudden changes. Thresholding is used to identify and eliminate coefficients that are due to noise [47], where coefficients below a certain threshold are set to zero, thereby effectively removing the noise from the image. Figure 2 showed the low-frequency and the three detail coefficients for EMCI class from MRI image.
The mathematical equation is replaced by the following:
where represents the discrete wavelet transform of the image, , represents the coefficients of the wavelet transform, and represents the wavelet basis function.
Equation (1) decomposed the images into various frequency subbands. Using a thresholding technique, the estimated noise is then eliminated from the subband; values below a given threshold are regarded as noise and eliminated. The following equation is used to achieve this:
where is the denoised image, is the threshold value, and and are the same as in Equation (7).
2.5. Multimodal Fusion
The goal of this image fusion is to combine data from PET and MRI scans. Fusion-based transfer learning is used because it allows for the transfer of knowledge from one frequency band to another. Transfer learning can learn from multiple sources (different frequency bands) and adapt to new situations. In this study, the VGG16 network is utilised to extract features from the four pairs of images from MRI and PET ( LL1 and LL2), (LH1 and LH2), (LV1 and LV2), and ( LD1 and LD2), as shown in Figure 1. For each pair of features, the VGG16 network is used to interpolate the features and generate a new band. For instance, for the pair of LL1 and LL2 using the layers of the VGG16 network to interpolate the features, the resulting output is the LL band. Similarly, for the pair of LH1 and LH2, LV1 and LV2, and LD1 and LD2, using the layers of VGG16 to interpolate their characteristics, the resulting output is LH, LV, and LD, respectively. LL, LH, LV, and LD represent the fused features of MRI and PET. To obtain the final fused image, an inverse discrete wavelet transform ( IDWT) is applied to each of the merged coefficients ( LL, LH, LV, and LD) and combines the results to form the final fused image. The IDWT uses a set of wavelet coefficients to reconstruct the final fused image that combines the strength of both modalities.
Mathematically, the IDWT equation is replaced by the following:
where are the wavelet coefficients obtained through the DWT. is the inverse wavelet function corresponding to the level i of the DWT. are the wavelet coefficients obtained by merging the coefficients of the MRI and PET images. is the final fused image obtained through the IDWT.
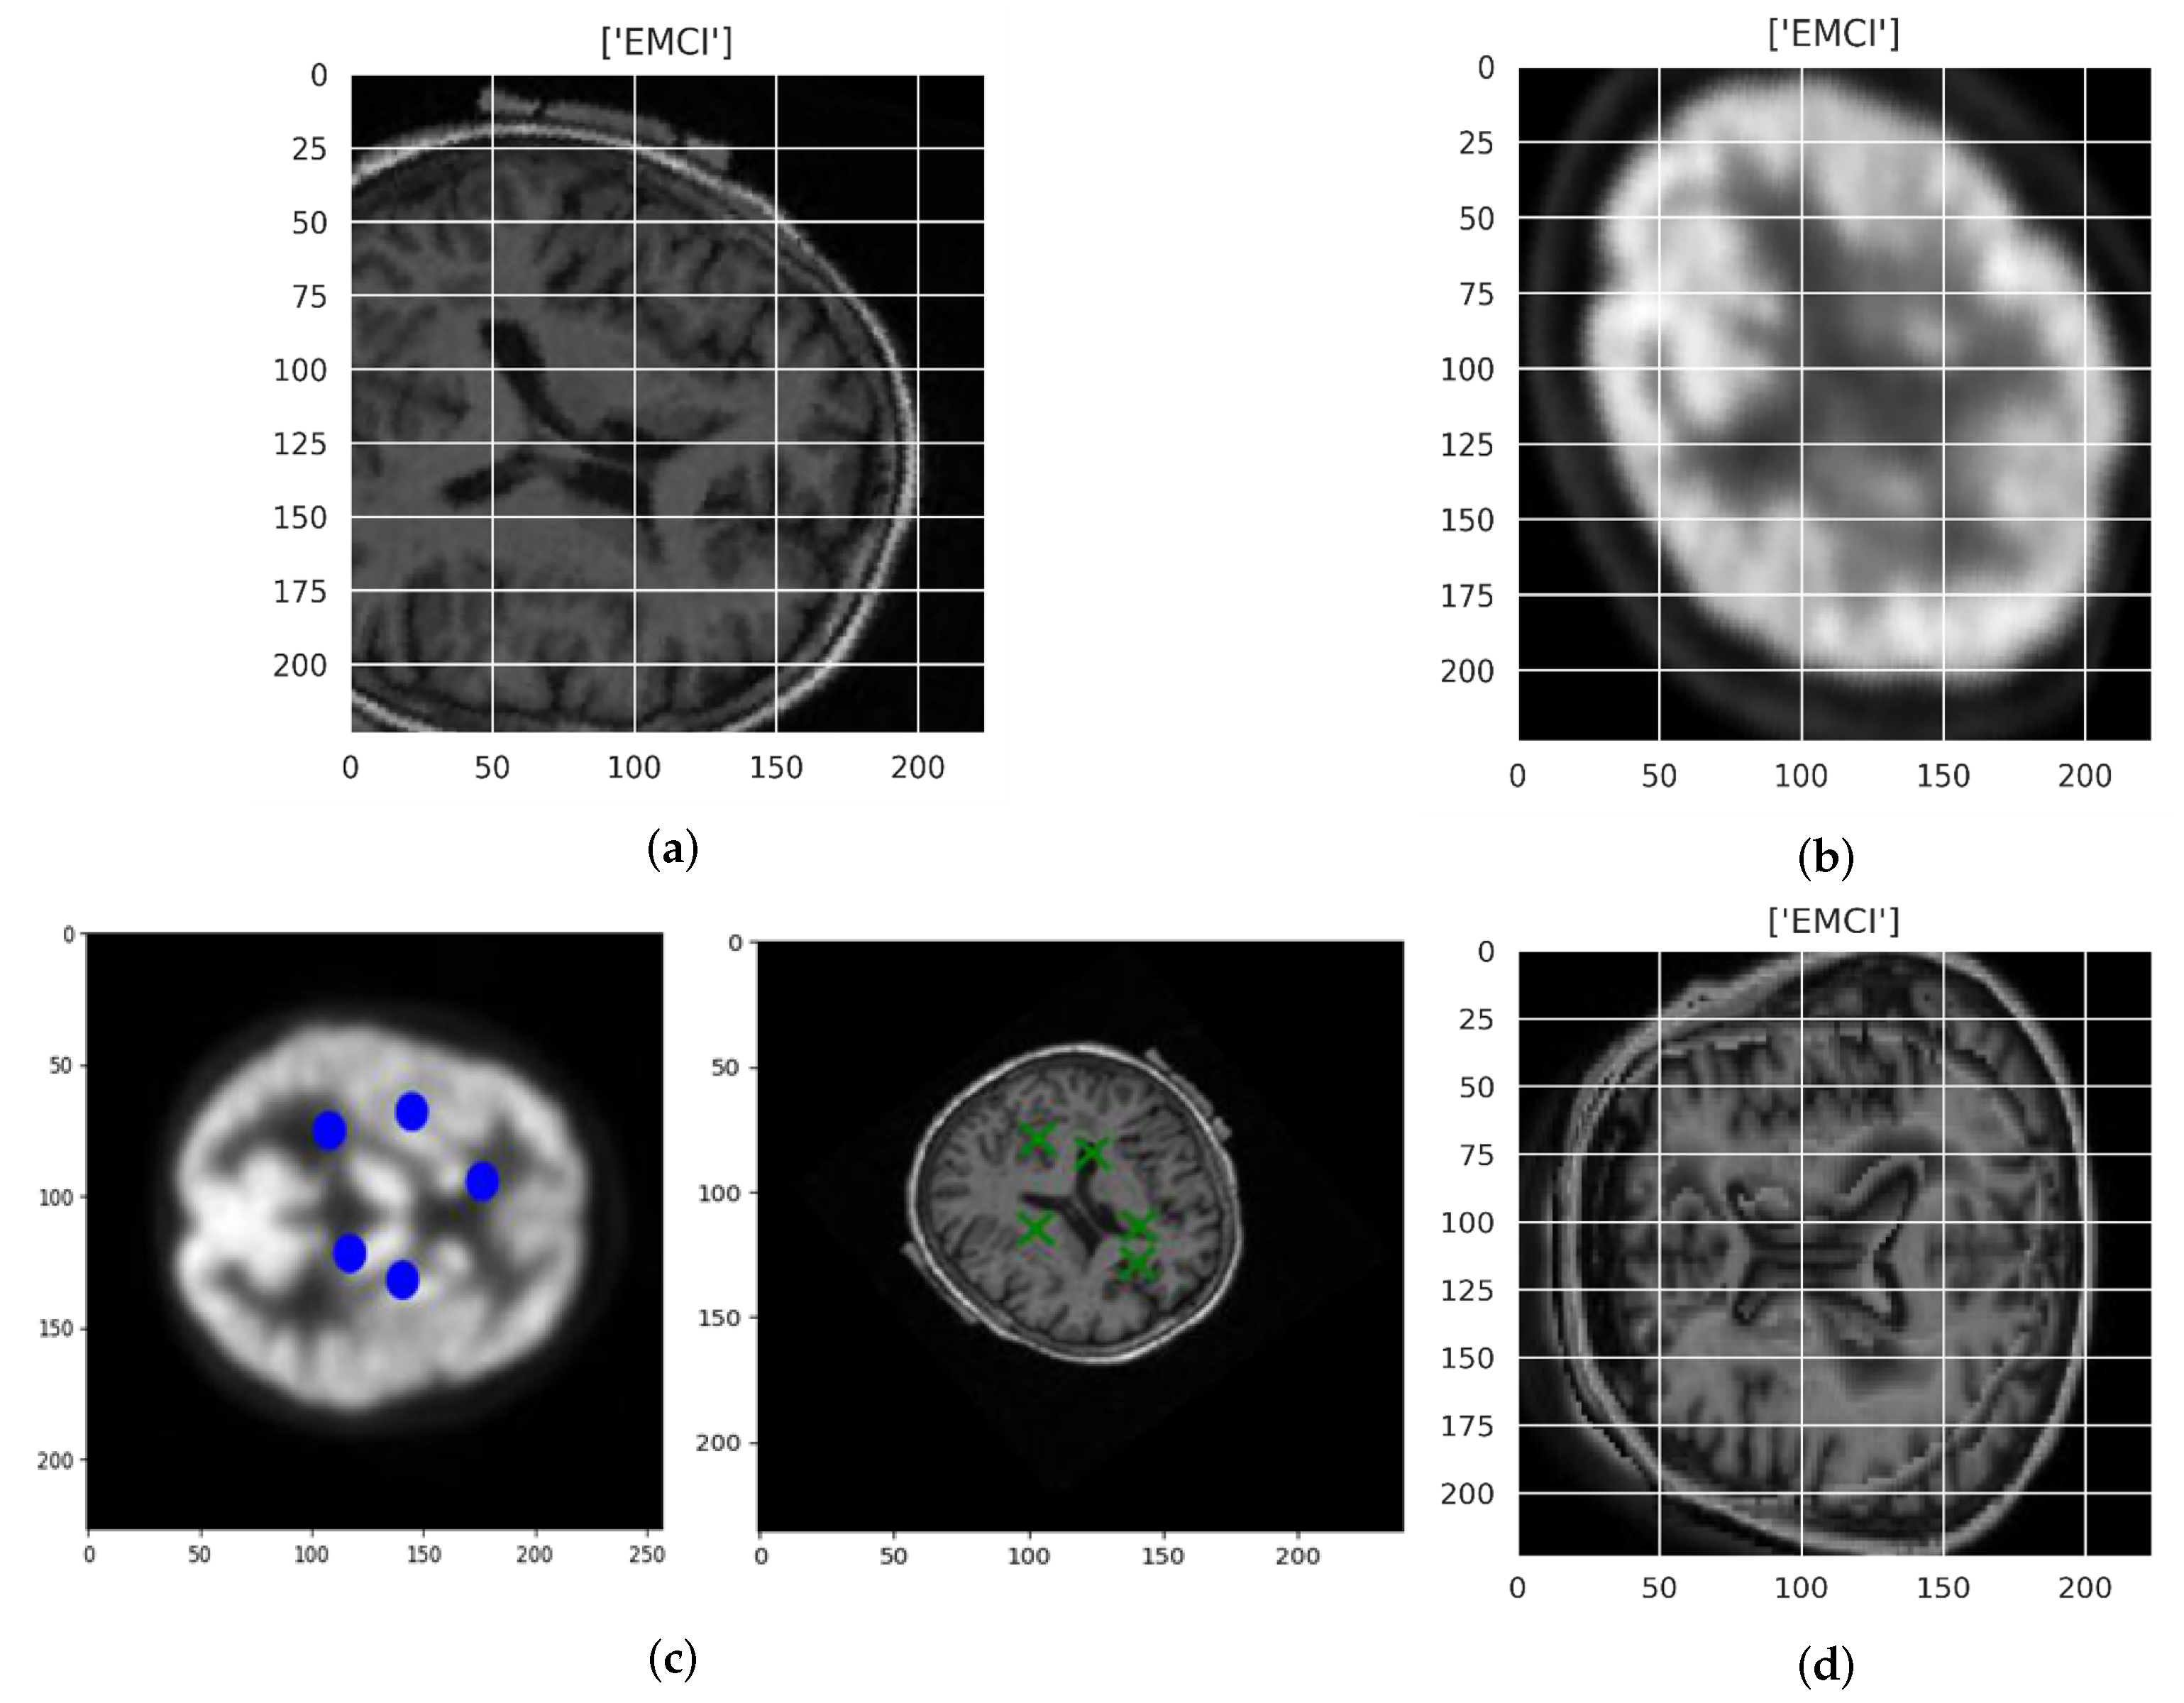
Figure 3a,b shows original image MRI of EMCI participants and PET of EMCI participants respectively. Figure 3c shows PET registered image (left) and MRI registered image (right), while Figure 3d shows the fused image. Eventclick was used to identify the point of alignments for PET and MRI images. After identifying the points at which the two images will be aligned, the images are transformed. The approximation and details are shown in Figure 2. Methods of siaseme are called on LL, LH, LD, and LV images. The trained network (VGG16) fuses two new input images by passing them through the network and concatenating their feature representations as the final fused image.
2.6. ViT Architecture
The vision transformer architecture consists of a series of self-attention layers, similar to those found in the transformer architecture. Each self-attention layer processes the input data in parallel, allowing the network to learn long-range dependencies in the data without the need for recurrence. The self-attention layers are followed by a series of feed-forward layers that perform further processing on the output of the self-attention layers. One of the key innovations of the vision transformer architecture is the use of multi-headed self-attention, which allows the network to attend to multiple different parts of the input data simultaneously [48]. This helps the network to learn more complex relationships in the data and improve its performance on tasks, such as image classification. In addition to the self-attention layers and feed-forward layers, the vision transformer architecture also includes several other components, such as a spatial transformer module, which allows the network to learn spatial relationships in the data, and a learnable pooling module, which helps to reduce the dimensionality of the input data [49]. We expect that from the fused images, the ViT models would be able to extract discriminative features related to AD and thereby make a classification decision. is a medium-sized vision transformer that processes input images by dividing them into a grid of 16 × 16 patches used in this study, with each patch being 16 × 16 pixels in size. The model is designed to take square images with a height and width of 224 pixels as input.
In the proposed approach, we utilized the Timm [50] repository to fine-tune a pre-trained ViT model. Timm is a library for efficient image classification with PyTorch, which allows for the fine-tuning of pre-trained models with minimal code. By training a ViT from scratch, two problems arise: high computational requirements and the need for large amounts of data. High computational requirements problems occur when there is absence of access to high performance computing infrastructure. Lack of access to a large dataset may lead to overfitting and inaccurate results. Fine-tuning a pre-trained ViT model on a specific task can be used to counter these problems, thereby significantly improving the performance of the ViT model [51]. Fine-tuned ViT classifies features by using a combination of self-attention and convolutional layers. Fine-tuning a ViT model involves adjusting the model’s weights and biases to better fit the specific features and characteristics of the dataset being used. This can be done through a process called back propagation, which involves adjusting the weights and biases to minimize the error between the model’s predictions and the true labels of the data [49]. By fine-tuning the model in this way, it can learn to better classify the features that are relevant to the specific task it is being used for.
The mathematical equation for the back propagation process is as follows:
here; : the update to the weight, : the learning rate, : the error gradient at the output layer, x: the input to the weight.
The decision function of the pre-trained ViT model on fused image of MRI and PET images can be expressed mathematically as:
where F = set of fused images, C = Target classes, = Predicted class for fused image, = Trained Model, = Specific fused image in the set F.
3. Experiments and Results
3.1. Experiments
The proposed model implementation and evaluation is performed using pytorch. The model is trained and validated using a NVIDIA Corporation TU116 (GeForce GTX 1660) graphic processing unit machine. Experiments were performed using five-fold cross-validation since the fused MRI and PET data are relatively small. The AdamW optimiser with an initial learning of 0.002, as well as a regularisation technique using weight decay of 0.01, is utilised in gradient descent. The AdamW optimizer is a modified version of Adam that integrates weight decay into its update algorithm. By introducing a penalty term in the loss function that encourages smaller weights, this regularization technique aids in preventing overfitting. The initial learning rate of 0.002 is a common starting point for training deep neural networks, as it is typically small enough to prevent the model from diverging during the early stages of training, but large enough to allow for relatively rapid convergence to a good solution. Through empirical experimentation and following best practices, a weight decay value of 0.01 was selected. The batch size is set to 10 when conducting batch training on NVIDIA GTX 1660 because smaller batch size can lead to faster convergence and better generalization. A learning rate scheduler is introduced to adjust the learning rate of the model during training to reduce overfitting. Optimisation of the learning rate is done using a cyclic learning rate, where the learning rate is not fixed, but oscillates between maximum and minimum value. The minimum rate is set to 0.002, and the maximum rate is set to 0.01. The cyclic learning rate is implemented using the triangular cycle learning rate schedule, where the learning rate increases linearly from a low value (0.002) to a high value (0.01) over a certain number of iterations (1000) and then decreases linearly back to the low value over the same number of iterations (1000). We increase the number of epochs from 10 to 30. Early stopping was further applied to the model during the training process, and this made the proposed model stop earlier than the number of epochs (30). At other epochs (10, 20), early stopping did not hold. Increasing the number of epochs to exceed 30 was shown not be of any advantage since the model did not complete the 30 epochs because of overfitting.
The fused image from MRI and PET utilized for our proposed multimodal model combines the high spatial resolution of MRI with the functional information provided by PET. Original MRI image and original PET image for both classes are compared with the fused image using structural similarity (SSIM), which incorporate luminance, contrast, and structure components. The luminance component measures the brightness of the images, the contrast component measures the difference in intensity between the darkest and lightest pixels, and the structure component measures the similarity of patterns in the images. To calculate SSIM, we utilized the structural_similarity library, including components of the Python library such as skimage. To ensure that the fused image accurately represents the underlying data in detecting Alzheimer’s disease using fused images of MRI and PET, it is crucial to consider similarity scores based on luminance, contrast, and structural components. By selecting similarity scores based on these components, the fused image can more accurately capture the differences and similarities between the MRI and PET images. This can make it easier to identify any abnormalities that could indicate Alzheimer’s disease. The precision of the similarity scores can have a significant impact on the sensitivity and specificity of AD stages classification.
To assess how well our model performs in classifying the stages of AD using fused images, we have two sets of experiments: AD vs EMCI, AD vs EMCI, and our set-up. To evaluate the performance of the proposed multimodal model on the new MRI and PET datasets of ADNI database participants, accuracy, sensitivity, specificity and confusion matrix are used. To further assess the performance of the ViT model, we trained the pre-trained Resnet18 using our fused images.
3.2. Result
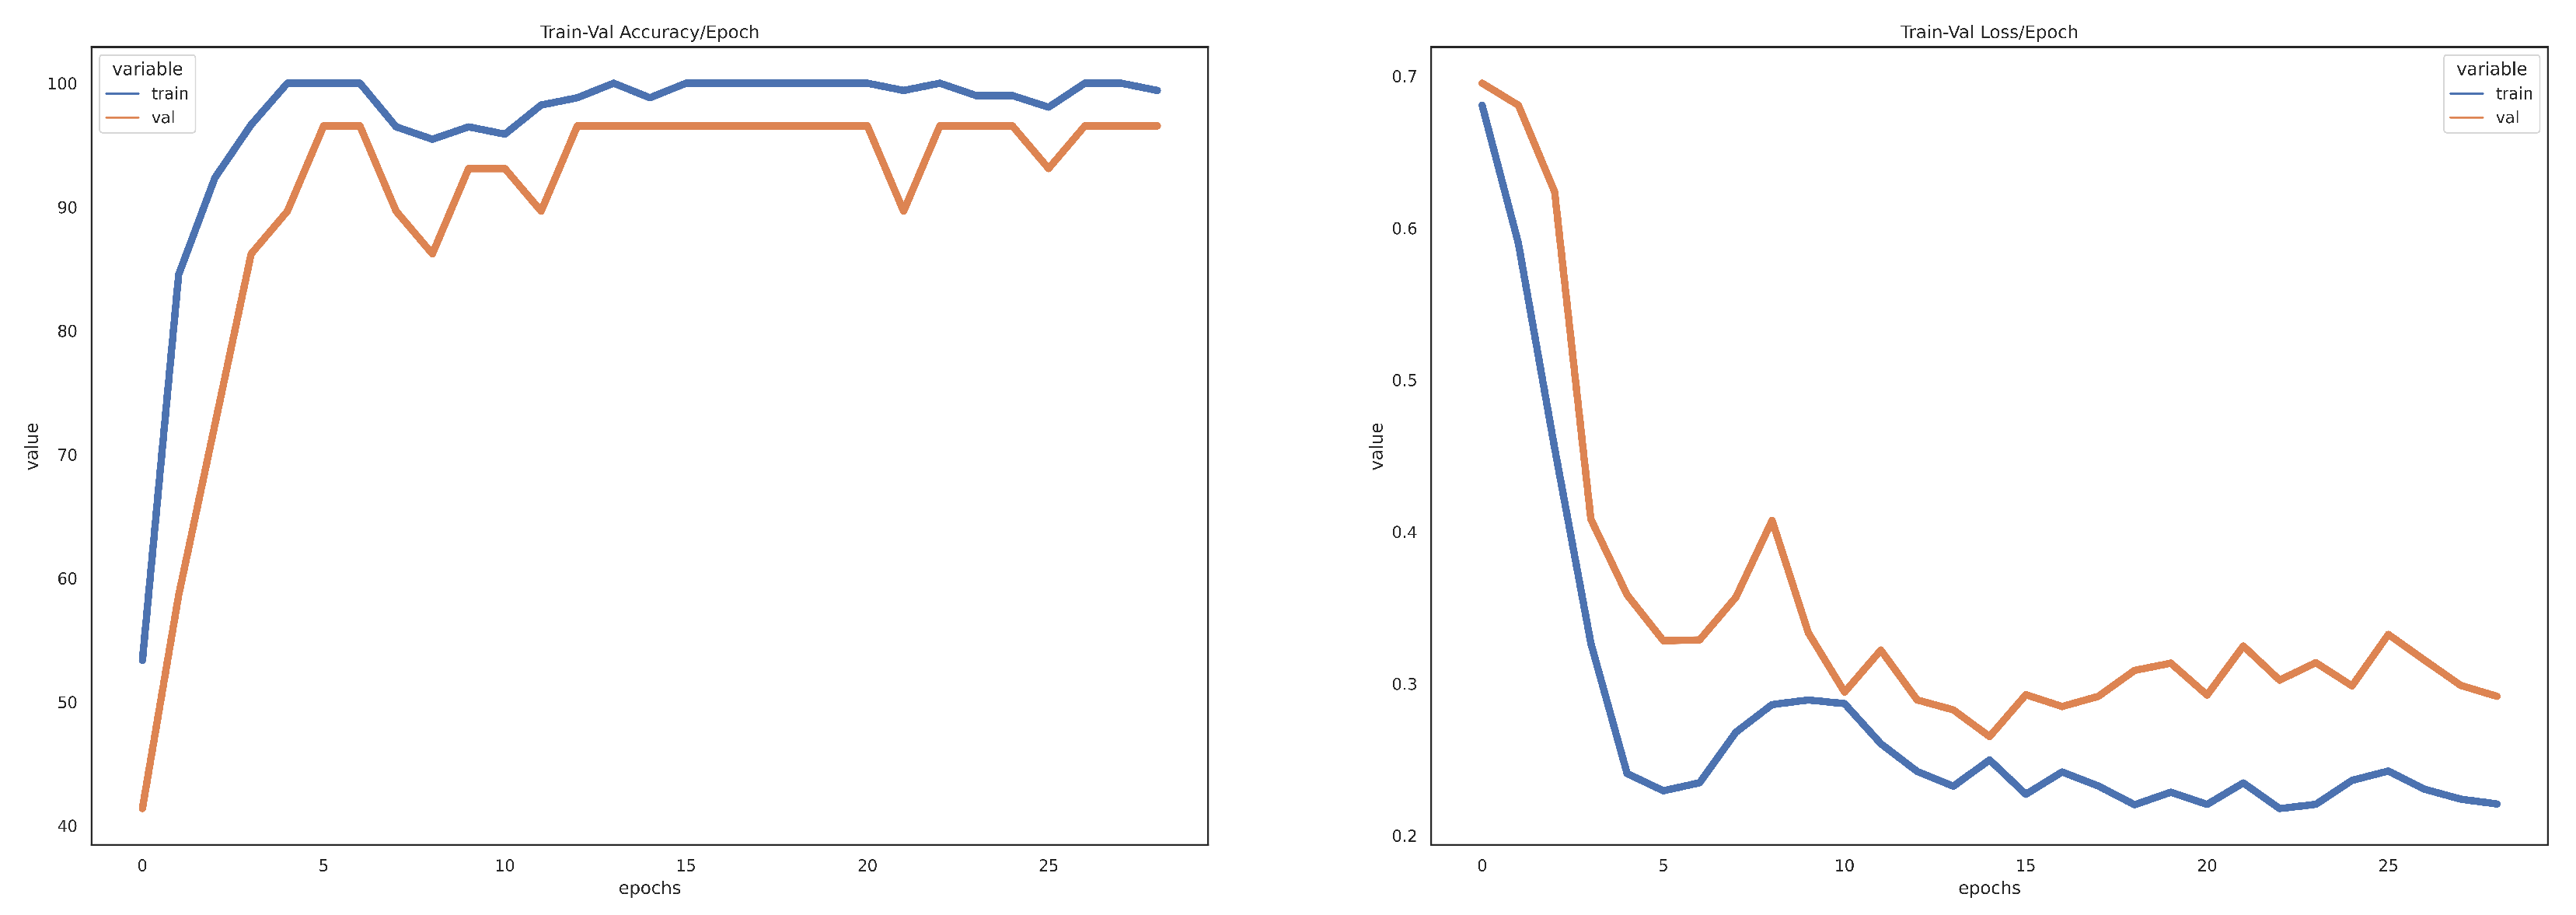
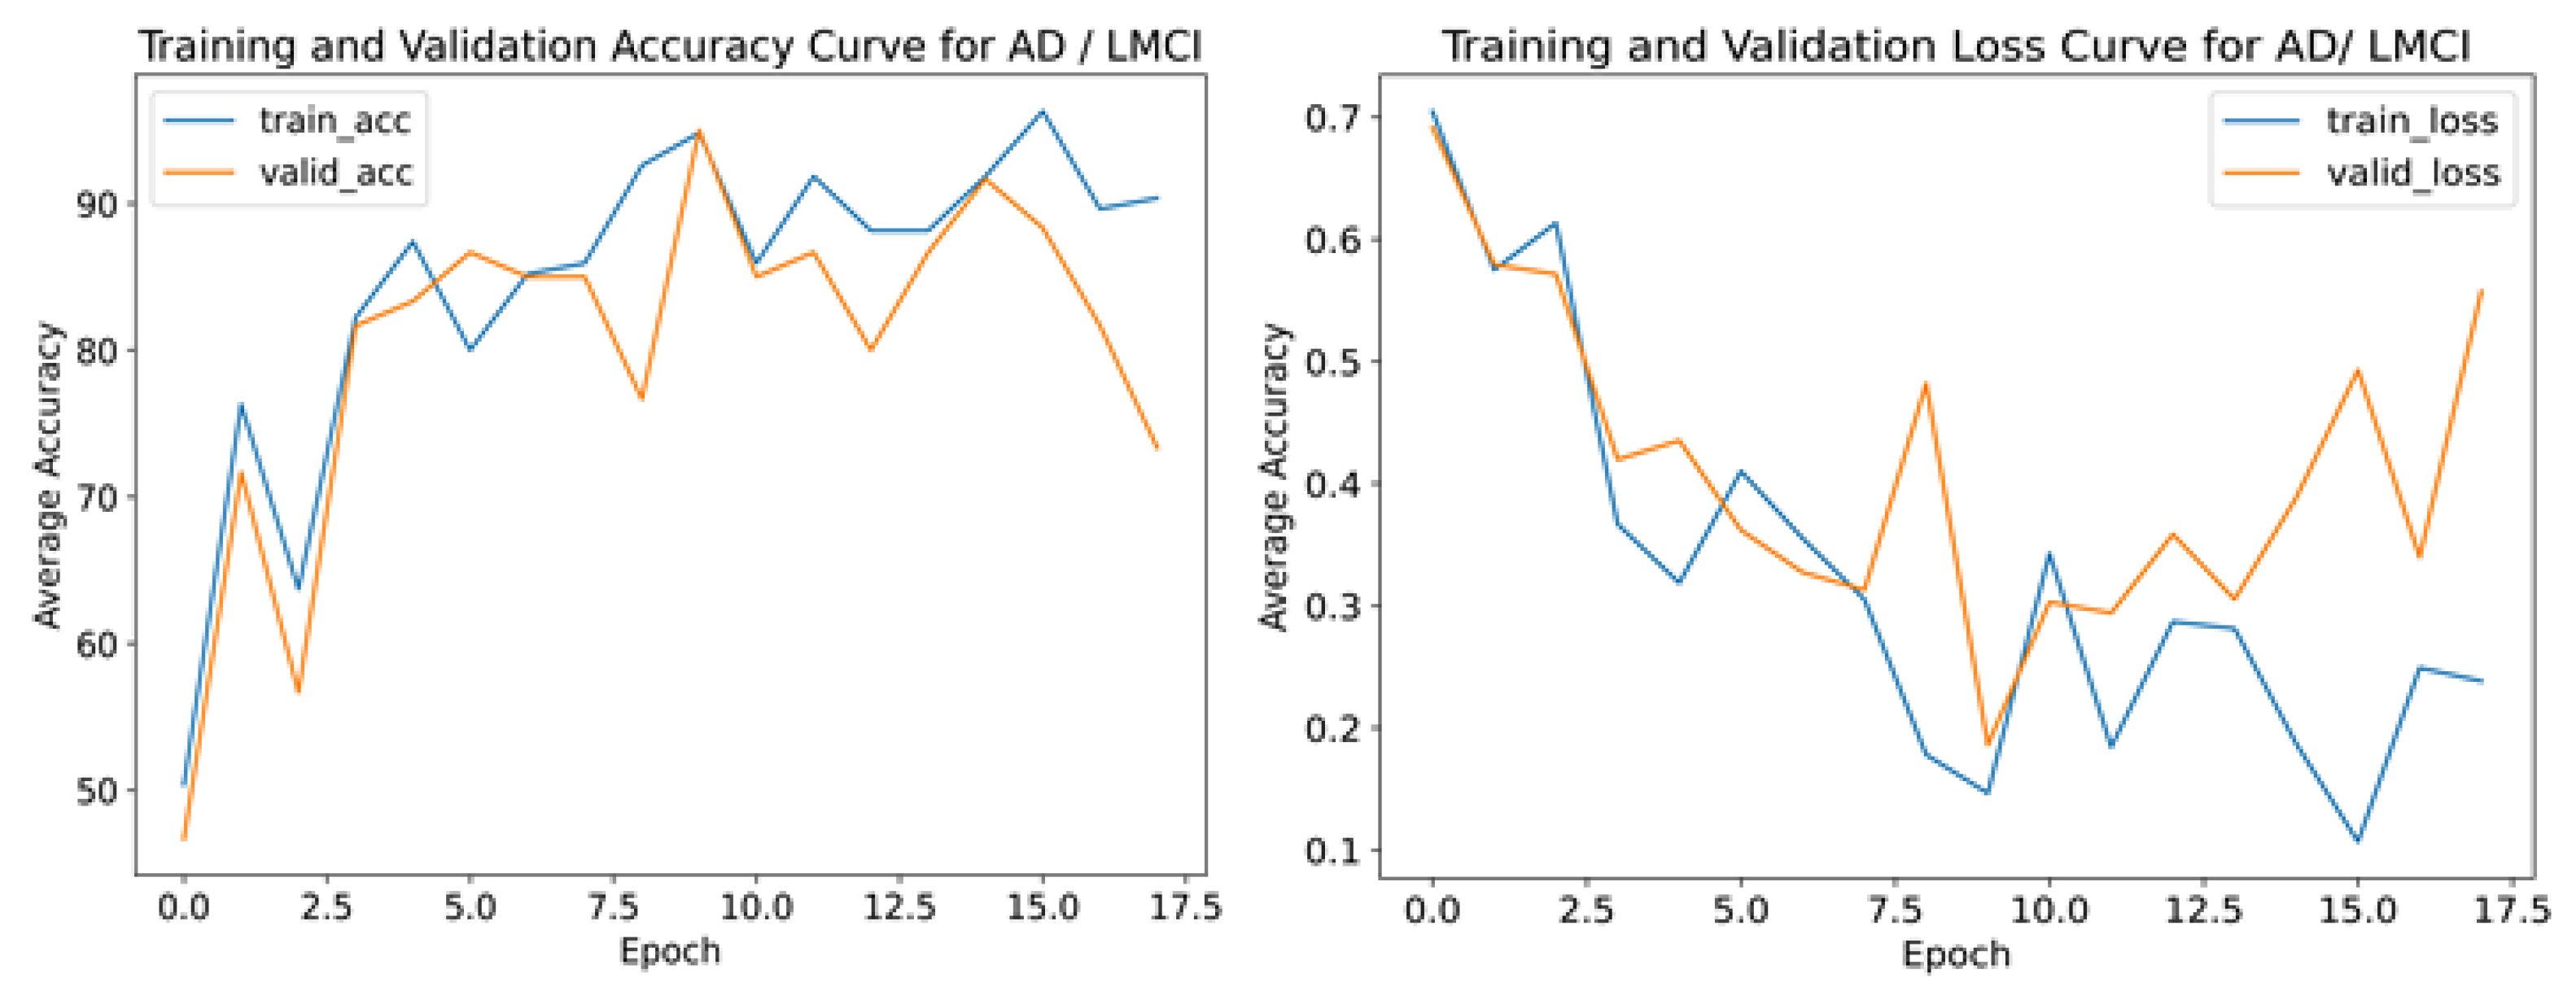
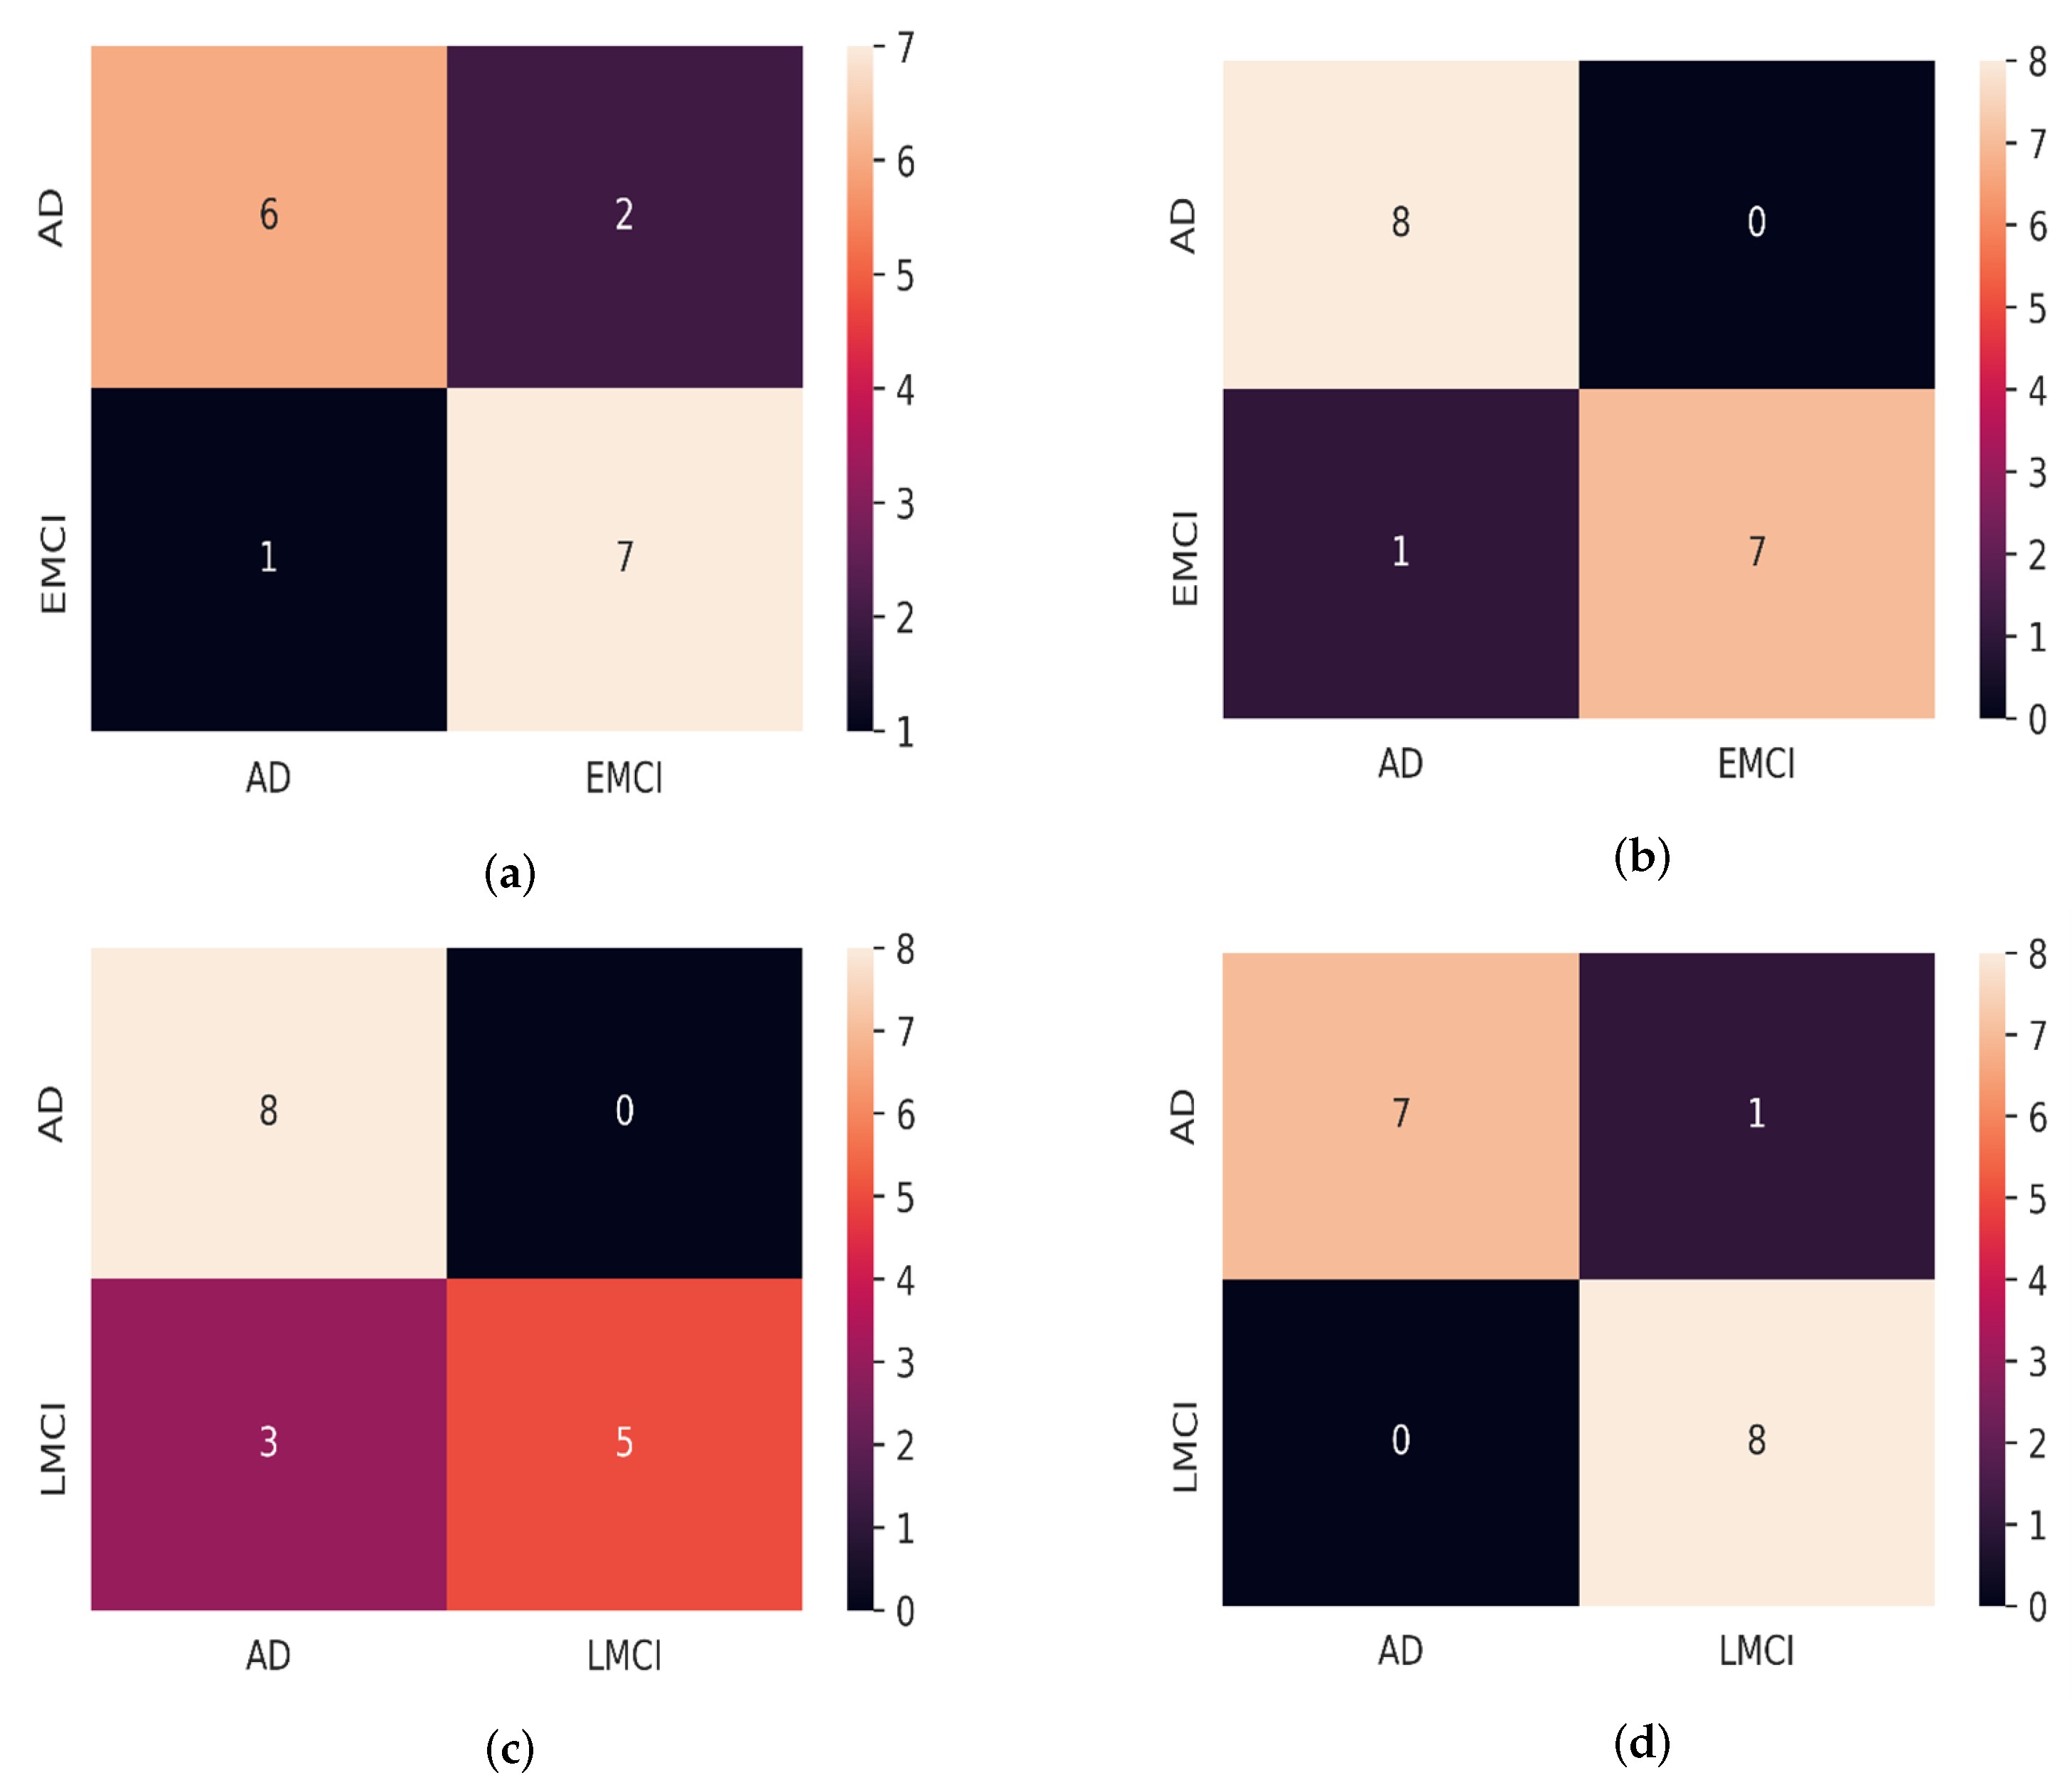
Table 1 showed the outcome of the structural similarity measurement of the original MRI, original PET, and fused image of AD, EMCI, and LMCI participants. As shown in Table 2, the model proposed for the validation accuracy results and the CNN model for the AD/EMCI classification, as well as the AD/LMCI classification, according to the validation set, are 98.50%, 98.59%, 94.03%, and 95.00%, respectively. The training/validation loss curve and the accuracy curve for AD/LMCI classification for our proposed model and CNN model is shown in Figure 4 and Figure 5, respectively. The results of our proposed method on multimodal data from MRI and PET image are obviously better than the proposed model on single modal data for all experiments. Our proposed model was evaluated on the dataset of new participants from the ADNI database, and the result is depicted in Table 3. The predictive analytics of our proposed model for AD/EMCI ( MRI test data), AD/EMCI ( PET test data), AD/LMCI (MRI test data), and AD/LMCI ( PET test data) is presented using a confusion matrix, as shown in Figure 6.
From Table 1, the structural similarity of original MRI, original PET, and fused image gave a score of above 0.750 in all the experiments.A performance analysis of SIMM using different imaging fusion techniques was carried out, and the result analysis shows the lowest score of 0.69 and the highest score of 0.97 for the MRI dataset among nine different experiments [52]. Information in visible and infrared spectra were fused, and the quality of the fused image was evaluated using SIMM, which gave 0.748 [53]. The result from Table 1 indicates that the original MRI, original PET, and the fused images have a high level of structural similarity. A score that is above 0.750 is relatively high and indicates that the two images have a strong visual resemblance in terms of the overall structure and layout of the features within the images. This suggests that the fusion process was successful in maintaining the integrity of the original MRI image while adding additional information from other sources.
The result of Table 2 means that the accuracy of the model when using only MRI data is 98.14%, when using only PET data, it is 97.09%, and when using merged MRI and PET data, it is 98.50% for the AD/EMCI classification. The use of MRI alone may result in an accurate classification, but it may not be able to identify specific pathological changes in the brain linked to AD/EMCI, which could be detected using PET imaging. When the two imaging methods are combined, they can provide a more complete picture of the brain, potentially improving the accuracy of classification. Even a slight improvement in accuracy achieved through the fusion of both modalities may have clinical significance, leading to a more precise and earlier diagnosis and treatment of AD/EMCI. The result of Table 3 shows that the precision of the multimodal fusion model, when tested with MRI data, is lower than when tested with PET data. One major reason could be that the optimisation method used for the fusion could not effectively combine the information from both modalities, as in the case of MRI. The fused MRI and PET data seem to have the highest accuracy, indicating that combining both types of data may improve the model’s performance. It is important to note that these results are specific to the ADNI dataset and may not necessarily apply to other datasets or scenarios for AD/LMCI classification. Figure 6a indicates that, of the total of 16 samples, six were correctly classified as AD (true positive), two were incorrectly classified as EMCI (false positive), seven were correctly classified as EMCI (true negative), and one was incorrectly classified as AD (false negative) for MRI test data.
The confusion matrix for testing the proposed model on PET test data is shown in Figure 6b, which is similar to the MRI test data, only that there were no false positive results, which means that the model correctly identified eight cases of AD. The result shows that the proposed model performed well on PET test data from ADNI than MRI test data with a high accuracy and precision of 100%, as well as a relatively high recall of 88.89%. Figure 6c means that all eight instances of AD were correctly identified. There were no false positive cases where AD was incorrectly identified. However, there were three false negative cases of LMCI on MRI test data while on PET test data, only one instance was incorrectly classified as LMCI. Generally, the proposed model gave a high specificity of 100%, and 88.00% in identifying LMCI and EMCI from PET test data, respectively. Additionally, the proposed model achieved specificity of 62.50% and 87.50% in identifying LMCI and EMCI from MRI test data, respectively. In this case, LMCI and EMCI are true negatives (TNs), and the proportion of TN results among all the patients that the model classifies as LMCI or EMCI is the specificity. The model is tested only on 16 samples for AD vs LMCI and AD vs EMCI because of the limited availability of data for LMCI and EMCI groups. However, this is sufficient to help us make informed decisions about whether further improvements need to be made to the model before it is used in practice. The proposed model performed better on PET test data, which could be an indication that the percentage of the functional information in the fused image is higher than the structural information. This is due to the imaging modalities and their respective signal-to-noise ratios, image resolution, and contrast. The fusion approach may perform better on one modality compared to the other.
3.3. Visualization
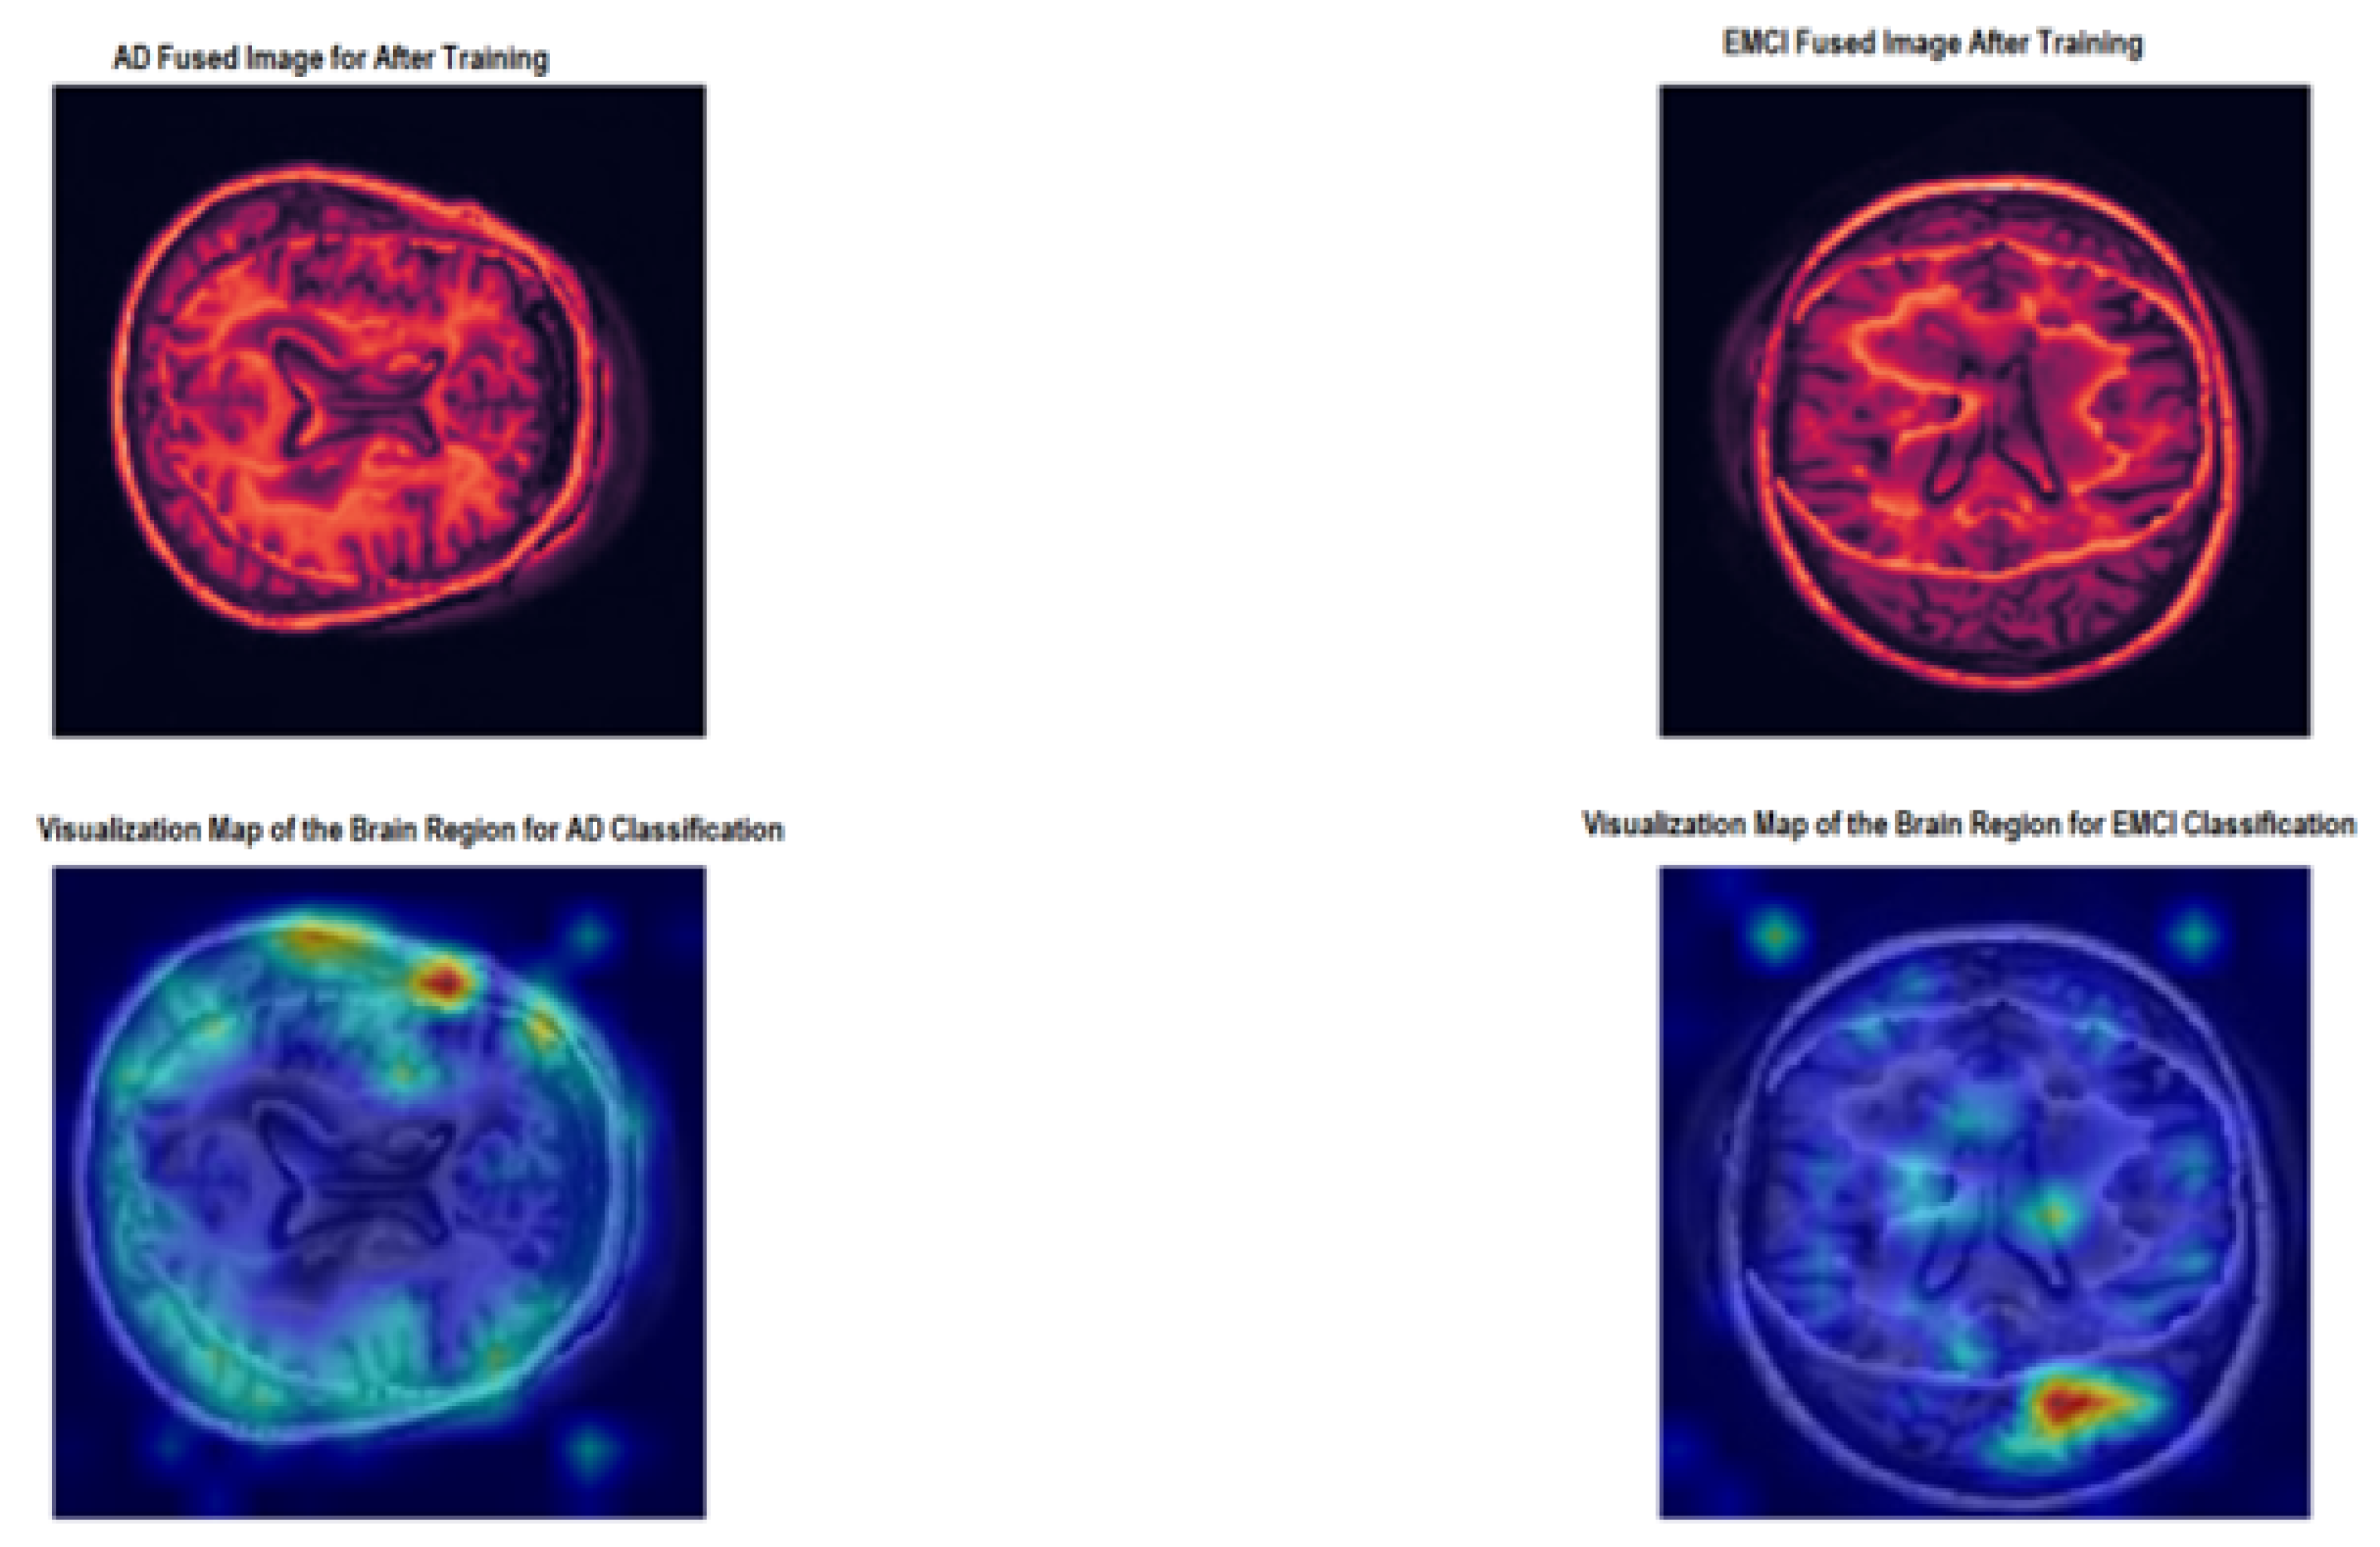
Transformer attribution is utilised to generate desired visualisation to understand the decision-making process of the proposed model. The generated maps for the AD fused image (the top left image) left) and the EMCI fused image (the top right image) right) are depicted in Figure 7. The bottom left image shows the map of the region to classify AD, and, at the bottom right, there is an image showing the map of the region for EMCI classification. The major fact we wanted to verify is to see which regions of the images (structural and functional) the model focused on the most to make the final diagnosis.
From Figure 7, the proposed model used more functional information for the AD/EMCI binary classification.
3.4. Comparison with Existing Methods
The proposed multimodal fusion model is compared with some existing models to demonstrate its effectiveness for early diagnosis of AD (Table 4). This followed binary classification of AD/EMCI using multimodal image data from MRI and PET or any other multimodal imaging fusion consisting of structural and functional information. Forouzannezhad et al. [36] combined MRI, as well as PET for AD/EMCI classification using a deep neural network with 83.2% precision. Forouzannezhad et al. [37] used a probabilistic method to collect the most relevant features from MRI, PET, and DTI for six binary classifications. The authors provided a distinction of the early and late stages of MCI using the Gaussian process and integrating the Bayesian prediction. Meng et al. [54] used DTI and fMRI to predict the diseased brain regions associated with AD, and a neural network using Lasso regression was used for the extraction and classification of multimodal image features.
4. Discussion
4.1. Answers to Research Questions
4.1.1. Answer to Research Question 1
The research question aimed to determine how MRI and PET data could be effectively combined for the early detection of AD. To address this, the authors of the paper proposed a multimodal fusion approach based on discrete wavelet transform (DWT) optimized with transfer learning based on the VGG16 model.
The proposed approach involves preprocessing the MRI and PET images to ensure they are properly aligned and then combining the images using DWT to create a fused image. The purpose of the fusion is to merge the complementary information present in the MRI and PET data to increase the precision of diagnosing AD. MRI provides structural information about the brain, while PET data provide functional information, and the fusion of these modalities can provide a more comprehensive picture of the brain’s health.
4.1.2. Answer to Research Question 2
The second research question in this paper aimed to evaluate the performance of the proposed multimodal fusion approach based on a vision transformer (ViT).
To answer this question, the authors performed experiments on the AD Neuroimaging Initiative (ADNI) dataset, which includes MRI and PET images from participants with different stages of AD. The fused images were then fed into a pre-trained vision transformer, which was fine-tuned to classify the images into either AD/EMCI or AD/LMCI categories.
The results showed that the ViT model achieved an accuracy of 81.25% on the MRI test data and 93.75% on the PET test data (see Table 3). These results suggest that the proposed multimodal fusion approach is effective in extracting important information from the MRI and PET data and using it to classify the images into different stages of AD.
The results suggest that the ViT model is a promising approach for analyzing multimodal neuroimaging data for early detection of AD. The high accuracy achieved by the model provides evidence that the proposed approach is effective in combining information from different neuroimaging modalities and using it to accurately diagnose AD.
4.1.3. Answer to Research Question 3
The third research question in this paper aimed to compare the performance of the proposed multimodal fusion approach based on a vision transformer (ViT) with other existing multimodal fusion models for AD diagnosis.
To answer this question, the authors compared the performance of their proposed ViT model with other existing multimodal fusion models on the AD Neuroimaging Initiative (ADNI) dataset. The dataset includes MRI and PET images from participants with different stages of AD.
The results showed that the ViT model outperformed the other existing multimodal fusion models in terms of accuracy for the diagnosis of AD using PET data. The ViT model achieved an accuracy of 93.75% on the PET test data, while the other existing models achieved a lower accuracy (see Table 4).
These results suggest that the ViT model with multimodal data fusion is a promising approach to the diagnosis of AD, especially compared to other existing multimodal fusion models. The ability of the proposed model to effectively extract information from the fused MRI and PET images and use it for an accurate diagnosis sets it apart from other existing models and makes it a valuable tool for early detection of AD.
4.1.4. Answer to Research Question 4
The fourth research question in this paper aimed to evaluate the generalisability of the proposed multimodal fusion approach based on a vision transformer (ViT) for the diagnosis of AD.
To answer this question, the authors evaluated the performance of their proposed ViT model on a different test dataset of MRI and PET images from participants with different stages of AD. This was done to test the generalization capability of the model and to see if it can perform well on unseen data.
The results showed that the proposed multimodal fusion approach achieved a high level of precision, 81.25%, on the MRI test data and 93.75% on the PET test data. These results indicate that the model has the ability to generalise well to new unseen data, which is a crucial aspect of its practical application in real-world settings.
These results suggest that the proposed multimodal fusion approach is a promising approach for the diagnosis of AD, as it can generalize well to new unseen data. This capability of the model is important for its practical use in real-world settings, where it may be applied to diagnose AD in new participants who were not present in the training dataset.
4.1.5. Answer to Research Question 5
The fifth research question in this paper aimed to identify the limitations and potential improvements of the proposed multimodal fusion approach and the use of ViT for medical imaging data analysis.
The limitations of the proposed multimodal fusion approach include the potential loss of unique features of each modality in the fused image and the need for further testing to ensure the accuracy of the model. Furthermore, the fusion parameters could be optimized in the future using weighting factors to improve the performance of the fused image.
Potential improvements of the proposed approach could include the integration of additional imaging modalities, the optimization of fusion parameters, and the development of more advanced deep learning models, such as attention-based models. Furthermore, incorporating additional clinical and demographic data into the model could also improve its performance. The use of ViT for medical imaging data analysis could also benefit from further fine-tuning on larger and more diverse datasets, as well as the integration of additional pre-processing techniques, such as segmentation and registration.
4.2. Limitations
The limitations of this study include:
- Limited dataset: the study was carried out on a limited dataset from the Alzheimer’s Disease Neuroimaging Initiative (ADNI) database, and the results may not be generalised to larger or diverse datasets.
- Fusion parameters: the fusion parameters in the study were not optimised to their full potential, and further optimisation may be necessary to improve the performance of the fused image.
- Single-mode performance: the performance of the model using single modalities (MRI or PET) was not evaluated, so it is not clear how well the model would perform without the fusion of data.
- Limitations of ViT: the use of a ViT model for the analysis of medical imaging data is still a relatively new area of research, and its limitations have not been fully explored.
The limitations associated with the methodology used in this paper can be stated as follows:
- Fusion technique: the fusion technique used in the study (DWT) may not be optimal for all types of medical imaging data, and other fusion techniques should be evaluated.
- Transfer learning: the study relied on transfer learning with a pre-trained VGG16 model, and the results may not generalise to other types of pre-training or architectures.
- Model selection: the selection of a ViT model for the study was based on its performance on a different task, and the suitability of ViT for the task of AD classification has not been fully established.
- These limitations highlight the need for further research and evaluation of the proposed multimodal fusion approach and the use of ViT for the analysis of medical imaging data.
5. Conclusions
In this study, a multimodal fusion model based on fine-tuned ViT is proposed for the binary classification of AD stages (AD/EMCI and AD/LMCI). MRI and PET images are fused with adequate preprocessing and image registration. To confirm the generalisation of our proposed multimodal fused image model, the proposed model was evaluated on different test data of MRI and PET from participants from the ADNI database with 81.25% and 93.75%, respectively. This suggests that the proposed ViT model, which was trained with fused data, can achieve a high level of accuracy when tested on ADNI PET test data. This implies that the model has acquired knowledge to effectively extract important characteristics of the fused data and is able to generalise well to new unseen data. Furthermore, the fact that the model achieved a 93.75% accuracy suggests that it can accurately classify a significant proportion of the PET test data. Overall, this indicates that the proposed ViT model is a promising approach for classifying AD stages when trained on fused MRI and PET data, in which classification with PET data gave better accuracy than MRI test data. The proposed model performed significantly better on PET data, but further research is required to improve its accuracy in MRI data classification.
The comparative analysis with existing multimodal models indicated that the proposed model considerably outperforms the others in generalizing well on PET data with an accuracy of 93.75%. The use of transfer learning for image interpolation offered a high quality fused image. The suggested diagnosis approach assists in validating observations and spotting early anomalies, fulfilling the needs of real-world applications. The use of fused image to train our proposed model for AD classification helps to reduce the cost of building different models for different imaging modalities, and this can save time and resources that would otherwise be spent building and training separate models. By demonstrating the feasibility and potential benefits of MRI-PET fusion, the combination of other imaging modalities, such as diffusion-weighted imaging or functional MRI, could also be investigated in the future. Other visualization techniques, such as Gradcam, could also be considered in future work to understand the proposed model decision-making. Evaluation of the impact of image quality on fused data is another future direction in this research.
Author Contributions
Conceptualization, R.M.; methodology, R.M.; software, M.O.; validation, M.O., R.M. and R.D.; formal analysis, M.O., R.M. and R.D.; investigation, M.O., R.M. and R.D.; resources, R.M.; data curation, M.O.; writing—original draft preparation, M.O. and R.M.; writing—review and editing, R.D.; visualization, M.O.; supervision, R.M. All authors have read and agreed to the published version of the manuscript.
Funding
This research received no external funding.
Institutional Review Board Statement
Not applicable.
Informed Consent Statement
Not applicable.
Data Availability Statement
The ADNI database is available from http://adni.loni.usc.edu/ (accessed 23 December 2021).
Acknowledgments
The authors thank esteemed Rb. Herbert von Allzenbutt for his thoughtful remarks on the medical analysis of the dark cavity in the fMRI data.
Conflicts of Interest
The authors declare no conflict of interest.
References
- DeTure, M.A.; Dickson, D.W. The neuropathological diagnosis of Alzheimer’s disease. Mol. Neurodegener. 2019, 14, 32. [Google Scholar] [CrossRef] [Green Version]
- Piovezan, R.D.; Oliveira, D.; Arias, N.; Acosta, D.; Prince, M.J.; Ferri, C.P. Mortality Rates and Mortality Risk Factors in Older Adults with Dementia from Low- and Middle-Income Countries: The 10/66 Dementia Research Group Population-Based Cohort Study. J. Alzheimer’s Dis. 2020, 75, 581–593. [Google Scholar] [CrossRef]
- Gaugler, J.E.; James, B.; Johnson, T.; Reimer, J.; Solis, M.; Weuve, J.; Buckley, R.F.; Hohman, T.J. 2022 Alzheimer’s disease facts and figures. Alzheimer’s Dement. 2022, 18, 700–789. [Google Scholar] [CrossRef]
- Odusami, M.; Maskeliunas, R.; Damaševičius, R.; Misra, S. Comparable Study of Pre-Trained Model on Alzheimer Disease Classification; Lecture Notes in Computer Science Volume 12953; Springer: Berlin/Heidelberg, Germany, 2021; pp. 63–74. [Google Scholar]
- Li, H.; Habes, M.; Wolk, D.A.; Fan, Y. A deep learning model for early prediction of Alzheimer’s disease dementia based on hippocampal magnetic resonance imaging data. Alzheimer’s Dement. 2019, 15, 1059–1070. [Google Scholar] [CrossRef]
- Bartos, A.; Gregus, D.; Ibrahim, I.; Tintěra, J. Brain volumes and their ratios in Alzheimer´s disease on magnetic resonance imaging segmented using Freesurfer 6.0. Psychiatry Res. Neuroimaging 2019, 287, 70–74. [Google Scholar] [CrossRef]
- Chandra, A.; Dervenoulas, G.; Politis, M. Magnetic resonance imaging in Alzheimer’s disease and mild cognitive impairment. J. Neurol. 2018, 266, 1293–1302. [Google Scholar] [CrossRef] [Green Version]
- Holiga, S.; Abdulkadir, A.; Klöppel, S.; Dukart, J. Functional Magnetic Resonance Imaging in Alzheimer’ Disease Drug Development. In Biomarkers for Alzheimer’s Disease Drug Development; Springer: Berlin/Heidelberg, Germany, 2018; pp. 159–163. [Google Scholar] [CrossRef]
- Forouzannezhad, P.; Abbaspour, A.; Fang, C.; Cabrerizo, M.; Loewenstein, D.; Duara, R.; Adjouadi, M. A survey on applications and analysis methods of functional magnetic resonance imaging for Alzheimer’s disease. J. Neurosci. Methods 2019, 317, 121–140. [Google Scholar] [CrossRef]
- Wang, X.H.; Zhao, J.; Du, Y.H.; Ding, X.T.; Men, G.Z. Alteration of functional connectivity in patients with Alzheimer’s disease revealed by resting-state functional magnetic resonance imaging. Neural Regen. Res. 2020, 15, 285. [Google Scholar] [CrossRef]
- Ossenkoppele, R.; Rabinovici, G.D.; Smith, R.; Cho, H.; Schöll, M.; Strandberg, O.; Palmqvist, S.; Mattsson, N.; Janelidze, S.; Santillo, A.; et al. Discriminative Accuracy of Positron Emission Tomography for Alzheimer Disease vs Other Neurodegenerative Disorders. JAMA 2018, 320, 1151. [Google Scholar] [CrossRef] [Green Version]
- Guo, J.; Qiu, W.; Li, X.; Zhao, X.; Guo, N.; Li, Q. Predicting Alzheimer’s Disease by Hierarchical Graph Convolution from Positron Emission Tomography Imaging. In Proceedings of the 2019 IEEE International Conference on Big Data (Big Data), Los Angeles, CA, USA, 9–12 December 2019; IEEE: New York, NY, USA, 2019. [Google Scholar] [CrossRef] [Green Version]
- Velazquez, M.; Anantharaman, R.; Velazquez, S.; Lee, Y.; Alzheimer’s Disease Neuroimaging Initiative. RNN-Based Alzheimer’s Disease Prediction from Prodromal Stage using Diffusion Tensor Imaging. In Proceedings of the 2019 IEEE International Conference on Bioinformatics and Biomedicine (BIBM), San Diego, CA, USA, 18–21 November 2019; pp. 1665–1672. [Google Scholar]
- Amoroso, N.; Rocca, M.L.; Bellotti, R.; Fanizzi, A.; Monaco, A.; Tangaro, S. Alzheimer’s disease diagnosis based on the Hippocampal Unified Multi-Atlas Network (HUMAN) algorithm. BioMedical Eng. Online 2018, 17, 6. [Google Scholar] [CrossRef] [Green Version]
- Lian, C.; Liu, M.; Zhang, J.; Shen, D. Hierarchical Fully Convolutional Network for Joint Atrophy Localization and Alzheimer’s Disease Diagnosis Using Structural MRI. IEEE Trans. Pattern Anal. Mach. Intell. 2020, 42, 880–893. [Google Scholar] [CrossRef]
- Gupta, Y.; Lee, K.H.; Choi, K.Y.; Lee, J.J.; Kim, B.C.; Kwon, G.R. Early diagnosis of Alzheimer’s disease using combined features from voxel-based morphometry and cortical, subcortical, and hippocampus regions of MRI T1 brain images. PLoS ONE 2019, 14, e0222446. [Google Scholar] [CrossRef] [Green Version]
- Toshkhujaev, S.; Lee, K.H.; Choi, K.Y.; Lee, J.J.; Kwon, G.R.; Gupta, Y.; Lama, R.K. Classification of Alzheimer’s Disease and Mild Cognitive Impairment Based on Cortical and Subcortical Features from MRI T1 Brain Images Utilizing Four Different Types of Datasets. J. Healthc. Eng. 2020, 2020, 1–14. [Google Scholar] [CrossRef]
- Hossain, M.S.; Kimura, F.; Yagi, Y.; Yamaguchi, M.; Nakamura, T. Practical image quality evaluation for whole slide imaging scanner. In Proceedings of the Biomedical Imaging and Sensing Conference, Yokohama, Japan, 25–27 April 2018; Matoba, O., Awatsuji, Y., Yatagai, T., Aizu, Y., Eds.; SPIE: Bellingham, WA, USA, 2018. [Google Scholar] [CrossRef]
- Bi, X.; Jiang, Q.; Sun, Q.; Shu, Q.; Liu, Y. Analysis of Alzheimer’s Disease Based on the Random Neural Network Cluster in fMRI. Front. Neuroinformatics 2018, 12. [Google Scholar] [CrossRef] [Green Version]
- Hojjati, S.H.; Ebrahimzadeh, A.; Khazaee, A.; Babajani-Feremi, A. Predicting conversion from MCI to AD by integrating rs-fMRI and structural MRI. Comput. Biol. Med. 2018, 102, 30–39. [Google Scholar] [CrossRef] [Green Version]
- Wang, Y.; Li, C. Functional magnetic resonance imaging classification based on random forest algorithm in Alzheimer’s disease. In Proceedings of the 2019 International Conference on Image and Video Processing, and Artificial Intelligence, Shanghai, China, 23–25 August 2019; Su, R., Ed.; SPIE: Bellingham, WA, USA, 2019. [Google Scholar] [CrossRef]
- Marchitelli, R.; Aiello, M.; Cachia, A.; Quarantelli, M.; Cavaliere, C.; Postiglione, A.; Tedeschi, G.; Montella, P.; Milan, G.; Salvatore, M.; et al. Simultaneous resting-state FDG-PET/fMRI in Alzheimer Disease: Relationship between glucose metabolism and intrinsic activity. NeuroImage 2018, 176, 246–258. [Google Scholar] [CrossRef] [Green Version]
- Chen, D.; Jiang, J.; Lu, J.; Wu, P.; Zhang, H.; Zuo, C.; Shi, K. Brain Network and Abnormal Hemispheric Asymmetry Analyses to Explore the Marginal Differences in Glucose Metabolic Distributions Among Alzheimer’s Disease, Parkinson’s Disease Dementia, and Lewy Body Dementia. Front. Neurol. 2019, 10. [Google Scholar] [CrossRef]
- Kadry, S.; Damasevicius, R.; Taniar, D.; Rajinikanth, V.; Lawal, I.A. Extraction of Tumour in Breast MRI using Joint Thresholding and Segmentation—A Study. In Proceedings of the 2021 IEEE 7th International Conference on Bio Signals, Images and Instrumentation, Chennai, India, 25–27 March 2021. [Google Scholar]
- Rajinikanth, V.; Kadry, S.; Nam, Y. Convolutional-neural-network assisted segmentation and svm classification of brain tumor in clinical mri slices. Inf. Technol. Control 2021, 50, 342–356. [Google Scholar] [CrossRef]
- Khan, M.A.; Khan, A.; Alhaisoni, M.; Alqahtani, A.; Alsubai, S.; Alharbi, M.; Malik, N.A.; Damaševičius, R. Multimodal brain tumor detection and classification using deep saliency map and improved dragonfly optimization algorithm. Int. J. Imaging Syst. Technol. 2022; Early View. [Google Scholar] [CrossRef]
- Rajinikanth, V.; Kadry, S.; Damasevicius, R.; Sujitha, R.A.; Balaji, G.; Mohammed, M.A. Glioma/Glioblastoma Detection in Brain MRI using Pre-trained Deep-Learning Scheme. In Proceedings of the 2022 3rd International Conference on Intelligent Computing, Instrumentation and Control Technologies: Computational Intelligence for Smart Systems, Kannur, Kerala, 11–12 August 2022; pp. 987–990. [Google Scholar]
- Badjie, B.; Deniz Ülker, E. A Deep Transfer Learning Based Architecture for Brain Tumor Classification Using MR Images. Inf. Technol. Control 2022, 51, 332–344. [Google Scholar] [CrossRef]
- Odusami, M.; Maskeliūnas, R.; Damaševičius, R.; Misra, S. ResD Hybrid Model Based on Resnet18 and Densenet121 for Early Alzheimer Disease Classification; Lecture Notes in Networks and Systems Volume 418; Springer: Berlin/Heidelberg, Germany, 2022; pp. 296–305. [Google Scholar]
- Ramya, J.; Maheswari, B.U.; Rajakumar, M.P.; Sonia, R. Alzheimer’s Disease Segmentation and Classification on MRI Brain Images Using Enhanced Expectation Maximization Adaptive Histogram (EEM-AH) and Machine Learning. Inf. Technol. Control 2022, 51, 786–800. [Google Scholar] [CrossRef]
- Venugopalan, J.; Tong, L.; Hassanzadeh, H.R.; Wang, M.D. Multimodal deep learning models for early detection of Alzheimer’s disease stage. Sci. Rep. 2021, 11, 3254. [Google Scholar] [CrossRef] [PubMed]
- Sarraf, S.; Tofighi, G. Classification of Alzheimer’s Disease Structural MRI Data by Deep Learning Convolutional Neural Networks. arXiv 2016, arXiv:1607.06583. [Google Scholar] [CrossRef]
- Abdelaziz, M.; Wang, T.; Elazab, A. Alzheimer’s disease diagnosis framework from incomplete multimodal data using convolutional neural networks. J. Biomed. Inform. 2021, 121, 103863. [Google Scholar] [CrossRef]
- Jin, L.; Zhao, K.; Zhao, Y.; Che, T.; Li, S. A Hybrid Deep Learning Method for Early and Late Mild Cognitive Impairment Diagnosis With Incomplete Multimodal Data. Front. Neuroinformatics 2022, 16, 843566. [Google Scholar] [CrossRef]
- Khagi, B.; Kwon, G.R. 3D CNN Design for the Classification of Alzheimer’s Disease Using Brain MRI and PET. IEEE Access 2020, 8, 217830–217847. [Google Scholar] [CrossRef]
- Forouzannezhad, P.; Abbaspour, A.; Li, C.; Cabrerizo, M.; Adjouadi, M. A Deep Neural Network Approach for Early Diagnosis of Mild Cognitive Impairment Using Multiple Features. In Proceedings of the 2018 17th IEEE International Conference on Machine Learning and Applications (ICMLA), Orlando, FL, USA, 17–20 December 2018; IEEE: New York, NY, USA, 2018. [Google Scholar] [CrossRef]
- Forouzannezhad, P.; Abbaspour, A.; Li, C.; Fang, C.; Williams, U.; Cabrerizo, M.; Barreto, A.; Andrian, J.; Rishe, N.; Curiel, R.E.; et al. A Gaussian-based model for early detection of mild cognitive impairment using multimodal neuroimaging. J. Neurosci. Methods 2020, 333, 108544. [Google Scholar] [CrossRef] [PubMed]
- Aqeel, A.; Hassan, A.; Khan, M.A.; Rehman, S.; Tariq, U.; Kadry, S.; Majumdar, A.; Thinnukool, O. A Long Short-Term Memory Biomarker-Based Prediction Framework for Alzheimer’s Disease. Sensors 2022, 22, 1475. [Google Scholar] [CrossRef]
- Sarraf, S.; Sarraf, A.; DeSouza, D.D.; Anderson, J.A.E.; Kabia, M. OViTAD: Optimized Vision Transformer to Predict Various Stages of Alzheimer’s Disease Using Resting-State fMRI and Structural MRI Data. bioXiv 2021. [Google Scholar] [CrossRef]
- Xing, X.; Liang, G.; Zhang, Y.; Khanal, S.; Lin, A.L.; Jacobs, N. Advit: Vision Transformer On Multi-Modality Pet Images For Alzheimer Disease Diagnosis. In Proceedings of the 2022 IEEE 19th International Symposium on Biomedical Imaging (ISBI), Kolkata, India, 28–31 March 2022. [Google Scholar] [CrossRef]
- Kushol, R.; Masoumzadeh, A.; Huo, D.; Kalra, S.; Yang, Y.H. Addformer: Alzheimer’s Disease Detection from Structural Mri Using Fusion Transformer. In Proceedings of the 2022 IEEE 19th International Symposium on Biomedical Imaging (ISBI), Kolkata, India, 28–31 March 2022. [Google Scholar] [CrossRef]
- Pan, J.; Wang, S. Cross-Modal Transformer GAN: A Brain Structure-Function Deep Fusing Framework for Alzheimer’s Disease. arXiv 2022, arXiv:2206.13393. [Google Scholar] [CrossRef]
- Muzammil, S.R.; Maqsood, S.; Haider, S.; Damaševičius, R. CSID: A novel multimodal image fusion algorithm for enhanced clinical diagnosis. Diagnostics 2020, 10, 904. [Google Scholar] [CrossRef]
- Andreella, A.; Finos, L. Procrustes Analysis for High-Dimensional Data. Psychometrika 2022, 87, 1422–1438. [Google Scholar] [CrossRef] [PubMed]
- Dwivedi, S.; Goel, T.; Tanveer, M.; Murugan, R.; Sharma, R. Multimodal Fusion-Based Deep Learning Network for Effective Diagnosis of Alzheimer’s Disease. IEEE MultiMedia 2022, 29, 45–55. [Google Scholar] [CrossRef]
- Grobbelaar, M.; Phadikar, S.; Ghaderpour, E.; Struck, A.F.; Sinha, N.; Ghosh, R.; Ahmed, M.Z.I. A Survey on Denoising Techniques of Electroencephalogram Signals Using Wavelet Transform. Signals 2022, 3, 577–586. [Google Scholar] [CrossRef]
- Khmag, A. Additive Gaussian noise removal based on generative adversarial network model and semi-soft thresholding approach. Multimed. Tools Appl. 2023, 82, 7757–7777. [Google Scholar] [CrossRef]
- Chen, Z.; Xie, L.; Niu, J.; Liu, X.; Wei, L.; Tian, Q. Visformer: The Vision-friendly Transformer. arXiv 2021, arXiv:2104.12533. [Google Scholar] [CrossRef]
- Khan, S.; Naseer, M.; Hayat, M.; Zamir, S.W.; Khan, F.S.; Shah, M. Transformers in Vision: A Survey. ACM Comput. Surv. 2022, 54, 1–41. [Google Scholar] [CrossRef]
- Dosovitskiy, A.; Beyer, L.; Kolesnikov, A.; Weissenborn, D.; Zhai, X.; Unterthiner, T.; Dehghani, M.; Minderer, M.; Heigold, G.; Gelly, S.; et al. An Image is Worth 16x16 Words: Transformers for Image Recognition at Scale. arXiv 2020, arXiv:2010.11929. [Google Scholar] [CrossRef]
- Sandler, M.; Zhmoginov, A.; Vladymyrov, M.; Jackson, A. Fine-tuning Image Transformers using Learnable Memory. arXiv 2022, arXiv:2203.15243. [Google Scholar] [CrossRef]
- Kumar, M.; Ranjan, N.; Chourasia, B. Analysis of Medical Image Fusion Using Transform-Based Function and Neural Network. Ann. Rom. Soc. Cell Biol. 2021, 25, 6333–6347. [Google Scholar]
- Peng, X.; Kong, L.; Han, W.; Wang, S. Multi-Sensor Image Fusion Method for Defect Detection in Powder Bed Fusion. Sensors 2022, 22, 8023. [Google Scholar] [CrossRef] [PubMed]
- Meng, X.; Liu, J.; Fan, X.; Bian, C.; Wei, Q.; Wang, Z.; Liu, W.; Jiao, Z. Multi-Modal Neuroimaging Neural Network-Based Feature Detection for Diagnosis of Alzheimer’s Disease. Front. Aging Neurosci. 2022, 14, 911220. [Google Scholar] [CrossRef] [PubMed]
Figure 1.
Block Diagram Integrating Wavelet Decomposition and Transfer Learning for Enhanced Multimodal Image Fusion for the Proposed Model.
Figure 1.
Block Diagram Integrating Wavelet Decomposition and Transfer Learning for Enhanced Multimodal Image Fusion for the Proposed Model.

Figure 2.
Wavelet transform of the sample EMCI participant MRI image.

Figure 3.
(a) Original MRI image (EMCI), (b) Original PET image (EMCI), (c) MRI and PET Image Registration Points for Alignment, (d) Fused Image (EMCI).
Figure 3.
(a) Original MRI image (EMCI), (b) Original PET image (EMCI), (c) MRI and PET Image Registration Points for Alignment, (d) Fused Image (EMCI).

Figure 4.
Training accuracy, validation accuracy, training loss, and validation loss for the proposed ViT model for AD/LMCI classification.
Figure 4.
Training accuracy, validation accuracy, training loss, and validation loss for the proposed ViT model for AD/LMCI classification.

Figure 5.
Training accuracy, validation accuracy, training loss, and validation loss for pre-trained ResNet18 model for AD/LMCI.
Figure 5.
Training accuracy, validation accuracy, training loss, and validation loss for pre-trained ResNet18 model for AD/LMCI.

Figure 6.
Confusion matrices. (a) Confusion matrix for AD/EMCI (MRI test data), (b) Confusion matrix for AD/EMCI (PET test data), (c) Confusion matrix for AD/LMCI (MRI test data), and (d) Confusion matrix for AD/LMCI (PET test data).
Figure 6.
Confusion matrices. (a) Confusion matrix for AD/EMCI (MRI test data), (b) Confusion matrix for AD/EMCI (PET test data), (c) Confusion matrix for AD/LMCI (MRI test data), and (d) Confusion matrix for AD/LMCI (PET test data).

Figure 7.
Relevancy Maps AD and EMCI.


Table 1.
Similarity score of original MRI and PET images.
| Modality | Similarity Score |
|---|---|
| MRI (AD) | 0.779 |
| PET (AD) | 0.812 |
| MRI (EMCI) | 0.720 |
| PET (EMCI) | 0.840 |
| MRI (LMCI) | 0.702 |
| PET( LMCI) | 0.890 |
Table 2.
Training precision of the proposed model and pre-trained CNN using PET, MRI, and fused data (MRI + PET).
Table 2.
Training precision of the proposed model and pre-trained CNN using PET, MRI, and fused data (MRI + PET).
| Group | MRI | PET | Fused (MRI + PET) |
|---|---|---|---|
| AD/EMCI (Proposed) | 98.1% | 97.09% | 98.50% |
| AD/LMCI (Proposed) | 96.11% | 94.70% | 99.58% |
| AD/EMCI (Pre-trained CNN) | 92.40% | 93.56% | 94.03% |
| AD/LMCI (Pre-trained CNN) | 93.33% | 93.56% | 95.00% |
Table 3.
Accuracy of the proposed model on test data.
| Group | MRI | PET |
|---|---|---|
| AD/EMCI | 81.25% | 93.75% |
| AD/LMCI | 81.25% | 93.75% |
Table 4.
The comparison results of EMCI vs AD classification with existing techniques.
| References | Method | Modality | Accuracy |
|---|---|---|---|
| [36] | Deep Neural Network | MRI + PET + | 83.20% |
| [37] | Gaussian process | MRI + PET + DTI | 88.10% |
| [54] | LassoNet + Neural network | DTI +fMRI | 85.00% |
| Proposed Model | Pretrained ViT + pixel image fusion | MRI + PET (PET test data) | 93.75% |
| Proposed Model | Pretrained ViT + pixel image fusion | MRI + PET (MRI test data) | 81.25% |
Disclaimer/Publisher’s Note: The statements, opinions and data contained in all publications are solely those of the individual author(s) and contributor(s) and not of MDPI and/or the editor(s). MDPI and/or the editor(s) disclaim responsibility for any injury to people or property resulting from any ideas, methods, instructions or products referred to in the content. |
© 2023 by the authors. Licensee MDPI, Basel, Switzerland. This article is an open access article distributed under the terms and conditions of the Creative Commons Attribution (CC BY) license (https://creativecommons.org/licenses/by/4.0/).
Share and Cite
MDPI and ACS Style
Odusami, M.; Maskeliūnas, R.; Damaševičius, R. Pixel-Level Fusion Approach with Vision Transformer for Early Detection of Alzheimer’s Disease. Electronics 2023, 12, 1218. https://doi.org/10.3390/electronics12051218
AMA Style
Odusami M, Maskeliūnas R, Damaševičius R. Pixel-Level Fusion Approach with Vision Transformer for Early Detection of Alzheimer’s Disease. Electronics. 2023; 12(5):1218. https://doi.org/10.3390/electronics12051218
Chicago/Turabian StyleOdusami, Modupe, Rytis Maskeliūnas, and Robertas Damaševičius. 2023. "Pixel-Level Fusion Approach with Vision Transformer for Early Detection of Alzheimer’s Disease" Electronics 12, no. 5: 1218. https://doi.org/10.3390/electronics12051218
Note that from the first issue of 2016, this journal uses article numbers instead of page numbers. See further details here.