1. Introduction
The most prevalent eye disorders include age-related macular degeneration, glaucoma, and diabetic retinopathy (DR). These disorders are largely caused by blood vessels in the light-sensitive membrane known as the retina [
1]. Rapid progression of DR, in particular, can be fatal and result in permanent vision loss due to two main factors: hyperglycemia and hypertension [
1,
2]. According to global statistics, it is estimated that approximately 30 million people worldwide will be affected by DR in 2030 [
3,
4,
5]. Macular degeneration, on the other hand, is a major cause of vision loss in developed countries. Macular degeneration affects approximately one in every seven people over the age of 50 in developed countries [
6]. Simply put, if eye disorders are not treated, they can result in serious complications like a sudden loss of vision [
7,
8,
9]. Early detection, treatment, and consultation with an ophthalmologist are critical for avoiding serious eye disorders. It has recently been documented that early disease detection and prompt treatment with proper follow-up procedures can prevent 95% of vision loss cases [
7]. For this purpose, one of the computerized techniques for identifying these progressive disorders is by analyzing the retinal image.
The fundus camera has two configurations of operation: Fundus fluorescein angiography (FFA) and digital color fundus image. The FFA configuration involves injecting fluorescein, a liquid that improves visibility when exposed to ultraviolet light, into the patient’s nerves. The path of the ultraviolet light through the vessels is brightened, facilitating the examination of blood flow in the retina vessel network. It produces an image with high contrast and leads to a better view for the analysis of the vessels by the expert ophthalmologist [
10,
11]. However, FFA configuration takes time, and it is challenging for the specialist to provide timely analysis for quick processing, which slows down the process. The digital color fundus image configuration contains the computerized method for performing segmentation automatically. It possesses the possibility of lowering the amount of manual labor required. while also lowering the cost of the inspection process [
12]. Reliable vessel segmentation is a hard process, and the computerized process based on color fundus image analysis allows for rapid analysis and processing.
This paper’s research goal is to evaluate the impact of vessel contrast on retinal blood vessel segmentation. The analysis of color images of the retinal fundus is a difficult task due to varying and minimal contrast and irregular illuminations of the vessels against their background. This method can be linked to the FFA analysis process and the influence of FFA can be reduced by using contrast normalization filtering such as the image coherence method. Our proposed method contained different stages. The first stage involves converting the retinal fundus color images into 3 RGB channels (red, green, and blue). The second stage contained the use of compound morphological techniques to eliminate uneven illumination and noise. The third stage is based on the new PCA technique to get a good grayscale image. But blood vessels are not always properly coherent, so the fourth stage contains the main contribution of this research work, we used different anisotropic-oriented diffusion filter schemes to get a well-coherent image. The fifth stage includes post-processing to develop a well-segmented image, based on our proposed image-rebuilding technique.
The proposed method is implemented to obtain well-segmented vessel images. The proposed overall method contains some good contributions that help in future retinal segmentation methods. For example, we provide a simple and novel process for noise removal as well as uneven illumination from medical images and these steps can be used as pre-processing for retinal vessel segmentations as well as enhancement steps to analyze the many medical images. Another main contribution is to provide the coherence module or some ensemble techniques to the research community to make the uniformity of different regions within images in the analysis of medical images for the segmentation and classification of different tasks. This set of coherence techniques can play a vital role in brain image analysis or brain tumor detection. The following are the primary contributions of this research study.
A retinal color fundus image contained three distinct pigments owing to the macula, hemoglobin, and melanin, which corresponded to the three channels of color fundus images. But, it is challenging to get a good contrast image based on proper visualization of retinal blood vessels. Our three steps provide new contributions to obtaining a well-grayscale image which leads to obtaining a well-segmented image.
Coherency of vessels is one of the main issues and many researchers have not addressed this issue. We proposed a model of coherence vessels as the fourth step, and we tested different anisotropic-oriented diffusion filters to obtain a well-coherent image of retinal blood vessels. This is one of the new contributions and it can be tested on other medical images.
2. Literature Review
Retinal blood vessels are distributed multi-directionally based on retinal color images of the fundus; therefore, it is difficult to isolate the visible. Different filtering techniques, such as core-based filters and traditional filters, and such filters have been implemented to improve blood vessel clarity for correct segmentation of the retinal vessel network [
13,
14]. The local phase-based normalized filters were implemented by Lathen et al. [
15] to enhance image intensity levels to segment retinal vessels.
Many methods of retinal vessel segmentation have been implemented over the past five years [
2,
16]. Most of these methods are divided into two types such as supervised and unsupervised segmentation methods [
17]. Supervised segmentation techniques, such as Gaussian mixture models (GMM) [
18,
19], artificial neural networks (ANN) [
20], support vector machine (SVM) [
21,
22], and k-nearest neighbor classifier [
23] are based on pre-labeled samples to train the data as a classifier. These well-trained classifiers are employed to identify non-vessel and vessel pixels and these classifiers require manually labeled ground truth images from process databases for retinal blood vessel segmentation. On the other side, unsupervised methods do not depend on classifiers or data labeling for pixel classification of vessels and non-vessels, and these methods segment retinal vessels without training data or user intervention. These unsupervised methods are becoming more convenient for researchers for automatic retinal blood vessel segmentations like [
13,
17,
24]. We also implemented an unsupervised method in this research work.
Many researchers have implemented unsupervised methods based on different techniques such as thresholding techniques, combinations of morphological tactics, and different traditional filtering. It is difficult in these methods to obtain the optimal threshold, and this is one of the reasons why the performance of many methods becomes unsatisfactory. One of the main reasons that there are many methods, either supervised, unsupervised or semi-supervised methods, to get a noise-free output model and they used different techniques [
25,
26,
27] but retinal vessels images have different problems because vessels networks are a combination of large and small vessels. Many researchers have used deep learning techniques because label-based semantic segmentation has a wide range of applications such as video analysis, autonomous driving, and robotics, but pixel-based segmentation is one technique most used on the most complex databases. Deep learning pixel segmentation is the process of labeling each pixel with the correct pixel class and craft features are extracted from this technique. The deep learning method is successful, but these methods gave misclassifications, and it becomes challenging to a proper segmentation problem and that is one reason why retinal blood vessel segmentation is a challenging issue. We have proposed the method based on a coherent technique and give a better comparison than the method based on deep learning for retinal vessel segmentation. The main problem with traditional filtering is optimization with image properties to get a well-segmented image. Due to these limitations, we have proposed a method based on contrast-normalized filtering to obtain well-segmented images and the proposed method section explains each step of the proposed methodology.
3. The Proposed Method
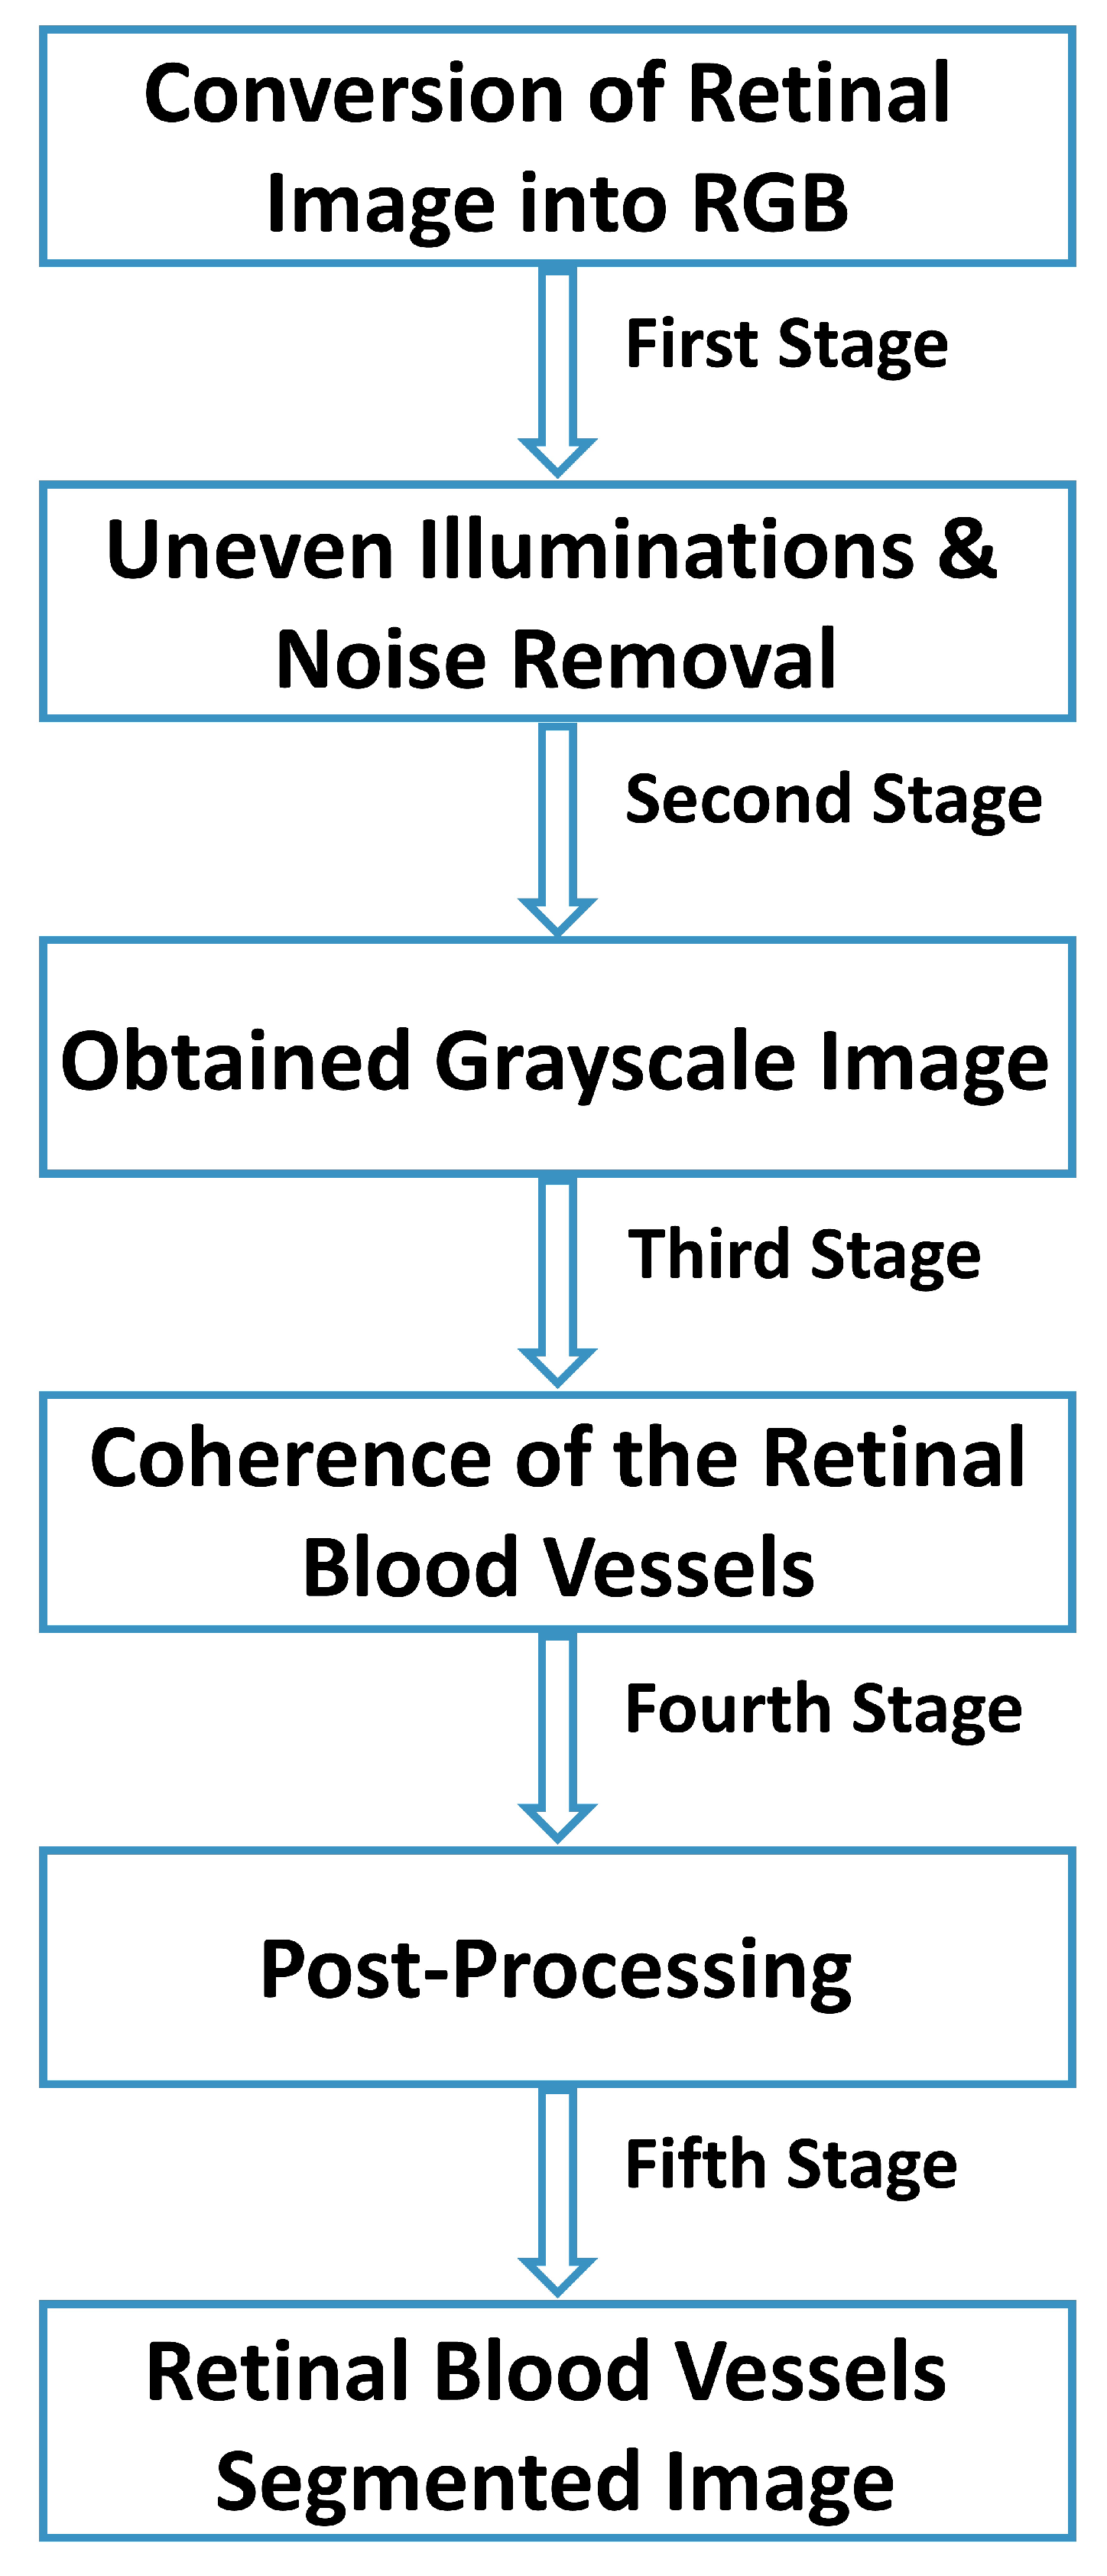
Figure 1 illustrates the proposed methods for the impact of image coherence schemes for the segmentation of retinal blood vessels. Each stage contains a novel contribution and is defined in detail below.
3.1. Stage 01: Retinal Image to RGB Channel Conversion
The fundus camera is used for fundus photography, and the fundus camera magnifies viewpoints of the interior of the retina with the help of the lens. The fundus camera, which is used to photograph the inside of the eye, is made up of standard low-power microscope sensors and a camera. The retina is made up of the posterior poles, the macula, and the optic disc [
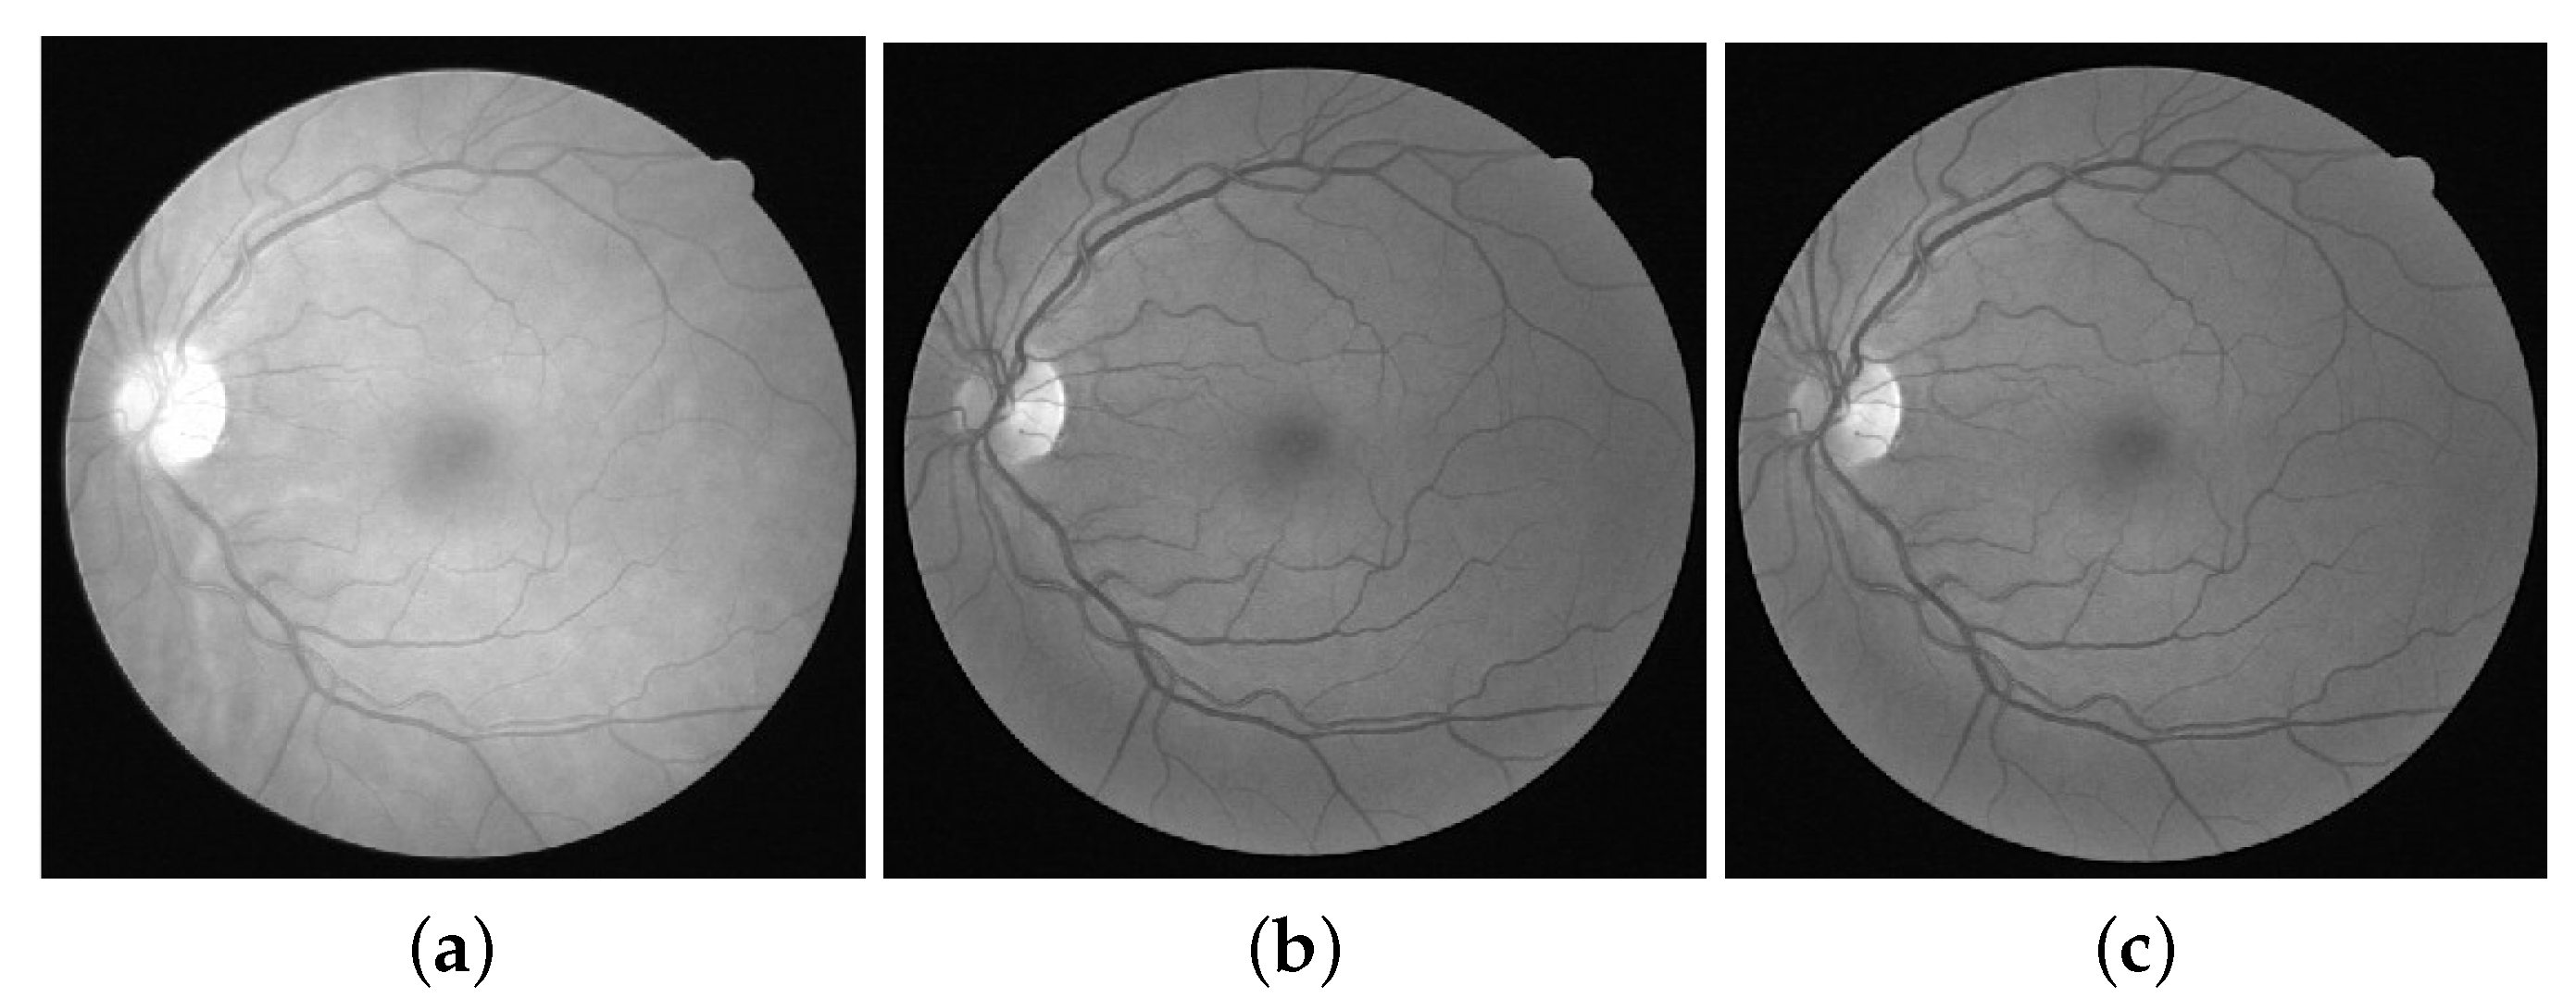
5]. The fundus camera captured the retinal fundus images by using imagining the theory of separation of the illumination and reflectance retinal surface. After the image acquisition process, the first stage of the proposed model is based on dividing retinal fundus images into RGB color channels. These channels necessitate additional processing time and intend to reduce the computation time, and the best option is to convert the retinal image to RGB channels, as shown in
Figure 2. It is analyzed that RGB channels suffer from variable low contrast and noise, and there is a need to remove uneven illuminations. The process of removing noise and uneven lighting is explained in the following section.
3.2. Stage 02: Eliminate Uneven Illuminations and Noise
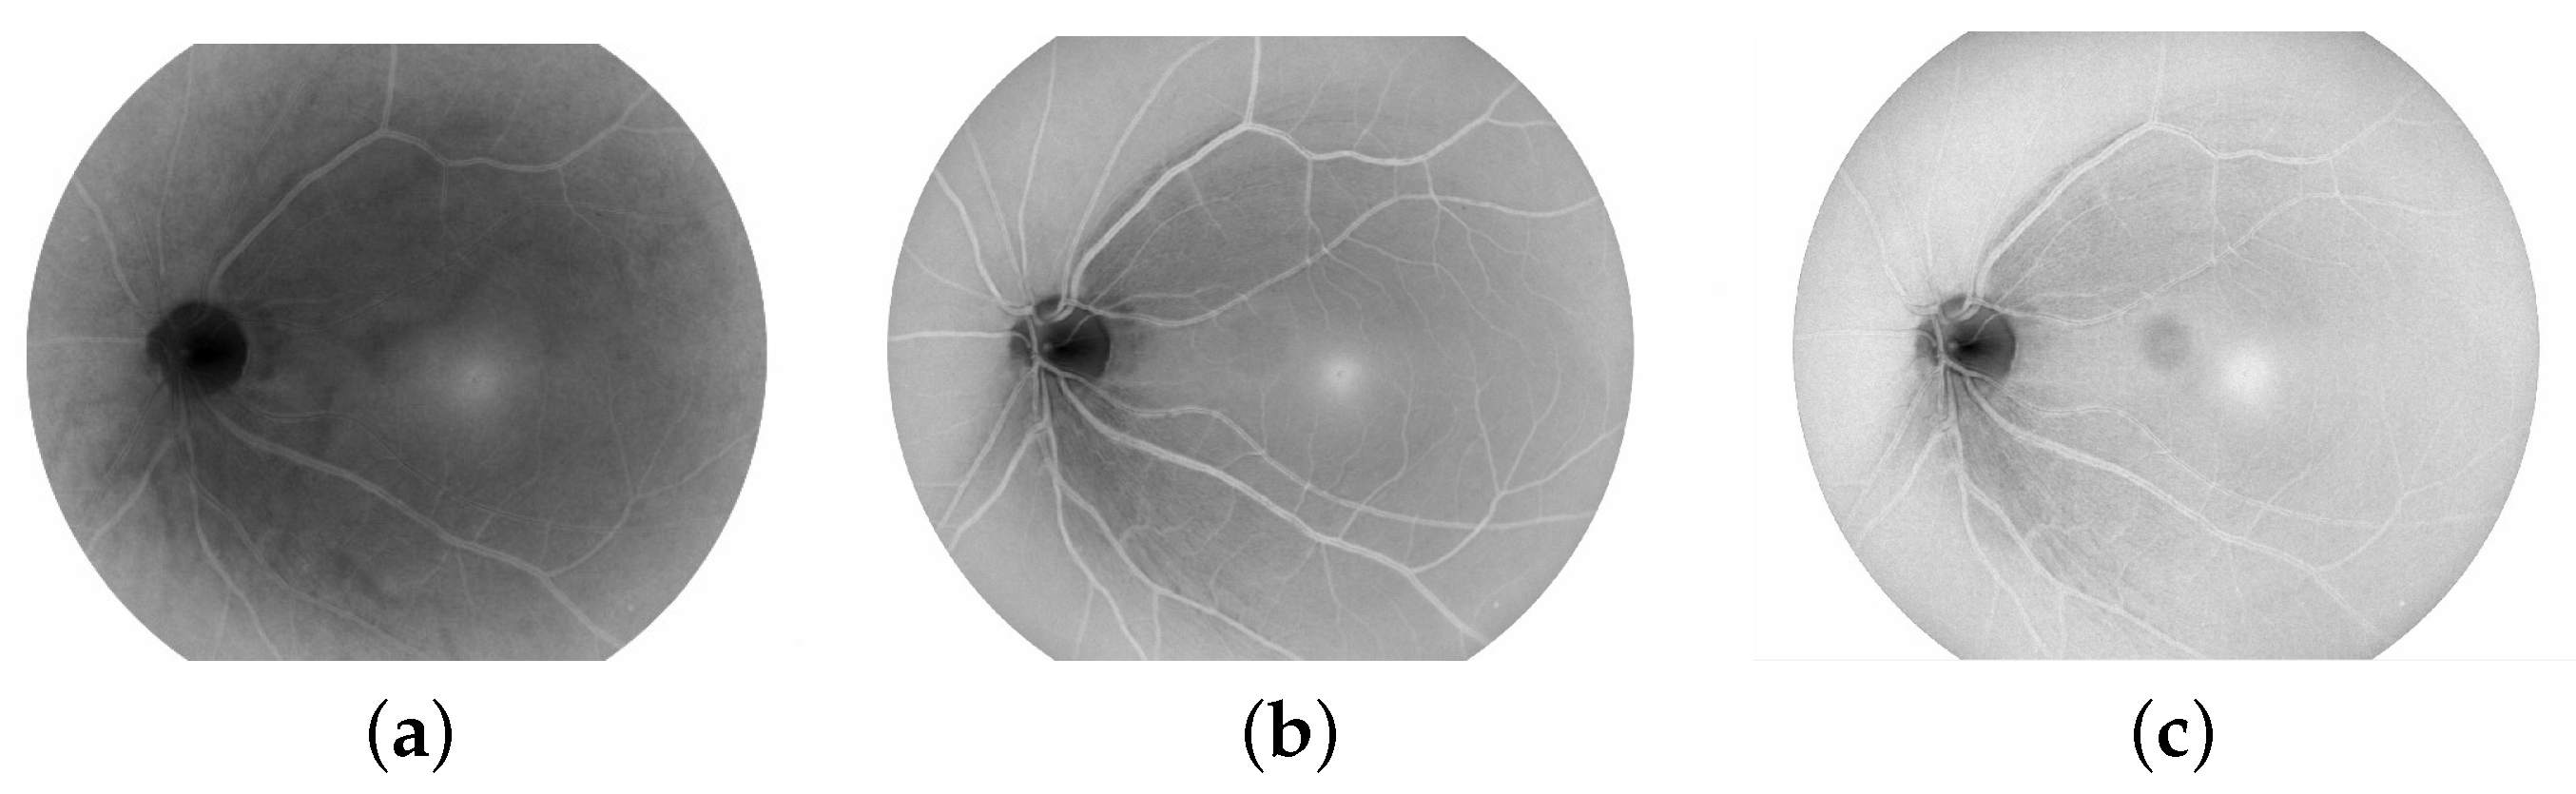
More retinal vessels are visible by manipulating uneven illumination and removing noise from retinal fundus images. We used image-processing tactics to handle this problem. The first step is converting RGB images to inverted RGB images, as shown in
Figure 3. Then we applied the morphological operation to handle the background non-uniformity, the top and bottom morphological tactics are used to get well-visible vessels, and both of these tactics work.
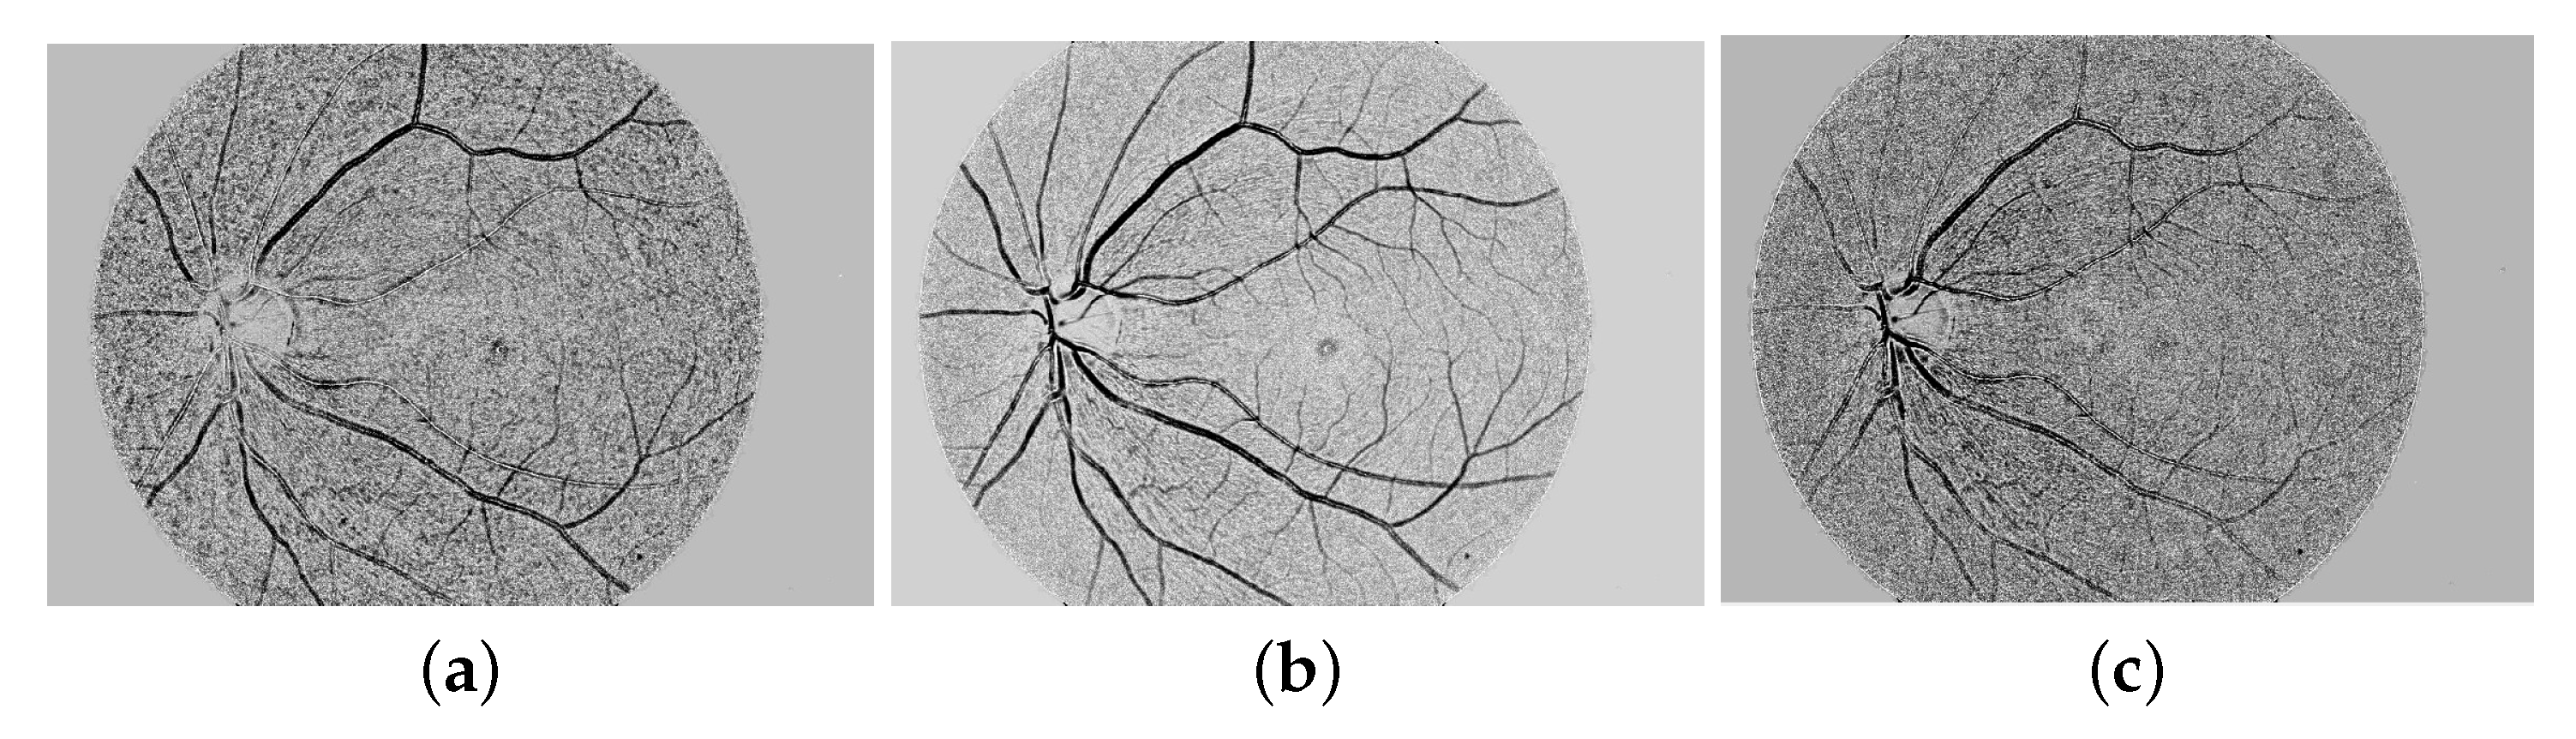
Figure 4 depicts the outcome of this step.
The top-hat and bottom-hat (THBH) morphological techniques are employed to suppress irregular illuminations and noise issues because they adjust the intensity of black pixels or background pixels to adjust for uneven background illumination by retinal blood vessels. Mathematically, it is expressed in equation form:
where
represents the morphological closing operation.
where
represents the morphological opening operation.
3.3. Stage 03: Conversion of Grey-Scale Image
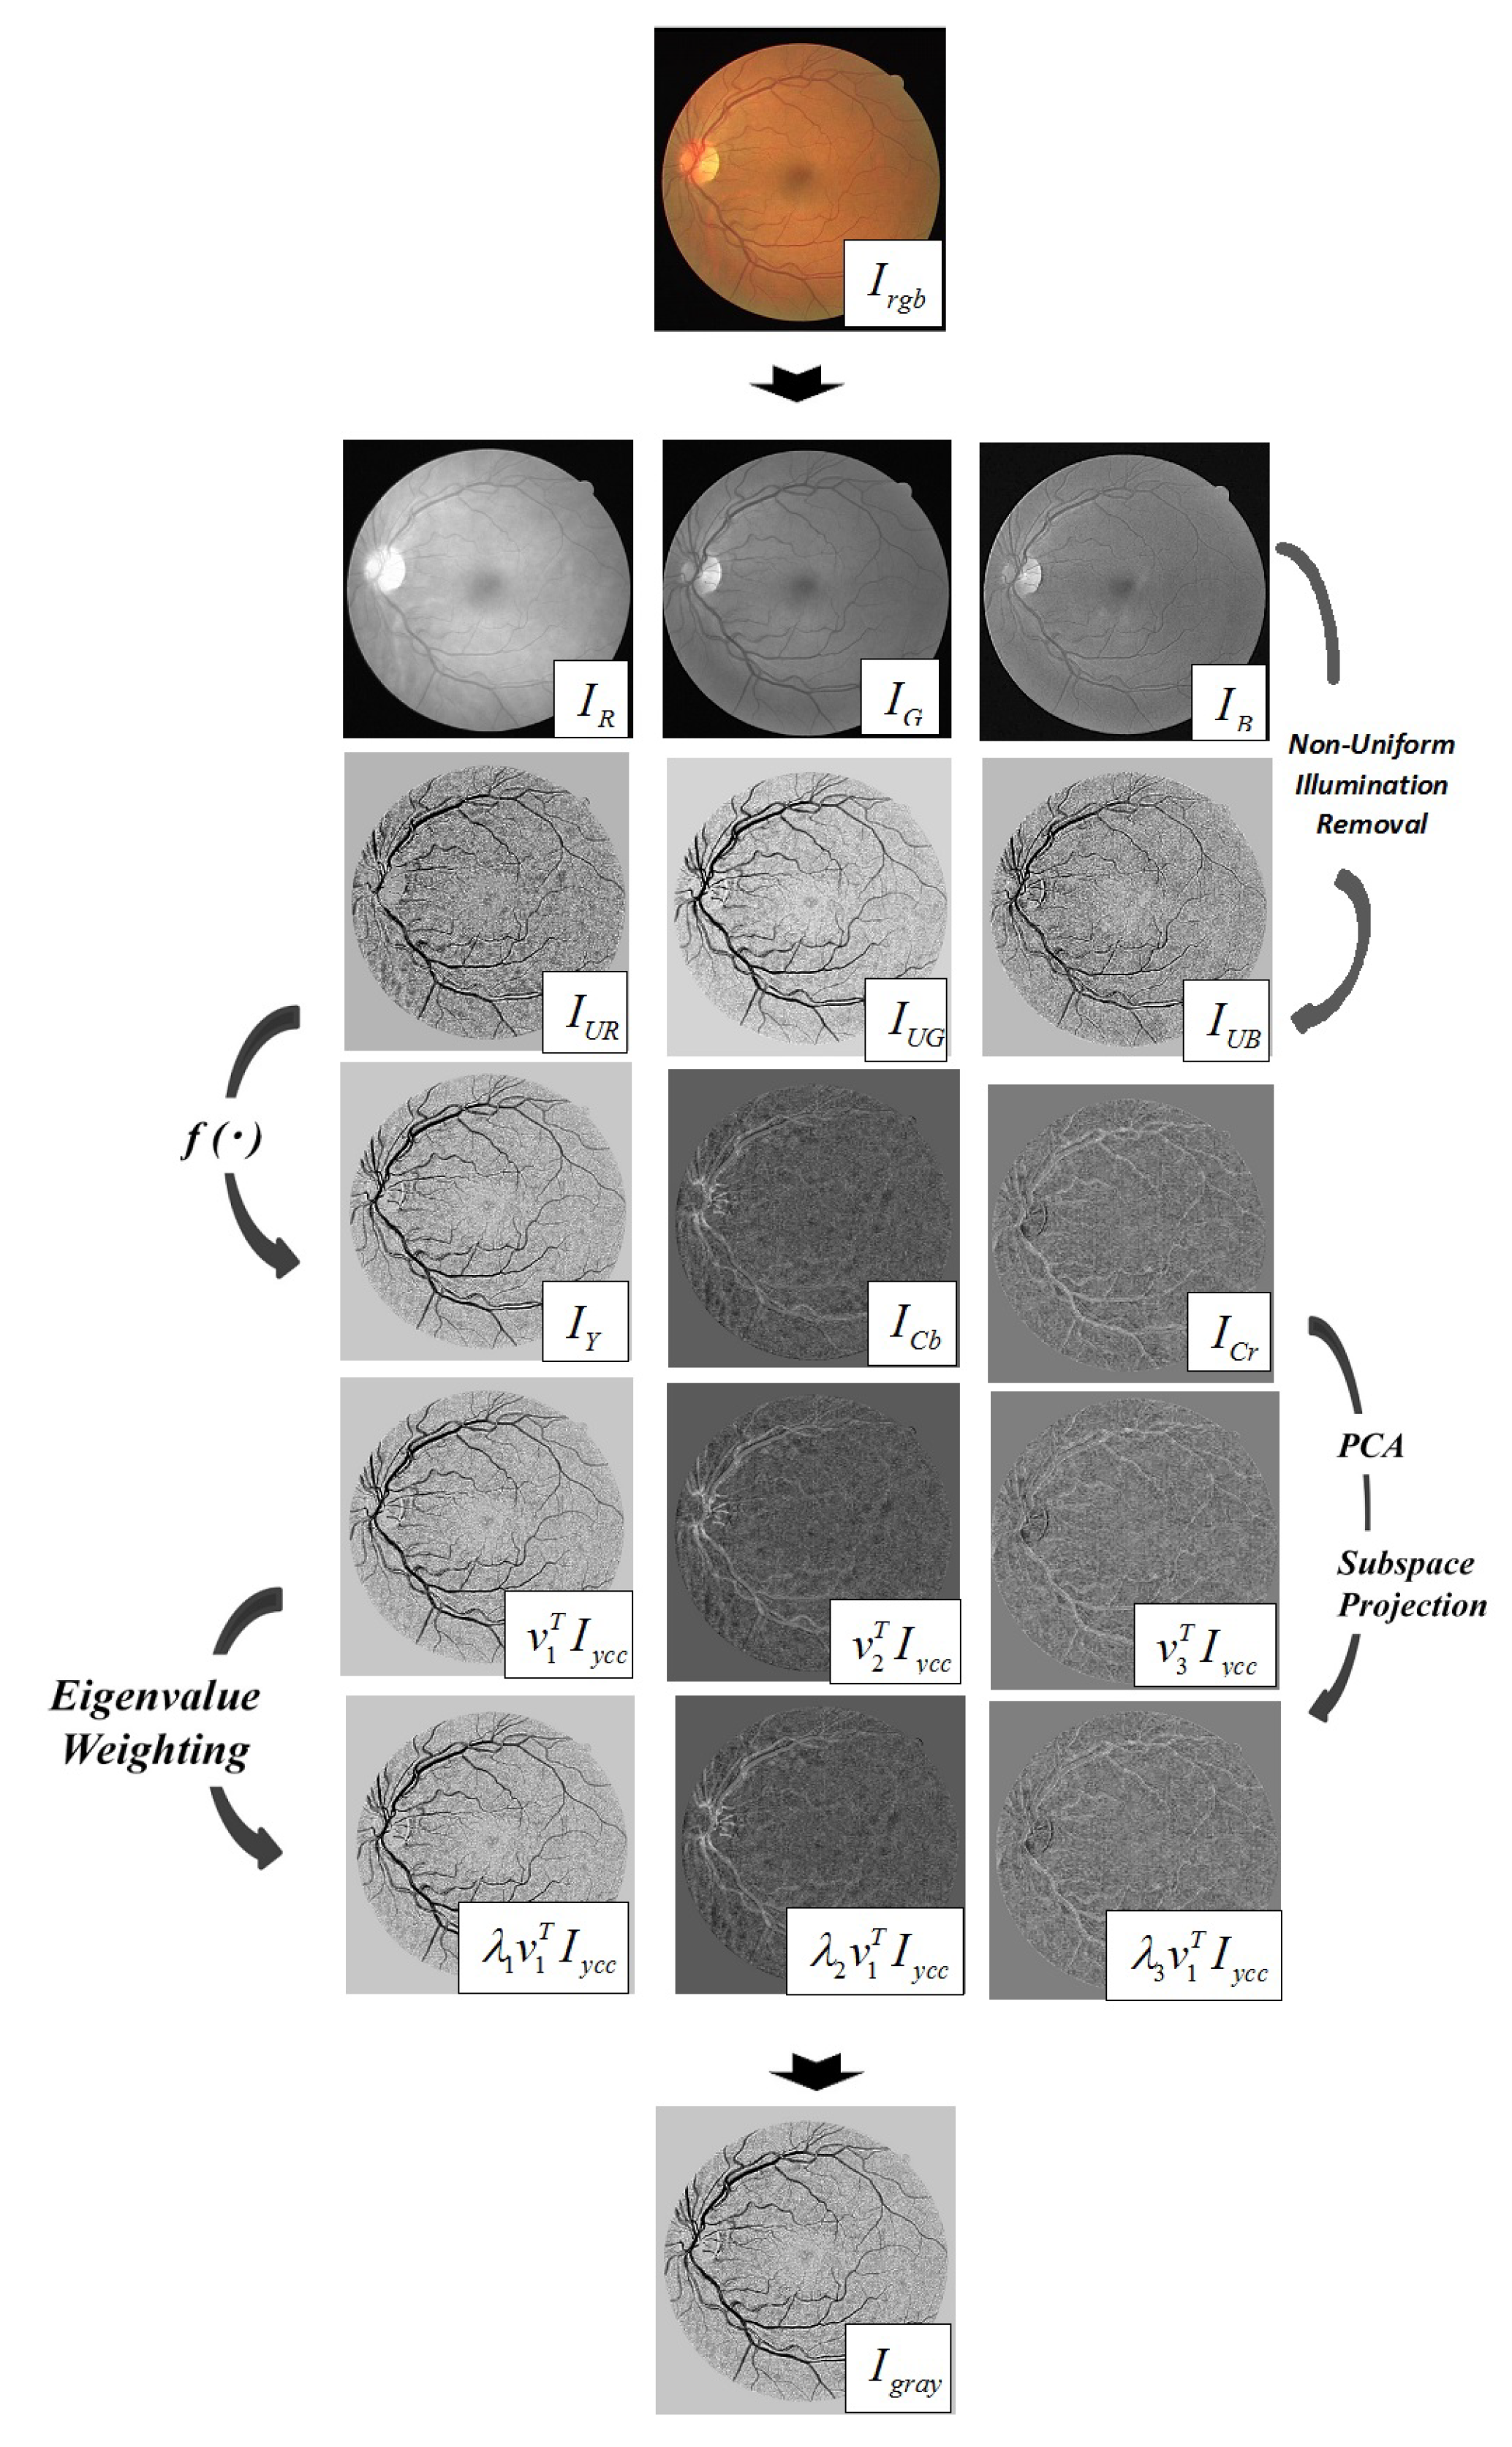
Detailed images are observed from the grayscale image, especially in medical images. Medical images are very critical for analyzing features. The observation of retinal images is very important to indicate the evolution of eye diseases. After dealing with the problem of uneven illumination, The following major work is to combine the RGB images into a single grayscale image, as this is necessary because each channel shows a different variation in contrast. The novel principal component analysis (PEC) technique is used to get a good grayscale image, as shown in
Figure 5. The PCA technique is based on transforming the rotation of the intensity magnitudes of the color space into orthogonal axes that give a well-contrasted grayscale image. The representation of the conversion of retinal RGB channels to grayscale is well defined by Soomro et al. [
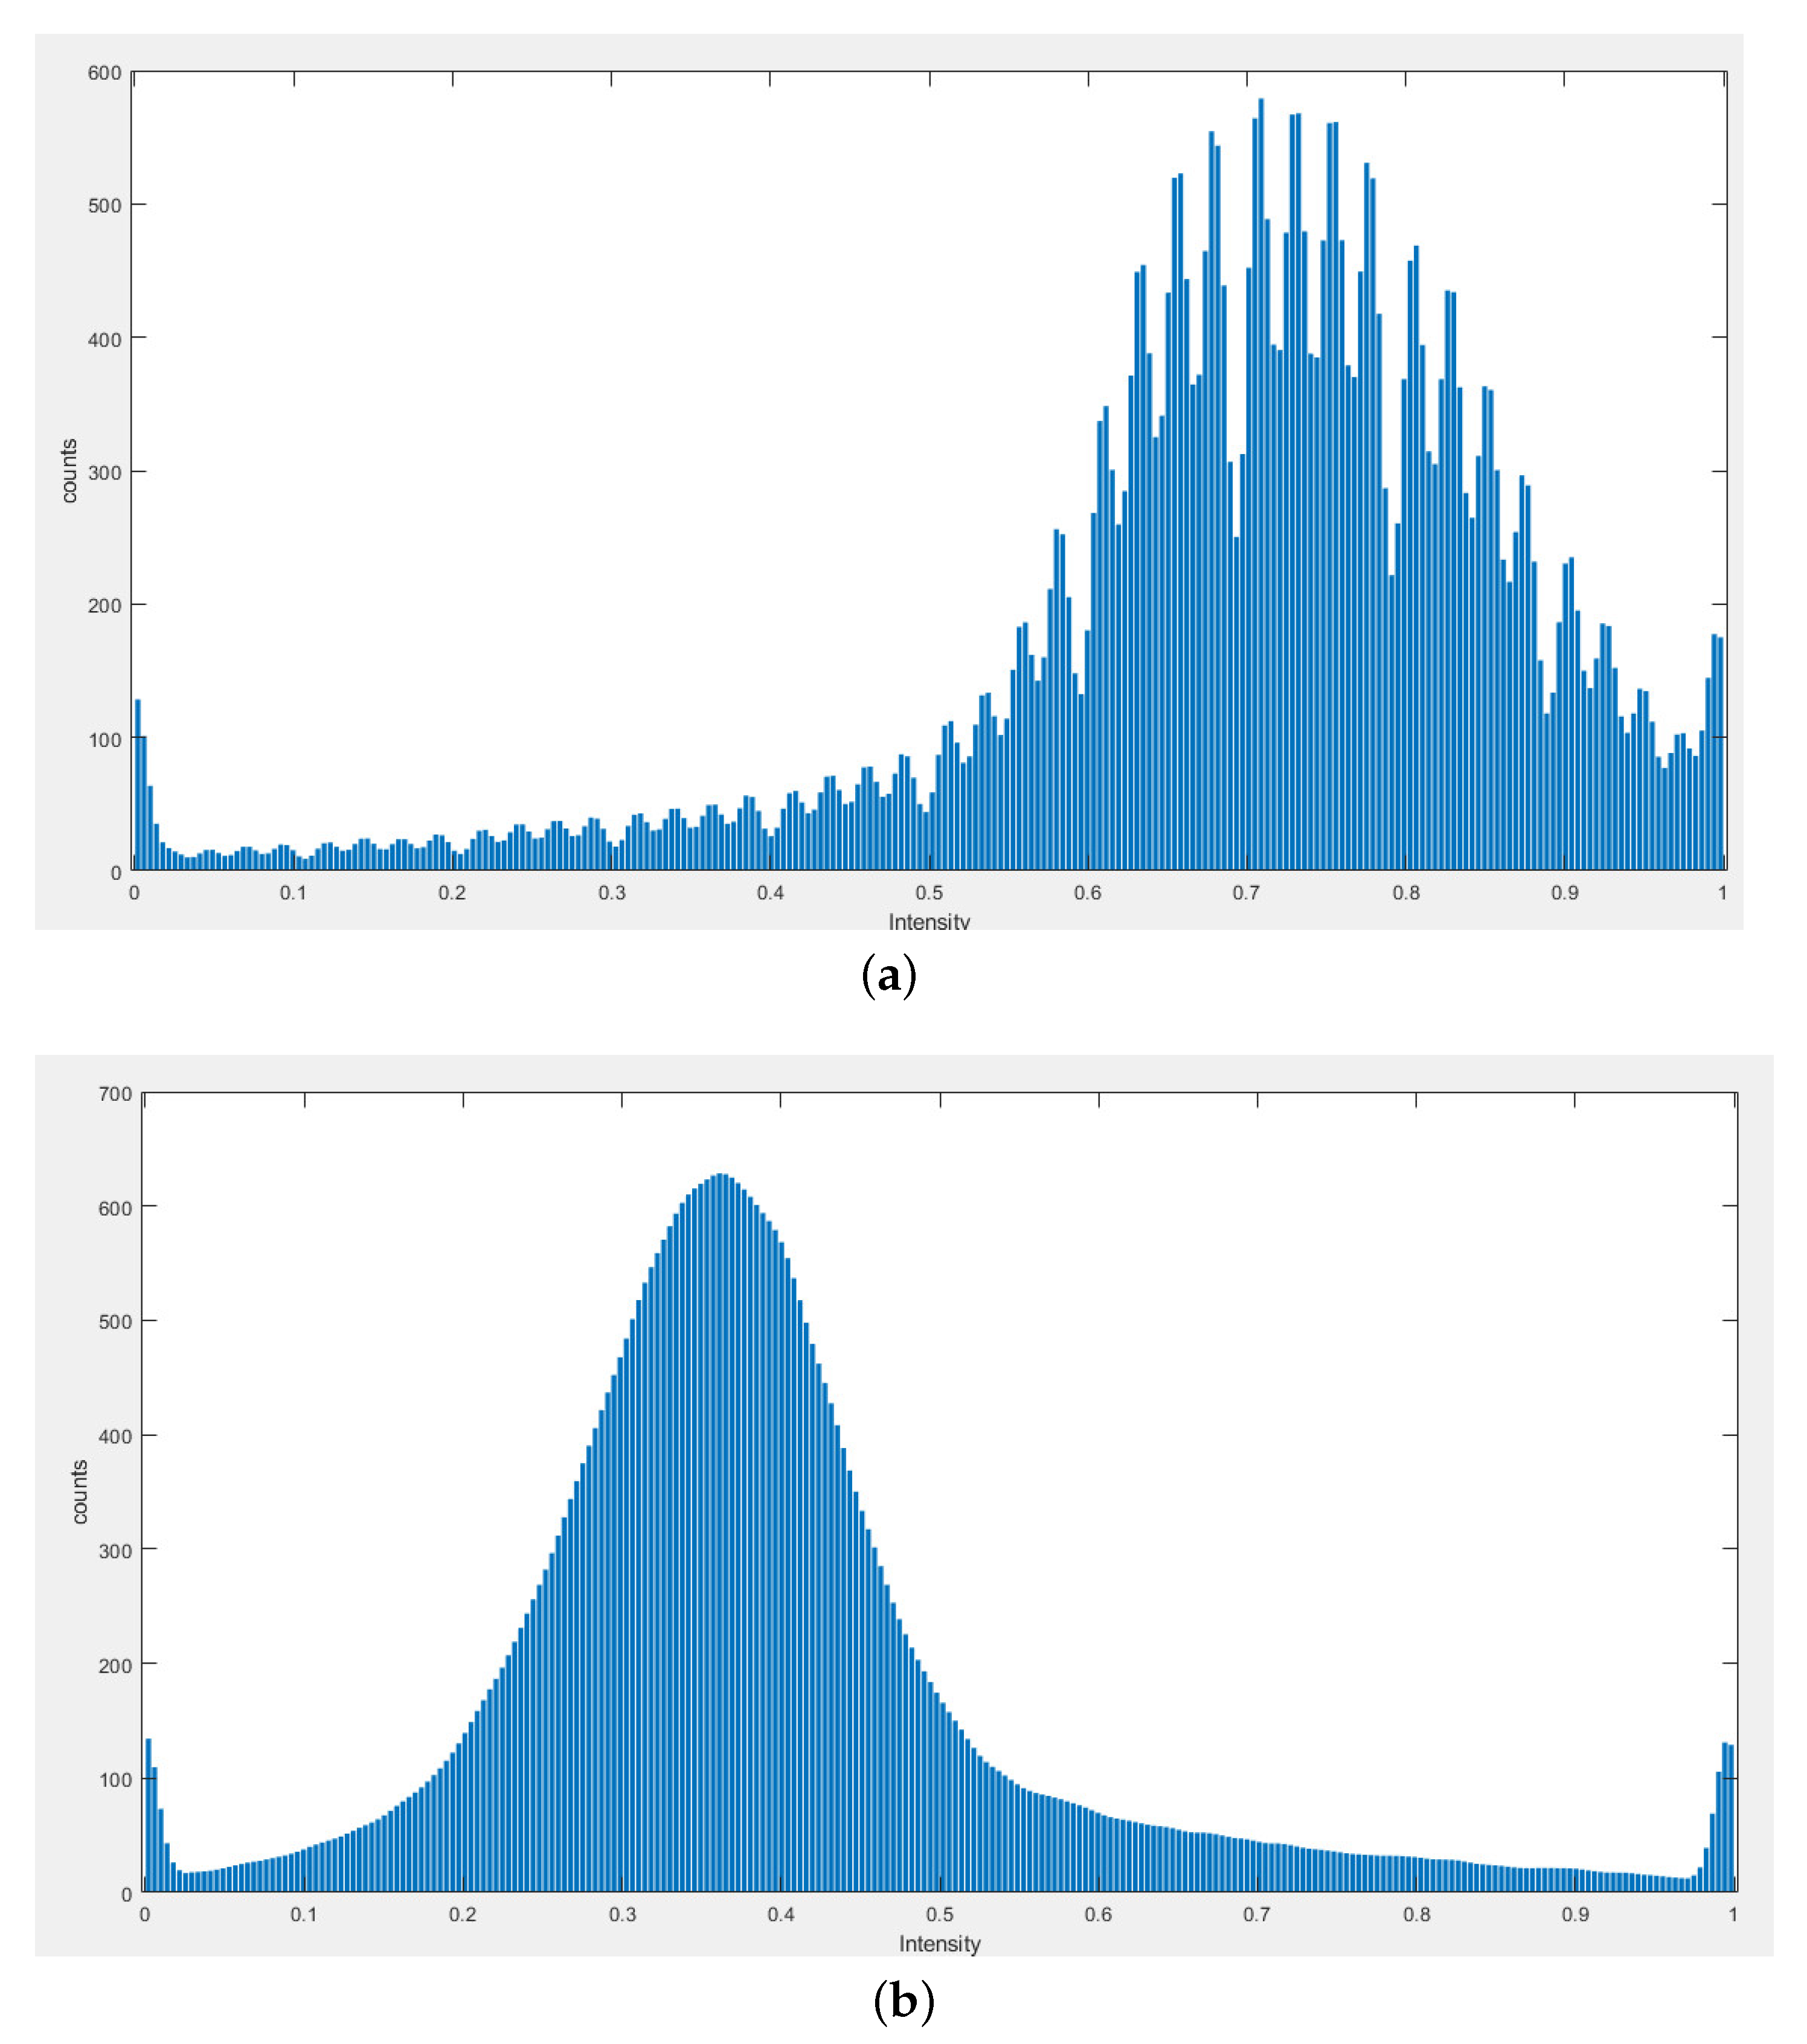
7]. The PCA gave a very discriminating image concerning the vessels compared to their background. Histogram analysis of PCA is shown in the
Figure 6, and it can be analyzed that it is more spread out and shows more intensity level compared to the morphological tactic image as shown in
Figure 6b.
3.4. Stage 04: Coherence of the Retinal Vessels
After obtaining the grayscale image, the Retinal Vessels still need to be improved because the large vessels observed correctly compared to the small vessels cannot be analyzed. Tiny vessel analysis can be analyzed correctly using oriented diffusion filtering and this filtering technique is first adopted by [
28] to detect low-quality fingerprints. The operation of an oriented diffusion filtering requires the image’s externally calculated orientation information and it is known as an orientation field (OF) which makes the diffusion tensor and orients according to the direction flow of vessels. The main motivation for using anisotropic diffusion filtering is to create the best ellipse tilt angle data as well as to correctly detect small vessels. The representation of the anisotropic diffusion of the image
is explained below.
The
D represented the diffusion matrix with 2. This is a structure matched to the image via a structural descriptor, known as the second moment matrix
, defined as:
The
,
and
show the Gaussian derivative filters with the directions
x and
y. The symmetric matrix
has two eigenvalues
and
calculated by:
where
The steering process of anisotropic diffusion filtering is based on the steering on the integration of the orientation data which was based on the secondary information when applying the adapted kernel. The orientation information may be used to create the eigenvectors of the second-moment matrix. The first normalised eigenvector is
, and the second orthogonal eigenvector is
. These eigenvectors are perpendicular to the flow of the vessel and others are parallel with parameters
representing the angle of inclination of the ellipses. Once the eigenvector is calculated and the next part gave the fixed values as eigenvalues. This process is known as the anisotropically oriented diffusion process. The optimal values of
and
are important to get a well-coherent image and the selection of
and
from the experiment work to get a well-coherent image and is elaborated in the equations below:
Stable diffusion process
step size is selected. The structure-invariant eigenvalues and structure-dependent eigenvectors are used to reconstruct the scattering matrix
D as
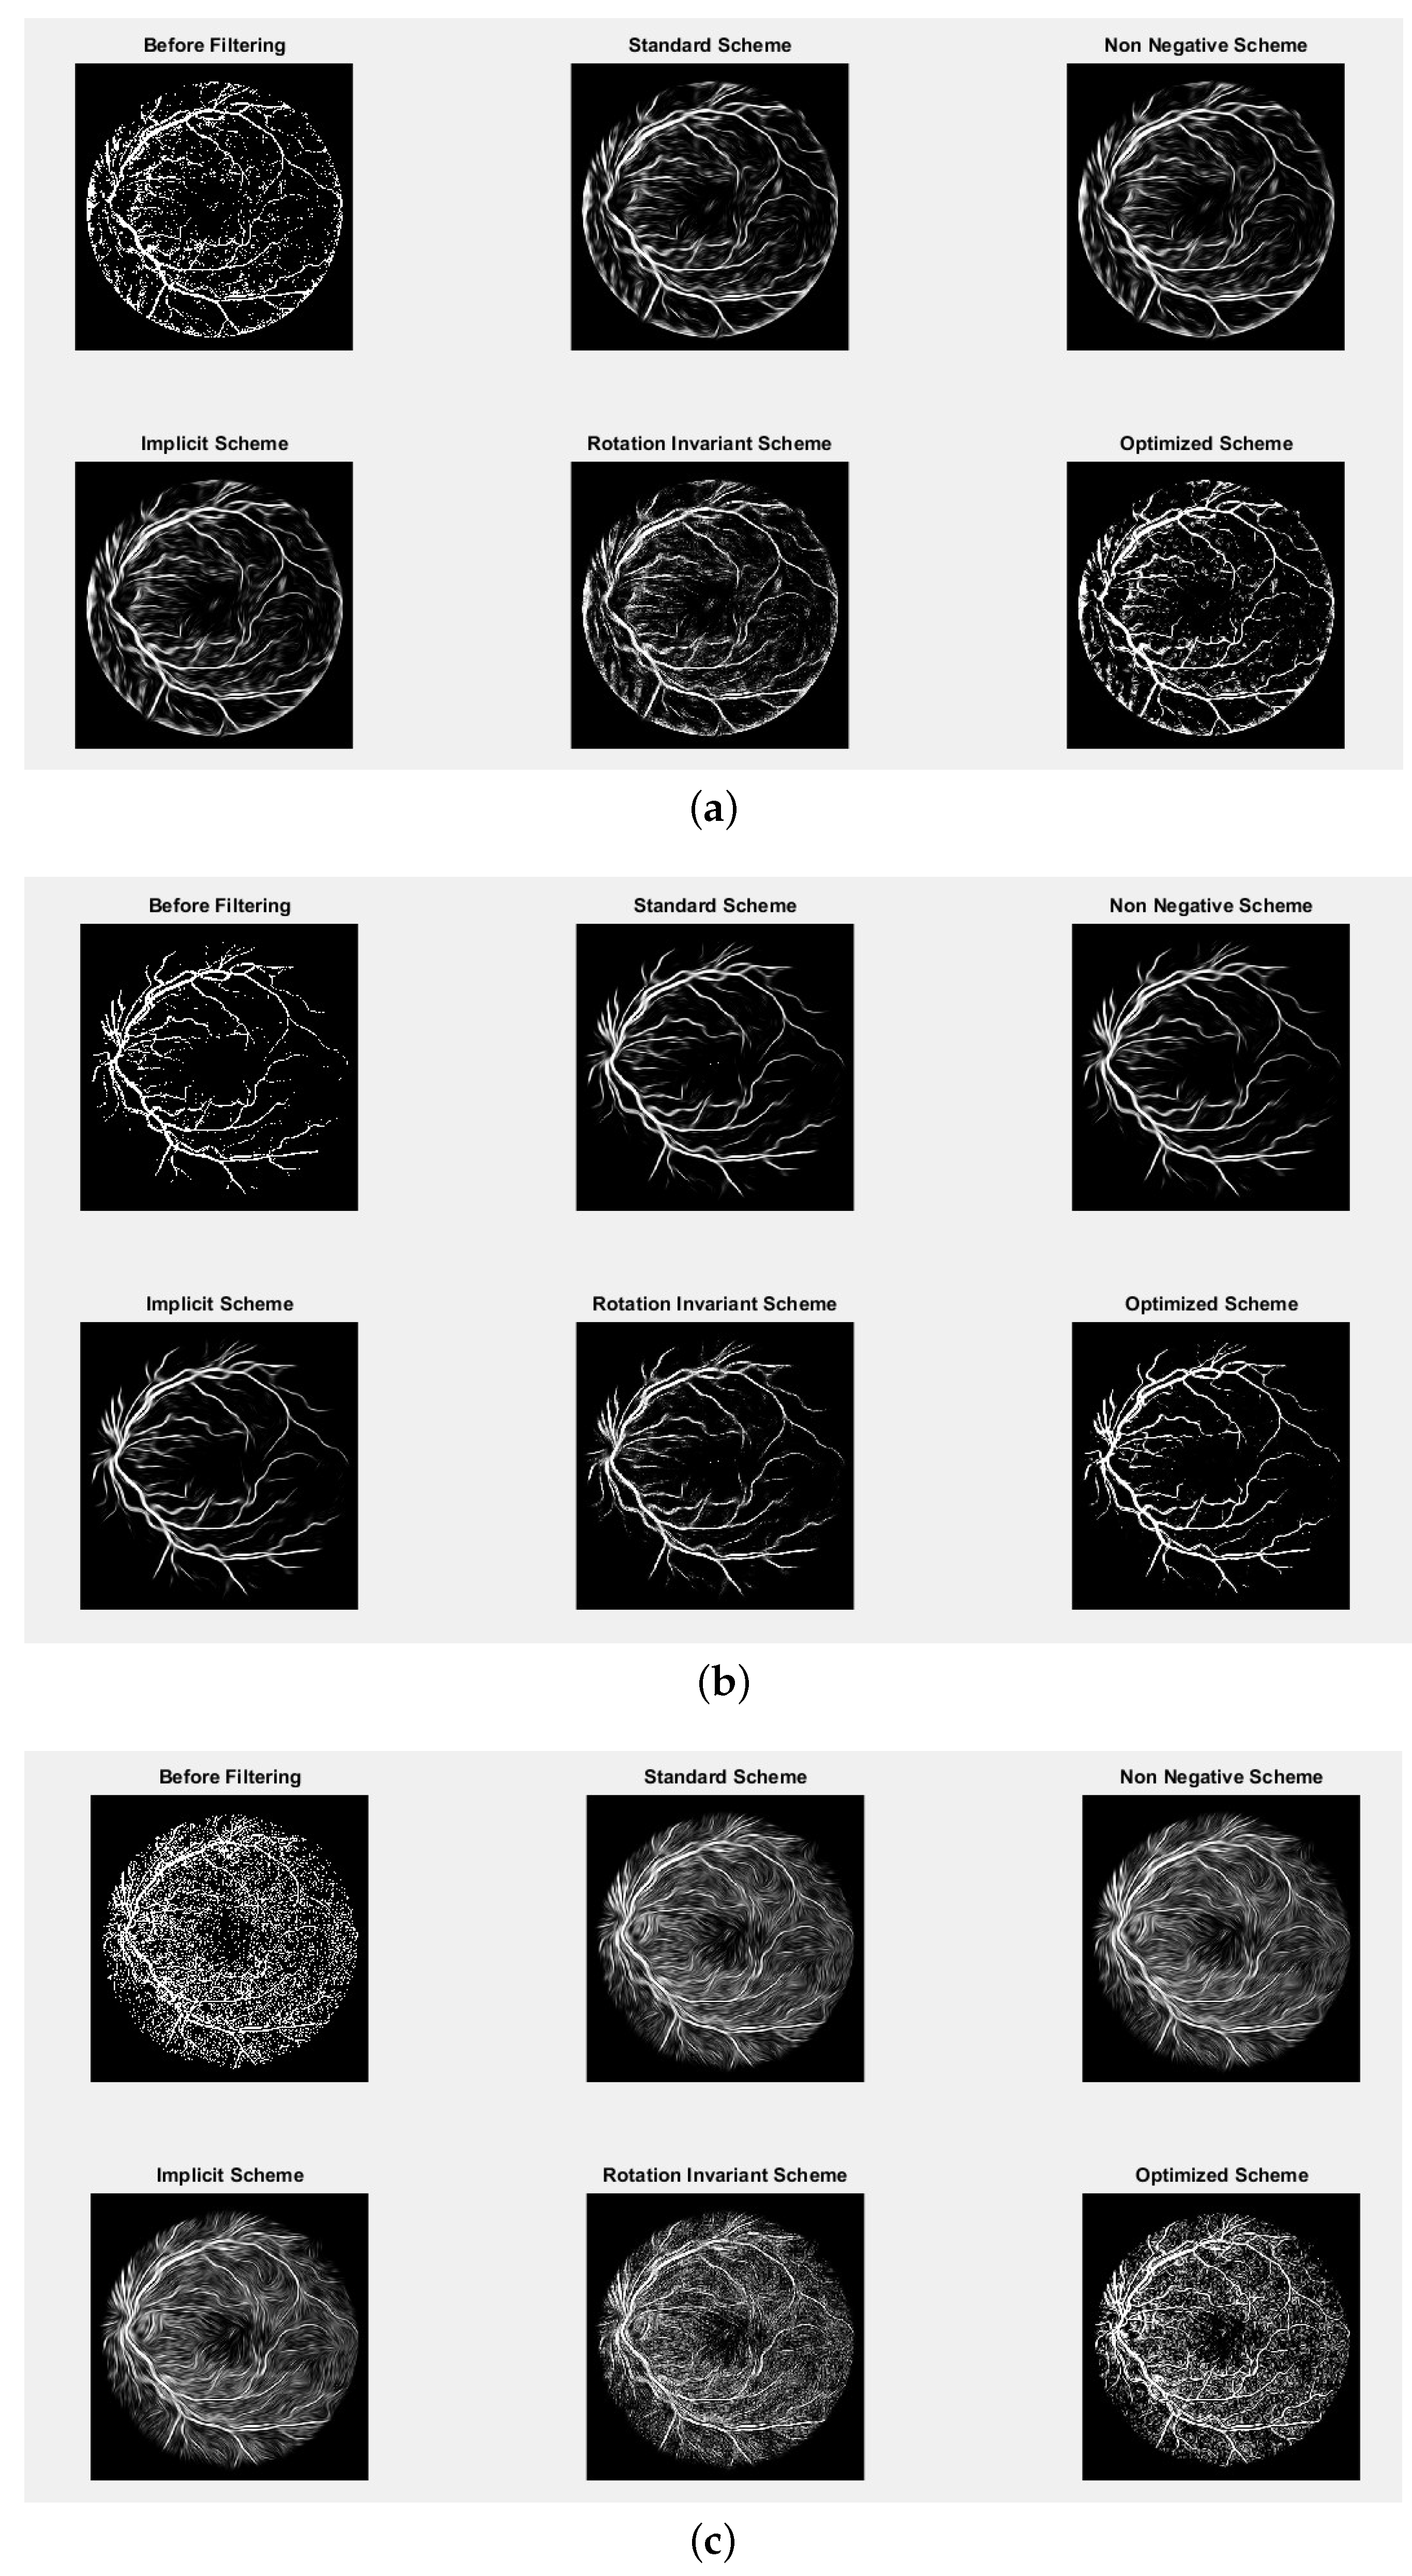
After the construction of the diffusion matrix, the smooth anisotropic process begins. This is an iterative process that contains initial retinal images and moves to form vessel structures at each stage. There is an appropriate stopping criterion to obtain well-coherent vessel images. The anisotropic diffusion filter contains different schemes, but well-coherent vessel images are obtained from optimally coherent anisotropic filtering. The output of different coherent anisotropic diffusion filter processes of our proposed method is shown in
Figure 7. The detailed analysis of anisotropic diffusion filter schemes such as standard scheme, non-negative scheme, implicit scheme, rotation invariant scheme, and optimized scheme. The optimized filtering scheme image gives better coherent images compared to other schemes.
3.5. Stage 05: Post-Processing: Retinal Blood Vessels Segmented Image
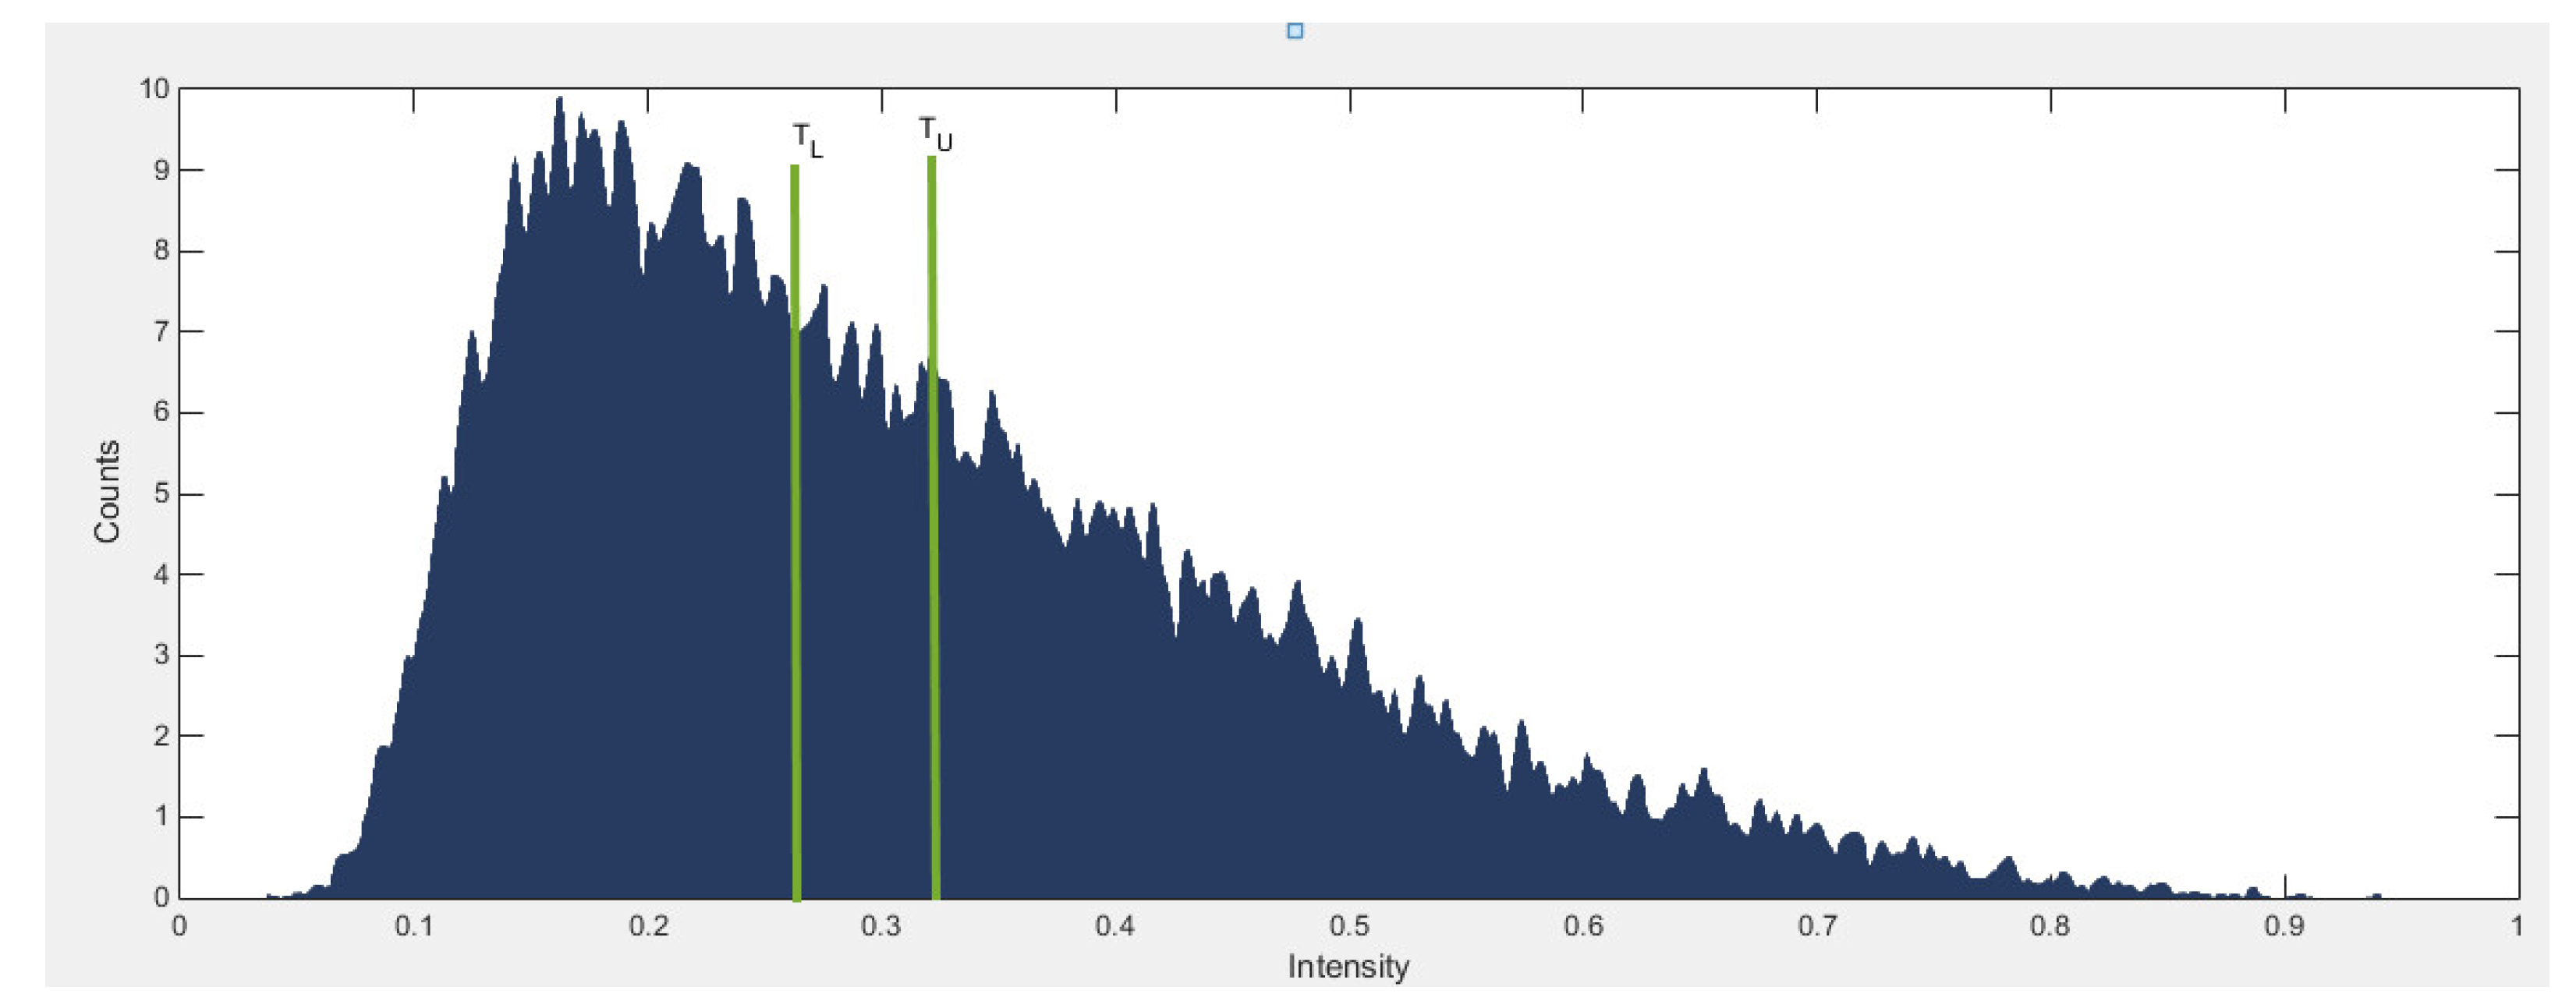
Coherent vessel images still require post-processing to obtain a well-segmented image because they have noisy pixels that make analyzing small vessels and their connecting vessels challenging. We employed a double threshold technique based on morphological rebuilding operations to create segmentation of the vessels. The morphological rebuilding procedure produced the final binary images, which are a composite of mask and marker images.
Figure 8 shows the histogram derived from the marker and mask images, while
Figure 9 shows the mask and marker images. To obtain the mask and marker images, the math operation is used. The mask image is created by implementing the image’s average values using the histogram, and the marker image is created by subtracting a 0.9 multiple SD from the image’s average values to get the optimal threshold for achieved good vessels image. Then, a morphological reconstruction is performed using the marker and the mask to produce a segmented image of the retinal vessels. But there is still noise in the morphological reconstruction image which gives false detection of the vessels. To remove noisy pixels, small areas of 50 pixels are eliminated, to produce the final image of segmented vessels.
3.6. Composed Algorithm
The proposed algorithms contain the implementation of coherent post-processing and pre-processing-based vessel schemes for retinal blood vessel segmentation. Each step of the proposed algorithm is summarized below:
The first stage contained the conversion of retinal color images to three channels (RGB).
The second stage addressed the problem of uneven illumination as well as noise using morphological techniques.
The third stage contained the conversion of the RGB images to a high-contrast grayscale image using the new PCA.
The fourth stage contained the coherence of the vessels in particular the tiny vessels. This is an important step to obtain a well-segmented image of vessels and increase the sensitivity of vessel detection. The different anisotropic-oriented diffusion filtering schemes are tested to obtain a well-performed filtering scheme. The optimized anisotropic-oriented diffusion filtering scheme addressed the problem of uneven vessel intensity and resulted in a well-coherent image of the vessels.
The last stage included double thresholding with morphological image reconstruction techniques to get a segmented image of the vessels.
4. Database and Measuring Parameters
For the experimental validation, we used the two datasets namely DRIVE [
23], and STARE [
29]. Two images in the DRIVE database contain 20, namely training and test images. These images included both their ground truth and mask images. The images in the DRIVE Dataset have a resolution of 768 × 584 pixels. Approximately 30–35% of the DRIVE database images comprised pathologies that made testing the retinal segmentation algorithm so difficult. The STARE database contained 20 images, with pathologies appearing in 50% of them. The STARE database is one of the most difficult to validate retinal vessel segmentation algorithms on. The resolution of the STARE data files is
pixels and includes ground truth and mask images. The benefit of using these datasets is that they constitute the validation images. These datasets have been used by numerous scholars, which allows us to compare the performance of our retinal vessel segmentation methods with existing methods.The evaluation of our suggested technique for retinal blood vessel segmentations is evaluated by measuring the three parameters, namely sensitivity (SE), specificity (SP), and accuracy (AC). These parameters are calculated based on the measurement of false negative (FN), true negative (TN), false positive (FP), and true positive (TP). The TP shows that the vessel’s pixel count is correctly segmented as vessels. TN correctly displays the non-vessels pixel count as non-vessels. FP refers to the amount of non-vessel pixels, segmented as vessels. The FN shows pixels of segmented vessels as non-vessels.
Sensitivity (SE) is described as the ratio of properly segmented vessels to the cumulative number of pixels of vessels and represented mathematically by:
Specificity (SP) is described as the ratio of properly segmented non-vessels to the cumulative number of pixels of non-vessels, and represented mathematically by:
Accuracy (AC) provides information on all the pixels of the segmented vessels.
4.1. Results and Analysis
The results and analysis section of the proposed method is based on a few important analyzed sections such as the validation of the proposed method on the DRIVE and STARE database, analysis of the impact of anisotropic diffusion filter on the process of segmentation, examination of the proposed method on challenging images and comparative analysis with existing methods. Each section is explained below.
4.1.1. Analysis on DRIVE and STARE Database
The STARE and DRIVE datasets are analyzed and presented in
Table 1. The proposed method gave sensitivities values of 0.811 and 0.821 on the STARE and DRIVE datasets, respectively. An accuracy of 0.954 is obtained on the STARE database and an accuracy of 0.961 is obtained on the DRIVE database. This result demonstrates the potential of the proposed technique to reach retinal blood vessels in comparison to the manual segmentation process.
4.1.2. Impact of the Coherence of the Retinal Blood Vessels
This section gives validation of the impact of retinal blood vessel coherence on the post-processing step, and vessel coherence is achieved by an optimized anisotropic diffusion filter scheme. Retinal blood vessel segmentation is analyzed with and without retinal blood vessel coherence.
Table 2 shows the analysis and it is observed that the performance is increased by 70%. This coherence of the vessels is contained up to stage 4 and it is considered the pre-processing step of our retinal segmentation method. The performance of Nguyen et al. [
30] and Hou et al. [
31] are improved by using our pr processing steps as shown in
Table 3 and
Table 4 The impact of retinal blood vessel coherence on these methods shows the ability to improve retinal blood vessel segmentation.
4.1.3. Performance on Challenging Images
The DRIVE and STARE databases contained 50% of the challenging images, and the challenging images meant that the images suffer from noise, varying contrast as well as the center of the light reflex, and uneven illumination and these issues make vessel segmentation difficult retinal blood, especially the small vessels as shown in the
Figure 10 and
Figure 11. The effectiveness of the suggested technique was examined based on images from both databases, and the results are shown in
Table 5 with improved performance.
4.1.4. Analysis on Pathological Images
The DRIVE and STARE databases contained the 70% of pathological images that we used for our performance analysis. The result of performance measurements on pathological images is presented in
Table 6. It is observed that our proposed method gives good performance and has capabilities to segment vessels closer to ground truth images as shown in
Figure 10. We perform an in-depth analysis and compare the result of our method with the two finest segmentation methods such as Nguyen et al. (2013) and Hou (2014). It is clearly parsed to give proper observations of the vessel’s image compared to Nguyen and Hou’s output image.
4.1.5. Analysis of Tiny Vessels Detection
One of the major limitations of retinal vessel analysis is small vessel analysis because correct detection of small vessels improves performance. There are two challenges in analyzing small vessels. First, small vessels are missed, and second, the missing of small vessels impacted the sensitivity of the compound algorithm. Improved detection of small vessels makes the algorithm more robust. We compared the performance of the method, we propose with the methods described for the detection of small vessels such as Nguyen et al. [
30], Hou [
31], Zhao et al. [
32] and Yan et al. [
33]. It is clearly observed that our proposed method yielded more tiny vessels than the counter method as shown in
Figure 11.
4.1.6. Comparative Analysis
4.1.7. Comparison with Other Traditional Methods
The proposed technique is validated further when compared to previously reported techniques on the STARE and DRIVE datasets, as shown in
Table 7. As can be shown, our recommended approach for segmenting retinal outperforms other methods in terms of sensitivity, but using STARE, Thangaraj et al. [
34] reported a sensitivity of 0.834, which is higher than our method but less accurate. On the other side, Soomro et al. [
35] gave higher accuracy but low sensitivity which shows that small vessels are not detected correctly. We have calculated the running time of the proposed algorithm and compared the running time with a few researchers calculating the running time as shown in
Table 7 that our proposed method has less time to give a well-segmented image compared to other reported execution methods. The results obtained using the proposed approaches show that our method is capable of accurately segmenting small and large retinal blood vessels. Noted: AUC represented Area Under Curve.
4.1.8. Comparison with Other Deep Learning or CNN-Based Methods
For more validation of the proposed method, we compared our proposed method with the deep learning method as many researchers have used these methods nowadays.
Table 8 shows the comparisons and our methods outperform many methods in terms of accuracy on the DRIVE as well as STARE as well.
After analyzing the performance of our proposed method, especially the experimental validation and comparison with the state of the art, it is clearly observed that our proposed method has the ability to perform well on databases as well as challenging images and pathological images and also to detect tiny vessels accurately as it is experimentally proven with quantification and visualization of retinal vessels. The performance of the proposed method compared to the state of the art is either the machine learning method or the image processing based methods, and it is clearly observed that our proposed method outperforms the existing methods as well as our method takes less time compared to many methods.
5. Conclusions
This research work contains an analysis of the impact of the coherence of the retinal vessels on the segmentations. Previous methods for segmenting retinal vessels were used to address the issue of poor varying contrast and noise, however, these techniques were ineffective in increasing the sensitivity of small vessel detection, and small vessel detection requires good coherence of the segmentation of the retinal vessel. The competence to correctly identify retinal vessels has given medical experts an advantage in analyzing disease progression and recommending appropriate treatment. In this study, the suggested coherency of retinal vessels (pre-processing step) and its impact on the segmentation modulus (post-processing step) resulted in promising results for small vessel segmentation. The reported method gave a good performance and is comparable to existing methods on the STARE and DRIVE datasets. We compared the performance of our proposed method against traditional methods and methods based on deep learning. We achieved a sensitivity of 0.821 on DRIVE, 0.811 on STARE, a specificity of 0.962 on DRIVE and 0.959 on STARE, an accuracy of 0.961 on DRIVE and 0.954 on STARE, an AUC of 0.967 on DRIVE and 0.966 on STARE and this performance of our proposed method surpasses the traditional and deep learning methods. Our proposed method takes less computation time compared to existing methods.
There are still many improvement ideas for future work. We will implement a robust CNN model as well as a coherency module as a pre-processing to achieve improved performance. Another future improvement is the work on the databases and the generation of the synthetic image to improve the training process in order to obtain a well-segmented image. However, these suggested future studies based on machine learning-based retinal vessel segmentation. The suggested consistency of retinal vessel segmentation can play an important role to improve the training process of these suggested studies and this research work can be a productive software to detect retinal blood vessels for retinal blood vessel detection.
Author Contributions
Conceptualization, A.S.S., T.A.S., N.A.J., A.A. and M.I.; software, T.A.S., N.A.J. and A.A.; validation, A.S.S., T.A.S., M.I., S.R., W.A.A., A.S.K. and I.A.; formal analysis, T.A.S., A.A., M.I. and N.A.J.; investigation, T.A.S. and A.S.S. and M.I.; resources, T.A.S., A.A. and M.I.; data curation, T.A.S., M.I., S.R., W.A.A., A.S.K. and I.A.; writing—original draft preparation, T.A.S.; writing—review and editing, T.A.S., A.A., N.A.J., M.I., S.R., W.A.A., A.S.K. and I.A.; visualization, A.S.S., T.A.S. and M.I.; supervision, A.S.S. and T.A.S.; project administration, T.A.S. and M.I.; funding acquisition, A.S.S., M.I. and I.A. All authors have read and agreed to the published version of the manuscript.
Funding
The APC of the journal was supported by the Najran University Kingdom of Saudi Arabia, grant No. (NU/RG/SERC/11/3).
Data Availability Statement
The data are available and can be shared upon request.
Acknowledgments
The authors acknowledge the support from the Deanship of Scientific Research, Najran University. Kingdom of Saudi Arabia, for funding this work under the Research Groups funding program grant code number (NU/RG/SERC/11/3).
Conflicts of Interest
The authors declare no conflict of interest.
References
- Grunkin, P.; Ersboll, M.; Madsen, B.; Larsen, K.; Christoffersen, M. Quantitative measurement of changes in retinal vessel diameter in ocular fundus images. Pattern Recognit. 2000, 21, 1215–1223. [Google Scholar]
- Fraza, M.; Remagninoa, P.; Hoppea, A.; Uyyanonvarab, B.; Rudnickac, A.; Owenc, C.; Barmana, S. Blood vessel segmentation methodologies in retinal images. A survey. Comput. Methods Programs Biomed. 2012, 108, 407–433. [Google Scholar] [CrossRef]
- Patton, N.; Aslam, T.; MacGillivray, T.; Patti, A.; Deary, I.J.; Dhillon, B. Retinal Vascular Image Analysis As A Potential Screening Tool For Cerebrovascular Disease: A: Rationale Based On Homology Between Cerebral And Retinal Microvasculatures. J. Anat. 2005, 206, 319–348. [Google Scholar] [CrossRef]
- Kanaide, H.; Ichiki, T.; Nishimura, J.; Hirano, K. Cellular Mechanism of Vasoconstriction Induced by Angiotensin II It Remains To Be Determined. Circ. Res. 2003, 1, 1089–1094. [Google Scholar]
- Cassin, B.; Solomon, S.A.B. Dictionary of Eye Terminology, 2nd ed.; Triad Publishing Company: Gainesville, FL, USA, 1990. [Google Scholar]
- Soomro, T.A.; Gao, J.; Khan, M.A.U.; Khan, T.M.; Paul, M. Role of Image Contrast Enhancement Technique for Ophthalmologist as Diagnostic Tool for Diabetic Retinopathy. In Proceedings of the International Conference on Digital Image Computing: Techniques and Applications (DICTA), Gold Coast, QLD, Australia, 30 November–2 December 2016; pp. 1–8. [Google Scholar]
- Soomro, T.A.; Gao, J.; Khan, T.M.; Hani, A.F.M.; Khan, M.A.U.; Paul, M. Computerised Approaches for the Detection of Diabetic Retinopathy Using Retinal Fundus Images: A Survey. J. Pattern Anal. Appl. 2017, 20, 927–961. [Google Scholar] [CrossRef]
- Heneghana, C.; Flynna, J.; O’Keefec, M.; Cahillc, M. Characterization of changes in blood vessel width and tortuosity in retinopathy of prematurity using image analysis. Med. Image Anal. 2002, 6, 407–429. [Google Scholar] [CrossRef]
- Saine, P.J.; Tyler, M.E. Ophthalmic Photography: Retinal Photography, Angiography and Electronic Imaging, 2nd ed.; Butterworth-Heinemann: Boston, MA, USA, 2002. [Google Scholar]
- Pakter, H.M.; Ferlin, E.; Fuchs, S.C.; Maestri, M.K.; Moraes, R.S.; Nunes, G.; Moreira, L.B.; Gus, M.; Fuchs, F.D. Measuring Arteriolar-To-Venous Ratio in Retinal Photography of Patients with Hypertension: Development and Application of a New Semi-Automated Method. Am. J. Hypertens. 2005, 18, 417–421. [Google Scholar] [CrossRef] [Green Version]
- Wong, T.Y.; Knudtson, M.D.; Klein, R.; Klein, B.E.; Meuer, M.S.M.; Hubbard, L.D. Computer-assisted measurement of retinal vessel diameters in the Beaver Dam Eye Study: Methodology, correlation between eyes, and effect of refractive errors. J. Ophthalmol. 2004, 111, 1181–1190. [Google Scholar] [CrossRef]
- Soomro, T.A.; Afifi, A.J.; Gao, J.; Hellwich, O.; Zheng, L.; Paul, M. Strided fully convolutional neural network for boosting the sensitivity of retinal blood vessels segmentation. Expert Syst. Appl. 2019, 134, 36–52. [Google Scholar] [CrossRef]
- Bankhead, P.; Scholfield, C.N.; McGeown, J.G.; Curtis, T.M. Fast retinal vessel detection and measurement using wavelets and edge location refinement. PLoS ONE 2012, 7, e32435. [Google Scholar] [CrossRef] [Green Version]
- Zhanga, B.; Zhangb, L.; Zhangb, L.; Karraya, F. Retinal vessel extraction by matched filter with first-order derivative of Gaussian. Comput. Biol. Med. 2010, 40, 438–445. [Google Scholar] [CrossRef] [Green Version]
- Lathen, G.; Jonasson, J.; Borga, M. Blood vessel segmentation using multi-scale quadrature filtering. Pattern Recognit. Lett. 2010, 31, 762–767. [Google Scholar] [CrossRef]
- Lesagea, D.; Angelini, E.D.; Bloch, I.; Funka-Leaa, G. A review of 3D Vessel Lumen Segmentation Techniques: Models, Features and Extraction Schemes. Med. Image Anal. 2009, 13, 819–845. [Google Scholar] [CrossRef]
- Sun, K.; Chen, Z.; Jiang, S. Local Morphology Fitting Active Contour for Automatic Vascular Segmentation. IEEE Trans. Biomed. Eng. 2012, 59, 464–473. [Google Scholar]
- Soares, J.V.; Leandro, J.J.; Cesar, R.M.; Jelinek, H.F.; Cree, M.J. Retinal Vessel Segmentation Using the 2-D Gabor Wavelet and Supervised Classification. IEEE Trans. Med. Imaging 2006, 9, 1214–1222. [Google Scholar] [CrossRef] [Green Version]
- Marin, D.; Aquino, A.; Gegundez-Arias, M.E.; Bravo, J.M. A New Supervised Method for Blood Vessel Segmentation in Retinal Images by Using Gray-Level and Moment Invariants-Based Features. IEEE Trans. Med. Imaging 2011, 30, 146–158. [Google Scholar] [CrossRef] [Green Version]
- Sinthanayothin, C.; Boyce, J.F.; Cook, H.L.; Williamson, T.H. Automated localisation of the optic disc, fovea, and retinal blood vessels from digital colour fundus images. Br. J. Ophthalmol. 1999, 83, 890–902. [Google Scholar] [CrossRef]
- Xinge, Y.; Qinmu, P.; Yuan, Y.; Yiu-ming, C.; Jiajia, L. Segmentation of Retinal Blood Vessels Using the Radial Projection and Semi-supervised Approach. Pattern Recognit. 2011, 44, 10–11. [Google Scholar]
- Ricci, E.; Perfetti, R. Retinal Blood Vessel Segmentation Using Line Operators and Support Vector Classification. IEEE Trans. Med. Imaging 2007, 26, 1357–1365. [Google Scholar] [CrossRef]
- Staal, J.; Abràmoff, M.D.; Niemeijer, M.; Viergever, M.A.; Van Ginneken, B. Ridge-based vessel segmentation in color images of the retina. IEEE Trans. Med. Imaging 2004, 23, 501–509. [Google Scholar] [CrossRef]
- Al-Diri, B.; Hunter, A.; Steel, D. An Active Contour Model for Segmenting and Measuring Retinal Vessels. IEEE Trans. Med. Imaging 2009, 28, 1488–1497. [Google Scholar] [CrossRef]
- Zhang, D.; Yao, L.; Chen, K.; Wang, S.; Chang, X.; Liu, Y. Making Sense of Spatio-Temporal Preserving Representations for EEG-Based Human Intention Recognition. IEEE Trans. Cybern. 2020, 50, 3033–3044. [Google Scholar] [CrossRef]
- Luo, M.; Chang, X.; Nie, L.; Yang, Y.; Hauptmann, A.G.; Zheng, Q. An Adaptive Semisupervised Feature Analysis for Video Semantic Recognition. IEEE Trans. Cybern. 2018, 48, 648–660. [Google Scholar] [CrossRef]
- Chen, K.; Yao, L.; Zhang, D.; Wang, X.; Chang, X.; Nie, F. A Semisupervised Recurrent Convolutional Attention Model for Human Activity Recognition. IEEE Trans. Neural Netw. Learn. Syst. 2020, 31, 1747–1756. [Google Scholar] [CrossRef]
- Gottschlich, C.; Schonlieb, C.-B. Oriented diffusion filtering for enhancing low-quality fngerprint images. IET Biom. 2012, 1, 105–113. [Google Scholar] [CrossRef]
- Hoover, A.; Kouznetsova, V.; Goldbaum, M. Locating blood vessels in retinal images by piecewise threshold probing of a matched filter response. IEEE Trans. Med. Imaging 2000, 19, 203–210. [Google Scholar] [CrossRef] [Green Version]
- Nguyen, U.T.V.; Bhuiyan, A.; Park, L.A.F.; Ramamohanarao, K. An effective retinal blood vessel segmentation method using multi-scale line detection. Pattern Recognit. 2013, 46, 703–715. [Google Scholar] [CrossRef]
- Hou, Y. Automatic Segmentation of Retinal Blood Vessels Based on Improved Multiscale Line Detection. J. Comput. Sci. Eng. 2014, 8, 119–128. [Google Scholar] [CrossRef] [Green Version]
- Zhao, Y.; Rada, L.; Chen, K.; Harding, S.P.; Zheng, Y. Automated Vessel Segmentation Using Infinite Perimeter Active Contour Model with Hybrid Region Information with Application to Retinal Images. IEEE Trans. Med. Imaging 2015, 34, 1797–1807. [Google Scholar] [CrossRef] [Green Version]
- Yan, Z.; Yang, X.; Cheng, K.T. Joint Segment-Level and Pixel-Wise Losses for Deep Learning Based Retinal Vessel Segmentation. IEEE Trans. Bio-Med. Eng. 2018, 65, 1912–1923. [Google Scholar] [CrossRef]
- Thangaraj, S.; Periyasamy, V.; Balaji, R. Retinal vessel segmentation using neural network. IET Image Process. 2018, 12, 669–678. [Google Scholar] [CrossRef]
- Soomro, T.A.; Ali, A.; Jandan, N.A.; Afifi, A.J.; Irfan, M.; Alqhtani, S.; Glowacz, A.; Alqahtani, A.; Tadeusiewicz, R.; Kantoch, E.; et al. Impact of Novel Image Preprocessing Techniques on Retinal Vessel Segmentation. Electronics 2021, 10, 2297. [Google Scholar] [CrossRef]
- Mendonca, A.; Campilho, A. Segmentation of retinal blood vessels by combining the detection of centerlines and morphological reconstruction. IEEE Trans. Med. Imaging 2006, 25, 1200–1213. [Google Scholar] [CrossRef]
- Martinez-Perez, M.E.; Hughes, A.D.; Thom, S.A.; Bharath, A.A. Segmentation of blood vessels from red-free and fluorescein retinal images. Med. Image Anal. 2007, 11, 47–61. [Google Scholar] [CrossRef]
- Lupas, C.A.; Tegolo, D.; Trucco, E. Retinal Vessel Segmentation Using AdaBoost. IEEE Trans. Inf. Technol. Biomed. 2010, 14, 1267–1274. [Google Scholar] [CrossRef]
- Palomera-Perez, M.A.; Martinez-Perez, M.E.; Benitez-Perez, H.; Ortega-Arjona, J.L. Parallel Multiscale Feature Extraction and Region Growing: Application in Retinal Blood Vessel Detection. IEEE Trans. Inf. Technol. Biomed. 2010, 14, 500–506. [Google Scholar] [CrossRef]
- Fraz, M.M.; Remagnino, P.; Hoppe, A.; Uyyanonvara, B.; Rudnicka, A.R.; Owen, C.G.; Barman, S.A. An ensemble classification-based approach applied to retinal blood vessel segmentation. IEEE Trans. Biomed. Eng. 2012, 59, 2538–2548. [Google Scholar] [CrossRef]
- Orlando, J.I.; Blaschko, M. Learning fully-connected CRFs for blood vessel segmentation in retinal images. In Medical Image Computing and Computer-Assisted Intervention; Springer: Cham, Switzerland, 2014; Volume 17, pp. 634–641. [Google Scholar]
- Yin, X.; Ng, B.W.H.; He, J.; Zhang, Y.; Abbott, D. Accurate Image Analysis of the Retina Using Hessian Matrix and Binarisation of Thresholded Entropy with Application of Texture Mapping. PLoS ONE 2014, 9, 1–17. [Google Scholar] [CrossRef] [Green Version]
- Roychowdhury, S.; Koozekanani, D.D.; Parhi, K.K. Blood Vessel Segmentation of Fundus Images by Major Vessel Extraction and Subimage Classification. IEEE J. Biomed. Health Inform. 2015, 19, 1118–1128. [Google Scholar]
- Melinscak, M.; Prentasic, P.; Loncaric, S. Retinal Vessel Segmentation Using Deep Neural Networks. In Proceedings of the 10th International Conference on Computer Vision Theory and Applications (VISAPP-2015), Berlin, Germany, 11 March–14 March 2015; pp. 577–582. [Google Scholar]
- Annunziata, R.; Garzelli, A.; Ballerini, L.; Mecocci, A.; Trucco, E. Leveraging Multiscale Hessian-Based Enhancement with a Novel Exudate Inpainting Technique for Retinal Vessel Segmentation. IEEE J. Biomed. Health Inform. 2016, 20, 1129–1138. [Google Scholar] [CrossRef]
- Li, Q.; Feng, B.; Xie, L.; Liang, P.; Zhang, H.; Wang, T. A Cross-Modality Learning Approach for Vessel Segmentation in Retinal Images. IEEE Trans. Med. Imaging 2016, 35, 109–118. [Google Scholar] [CrossRef]
- Soomro, T.A.; Khan, M.A.U.; Gao, J.; Khan, T.M.; Paul, M.; Mir, N. Automatic Retinal Vessel Extraction Algorithm. In Proceedings of the International Conference on Digital Image Computing: Techniques and Applications (DICTA), Gold Coast, QLD, Australia, 30 November–2 December 2016; pp. 1–8. [Google Scholar] [CrossRef]
- Khan, T.M.; Khan, M.A.; Kong, Y.; Kittaneh, O. Stopping criterion for linear anisotropic image diffusion: A fingerprint image enhancement case. Eurasip J. Image Video Process. 2016, 2016, 1–20. [Google Scholar] [CrossRef] [Green Version]
- Zhang, J.; Dashtbozorg, B.; Bekkers, E.; Pluim, J.P.W.; Duits, R.; ter Haar Romeny, B.M. Robust Retinal Vessel Segmentation via Locally Adaptive Derivative Frames in Orientation Scores. IEEE Trans. Med. Imaging 2016, 35, 2631–2642. [Google Scholar] [CrossRef] [Green Version]
- Orlando, J.I.; Prokofyeva, E.; Blaschko, M.B. A Discriminatively Trained Fully Connected Conditional Random Field Model for Blood Vessel Segmentation in Fundus Images. IEEE Trans. Biomed. Eng. 2017, 64, 16–27. [Google Scholar] [CrossRef]
- Ngo, L.; Han, J. Multi-level deep neural network for efficient segmentation of blood vessels in fundus images. Electron. Lett. 2017, 53, 1096–1098. [Google Scholar] [CrossRef]
- Guo, Y.; Budak, U.; Sengur, A.; Smarandache, F. A Retinal Vessel Detection Approach Based on Shearlet Transform and Indeterminacy Filtering on Fundus Images. Symmetry 2017, 9, 235. [Google Scholar] [CrossRef] [Green Version]
- Biswal, B.; Pooja, T.; Subrahmanyam, N.B. Robust retinal blood vessel segmentation using line detectors with multiple masks. IET Image Process. 2018, 12, 389–399. [Google Scholar] [CrossRef]
- Soomro, T.A.; Khan, T.M.; Khan, M.A.U.; Gao, J.; Paul, M.; Zheng, L. Impact of ICA-Based Image Enhancement Technique on Retinal Blood Vessels Segmentation. IEEE Access 2018, 6, 3524–3538. [Google Scholar] [CrossRef]
- Soomro, T.A.; Gao, J.; Lihong, Z.; Afifi, A.J.; Soomro, S.; Paul, M. Retinal Blood Vessels Extraction of Challenging Images. In Data Mining. AusDM 2018. Communications in Computer and Information Science; Springer: Singapore, 2019; Volume 996. [Google Scholar]
- Zhang, J.; Cui, Y.; Jiang, W.; Wang, L. Blood Vessel Segmentation of Retinal Images Based on Neural Network. In Lecture Notes in Computer Science; Springer: Cham, Switzerland, 2015; Volume 9218. [Google Scholar]
- Maji, D.; Santara, A.; Mitra, P.; Sheet, D. Ensemble of Deep Convolutional Neural Networks for Learning to Detect Retinal Vessels in Fundus Images. arXiv 2016, arXiv:1603.04833. [Google Scholar]
- Liskowski, P.; Krawiec, K. Segmenting Retinal Blood Vessels With Deep Neural Networks. IEEE Trans. Med. Imaging 2016, 35, 2369–2380. [Google Scholar] [CrossRef]
- Fu, H.; Xu, Y.; Lin, S.; Kee Wong, D.W.; Liu, J. DeepVessel: Retinal Vessel Segmentation via Deep Learning and Conditional Random Field. In Lecture Notes in Computer Science; Springer: Cham, Switzerland, 2016; Volume 9901, pp. 132–139. [Google Scholar]
- Wu, A.; Xu, Z.; Gao, M.; Buty, M.; Mollura, D.J. Deep vessel tracking: A generalized probabilistic approach via deep learning. In Proceedings of the IEEE 13th International Symposium on Biomedical Imaging (ISBI), Prague, Czech Republic, 13–16 April 2016; pp. 1363–1367. [Google Scholar]
- Yao, Z.; Zhang, Z.; Xu, L.-Q. Convolutional Neural Network for Retinal Blood Vessel Segmentation. In Proceedings of the 9th International Symposium on Computational Intelligence and Design (ISCID), Hangzhou, China, 10–11 December 2016; pp. 406–409. [Google Scholar]
- Maninis, K.K.; Pont-Tuset, J.; Arbeláez, P.; Van Gool, L. Deep Retinal Image Understanding. In Lecture Notes in Computer Science; Springer: Cham, Switzerland, 2016; Volume 9901, pp. 140–148. [Google Scholar]
- Tan, J.H.; Acharya, U.R.; Bhandary, S.V.; Chua, K.C.; Sivaprasad, S. Segmentation of optic disc, fovea and retinal vasculature using a single convolutional neural network. J. Comput. Sci. 2017, 20, 70–79. [Google Scholar] [CrossRef] [Green Version]
- Frucci, M.; Riccio, D.; Sanniti di Baja, G.; Serino, L. Direction-Based Segmentation of Retinal Blood Vessels. In Lecture Notes in Computer Science; Springer: Cham, Switzerland, 2017; Volume 10125, pp. 1–9. [Google Scholar]
- Song, J.; Lee, B. Development of automatic retinal vessel segmentation method in fundus images via convolutional neural networks. In Proceedings of the 39th Annual International Conference of the IEEE Engineering in Medicine and Biology Society (EMBC), Jeju, Republic of Korea, 11–15 July 2017; pp. 681–684. [Google Scholar]
- Soomro, T.A.; Afifi, A.J.; Gao, J.; Hellwich, O.; Khan, M.A.; Paul, M.; Zheng, L. Boosting Sensitivity of a Retinal Vessel Segmentation Algorithm with Convolutional Neural Network. In Proceedings of the International Conference on Digital Image Computing: Techniques and Applications (DICTA), Sydney, NSW, Australia, 29 November–1 December 2017; pp. 1–8. [Google Scholar]
- Guo, Y.; Budak, Ü.; Şengur, A. A novel retinal vessel detection approach based on multiple deep convolution neural networks. Comput. Methods Programs Biomed. 2018, 167, 43–48. [Google Scholar] [CrossRef]
- Brancati, N.; Frucci, M.; Gragnaniello, D.; Riccio, D. Retinal Vessels Segmentation Based on a Convolutional Neural Network. In Lecture Notes in Computer Science; Springer: Cham, Switzerland, 2018; Volume 10657, pp. 119–126. [Google Scholar]
- Soomro, T.A.; Afifi, A.J.; Gao, J.; Hellwich, O.; Paul, M.; Zheng, L. Strided U-Net Model: Retinal Vessels Segmentation using Dice Loss. In Proceedings of the Digital Image Computing: Techniques and Applications (DICTA), Canberra, ACT, Australia, 10–13 December 2018; pp. 1–8. [Google Scholar]
- Wang, C.; Zhao, Z.; Ren, Q.; Xu, Y.; Yu, Y. Dense U-net Based on Patch-Based Learning for Retinal Vessel Segmentation. Entropy 2019, 21, 168. [Google Scholar] [CrossRef] [Green Version]
- Mahapatra, S.; Agrawal, S.; Mishro, P.K.; Pachori, R.B. A novel framework for retinal vessel segmentation using optimal improved frangi filter and adaptive weighted spatial FCM. Comput. Biol. Med. 2022, 147, 105770. [Google Scholar] [CrossRef]
Figure 1.
Proposed methods for the impact of image coherence schemes for segmentation of retinal blood vessels.
Figure 1.
Proposed methods for the impact of image coherence schemes for segmentation of retinal blood vessels.
Figure 2.
Retinal Image Conversion (a) Red (b) Green and (c) Blue, channels images.
Figure 2.
Retinal Image Conversion (a) Red (b) Green and (c) Blue, channels images.
Figure 3.
RGB Images Inversion (a) Inverted Red-Channel (b) Inverted Green-Channel (c) Inverted Blue-Channel.
Figure 3.
RGB Images Inversion (a) Inverted Red-Channel (b) Inverted Green-Channel (c) Inverted Blue-Channel.
Figure 4.
Morphological THBH method for irregular illuminations (a) Red (b) Green and (c) Blue, Channels THBH.
Figure 4.
Morphological THBH method for irregular illuminations (a) Red (b) Green and (c) Blue, Channels THBH.
Figure 5.
PCA Conversion Model.
Figure 5.
PCA Conversion Model.
Figure 6.
PCA Green channel Histogram and Morphological operation Green channel Histogram Comparison (a) Green channel histogram of morphological operation (b) Histogram of the PCA Green channel.
Figure 6.
PCA Green channel Histogram and Morphological operation Green channel Histogram Comparison (a) Green channel histogram of morphological operation (b) Histogram of the PCA Green channel.
Figure 7.
Oriented Diffusion Output. (a) Comparison of Oriented Diffusion Red Channel output on other Oriented Diffusion filtering Schemes (b) Comparison of Oriented Diffusion Green Channel output on other Oriented Diffusion filtering Schemes (c) Comparison of Oriented Diffusion Blue Channel output on other Oriented Diffusion filtering Schemes.
Figure 8.
The histogram denoted two thresholds, as two vertical lines. The is calculated by subtracting 0.9 SD from the mean magnitude of the image histogram, while the is calculated by employing the average magnitude of the histogram based on edge.
Figure 8.
The histogram denoted two thresholds, as two vertical lines. The is calculated by subtracting 0.9 SD from the mean magnitude of the image histogram, while the is calculated by employing the average magnitude of the histogram based on edge.
Figure 9.
The post-processing module’s output. (a) mask (b) marker (c) image morphologically rebuilt and (d) retinal vessels’ ultimate binary or segmented image.
Figure 9.
The post-processing module’s output. (a) mask (b) marker (c) image morphologically rebuilt and (d) retinal vessels’ ultimate binary or segmented image.
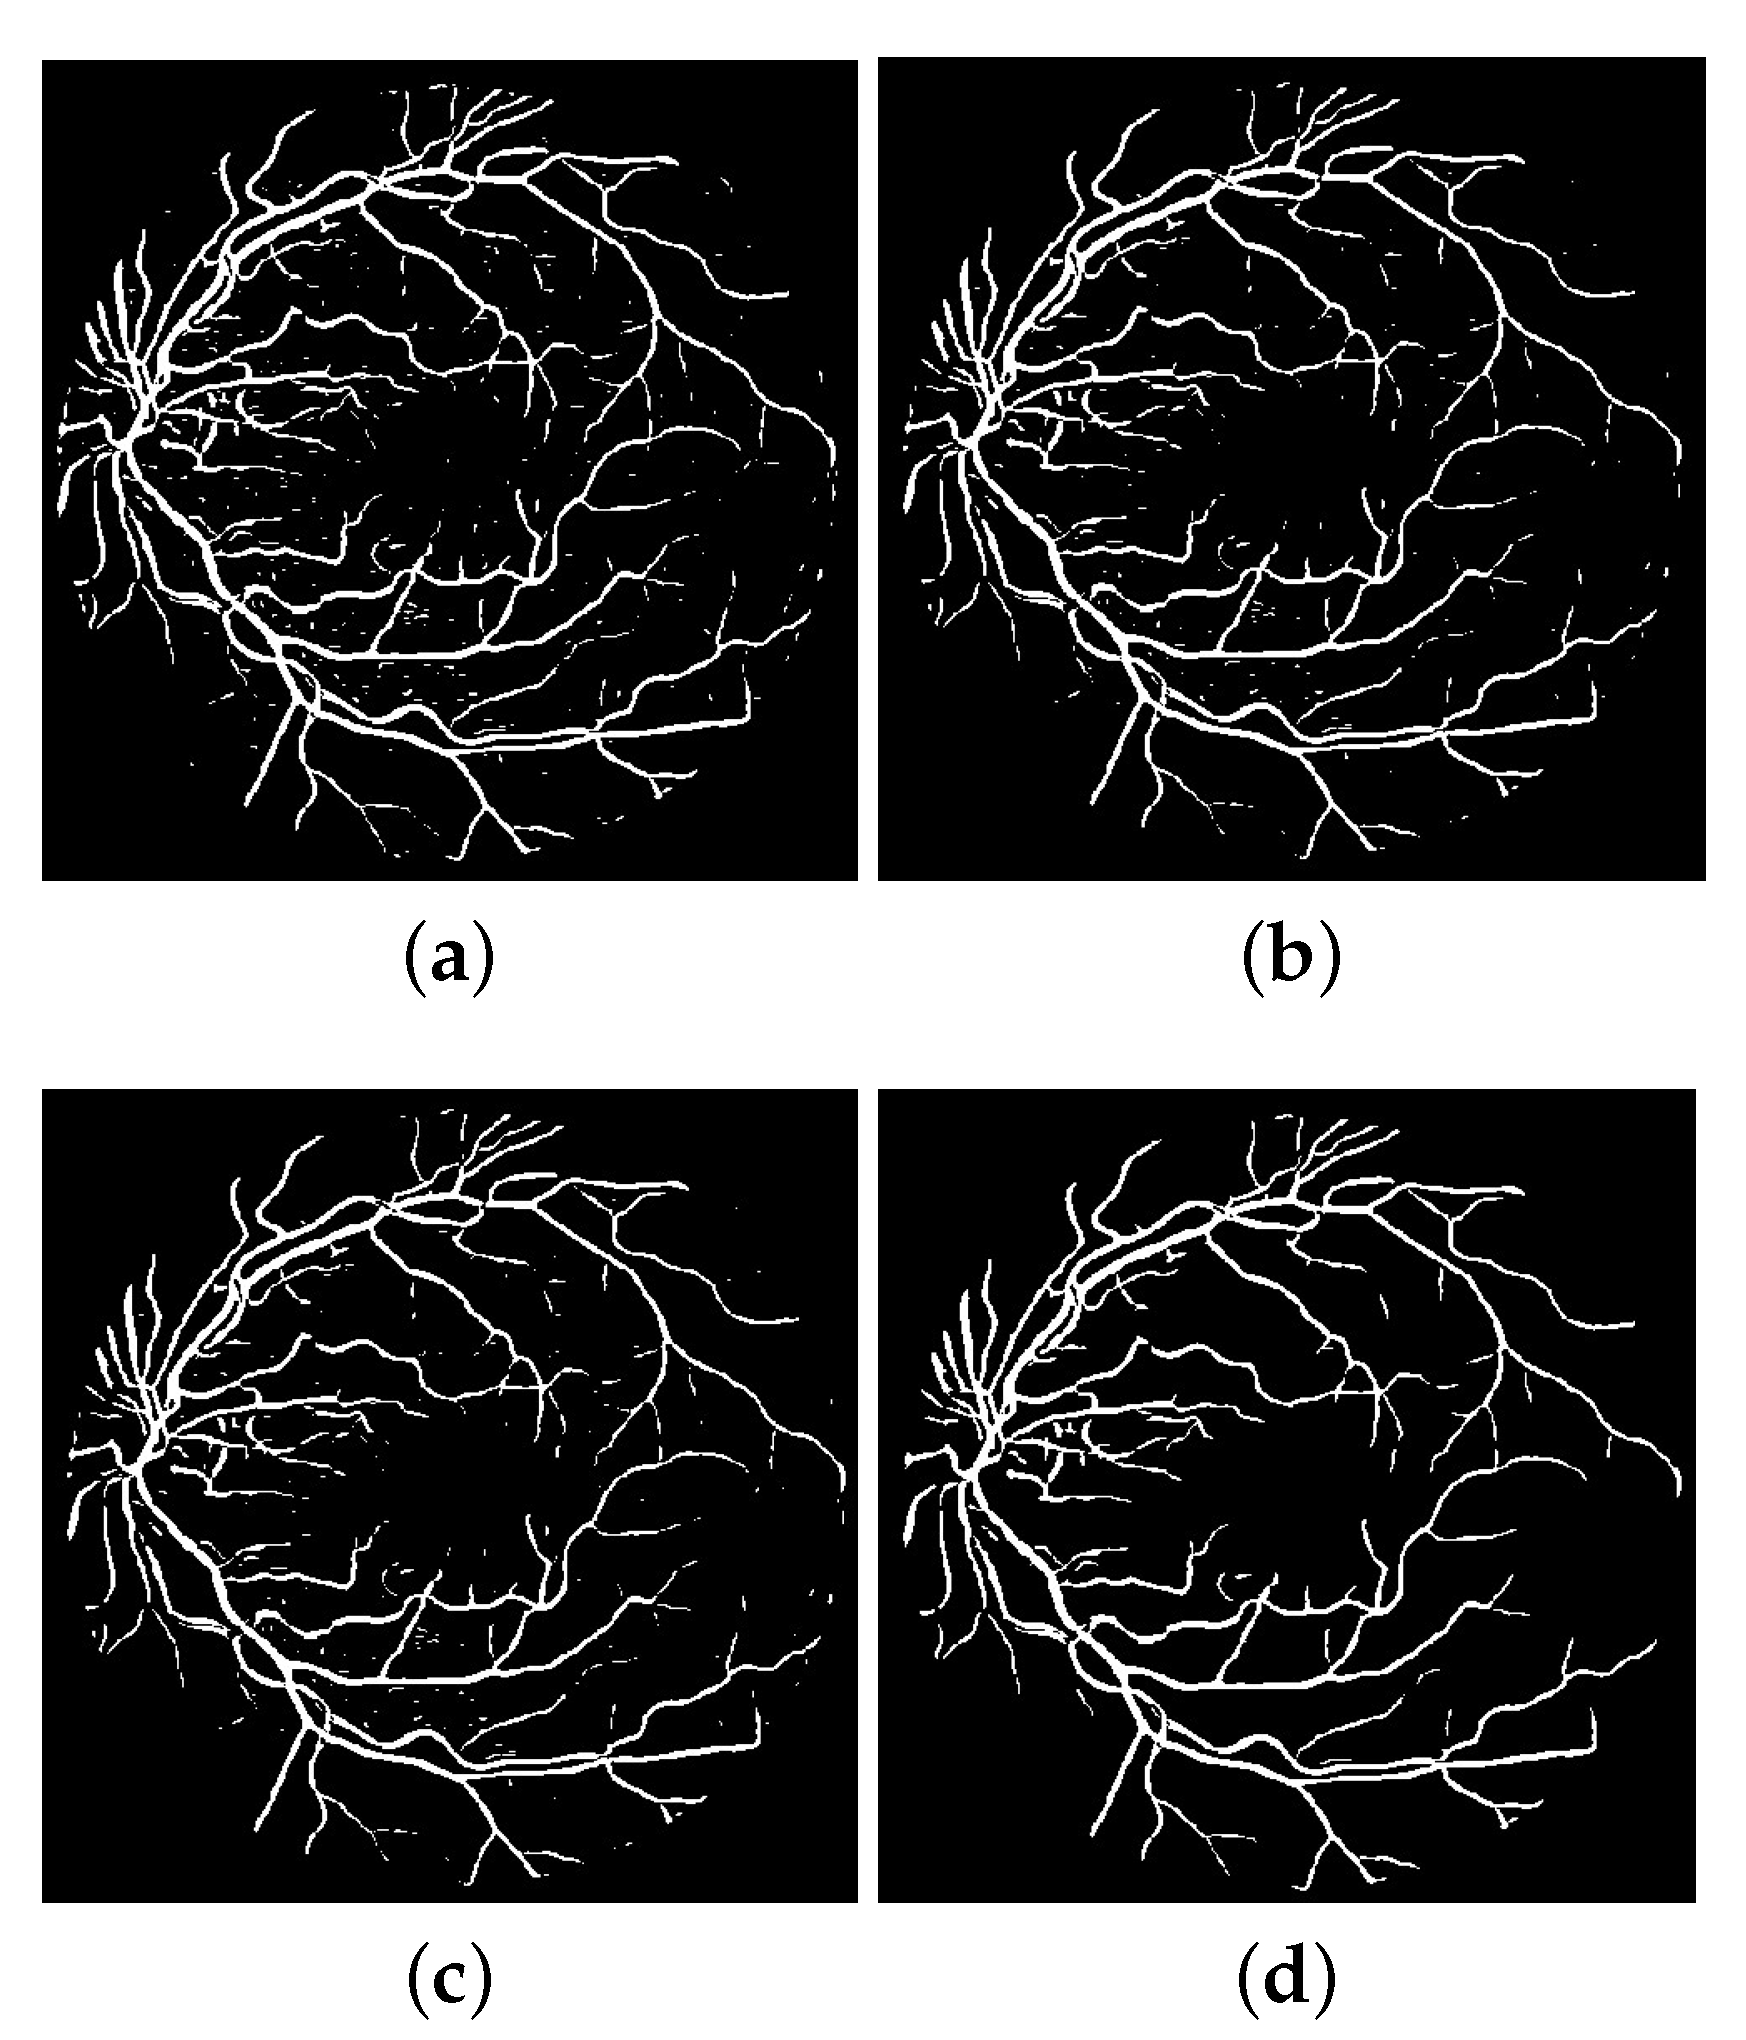
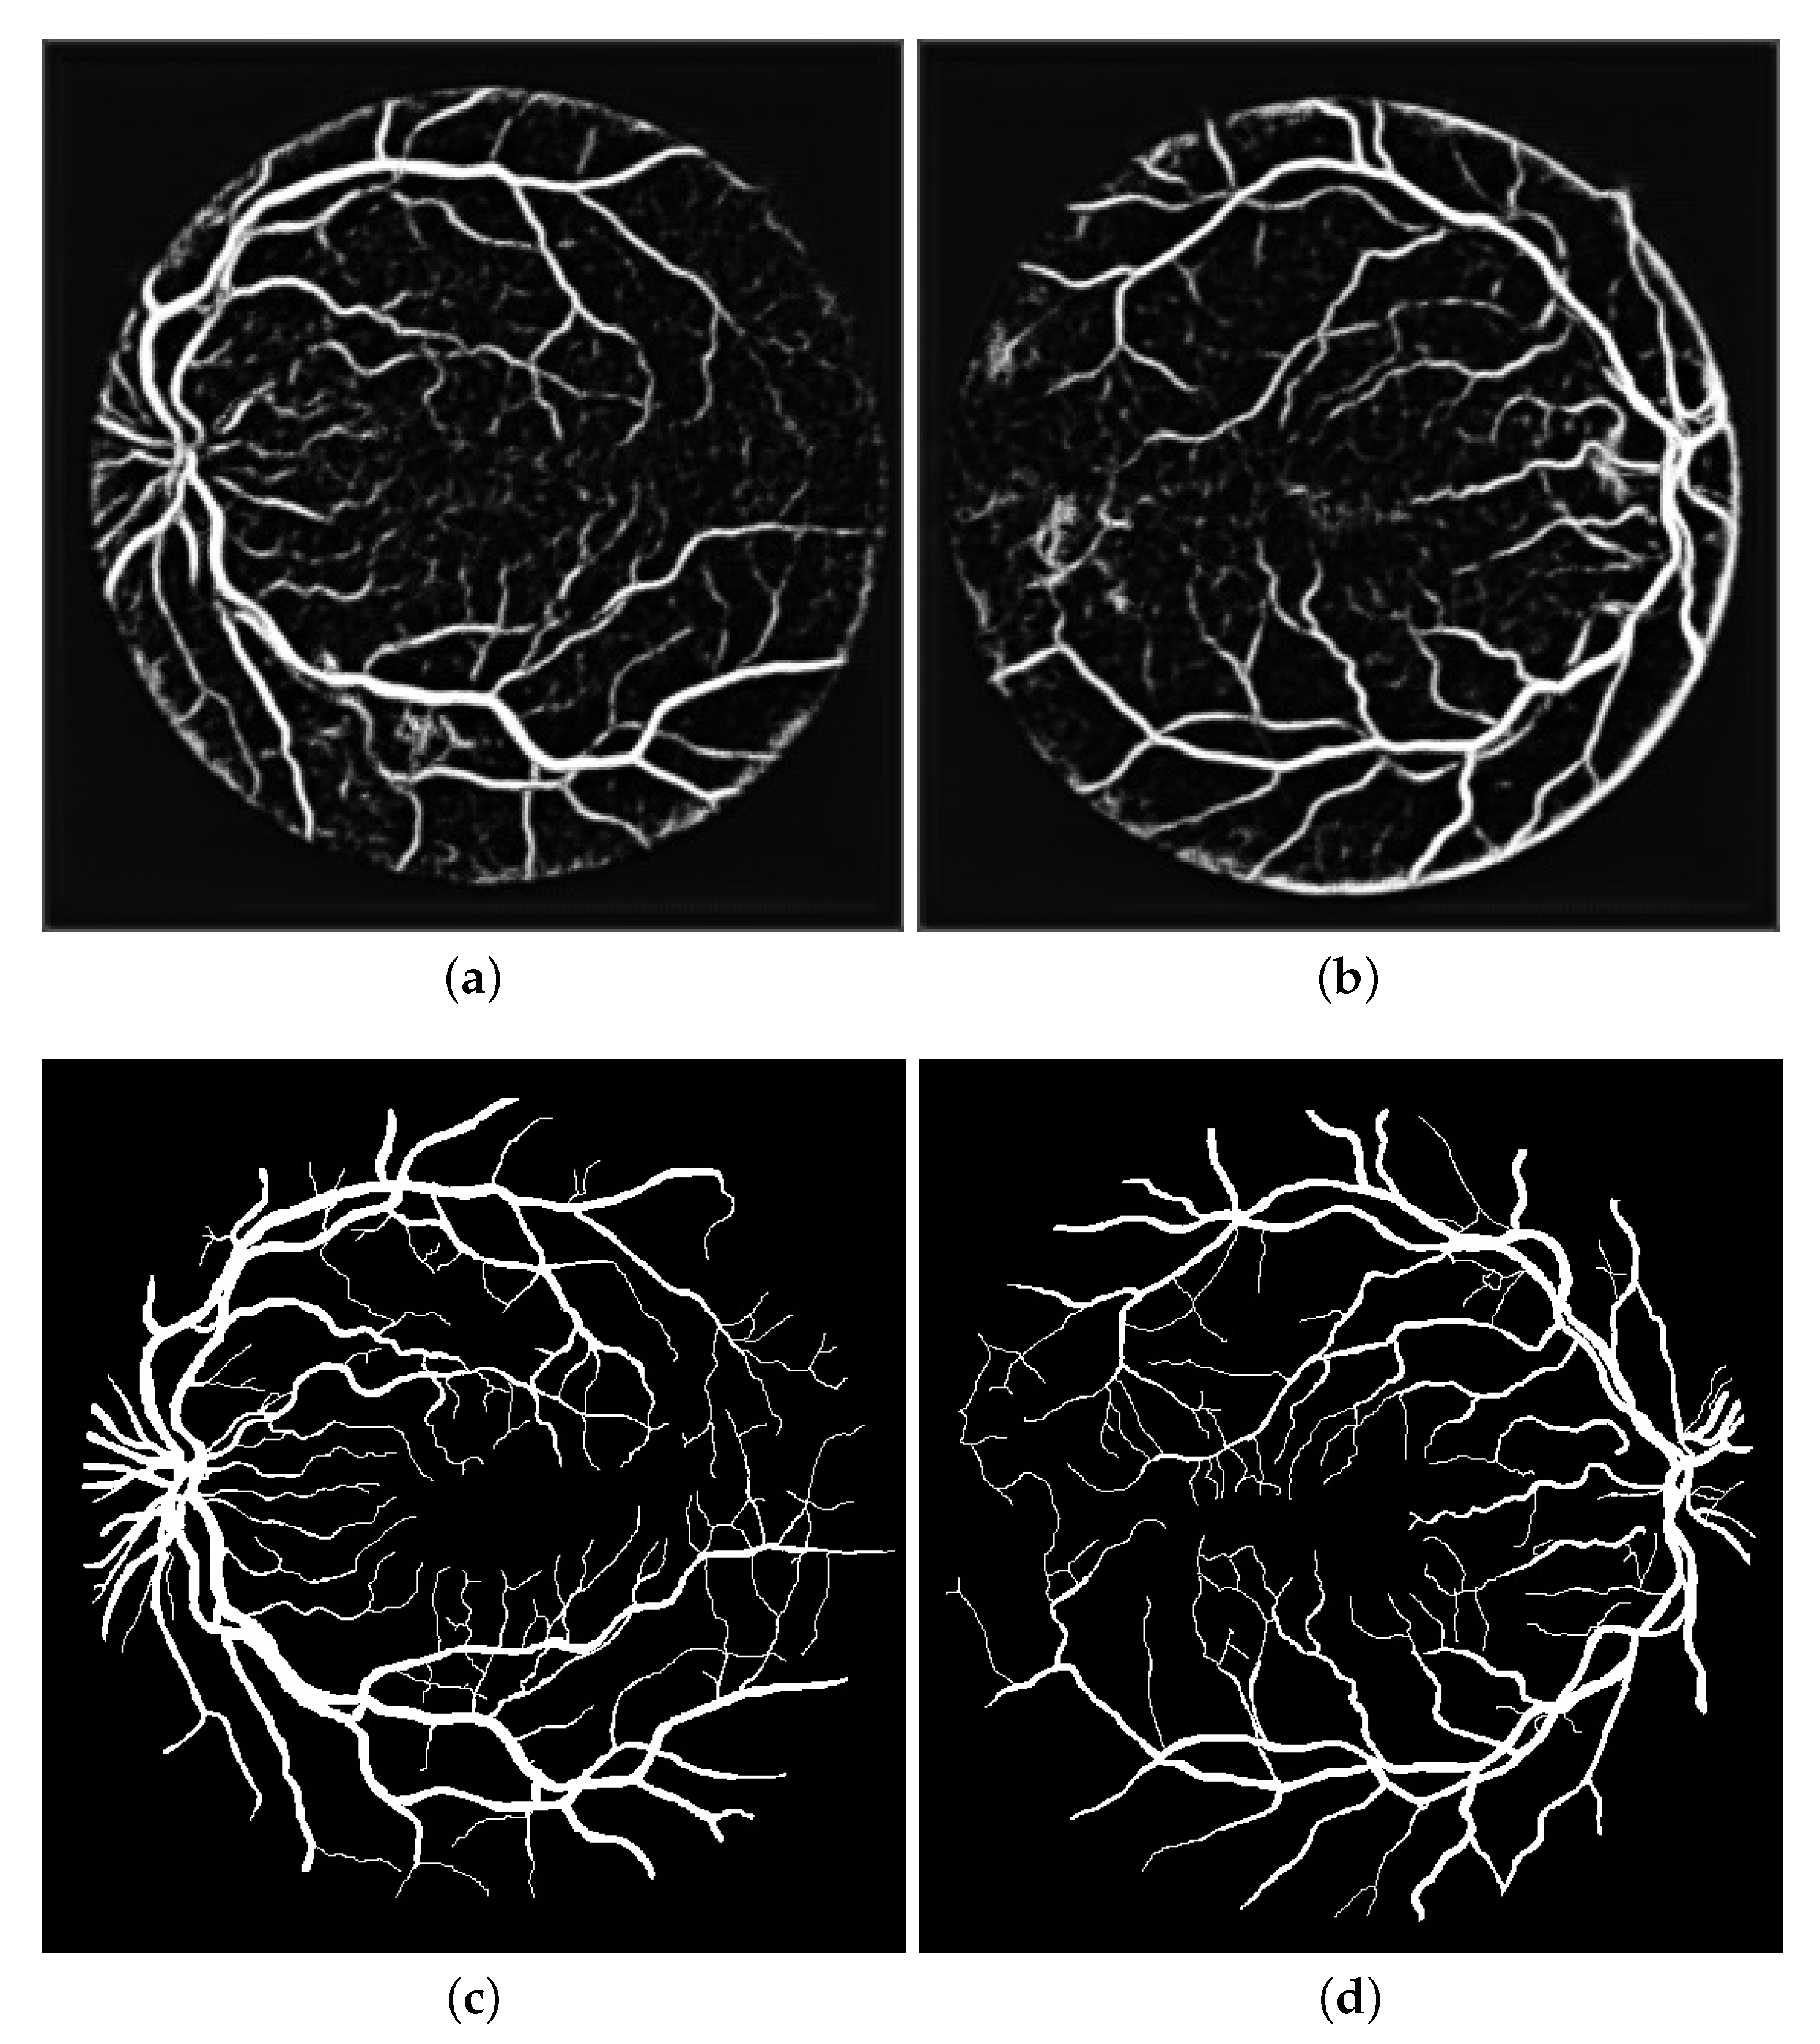
Figure 10.
Analysis of vessels observation of pathological images. Fig (a) and Fig (b) represent the final vessel images of our proposed method. Fig (c) and Fig (d) represent ground truth images.
Figure 10.
Analysis of vessels observation of pathological images. Fig (a) and Fig (b) represent the final vessel images of our proposed method. Fig (c) and Fig (d) represent ground truth images.
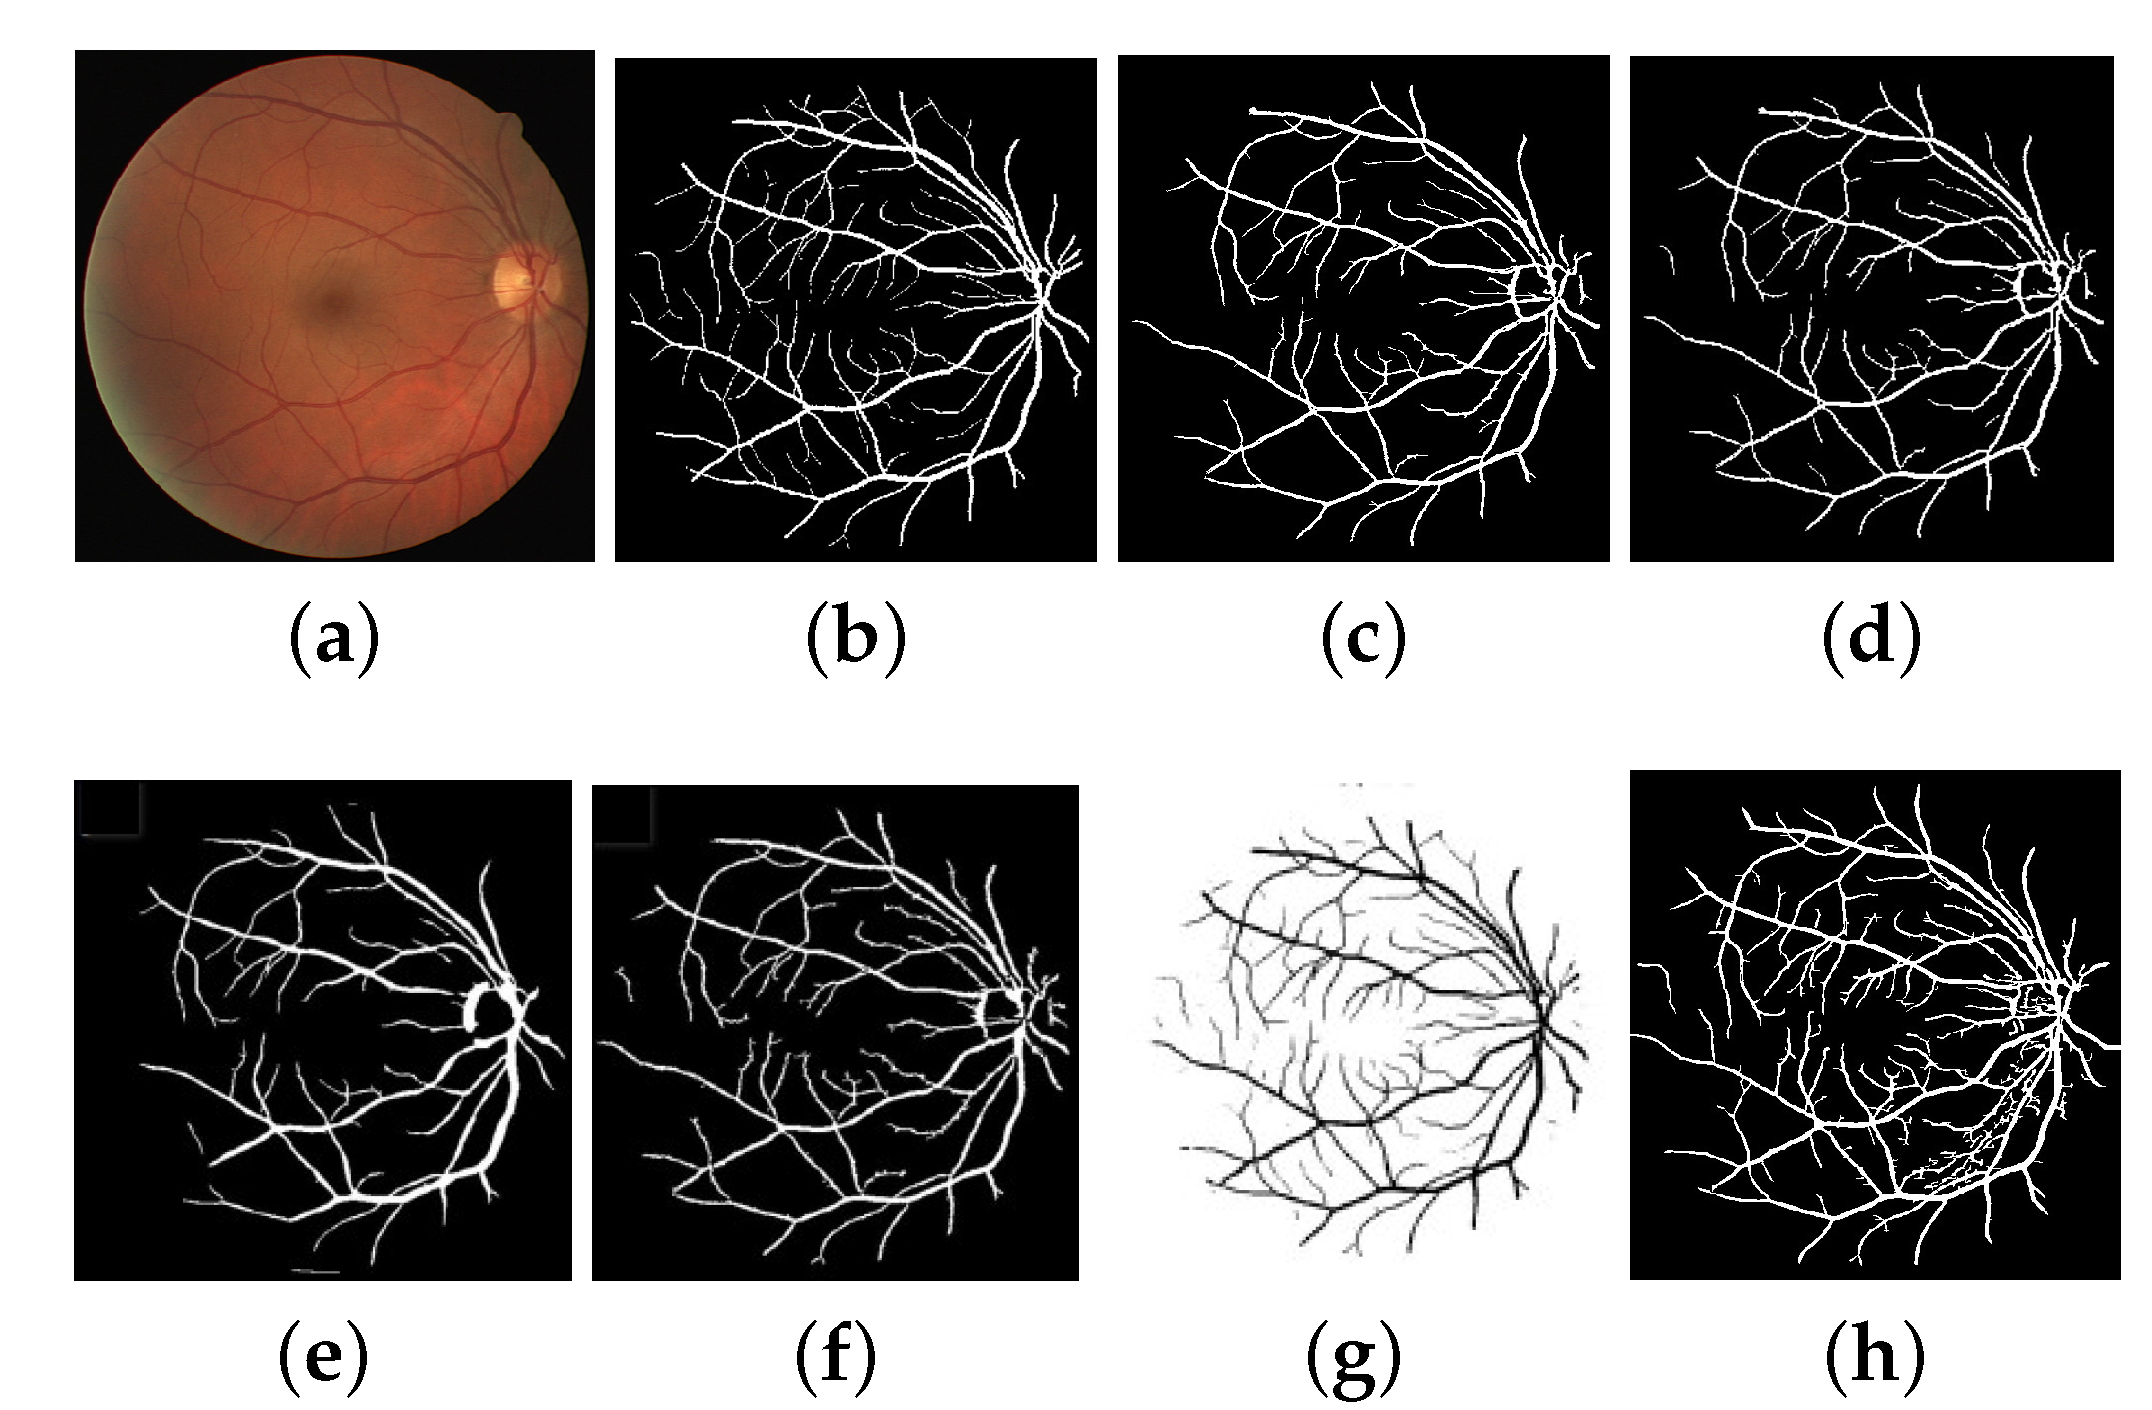
Figure 11.
This figure shows the comparative analysis of the detection of tiny vessels from a retinal image with our proposed method. Fig (a) shows the original image. Fig (b) shows the manually segmented image. Fig (c) shows the output image of Nuygen’s method. Fig (d) shows the output image of Hou’s method. Fig (e) shows the output image of Zhao’s method based on filtering. Fig (f) shows the output image of Zhao’s method based on wavelet transform filtering. Fig (g) shows the output image of Yan’s method based on filtering. Fig (h) shows the output image of the proposed method.
Table 1.
Performance Evaluations on the STARE and DRIVE Datasets.
Table 1.
Performance Evaluations on the STARE and DRIVE Datasets.
| Database | | | |
|---|
| STARE | 0.811 | 0.959 | 0.954 |
| DRIVE | 0.821 | 0.962 | 0.961 |
Table 2.
The Post-processing Module’s Impact.
Table 2.
The Post-processing Module’s Impact.
| Technique | Without Coherence Retinal Vessels | With Coherence Retinal Vessels |
|---|
| Database | SE | SP | AC | SE | SP | AC |
|---|
| STARE | 0.341 | 0.372 | 0.316 | 0.798 | 0.949 | 0.947 |
| DRIVE | 0.332 | 0.391 | 0.326 | 0.807 | 0.951 | 0.951 |
Table 3.
The Impact of a Post-processing Module on Previous Techniques: DRIVE Dataset.
Table 3.
The Impact of a Post-processing Module on Previous Techniques: DRIVE Dataset.
| Technique | Performance | With Coherence Retinal Vessels |
|---|
| Method | SE | SP | AC | SE | SP | AC |
|---|
| [31] | 0.735 | 0.969 | 0.941 | 0.797 | 0.953 | 0.939 |
| [30] | - | - | 0.940 | 0.805 | 0.949 | 0.941 |
Table 4.
The Impact of a Post-processing Module on Previous Techniques: DSTARE Dataset.
Table 4.
The Impact of a Post-processing Module on Previous Techniques: DSTARE Dataset.
| Technique | Performance | With Coherence Retinal Vessels |
|---|
| Method | SE | SP | AC | SE | SP | AC |
|---|
| [31] | 0.734 | 0.965 | 0.933 | 0.783 | 0.957 | 0.953 |
| [30] | - | - | 0.932 | 0.781 | 0.939 | 0.942 |
Table 5.
Analysis of Performance on Challenging images.
Table 5.
Analysis of Performance on Challenging images.
| Database | SE | SP | AC |
|---|
| STARE | 0.799 | 0.951 | 0.938 |
| DRIVE | 0.809 | 0.953 | 0.941 |
Table 6.
Observation of Performance on Pathological Images.
Table 6.
Observation of Performance on Pathological Images.
| Database | SE | SP | AC | AUC |
|---|
| DRIVE | 0.803 | 0.952 | 0.957 | 0.873 |
| STARE | 0.794 | 0.949 | 0.941 | 0.852 |
Table 7.
Comparison of Proposed Method with Existing Methods.
Table 7.
Comparison of Proposed Method with Existing Methods.
| Database | DRIVE | STARE |
|---|
| Methods | Time | SE | SP | AC | AUC | Time | SE | SP | AC | AUC |
|---|
| [23] | - | - | - | 0.946 | - | - | - | - | 0.951 | - |
| [18] | - | - | - | 0.946 | - | - | - | - | 0.948 | - |
| [36] | - | 0.734 | 0.976 | 0.945 | 0.855 | - | 0.699 | 0.973 | 0.944 | 0.836 |
| [37] | - | 0.724 | 0.965 | 0.934 | 0.845 | - | 0.750 | 0.956 | 0.941 | 0.853 |
| [24] | - | 0.728 | 0.955 | - | 0.842 | - | 0.752 | 0.968 | - | 0.860 |
| [38] | - | 0.720 | - | 0.959 | - | - | - | - | - | - |
| [39] | - | 0.66 | 0.961 | 0.922 | 0.811 | - | 0.779 | 0.940 | 0.924 | 0.860 |
| [21] | - | 0.741 | 0.975 | 0.943 | 0.858 | - | 0.726 | 0.975 | 0.949 | 0.851 |
| [19] | - | 0.706 | 0.980 | 0.945 | 0.843 | - | 0.694 | 0.981 | 0.952 | 0.838 |
| [40] | - | 0.741 | 0.981 | 0.948 | 0.974 | - | 0.754 | 0.973 | 0.953 | 0.977 |
| [30] | - | - | - | 0.940 | - | - | - | - | 0.932 | - |
| [31] | - | 0.735 | 0.969 | 0.941 | 0.961 | - | 0.734 | 0.965 | 0.933 | 0.957 |
| [41] | - | 0.785 | 0.967 | - | - | - | - | - | 0.951 | - |
| [42] | - | - | - | 0.947 | - | - | - | - | - | - |
| [43] | - | 0.725 | 0.983 | 0.952 | 0.962 | - | 0.772 | 0.973 | 0.951 | 0.969 |
| [44] | - | - | - | 0.946 | 0.974 | - | - | - | - | - |
| [45] | - | - | - | - | - | - | 0.713 | 0.984 | 0.956 | 0.965 |
| [46] | - | 0.756 | 0.981 | 0.952 | 0.974 | - | 0.773 | 0.984 | 0.962 | 0.987 |
| [32] | - | 0.716 | 0.978 | 0.944 | 0.848 | - | 0.776 | 0.954 | 0.943 | 0.865 |
| [47] | 90 s | 0.713 | 0.968 | 0.941 | 0.841 | 91 s | 0.711 | 0.965 | 0.942 | 0.838 |
| [48] | 93 s | 0.734 | 0.967 | 0.951 | 0.850 | 95 s | 0.736 | 0.971 | 0.95 | 0.853 |
| [49] | - | 0.743 | 0.976 | 0.947 | 0.952 | - | 0.767 | 0.976 | 0.954 | 0.961 |
| [50] | - | 0.789 | 0.968 | - | - | - | 0.768 | 0.973 | - | - |
| [51] | - | 0.746 | 0.984 | 0.953 | 0.975 | - | - | - | - | - |
| [52] | - | - | - | - | 0.947 | - | - | - | - | 0.946 |
| [34] | - | 0.801 | 0.975 | 0.961 | 0.888 | - | 0.834 | 0.953 | 0.944 | 0.894 |
| [53] | - | 0.71 | 0.97 | 0.95 | - | - | 0.70 | 0.97 | 0.95 | - |
| [54] | 87 s | 0.752 | 0.976 | 0.953 | - | 89 s | 0.786 | 0.982 | 0.967 | - |
| [55] | 86 s | 0.745 | 0.962 | 0.948 | - | 89 s | 0.784 | 0.976 | 0.951 | - |
| [35] | 80 s | 0.812 | 0.971 | 0.963 | 0.951 | 81 s | 0.809 | 0.969 | 0.958 | 0.949 |
| Proposed Method | 920 ms | 0.821 | 0.962 | 0.961 | 0.967 | 925 ms | 0.811 | 0.959 | 0.954 | 0.966 |
Table 8.
Comparison of Proposed Segmentation Methods with CNN-Based learning methods.
Table 8.
Comparison of Proposed Segmentation Methods with CNN-Based learning methods.
| Database | DRIVE | STARE |
|---|
| Methods | Time | SE | SP | AC | AUC | Time | SE | SP | AC | AUC |
|---|
| [56] | 20 s | - | - | 0.940 | - | - | - | - | - | - |
| [57] | - | - | - | 0.947 | - | - | - | - | - | - |
| [58] | - | - | - | 0.949 | 0.973 | - | - | - | 0.949 | 0.982 |
| [59] | - | 0.760 | - | 0.952 | - | - | 0.741 | - | 0.958 | - |
| [60] | - | - | - | - | 0.97 | - | - | - | - | - |
| [61] | - | 0.773 | 0.960 | 0.936 | - | - | - | - | - | - |
| [62] | 90 s | - | - | - | 0.822 | - | - | - | - | 0.831 |
| [63] | - | 0.753 | 0.969 | 0.926 | - | - | - | - | - | - |
| [64] | - | 0.660 | 0.985 | 0.956 | - | - | - | - | - | - |
| [65] | 0.75 | 0.979 | 0.949 | - | - | - | - | - | - | - |
| [66] | - | 0.746 | 0.917 | 0.948 | 0.831 | - | 0.748 | 0.922 | 0.947 | 0.835 |
| [67] | - | - | - | - | 0.965 | - | - | - | - | - |
| [68] | - | 0.742 | 0.982 | 0.954 | - | - | - | - | - | - |
| [33] | - | 0.765 | 0.981 | 0.954 | 0.975 | - | 0.758 | 0.984 | 0.961 | 0.981 |
| [69] | - | 0.739 | 0.956 | 0.948 | 0.844 | - | 0.748 | 0.962 | 0.947 | 0.855 |
| [70] | - | 0.798 | 0.973 | 0.951 | 0.974 | - | 0.791 | 0.972 | 0.953 | 0.970 |
| [71] | - | 0.702 | 0.984 | 0.965 | - | - | 0.731 | 0.995 | 0.957 | - |
| Proposed Method | 920 ms | 0.821 | 0.962 | 0.961 | 0.967 | 925 ms | 0.811 | 0.959 | 0.954 | 0.966 |
| Disclaimer/Publisher’s Note: The statements, opinions and data contained in all publications are solely those of the individual author(s) and contributor(s) and not of MDPI and/or the editor(s). MDPI and/or the editor(s) disclaim responsibility for any injury to people or property resulting from any ideas, methods, instructions or products referred to in the content. |
© 2023 by the authors. Licensee MDPI, Basel, Switzerland. This article is an open access article distributed under the terms and conditions of the Creative Commons Attribution (CC BY) license (https://creativecommons.org/licenses/by/4.0/).


 ,
, 


