
Recommendation of Music Based on DASS-21 (Depression, Anxiety, Stress Scales) Using Fuzzy Clustering

1
Department of IT Semiconductor Convergence Engineering, Tech University of Korea, Siheung 15073, Republic of Korea
2
CONNECTWELL Co., Ltd., Seongnam 13449, Republic of Korea
3
Department of Design Engineering, Tech University of Korea, Siheung 15073, Republic of Korea
4
Department of Computer Engineering, Tech University of Korea, Siheung 15073, Republic of Korea
*
Author to whom correspondence should be addressed.
Electronics 2023, 12(1), 168; https://doi.org/10.3390/electronics12010168
Submission received: 25 November 2022
/
Revised: 22 December 2022
/
Accepted: 26 December 2022
/
Published: 30 December 2022
(This article belongs to the Special Issue Application Research Using AI, IoT, HCI, and Big Data Technologies)
Abstract
:The present study proposes a music recommendation service in a mobile environment using the DASS-21 questionnaire to distinguish and measure certain psychological state instability symptoms—viz. anxiety, depression, and stress—that anyone can experience regardless of job or age. In general, the outcome of the DASS-21 from almost every participant did not reveal any single psychological state out of the abovementioned three states. Therefore, the weighted scores were calculated for each scale and fuzzy clustering was used to cluster users into groups with similar states. For the initial dataset’s generation, we used the DASS inventory collected from the Open-Source Psychometrics Project conducted from 2017 to 2019 on approximately 39,000 respondents, and the results of the survey showed that the average scores for each scale were 23.6 points for depression, 17.4 for anxiety, and 23.3 for stress. Based on the datasets collected from fuzzy clustering, the individuals were classified into three groups: Group 1 was recommended with music for “high” depression, “high” anxiety, and “low” stress; Group 2 was recommended with music for “normal” depression, “low” anxiety, and “normal” stress; and Group 3 was recommended with music for “high” depression, “high” anxiety, and “high” stress. Especially, the largest numbers of recommended music in the three groups were for Group 1 with “High” depressive (4.64), Group 2 for “Low” anxiety (4.54), and Group 3 for “High” anxiety (4.76). In addition, to compare the results of fuzzy clustering with other data, the silhouette coefficient of the samples extracted with the same severity ratio and those generated by simple random sampling were 0.641 and 0.586, respectively, which were greater than 0. The proposed service can recommend not only the music of users with similar trends at all psychological states, but also the music of users with similar psychological states in part.
1. Introduction
In present days, depression and anxiety are the most common symptoms of unstable mental health worldwide. Statistics from the National Center of Mental Health reveal that approximately 62.2% of people suffer from mental health problems, such as depression, and anxiety over a year, and the percentage of people with stable mental health decreased to 46.7% [1]. Several causes for such mental health issues have been identified regardless of occupation and age, such as work overload, interpersonal relationship, and career concerns among workers, alongside increased pressure from tests or exams and concerns over high expectations of parents among college students [2,3]. However, most people who experience negative moods such as depression and anxiety often neglect their emotional problems and do not take any counseling or medical treatment thinking that their symptoms are merely some temporary psychological changes. Commonly, depression is a psychological state that causes a persistent feeling of sadness and loss of interest, and involves negative feelings of subjective unhappiness, helplessness, and disappointment. Anxiety is characterized by feelings such as tension and worried thoughts, and also physical changes such as high blood pressure. When emotional changes persist and symptoms worsen without any sign of emotional stability recovery, the daily life and health condition are negatively influenced by the feeling of helplessness, sleep disturbance, and inappetence [4,5]. Typically, stress originates due to certain external factors, such as noise and reduced convenience, and internal factors, such as negative thoughts and extreme thinking. Moreover, the stress caused by external factors intensifies when the pressure exceeds an individual’s ability to cope with it [6,7]. Since stress is associated with anxiety symptoms (restlessness, concern, worry) in its early stage and depressive symptoms with prolonged exposure to stress, its treatment becomes critical through diagnosis and assessment of psychological status toward depression, anxiety, and stress.
There are several assessment tools used in the early screening and evaluation of psychological symptoms, such as the Beck Depression Inventory to evaluate the type and severity of depression; Hamilton Anxiety Scale to assess anxiety levels; Perceived Stress Scale—a self-reporting instrument for measuring the perception and interpretation of stress in the previous month; and the Depression Anxiety Stress Scale (DASS), used for discriminating anxiety, depression, and stress. The current study used the DASS to quantitatively assess the severity of depression, anxiety, and stress. Specifically, DASS-21—a brief version of the 42-item DASS—is widely used by many investigators because of its advantages, viz. relatively short survey time and public accessibility (free of charge) [8]. The main three items of the DASS-21 are depression consisting of low positive mood; anxiety comprising physical changes, such as faster heart palpitation and anxiety; and stress including persistent tension and negative emotion [9]. The three scales of depression, anxiety, and stress contain a total of twenty-one items, with seven items per scale. The scale can measure the current emotional states of users and distinguish their emotions based on quantitative values calculated by adding the scores of the questionnaire items.
The symptoms of depression, anxiety, and stress assessed and diagnosed with the scale can be treated with pharmacological therapy using antidepressants; however, concerns exist over long-term drug use due to drug abuse, risk of side effects, and drug dependence [10]. Besides pharmacological therapy, there are also other therapeutic approaches for psychological stability, such as art therapy. This therapy promotes the understanding of self-emotional states by stimulating various senses using cognitive behavioral therapy via exercise or talk therapy provided by counselors, arts, drama, music, and other mediators. Cognitive behavioral therapy helps emotional recovery from negative emotions and behaviors by recognizing maladaptive emotions and behaviors and shifting the negative thoughts and emotions of an interpersonal relationship towards a more positive direction. However, since cognitive behavioral therapy requires cooperative interaction between counselors and counselees and voluntary involvement of the counselee, its effectiveness can be limited without voluntary participation or for those having difficulty in verbal communication [11,12]. On the other hand, art therapy has advantages of allowing counselees to freely share thoughts and open their minds by enabling the expression of emotional states, which cannot be expressed verbally, in various ways using pictures, music, motions, and other mediators [13]. Of these mediators, music therapy can be easily accessed by anyone via improvisation, music composition, and music listening, and managed by themselves without time and space constrains. Particularly, listening to preferred music can be very effective in leaving positive effects on emotional states and achieving stress relief [14,15]. Since music preference varies from person to person, many investigations have been performed to achieve stable emotional states effectively by analyzing the music preferences of people grouped according to similar emotional conditions and recommending individually tailored music [16].
Recent studies on music recommendation techniques have proposed several data mining approaches or treadmill algorithms. Hong-Yi Chang et al. (2017) suggested a new clustering algorithm called K-MeansH that can discriminate stress-relief music and provide recommendations based on personal music preferences [17]. This method can minimize outliers and noise by controlling cluster size via setting a critical value for similarity and adjusting the number of hierarchical clusters during data clustering. When comparing the number of cluster formations with regard to algorithm accuracy and data number, the newly proposed K-MeansH demonstrated better performance by approximately 71% over the K-Means algorithm and 57% over the K-Medoids. Esha Dutta (2020) proposed a music recommendation system for improved emotional states by applying a Q-learning algorithm based on the electroencephalogram (EEG) signals of users measured while they were listening to music [18]. The Q-learning assigns rewards if the emotional states show positive EEG signals between two consecutive time intervals. In this regard, the EEG signal change according to emotions between the present time (t) and the next time interval (t + 1) were compared for all music tracks. Likewise, the probability for shifting to more positive EEG signals at time t + 1 compared with those at time t will increase as this algorithm recommends music with the greatest weighted value from all the music imposed with a weighted value. However, all these past studies require a portable device for collecting physiological signals and the users were not categorized into different groups; thus, there are difficulties in recommending appropriate kind of music for various psychological states. For example, if a proposed music for improvement of depressive symptoms is not suitable for anxiety and stress relief, it may not have any fruitful effect on relieving anxiety and stress [19,20]. Therefore, an effective music recommendation system for emotional relief is necessary by determining the symptoms and severity of current emotional states and identifying the appropriate class of music.
The present study used the DASS-21 to quantitatively assess users’ current emotional states and identify severity levels of depression, anxiety, and stress. A survey was performed in the mobile environment to mitigate time and space constrains. We aimed to provide a music recommendation system to improve emotional states by proposing music preferred by users with similar emotional states based on survey scores. A fuzzy clustering algorithm was used to recommend music according to fuzzy membership degree for each group of similar users. This is because users do not remain in a single emotional state of depression, anxiety, or stress. The preferred music was recommended to similar users within a cluster and even to other users who did not belong to the same group when the measurements for different emotions were similar or one of the emotional states stood out. Our music recommendation service is expected to provide relief to the users from their depression, anxiety, and stress by accumulating data on music they listen to according to their emotional states over time. Through our proposed service, we expect our results to be utilized as foundation data for further studies to classify the negative psychological state of modern people and be aware of the current psychological state. Moreover, the contribution of this study will surely help in studies that recommend music to alleviate the negative psychological state of modern people.
2. Materials and Methods
2.1. Fuzzy Clustering for Music Recommendation
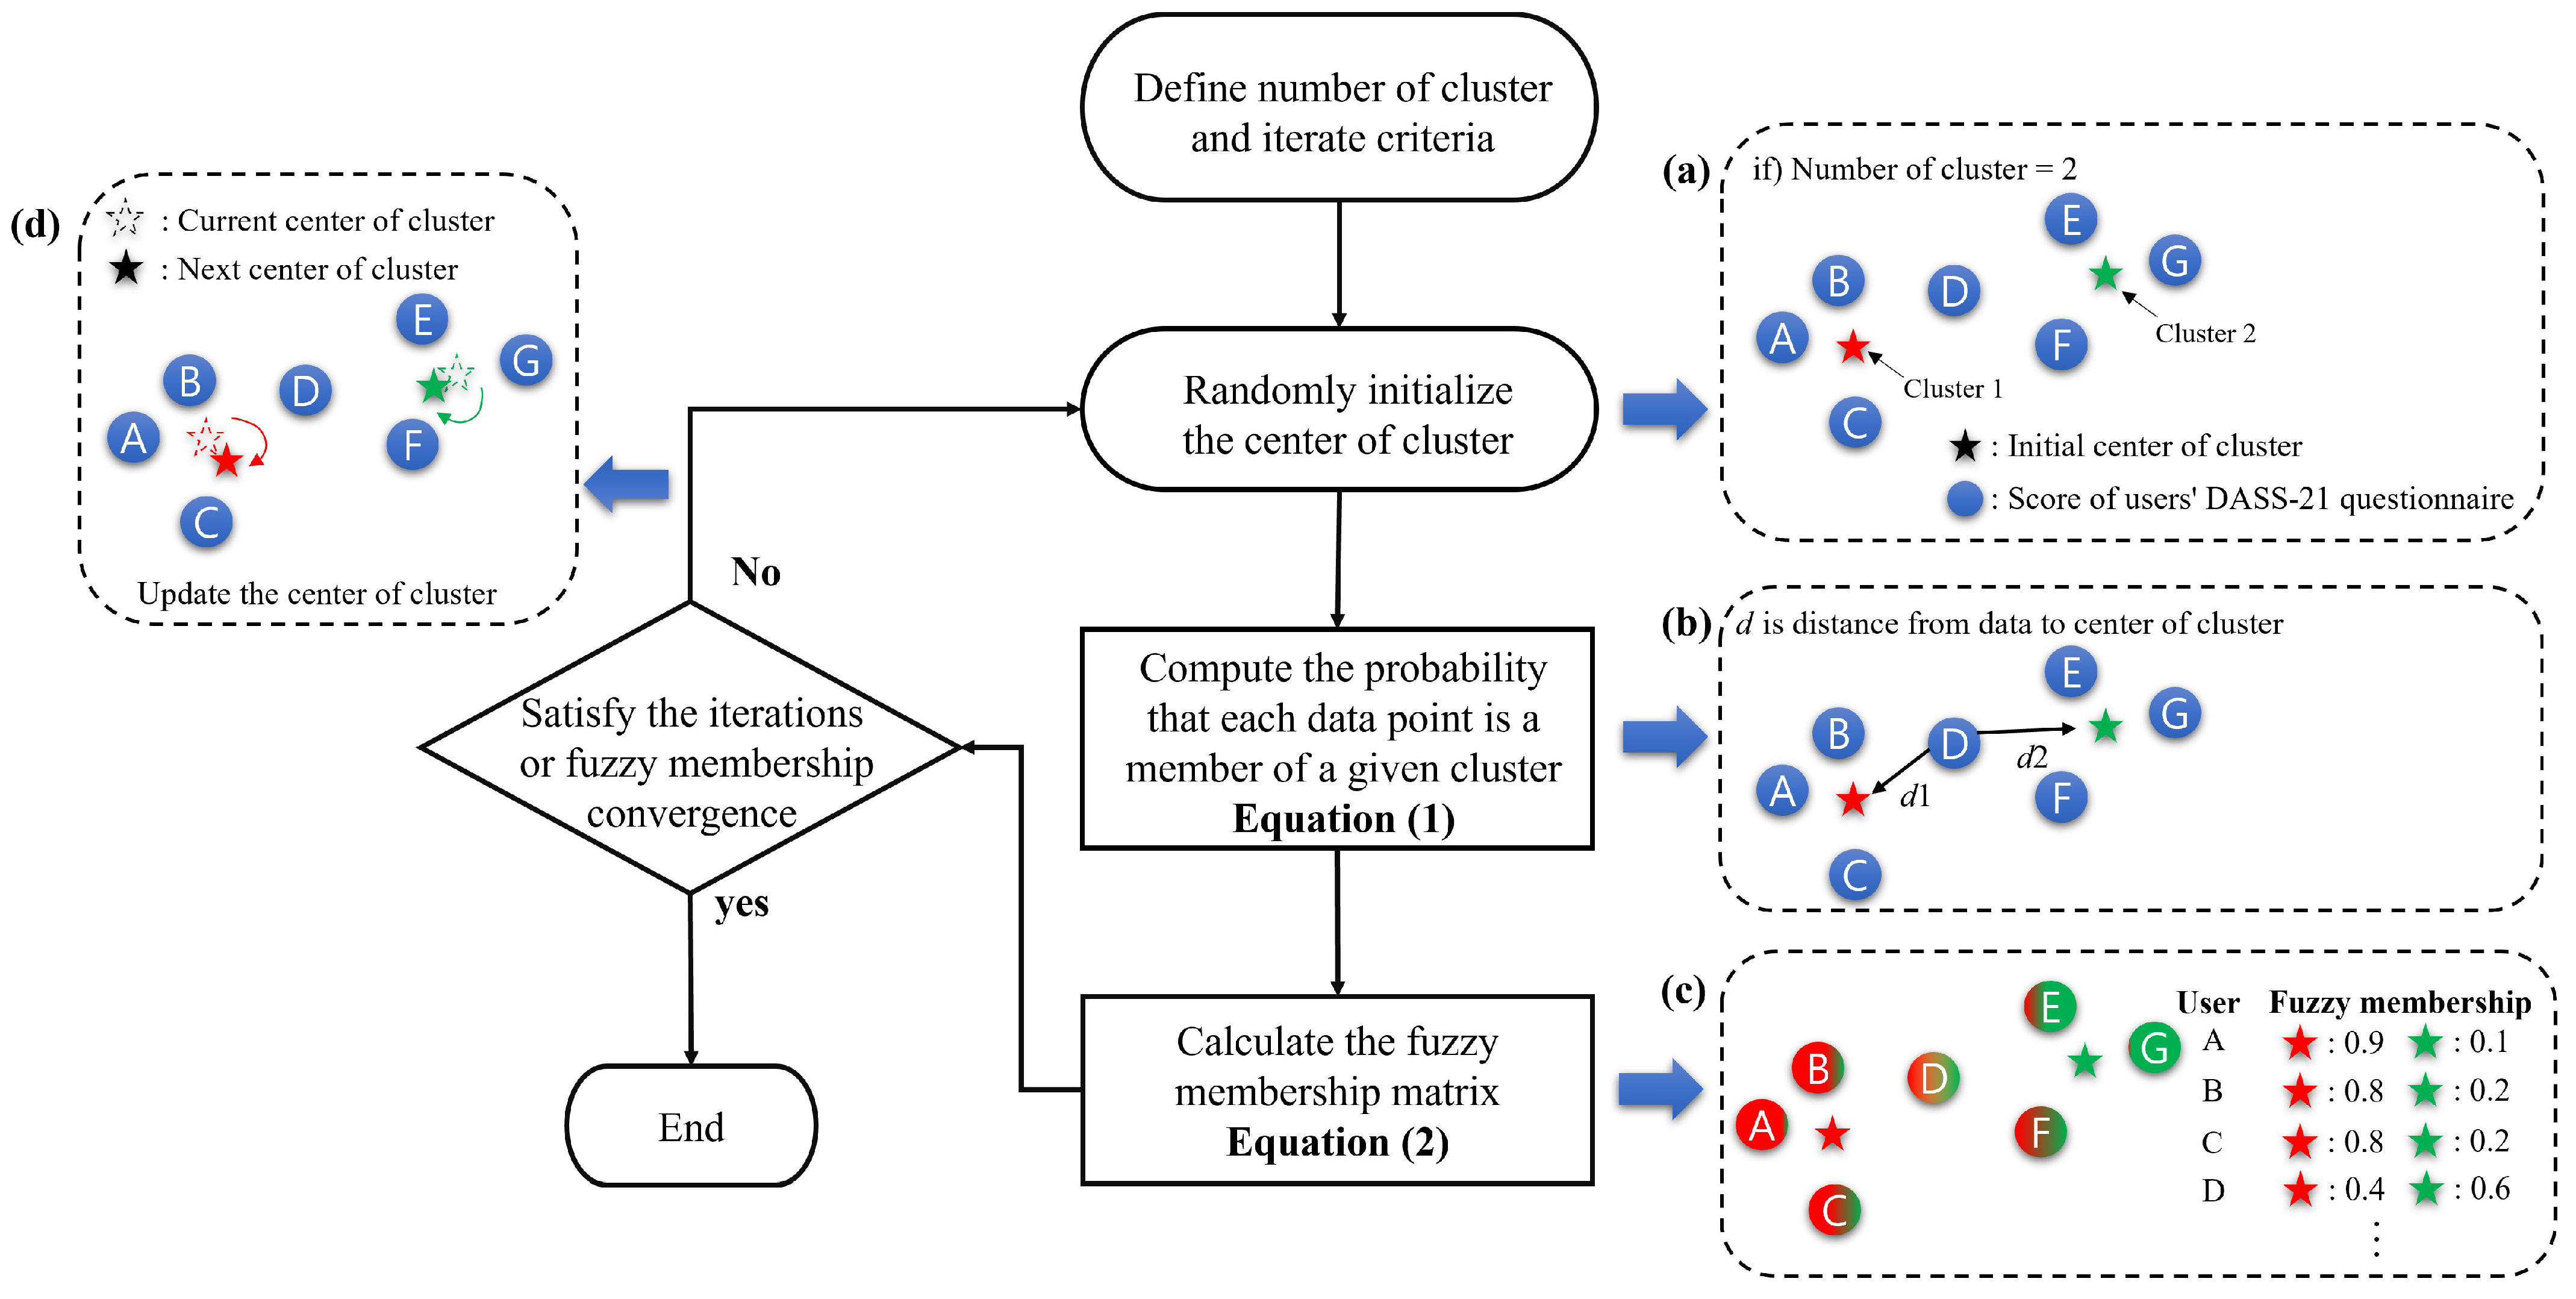
By examining the information that users want, the recommendation service recommends suitable content by analyzing the users’ similar characteristics, such as age, personality, gender, and preference for choice to reduce the amount of time spent performing the data search. The commonly used recommendation methods are content-based filtering, collaborative filtering, and hybrid filtering—the third one is the combination of the results of the first two techniques [21,22]. Out of these, collaborative filtering is the most popular recommendation algorithm, which recommends personal information and user orientation without requiring to peruse the past history of use or assessment. This method uses a clustering algorithm to group users with similar profiles. The users are placed in different groups according to their closest distance or high correlation by computing geometric distance (e.g., Euclidean, Manhattan) or similarity (e.g., Pearson, Cosine) [23,24]. In the current research, music was recommended for different groups by clustering people with similar levels of depression, anxiety, and stress into the same group based on their scores for DASS-21. Since people typically have more than one emotional state among depression, anxiety, and stress, fuzzy clustering was used to provide the appropriate music to the clustered groups. For example, a group with higher scores in depression than in anxiety or stress was recommended with music for anxiety and stress relief. The fuzzy clustering aimed to minimize the sum of squares of error to maximize the cohesion between the data in each group when the groups were formed. The fuzzy clustering process is shown in Figure 1.
First, the process of fuzzy clustering involves ascertaining the number of clusters and the number of iterations to perform the algorithm in how many clusters. Second, depending on the number of clusters, the centers of the clusters are initialized using the scores of the users’ DASS-21 questionnaire (Figure 1a), and the probability of belonging to a cluster (Figure 1b) is calculated from Equation (1) based on the distance between each data point and the center of the cluster [25].
where means ith cluster v, U represents the set of users, n is the total number of users, k is the total number of clusters, and denotes the probability of a user belonging to the ith cluster v. Moreover, denotes the membership degree of the ith user allocated to the jth group, and m is the weighted value that controls the amount of fuzziness and implies any real numbers greater than 1. As the fuzzy multiplier values (m) come closer to 1, the probability of belonging to a cluster becomes higher. When m increases, the probability of belonging to a cluster cannot be identified because the distances between the groups become similar. In the current research, to prevent chances of a user not belonging to any group at all, when the DASS-21 scores and distances between group centers were the same, the maximum value of membership strength was limited to less than 2 . In addition, computes the distance between the ith user’s DASS-21 score x and jth cluster c. Third, as shown in Figure 1c, the fuzzy membership degree for x in cluster c is calculated using Equation (2), as shown below [26].
where denotes the fuzzy membership degree of the ith user assigned to the jth cluster and computes the distance between x, the ith user’s DASS-21 score, and the jth cluster c as an inverse function. Finally, clustering was repeatedly performed by changing the coordinates of the center of the cluster until the DASS-21 result scores of all the users met the criteria shown in Figure 1d for the number of iterations set or until convergence of fuzzy membership degree was reached and no change was observed. When the repetition was over, the music preferred by the users of each corresponding group was recommended to them according to their fuzzy membership degree (m); the higher the fuzzy membership degree, the greater the number of music that was recommended.
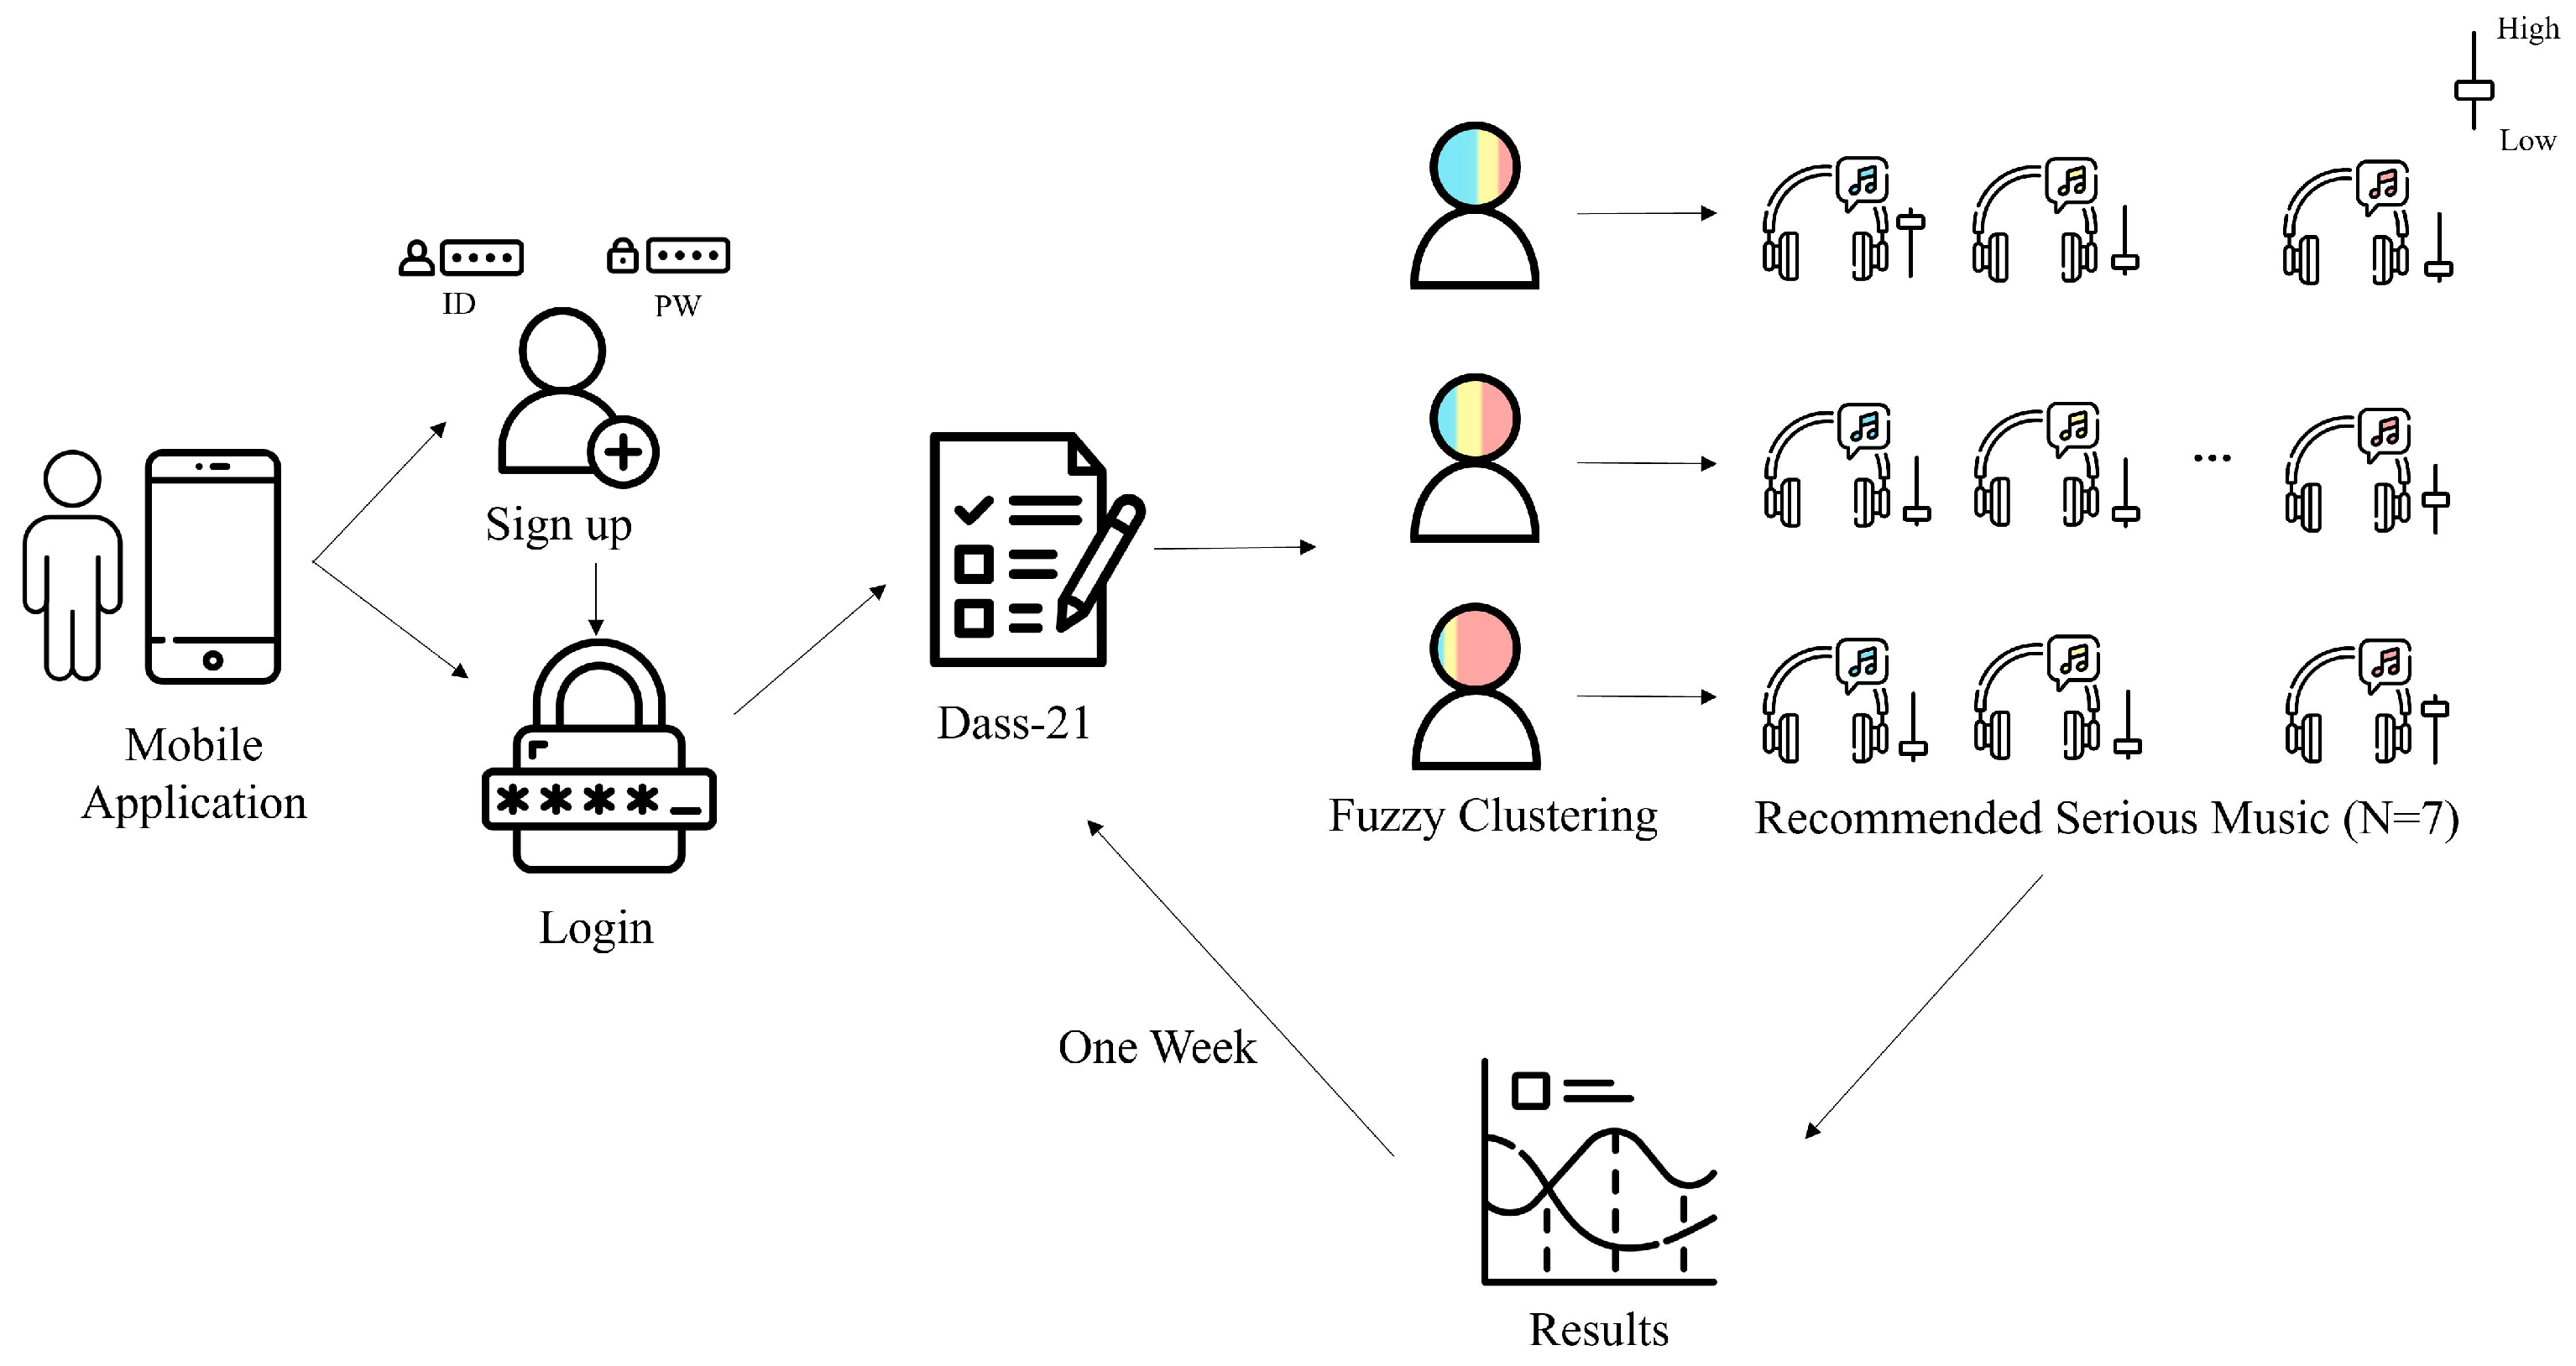
2.2. Mobile Music Application
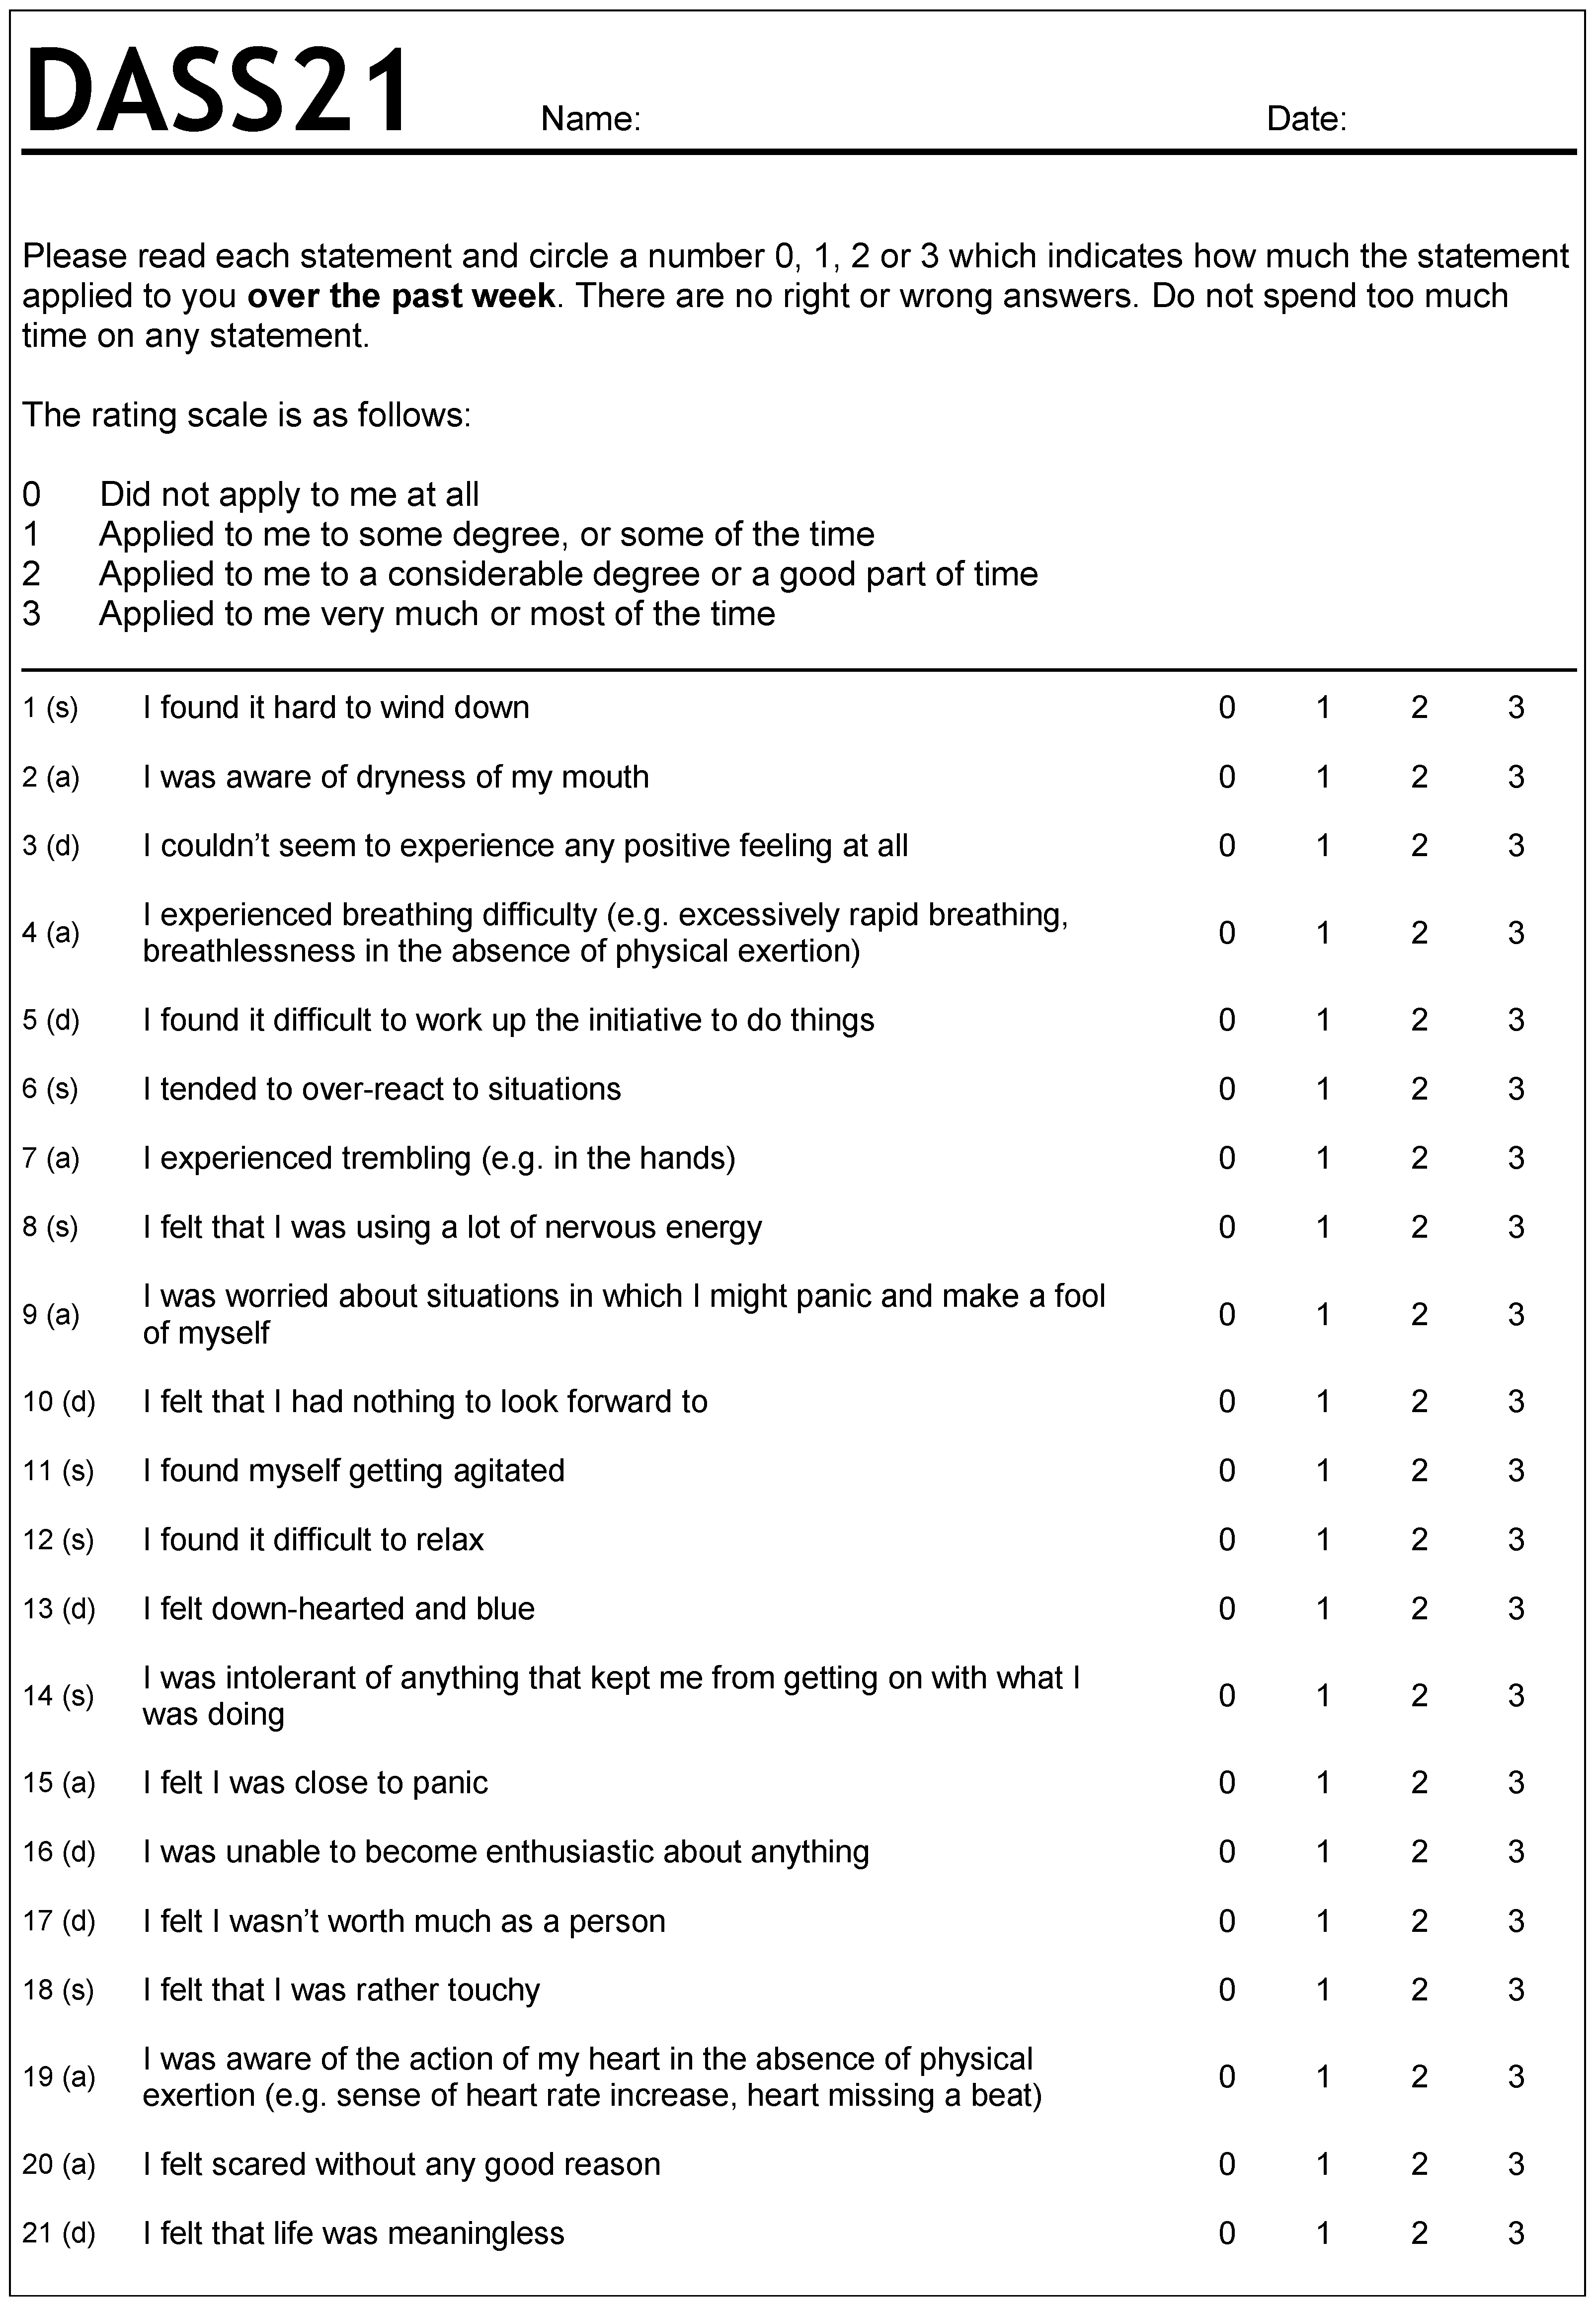
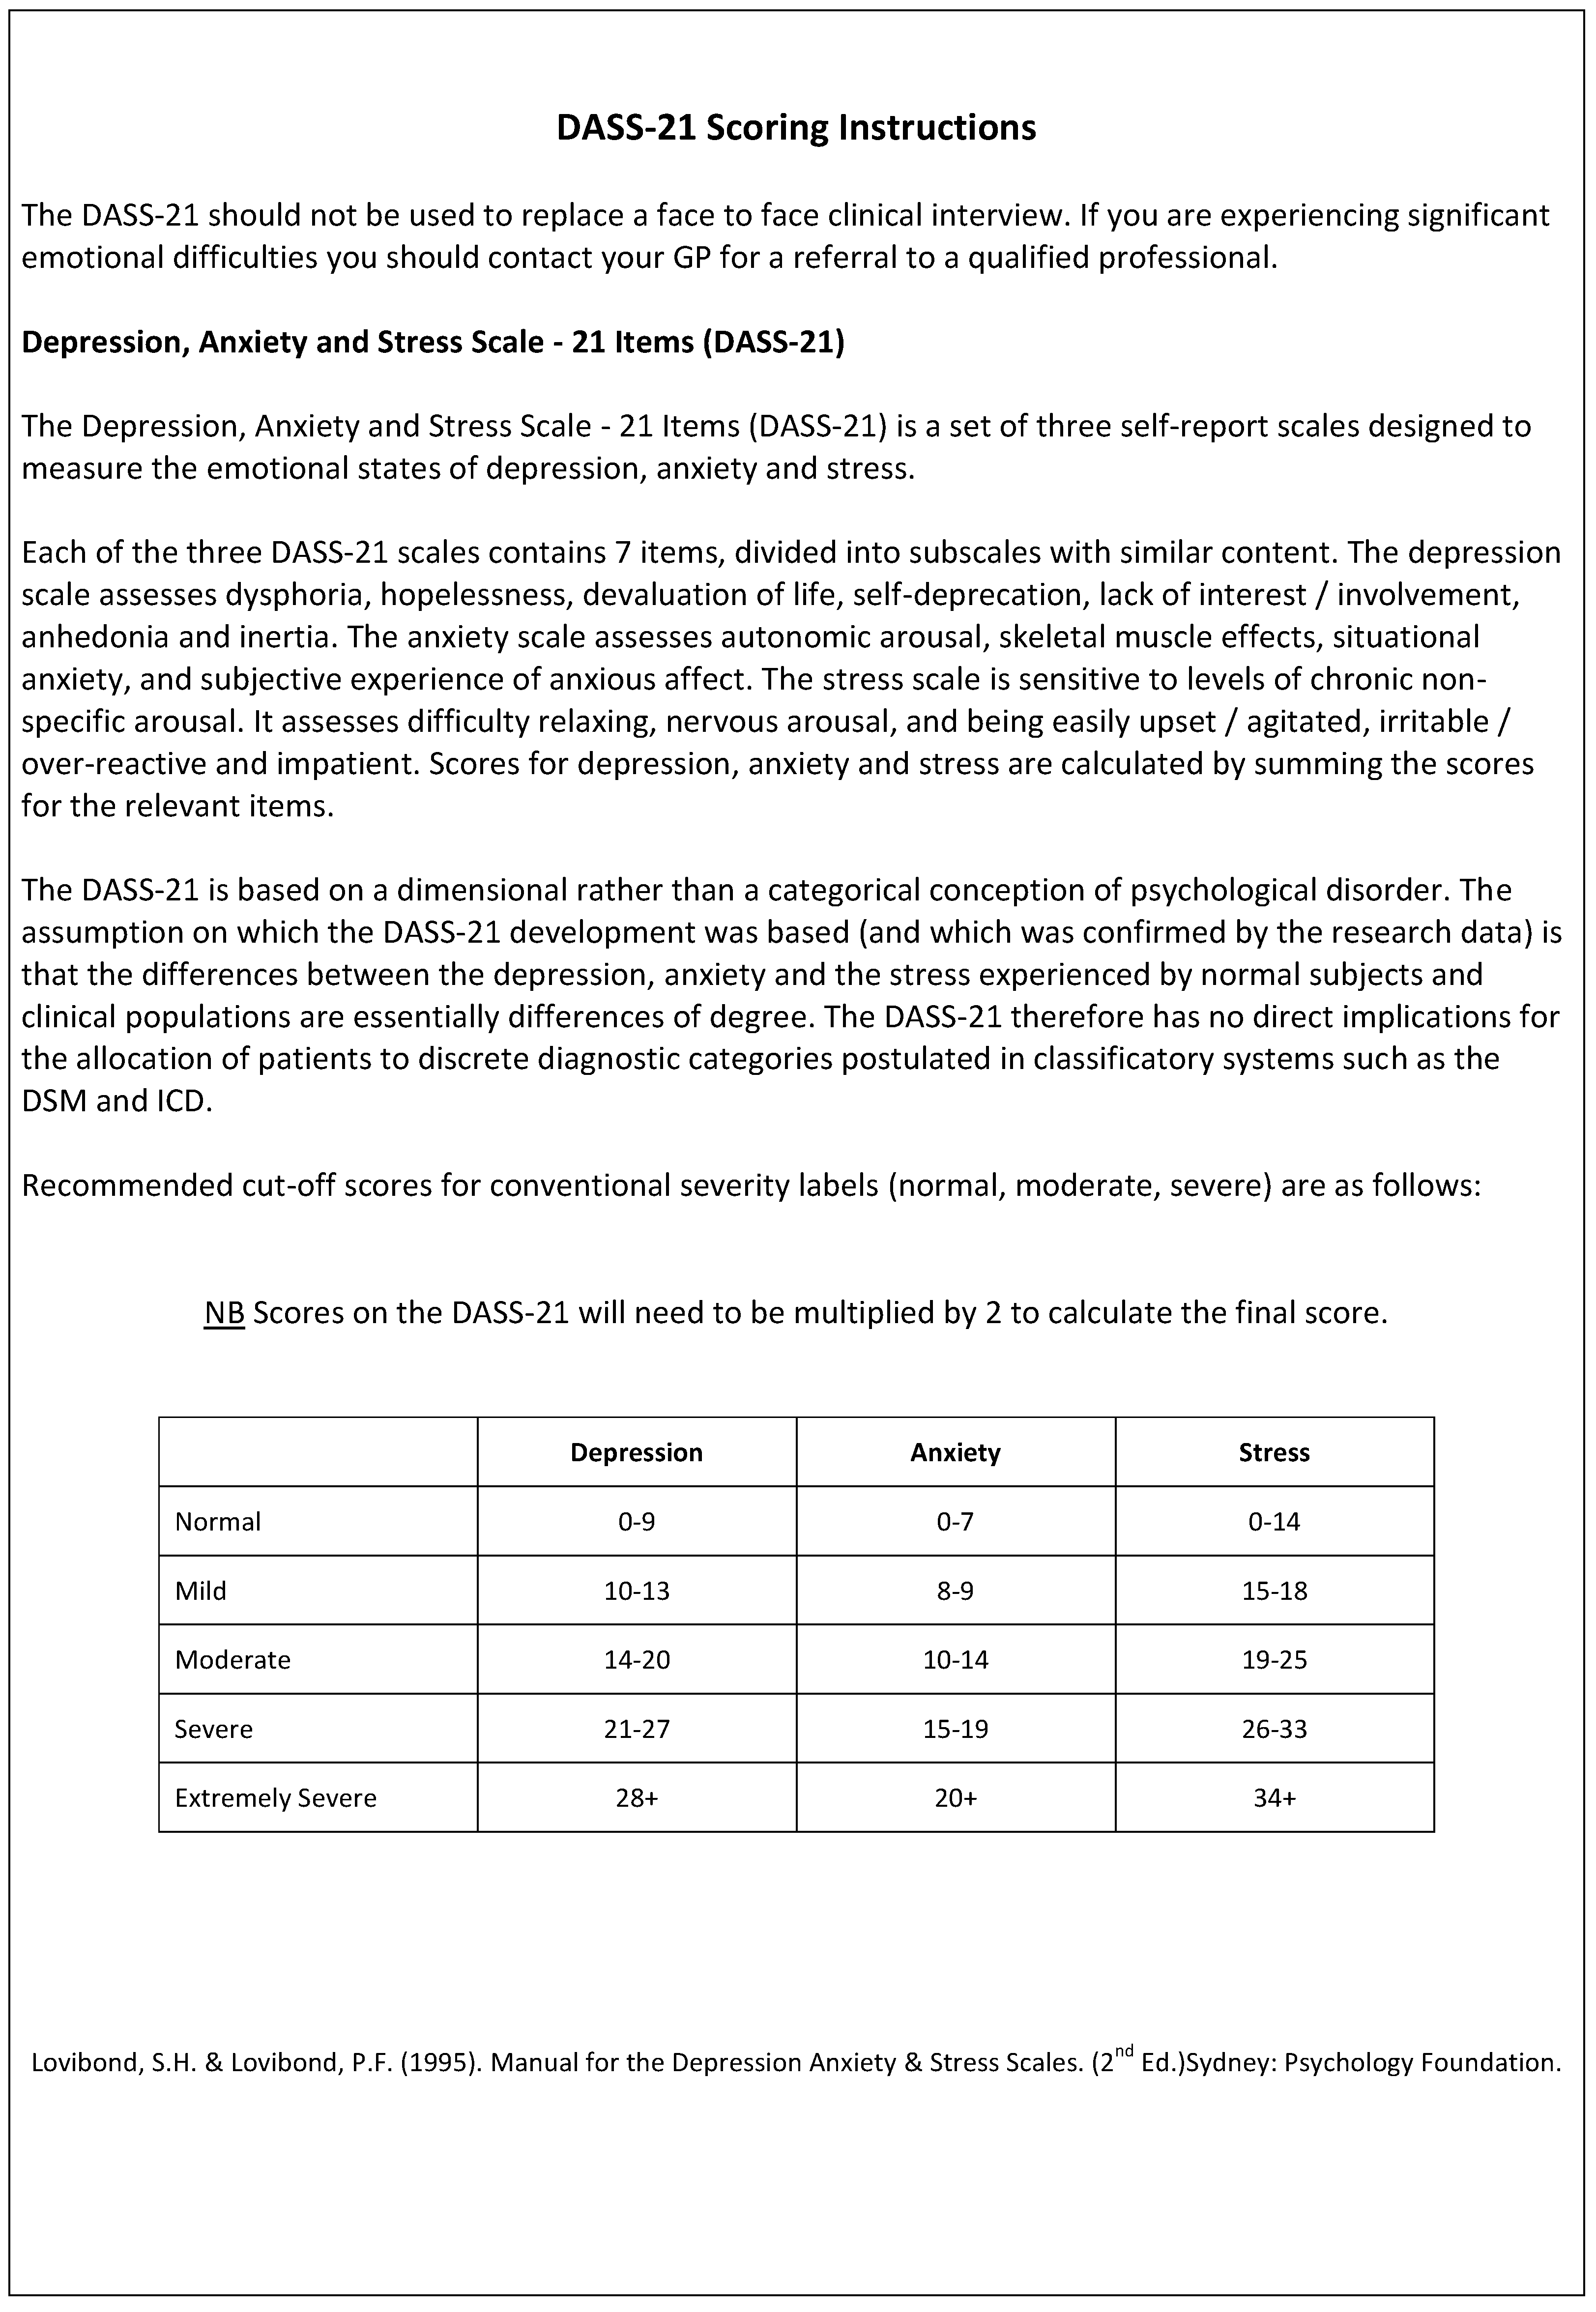
The mobile application service implemented in this study uses the React Native (version: 0.62) platform and this app can be run on both IOS 15.5 and Android 12.0 or higher OS. Figure 2 shows the diagram of the music recommendation service. This service was made available to the new users after they had signed up for membership and registered with ID and passwords. After completing the registration, the users had to answer the DASS-21 questionnaire; then, the recommended music was provided by clustering the users with similarity using fuzzy clustering based on the survey scores. The questionnaire in DASS-21 comprised a total of 21 questions about anxiety, depression, and stress, and a four-point Likert scale was employed to classify the responses from 0, which meant “Did not apply at all”, to 3, signifying “very much or Most of the time”. The DASS-21 score was added by doubling each depression, anxiety, and stress scale, and the severity levels of depression, anxiety, and stress were then classified into 5 categories. For example, for the depression scale, normal depression (0–9), mild depression (10–13), moderate depression (14–20), severe depression (21–27), and extremely severe depression (≥28) were used [27]. In addition, the severity baseline score for anxiety and stress scales other than the depression scale, the content of the entire questionnaire, and guidance on scoring the score can be found in Figure A1. This study developed a system that provides an appropriate choice of music by reorganizing the severity levels into three stages: “low”, comprising normal state; “normal”, consisting of mild and moderate states; and “high”, including severe and extremely severe conditions.
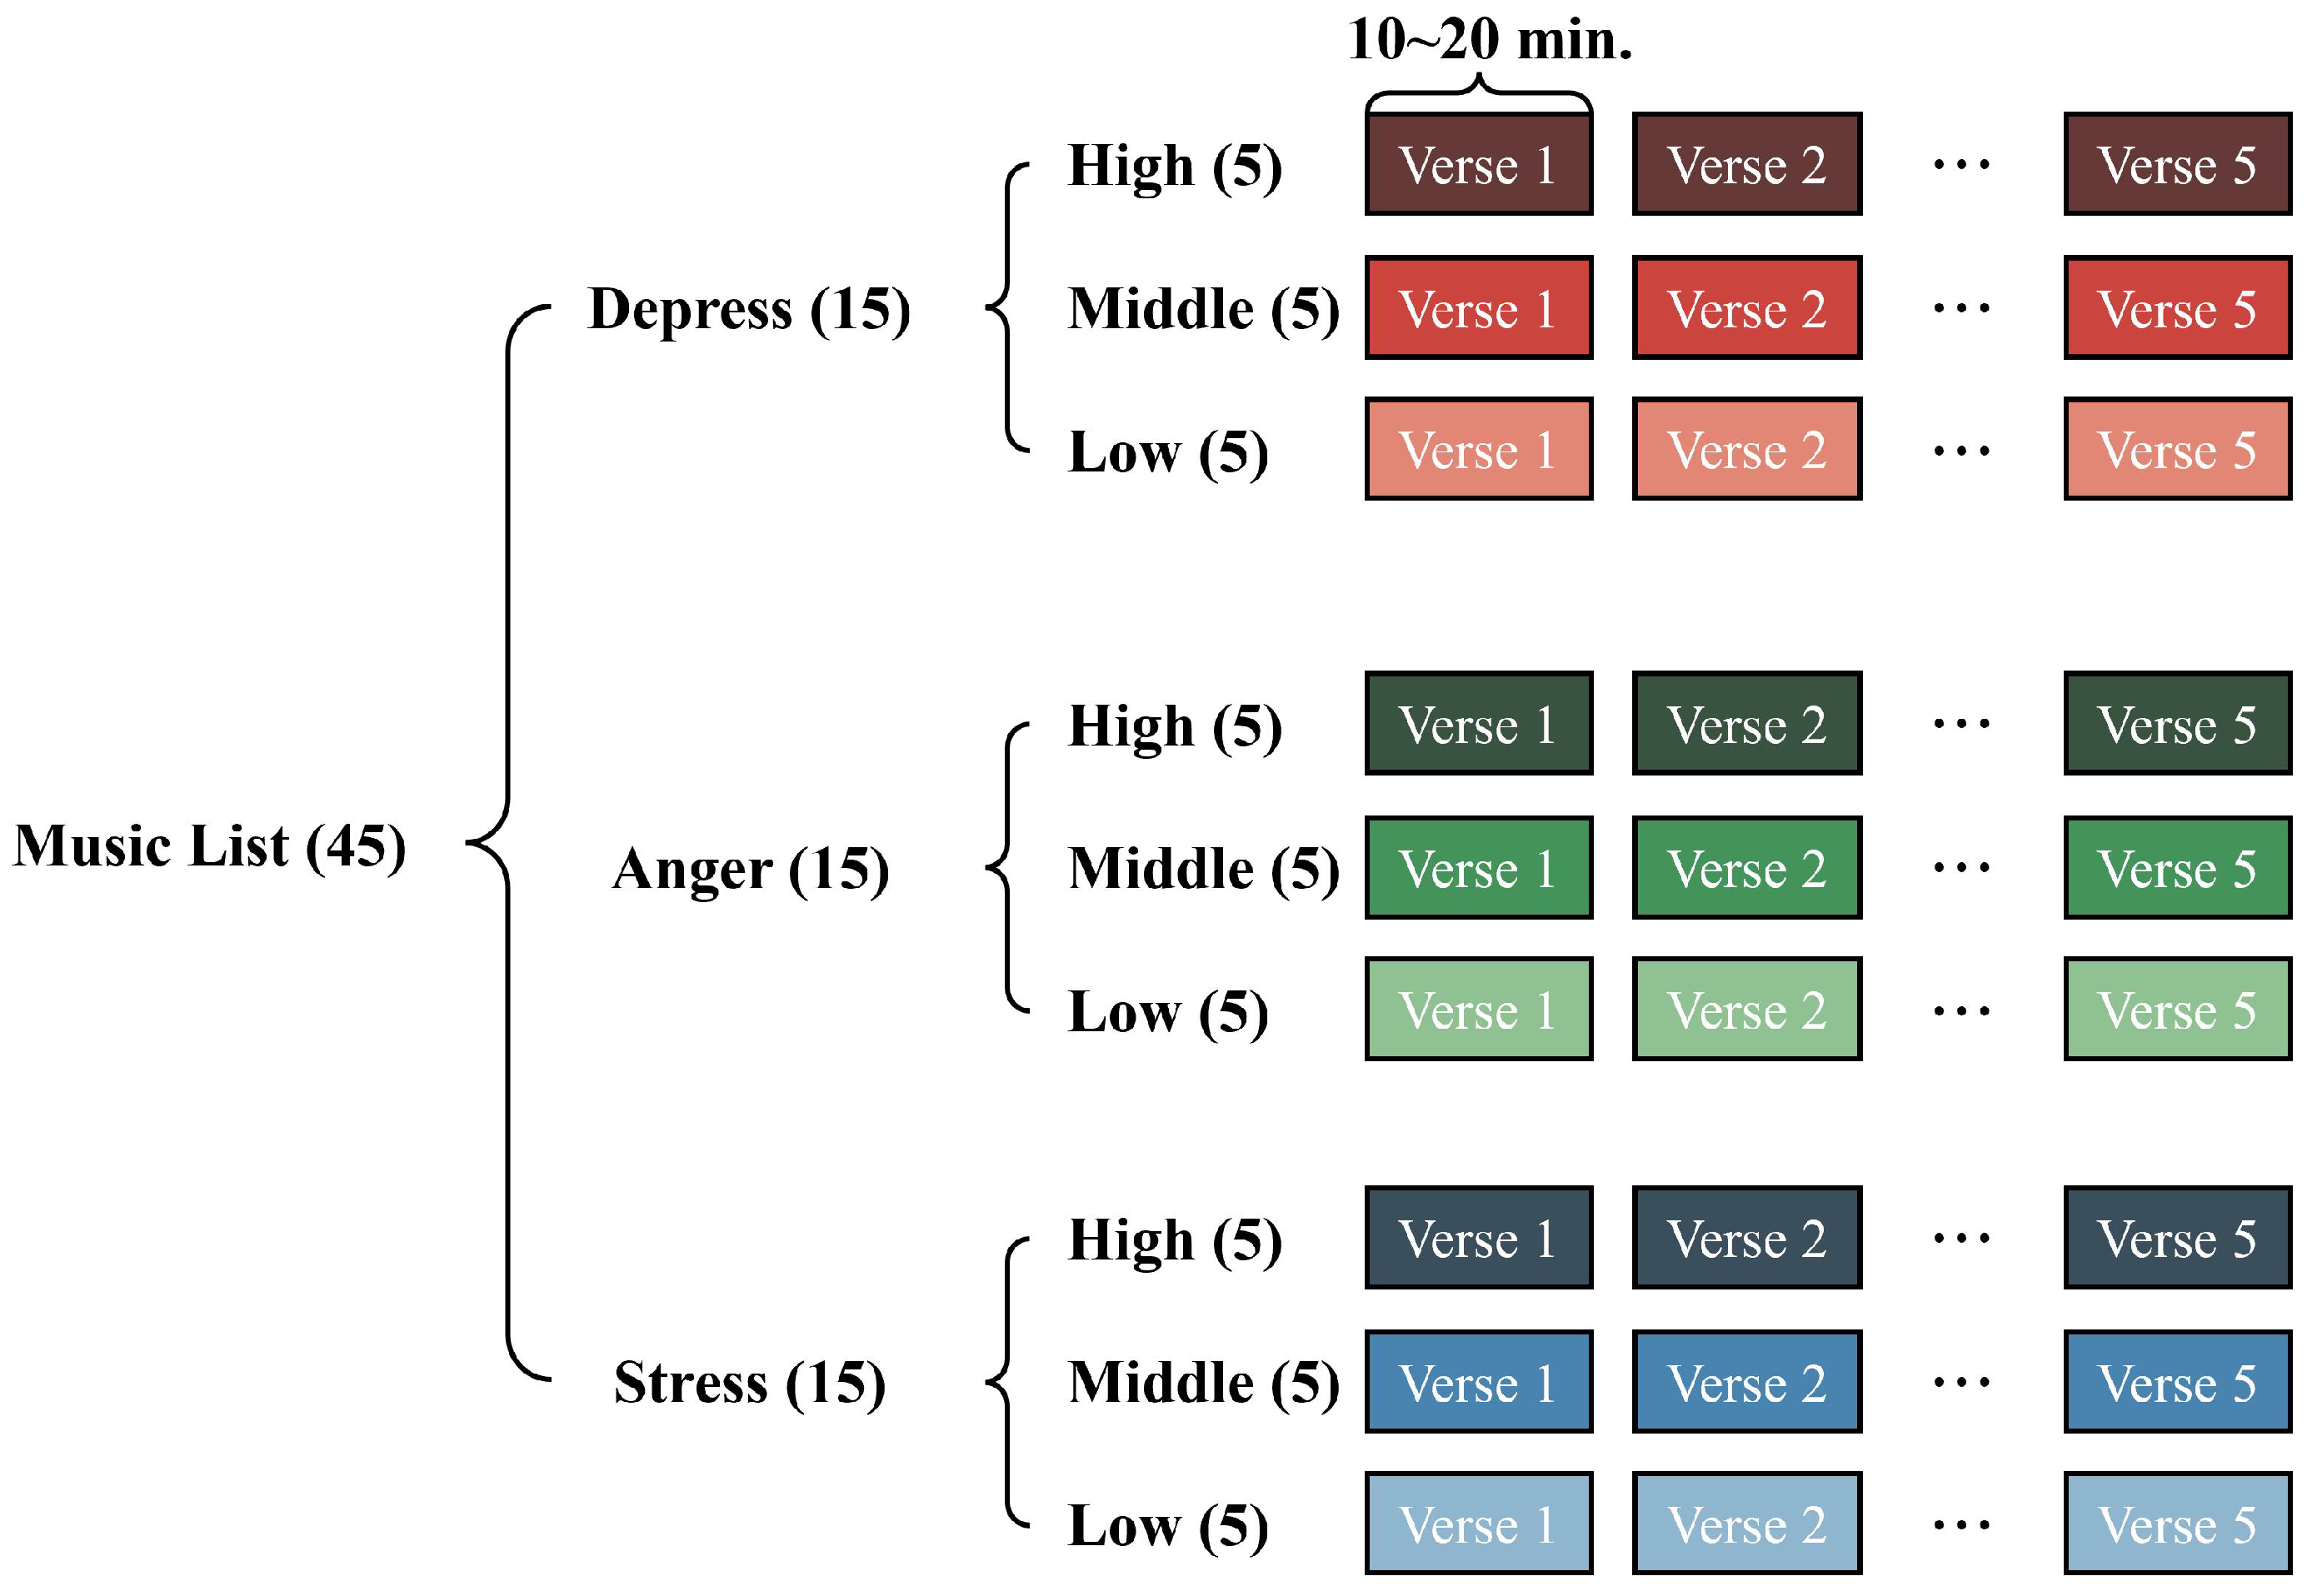
As shown in Figure 3, the music comprised a total of 45 music tracks. Music tracks for depression, anxiety, and stress contained 15 music tracks each, while 5 music tracks out of those 15 were for each of the scores “High”, “Normal”, and “Low” by scale. The maximum and minimum numbers of music tracks recommended for each scale of music tracks were 5 and 1, respectively. Therefore, in this study, seven music tracks were selected according to the membership degree of fuzzy clustering (e.g., 5 music tracks for depression (Max.), 1 for anxiety (Min.), and 1 for stress (Min.)). If the total number of music tracks increases, the maximum number of music tracks that can be recommended for each scale also increases; therefore, the number of music tracks recommended also increases accordingly. For example, if there are seven music tracks for depression, seven music tracks for anxiety, and seven music tracks for stress, then up to seven music tracks on one scale and at least one music track on the other two scales—i.e., up to nine music tracks—can be recommended. The playtime of each track was approximately 10–20 min, and the playlist consisted of music with faster tempo and greater amplitude (sound loudness) for those with scores closer to “high” for each scale, i.e., depression, anxiety, and stress [28]. Users with high scores in depression were recommended classical or jazz music genres, effective in easing tension and stabilizing mood, and music with an allegro (cheerful; 70–80 bpm) or adagio (calmly, slowly; 60–70 bpm) tempo using a drum-based percussion instrument [29]. After listening to all the recommended music playlists, the changes in emotional states and listening time were checked at weekly or monthly intervals. Through this process, the most common emotions exhibited and the most played music were determined, and characteristics (genre, tempo, musical instrument) of the music preferred by the users were identified by integrating the played music with respect to emotional status.
2.3. Building Initial Datasets Using the Psychometrics’ Open-Source DASS Survey
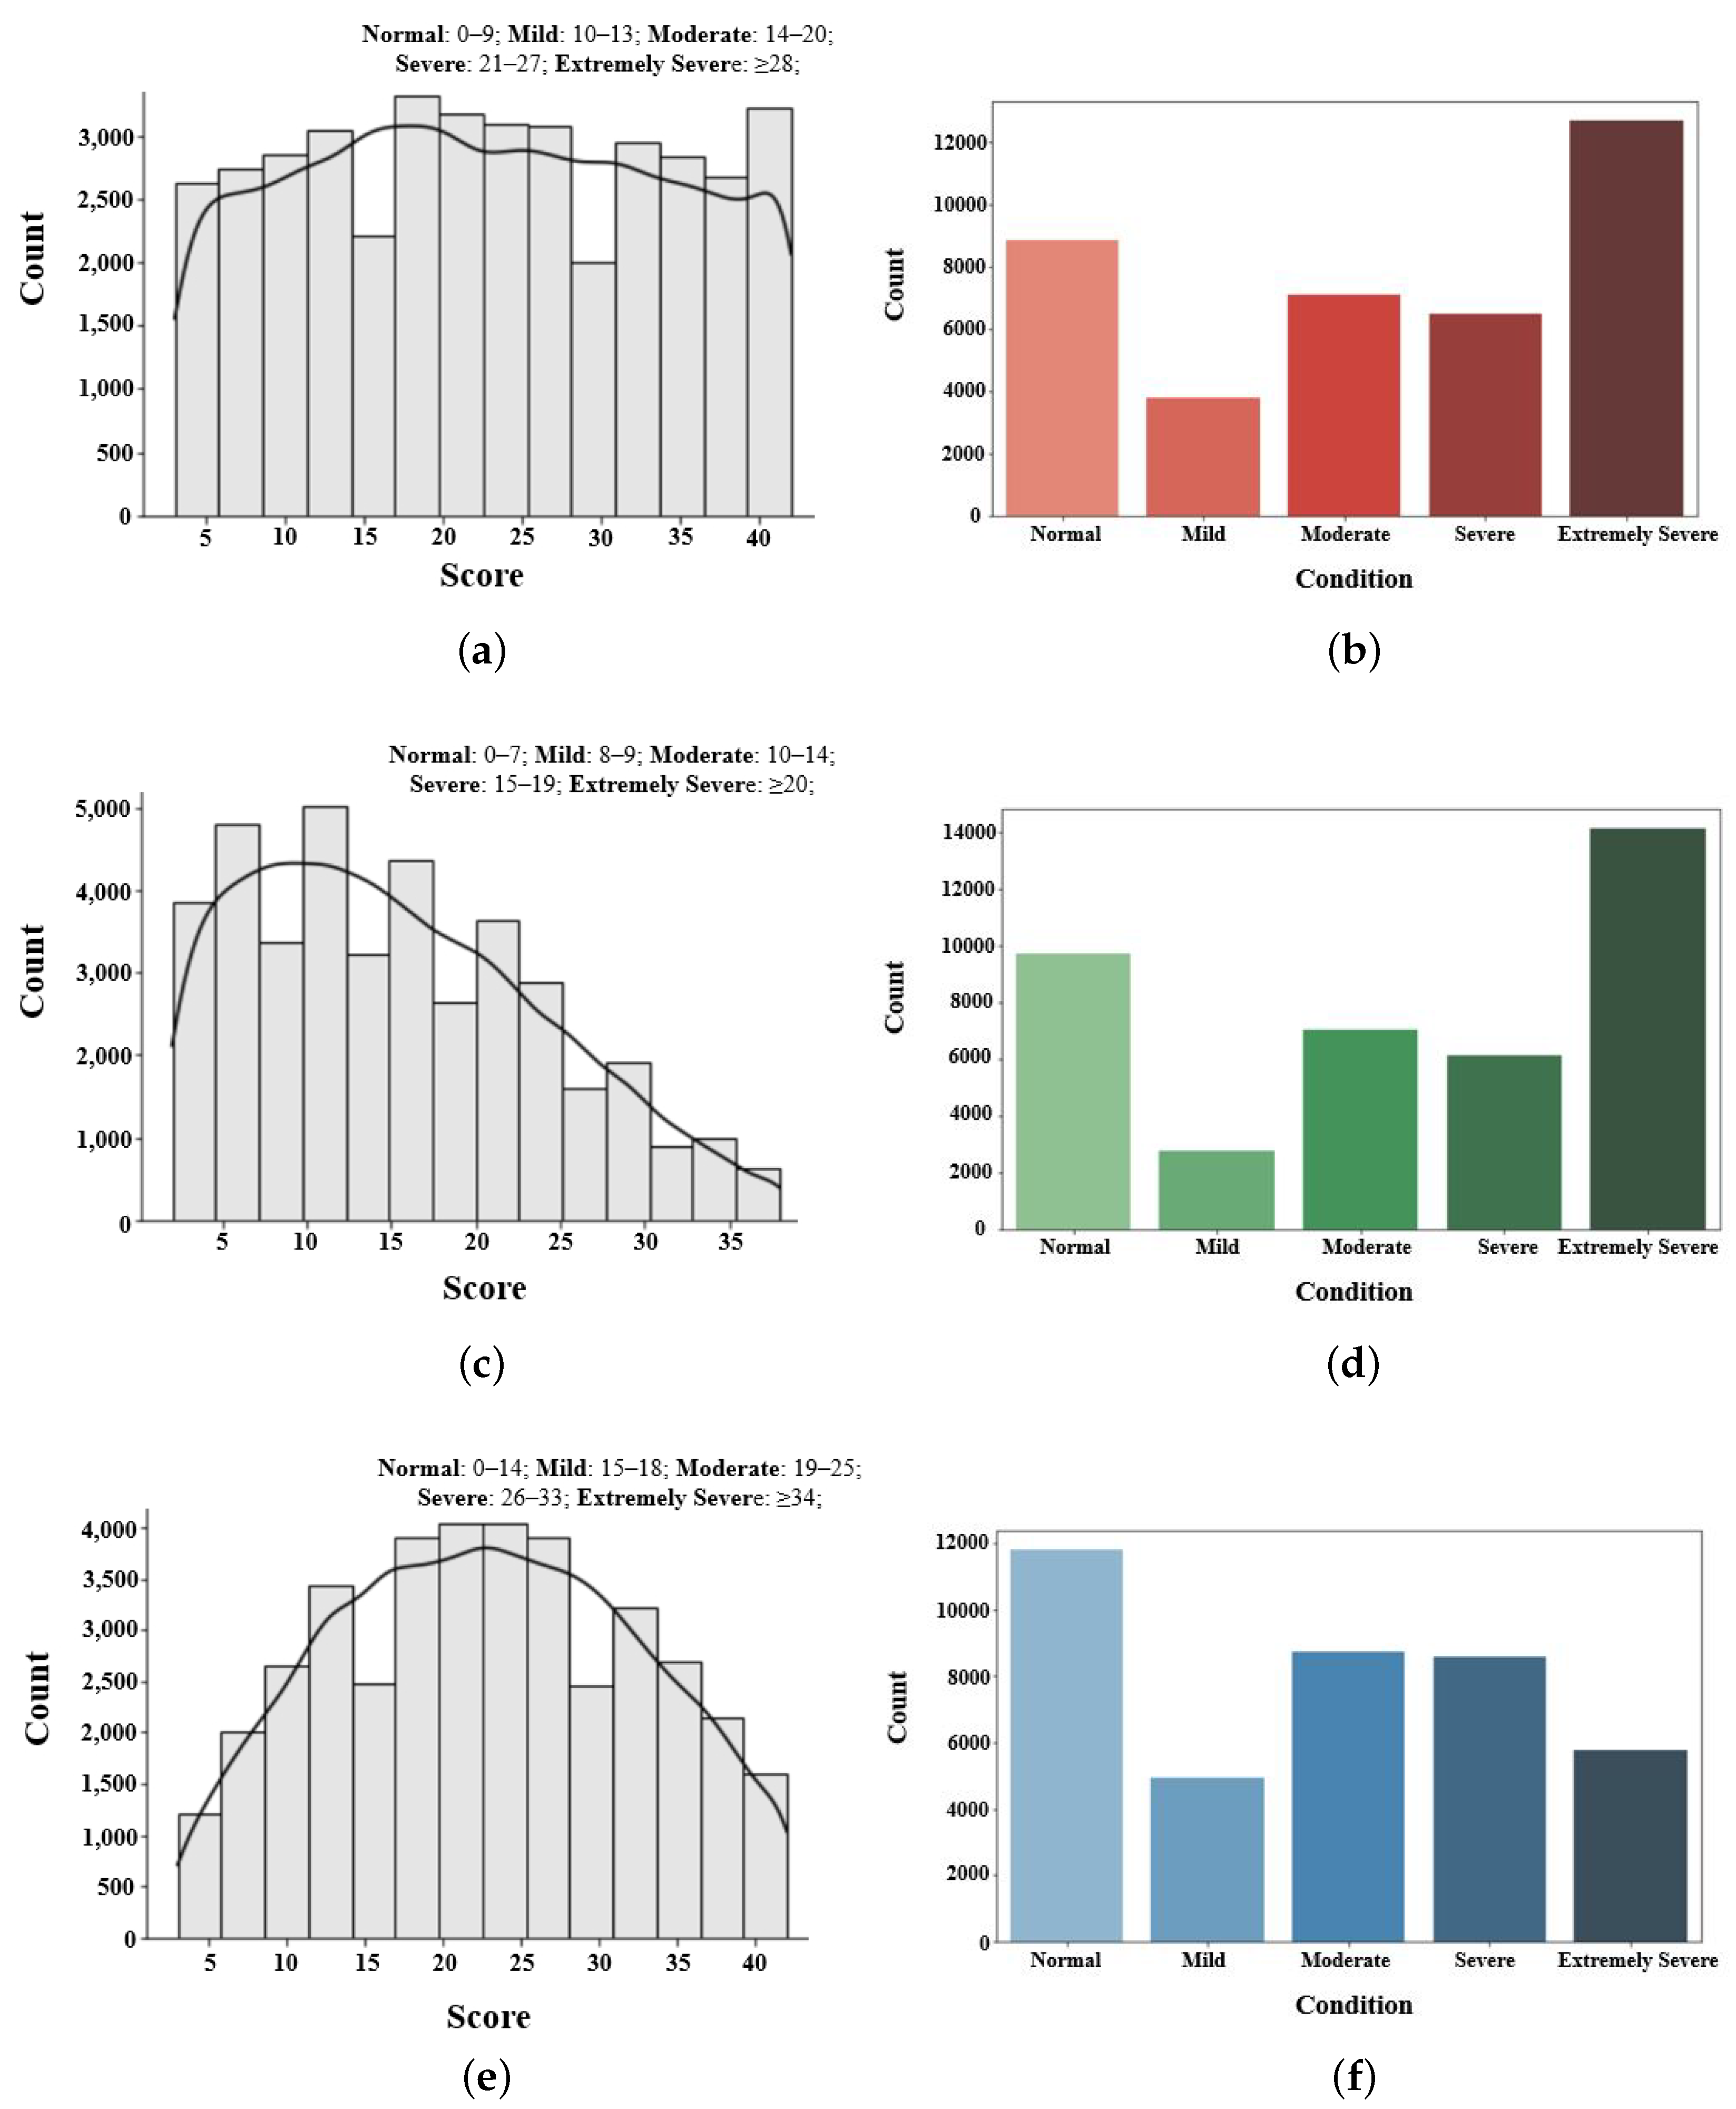
This study generated initial data using the response datasets of the DASS survey provided by the Open-Source Psychometrics Project [30]. This DASS survey questionnaire is available online openly to anyone in the world, and 39,000 respondents participated in the survey from 2017 to 2019. This study included only the data of participants who agreed to the statement “Have you given accurate answers and may they be used for research?” Figure 4 displays the distribution of scores and severity by scale—depression, anxiety, and stress among participants.
Figure 4a shows the distribution of scores for depression with a mean score of 23.6 points. The mean score belongs to the category “severe (21–27)”. Of all the participants, 51.2% scored higher than the “severe” level, as shown in Figure 4b. Figure 4c presents the distribution of scores for anxiety with a mean score of 17.4 points, and the curve distributed symmetrically to the left side of the median (Skewness = 0.46). The mean score of anxiety was lower than that of depression because the baseline score of anxiety was lower than that of depression. In the distribution of anxiety severity, 53.8% participants accounted for the severity levels higher than “severe”, while 37.4% participants accounted for the “extremely severe” level, as shown in Figure 4d. Figure 4e,f represent the mean score of stress and the distribution of severity, respectively. The average score is 23.3 points, signifying the “moderate (19–25)” category. For stress, the highest proportion of the participants (30.3%) belonged to the “normal” category. Participants in the “moderate” and “severe” categories in stress were greater in number than those in depression and anxiety. The above results were used as initial datasets for grouping users with similar interests. This study designed services for music proposal by grouping new users using fuzzy clustering.
3. Results
3.1. Fuzzy Clustering for Users with Similar DASS-21 Scores
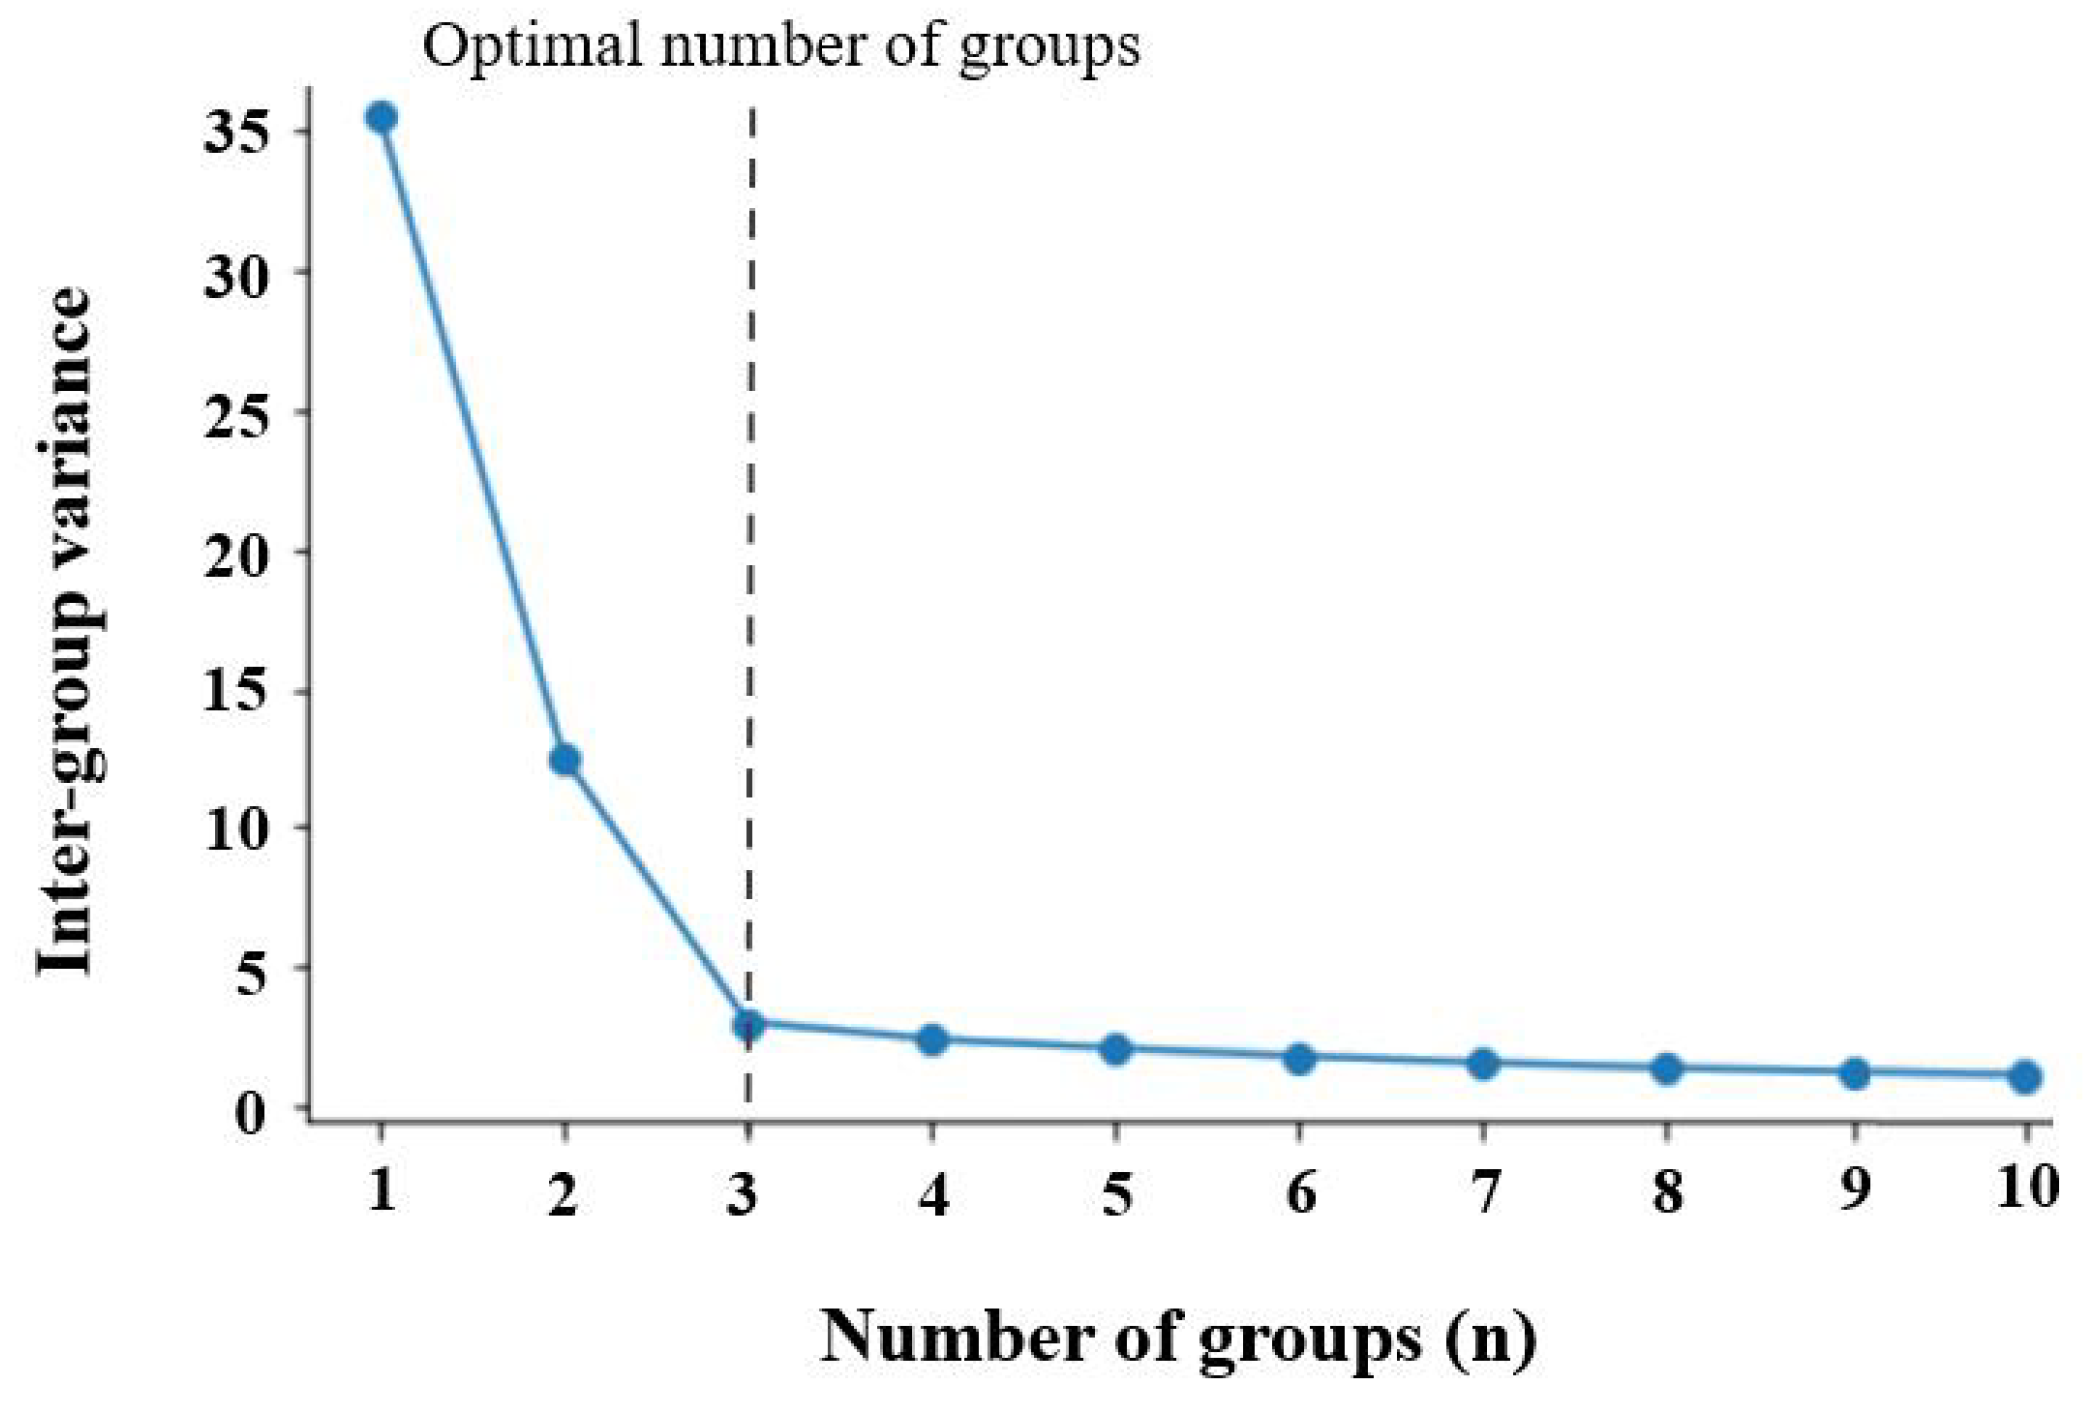
Based on the Psychometrics’ Open-Source DASS survey points, groups with users having similar interests were formed using fuzzy clustering. Figure 5 shows the cohesion curve of inter-group data according to the number of groups formed. The graph presents the changes in the sum of squares errors (SSE) within the groups by consecutively increasing the number of groups from 1 to 10. A decrease in SSE within groups indicates an increase in data cohesion. As shown in Figure 5, data cohesion is maximized when the number of groups is 3 or more. When the number of groups is more than 4, the time spent in the process of clustering users increases due to the large amount of data to be calculated by fuzzy clustering, and the change in the level of cohesion is insignificant. For this reason, this study grouped similar users by deciding the number of groups as 3 for fuzzy clustering.
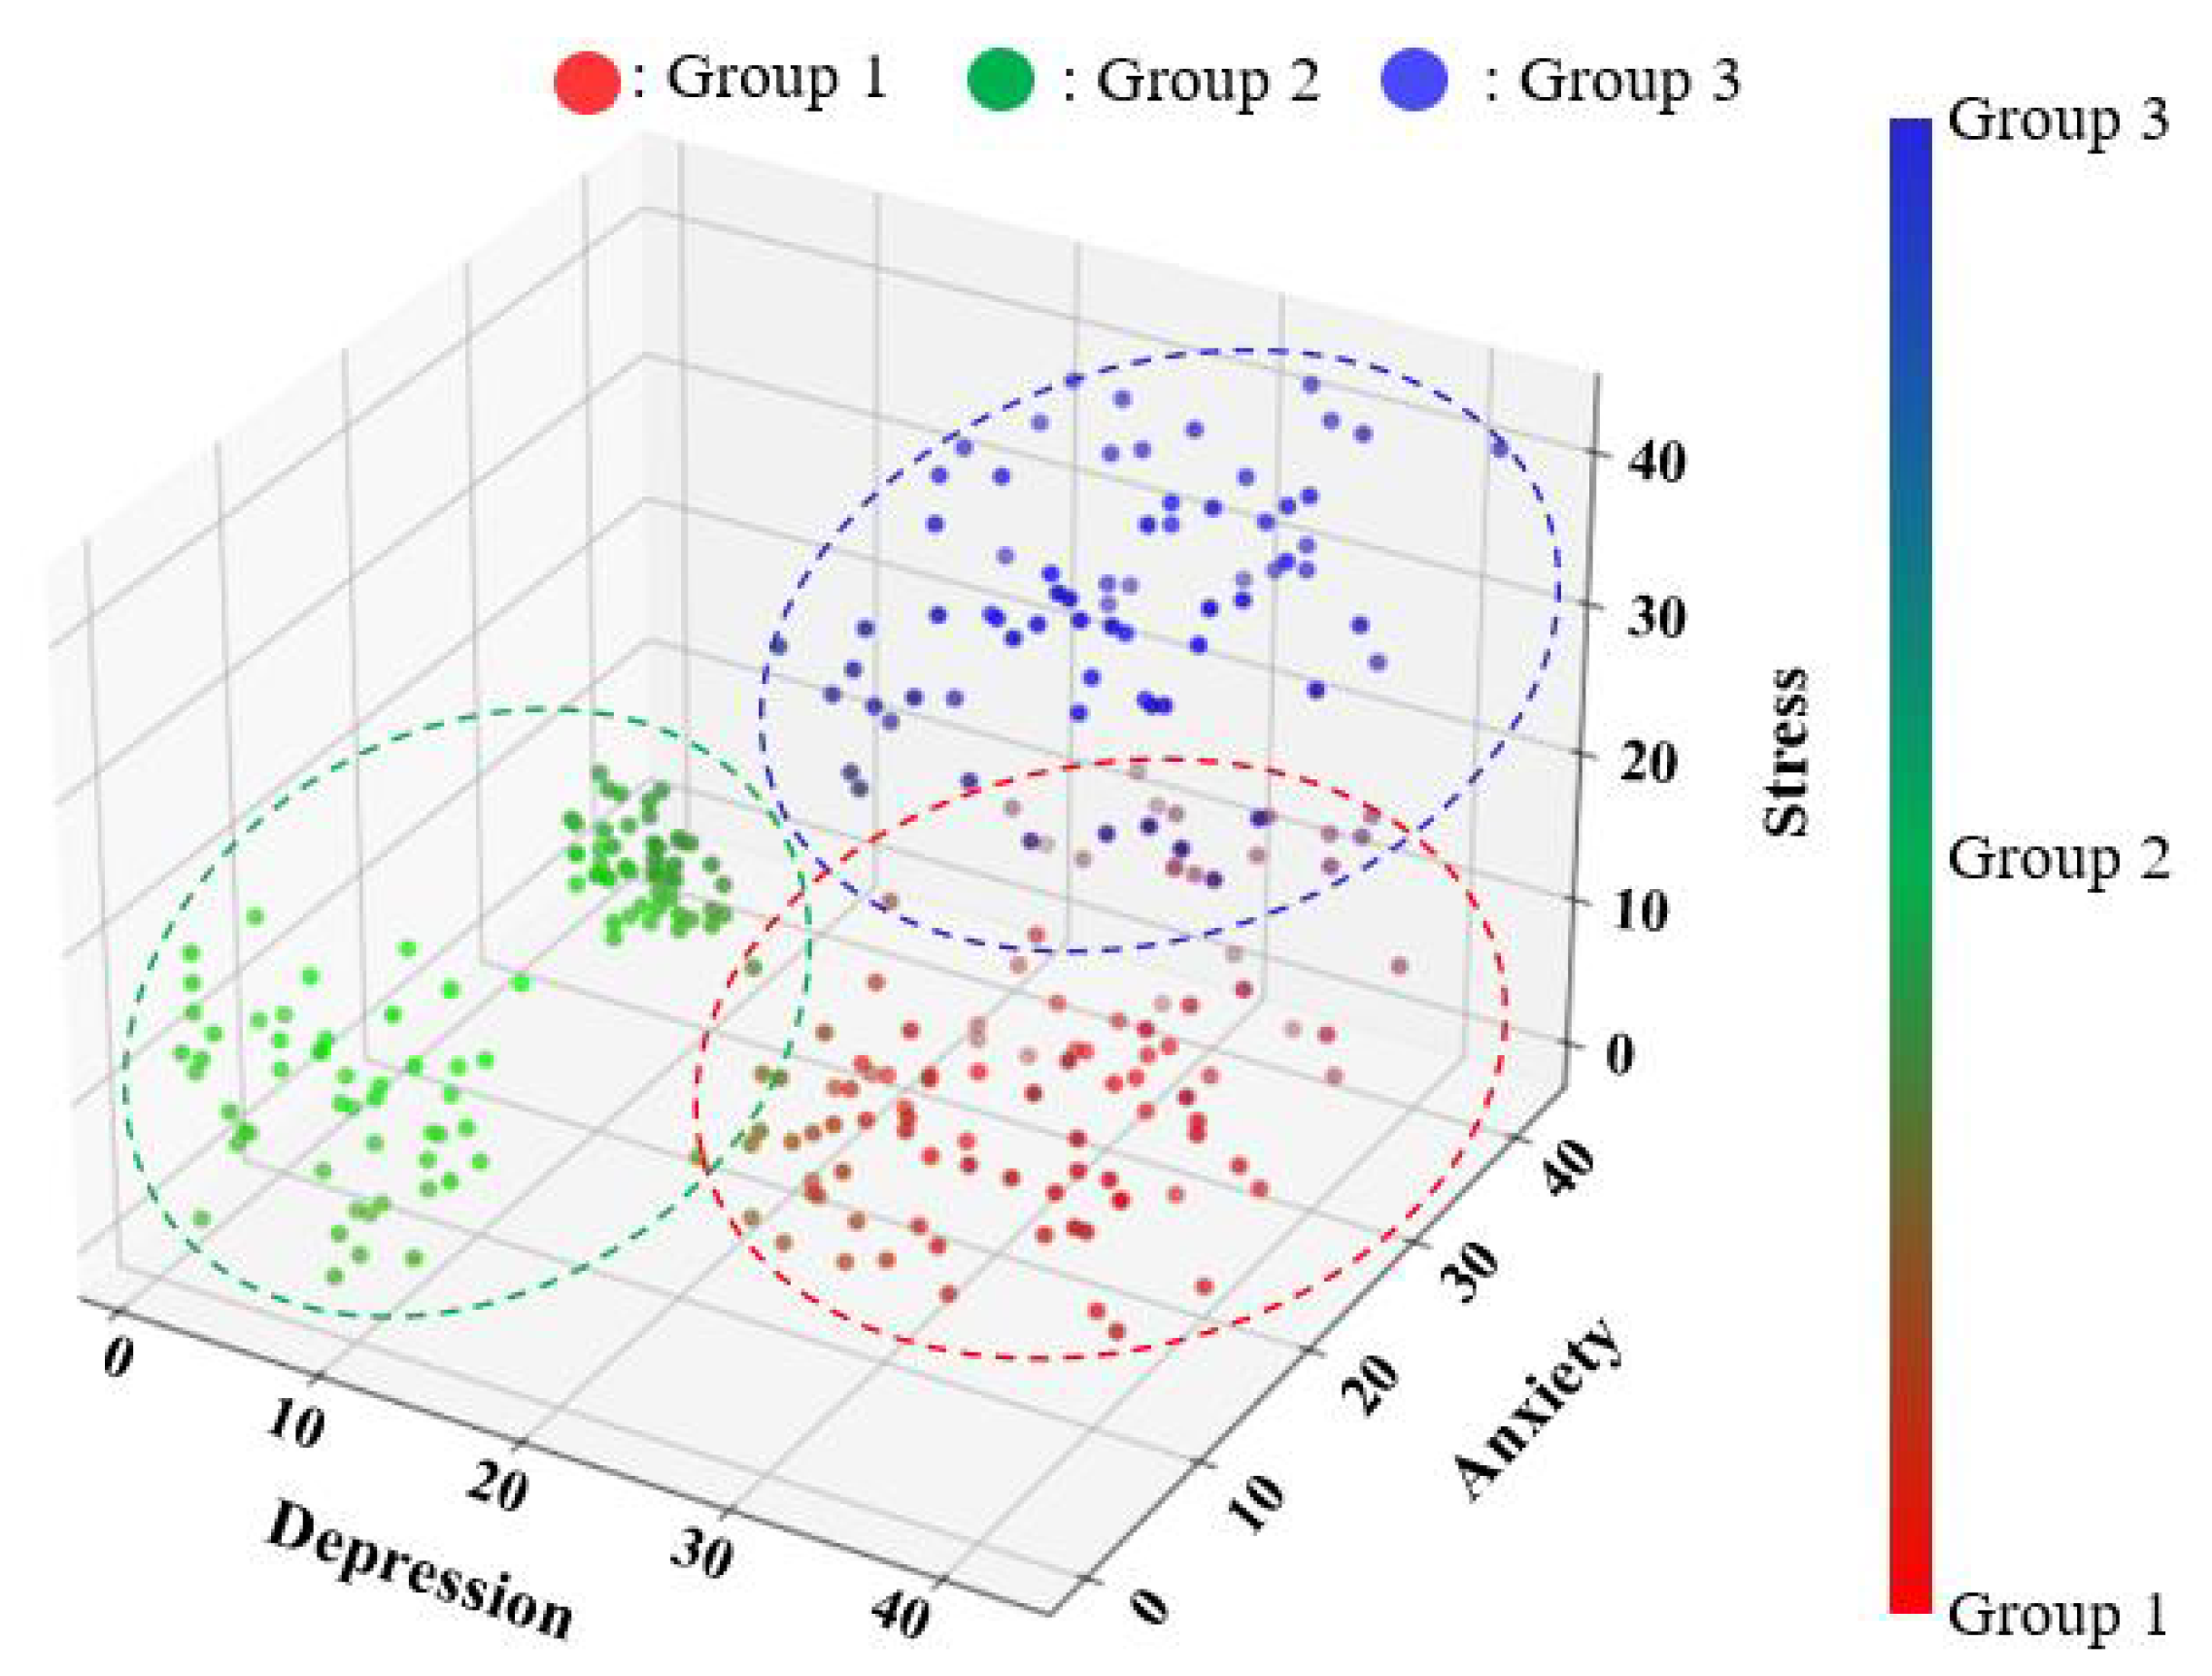
Since there are limitations in producing the results of clustering 39,000 participants on a coordinate plane, 390 persons with the same severity ratio were sampled and the number of groups was three. Figure 6 shows the results of clustering the samples into three groups using fuzzy clustering. The higher the value of fuzzy membership degree in each group, the clearer the group colors. The mean scores (center of Group 1’s cluster) for the three scales in Group 1 were 31.1 for depression, 23.2 for anxiety, and 8.6 for stress. Similarly, the mean scores for the three scales in Group 2 were 12.1, 7.3, and 16.1, and in Group 3 they were 31.3, 22.4, and 34.8, respectively. With higher fuzzy membership degree (which means the nearer the average score is), the music selected for “high” depression, “high” anxiety, and “low” stress is recommended for the participants within the corresponding average scores of Group 1. For users with higher fuzzy membership degree, the music for “normal” depression, “low” anxiety, and “normal” stress is recommended for the participants in Group 2, and music for “high” depression, “high” anxiety, and “high” stress for the participants in Group 3.
For example, when a random user scores 29 in depression, 13 in anxiety, and 7 in stress on the DASS-21, the music appropriate for “high” depression, “normal” anxiety, and “low” stress is recommended. The fuzzy membership degree of this user is computed as 0.583, 0.246, and 0.171 for Group 1, Group 2, and Group 3, respectively. In the current study, a total of 7 music tracks are recommended, consisting of 4 tracks for depression, 2 for anxiety, and 1 for stress.
The recommended list of 7 music tracks had the highest fuzzy membership degree (0.583) in Group 1. Since the severity level was highest in depression—i.e., the highest score (29 points) on the DASS-21 scale—the recommend music included 4 tracks for “high” depression preferred by the participants in Group 1, 2 tracks for the “normal” anxiety in Group 2, and 1 track for the “low” stress in Group 3. If a user’s scores are the same in two or all three scales, the music for the scales with low baseline scores is recommended [31].
Table 1 shows the proportion of recommended music tracks by DASS severity and the number of tracks in each group after fuzzy clustering conducted with 390 individuals having the same severity level ratios.
Group 1 had the highest chance of music recommendation for “high” depression and “normal” stress at 0.81 and 0.76, respectively. By contrast, “normal” depression and “high” anxiety at 0.19 and 0.18, respectively, had the lowest chance of music recommendations. The number of music tracks recommended for “high” depression was 4.64 (the largest number), while no music was recommended to users with “low” depression and “high” stress because they did not obtain any DASS score. The highest chance of music recommendation in group 2 was for “low” anxiety at 0.64, and the lowest chance was for “high” stress at 0.11. The number of music tracks recommended for “low” anxiety was 4.54 (the highest number), while 0.79 was the smallest in Group 2. The highest chance of music recommendation in group 3 was for “high” depression and “high” anxiety at 0.74 and 0.84, respectively. This mobile application does not provide music for “low” levels of all scales. Since the ratios of the severe levels were relatively higher in Group 3 than in the other two groups, the music for “low” levels of all scales was not recommended.
3.2. Comparison with Other Samples in the Dataset
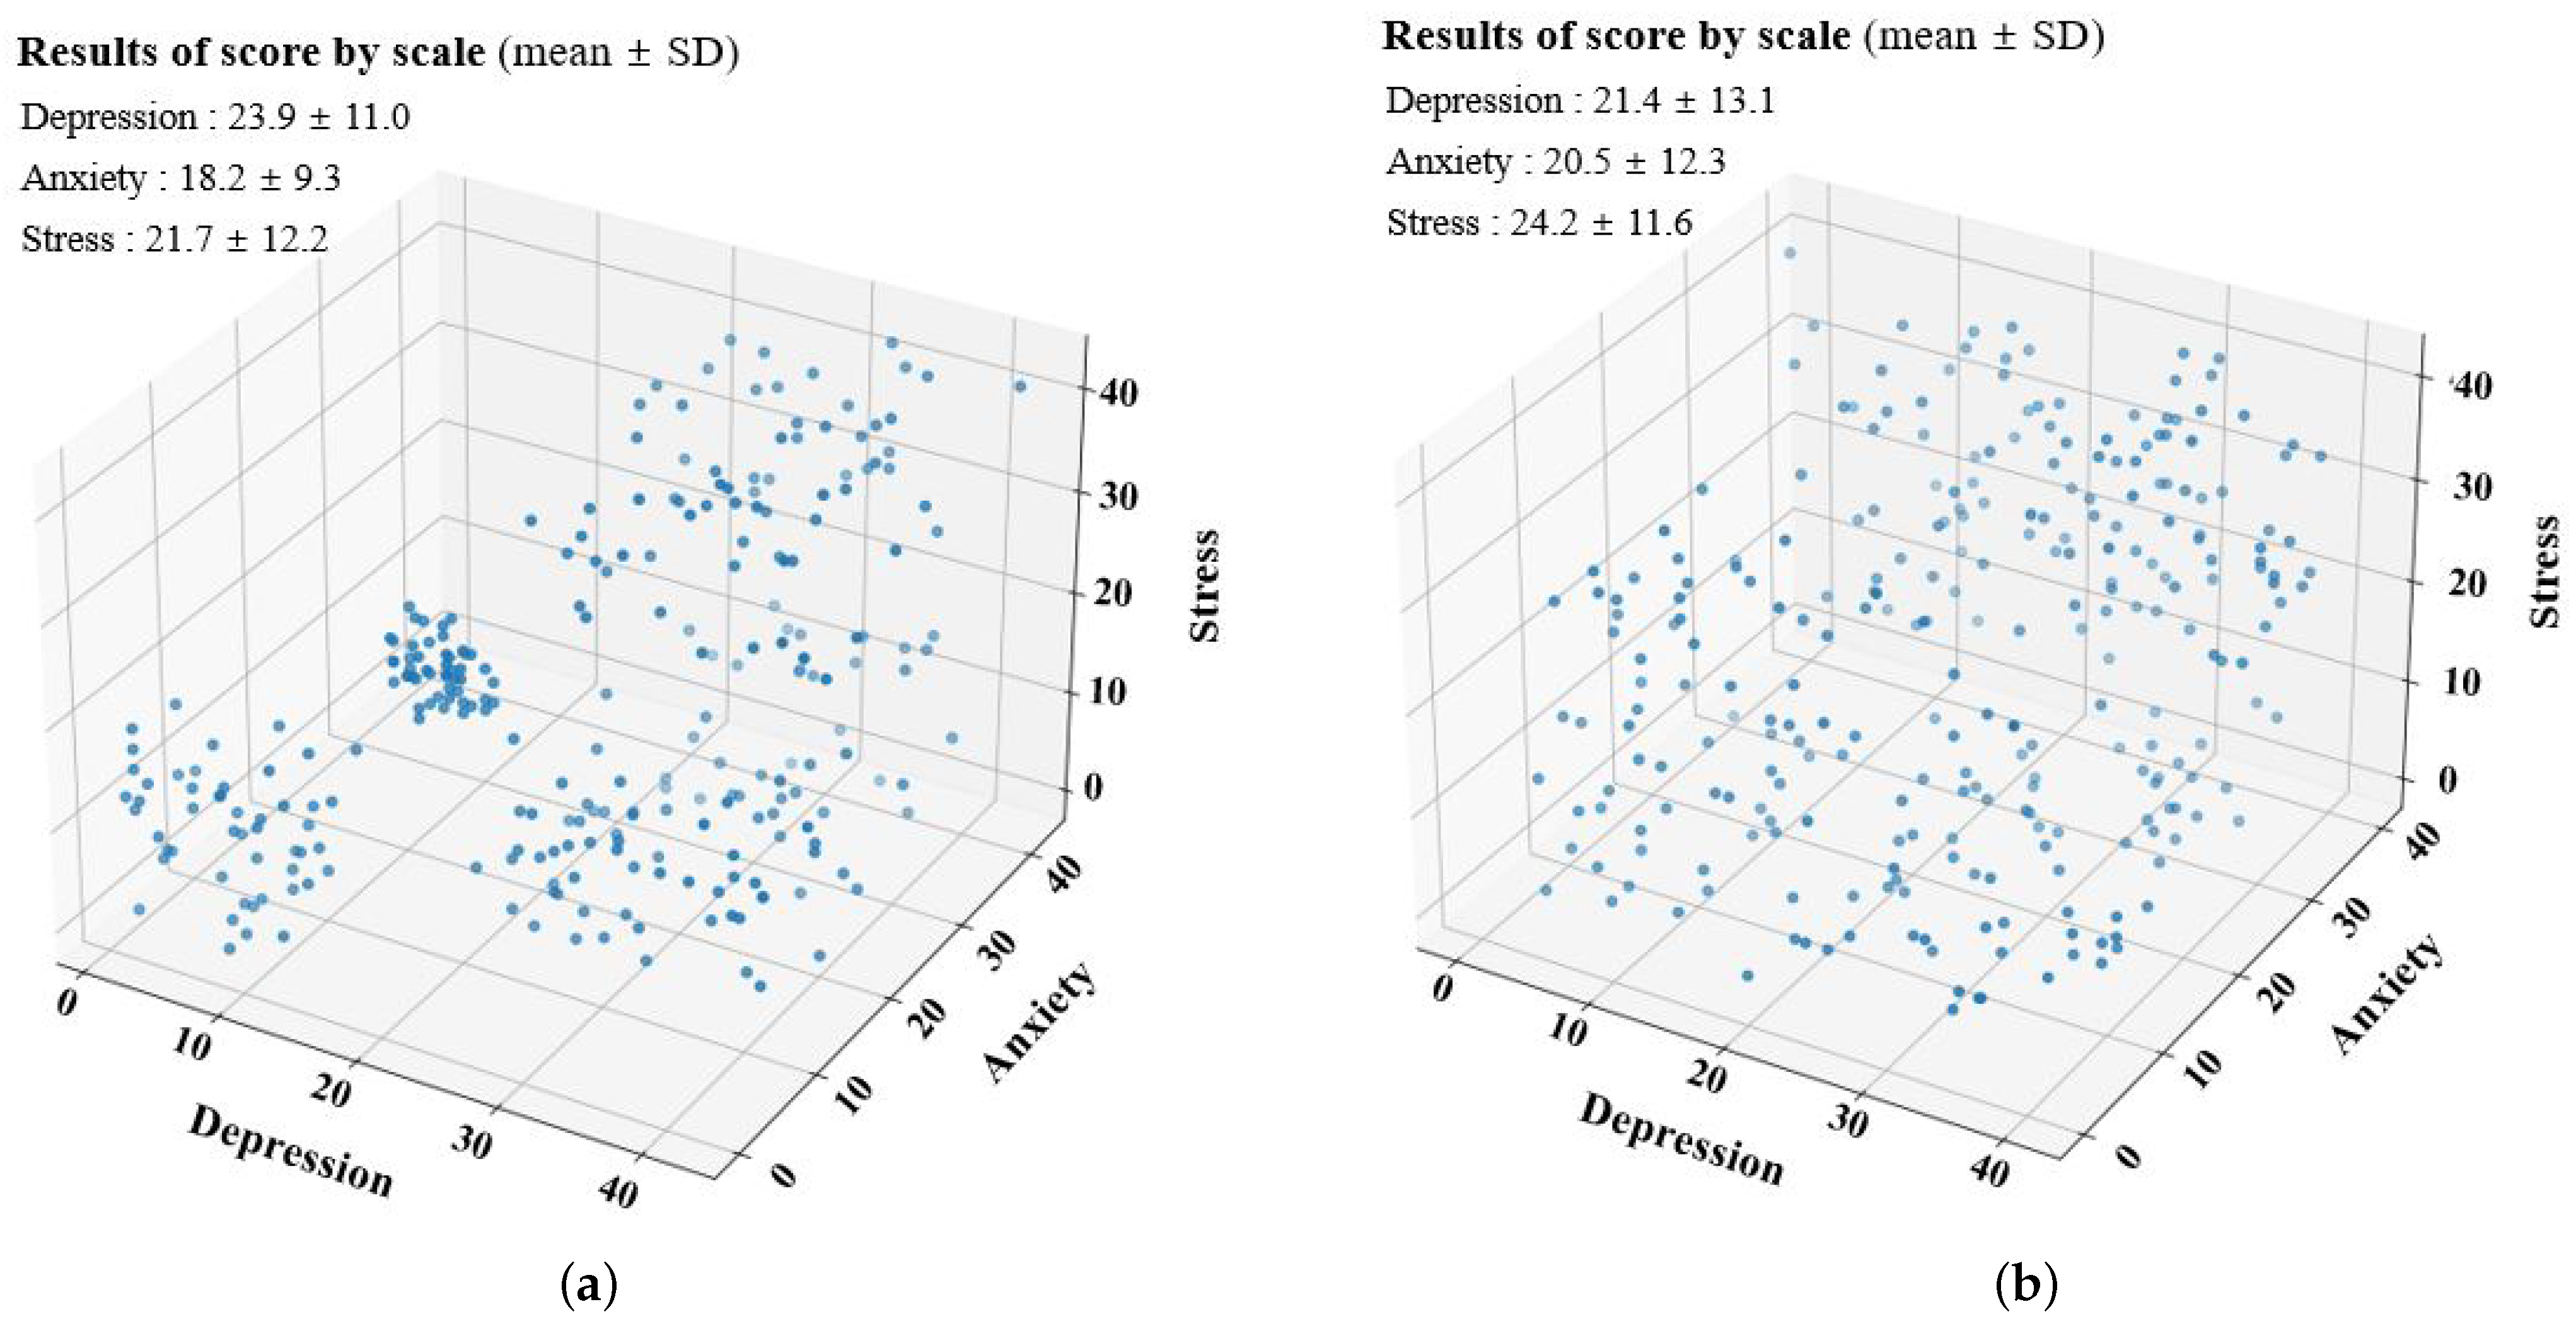
Based on the Open-Source DASS Survey, 390 samples were extracted with the same severity ratio, and a dataset of samples with the same size (n = 390) was generated through non-restore simple randomization. The dataset was then compared with the results of fuzzy clustering. The distribution of the resulting scores with regard to depression, anxiety, and stress scales of the two extracted samples is shown in Figure 7. Figure 7a shows the distribution of samples extracted having the same severity ratio, and the average score and standard deviation of their depression, anxiety, and stress scale results were depression 23.9 ± 11.0 points, anxiety 18.2 ± 9.3 points, and stress 22.7 ± 12.2 points. Figure 7b shows the distribution of samples generated through non-restore simple randomization, and the average score and standard deviation of their depression, anxiety, and stress scales were depression 21.4 ± 10.7 points, anxiety 22.5 ± 12.3 points, and stress 18.2 ± 9.7 points. In addition, an independent sample t-test ( = 0.05) was performed to test whether there was a difference in average scores for the two samples extracted, and there were statistically significant differences in the scores of depression (t = 2.671, p = 0.04), anxiety (t = 3.127, p = 0.03), and stress (t = 2.584, p = 0.04).
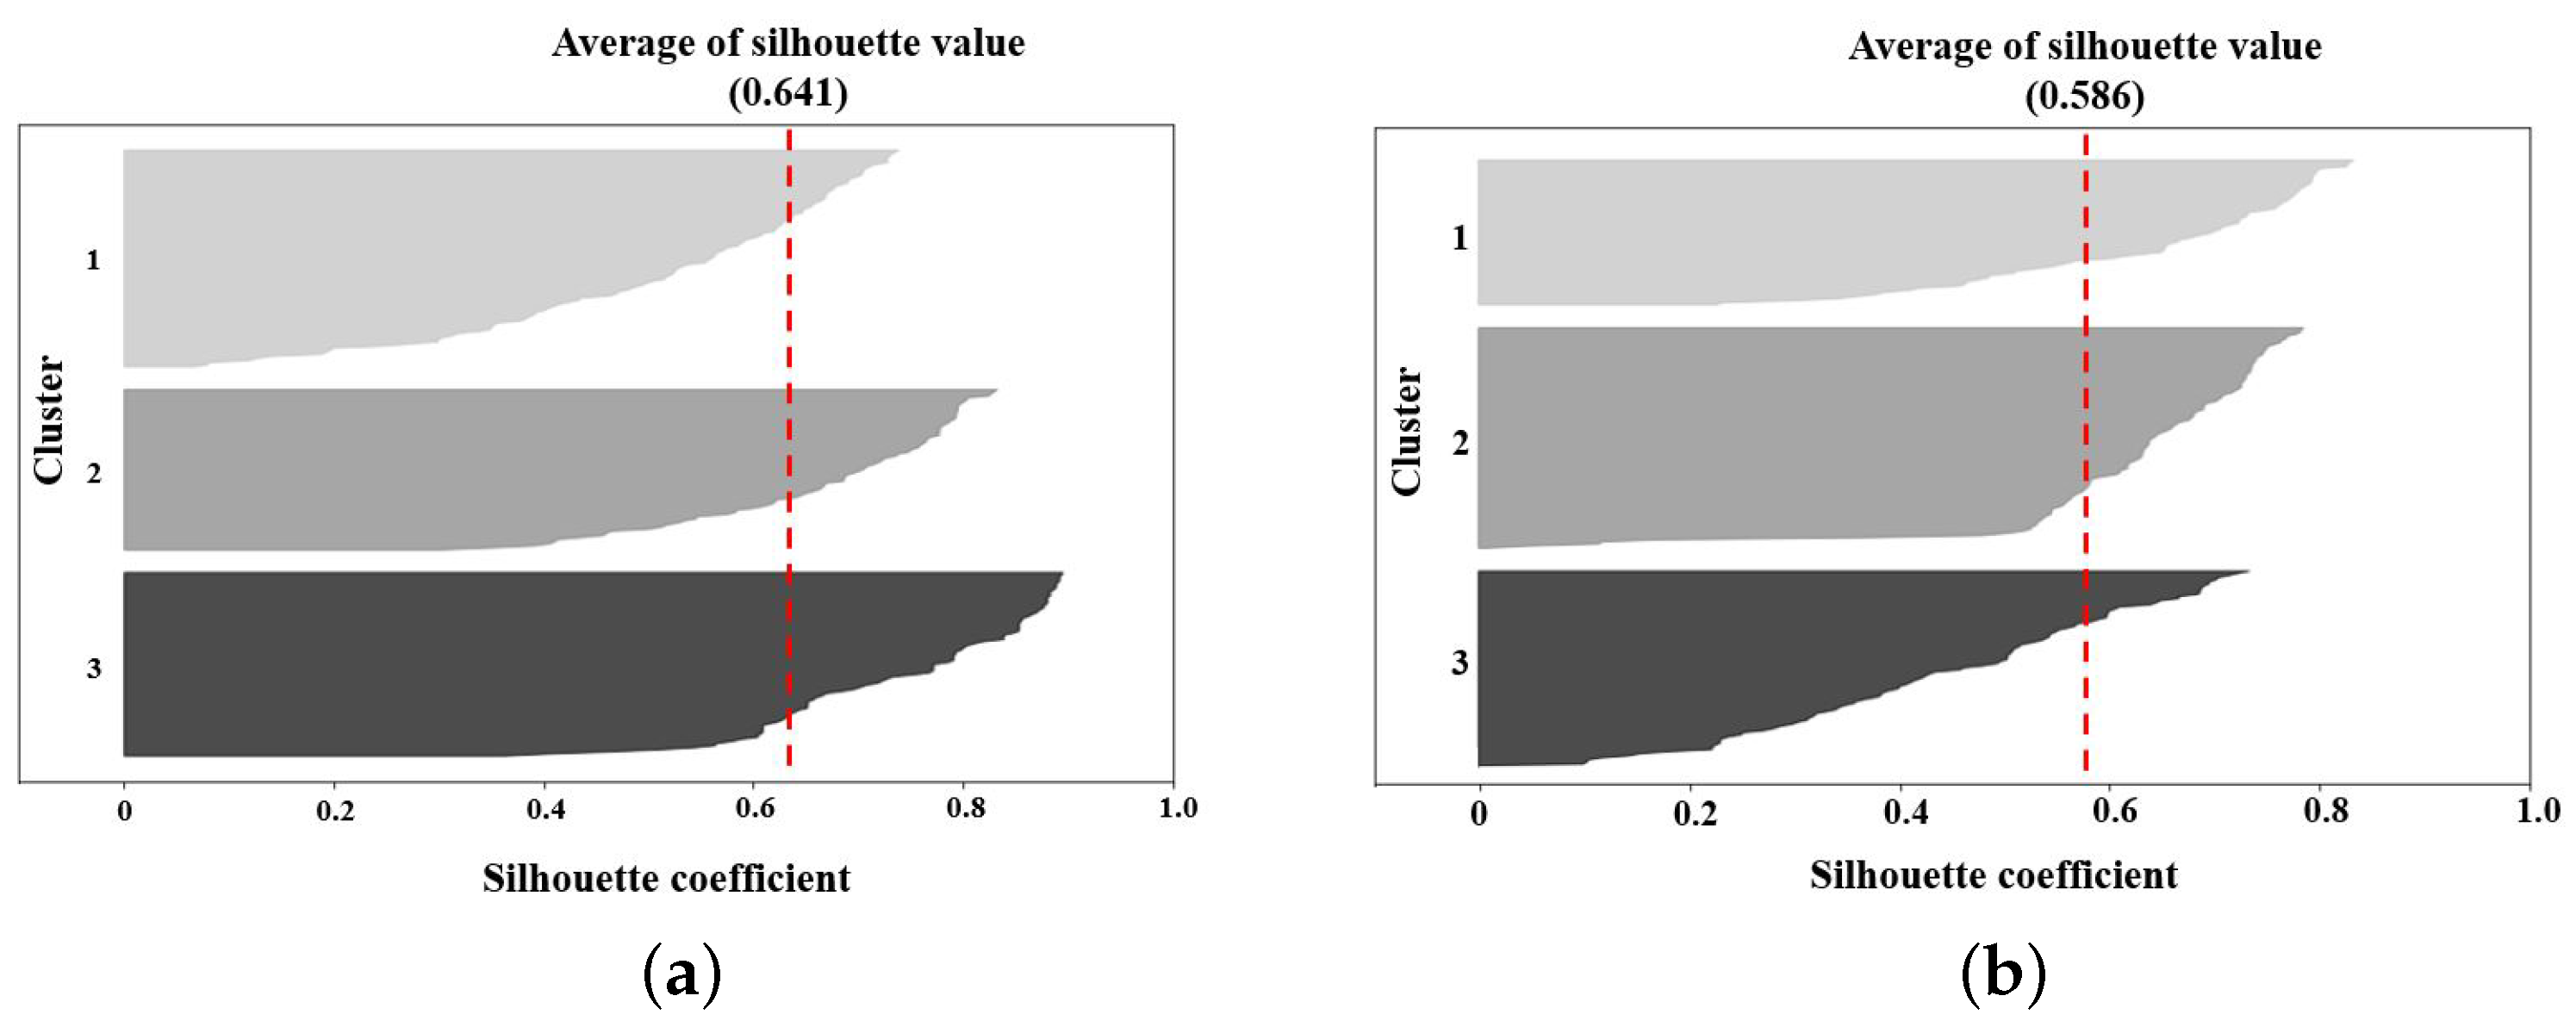
Figure 8 shows a comparison of the silhouette coefficients representing the degree of cohesion within the same cluster and the degree of separation between different clusters based on distance to evaluate the fuzzy clustering results of samples with the same severity ratio and samples with non-restore simple randomization. In Figure 8a,b, when the number of clusters was set to 3, the degree of data cohesion in all the clusters was greater than 0, and the average silhouette coefficient was 0.641 and 0.586, respectively. Here, the silhouette coefficient has a value between −1 and 1; if it is greater than 0 and closer to 1, the data within the same cluster can be interpreted as homogeneous and heterogeneous when the data are in different clusters. Furthermore, the smaller and closer to −1 the Silhouette coefficient, the more heterogeneous data are classified into the same cluster [32]—that is, the cluster results were appropriately achieved even for different datasets.
3.3. Music Recommendation in Mobile Application
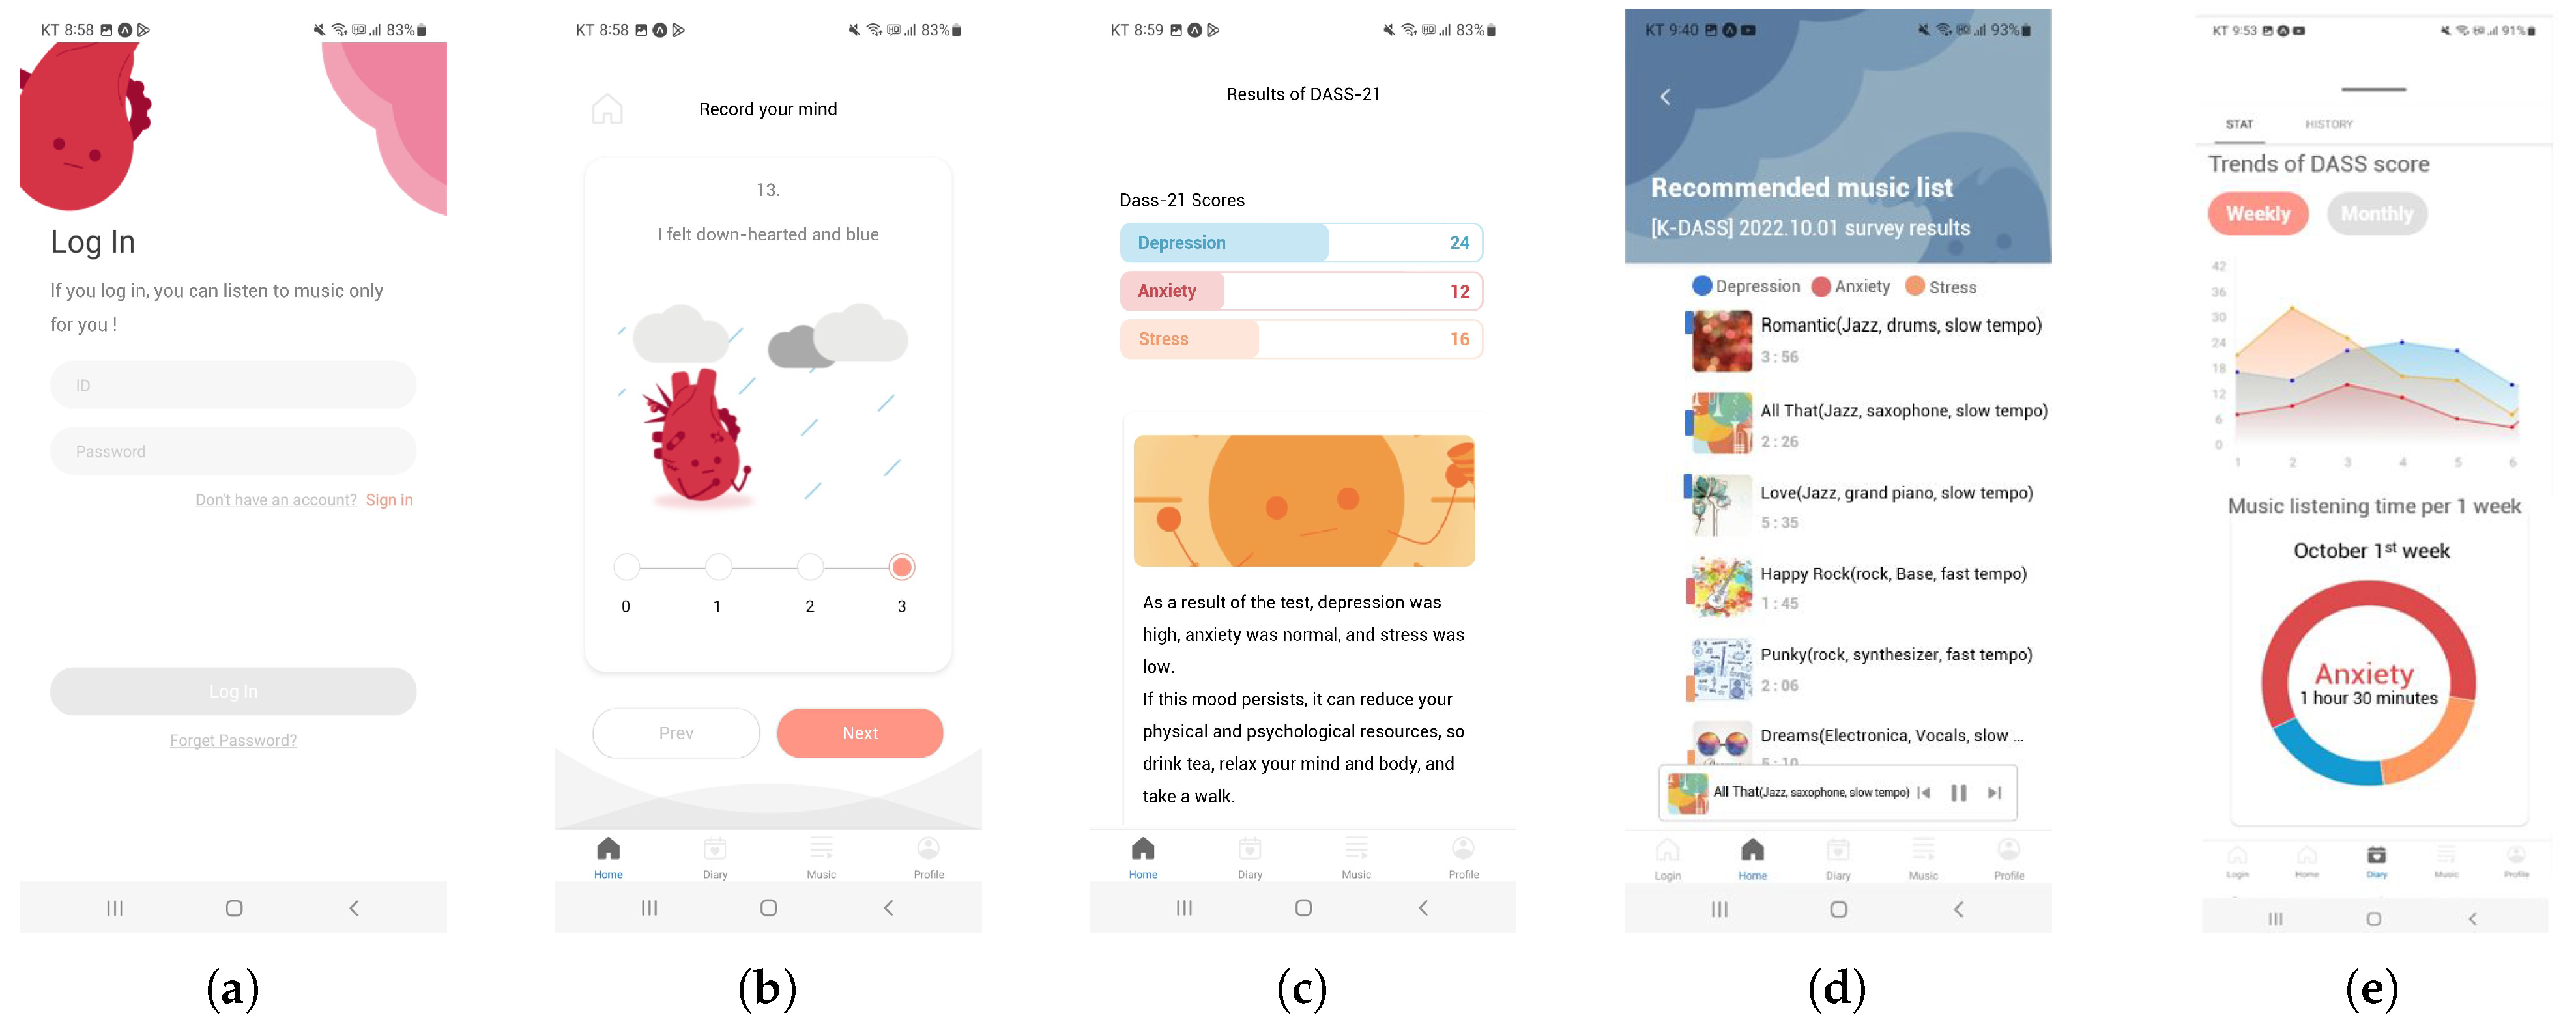
Based on the above results, Figure 9 shows the process of music recommendation screen in the mobile application, displaying the recommended music list and the outcomes after listening to them based on the above findings. Figure 9a shows the login screen when a user executes the mobile application, and when the ID and password are entered. Figure 9b shows the screen on which the user answers the DASS-21 questionnaire and where scores from 0 to 3 are given for each of the 21 questions. The final score for all of the 21 questions is shown as Figure 9c, and if the user acquires 24 points for depression, 12 points for anxiety, and 16 points for stress in each scale, the music tracks corresponding to depression “High”, anxiety “Normal”, and stress “Low” are recommended. The music list recommended to this user for depression, anxiety, and stress depends on fuzzy membership degree based on the DASS scores, as shown in Figure 9d. In addition, the three colors on the left side of each music distinguish the music appropriate for depression, anxiety, and stress, and the location of the colors (top, middle, bottom) indicates the music for different severity levels, “high”, “normal”, and “low”. For example, the music marked in blue on top means it is for “high” depression, and the music marked in red in the middle is for “normal” anxiety. After listening to the music, the changes in the DASS scores and music listening time by each scale are shown in Figure 9e. These findings reveal the changes in weekly and monthly DASS scores; emotional states; preferred music; and listening time, which depends upon different emotional states.
4. Discussion
The current research recommended music to users with the most common mental health problems, viz. depression, anxiety, and stress. The mean score for each scale was 23.6 points in depression, 17.4 in anxiety, and 23.3 in stress. The average score was lowest in the anxiety scale. The baseline score for “severe” was 21 points in depression and 15 in anxiety, respectively. The mean score (17.4) of anxiety was lower than the mean score (23.6) of depression, but the proportions of severity levels were similar for all scales. In particular, the proportion was largest in “extremely severe” for both depression and anxiety scales. On the contrary, the baseline score for “severe” was 26 points in stress, which was relatively higher than that of depression and anxiety. For this reason, the majority of the respondents were distributed below “moderate” within the ranges of moderate level. The percentage of each severity level was the highest for “normal”. This distribution of severity in the current study was obtained by examining the degree of depression and anxiety stress among medical workers during the COVID-19 outbreak, viz. 64.7% for all the participants, 51.6% for anxiety, and 41.2% for stress. This severity distribution result is similar to that of Elbay et al. (2020) [33]. Furthermore, since the baseline scores for distinguishing severity levels varied with scale, there may be problems in recommending music based on the scores of different scales. For example, even though a respondent obtains the same score of 15 points in all scales, the severity level is assessed as “moderate” for depression, “severe” for anxiety, and “mild” for stress. Therefore, despite the same score in all scales, this person may be recommended with music appropriate for severe anxiety.
To design a system that can recommend music according to the severity of each scale—viz. depression, anxiety, and stress—users with similar emotional states were clustered using fuzzy clustering based on open datasets and divided into three groups based on the cohesion curve. When emotional states are classified according to data clustering, users with high severity levels can be recommended with music according to the severity levels of different scales. Likewise, M.C. Chiu et al. (2017) also categorized music to alleviate negative psychological conditions. Fuzzy clustering was applied by the authors to classify musical characteristics (tempo, volume, amplitude) for music treatment. However, such a method differs from the one used in the current study where fuzzy clustering was applied to classify the users with similar psychological states [34]. Consequently, users with a high fuzzy membership degree for Groups 1 and 3 were recommended with choices of music falling under “high” depression and anxiety. By contrast, Group 1 was provided with music appropriate for “low” stress, while Group 3 was suggested music suitable for “high” stress. Group 2 consisted of users at relatively “moderate” levels or below. The chances of music recommendation for low emotional scales increased for users with high severity levels, as the number of users belonging to this group increased.
Furthermore, the silhouette coefficient of sampling with severity ratio was compared with simple random sampling without replacement, and the values were found to be 0.641 and 0.586, respectively, which were greater than 0. The data cohesion in each cluster greater than 0 means that each datum is classified into the nearest cluster. This can be considered an appropriate classification of clusters through fuzzy clustering in the two samples, where the silhouette coefficients for different samples were similar and close to 1.
5. Limitations
In the present study, the reliability of the DASS-21 questionnaire score may decrease if the questionnaire is memorized by the user. Moreover, the psychological state was measured only once a week, and music was recommended based on the result score. Therefore, since the music list was not recommended by evaluating the emotional state in real time, the limitation is that the same music list was recommended for a week. In addition, since the music list was recommended for a week based on the time of measuring the psychological state, there is a limitation that the music list corresponding to the changing psychological state was not recommended.
6. Conclusions
In this study, based on the DASS-21 questionnaire that quantitatively measures the current psychological state of users and can distinguish the severity of depression, anxiety, and stress, we proposed a music recommendation service in a mobile environment using fuzzy clustering. Further studies are warranted to clarify in detail the characteristics of groups by using a variety of datasets and including more parameters such as age, gender, and personality traits so that a wider choice of music genres tailored and optimized for different users can be recommended. Accordingly, research should be conducted to collect DASS questionnaire data from participants of various age groups, genders, and occupations, and to recommend music more suitable for users’ current psychological state through fuzzy clustering.
Moreover, since satisfaction with the recommended music is expected to increase when the feature of the preferred music gradually accumulates after consistent listening to initially recommended music, further studies are needed to evaluate satisfaction and accuracy in recommended music according to the length of time. Furthermore, the effect of music needs to be verified by determining how effectively the recommended music provides emotional relief for each scale by assessing the changes in user’s emotional states over time. In particular, a comparative study on the correlation and association of emotional relief with music composed for this study and ordinary music (classical music, jazz, blues, and other genres) is expected to be helpful in recommending more suitable music for current emotional states for anyone. Additionally, further studies are anticipated to provide more appropriate choices of music for users with more unstable emotional states and serious mood shifts by exploring advanced music recommendation algorithms to improve concentration difficulty and insomnia.
Author Contributions
Conceptualization, E.W. and S.C.; methodology, E.W., H.L. and K.D.; software, M.L. and K.D.; validation, E.W. and S.C.; formal analysis, E.W. and H.L.; data curation, H.L., K.D. and M.L.; writing—original draft preparation, all authors; writing—review and editing, S.C.; visualization, M.L.; supervision, E.W. and S.C.; project administration, E.W. All authors have read and agreed to the published version of the manuscript.
Funding
This work was partly supported by the Technology development Program of MSS [S3148598] and the Korea Institute for Advancement of Technology (KIAT) grant funded by the Korean Government (MOTIE) (P0012725, 2022 Emerging Technology Integrated Design Education program).
Institutional Review Board Statement
Not applicable.
Informed Consent Statement
Not applicable.
Data Availability Statement
The data Depression Anxiety Stress Scales Responses from Kaggle were used in this study. The dataset consists of questions, answers, and metadata collected from Depression Anxiety Stress Scale and the data is available at https://www.kaggle.com/datasets/lucasgreenwell/depression-anxiety-stress-scales-responses (accessed on 3 June 2020).
Conflicts of Interest
The authors declare no conflict of interest.
Appendix A
Figure A1.
DASS-21 questionnaire and scoring instructions.


References
- Lee, Y.; National Center for Mental Health. National Mental Health Statistics 2019. 2019. Available online: https://www.ncmh.go.kr (accessed on 30 October 2020).
- Ramon-Arbues, E.; Gea-Caballero, V.; Granada-Lpez, J.M.; Juarez-Vela, R.; Pellicer-Garcia, B.; Anton-Solanas, I. The prevalence of depression, anxiety and stress and their associated factors in college students. Int. J. Environ. Res. Public Health 2020, 17, 7001. [Google Scholar] [CrossRef] [PubMed]
- Jun, D.; O’Leary, S.; McPhail, S.M.; Johnston, V. Job strain and psychological distress in office workers: The role of coping. Work 2019, 64, 55–65. [Google Scholar] [CrossRef] [PubMed]
- Wainberg, M.L.; Scorza, P.; Shultz, J.M.; Helpman, L.; Mootz, J.J.; Johnson, K.A.; Neria, Y.; Bradford, J.M.E.; Oquendo, M.A.; Arbuckle, M.R. Challenges and opportunities in global mental health: A research-to-practice perspective. Curr. Psychiatry Rep. 2017, 19, 1–10. [Google Scholar] [CrossRef] [PubMed] [Green Version]
- Diagnostic and statistical manual of mental disorders. Am. Psychiatr. Assoc. 2013, 21, 591–643.
- Herbison, C.E.; Allen, K.; Robinson, M.; Newnham, J.; Pennell, C. The impact of life stress on adult depression and anxiety is dependent on gender and timing of exposure. Dev. Psychopathol. 2017, 29, 1443–1454. [Google Scholar] [CrossRef]
- Auerbach, R.P.; Mortier, P.; Bruffaerts, R.; Alonso, J.; Benjet, C.; Cuijpers, P.; Demyttenaere, K.; Ebert, D.D.; Green, J.G.; Hasking, P.; et al. WHO World Mental Health Surveys International College Student Project: Prevalence and distribution of mental disorders. J. Abnorm. Psychol. 2018, 127, 623. [Google Scholar] [CrossRef]
- Lee, J.; Lee, E.H.; Moon, S.H. Systematic review of the measurement properties of the Depression Anxiety Stress Scales–21 by applying updated COSMIN methodology. Qual. Life Res. 2019, 28, 2325–2339. [Google Scholar] [CrossRef]
- Lovibond, P.F.; Lovibond, S.H. The structure of negative emotional states: Comparison of the Depression Anxiety Stress Scales (DASS) with the Beck Depression and Anxiety Inventories. Behav. Res. Ther. 1995, 33, 335–343. [Google Scholar] [CrossRef]
- Zaprutko, T.; Göder, R.; Rybakowski, F.; Kus, K.; Kopciuch, D.; Paczkowska, A.; Ratajczak, P.; Nowakowska, E. Non-pharmacological treatments of inpatients with major depression–the case of Polish (Poznan) and German (Kiel) hospital. Complement. Ther. Clin. Pract. 2020, 39, 101129. [Google Scholar] [CrossRef]
- Park, Y.C. Non-pharmacological treatment for depression. J. Korean Med. Assoc. 2011, 54, 376–380. [Google Scholar] [CrossRef] [Green Version]
- Trimmer, C.; Tyo, R.; Pikard, J.; McKenna, C.; Naeem, F. Low-intensity cognitive behavioural therapy-based music group (CBT-music) for the treatment of symptoms of anxiety and depression: A feasibility study. Behav. Cogn. Psychother. 2018, 46, 168–181. [Google Scholar] [CrossRef] [PubMed]
- Hu, J.; Zhang, J.; Hu, L.; Yu, H.; Xu, J. Art Therapy: A Complementary Treatment for Mental Disorders. Front. Psychol. 2021, 12, 686005. [Google Scholar] [CrossRef] [PubMed]
- de Witte, M.; Pinho, A.d.S.; Stams, G.J.; Moonen, X.; Bos, A.E.; van Hooren, S. Music therapy for stress reduction: A systematic review and meta-analysis. Health Psychol. Rev. 2022, 16, 134–159. [Google Scholar] [CrossRef]
- Wang, S.; Agius, M. The use of music therapy in the treatment of mental illness and the enhancement of societal wellbeing. Psychiatr. Danub. 2018, 30, 595–600. [Google Scholar]
- Schedl, M.; Zamani, H.; Chen, C.W.; Deldjoo, Y.; Elahi, M. Current challenges and visions in music recommender systems research. Int. J. Multimed. Inf. Retr. 2018, 7, 95–116. [Google Scholar] [CrossRef] [Green Version]
- Chang, H.Y.; Huang, S.C.; Wu, J.H. A personalized music recommendation system based on electroencephalography feedback. Multimed. Tools Appl. 2017, 76, 19523–19542. [Google Scholar] [CrossRef]
- Dutta, E.; Bothra, A.; Chaspari, T.; Ioerger, T.; Mortazavi, B.J. Reinforcement learning using EEG signals for therapeutic use of music in emotion management. In Proceedings of the 2020 42nd Annual International Conference of the IEEE Engineering in Medicine & Biology Society (EMBC), Montreal, QC, Canada, 20–24 July 2020; pp. 5553–5556. [Google Scholar]
- Rahman, J.S.; Gedeon, T.; Caldwell, S.; Jones, R.; Jin, Z. Towards effective music therapy for mental health care using machine learning tools: Human affective reasoning and music genres. J. Artif. Intell. Soft Comput. Res. 2021, 11, 5–20. [Google Scholar] [CrossRef]
- Amiri, S.; Fard, A.P.; Khaledi-Paveh, B.; Foroughi, A.; Bavafa, A.; Bazani, M.; Mohammadian, Y.; Sadeghi, K. The effectiveness of music therapy on insomnia using Persian traditional music. J. Kermanshah Univ. Med Sci. 2019, 23, e86914. [Google Scholar] [CrossRef] [Green Version]
- Geetha, G.; Safa, M.; Fancy, C.; Saranya, D. A hybrid approach using collaborative filtering and content based filtering for recommender system. J. Phys. Conf. Ser. 2018, 1000, 012101. [Google Scholar] [CrossRef] [Green Version]
- Gupta, G.; Katarya, R. Recommendation analysis on item-based and user-based collaborative filtering. In Proceedings of the 2019 International Conference on Smart Systems and Inventive Technology (ICSSIT), Tirunelveli, India, 27–29 November 2019; pp. 1–4. [Google Scholar]
- AL-Bakri, N.F.; Hashim, S.H. Collaborative Filtering Recommendation Model Based on k-means Clustering. Al-Nahrain J. Sci. 2019, 22, 74–79. [Google Scholar] [CrossRef] [Green Version]
- Golalipour, K.; Akbari, E.; Hamidi, S.S.; Lee, M.; Enayatifar, R. From clustering to clustering ensemble selection: A review. Eng. Appl. Artif. Intell. 2021, 104, 104388. [Google Scholar] [CrossRef]
- Miyamoto, S.; Ichihashi, H.; Honda, K.; Ichihashi, H. Algorithms for Fuzzy Clustering; Springer: Berlin/Heidelberg, Germany, 2008; Volume 10. [Google Scholar]
- Deng, J.; Deng, Y. Information Volume of Fuzzy Membership Function. Int. J. Comput. Commun. Control 2021, 16, 1–14. [Google Scholar] [CrossRef]
- Antony, M.M.; Bieling, P.J.; Cox, B.J.; Enns, M.W.; Swinson, R.P. Psychometric properties of the 42-item and 21-item versions of the Depression Anxiety Stress Scales in clinical groups and a community sample. Psychol. Assess. 1998, 10, 176. [Google Scholar] [CrossRef]
- Garg, A.; Chaturvedi, V.; Kaur, A.B.; Varshney, V.; Parashar, A. Machine learning model for mapping of music mood and human emotion based on physiological signals. Multimed. Tools Appl. 2022, 81, 5137–5177. [Google Scholar] [CrossRef]
- Leubner, D.; Hinterberger, T. Reviewing the effectiveness of music interventions in treating depression. Front. Psychol. 2017, 8, 1109. [Google Scholar] [CrossRef] [PubMed] [Green Version]
- Monga, P.; Sharma, M.; Sharma, S.K. Performance Analysis of Machine Learning and Soft Computing Techniques in Diagnosis of Behavioral Disorders. In Electronic Systems and Intelligent Computing; Springer: Berlin/Heidelberg, Germany, 2022; pp. 85–99. [Google Scholar]
- Coker, A.; Coker, O.; Sanni, D. Psychometric properties of the 21-item depression anxiety stress scale (DASS-21). Afr. Res. Rev. 2018, 12, 135–142. [Google Scholar] [CrossRef]
- Shahapure, K.R.; Nicholas, C. Cluster quality analysis using silhouette score. In Proceedings of the 2020 IEEE 7th International Conference on Data Science and Advanced Analytics (DSAA), Sydney, NSW, Australia, 6–9 October 2020; pp. 747–748. [Google Scholar]
- Elbay, R.Y.; Kurtulmuş, A.; Arpacıoğlu, S.; Karadere, E. Depression, anxiety, stress levels of physicians and associated factors in COVID-19 pandemics. Psychiatry Res. 2020, 290, 113130. [Google Scholar] [CrossRef]
- Chiu, M.C.; Hsu, Y.W. Using fuzzy c-means clustering based on integration of psychological and physiological data for therapeutic music design. J. Ind. Prod. Eng. 2017, 34, 382–397. [Google Scholar] [CrossRef]
Figure 1.
The process of fuzzy clustering and graphical example.

Figure 2.
The music recommendation service process in mobile application.

Figure 3.
Composition of the DASS-21 scale with 45 music tracks.

Figure 4.
Distribution of DASS dataset’s score and severity. (a,b) Depression scale. (c,d) Anxiety scale. (e,f) Stress scale.
Figure 4.
Distribution of DASS dataset’s score and severity. (a,b) Depression scale. (c,d) Anxiety scale. (e,f) Stress scale.

Figure 5.
Optimization for number of fuzzy clustering.

Figure 6.
Visualization of fuzzy clustering for three groups using open-source DASS survey.

Figure 7.
Results of DASS-21 scores by samples. (a) Sampling with severity ratio samples. (b) Simple random sampling without replacement.
Figure 7.
Results of DASS-21 scores by samples. (a) Sampling with severity ratio samples. (b) Simple random sampling without replacement.

Figure 8.
Results of silhouette coefficient by samples. (a) Sampling with severity ratio samples. (b) Simple random sampling without replacement.
Figure 8.
Results of silhouette coefficient by samples. (a) Sampling with severity ratio samples. (b) Simple random sampling without replacement.

Figure 9.
Screen of music recommendation process in mobile application. (a) Login page. (b) DASS-21 survey. (c) Score of DASS-21. (d) Recommended music list. (e) Trends of DASS score and music listening time.
Figure 9.
Screen of music recommendation process in mobile application. (a) Login page. (b) DASS-21 survey. (c) Score of DASS-21. (d) Recommended music list. (e) Trends of DASS score and music listening time.


Table 1.
Results of proportion and average number of music tracks by DASS severity.
| Music | Group 1 | Group 2 | Group 3 | ||||
|---|---|---|---|---|---|---|---|
| DASS | Severity | Prop. | No. Music | Prop. | No. Music | Prop. | No. Music |
| High | 0.81 | 4.64 | 0.35 | 1.45 | 0.74 | 4.52 | |
| Depression | Middle | 0.19 | 0.83 | 0.32 | 1.51 | 0.26 | 1.24 |
| Low | - | - | 0.33 | 1.29 | - | - | |
| High | 0.18 | 1.89 | 0.16 | 2.58 | 0.84 | 4.76 | |
| Anxiety | Middle | 0.41 | 2.28 | 0.20 | 1.71 | 0.16 | 1.61 |
| Low | 0.32 | 2.43 | 0.64 | 4.54 | - | - | |
| High | - | - | 0.11 | 0.79 | 0.58 | 1.54 | |
| Stress | Middle | 0.76 | 1.47 | 0.52 | 2.57 | 0.42 | 2.78 |
| Low | 0.24 | 1.12 | 0.37 | 2.12 | - | - | |
Disclaimer/Publisher’s Note: The statements, opinions and data contained in all publications are solely those of the individual author(s) and contributor(s) and not of MDPI and/or the editor(s). MDPI and/or the editor(s) disclaim responsibility for any injury to people or property resulting from any ideas, methods, instructions or products referred to in the content. |
© 2022 by the authors. Licensee MDPI, Basel, Switzerland. This article is an open access article distributed under the terms and conditions of the Creative Commons Attribution (CC BY) license (https://creativecommons.org/licenses/by/4.0/).
Share and Cite
MDPI and ACS Style
Wang, E.; Lee, H.; Do, K.; Lee, M.; Chung, S. Recommendation of Music Based on DASS-21 (Depression, Anxiety, Stress Scales) Using Fuzzy Clustering. Electronics 2023, 12, 168. https://doi.org/10.3390/electronics12010168
AMA Style
Wang E, Lee H, Do K, Lee M, Chung S. Recommendation of Music Based on DASS-21 (Depression, Anxiety, Stress Scales) Using Fuzzy Clustering. Electronics. 2023; 12(1):168. https://doi.org/10.3390/electronics12010168
Chicago/Turabian StyleWang, Eunyoung, Hyeokmin Lee, Kyunghee Do, Moonhwan Lee, and Sungtaek Chung. 2023. "Recommendation of Music Based on DASS-21 (Depression, Anxiety, Stress Scales) Using Fuzzy Clustering" Electronics 12, no. 1: 168. https://doi.org/10.3390/electronics12010168
Note that from the first issue of 2016, this journal uses article numbers instead of page numbers. See further details here.