
The Hemodynamic Effect of Modified Blalock–Taussig Shunt Morphologies: A Computational Analysis Based on Reduced Order Modeling

 , , and
Abstract
:1. Introduction
2. Theoretical Background
2.1. The Mesh Morphing Technique
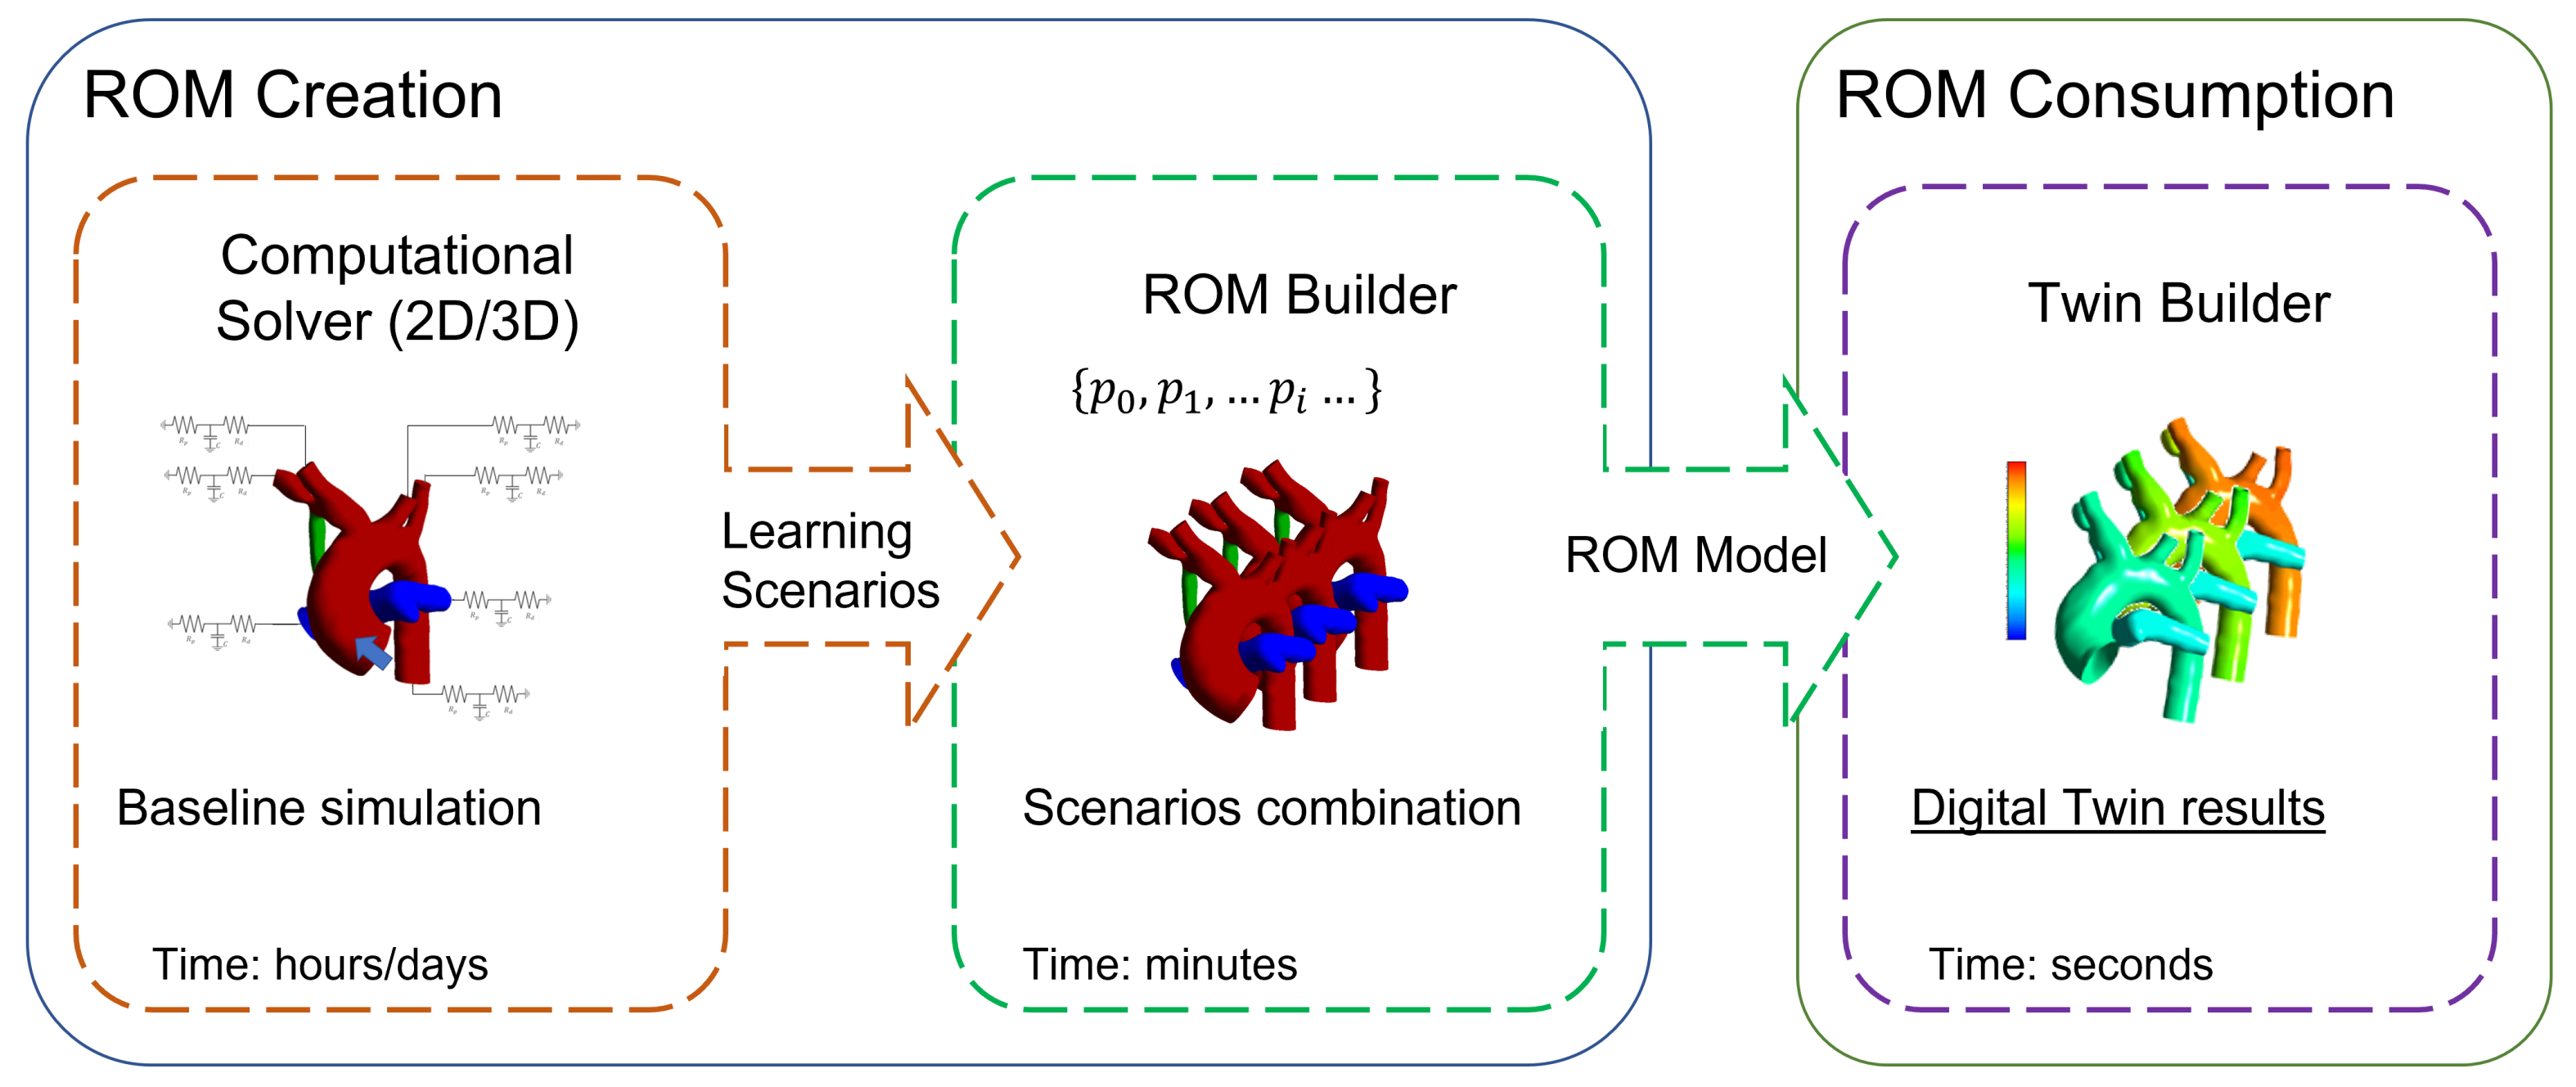
2.2. Reduced Order Modeling
3. Materials and Methods
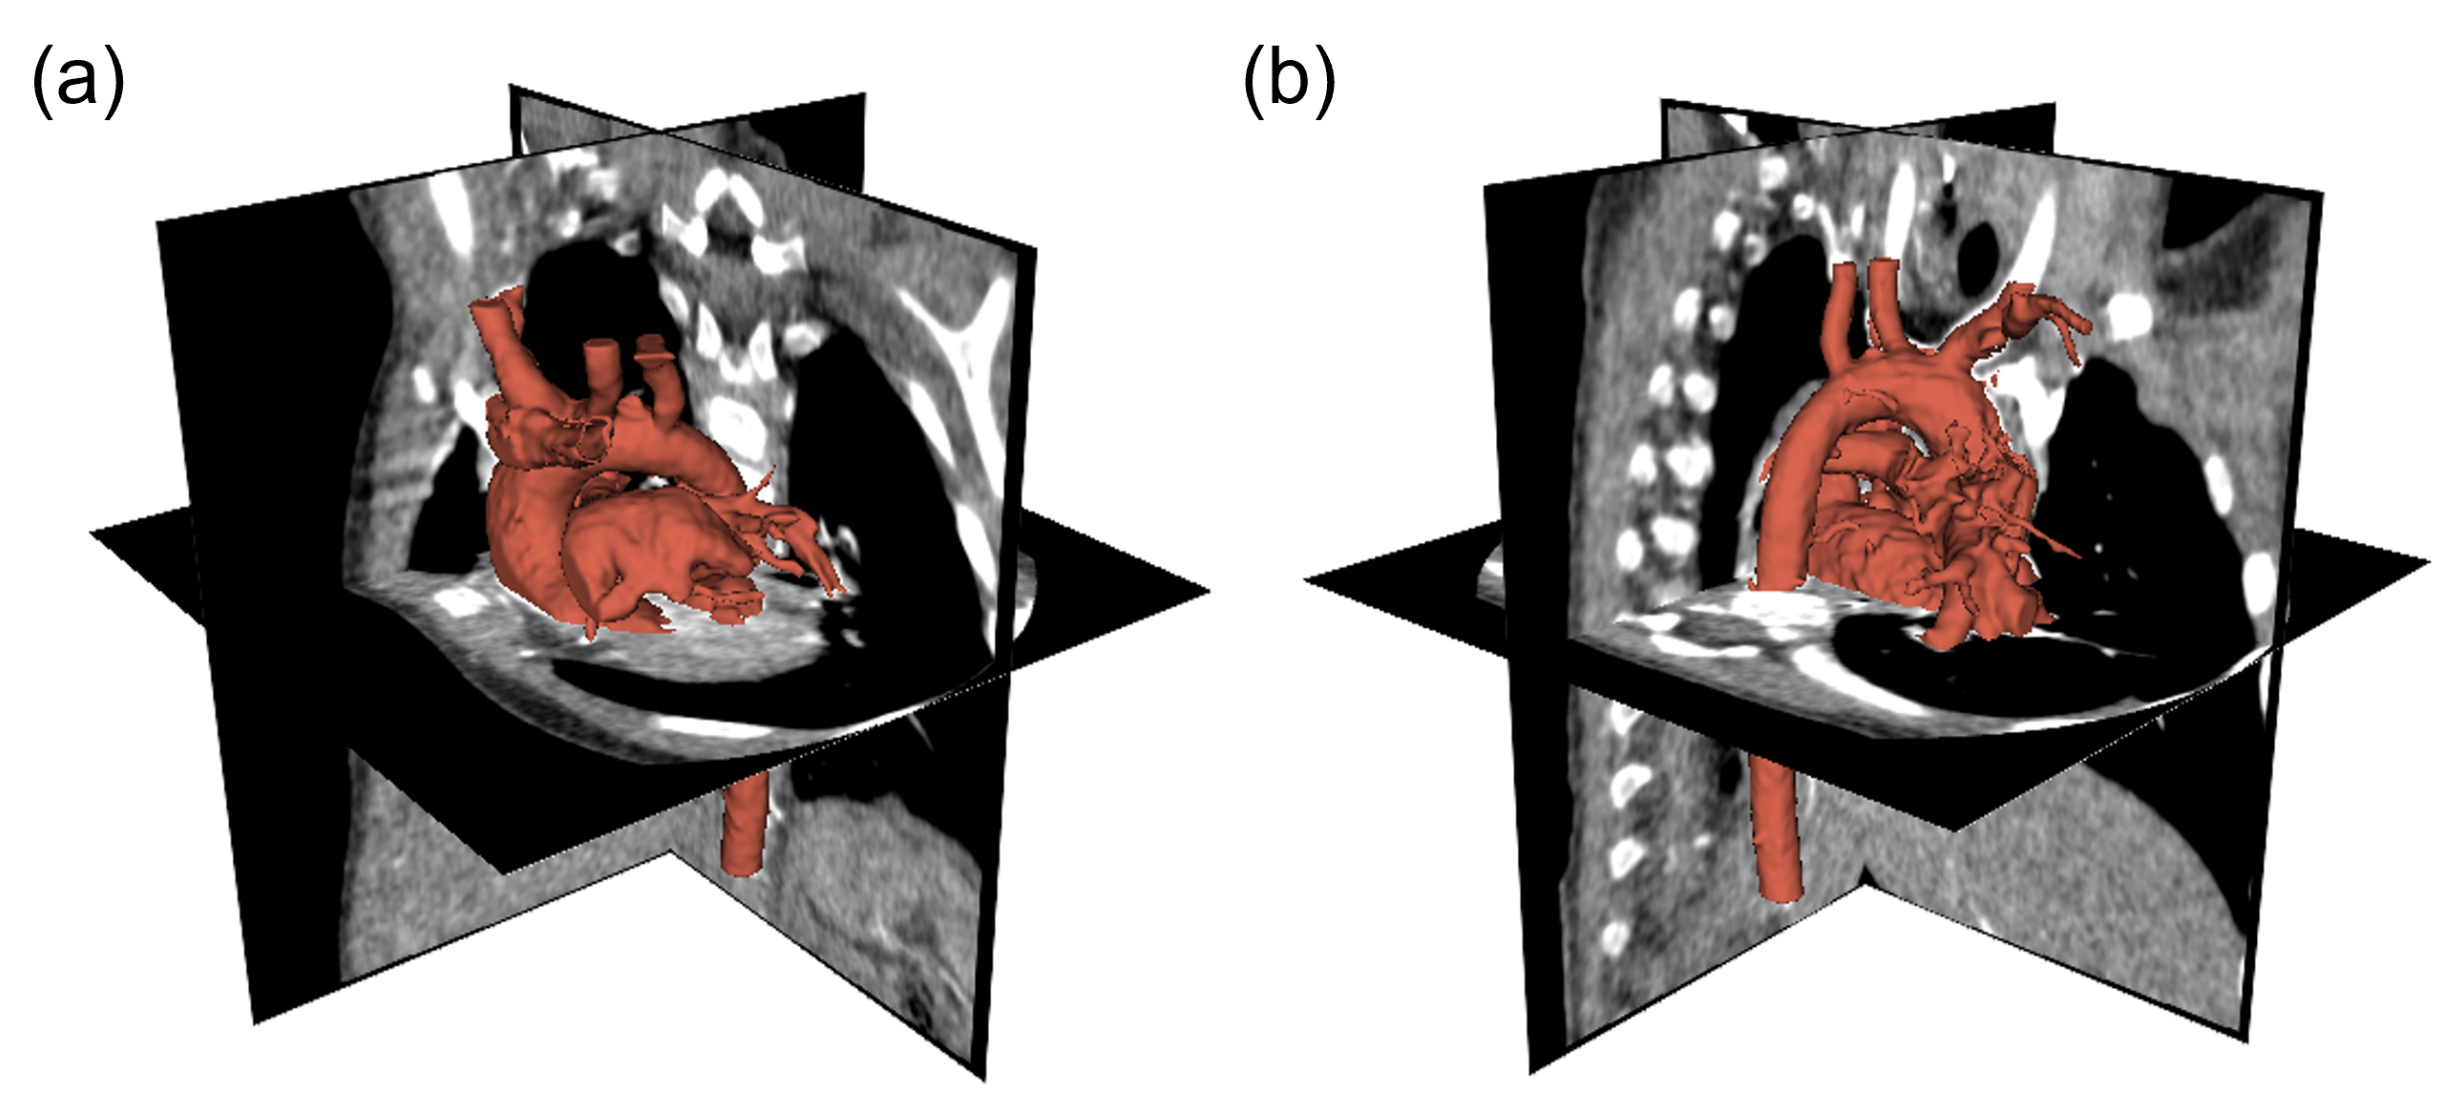
3.1. Patient-Specific Data Pre-Processing
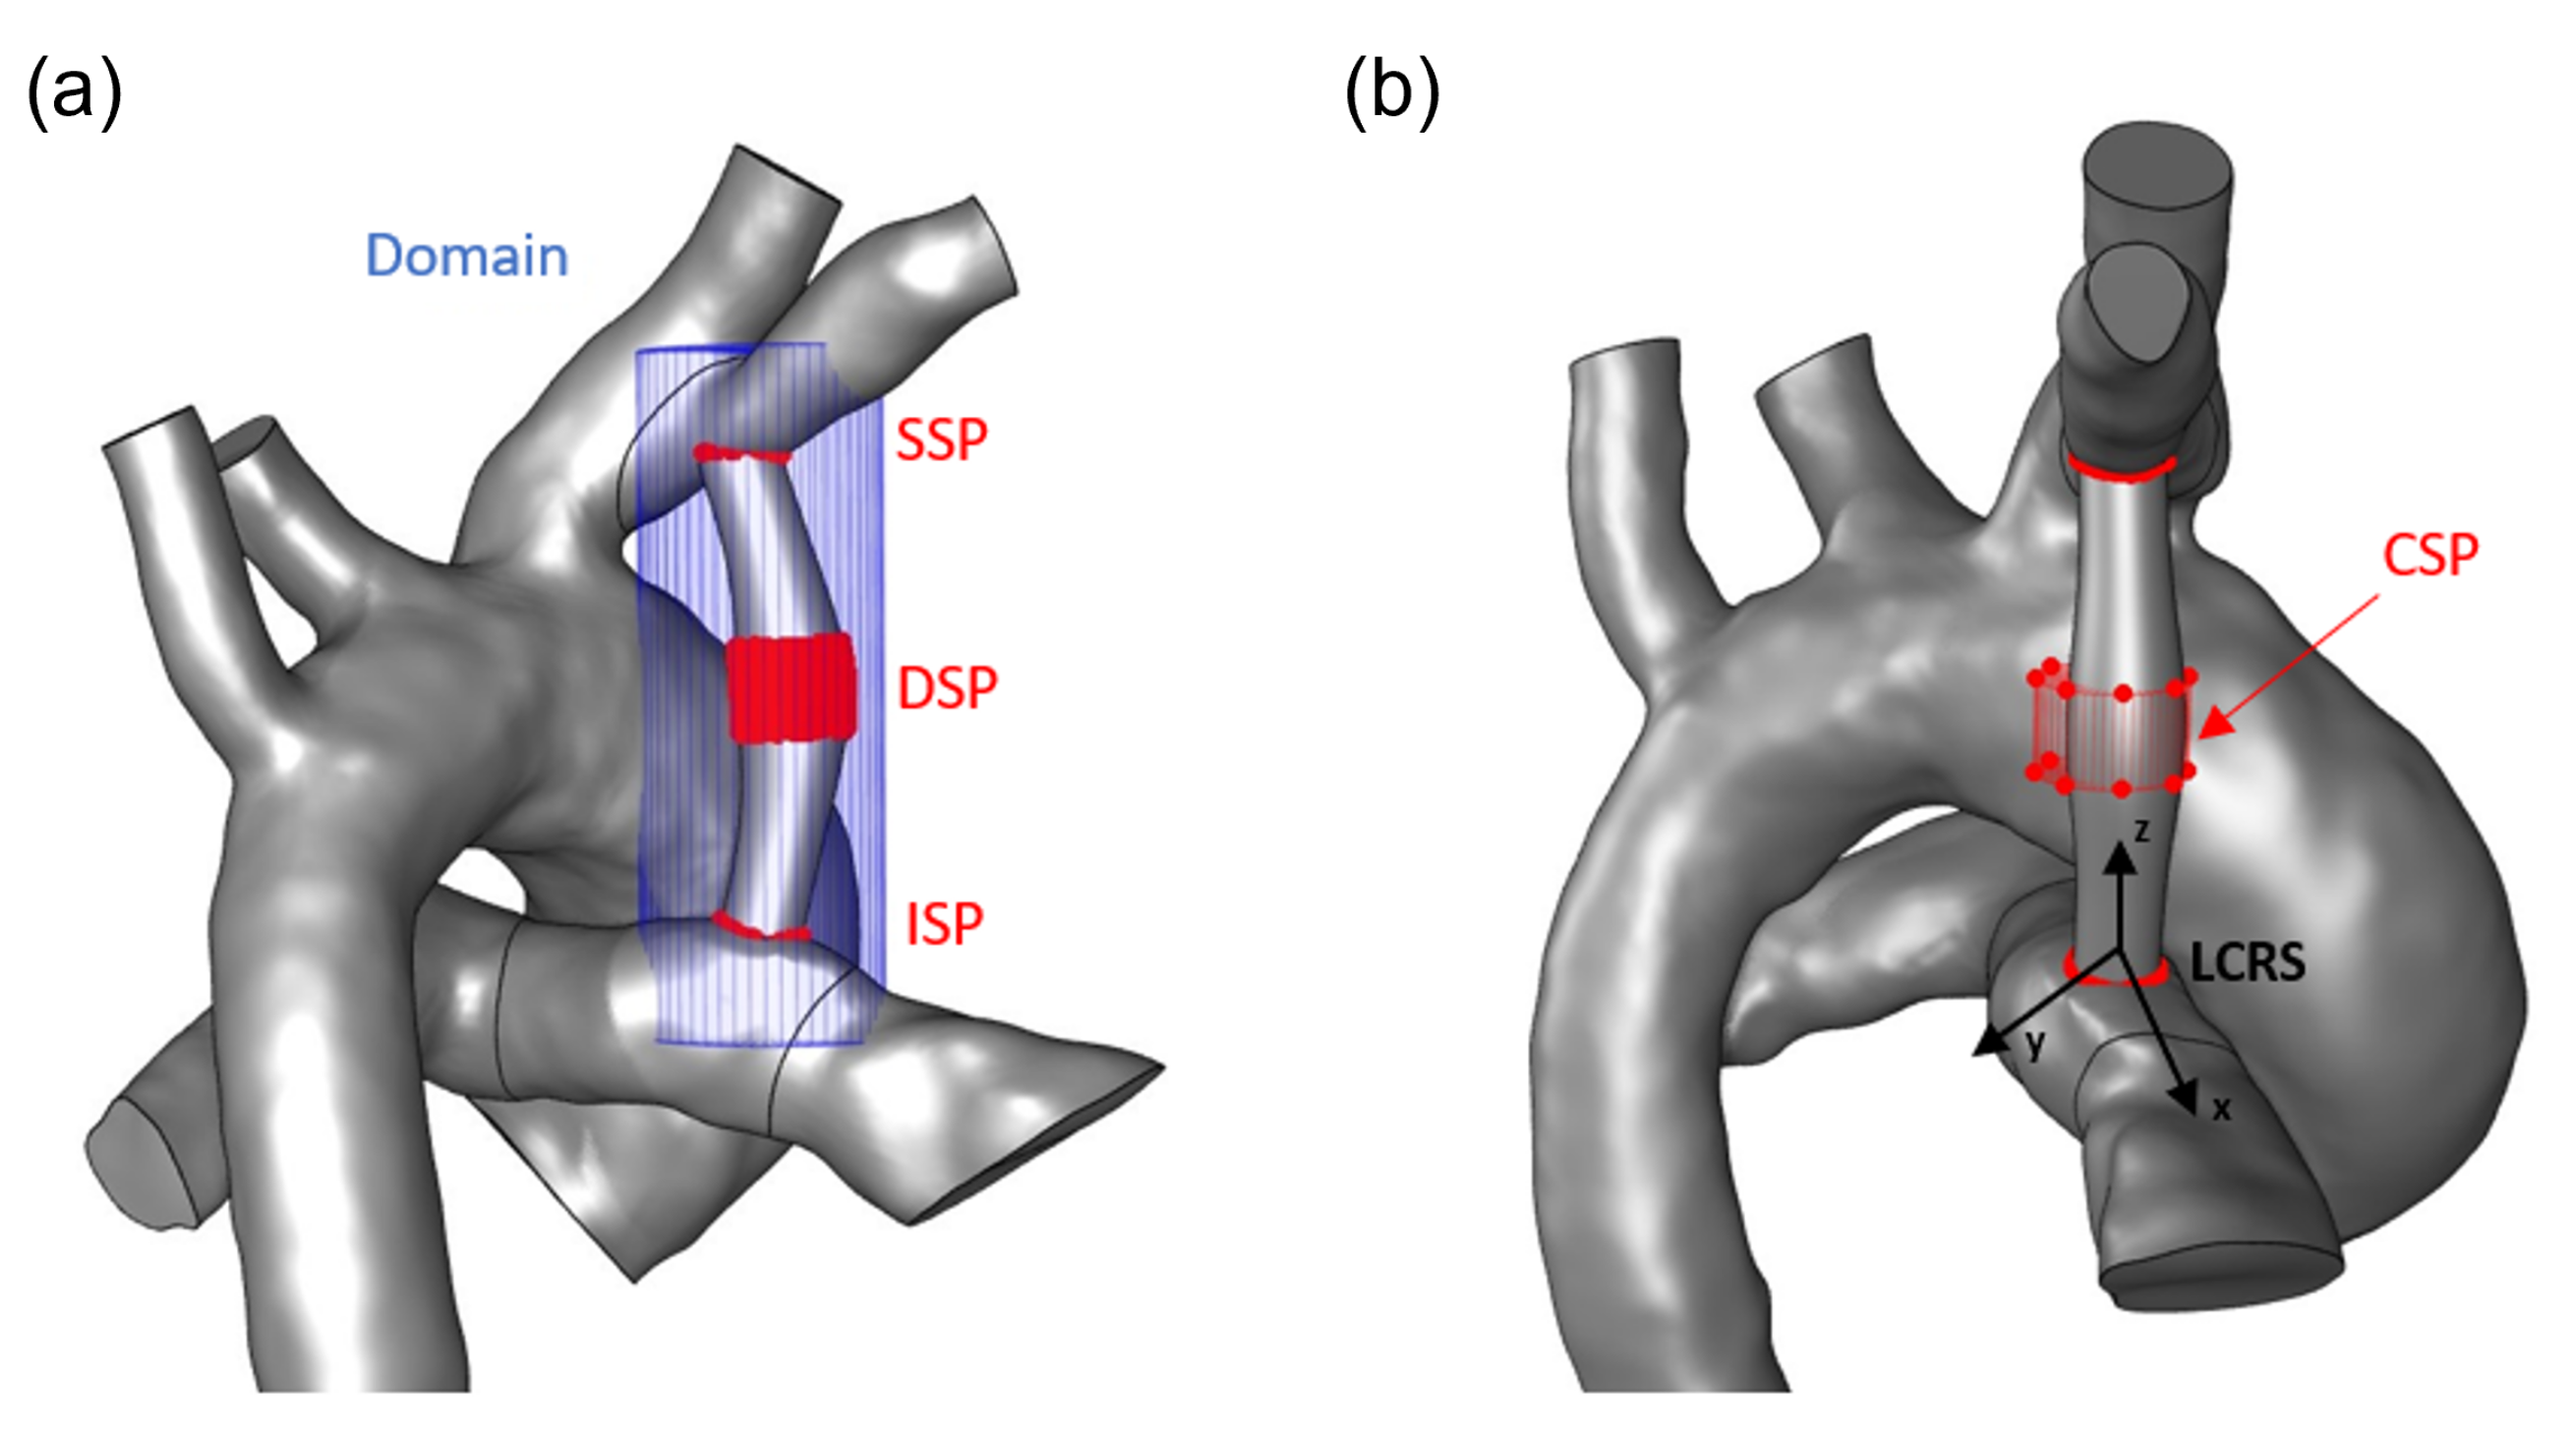
3.2. Mesh Morphing Set-Up
- the inferior boundary of the shunt’s geometry (ISP)
- the central segment of the shunt, correspondingto the maximum cross-sectional diameter (DSP)
- the cylindrical periphery of the shunt’s geometry (CSP)
- the superior boundary of the shunt’s geometry (SSP)
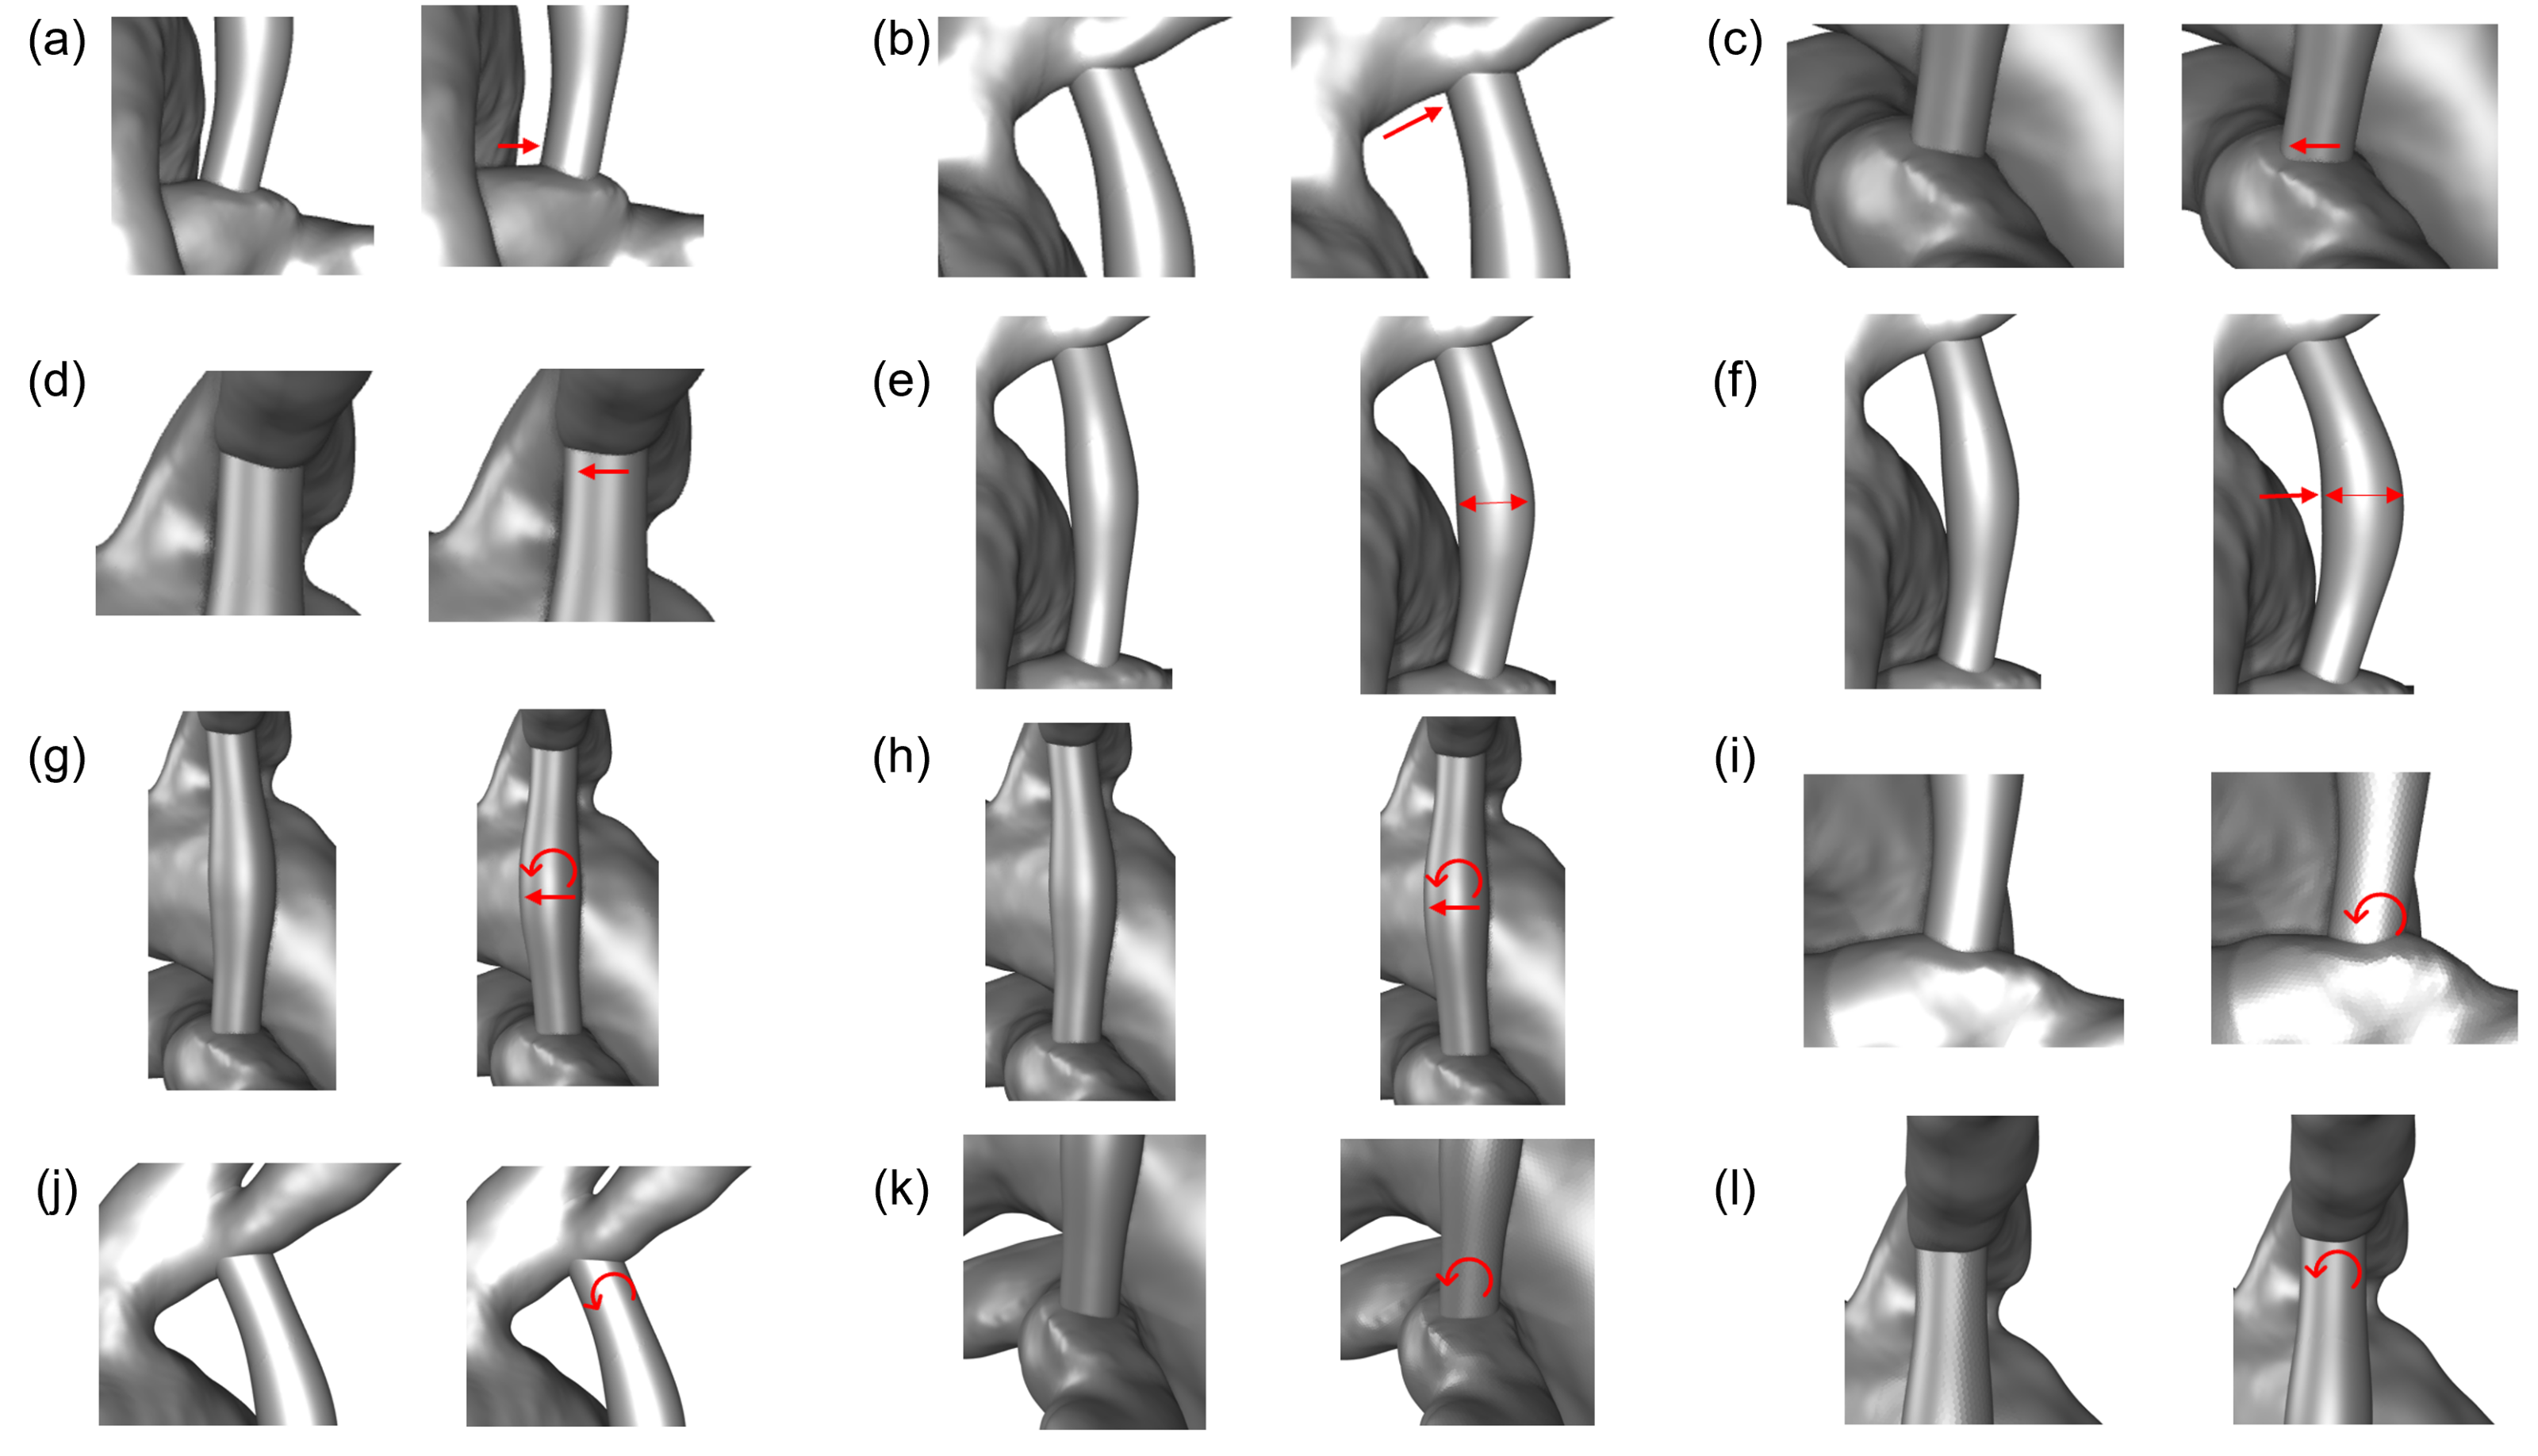
- dl-1-vol—Rigid motion of ISP along the ±x direction: sliding of the shunt’s root along the length of the pulmonary artery (Figure 5a).
- dl-2-vol—Rigid motion of SSP along the ±x direction: sliding of the shunt’s top segment along the length of the right subclavian artery (Figure 5b).
- dr-1-vol—Rigid motion of ISP along the ±y direction: sliding of the shunt’s root along the width of the pulmonary artery (Figure 5c).
- dr-2-vol—Rigid motion of SSP along the ±y direction: sliding of the shunt’s top segment along the width of the right subclavian artery (Figure 5d).
- mid-dl-vol2—Rigid motion of DSP along ±x direction: inflation or deflation towards the ±x axis (Figure 5e).
- mid-dl-vol—Rigid motion of CSP along ±x direction: inflation or deflation towards the ±x axis (Figure 5f).
- mid-dr-vol2—Rigid motion of DSP along ±y direction: inflation or deflation towards the ±y axis (Figure 5g).
- mid-dr-vol—Rigid motion of CSP along ±y direction: inflation or deflation towards the ±y axis (Figure 5h).
- rl-1-vol—Rotation of ISP with respect to the y axis of LCRS: the shunt’s root, which is located on pulmonary boundary, is revealed or hidden on the zx plane (Figure 5i).
- rl-2-vol—Rotation of SSP with respect to the y axis of LCRS: the shunt’s upper segment which is located on the right subclavian aortic boundary, is revealed or hidden on the zx plane (Figure 5j).
- rr-1-vol—Rotation of ISP with respect to the x axis of LCRS: the shunt’s root is revealed or hidden on the yx plane (Figure 5k).
- rr-2-vol—Rotation of SSP with respect to the x axis of LCRS: the shunt’s upper segment is revealed or hidden on the yx plane (Figure 5l).
3.3. CFD Set-Up
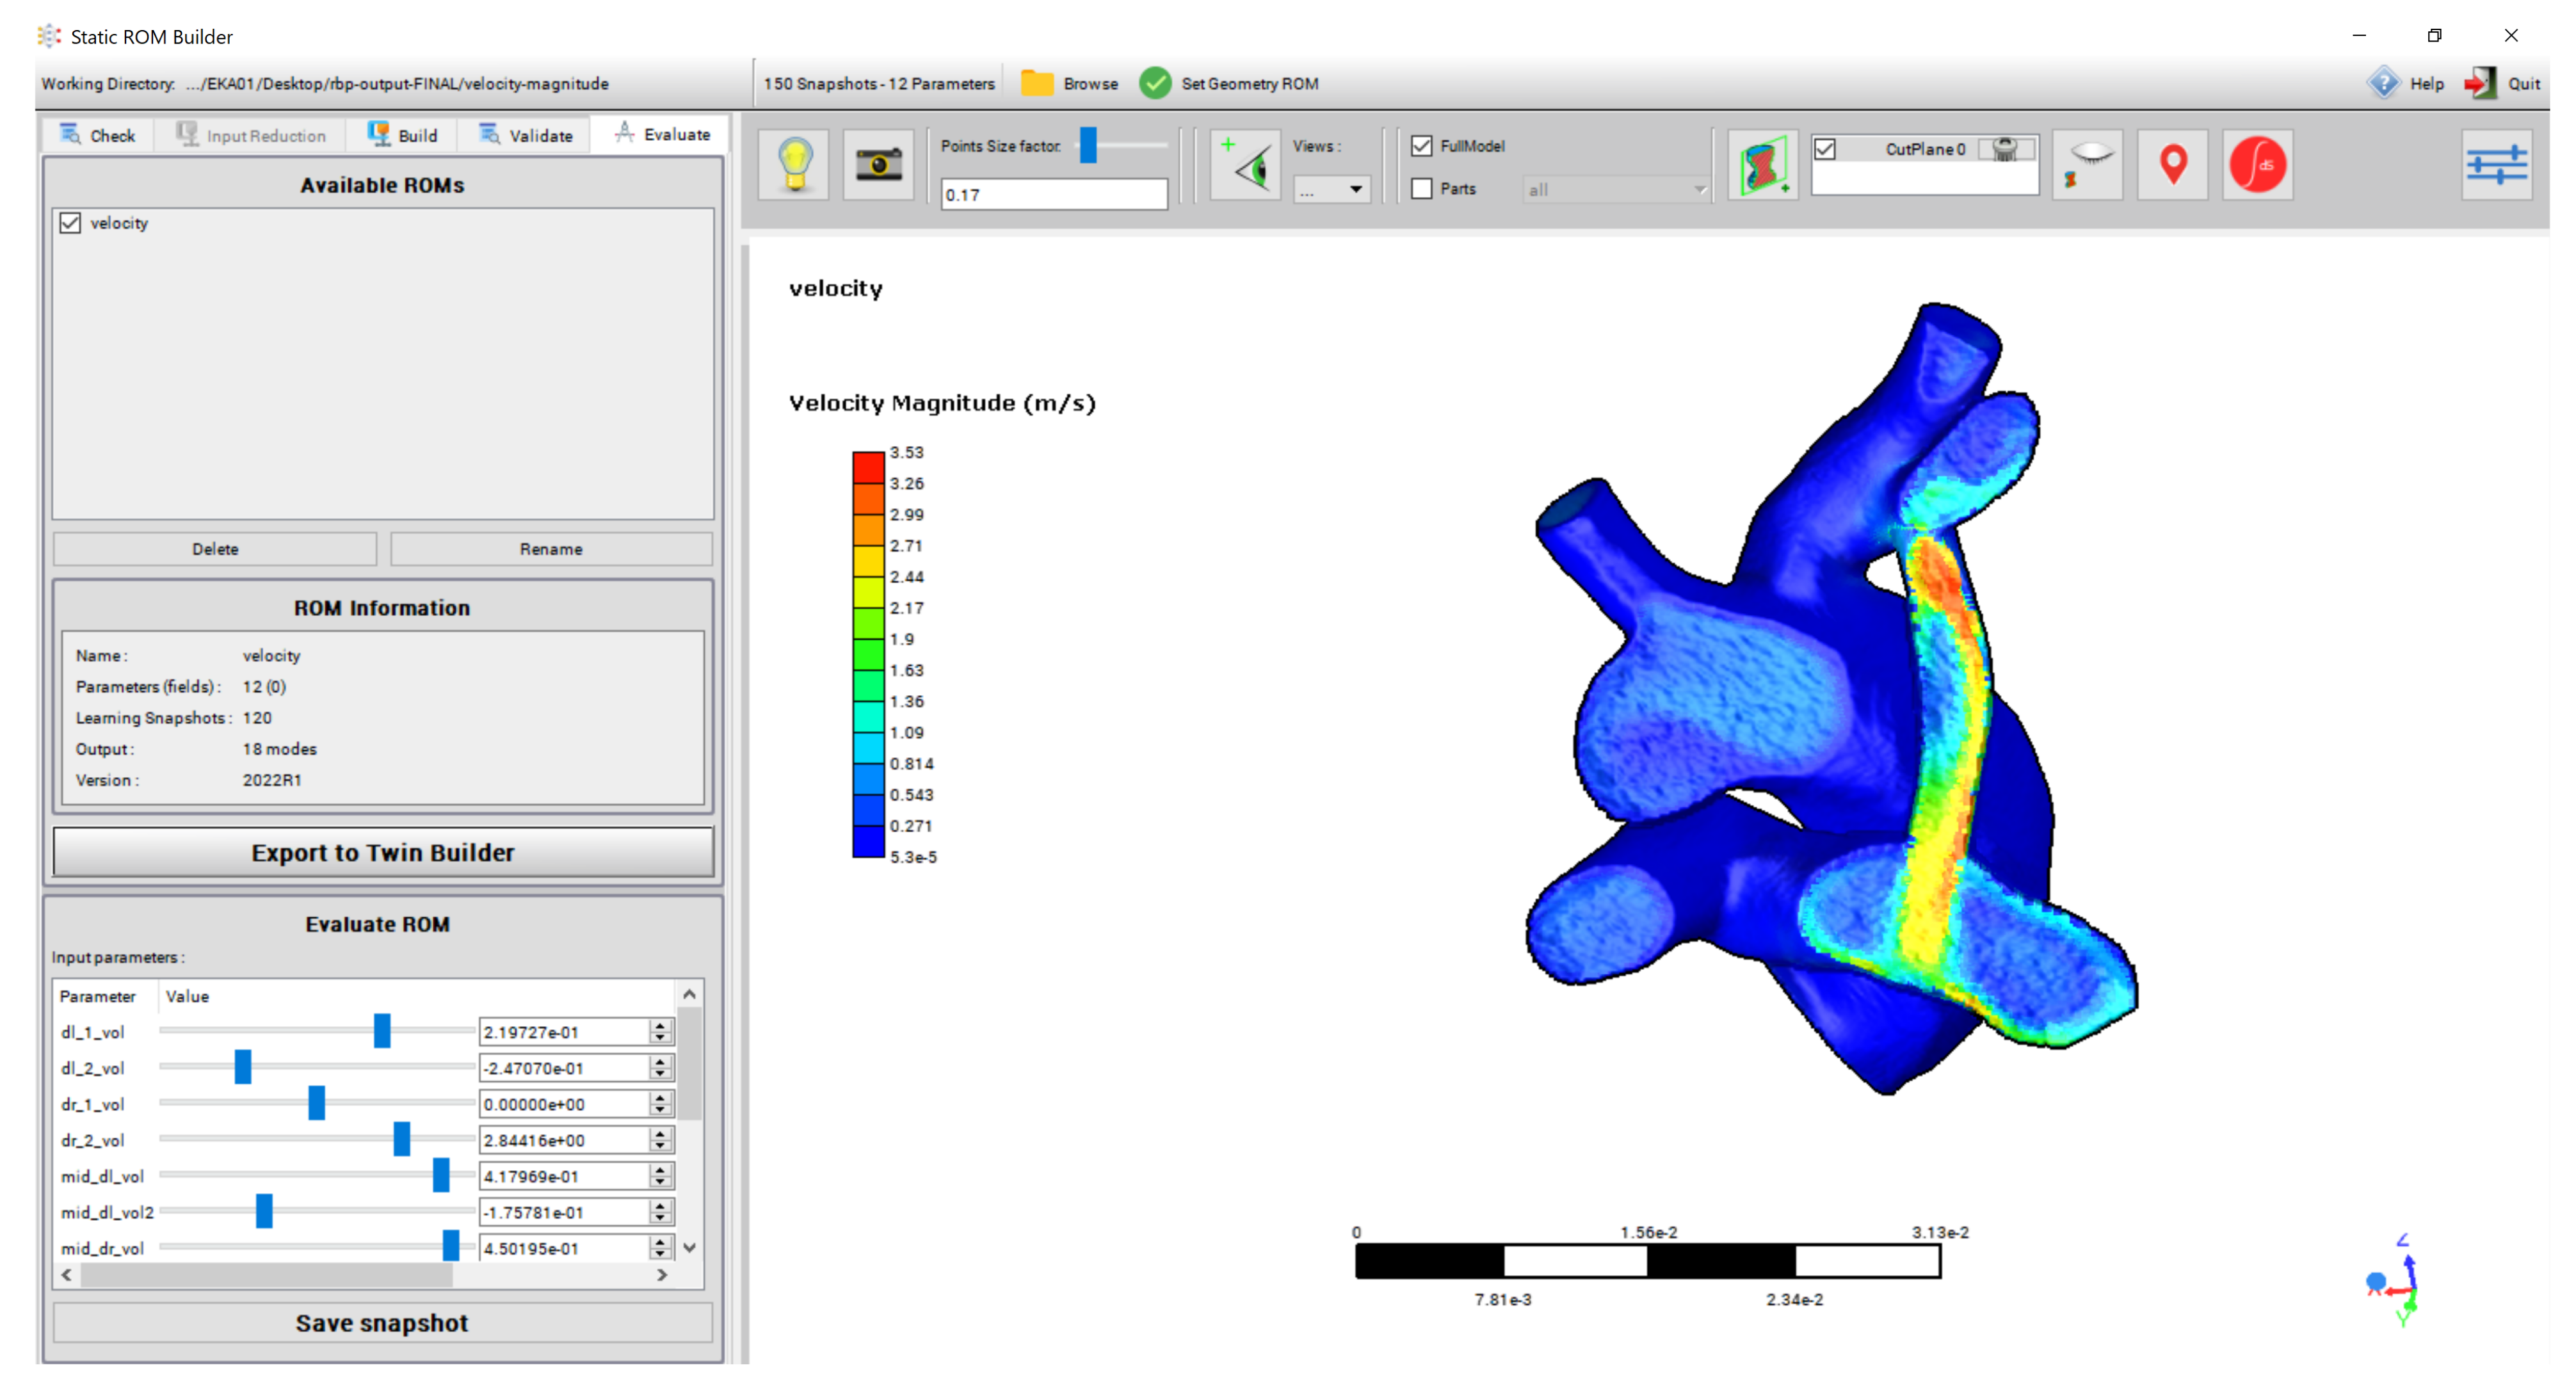
3.4. ROM Set-Up
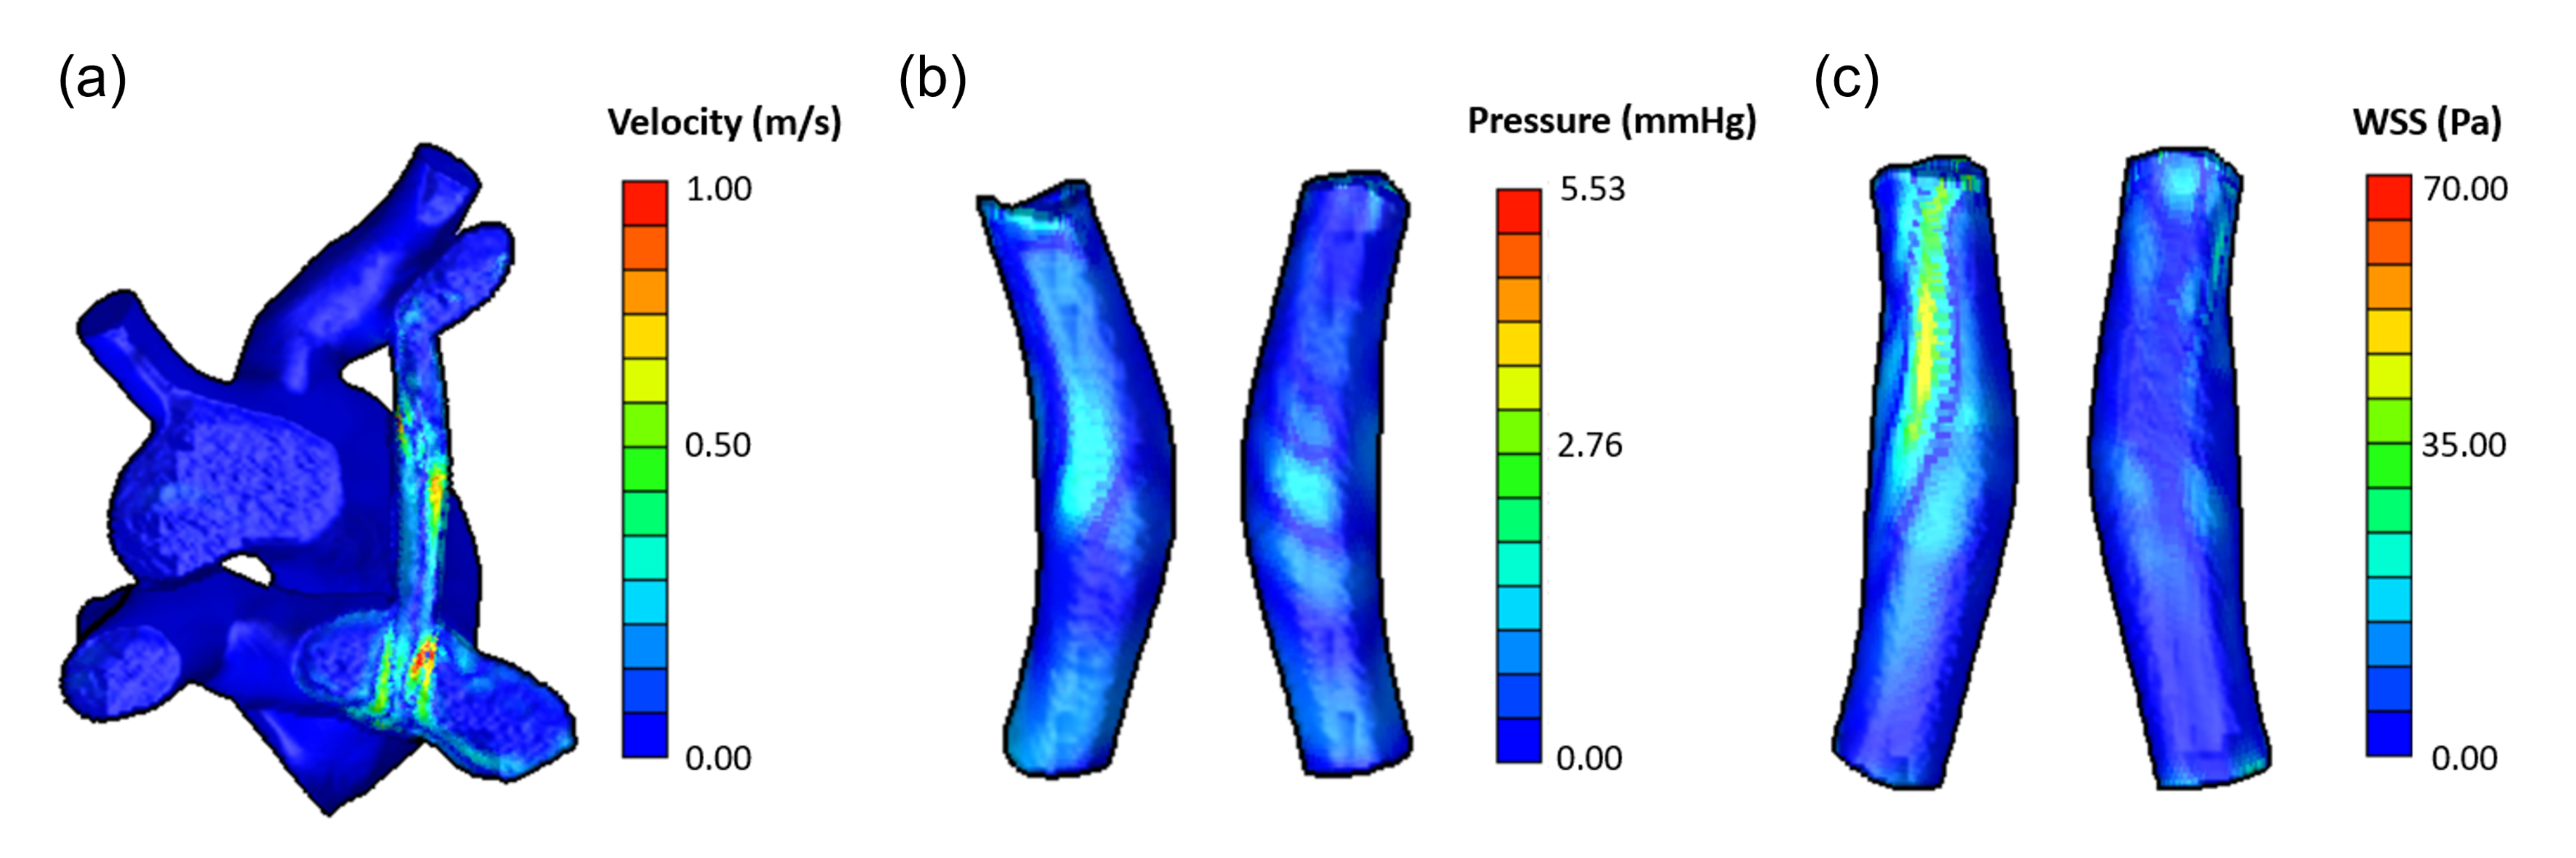
4. Results
4.1. Mesh Morphing Verification
4.2. ROM Verification
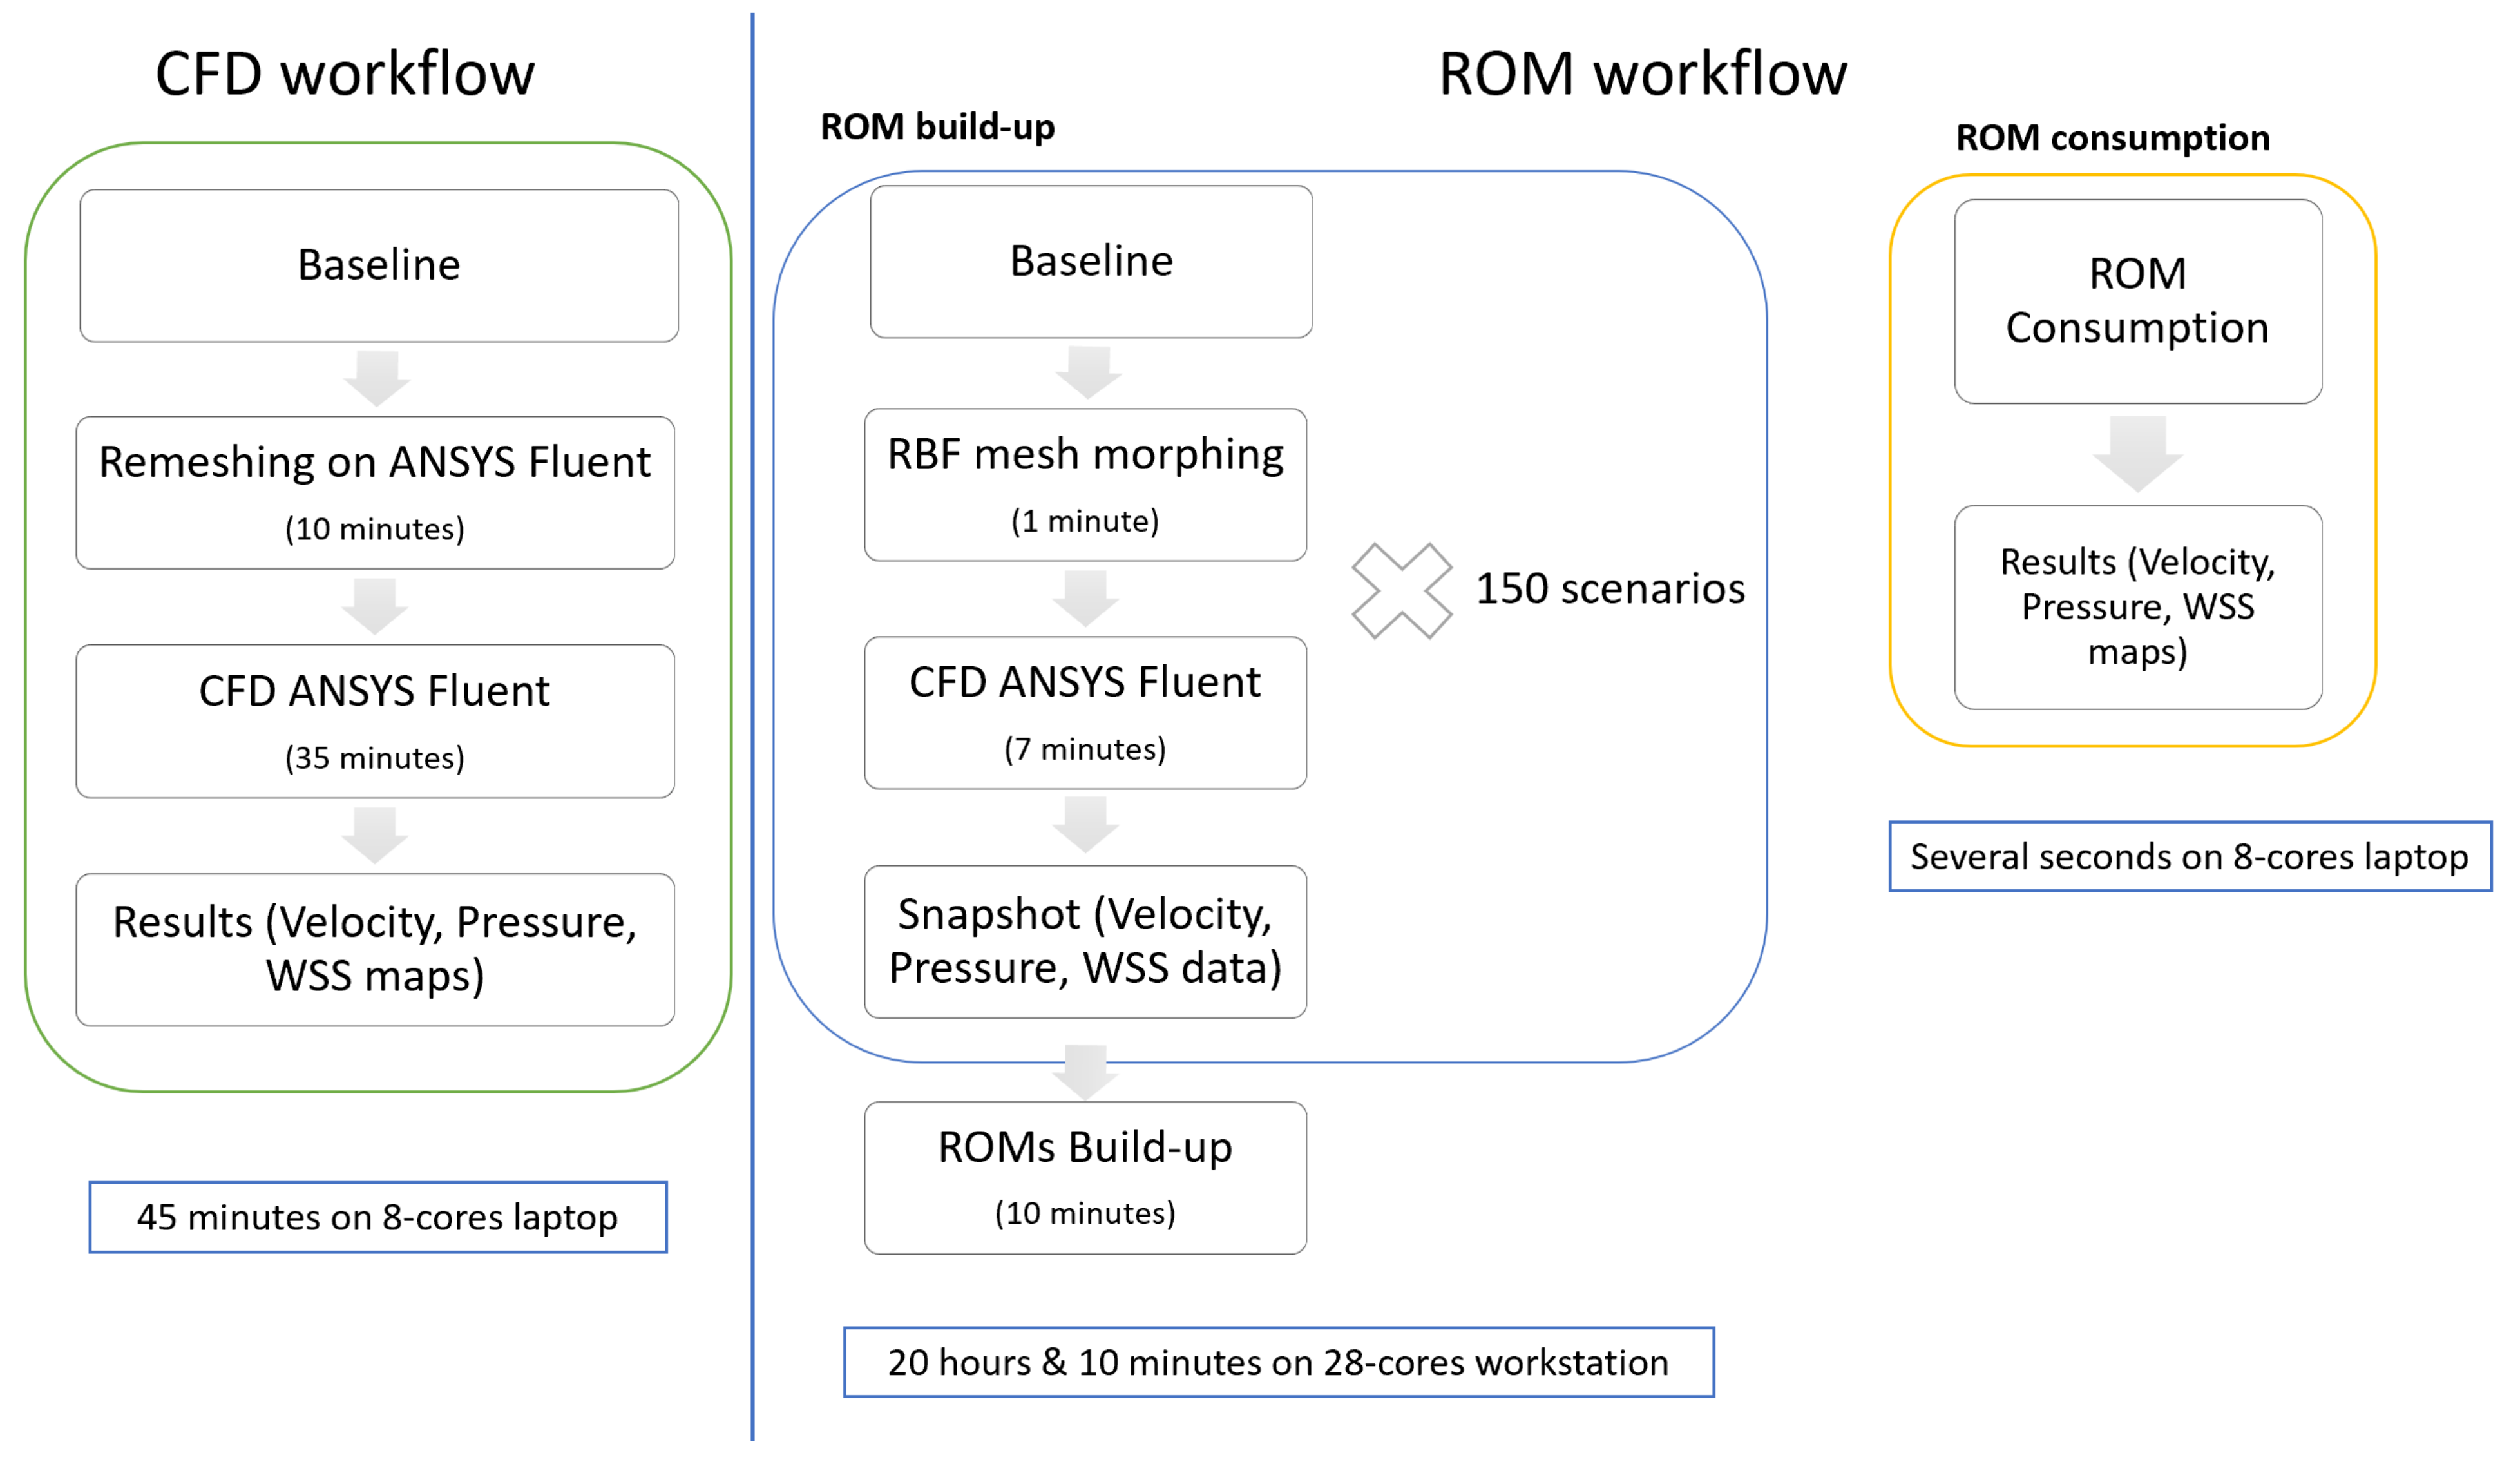
4.3. ROM Consumption
5. Discussion
6. Conclusions
Supplementary Materials
Author Contributions
Funding
Institutional Review Board Statement
Informed Consent Statement
Data Availability Statement
Conflicts of Interest
Abbreviations
| CAE | Computer-Aided Engineering |
| CFD | Computational Fluid Dynamics |
| CPU | Central Processing Unit |
| CSP | Cylindrical Source Points |
| CT | Computed Tomography |
| DA | Descending Aorta |
| DOE | Design of Experiments |
| DSP | Diameter Source Points |
| GARS | Genetic Aggregation Response Surface |
| ISP | Inferior Source Points |
| LCRS | Local Coordinate Reference System |
| LCRS | Local Coordinate Reference System |
| MBTS | Modified Blalock–Taussig Shunt |
| MDT | Medical Digital Twin |
| RBFs | Radial Basis Functions |
| RCCA/LCCA | Right/Left Common Carotid Arteries |
| ROM | Reduced Order Modeling |
| RPA/LPA | Right/Left Pulmonary Artery |
| RS | Response Surface |
| RSA/LSA | Right/Left Subclavian Artery |
| SSP | Superior Source Points |
| SVD | Singular Value Decomposition |
| WSS | Wall Shear Stresses |
References
- Zimmerman, M.S.; Smith, A.G.C.; Sable, C.A.; Echko, M.M.; Wilner, L.B.; Olsen, H.E.; Atalay, H.T.; Awasthi, A.; Bhutta, Z.A.; Boucher, J.L.; et al. Global, regional, and national burden of congenital heart disease, 1990–2017: A systematic analysis for the Global Burden of Disease Study 2017. Lancet Child Adolesc. Health 2020, 4, 185–200. [Google Scholar] [CrossRef] [Green Version]
- Sun, P.F.; Ding, G.C.; Zhang, M.Y.; He, S.N.; Gao, Y.; Wang, J.H. Prevalence of congenital heart disease among infants from 2012 to 2014 in Langfang, China. Chin. Med J. 2017, 130, 1069–1073. [Google Scholar] [CrossRef] [PubMed]
- Alsagheir, A.; Koziarz, A.; Makhdoum, A.; Contreras, J.; Alraddadi, H.; Abdalla, T.; Benson, L.; Chaturvedi, R.R.; Honjo, O. Duct stenting versus modified Blalock–Taussig shunt in neonates and infants with duct-dependent pulmonary blood flow: A systematic review and meta-analysis. J. Thorac. Cardiovasc. Surg. 2021, 161, 379–390. [Google Scholar] [CrossRef] [PubMed]
- Gladman, G.; McCrindle, B.W.; Williams, W.G.; Freedom, R.M.; Benson, L.N. The modified Blalock-Taussig shunt: Clinical impact and morbidity in Fallot’s tetralogy in the current era. J. Thorac. Cardiovasc. Surg. 1997, 114, 25–30. [Google Scholar] [CrossRef] [Green Version]
- Petrucci, O.; O’Brien, S.M.; Jacobs, M.L.; Jacobs, J.P.; Manning, P.B.; Eghtesady, P. Risk factors for mortality and morbidity after the neonatal Blalock-Taussig shunt procedure. Ann. Thorac. Surg. 2011, 92, 642–652. [Google Scholar] [CrossRef]
- Ashburn, D.A.; McCrindle, B.W.; Tchervenkov, C.I.; Jacobs, M.L.; Lofland, G.K.; Bove, E.L.; Spray, T.L.; Williams, W.G.; Blackstone, E.H. Outcomes after the Norwood operation in neonates with critical aortic stenosis or aortic valve atresia. J. Thorac. Cardiovasc. Surg. 2003, 125, 1070–1082. [Google Scholar] [CrossRef] [Green Version]
- Zhang, N.; Yuan, H.; Chen, X.; Liu, J.; Jian, Q.; Huang, M.; Zhang, K. Computational fluid dynamics characterization of two patient-specific systemic-to-pulmonary shunts before and after operation. Comput. Math. Methods Med. 2019, 2019, 1502318. [Google Scholar] [CrossRef] [Green Version]
- Piskin, S.; Altin, H.F.; Yildiz, O.; Bakir, I.; Pekkan, K. Hemodynamics of patient-specific aorta-pulmonary shunt configurations. J. Biomech. 2017, 50, 166–171. [Google Scholar] [CrossRef] [Green Version]
- De Leval, M.R.; McKay, R.; Jones, M.; Stark, J.; Macartney, F.J. Modified Blalock-Taussig shunt: Use of subclavian artery orifice as flow regulator in prosthetic systemic-pulmonary artery shunts. J. Thorac. Cardiovasc. Surg. 1981, 81, 112–119. [Google Scholar] [CrossRef]
- Alsoufi, B.; Gillespie, S.; Mori, M.; Clabby, M.; Kanter, K.; Kogon, B. Factors affecting death and progression towards next stage following modified Blalock-Taussig shunt in neonates. Eur. J. Cardio-Thorac. Surg. 2016, 50, 169–177. [Google Scholar] [CrossRef] [Green Version]
- Dirks, V.; Prêtre, R.; Knirsch, W.; Valsangiacomo Buechel, E.R.; Seifert, B.; Schweiger, M.; Hübler, M.; Dave, H. Modified Blalock Taussig shunt: A not-so-simple palliative procedure. Eur. J. Cardio-Thorac. Surg. 2013, 44, 1096–1102. [Google Scholar] [CrossRef]
- Antonuccio, M.N.; Mariotti, A.; Fanni, B.M.; Capellini, K.; Capelli, C.; Sauvage, E.; Celi, S. Effects of Uncertainty of Outlet Boundary Conditions in a Patient-Specific Case of Aortic Coarctation. Ann. Biomed. Eng. 2021, 49, 3494–3507. [Google Scholar] [CrossRef]
- Vignali, E.; Gasparotti, E.; Celi, S.; Avril, S. Fully-coupled FSI computational analyses in the ascending thoracic aorta using patient-specific conditions and anisotropic material properties. Front. Physiol. 2021, 12, 732561. [Google Scholar] [CrossRef]
- Boccadifuoco, A.; Mariotti, A.; Capellini, K.; Celi, S.; Salvetti, M.V. Validation of numerical simulations of thoracic aorta hemodynamics: Comparison with in vivo measurements and stochastic sensitivity analysis. Cardiovasc. Eng. Technol. 2018, 9, 688–706. [Google Scholar] [CrossRef]
- Bordones, A.D.; Leroux, M.; Kheyfets, V.O.; Wu, Y.A.; Chen, C.Y.; Finol, E.A. Computational fluid dynamics modeling of the human pulmonary arteries with experimental validation. Ann. Biomed. Eng. 2018, 46, 1309–1324. [Google Scholar] [CrossRef]
- Tsubata, H.; Nakanishi, N.; Itatani, K.; Ogo, T.; Yaku, H.; Matoba, S. Pulmonary artery blood flow dynamics in patients with chronic thromboembolic pulmonary hypertension; analysis by Computational Fluid Dynamics. Pulm. Hypertens. 2019, 54, PA1435. [Google Scholar]
- Fanni, B.M.; Gasparotti, E.; Vignali, E.; Capelli, C.; Positano, V.; Celi, S. An integrated in-vitro and in-silico workflow to study the pulmonary bifurcation hemodynamics. Comput. Fluids 2022. under review. [Google Scholar]
- Celi, S.; Berti, S. Three-dimensional sensitivity assessment of thoracic aortic aneurysm wall stress: A probabilistic finite-element study. Eur. J. Cardio-Thorac. Surg. 2013, 45, 467–475. [Google Scholar] [CrossRef]
- Fanni, B.; Sauvage, E.; Celi, S.; Norman, W.; Vignali, E.; Landini, L.; Schievano, S.; Positano, V.; Capelli, C. A proof of concept of a non-invasive image-based material characterization method for enhanced patient-specific computational modeling. Cardiovasc. Eng. Technol. 2020, 11, 532–543. [Google Scholar] [CrossRef]
- Majid, Q.A.; Fricker, A.T.R.; Gregory, D.A.; Davidenko, N.; Hernandez Cruz, O.; Jabbour, R.J.; Owen, T.J.; Basnett, P.; Lukasiewicz, B.; Stevens, M.; et al. Natural Biomaterials for Cardiac Tissue Engineering: A Highly Biocompatible Solution. Front. Cardiovasc. Med. 2020, 7, 192. [Google Scholar] [CrossRef]
- Caddeo, S.; Boffito, M.; Sartori, S. Tissue engineering approaches in the design of healthy and pathological in vitro tissue models. Front. Bioeng. Biotechnol. 2017, 5, 40. [Google Scholar] [CrossRef] [PubMed] [Green Version]
- Arnaz, A.; Pişkin, Ş.; Oğuz, G.N.; Yalçınbaş, Y.; Pekkan, K.; Sarıoğlu, T. Effect of modified Blalock-Taussig shunt anastomosis angle and pulmonary artery diameter on pulmonary flow. Anatol. J. Cardiol. 2018, 20, 2. [Google Scholar] [CrossRef]
- Biancolini, M.; Capellini, K.; Costa, E.; Groth, C.; Celi, S. Fast interactive CFD evaluation of hemodynamics assisted by RBF mesh morphing and reduced order models: The case of aTAA modelling. Int. J. Interact. Des. Manuf. IJIDeM 2020, 14, 1–12. [Google Scholar] [CrossRef]
- Keiper, W.; Milde, A.; Volkwein, S. Reduced-Order Modeling (ROM) for Simulation and Optimization: Powerful Algorithms as Key Enablers for Scientific Computing; Springer: Cham, Switzerland, 2018. [Google Scholar]
- Biancolini, M.E. Fast Radial Basis Functions for Engineering Applications; Springer: Cham, Switzerland, 2018. [Google Scholar]
- De Boer, A.; Van der Schoot, M.; Bijl, H. Mesh deformation based on radial basis function interpolation, computers and structure. Comput. Struct. 2007, 85, 784–795. [Google Scholar] [CrossRef]
- Biancolini, M.; Valentini, P.P. Virtual human bone modelling by interactive sculpting, mesh morphing and force-feedback. Int. J. Interact. Des. Manuf. IJIDeM 2018, 12, 1–12. [Google Scholar] [CrossRef]
- Micchelli, C.A. Interpolation of Scattered Data: Distance Matrices and Conditionally Positive Definite Functions. In Approximation Theory and Spline Functions; Singh, S.P., Burry, J.W.H., Watson, B., Eds.; Springer: Dordrecht, The Netherlands, 1984; pp. 143–145. [Google Scholar]
- Acar, E. Optimizing the shape parameters of radial basis functions: An application to automobile crashworthiness. Proc. Inst. Mech. Eng. Part D J. Automob. Eng. 2010, 224, 1541–1553. [Google Scholar] [CrossRef]
- Zhang, H.; Zhang, X.; Bu, R. Radial Basis Function Neural Network Sliding Mode Control for Ship Path Following Based on Position Prediction. J. Mar. Sci. Eng. 2021, 9, 1055. [Google Scholar] [CrossRef]
- Morelli, M.; Bellosta, T.; Guardone, A. Efficient radial basis function mesh deformation methods for aircraft icing. J. Comput. Appl. Math. 2021, 392, 113492. [Google Scholar] [CrossRef]
- Lei, L.; Liu, W. Predictive control of multi-zone variable air volume air-conditioning system based on radial basis function neural network. Energy Build. 2022, 261, 111944. [Google Scholar] [CrossRef]
- Carr, J.; Fright, W.; Beatson, R. Surface interpolation with radial basis functions for medical imaging. IEEE Trans. Med. Imaging 1997, 16, 96–107. [Google Scholar] [CrossRef]
- Vega, J.M.; Le Clainche, S. Chapter 1—General introduction and scope of the book. In Higher Order Dynamic Mode Decomposition and Its Applications; Vega, J.M., Le Clainche, S., Eds.; Academic Press: Cambridge, MA, USA, 2021; pp. 1–28. [Google Scholar]
- Wang, L.; Xiao, Q.; Xu, H. Optimal maximin L1-distance Latin hypercube designs based on good lattice point designs. Ann. Stat. 2018, 46, 3741–3766. [Google Scholar] [CrossRef] [Green Version]
- Klema, V.; Laub, A. The singular value decomposition: Its computation and some applications. IEEE Trans. Autom. Control 1980, 25, 164–176. [Google Scholar] [CrossRef] [Green Version]
- Abdi, H. Singular value decomposition (SVD) and generalized singular value decomposition. In Encyclopedia of Measurement and Statistics; Sage: Thousand Oaks, CA, USA, 2007; pp. 907–912. [Google Scholar]
- Ben Salem, M.; Roustant, O.; Gamboa, F.; Tomaso, L. Universal prediction distribution for surrogate models. SIAM/ASA J. Uncertain. Quantif. 2017, 5, 1086–1109. [Google Scholar] [CrossRef] [Green Version]
- Celi, S.; Gasparotti, E.; Capellini, K.; Vignali, E.; Fanni, B.M.; Ali, L.A.; Cantinotti, M.; Murzi, M.; Berti, S.; Santoro, G.; et al. 3D printing in modern cardiology. Curr. Pharm. Des. 2021, 27, 1918–1930. [Google Scholar] [CrossRef]
- Liu, J.; Sun, Q.; Qian, Y.; Hong, H.; Liu, J. Numerical simulation and hemodynamic analysis of the modified Blalock-Taussig shunt. In Proceedings of the 2013 35th Annual International Conference of the IEEE Engineering in Medicine and Biology Society (EMBC), Osaka, Japan, 3–7 July 2013; pp. 707–710. [Google Scholar]
- Perktold, K.; Peter, R.; Resch, M.; Langs, G. Pulsatile non-newtonian blood flow in three-dimensional carotid bifurcation models: A numerical study of flow phenomena under different bifurcation angles. J. Biomed. Eng. 1991, 13, 507–515. [Google Scholar] [CrossRef]
- Bove, E.L.; Migliavacca, F.; de Leval, M.R.; Balossino, R.; Pennati, G.; Lloyd, T.R.; Khambadkone, S.; Hsia, T.Y.; Dubini, G. Use of mathematic modeling to compare and predict hemodynamic effects of the modified Blalock–Taussig and right ventricle–Pulmonary artery shunts for hypoplastic left heart syndrome. J. Thorac. Cardiovasc. Surg. 2008, 136, 312–320.e2. [Google Scholar] [CrossRef] [Green Version]
- Wardoyo, S.; Makdinata, W.; Wijayanto, M.A. Perioperative strategy to minimize mortality in neonatal modified Blalock–Taussig–Thomas Shunt: A literature review. Cirugía Cardiovasc. 2022, 29, 31–35. [Google Scholar] [CrossRef]
- Capellini, K.; Vignali, E.; Costa, E.; Gasparotti, E.; Biancolini, M.E.; Landini, L.; Positano, V.; Celi, S. Computational Fluid Dynamic Study for ATAA hemodynamics: An integrated image-based and radial basis functions mesh morphing approach. J. Biomech. Eng. 2018, 140, 111007. [Google Scholar] [CrossRef]
- Aslan, S.; Guillot, M.; Ross-Ascuitto, N.; Ascuitto, R. Hemodynamics in a bidirectional Glenn Shunt supplemented with a modified Blalock-Taussig shunt: Computational fluid dynamics assessment. Prog. Pediatr. Cardiol. 2021, 60, 101256. [Google Scholar] [CrossRef]
- Zhang, N.; Haiyun, Y.; Chen, X.; Liu, J.; Zhou, C.; Huang, M.; Qifei, J.; Zhuang, J. Hemodynamic of the Patent Ductus Arteriosus in Neonates with Modified Blalock-Taussig Shunts. Comput. Methods Programs Biomed. 2019, 186, 105223. [Google Scholar] [CrossRef]


| Shape factor | Scenario 23 | Scenario 43 | Scenario 123 | Scenario 142 |
|---|---|---|---|---|
| dl-1-vol | −0.26 | −0.49 | −0.36 | −0.39 |
| dl-2-vol | −0.03 | −0.27 | 0.48 | −0.46 |
| dr-1-vol | −0.17 | 3.30 | 0.70 | −2.23 |
| dr-2-vol | −3.30 | 0.90 | 4.23 | −0.70 |
| mid-dl-vol2 | −0.04 | 0.30 | −0.08 | 0.34 |
| mid-dl-vol | −0.02 | 0.18 | −0.18 | 0.14 |
| mid-dr-vol2 | 0.48 | −0.36 | -0.08 | 0.34 |
| mid-dr-vol | −0.25 | 0.24 | −0.34 | 0.05 |
| rl-1-vol | −4.63 | 4.43 | −1.83 | 3.30 |
| rl-2-vol | −2.83 | 0.57 | 3.90 | 2.43 |
| rr-1-vol | −0.57 | 2.50 | −1.37 | −3.10 |
| rr-2-vol | 4.77 | −0.37 | 3.17 | −2.37 |
| Cell Squish | 0.982 | 0.994 | 0.906 | 0.973 |
Publisher’s Note: MDPI stays neutral with regard to jurisdictional claims in published maps and institutional affiliations. |
© 2022 by the authors. Licensee MDPI, Basel, Switzerland. This article is an open access article distributed under the terms and conditions of the Creative Commons Attribution (CC BY) license (https://creativecommons.org/licenses/by/4.0/).
Share and Cite
Kardampiki, E.; Vignali, E.; Haxhiademi, D.; Federici, D.; Ferrante, E.; Porziani, S.; Chiappa, A.; Groth, C.; Cioffi, M.; Biancolini, M.E.; et al. The Hemodynamic Effect of Modified Blalock–Taussig Shunt Morphologies: A Computational Analysis Based on Reduced Order Modeling. Electronics 2022, 11, 1930. https://doi.org/10.3390/electronics11131930
Kardampiki E, Vignali E, Haxhiademi D, Federici D, Ferrante E, Porziani S, Chiappa A, Groth C, Cioffi M, Biancolini ME, et al. The Hemodynamic Effect of Modified Blalock–Taussig Shunt Morphologies: A Computational Analysis Based on Reduced Order Modeling. Electronics. 2022; 11(13):1930. https://doi.org/10.3390/electronics11131930
Chicago/Turabian StyleKardampiki, Eirini, Emanuele Vignali, Dorela Haxhiademi, Duccio Federici, Edoardo Ferrante, Stefano Porziani, Andrea Chiappa, Corrado Groth, Margherita Cioffi, Marco Evangelos Biancolini, and et al. 2022. "The Hemodynamic Effect of Modified Blalock–Taussig Shunt Morphologies: A Computational Analysis Based on Reduced Order Modeling" Electronics 11, no. 13: 1930. https://doi.org/10.3390/electronics11131930