Article

Micromolar Levofloxacin Sensor by Incorporating Highly Crystalline Co3O4 into a Carbon Paste Electrode Structure

1
Scientific Institution, Institute of Chemistry, Technology and Metallurgy, National Institute University of Belgrade, 11000 Belgrade, Serbia
2
Faculty of Chemistry, University of Belgrade, Studentski trg 12-16, 11000 Belgrade, Serbia
3
VINČA Institute of Nuclear Sciences-National Institute of the Republic of Serbia, University of Belgrade, Mike Petrovića Alasa 12-14, 11000 Belgrade, Serbia
4
Department for Ecology and Chemical Technology, South Ural State University, Lenin Prospect 76, 454080 Chelyabinsk, Russia
*
Authors to whom correspondence should be addressed.
Electrochem 2024, 5(1), 45-56; https://doi.org/10.3390/electrochem5010003
Submission received: 8 November 2023 / Revised: 28 December 2023 / Accepted: 16 January 2024 / Published: 23 January 2024

Abstract

:
In this work, we successfully prepared a modified cobalt oxide (Co3O4) carbon paste electrode to detect Levofloxacin (LEV). By synthesizing Co3O4 nanoparticles through the chemical coprecipitation method, the electrochemical properties of the electrode and LEV were thoroughly investigated using CV, SWV, and EIS, while material properties were scrutinized using ICP-OES, TEM, SEM, and XRD. The results showed that the prepared electrode displayed a better electrocatalytic response than the bare carbon paste electrode. After optimizing SWV, the electrode exhibited a wide linear working range from 1 to 85 μM at pH 5 of BRBS as the supporting electrolyte. The selectivity of the proposed method was satisfactory, with good repeatability and reproducibility, strongly suggesting a potential application for determining LEV in real samples, particularly in pharmaceutical formulations. The practicality of the approach was demonstrated through good recoveries, and the morphology of the materials was found to be closely related to other parameters, indicating that the developed method can provide a cost-effective, rapid, selective, and sensitive means for LEV monitoring. Overall, this project has made significant progress towards developing a reliable method for detecting LEV and has opened up new opportunities for future research in this field.

1. Introduction

Antibiotics are widely used in human medicine worldwide because they treat bacterial infections effectively. Studies conducted since the 1980s have shown that fluoroquinolines are highly effective antibacterial drugs with wide application in both human and veterinary practice [1]. These compounds have been found to be particularly effective at treating various diseases, such as infections of the skin, respiratory tract, urinary tract, and nervous system, as well as bones and joints. The experimental findings have established that fluoroquinolines are an important class of antibiotics, and their effectiveness makes them a valuable treatment option for many bacterial infections [2,3,4]. Levofloxacin, namely (S)-9-fluoro-2, 3-dihydro-3-methyl-10-(4-methyl-1-piperazinyl)-7-oxo-7H-pyrido [1,2,3-de]-1, 4-benzoxazine-6-carboxylic acid is one of the most promising fluoroquinolones, and its antibacterial activity is much higher than the activity of other drugs of the fluoroquinolone family [5]. Levofloxacin (LEV) directly inhibits bacterial DNA synthesis, and it promotes the breakage of DNA strands by inhibiting DNA-gyrase in susceptible organisms, which inhibits the relaxation of supercoiled DNA [6]. Considering the importance of these compounds, and their prevalence in the environment and aquatic systems [7], the existence of methods for the control and monitoring of these compounds is of crucial importance. Several different methodological approaches have been developed so far for monitoring the concentration of LEV and they are based on spectrophotometry [8,9], high-performance liquid chromatography (HPLC) [10,11], and chemiluminescence [12]. These methods also have drawbacks such as high cost, extended analysis time, and sample preparation such as derivatization and extraction, while purification is often necessary. Electrochemical methods have been shown to have numerous advantages over traditional methods of analysis, including simplicity of handling, cost-effectiveness, sensitivity, and rapid analysis [13]. They also offer an easy way to transfer technology and facilitate device miniaturization and in vivo and in vitro process monitoring, which are additional parameters that highlight their advantages [14]. Electrochemical methods are simpler and more reasonable, with excellent reproducibility, short assay time, and cost less compared to other conventional approaches. Additionally, the modification of electrochemical reactions by altering the value of the oxidation and/or reduction potential promotes their existence [15]. The modification step also allows us to avoid some of the problems of surface contamination [16,17].
A proposed study has been put forward that aims to prepare a modified cobalt oxide carbon paste electrode for the purpose of detecting LEV. The key components of this electrode are Co3O4 nanoparticles, which were synthesized via the chemical coprecipitation method. For analyzing the electrochemical properties of LEV at this electrode, the study utilized a range of techniques including cyclic voltammetry, square wave voltammetry, and differential pulse voltammetry. In addition, electrochemical impedance spectroscopy, inductively coupled plasma-optical emission spectrometry, transmission and scanning electron microscopy, and X-ray diffraction were employed to characterize the synthesized material. The ultimate goal of this study was to provide a comprehensive understanding of the electrochemical properties of both LEV and the synthesized material, with potential applications in a wide range of fields.

2. Materials and Methods

2.1. Reagents and Apparatus

In this study, all reagents used were of analytical grade and were manufactured by Sigma Aldrich. The reagents were used without further purification, including Cobalt (II) chloride hexahydrate (CoCl2∙6H2O), sodium hydroxide (NaOH), paraffin oil, and carbon powder (glassy carbon, spherical powder, 2–12 µm, 99.95%). Britton Robinson buffer solution (BRBS) was used as the supporting electrolyte. To prepare initial pH2, appropriate amounts of boric acid, phosphoric acid, and acetic acid were dissolved in 1 L of ultrapure water (all concentrations were 0.04 M). Other pHs were adjusted using 0.5 M NaOH. For EIS and CV measurements, the Fe2+/3+ redox couple was used, which was prepared from 5 mM potassium hexacyanoferrate(III) (K3[Fe(CN)6]) and potassium hexacyanoferrate(II) trihydrate (K4[Fe(CN)6]∙3H2O) in 0.1M KCl solution. Interference and LEV solutions were prepared freshly on the day of use.
The crystal structure of cobalt oxide nanoparticles was determined using X-ray powder-diffraction (XRD) data measured on dried powders in a high-resolution SmartLab® diffractometer (Rigaku, Japan), equipped with a Cu Kα radiation source (λ = 1.5406 Å) under a voltage of 40 kV and a 30 mA current. The patterns were collected within the 10–70° 2θ range at a scan rate of 1°/min and a 0.02° step size.
A transmission electron microscope Jeol JEM-2100F (JEOL, Tokyo, Japan) and a scanning electron microscope Jeol JSM-7001F (JEOL, Tokyo, Japan) were used to scrutinize the morphological properties of the material. The accelerating voltage of the electron gun was set to the 20 kV required for quantitative EDX analysis.
All electrochemical measurements were performed using a PalmSens4 analyzer (Houten, Utrecht, The Netherlands) running PSTrace voltammetry software (Version 5.8). A three-electrode system was used with un- or modified CP electrodes, an Ag/AgCl electrode, and a platinum electrode as working, reference, and counter electrode, respectively. Measurements were performed in BRBS at pH 5. Cyclic voltammetry (CV) measurements, square wave voltammetry (SWV) and electrochemical impedance spectroscopy (EIS measurements were performed according to the procedures listed in the appropriate section.

2.2. Material Preparation

The coprecipitation method is an established technique for the synthesis of mixed metal oxides, and has been shown to be effective for the preparation of cobalt oxide. By using this method, we aim to produce a high-quality sample of mixed cobalt oxide that can be used for a variety of applications. This work involves the preparation of mixed cobalt oxide using the coprecipitation method. To achieve this, we will dissolve the appropriate amount of cobalt(II) chloride in water, adjust the pH of the resulting solution to 13 using sodium hydroxide, and heat the solution for 4 h at 60 °C. The solution will then be washed with water until the reaction is neutral, and the resulting cobalt oxide precipitate will be dried for 16 h at 100 °C and annealed at 700 °C for 4 h.

2.3. Electrode Preparation

The bare carbon paste electrode was prepared using a standard procedure, mixing 80% glassy carbon powder with 20% silicon oil for 30 min. The resulting paste was left overnight before use. A modified carbon paste electrode was also prepared using the same procedure, but with the addition of an appropriate amount of cobalt oxide in percentages of 2, 5, 7, and 15 to the carbon powder. The working electrode was housed in a homemade Teflon body.

3. Results

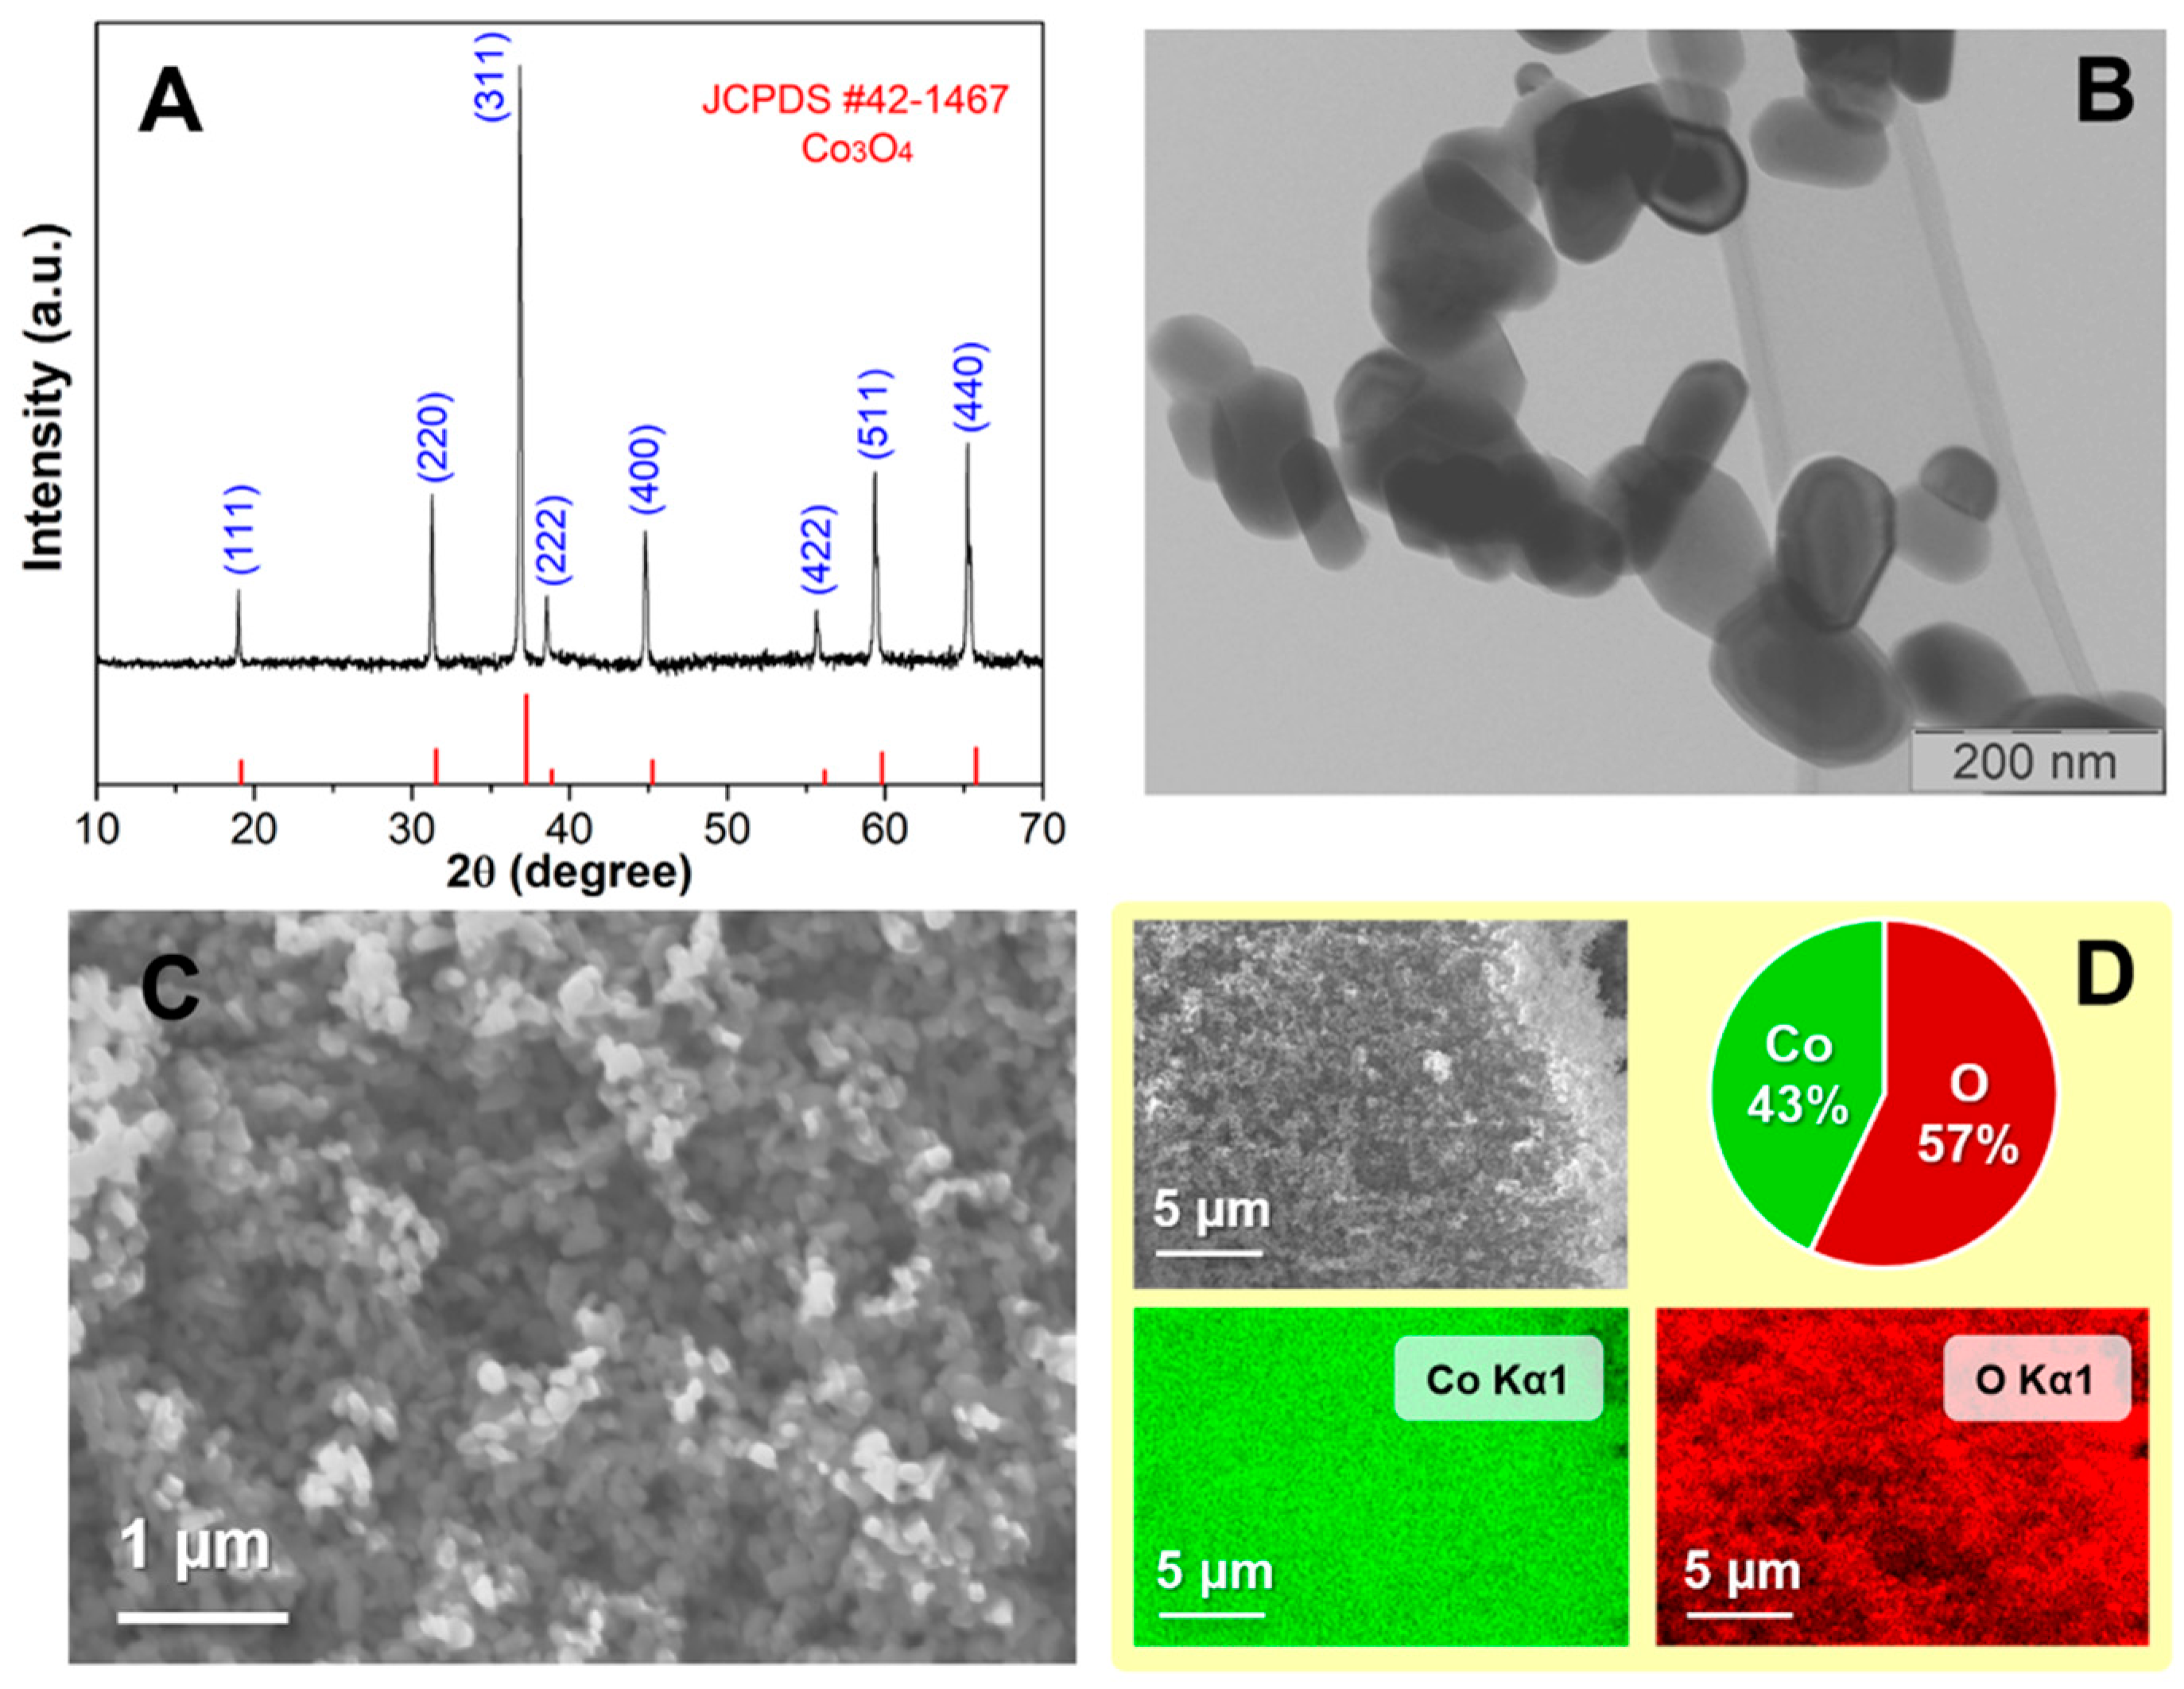
3.1. Morphology and Structure Characterization

The morphology and the structure of prepared Co3O4 nanoparticles were analyzed by X-ray diffraction data (XRD), transmission electron microscopy (TEM), and scanning electron microscopy (SEM) (Figure 1). Figure 1A presents the diffraction pattern of synthesized cobalt oxide, pointing to the excellent crystallinity of the sample. Crystal reflections occur in the same position as those for cobalt oxide of the spinel structure type, indicating that all the reflections can be indexed to the same space Fdm group and match the simulated diffraction data (JCPDS#42-1467) from the literature [18]. The cobalt oxide nanoparticles are hexagonally elongated in one dimension, as shown in Figure 1B. The average length of nanoparticles is about (130 ± 30) nm, while the average width is (70 ± 20) nm. The SEM micrographs and EDS elemental mapping of a wider area of the sample are displayed in Figure 1C,D. SEM figures reveal the homogeneous distribution of the sample while EDS elemental mapping shows that cobalt oxide was formed along the entire sample with the proportion of cobalt and oxygen, 43% and 57% respectively. The prepared cobalt oxide nanoparticles exhibited potential for use as electrochemical sensors due to their small crystallite size and large specific surface area. These properties provide active sites for the accumulation of ions.
Based on the ICP-OES method, the concentration of cobalt in the material used for the electrode preparation was found to be 591.27 mg/g with an RSD of 0.32%. This result is indicative of a high concentration of cobalt in the material, which could potentially have implications for the performance of the electrode. Further investigation may be necessary to fully understand the impact of this concentration on the overall function of the electrode.

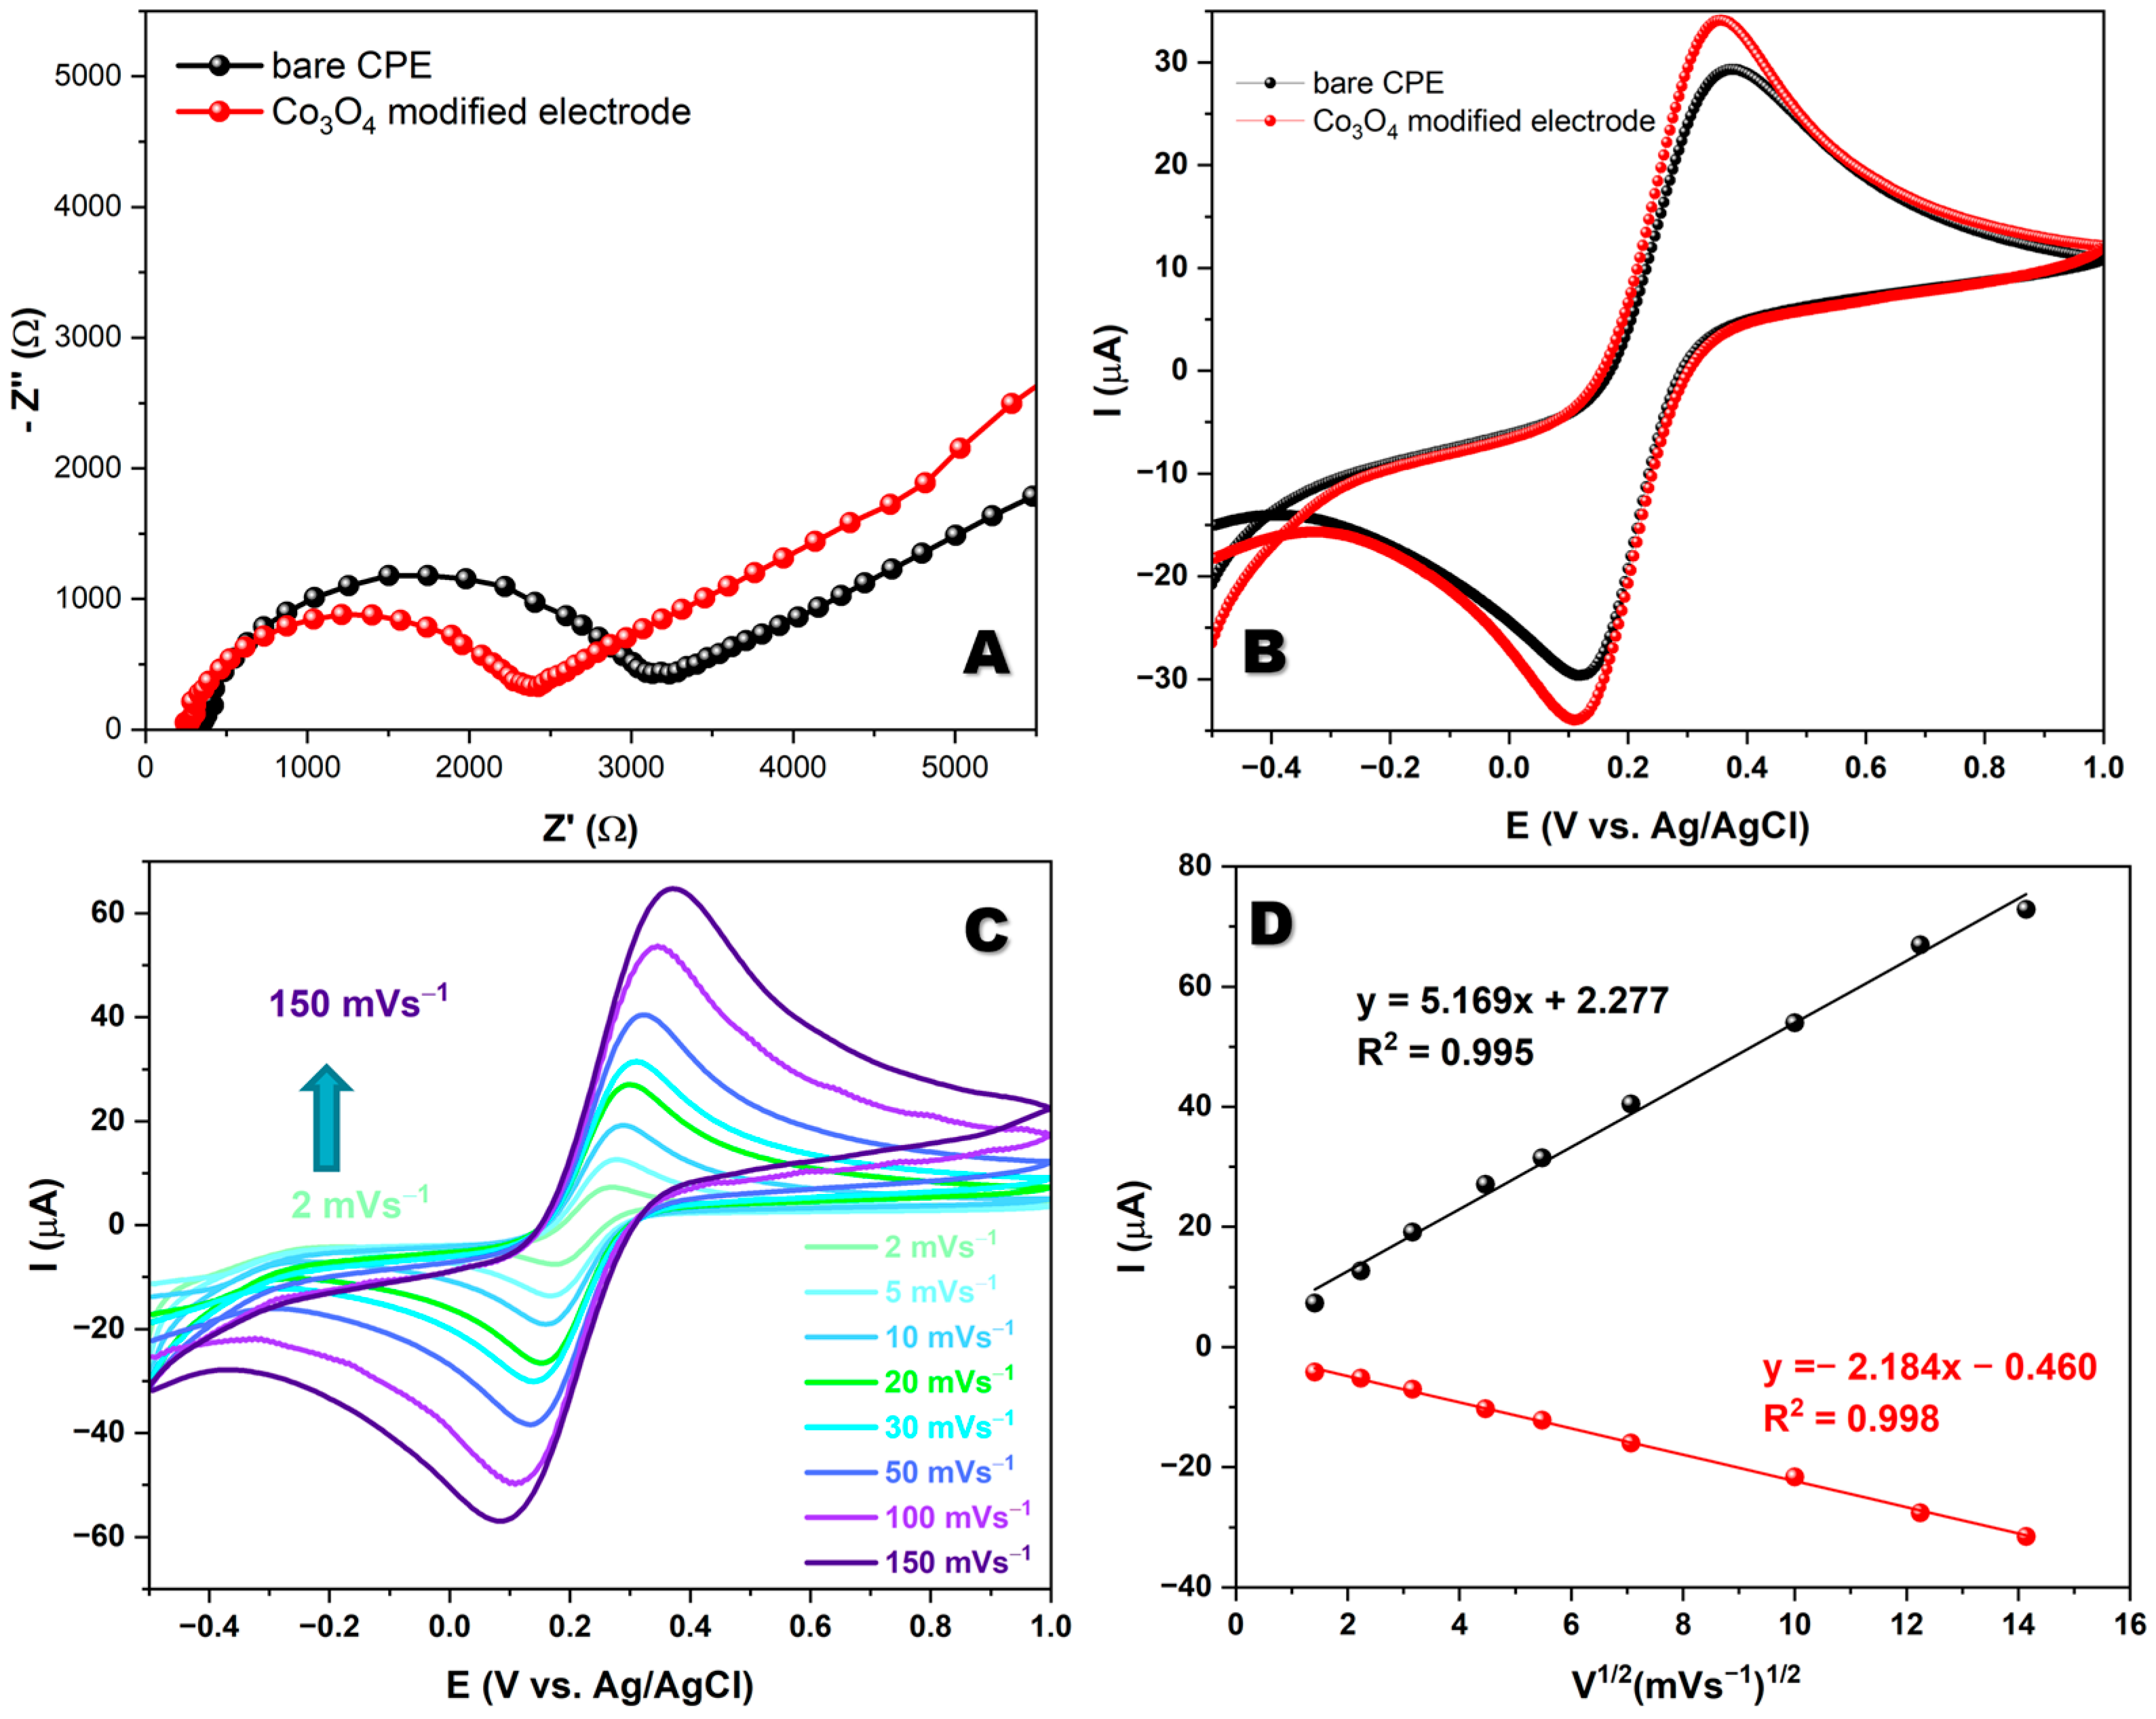
3.2. Electrochemical Characterization of Materials

When studying electron transport between the electrolyte and the electrode’s active surface, researchers employed electrochemical impedance spectroscopy. The resulting EIS spectra consisted of a semicircular high-frequency region and a linear low-frequency region. The semicircle’s diameter reflected the resistance to charge transfer, while the linear region indicated mass transfer and the diffusion of electroactive species. These observations provide valuable insights regarding the system’s behavior under investigation. EIS measurements were performed in a 5 mM redox system K3[Fe(CN)6]/K4[Fe(CN)6] and 0.1 M KCl as the supporting electrolyte, using an electrode modified with synthesized material and an unmodified carbon paste electrode. The results obtained using electrochemical impedance spectroscopy show a regular behavior, and the obtained spectra consist of two parts: a semicircular (high-frequency) and a linear (low-frequency) spectral region. Figure 2A shows that the Rct value of the modified electrode is lower than the Rct value of the bare electrode. The Rct values indicate that the modified electrode has a low resistance compared with the bare carbon paste electrode. It appears that the low resistance of the Co3O4 modified electrode can be attributed to its nanocomposite structure, which possesses superior electronic conductivity and remarkable electrocatalytic activity [19]. To determine the electron transfer behavior of the bare CPE and Co3O4-modified electrode, CV measurements were performed in 5 mM K3[Fe(CN)6]3−/4− in a 0.1 M KCl system. The CV profile of the modified electrode exhibits good redox peaks during forward and backward scans at potentials ranging from −0.5 V to 1 V with a scan rate of 50 mV s−1 (Figure 2B). Figure 2C shows the redox peaks for the Co3O4-modified electrode with different scan rates of 2–150 mVs−1 in [Fe(CN)6]3−/4−. Increasing the scan rate also expands the anodic and cathodic peak current. The analysis of the current peaks in the electrochemical reaction at the electrode/testing solution interface has revealed an interesting linear correlation between the currents and the square root of the scan rate, as depicted in Figure 2D. This correlation suggests that the electrochemical reaction at the interface is diffusion-controlled, which provides valuable insights into the mechanisms of the reaction.

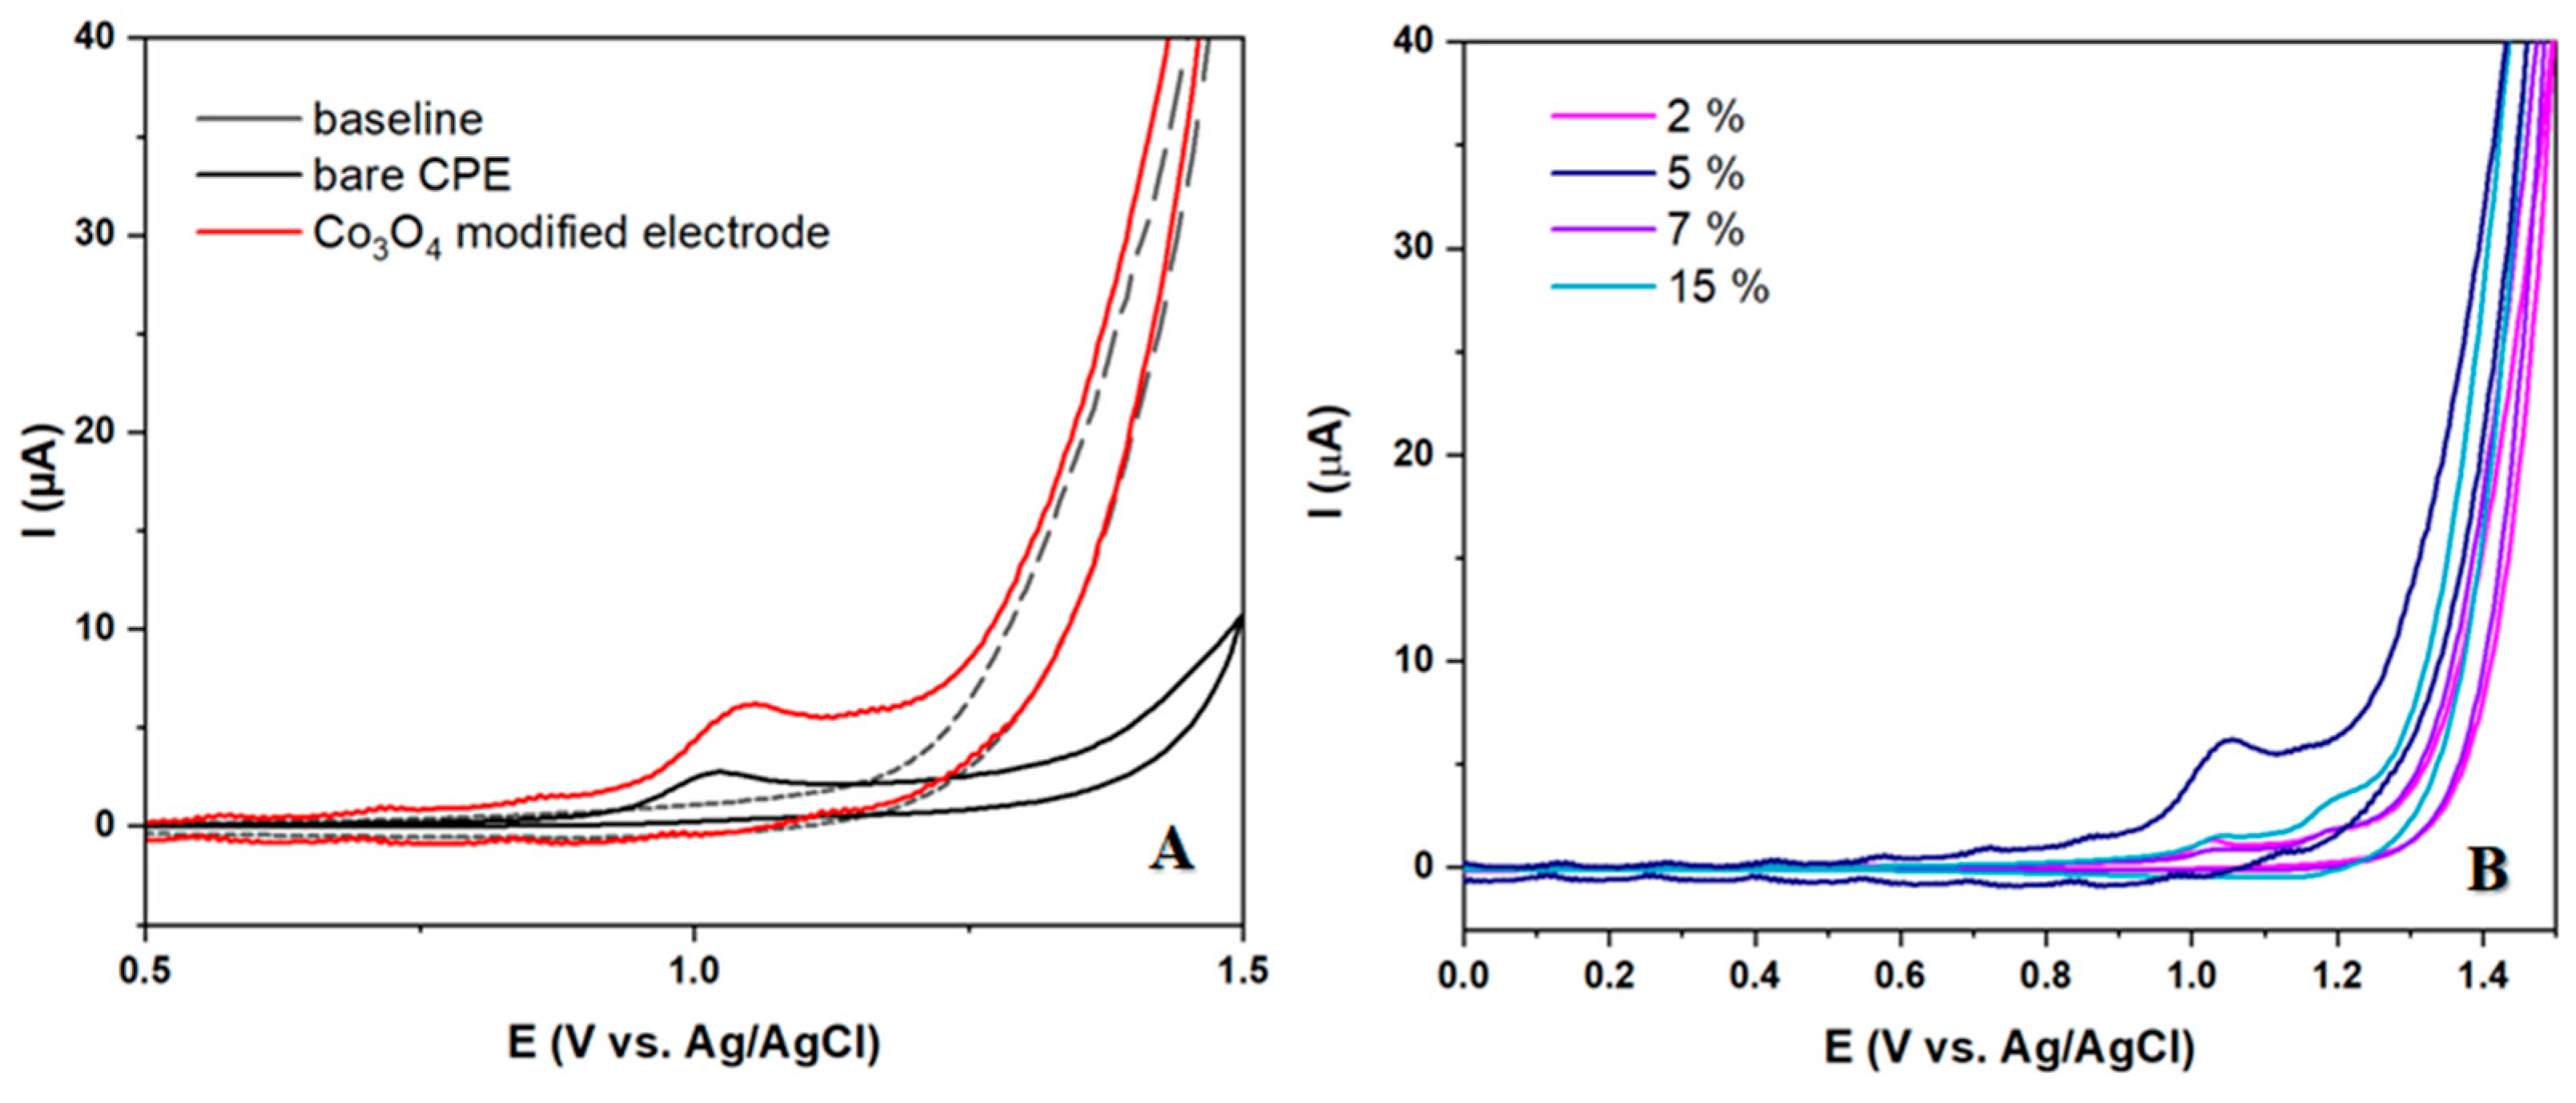
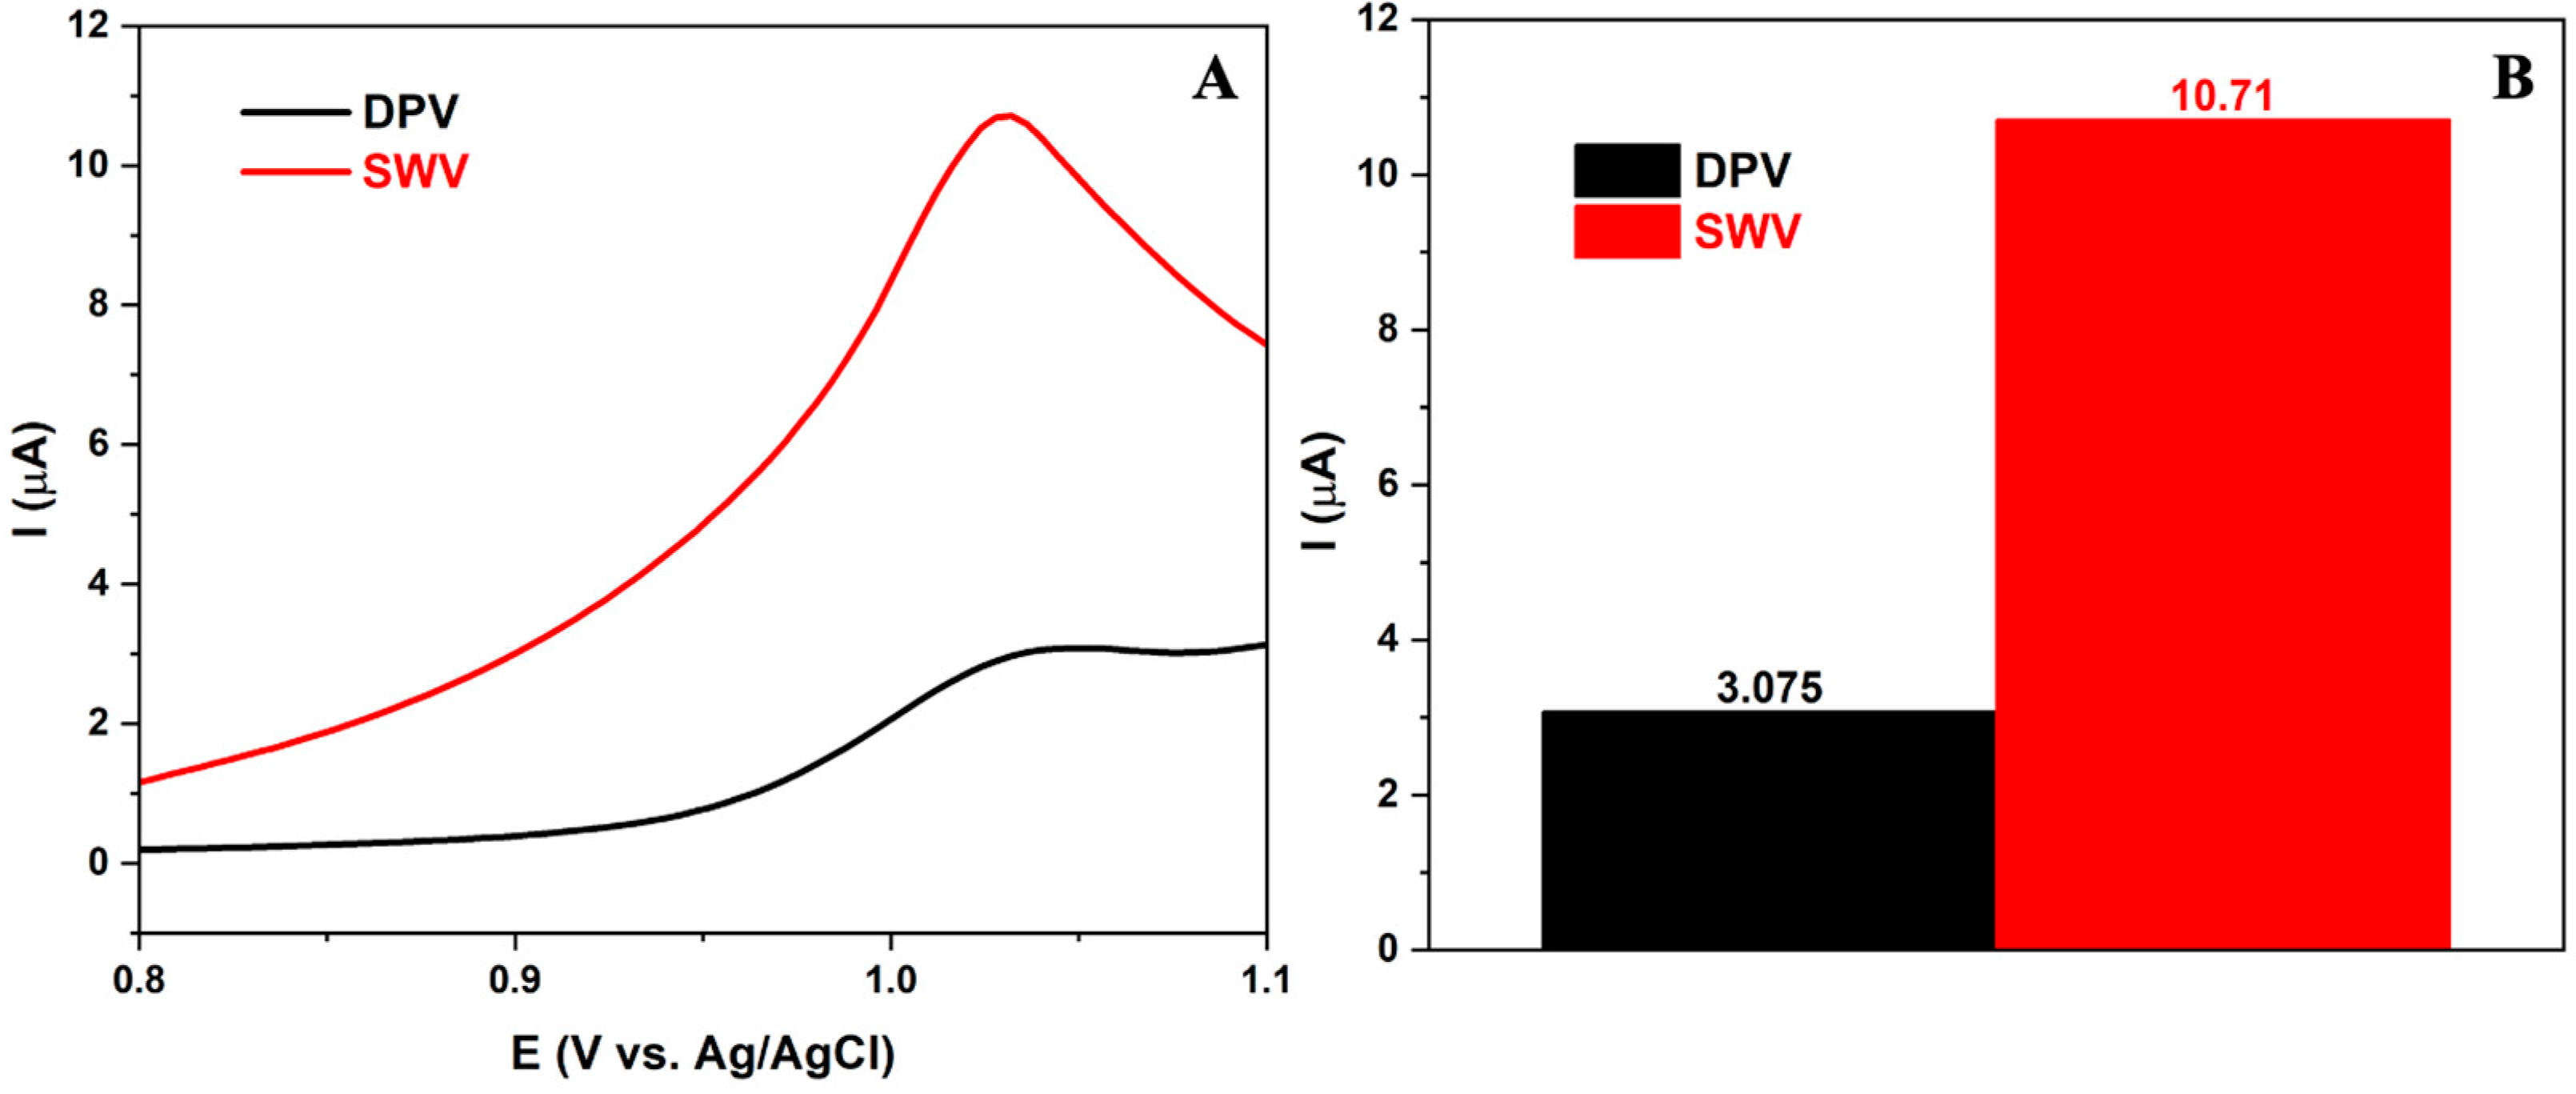
3.3. Detection of LEV

In this section, we conducted a thorough investigation of the capability of prepared electrodes to detect 50 μM LEV. The findings revealed a distinct and precise peak resulting from the precipitated analyte at potentials just above 1 V, signifying its oxidation. The modified electrode exhibited a significantly higher peak current in comparison to the unmodified electrode (Figure 3A). The impact of various modification percentages (2, 5, 7 and 15 wt%) on the intensity and shape of the oxidation peak of LEV was thoroughly examined (Figure 3B). At low catalyst loadings below 5 wt%, the amount of active material is likely insufficient to make full use of the high surface area CPE. This limits the number of electrochemically active sites for the redox reactions. As the catalyst loading increases, more active sites become available, leading to higher redox peak currents [20]. However, above the 5 wt% loading of Co3O4, the catalyst particles may begin to aggregate. This reduces the exposed catalyst surface area and limits the electrolyte’s access to the active sites. This is observed from the data we obtained for the material with a high catalyst content of 15 wt%. Furthermore, electrical conductivity through the electrode may be impeded at a high content of the aggregated catalyst particles, which is observed from the CV data. In summary, 5 wt% appears to strike an optimal balance between increasing the number of active sites, while decreasing unwanted catalyst particle aggregation effects. This electrode was utilized for all additional studies and the development of an analytical procedure for LEV detection.

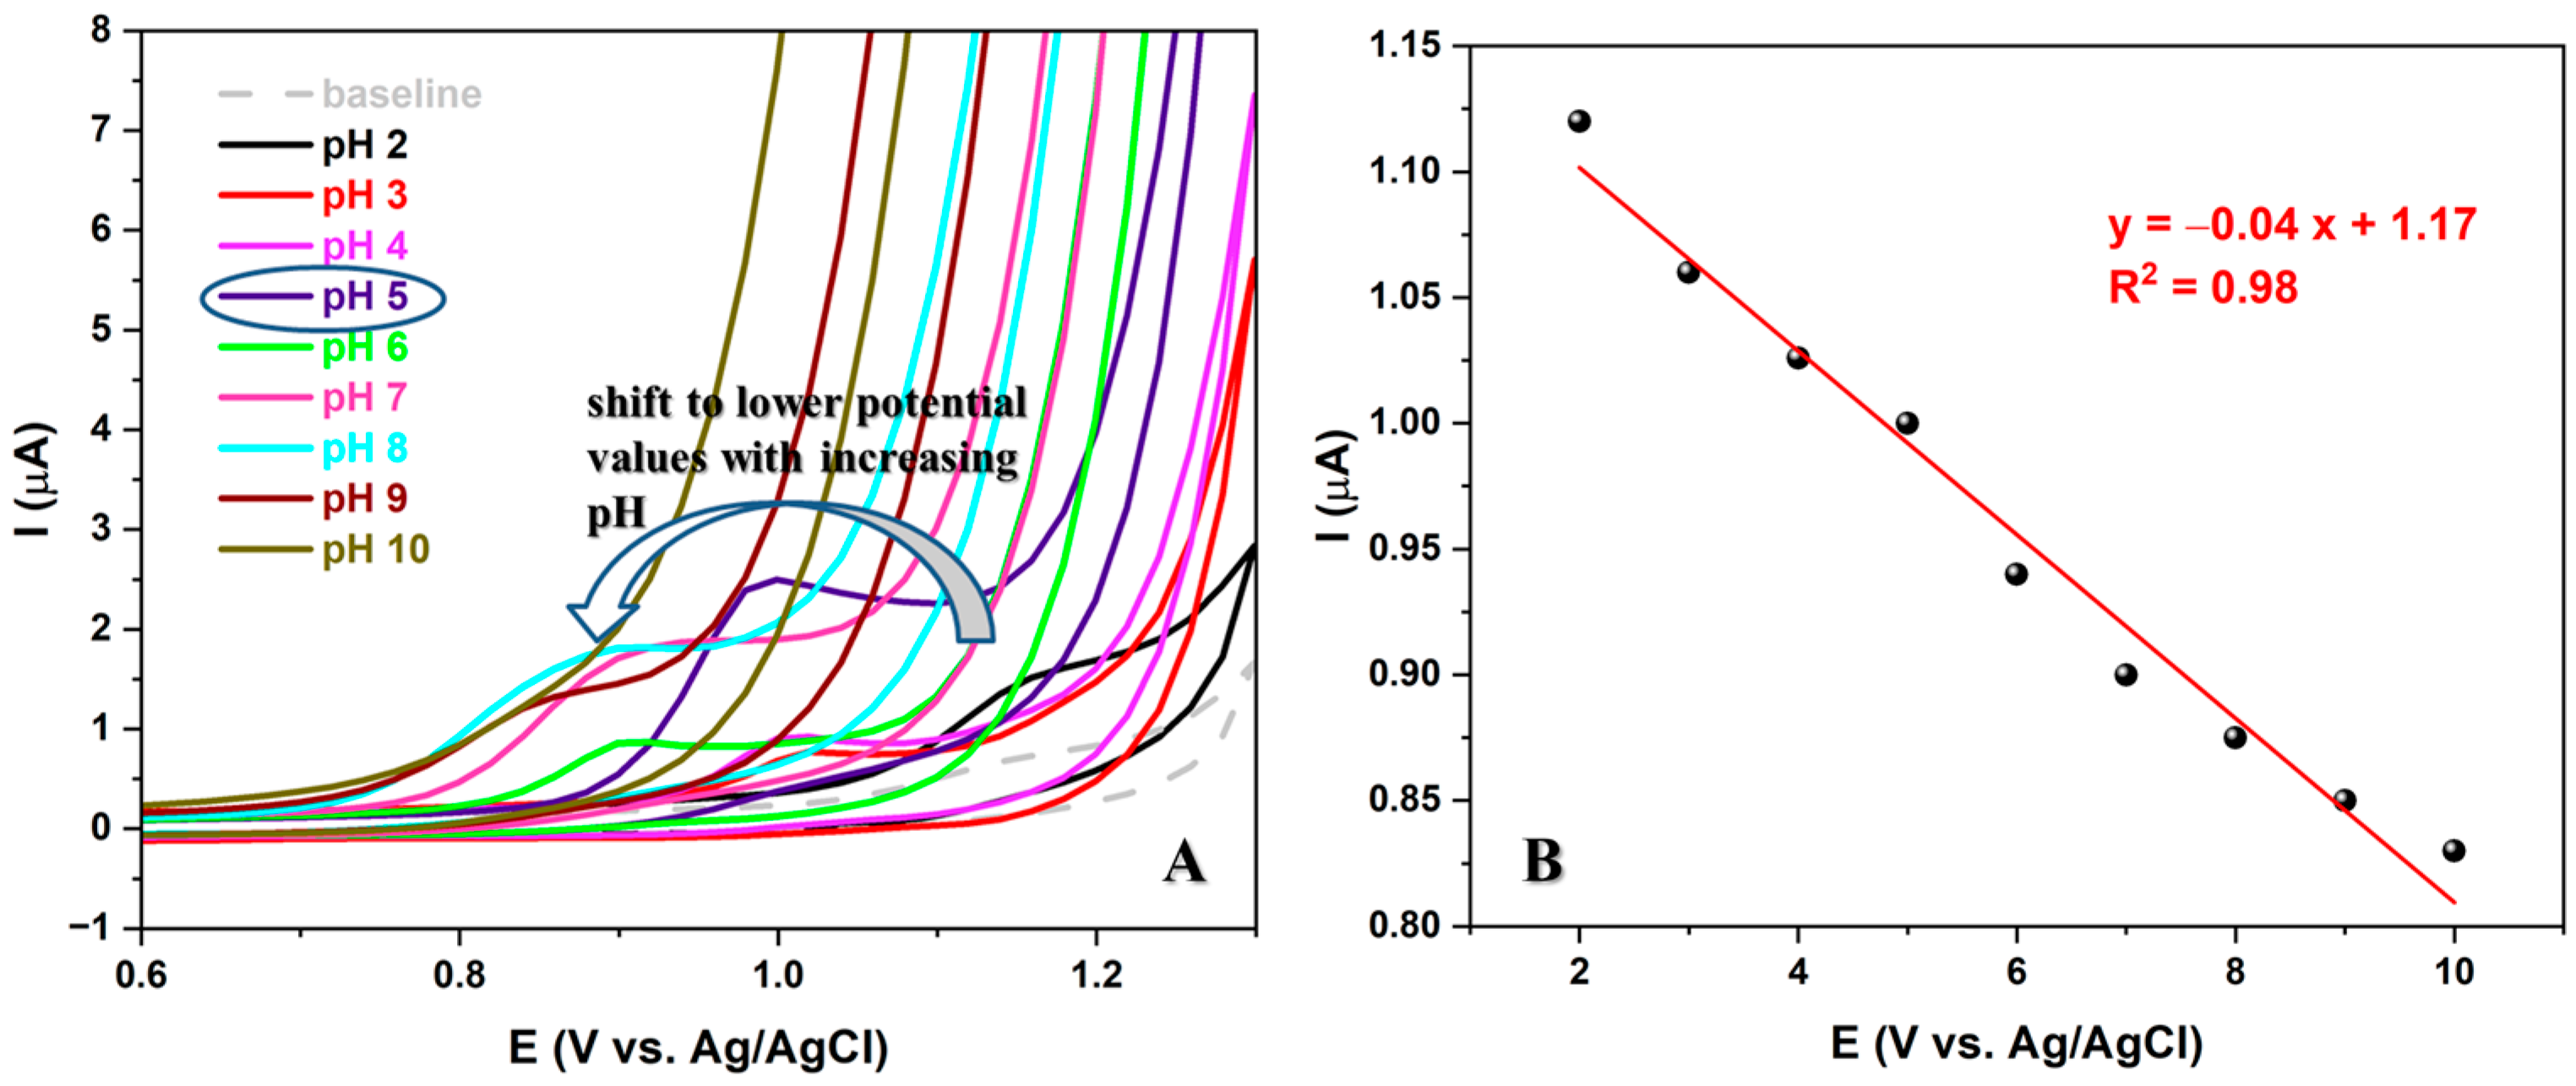
3.4. Optimization of pH of the Supporting Electrolyte

The electrode selected to test the optimal pH value of the supporting electrolyte produced interesting results. As seen in Figure 4A, when using a scan rate of 50 mV/s in BRBS buffer with a range of pH values from 2 to 10 and a constant concentration of 50 µM of LEV, an increase in pH from 2 to 5 resulted in a double effect of an increase in peak current and a shift of the peak to less positive values. However, a further increase in pH resulted in a peak shift in the same direction, but with a decrease in peak current. Therefore, pH 5 of the BRBS buffer was selected for further recordings, which showed a well-defined and oval peak with the most intense current.
The peak potential shifts linearly with the increasing pH of the supporting electrolyte. This correlation can be expressed with the following equation: Ep = 1.17 − 0.04 pH. The slope obtained for the LEV oxidation process is close to the theoretical one (0.059), which suggested that the same number of protons and electrons are involved in the studied electrochemical reaction. According to the cyclic voltammetry theory for irreversible systems, the number of electrons in the LEV oxidation (n) was determined using the following equation: Ep − Ep1/2 = 47.7 mV/αn, where Ep, Ep1/2, α, and n are potential peak, potential peak at half-height, electronic transfer coefficient (0.5), and the number of electrons, respectively [21]. The number of electrons for the oxidation of LEV can be calculated as n = 1.6 ≈ 2 electrons per molecule of LEV. These findings suggested that the electrochemical oxidation of LEV on the Co3O4/CPE surface could follow the reaction depicted in Scheme 1, which is consistent with data from the literature on the reaction mechanism [1,22].

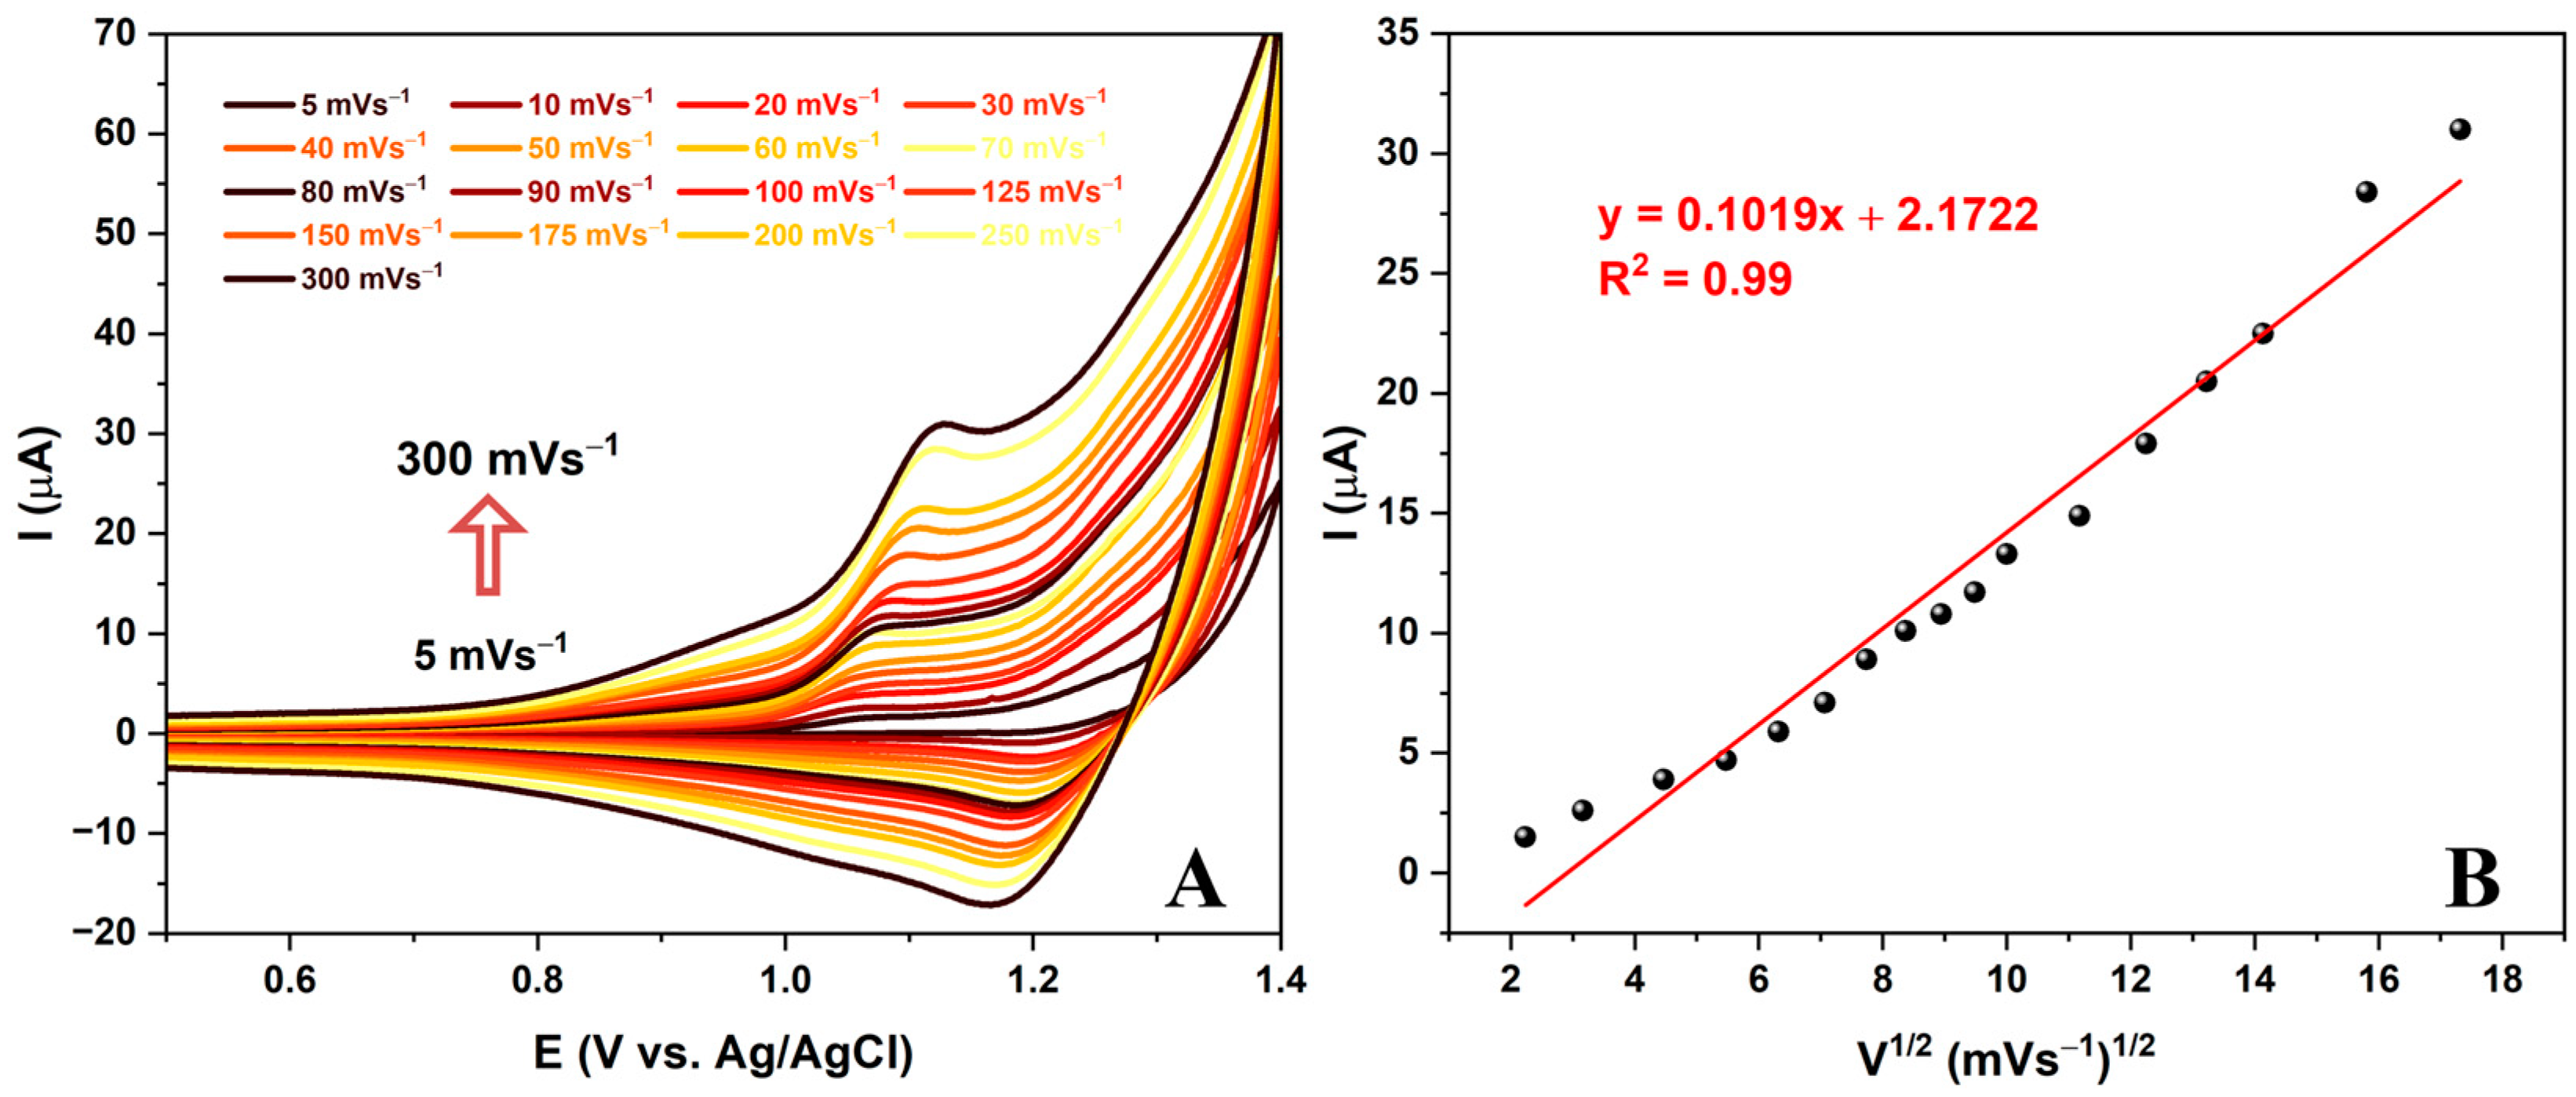
3.5. Electrochemical Behavior of LEV at Different Scan Rates over Co3O4/CPE Sensor

The recent study on the electrochemical behavior of LEV has yielded promising results. By examining the kinetics of the electrode reaction at the electrode/test solution interface at different scan rates, it was found that a higher scan speed led to an increase in Faraday and capacitive current (Figure 5A). The oxidation current, in particular, displayed a linear dependence on the square root of the scan rate (Figure 5B), indicating that the process occurring at the electrode is diffusion-controlled. This finding is significant, as it makes the synthesized nanomaterial a strong contender for the development of an electroanalytical method for LEV detection. The study’s results suggest that the nanomaterial’s diffusion-controlled behavior could be leveraged to create a reliable and efficient method for detecting LEV.

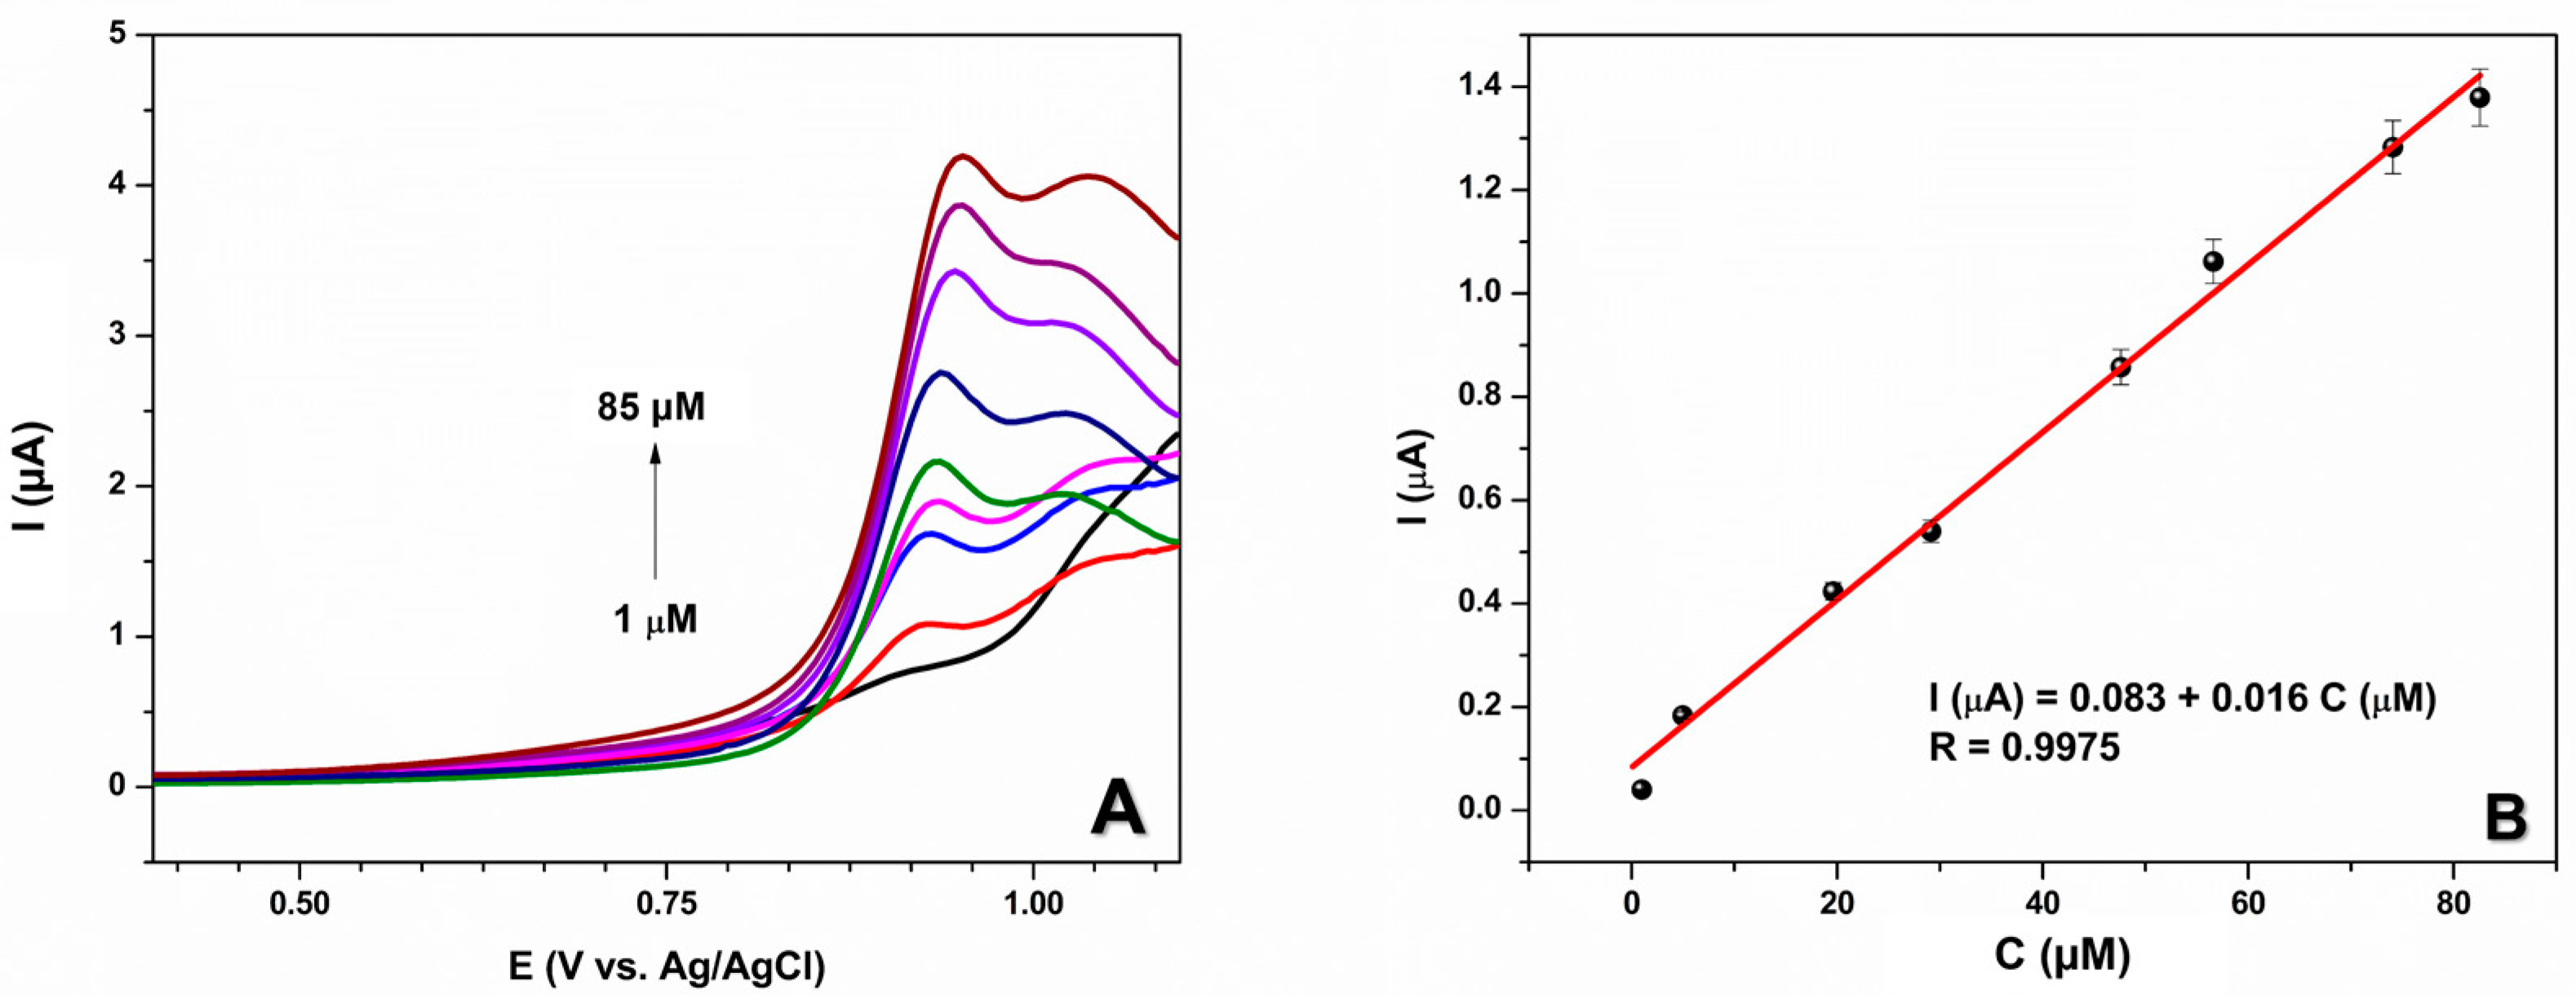
3.6. Quantification of LEV

Our thorough investigation has revealed that square wave voltammetry (SWV) and differential pulse voltammetry (DPV) are the two most efficient techniques for quantitative analysis in voltammetry. Upon conducting a detailed comparison of the voltammograms acquired through DPV and SWV (Figure 6A), we have determined that the SWV method provides a superior peak with higher current and resolution (Figure 6B). Therefore, we have decided to employ the SWV method for all our subsequent measurements as it offers faster measurement speed, improved detection limits, wider linear working ranges, and better measurement signal processing.
We conducted extensive research to optimize the working parameters for the SWV method, with the goal of improving the method’s detection limit and signal discrimination. We used CPE with a 5% Co3O4-modified electrode in BRBS at pH 5, within a potential range of 0 to 1.1 V. To determine the optimal working parameters, we tested various potential increments ranging from 2 mV to 20 mV, as well as varied the frequency value from 10 to 90 Hz and the amplitude from 10 to 90 mV. After conducting these tests, we found that the ideal working parameters for the SWV method were a potential step of 5 mV, an amplitude of 70 mV, and a frequency of 5 Hz. These optimized working parameters will significantly enhance the accuracy and precision of the SWV method. By implementing these parameters, we expect to achieve superior results in future experiments and further advance the field of electrochemical analysis.
The positive results obtained on the improvement of the characteristics of the electrode made of carbon paste were confirmed by examining the influence of different concentrations of analyte, using previously optimized parameters. Figure 7 shows the dependence of the oxidation current on the added amount of standard LEV solution. A linear dependence was obtained for a wide range of concentrations from 1 to 85 μM. The calibration curve can be described by the equation Ap (VμA) = 0.003 + 0.001 × C (μM) with a linear regression coefficient (R) of 0.9975. The limit of detection (LOD) and the limit of quantification (LOQ) were calculated as 3S/b and 10S/b, respectively, where S is the standard deviation of three repeated blank measurements and b is the slope value of the calibration curve [23]. The found values were 0.39 μM for LOD and 1.30 μM for LOQ. The sensitivity of the proposed sensor was found to be 0.51 µAµM−1cm−2, calculated from the slope of the calibration curve and the apparent surface area of the CPE.
An investigation of the repeatability of the LEV sensor was conducted. This study was carried out using LEV in BRBS pH 5 with 50 μM of analyte. The obtained results revealed that the relative standard deviation (RSD) for five consecutive measurements was 3.5%, indicating excellent repeatability. These data are immensely informative and provide a significant insight into the performance of the LEV sensor. It also highlights the potential applications of this sensor in various fields. Going forward, we aim to continue with our research and testing to further explore the capabilities of the LEV sensor and the potential impact it can make in different areas.

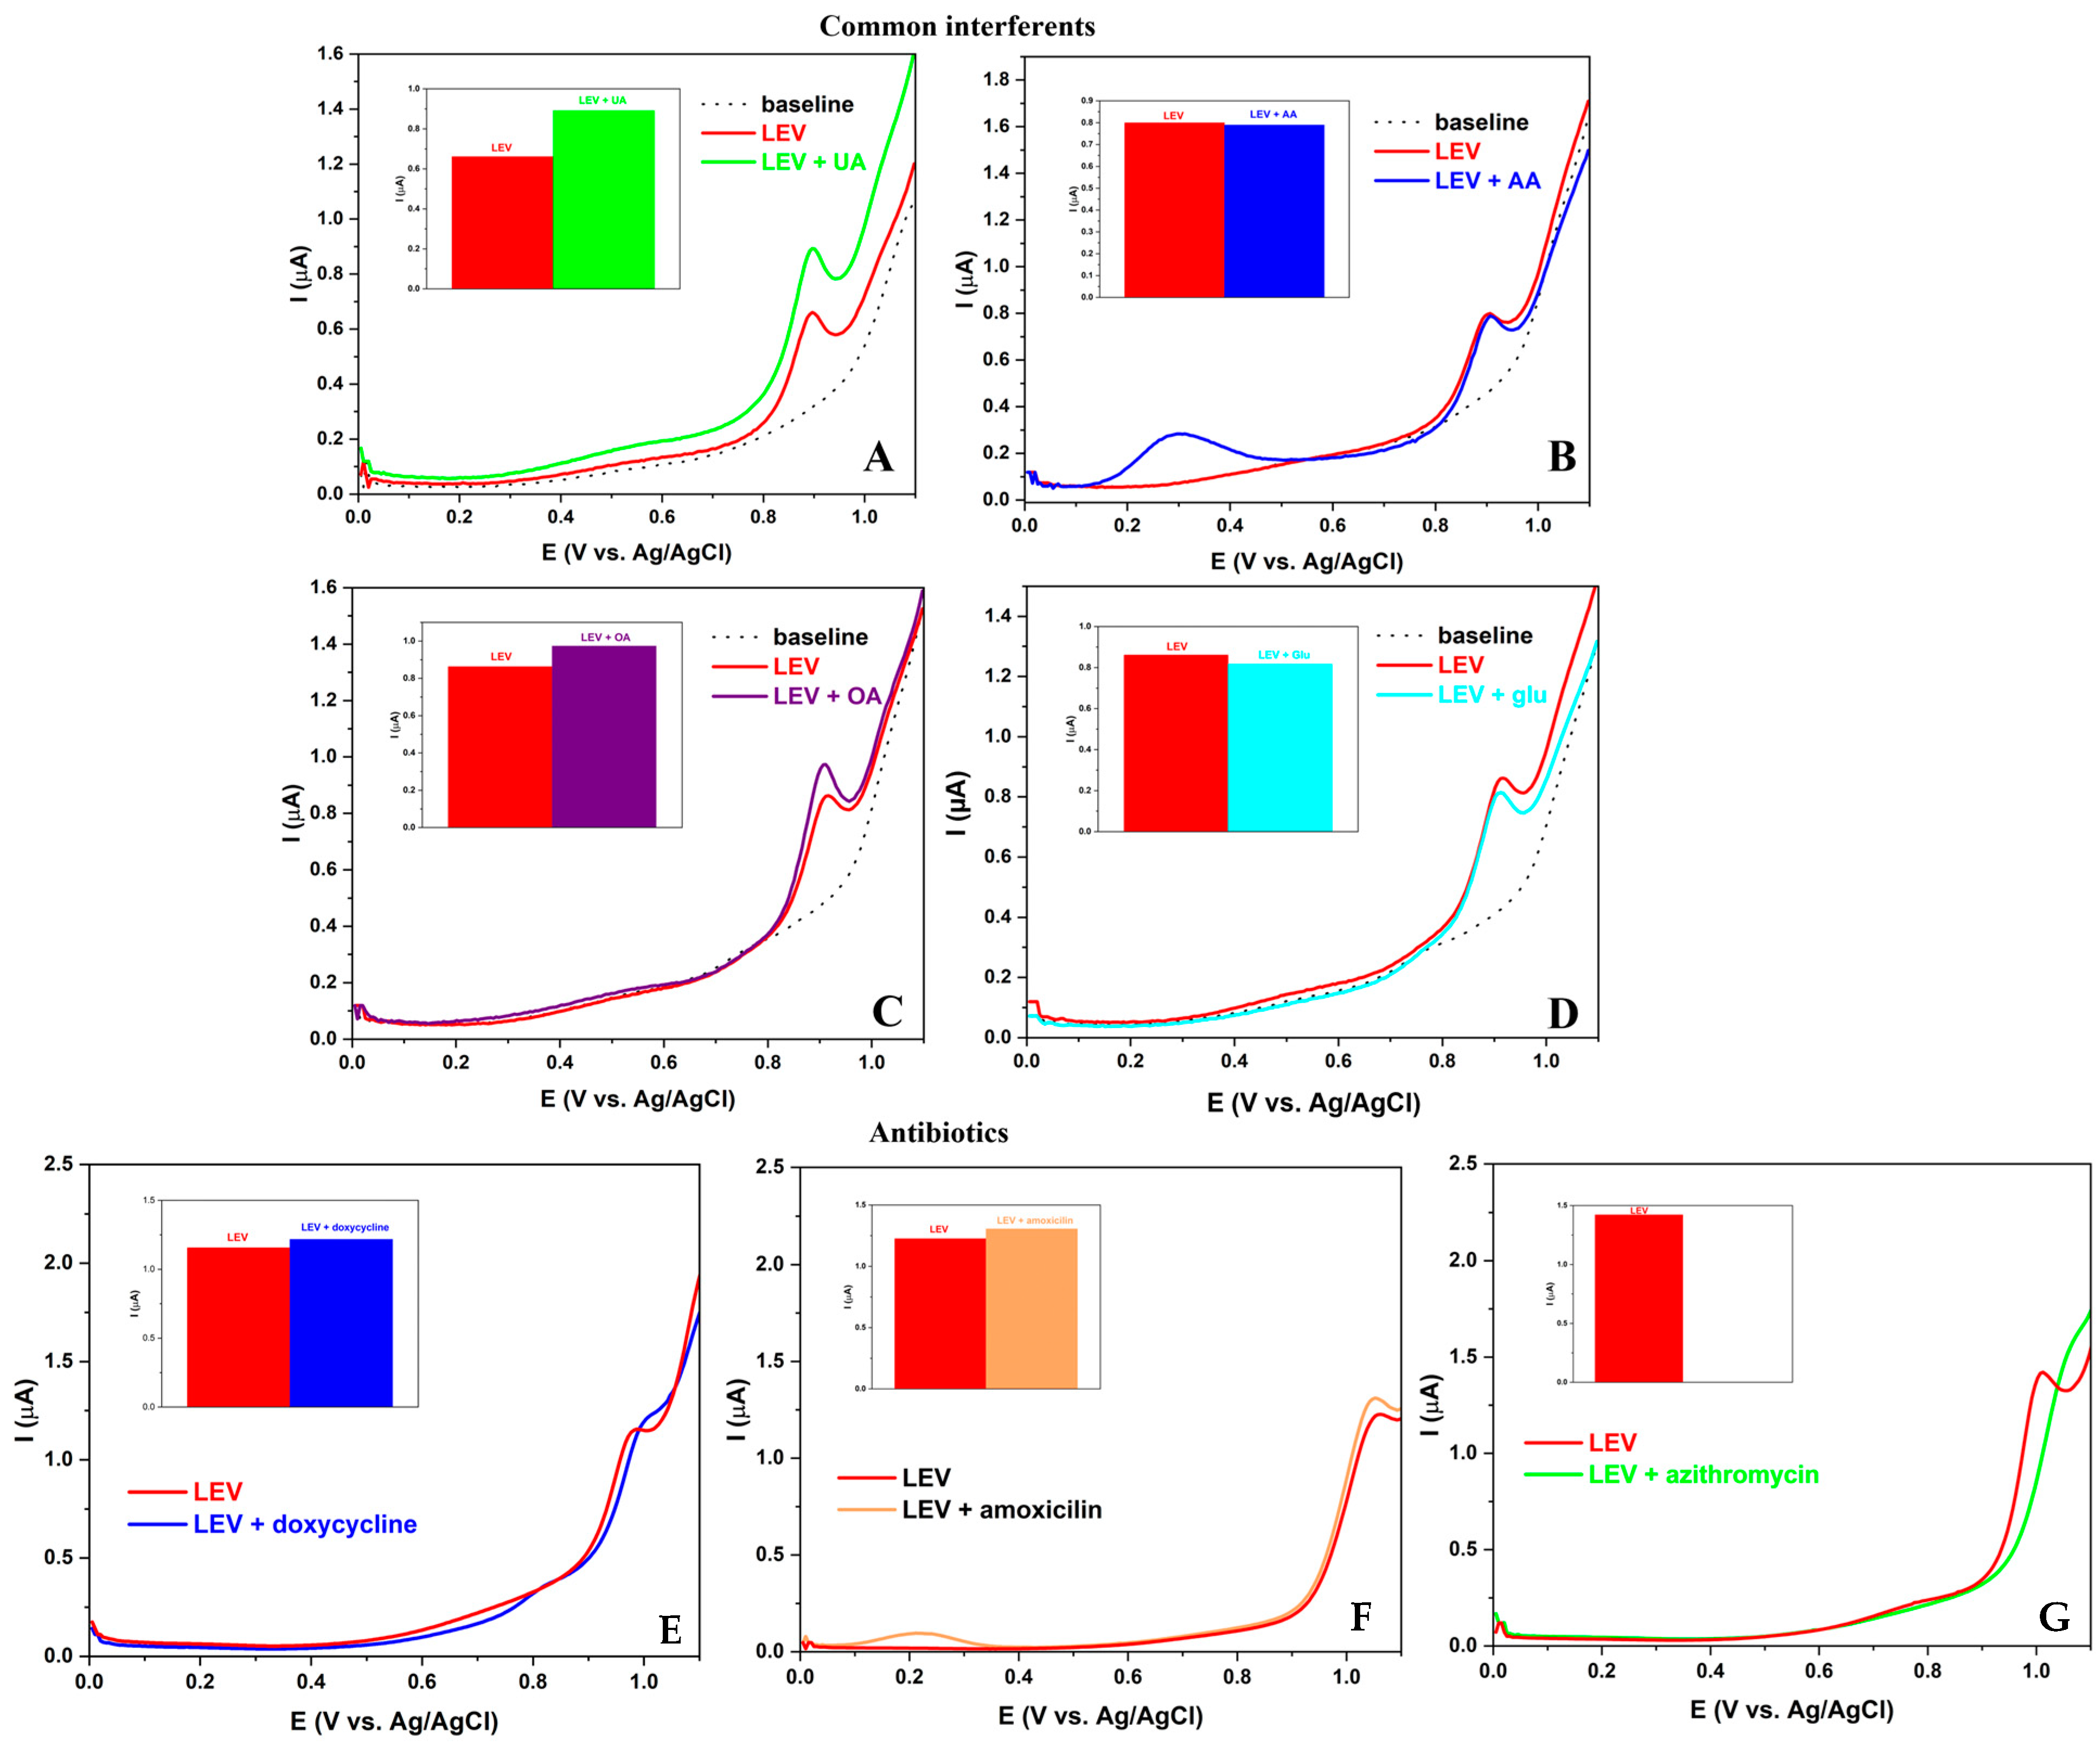
3.7. Interference Measurement

To evaluate the selectivity of our method for detecting LEV, we conducted tests by introducing a standard solution of interfering substances to solutions containing 50 μM of LEV. Our findings (Figure 8) revealed that the presence of ascorbic acid (AA) and glucose (Glu) did not interfere with the quantification of LEV, resulting in changes in the current signal that were less than 2% and 5%, respectively. On the other hand, the presence of oxalic acid (OA) and uric acid (UA) caused significant signal reduction, with changes of 11% and 25%, respectively. However, it is important to note that our proposed sensor can still be effectively utilized for determining the concentration of analytes in pharmaceutical formulations where the presence of OA and UA is not expected. Also, we investigated the influence of antibiotics on the determination of LEV. Our results (Figure 8E–G) show that doxycycline and amoxicillin changes the current signal by less than 3%, but in the presence of azithromycin, we lose the LEV signal. Our sensor can be used for analysis in samples where the investigated antibiotics are present. Consequently, our results indicate a high degree of accuracy and reliability of our method in detecting LEV.

3.8. Application of a Modified Electrode for the Determination of LEV

In order to test the practical applicability of the method for the quantification of LEV, we used tap water as real samples. The pH value of real water samples was 5.8. In order to obtain the best possible electrode response, the pH value of the real sample was adjusted to pH 5. In water samples, three different concentrations of LEV (13.56; 21.67 and 37.96 µM) were added, and corresponding SWV voltammograms were recorded. For each sample, the obtained current values and analyte concentrations were determined, with the help of a previously constructed calibration line. The results are presented in Table 1. Recovery values were calculated as the ratio of the found and added concentration of Levofloxacin in real water samples. The values were multiplied by 100 to present results in percentages (%). The obtained recovery values were in range of 94–106%, indicating that the proposed method is both reliable and reproducible, making it a promising tool for the analysis of LEV in water samples. Overall, the results of this study highlight the potential of the proposed method for the analysis of LEV in water samples. Further research is certainly recommended to fully explore the capabilities and potential applications of this method. However, the initial findings indicate that this method is a reliable and reproducible tool for the quantification of LEV in real-time water samples.

4. Discussion

The use of nanomaterials plays a key role in the selectivity and sensitivity of the method. A simple synthesis of Co3O4 gives uniformly distributed and highly crystalline spherical nanoparticles. The co-precipitation synthesis method used in this work does not require the use of organic solvents, which makes it green, eco-friendly, and in accordance with the requirements of modern science. The material thus prepared showed excellent electrocatalytic abilities in the Fe2+/3+ couple using cyclic voltammetry and impedance spectroscopy. These catalytic properties can be associated with the presence of Co2+ and Co3+, which are known to occupy tetrahedral and octahedral positions, respectively, in the structure of the material, thus significantly contributing to the catalytic axis of the material. The presence of this catalyst in the structure of the material significantly affects the detection of levofloxacin. A significant increase in the peak current compared to the unmodified electrode is observed, and this can be related to the improvement of the interaction between the tested analyte and the electrode surface, through the improvement of diffusion on the electrode surface and the number of active sites (effective electrode surface). Additional confirmation of this is the dependence of the levofloxacin oxidation current on the amount of modifier. Electroanalytical detection methods are based on the use of the pulse SWV method. The parameters of the method were optimized and, as a final result, the sub-micromolar limit of detection was achieved. The excellent compatibility of the material with the target analyte was demonstrated through studies of the influence of interfering compounds, while the influence of the matrix effect was shown to be minimal through the practical use of the method for the detection of levofloxacin in real samples, recovery, reproducibility, and repeatability. The innovative and ecologically conscious sensing techniques devised by our research team possess the ability to establish a solid groundwork for subsequent breakthroughs in this domain. The successful implementation of these methods could eventually culminate in a revolutionary transition, in which the principle we have established can be seamlessly adapted into an online system that can be operated and controlled remotely, enabling efficient monitoring and analysis. Moreover, this advancement holds great promise for facilitating real-time and continuous detection and measurement of levofloxacin, thereby enhancing the effectiveness and reliability of this analytical process in various industries and applications.

5. Conclusions

We have developed a highly effective method for detecting and measuring levofloxacin using cobalt oxide (Co3O4) nanomaterial as a support for the carbon paste electrode. We have carefully examined the nanomaterial’s morphological properties using advanced imaging techniques such as TEM, SEM, and XRD. The detection method we employed, SWV, proved to be exceptional, with a linear correlation concentration/current ranging from 1 to 85 μM, and a detection limit of 0.39 μM. We utilized this optimized method to analyze a real sample and obtained highly satisfactory results. The developed sensor has low sensitivity (0.51 µAµM−1 cm−2) and selectivity, a quick response time (<2 s), all while being more cost-effective than standard analytical methods for LEV determination and quantification. This method can be readily applied in routine research with the use of a calibration line or the standard addition method.

Author Contributions

Conceptualization, T.M. and D.S.; methodology D.S., D.M. and D.P., formal analysis, F.P. and V.V.A.; investigation, T.M., D.S., V.S. and D.P.; resources, M.O. and V.S.; data curation, D.M., D.P. and F.P.; writing—original draft preparation, T.M., D.S., M.O. and V.S.; writing—review and editing, T.M., M.O. and V.S.; supervision, M.O. and V.S. All authors have read and agreed to the published version of the manuscript.

Funding

This research has been financially supported by the Ministry of Science, Technological Development and Innovation of Republic of Serbia (Contract No: 451-03-47/2023-01/200026 and 451-03-47/2023-01/200168) and Ministry of Science and Higher Education of the Russian Federation (agreement No. 075-15-2022-1135) and South Ural State University.

Institutional Review Board Statement

Not applicable.

Informed Consent Statement

Not applicable.

Data Availability Statement

Data are contained within the article.

Conflicts of Interest

The authors declare no conflicts of interest.

References

  1. Rkik, M.; Brahim, M.B.; Samet, Y. Electrochemical determination of levofloxacin antibiotic in biological samples using boron-doped diamond electrode. J. Electroanal. Chem. 2017, 794, 175–181. [Google Scholar] [CrossRef]
  2. Siporin, C.; Heifetz, C.L.; Domagala, J.M. (Eds.) The New generation of quinolones. In Infectious Disease and Therapy; M. Dekker: New York, NY, USA, 1990; Volume 5. [Google Scholar]
  3. Wolfson, J.S.; Hooper, D.C. Fluoroquinolone antimicrobial agents. Clin. Microbiol. Rev. 1989, 2, 378–424. [Google Scholar] [CrossRef] [PubMed]
  4. Anderson, G.J. Quinolone Antimicrobial Agents, 3rd ed.; Emerg Infectious Diseases; CDC: Atlanta, GA, USA, 2004; Volume 10, p. 1177. [Google Scholar] [CrossRef]
  5. Tunitskaya, V.L.; Khomutov, A.R.; Kochetkov, S.N.; Kotovskaya, S.K.; Charushin, V.N. Inhibition of DNA gyrase by levofloxacin and related fluorine-containing heterocyclic compounds. Acta Nat. 2011, 3, 94–99. [Google Scholar] [CrossRef]
  6. Podder, V.; Sadiq, N.M. Levofloxacin. In StatPearls; StatPearls Publishing: Treasure Island, FL, USA, 2022. [Google Scholar]
  7. Ghanbari, M.H.; Khoshroo, A.; Sobati, H.; Ganjali, M.R.; Rahimi-Nasrabadi, M.; Ahmadi, F. An electrochemical sensor based on poly (l-Cysteine)@AuNPs @ reduced graphene oxide nanocomposite for determination of levofloxacin. Microchem. J. 2019, 147, 198–206. [Google Scholar] [CrossRef]
  8. Maleque, M.; Hasan, M.R.; Hossen, F.; Safi, S. Development and validation of a simple UV spectrophotometric method for the determination of levofloxacin both in bulk and marketed dosage formulations. J. Pharm. Anal. 2012, 2, 454–457. [Google Scholar] [CrossRef] [PubMed]
  9. Zhan, Y.; Zhang, Y.; Li, Q.; Du, X. Selective spectrophotometric determination of paracetamol with sodium nitroprusside in pharmaceutical and biological samples. J. Anal. Chem. 2011, 66, 215–220. [Google Scholar] [CrossRef]
  10. Szerkus, O.; Jacyna, J.; Wiczling, P.; Gibas, A.; Sieczkowski, M.; Siluk, D.; Matuszewski, M.; Kaliszan, R.; Markuszewski, M.J. Ultra-high performance liquid chromatographic determination of levofloxacin in human plasma and prostate tissue with use of experimental design optimization procedures. J. Chromatogr. B Analyt Technol. Biomed. Life Sci. 2016, 1029–1030, 48–59. [Google Scholar] [CrossRef]
  11. Attimarad, M. Simultaneous determination of paracetamol and lornoxicam by RP-HPLC in bulk and tablet formulation. Pharm. Methods 2011, 2, 61–66. [Google Scholar] [CrossRef] [PubMed]
  12. Shao, X.; Li, Y.; Liu, Y.; Song, Z. Rapid determination of levofloxacin in pharmaceuticals and biological fluids using a new chemiluminescence system. J. Anal. Chem. 2011, 66, 102–107. [Google Scholar] [CrossRef]
  13. Khoshsafar, H.; Bagheri, H.; Rezaei, M.; Shirzadmehr, A.; Hajian, A.; Sepehri, Z. Magnetic Carbon Paste Electrode Modified with a High Performance Composite Based on Molecularly Imprinted Carbon Nanotubes for Sensitive Determination of Levofloxacin. J. Electrochem. Soc. 2016, 163, B422–B427. [Google Scholar] [CrossRef]
  14. Mutić, T.; Ognjanović, M.; Kodranov, I.; Robić, M.; Savić, S.; Krehula, S. The influence of bismuth participation on the morphological and electrochemical characteristics of gallium oxide for the detection of adrenaline. Anal. Bioanal. Chem. 2023, 415, 4445–4458. [Google Scholar] [CrossRef] [PubMed]
  15. Özcan, A.; Hamid, F.; Özcan, A.A. Synthesizing of a nanocomposite based on the formation of silver nanoparticles on fumed silica to develop an electrochemical sensor for carbendazim detection. Talanta 2021, 222, 121591. [Google Scholar] [CrossRef] [PubMed]
  16. Özcan, A.; Ilkbaş, S. Preparation of poly(3,4-ethylenedioxythiophene) nanofibers modified pencil graphite electrode and investigation of over-oxidation conditions for the selective and sensitive determination of uric acid in body fluids. Anal. Chim. Acta 2015, 891, 312–320. [Google Scholar] [CrossRef]
  17. Özcan, A.; Ilkbaş, S. Poly(pyrrole-3-carboxylic acid)-modified pencil graphite electrode for the determination of serotonin in biological samples by adsorptive stripping voltammetry. Sens. Actuators B Chem. 2015, 215, 518–524. [Google Scholar] [CrossRef]
  18. Thangavelu, K.; Parameswari, K.; Kuppusamy, K.; Haldorai, Y. A simple and facile method to synthesize Co3O4 nanoparticles from metal benzoate dihydrazinate complex as a precursor. Mater. Lett. 2011, 65, 1482–1484. [Google Scholar] [CrossRef]
  19. Mariappan, K.; Alagarsamy, S.; Chen, S.-M.; Subramanian, S. Electrochemical Detection of Metronidazole by the Fabricated Composites of Orthorhombic Iron Tungsten Oxide Decorated with Carbon Nanofiber Composites Electrode. J. Electrochem. Soc. 2023, 170, 037514. [Google Scholar] [CrossRef]
  20. Apetrei, C.; Casilli, S.; De Luca, M.; Valli, L.; Jiang, J.; Rodríguez-Méndez, M.L.; De Saja, J.A. Spectroelectrochemical characterisation of Langmuir–Schaefer films of heteroleptic phthalocyanine complexes. Potential applications. Colloids Surf. A Physicochem. Eng. Asp. 2006, 284–285, 574–582. [Google Scholar] [CrossRef]
  21. Bhimaraya, K.; Manjunatha, J.G.; Moulya, K.P.; Tighezza, A.M.; Albaqami, M.D.; Sillanpää, M. Detection of Levofloxacin Using a Simple and Green Electrochemically Polymerized Glycine Layered Carbon Paste Electrode. Chemosensors 2023, 11, 191. [Google Scholar] [CrossRef]
  22. Lourenço, A.S.; Sanches, F.A.C.; Magalhães, R.R.; Costa, D.J.E.; Ribeiro, W.F.; Bichinho, K.M.; Salazar-Banda, G.R.; Araújo, M.C.U. Electrochemical oxidation and electroanalytical determination of xylitol at a boron-doped diamond electrode. Talanta 2014, 119, 509–516. [Google Scholar] [CrossRef] [PubMed]
  23. Mocak, J.; Bond, A.M.; Mitchell, S.; Scollary, G. A statistical overview of standard (IUPAC and ACS) and new procedures for determining the limits of detection and quantification: Application to voltammetric and stripping techniques (Technical Report). Pure Appl. Chem. 1997, 69, 297–328. [Google Scholar] [CrossRef]
Figure 1. (A) X-ray powder diffraction pattern of Co3O4, the pattern of Co3O4 (JCPDS#42-1467) was given as a reference; (B) TEM micrograph of Co3O4 nanoparticles; the scale bar is 200 nm; (C) SEM micrograph of Co3O4 nanoparticles and (D) EDS elemental mapping of cobalt oxide nanoparticles.
Electrochem 05 00003 g001
Figure 2. (A) EIS (Nyquist plot) of bare CPE and Co3O4-modified CPE. (B) CV studies of the bare CPE and Co3O4-modified CPE with 0.1 M KCl/5.0 mM [Fe(CN)6]3−/4−. (C) CV profiles at different scan rates of 2–150 mVs−1. (D) The linear graph for scan rate vs. peak current (Ip).
Electrochem 05 00003 g002
Figure 3. CV voltammograms of 50 μM LEV in BRBS at pH 5 for (A) bare and modified CP electrode. (B) Modified CP electrodes with different amounts of Co3O4 (2, 5, 7, and 15%).
Electrochem 05 00003 g003
Figure 4. CV voltammograms of 50 μM LEV in BRBS (A) for different pH values (2–10) of supporting electrolyte. (B) The correlation between the peak current value and the pH of the supporting electrolyte.
Electrochem 05 00003 g004
Scheme 1. Probable electrochemical redox reaction of LEV on the Co3O4/CPE surface.
Electrochem 05 00003 sch001
Figure 5. (A) CV measurements of a 50 μM solution of LEV in BRBS at pH 5 at different scan rates. (B) Correlation between peak current and square root of scan rate.
Electrochem 05 00003 g005
Figure 6. (A) Signals of 50 μM LEV solution in BRBS at pH 5 obtained by SWV and DPV; (B) current intensities for SWV and DPV signals for 50 μM LEV solution.
Electrochem 05 00003 g006
Figure 7. (A) The voltammetric response over the Co3O4-modified electrode toward various concentrations of LEV. (B) Calibration curve of LEV for the concentration range from 1 to 85 μM.
Electrochem 05 00003 g007
Figure 8. (AG) The electrochemical response of 5% Co3O4-modified electrode in solution containing 50 μM of LEV in the presence of different interfering organic compounds: (A) Uric acid—UA; (B) Ascorbic acid—AA; (C) Oxalic acid—OA; (D) Glucose—Glu; (E) Doxycycline; (F) Amoxicilin; (G) Azithromycin.
Electrochem 05 00003 g008
Table 1. Recovery studies for real sample analysis.
Added (µM)Found (µM)RSD (%)Recovery (%)
Real water sample13.5613.934.2103
21.6720.453.294
37.9640.131.5106
Disclaimer/Publisher’s Note: The statements, opinions and data contained in all publications are solely those of the individual author(s) and contributor(s) and not of MDPI and/or the editor(s). MDPI and/or the editor(s) disclaim responsibility for any injury to people or property resulting from any ideas, methods, instructions or products referred to in the content.

