
Beyond Geospatial Inquiry—How Can We Integrate the Latest Technological Advances into Geography Education?

Department of Social Studies Education, Ewha Womans University, Seoul 03760, Republic of Korea
Educ. Sci. 2023, 13(11), 1128; https://doi.org/10.3390/educsci13111128
Submission received: 14 September 2023
/
Revised: 8 November 2023
/
Accepted: 9 November 2023
/
Published: 13 November 2023
(This article belongs to the Special Issue The Use of Technology for Geography Teaching and Learning)
Abstract
:In geography education, geospatial technologies have been actively researched and widely used in combination with classroom inquiry and fieldwork. Recently, emerging data sources and technologies, such as open data, big data, and Artificial Intelligence (AI), are now gaining attention for their educational potential. In this study, both existing and emerging data and technologies are combined and grouped into four categories: (1) Geospatial Web service, (2) open data and big data, (3) fieldwork using Geographic Information Systems (GIS), (4) AI and coding. And based on these, geospatial inquiry activities for learning high school Korean Geography were developed. Learning to use these data sources and technologies is expected to equip students with essential 21st century skills.
1. Introduction
Traditional school education has been criticized for not adequately reflecting the changes in society. The ongoing digital transformation, which affects both social and economic realms, exemplifies this trend. The teaching of geography, when delivered in an outdated manner or devoid of real-world relevance, faces criticism for not sufficiently equipping upcoming generations with the necessary skills and competencies, as noted by Lee [1].
In geography education, geospatial technologies have been actively researched and are widely used in combination with inquiry in the classroom and fieldwork. The term “Geospatial Technology” (GST) encompasses a variety of modern tools that contribute to the mapping and analysis of Earth and human societies [2]. Geospatial Web services based on web-mapping technology and fieldwork using Geographic Information Systems (GIS) are typical examples [3,4,5,6]. Geospatial technologies are often used in combination with the inquiry approach, and the term “geospatial inquiry” has been used to indicate inquiry involving the analysis of geospatial data. More specifically, it can be defined as the process of addressing questions through the examination and communication of data linked to specific geographic locations on, above, or near Earth [7].
In recent times, there has been a surge in new types of data and technologies, such as open data, big data, Artificial Intelligence (AI), and coding, which has resulted in a significant expansion of the available data and technological resources applicable to educational settings [1,3]. Geographers are actively adopting these emerging technologies, and new research fields have evolved, such as Geospatial AI (GeoAI), spatial data mining, and geospatial data science [8]. It is worth noting that while these advancements have not yet been fully integrated into geography curricula or classroom teaching practices, the field of geography education has a longstanding tradition of utilizing geospatial technologies [9]. Consequently, there exists a distinct advantage in effectively employing these newfound technological tools.
In response to the digital transformation driving societal shifts, Korea’s Ministry of Education [10] took proactive measures in revising the national curriculum in 2022 to underscore students’ proficiency in digital skills. As part of this process, the high school subject Korean Geography was redefined as a career development track to support students in shaping their future professional paths. This study assumed that the use of GST, which has been widely employed in geography education, and the incorporation of emerging data and technological competencies both align with the characteristics of career-oriented education, as stipulated by the Korean Ministry of Education [11].
The goal of this study is to design geography student activities that reflect recent changes in data sources and technologies, such as open data, big data, and AI. To this end, new data and technologies have been identified in the context of geography education, and inquiry activities, called “geospatial inquiry activities”. This effort can be viewed as a meaningful step towards embracing the digitization of geography education, as it seeks to adapt and respond to the evolving landscape of data and technology.
2. Current and New Types of Data and Technology in Geography Education
2.1. Geospatial Web Service
With the advent of GIS in the 1990s, many geography education researchers came to believe that GIS would revolutionize the way geography was taught in schools [12,13]. Although this prediction seemed premature in the early 2000s, it is now becoming a reality, and it is primarily driven by advancements in technology called “Geospatial Web service”. It is defined as “… a mix of Internet-embedded geospatial technologies that support the blending of formal spatial databases and informal user-generated data and provides a number of robust tools and techniques particularly suited for use in local education and community outreach” [4] (p. 63). This technology allows users to search, visualize, and analyze spatial data as effortlessly as they use a web browser. Its user-friendly nature and its ability to deliver expert-level results make it a promising tool for educational applications [3,14,15]. Google Maps and Google Earth are prime examples of such services.
Harris et al. [4] outlined four key reasons for the significance of the Geospatial Web in local geography education: Firstly, it enables the creation of personalized web maps without substantial time and effort, thereby allowing students and educators to engage in mapping even with basic setups and increased internet access. Secondly, students can seamlessly integrate their spatial data into web mapping platforms, thus transforming themselves into citizen sensors who contribute to a global geographic data framework by merging grassroots and expert GIS data. Thirdly, the Geospatial Web supports local studies by capitalizing on students’ experiential knowledge, which fosters a hands-on approach to geography and bridges practical and theoretical perspectives. Lastly, it caters to the collaborative learning preferences of the new generation by fostering a social networking-oriented educational environment.
The surge in online spatial data has also been facilitated by Geospatial Web services [16]. For example, in Korea, the statistical geographic information service [17], which is managed by Korea’s National Statistical Office, offers statistical maps on 180 topics that range from population demographics to environmental data. Users can utilize basic functions like zooming and measuring, and they can choose from various map visualization techniques. Additionally, the “My Village Commercial Area Analysis Service” [18] by the city of Seoul’s administration provides an exploration of the city’s commercial sectors. The Korea Research Institute for Human Settlements presents the “Living Infrastructure Deficiency Index” [19], which describes the availability of essential facilities (i.e., SOC). These Geospatial Web services also grant access to diverse aerial and satellite images and enhance the scope of geography lessons. Aerial and satellite images illustrate changes in land use over time. Moreover, they provide a view of areas for which only sparse data are available, like North Korea [1].
2.2. Fieldwork Using GIS
GIS is a tool that captures, stores, checks, integrates, manipulates, analyzes, and displays data related to positions on the Earth’s surface. When combined with fieldwork, GIS offers a powerful means to gather, manage, and interpret spatial data. The integration of GST with devices that are interconnected via Wi-Fi offers numerous advantages over traditional fieldwork methods [20]. The key benefits of this integration include:
In Korea, community mapping, a technology-driven outdoor survey activity that is suitable for secondary schools, is gaining attraction [28]. Community mapping involves the collaborative creation of a map focused on a specific topic or interest. While community mapping traditionally improved the scope and completeness of maps due to individuals uploading data from different regions, in a secondary school setting, classmates collaborate on topic selection, data collection, and outcome sharing. Some examples include the mapping of crime hotspots, areas littered with cigarette butts, locations where stray cats are frequently spotted, or even areas where nocturnal fireflies can be mapped.
2.3. Open Data
Open data are “digital data that is made available with the technical and legal characteristics necessary for it to be freely used, reused, and redistributed by anyone, anytime, anywhere” [29]. These data are typically provided by governments, organizations, and various agencies with the intention to enhance transparency and accessibility. Making data accessible to a broad audience, including citizens, researchers, businesses, and policymakers, paves the way for informed decision making and spurs innovation. These practices are instrumental in bolstering transparency, fostering evidence-driven governance, and fortifying democratic values [30]. Examples include real-time traffic updates, health services, and environmental data [31].
In Korea, several governmental bodies have embraced this initiative. The Korea Meteorological Administration, for instance, offers a plethora of weather-related data, including regional temperatures, precipitation rates, and heat wave occurrences, via its open meteorological data portal. Seoul City shares information on public bicycle usage, parking facilities, transportation card statistics, and water management. The Ministry of Agriculture, Food and Rural Affairs provides data on livestock, agricultural statistics, origin tracking, and farming trends. Furthermore, the Korean government has launched a comprehensive public data portal that aggregates data at various institutional levels. These datasets, which are presented by government agencies and public institutions, come in various formats like CSV, JSON, XML, and API. A notable example is the Government Open Data Portal [32], which houses more than 3000 diverse datasets.
However, a review of existing literature reveals a disparity in the utilization of open data, despite its potential educational and innovative benefits [33]. Although students of higher education are the primary users, there is a clear gap in its adoption within public schools. This underutilization stems from the limited awareness of the educational potential of open data and lack of easily accessible, educationally pertinent datasets available on open data platforms. Educators often remain uninformed about the available datasets and their potential integration into teaching methodologies [31].
2.4. Big Data
Big data refer to large-scale data generated in the digital environment that are massive and have a short generation cycle [34]. As society undergoes digital transformation, individuals inadvertently produce significant amounts of data with the use of a variety of devices and platforms. Activities such as social media interactions, e-commerce transactions, YouTube viewing, and data from Internet-of-Things (IoT) sensors like CCTVs and car navigation systems all contribute to this deluge of data. Entities like governments and companies employ big data to anticipate customer behaviors or manage crises. For example, Amazon amasses extensive user data about purchasing patterns, online durations, product reviews, and even estimations of income based on billing addresses. Given the locational correlation inherent in much of these data, Kerski [35] described our society as “geo-enabled”.
The integration of novel data forms, including big data, into educational settings is gaining attention [30,36,37]. Since a vast amount of data are available through the internet, students must be able to understand big data and their use to be active citizens and learners [38]. The Innovating Pedagogy 2017 Report included “big-data inquiry” as one of the innovative trends that have the potential to provoke major shifts in educational practice [39]. When data become overwhelmingly large in terms of volume and complexity, innovative techniques are needed to extract meaning from the data and transform them into valuable information. For big data processing, analysis, and visualization in geography, tools like Excel, programming languages like Python and R, and GIS software such as ArcGIS and QGIS are often used. Python and coding tend to be widely emphasized at the national level and in education, as they are considered to be important future competencies in the curriculum. However, they are difficult to learn; therefore, it is not easy to use them in subjects like geography other than information technology subjects [40].
2.5. AI and Coding
AI, particularly generative AI, is emerging as a pivotal tool in the era of digital transformation. ChatGPT, which is a prime example of generative AI, utilizes deep learning methods like neural networks to analyze extensive data and produce content that resembles its input [41]. Users can engage in dynamic, ongoing conversations with ChatGPT and can extract the desired information through these interactions.
Generative AI has been rapidly infiltrating schools and education. Generative AI is suitable for inquiry-based learning that covers the process of collecting, analyzing, and visualizing data during geography classes [42]. AI has the potential to enhance all facets of geography education [9], and it is especially adept at teaching structured knowledge domains like coding. Given the perceived complexity of coding relative to its societal significance, the assistance of AI could be a game changer [43]. For instance, using generative AI, one can extract article titles or images from search results, present a century’s worth of temperature data for a specific location, and even generate Python code that predicts future climate patterns. Additionally, AI tools like DALL-E can craft unique images based on input, which enables the design of symbols or emblems that encapsulate a region’s identity [42].
At the same time, there are aspects one should be careful about using AI for geography learning. Conducting research using AI still requires the skill to formulate questions and interpret the responses from ChatGPT. In problem solving with AI, the capability to pose pertinent questions is vital, and a foundational understanding is essential to accurately interpret the answers [44].
3. Pedagogical Connection
The data and technology covered in this study are not completely different from the spatial data and GST that have been mainly dealt with in geography education research [30]. Therefore, existing educational approaches can be helpful in integrating new data and technologies for geographic learning.
3.1. Geospatial Inquiry
When geography education is combined with GST, it typically adopts strategies that are rooted in constructivist approaches, including project-based learning, problem-based learning, inquiry-driven approaches, and context-specific scenarios [6,28,45,46,47]. Among these approaches, inquiry-based learning is the most prevalent, and the reasons for this preference are outlined below.
- The development of critical thinking: Geospatial data can be intricate and multifaceted. Inquiry-based learning encourages students to critically analyze, interpret, and draw conclusions from the data, which fosters a deeper understanding and the development of analytical skills [47].
- Real-world application: Geospatial technologies are often used to address tangible, real-world challenges. Inquiry-based learning emphasizes problem solving in authentic contexts and makes the learning experience more relevant and impactful [5].
Utilizing GST for inquiry is often referred to as “geospatial inquiry”. Geospatial inquiry typically involves asking geographic questions, collecting relevant spatial data, analyzing patterns and relationships, and drawing conclusions based on the spatial context. It involves using various technologies and tools, such as GIS, remote sensing, and spatial data analysis, to analyze and interpret spatial data to gain insight, solve problems, and make informed decisions. Web-based GIS, which facilitates mapping and analysis using a web browser, stands out as especially beneficial for geospatial inquiry [52,53]. A prime example of web-based GIS-driven inquiry is ESRI’s geo-inquiries [54], which operates in ArcGIS Online. Geo-inquiries cover diverse topics that include globalization, population dynamics, language distribution, migration patterns, and urban density. Each geo-inquiry offers standards alignment, a link to the web map, the five-stage inquiry process, activity extensions, and a feedback URL. Geospatial inquiry is used in fields like geography, environmental science, urban planning, and others to understand and address spatial issues and phenomena.
3.2. Inquiry Models
Some inquiry models have been developed for specific purposes. For example, National Geographic’s [55] geo-inquiry process comprises five steps that are carefully crafted to cultivate essential skills for thinking and reasoning geographically. These steps include formulating geo-inquiry questions, gathering geographic information, organizing, and analyzing the collected data, and using this valuable information to address geo-inquiry questions, which would ultimately lead to informed decision making and action. Krajcik et al. [56] highlight the intricacy of the inquiry process within project-based science classrooms. They propose that, in contrast to the linear nature of the stepwise scientific inquiry method, inquiry is a multifaceted process in which various factors interact in complex ways. The authors identify five key aspects of inquiry: (1) asking questions; (2) devising investigation and planning procedures; (3) constructing apparatuses and conducting investigations; (4) analyzing data and drawing conclusions; (5) collaborating and presenting findings.
In theory, inquiry can be visualized as a continuum that incorporates varying levels of student and teacher participation, along with different strategies of approach. Several frameworks have been proposed to distinguish the degrees to which teachers can facilitate the involvement of learners in constructing knowledge. For instance, “structured”—“guided”—“open” represents a progression away from teacher-controlled learning. A “structured” approach to inquiry-based learning involves teachers selecting questions, data, activities, and conclusions, while tightly controlling the knowledge outcomes. By comparison, a “guided” approach involves teachers guiding students in constructing geographical knowledge, but with limited intervention. Finally, an “open” approach allows students to decide which questions to investigate under the guidance of a teacher, who provides support and direction as the students identify suitable methods and procedures and draw their conclusions. Generally, when students are tasked with using unfamiliar technology for their research, it is advisable for teachers to structure the inquiry process and offer enhanced guidance and support [45,50].
3.3. Considerations for Incorporating New Types of Data and Technologies into Geospatial Inquiry
In this study, we aim to develop inquiry activities based on open data, big data, and AI technologies, which have recently been attracting attention, and on the Geospatial Web and GIS-based fieldwork that is currently being used in geography education. We call these “geospatial inquiry activities,” which are organized into five steps: (1) asking questions; (2) planning; (3) collecting data; (4) presenting and analyzing; (5) concluding and reflecting.
The following are considerations in developing geospatial inquiry activities. First, it is crucial to recognize the roles of new data and technologies in geospatial inquiry and their contributions to the inquiry practice. Each data and technology was considered to function as a cognitive tool in the students’ inquiry process. Cognitive tools refer to technologies that augment human cognitive abilities during processes like thinking, problem solving, and learning [57]. Specifically, it was designed to clearly reflect the characteristics of the data and technology being used, rather than the general characteristics of the five stages of inquiry learning (Table 1). To accomplish this, a thorough and educational comprehension of the functions and attributes of each data source and technology is essential. For example, open data, big data, and Geospatial Web services serve as data sources for inquiry, whereas AI excels in guiding and facilitating the inquiry process. Open data are typically available in their raw form and are primarily utilized in the data collection or analysis stage. In contrast, the Geospatial Web service presents data in diverse formats, including statistics, charts, and interactive maps, offering the flexibility to be employed across various stages of inquiry. Moreover, when students engage in fieldwork using GIS, it delivers a more authentic and comprehensive experience that other types of data cannot provide.
Second, facilitating access to data is crucial. Although research has confirmed that the incorporation of new technology, such as open data and big data, can bring about substantial change in classrooms, teachers are unfamiliar with the spectrum of data that are accessible on the Internet and their applicability within the teaching context [31]. They simply lack information about openly available datasets and their potential use in geography education. Coughlan (2019), who investigated the use of open data in education, mentioned the following and emphasized the accessibility of appropriate data: “All interviewees noted that finding good data for a purpose could be a substantial undertaking for educators or learners” [30] (p. 399). In a similar vein, another study examined obstacles to using open data in secondary school classrooms and found that both students and teachers faced challenges due to limited literacy and resources [58].
Third, Korean students generally have a low level of understanding of inquiry and lack experience in inquiry-based learning using data or technology. For instance, they face difficulties in formulating appropriate inquiry questions. In addition, when there is a need to gather data or information to answer questions, they rely heavily on search engines like Google or Naver. Essentially, the lack of experience with inquiry within their schooling leads to a deficiency in useful inquiry skills and strategies. Therefore, the primary focus should be on students gaining standardized and correct procedures through participating in structured inquiry, rather than offering them the chance to independently conduct inquiry.
4. Design Principles and Examples of Geospatial Inquiry Activities
4.1. Design Principles of Geospatial Inquiry Activities
In response to the national curriculum for Korean Geography: Inquiry Approach, a set of student activities centered around geospatial data and technologies was created. The guiding principle behind the development of these activities is outlined as follows:
- Curriculum link: Inquiry questions are derived from the attainment objectives outlined in the high school Korean Geography curriculum.
- Purposeful approach: Geospatial inquiry serves the purpose of addressing questions, solving problems, or explaining phenomena.
- Utilization of geospatial data and technologies: Geospatial data and technologies serve as cognitive tools to assist students in collecting, visualizing, and analyzing data.
- Structured inquiry: Students are given the questions and the method of achieving the results, but the goal is to provide students with an opportunity to contemplate solutions to these questions, gather and evaluate data, and arrive at their own conclusions.
- Delivery mechanism: The necessary information and data needed for inquiry activities are accessed via the Internet. Nevertheless, rather than presenting data in downloadable formats, they are offered as hyperlinks. This method fosters students’ involvement in limited searching and decision-making processes, rather than mere file downloading.
- Inspiration for career development: Engaging in geospatial inquiry and observing its professional applications can inspire individuals to pursue careers in related fields.
- Iterative development and modification: The process of refining and applying activities to address issues that arise during classroom implementation is reiterated to minimize challenges.
4.2. Examples of Geospatial Inquiry Activities
To provide a tangible understanding of the design principles, this article presents four practical instances of geospatial inquiry activities. These examples are associated with Geospatial Web services, big data and open data, fieldwork using GIS, and AI with coding, respectively (Table 2, Table 3, Table 4 and Table 5) (Figure 1, Figure 2, Figure 3 and Figure 4).
5. Discussion
5.1. Comparison with Other Geospatial Inquiry Projects
In order to accurately understand the inquiry activities developed through this study, it is a good way to compare them with existing representative inquiry activities of similar nature. ESRI’s geo-inquiry is the project that is most similar to this geospatial inquiry activity. These two projects share numerous similarities: Predetermined inquiry questions, a structured five-step process that begins with questioning, detailed explanations of necessary spatial data and technologies, as well as strategies for sourcing them. However, although ArcGIS Online serves as a platform for data organization, visualization, and analysis in geo-inquiry projects, geospatial inquiry activities use a wider range of data and technologies, which include open and big data, fieldwork using GIS, and AI and coding integration. In contrast to the United States, the use of ESRI’s programs requires a fee in Korea, which is another difference and a major limitation to use and spread (Table 6).
5.2. Development of Geospatial Inquiry Activities and Digitalization of Geography Curriculum
As social studies and economics transition into digital domains, there is a growing imperative for the education sector to undergo digitalization, as well. The COVID-19 pandemic has accelerated the need for digital transformation in education. Kim [59] argued the teaching–learning space (environment), curriculum (contents), and teaching–learning method (instructors) as key targets for conversion. Specifically, teaching and learning spaces should fully support teaching and learning activities that use digital devices and materials for students and instructors. The curriculum must be presented in a form combined with AI and digital content, and instructors must be able to teach by integrating the curriculum with EdTech.
Then, to what degree has the geography curriculum undergone digital transformation? Evaluations of the digitalization of curriculums are contradictory. Compared with other subjects, the subject of geography is advantageous to the digital transformation of a curriculum [9]. Using Google Earth to survey different parts of the world or using street views to examine changes in a region is now a common practice in classroom instruction. VR is replacing the experience of geographical fieldwork, and community mapping activities that are related to local problem solving can be carried out using smartphones with built-in GIS functions [6,20,60]. At the same time, we note that the digitization of the geography curriculum is progressing slowly. Peter and Sprenger [61] stated “Digitalization remains at a very general, not subject-specific level, with the exception of GIS and remote sensing, future modifications should sharpen the breadth of the entire subject-specific potential” (p. 14).
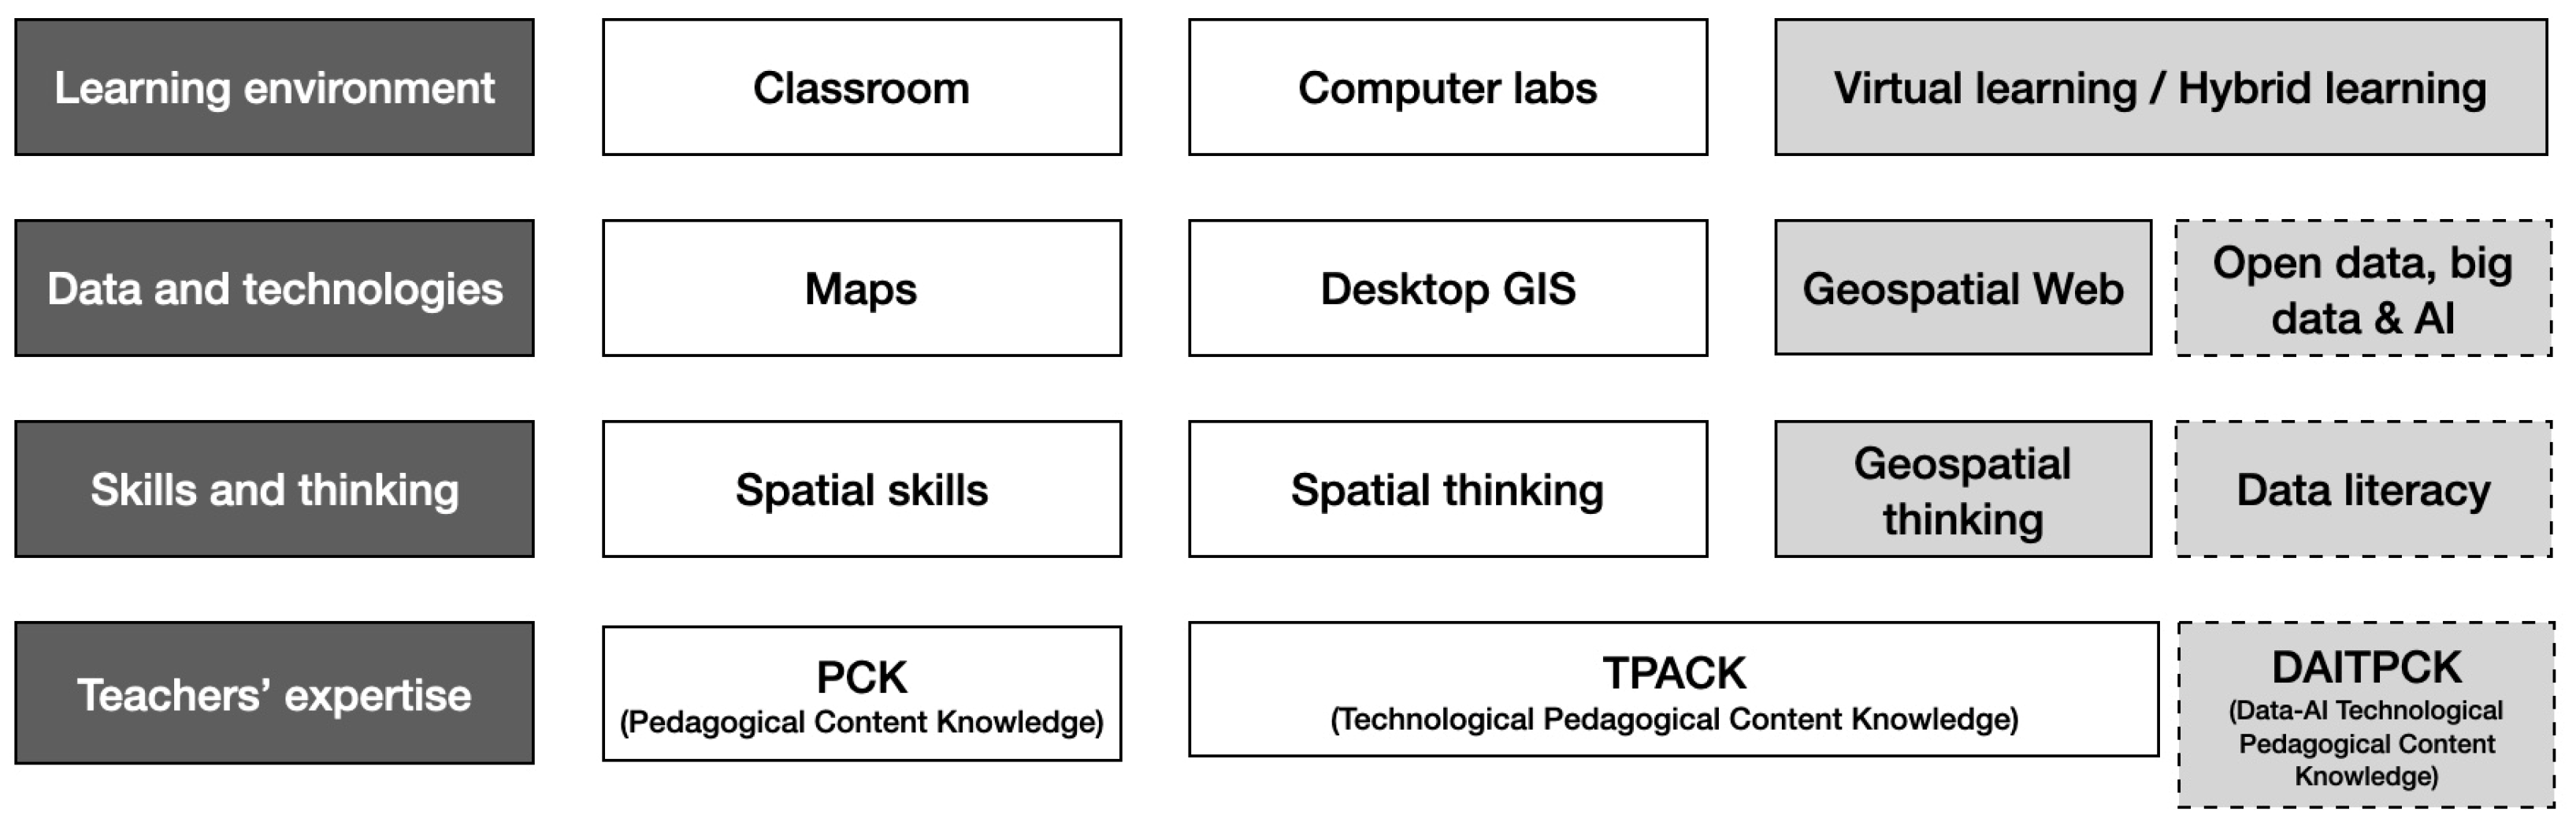
This study seeks to present Peter and Sprenger’s [61] argument one step further. To this end, it is necessary to re-establish Kim’s [59] three categories presented above in the context of geography education: the learning environment, the technology and data utilized in geography classes, the skills and thinking that demanded their effective use, and the pedagogical expertise required for class planning and execution. Figure 5 illustrates the evolution of each of these elements over time.
For example, in traditional geography classes, maps were an important teaching and learning tool as well as material, and students were required to have spatial skills to use them. About 2000 paper maps were replaced by GIS, and to support this, classrooms were equipped with computers, and geography teachers were required to have the ability to plan and teach classes using GIS along with various multimedia. PCK stands for Pedagogical Content Knowledge, meaning the integration of pedagogical and content knowledge necessary for teachers to effectively teach content to students. Later, TPACK (Technological Pedagogical Content Knowledge) was a concept that was proposed by integrating technology use knowledge into PCK as the importance of technology use in classroom instruction was highlighted [62].
As GIS, which demanded specialized skills, became accessible on portable devices, such as smartphones and tablets, and various data became accessible via Wi-Fi, its use in school geography classes swiftly gave way to the Geospatial Web. Consequently, not only did the variety and volume of utilized data expand, but costs decreased, and utilization became more straightforward. Additionally, due to the impact of COVID-19, online education and hybrid learning environments have eclipsed traditional learning spaces, coinciding with the rise of seamless learning—encompassing learning at one’s preferred time and place using personal devices.
More recently, novel data sources and technologies like open data, big data, and Artificial Intelligence (AI) have surfaced, reshaping the content and methodologies of learning, and even the nature of learning itself. In prior geography classes, specific data or methods were typically recommended for problem solving, but now it is imperative to transcend these established methods and explore alternative approaches facilitated by newly available data sources and technologies. Furthermore, educators must possess the capability to design the learning process and craft tasks while distinguishing their own role from that of AI. Given that the evolving demands on educators extend beyond mere technical aptitude, there is a need for DAITPACK: Data-AI Technological Pedagogical Content Knowledge, which incorporates the educational utilization of open data, big data, and AI.
6. Conclusions
This study aims to explore the potential of integrating emerging data and technology for the development of geographical inquiry activity. Although Geospatial Web services and GIS-based fieldwork have been widely studied and adopted in educational settings, the recent advances in open data, big data, and AI technologies have yet to be adequately examined for their educational use and contributions. In pursuit of this, an inquiry-based learning approach is suggested as an instructional method to integrate these technological advancements into geography lessons. The study categorizes geospatial inquiry activities into four main groups based on these data sources and technologies: Geospatial Web services, fieldwork using GIS, open and big data, and AI combined with coding. This study shows examples of inquiry activities from these four categories that are aligned with the high school Korean Geography curriculum. This study has significance as it is the first study to present a framework that integrates emerging data and technology in current school geography.
Next, what changes will the activities suggested in this study bring to the geography classroom? Do you believe that as the data and technology available outside the classroom change, so must the teaching and learning in the classroom? If the answer to this question is Yes, it will not be difficult to think of an answer to the preceding question. Schooling has always been criticized for failing to reflect the rapid changes in society. Although integrating new data types and technology may not inherently broaden the scope of content or subjects addressed in geography classes, they can significantly enhance how these topics are learned. This enhancement will in turn result in a more nuanced understanding that is closer to real-world scenarios, thereby equipping students with the essential proficiencies required for navigating the complexities of the 21st century.
This study introduces the potential of using modern technologies like AI, big data, and open data in geography education. It provides a solid argument and some initial examples. However, the actual application of these technologies in the classroom has not been accomplished yet. We have a vision for what technology-enhanced lessons could look like, but the development and classroom testing of these lesson plans are still pending. The gap between the innovative ideas presented in this research and their classroom application is a current limitation of our study. Education often trails behind technological innovation, and implementing new tech-based teaching methods takes time—time to design the lessons, train teachers, and update educational policies to accommodate these changes.
Several additional studies related to the results of this study have been requested. First, research to verify the application and educational effects of classroom instruction using new data and technology should be undertaken. Next, as mentioned in the Section 5, a theoretical framework is needed to explain the achievements of this study at a conceptual level. As one such conceptual framework, this study suggested the digitization of education, the digitization of the learning space, the digitization of the instructors, and the digitization of the curriculum. The results of this study will be evaluated relative to the digitization of the curriculum, and it may be possible to present new skills that instructors should have.
Funding
This research was funded by the Ministry of Education of the Republic of Korea and the National Research Foundation of Korea, grant number NRF-2022S1A5A2A01046029.
Institutional Review Board Statement
Not applicable.
Informed Consent Statement
Not applicable.
Data Availability Statement
No new data were created or analyzed in this study. Data sharing is not applicable to this article.
Conflicts of Interest
The author declares no conflict of interest.
References
- Lee, J. Development of Curriculum to Respond to the Era of Digital Transformation—A Case Study of Korean Geography. J. Assoc. Korean Geogr. Environ. Educ. 2023, 31, 93–106. [Google Scholar] [CrossRef]
- AAAS. What Are Geospatial Technologies? Available online: https://www.aaas.org/programs/scientific-responsibility-human-rights-law/overview-geospatial-project (accessed on 31 August 2023).
- Fargher, M. WebGIS for Geography Education: Towards a GeoCapabilities Approach. ISPRS Int. J. Geo-Inf. 2018, 7, 111. [Google Scholar] [CrossRef]
- Harris, T.; Rouse, L.J.; Bergeron, S.J. The Geospatial Web and Local Geographical Education. Int. Res. Geogr. Environ. Educ. 2010, 19, 63–66. [Google Scholar] [CrossRef]
- Lee, H.; Kim, M. The Pedagogical Effects of Student-Centered Convergence Project Class Using Geospatial Services. J. Assoc. Korean Geogr. Environ. Educ. 2021, 29, 53–69. [Google Scholar] [CrossRef]
- Schlemper, M.B.; Athreya, B.; Czajkowski, K.; Stewart, V.C.; Shetty, S. Teaching Spatial Thinking and Geospatial Technologies Through Citizen Mapping and Problem-Based Inquiry in Grades 7–12. J. Geogr. 2019, 118, 21–34. [Google Scholar] [CrossRef]
- Nolan, E.; Whitworth, B.A.; Rubino-Hare, L. A Lesson in Geospatial Inquiry. Sci. Teach. 2019, 87, 26–33. Available online: https://core.ac.uk/download/pdf/354494343.pdf (accessed on 31 August 2023). [CrossRef]
- VoPham, T.; Hart, J.E.; Laden, F.; Chiang, Y.-Y. Emerging Trends in Geospatial Artificial Intelligence (geoAI): Potential Applications for Environmental Epidemiology. Environ. Health 2018, 17, 40. [Google Scholar] [CrossRef]
- Kim, M. The Educational Use of Artificial Intelligence and the Task of Geography Education in the Era of the Fourth Industrial Revolution. J. Assoc. Korean Geogr. 2021, 10, 329–345. [Google Scholar] [CrossRef]
- Ministry of Education. Future Curriculum Promotion Plan with the People; Ministry of Education: Seoul, Republic of Korea, 2021.
- Lee, J.; Sung, J. The Development and Content of Korean Geography—An Inquiry Approach. J. Assoc. Korean Geogr. Environ. Educ. 2023, 31, 15–25. [Google Scholar] [CrossRef]
- Bednarz, S.W. Geographic Information Systems: A Tool to Support Geography and Environmental Education? Geo J. 2004, 60, 191–199. [Google Scholar] [CrossRef]
- Kerski, J.J. The Implementation and Effectiveness of Geographic Information Systems Technology and Methods in Secondary Education. Ph.D. Thesis, University of Colorado Boulder, Boulder, CO, USA, 2000. Available online: https://www.proquest.com/openview/3728d8f9a47f8c40cfc521e1cf7e35b7/1?pq-origsite=gscholar&cbl=18750&diss=y (accessed on 31 August 2023).
- Milson, A.J.; Demirci, A.; Kerski, J.J. (Eds.) International Perspectives on Teaching and Learning with GIS in Secondary Schools; Springer: Berlin/Heidelberg, Germany, 2012. [Google Scholar] [CrossRef]
- West, H.; Horswell, M. GIS Has Changed! Exploring the Potential of ArcGIS Online. Teach. Geogr. 2018, 43, 22–24. [Google Scholar]
- Hofer, B. Uses of Online Geoprocessing Technology in Analyses and Case Studies: A Systematic Analysis of Literature. Int. J. Digit. Earth. 2015, 8, 901–917. [Google Scholar] [CrossRef]
- Korea’s National Statistical Office. Available online: https://sgis.kostat.go.kr (accessed on 31 August 2023).
- City of Seoul’s Administration. My Village Commercial Area Analysis Service. Available online: https://golmok.seoul.go.kr/main.do (accessed on 31 August 2023).
- The Korea Research Institute for Human Settlements, Living Infrastructure Deficiency Index. Available online: https://interactive.krihs.re.kr/interactive/multipleDeprivationIndex (accessed on 31 August 2023).
- Lee, J. Designing an Inquiry-Based Fieldwork Project for Students Using Mobile Technology, and Its Effects on Students’ Experience. Rev. Int. Geogr. Educ. Online. 2020, 10, 14–39. [Google Scholar] [CrossRef]
- Jarvis, C.; Tate, N.; Dickie, J.; Brown, G. Mobile Learning in A Human Geography Field Course. J. Geogr. 2016, 115, 61–71. [Google Scholar] [CrossRef]
- Jong, M.S.; Tsai, C. Understanding the Concerns of Teachers About Leveraging Mobile Technology to Facilitate Outdoor Social Inquiry Learning: The EduVenture Experience. Interact. Learn. Environ. 2016, 24, 328–344. [Google Scholar] [CrossRef]
- Hedberg, J.G. Extending the Pedagogy of Mobility. Educ Media Int. 2014, 51, 237–253. [Google Scholar] [CrossRef]
- Chang, C.-H.; Chatterjeaa, K.; Gohb, D.H.-L.; Thengb, Y.L.; Limc, E.P.; Sund, A.; Razikinb, K.; Kimb, T.N.Q.; Nguyenb, Q.N. Lessons from Learner Experiences in A Field-Based Inquiry in Geography Using Mobile Devices. Int. Res. Geogr. and Environ. Educ. 2012, 21, 41–58. [Google Scholar] [CrossRef]
- Marra, W.A.; van de Grint, L.; Alberti, K.; Karssenberg, D. Using GIS in an Earth Science Field Course for Quantitative Exploration, Data Management, and Digital Mapping. J. Geogr. High. Educ. 2017, 41, 213–229. [Google Scholar] [CrossRef]
- Chatterjea, K. Use of Mobile Devices for Spatially—Cognizant and Collaborative Fieldwork in Geography. Rev. Int. Geogr. Educ. Online. 2012, 2, 303–325. [Google Scholar]
- Suárez, Á.; Specht, M.; Prinsen, F.; Kalz, M.; Ternier, S. A Review of the Types of Mobile Activities in Mobile Inquiry-Based Learning. Comput. Educ. 2018, 118, 38–55. [Google Scholar] [CrossRef]
- Kim, H.; Lee, J. The Use of Community Mapping in Elementary and Secondary Education. J. Korean Geogr. Soc. 2021, 56, 551–564. [Google Scholar] [CrossRef]
- Open Data Charter. Principles. Available online: https://opendatacharter.net/principles/ (accessed on 31 August 2023).
- Coughlan, T. The Use of Open Data as A Material for Learning. Educ. Technol. Res. Dev. 2020, 68, 383–411. [Google Scholar] [CrossRef]
- Saddiqa, M.; Magnussen, R.; Larsen, B.; Pedersen, J.M. Open Data Interface (ODI) for Secondary School Education. Compu. Educ. 2021, 174, 104294. [Google Scholar] [CrossRef]
- Government Open Data Portal. Available online: https://www.data.go.kr/en/index.do (accessed on 31 August 2023).
- Saddiqa, M.; Rasmussen, L.; Magnussen, R.; Larsen, B.; Pedersen, J.M. Bringing Open Data into Danish Schools and Its Potential Impact on School Pupils. In Proceedings of the 15th International Symposium on Open Collaboration, Skövde, Sweden, 20–22 August 2019; Association for Computing Machinery: New York, NY, USA, 2019; pp. 1–10. [Google Scholar] [CrossRef]
- Manyika, J.; Chui, M.; Brown, B.; Bughin, J.; Dobbs, R.; Roxburgh, C.; Byers, A.H. Big Data: The Next Frontier for Innovation, Competition, and Productivity; McKinsey Global Institute: New York, NY, USA, 2011; Available online: https://www.mckinsey.com/capabilities/mckinsey-digital/our-insights/big-data-the-next-frontier-for-innovation (accessed on 31 August 2023).
- Kerski, J.J. Geo-awareness, Geo-enablement, Geotechnologies, Citizen Science, and Storytelling: Geography on the World Stage. Geogr. Compass. 2015, 9, 14–26. [Google Scholar] [CrossRef]
- Hwang, H.-S. Exploring Teaching and Learning Model in Elementary Social Studies Using Big Data. Soc. Stu. Educ. 2019, 58, 63–98. [Google Scholar] [CrossRef]
- Hwang, H.-S. A Case Study on Application of Big Data-Based Social Studies Teaching and Learning Model. Soc. Stu. Educ. 2021, 60, 111–131. [Google Scholar] [CrossRef]
- Alayan, A. Innovating Pedagogy Report 2017. AACE REV. 2018. Available online: https://www.aace.org/review/innovating-pedagogy-report-2017/ (accessed on 31 August 2023).
- Ferguson, R.; Barzilai, S.; Ben-Zvi, D.; Chinn, C.A.; Herodotou, C.; Hod, Y.; Kali, Y.; Kukulska-Hulme, A.; Kupermintz, H.; McAndrews, P.; et al. Innovating Pedagogy 2017; The Open University: Milton Keynes, UK, 2017; Available online: https://www.learntechlib.org/p/182004/ (accessed on 31 August 2023).
- Song, Y.; Song, S.; Kim, Y.; Lim, C. Developmental Study of an Instructional Model and Strategies for Data-driven Debate (DDD) to Improve Data Literacy. J. Educ. Technol. 2021, 37, 943–982. [Google Scholar] [CrossRef]
- Yu, H.; Guo, Y. Generative Artificial Intelligence Empowers Educational Reform: Current Status, Issues, and Prospects. In Frontiers in Education; Frontiers: Lausanne, Switzerland, 2023; Available online: https://www.frontiersin.org/articles/10.3389/feduc.2023.1183162/full (accessed on 31 August 2023).
- Lee, J.; Kim, H. Geographical Inquiry Using Open and Big Data Based on Artificial Intelligence and Python. 30 Years of Geography Education, Retrospective and Outlook. In Proceedings of the Association of Korean Geographical and Environmental Education Summer Conference, Seoul National University, Seoul, Republic of Korea, 4–7 December 2023; pp. 80–83. [Google Scholar]
- Lee, D.-Y.; Chung, J.-I. The Effects of Middle School Mathematical Statistics Area and Python Programming STEAM Instruction on Problem Solving Ability and Curriculum Interest. J. Korea Acad. Ind. Coop. Soc. 2019, 20, 336–344. [Google Scholar]
- Chung, J.; Cho, H.; Hwang, J.; Moon, M.; Kim, I. ChatGPT Education Revolution: High-Touch, high-Tech Future Education Using ChatGPT; Porce: Seoul, Republic of Korea, 2023. [Google Scholar]
- Favier, T.T.; van der Schee, J.A. Exploring the Characteristics of an Optimal Design for Inquiry-Based Geography Education with Geographic Information Systems. Comput. Educ. 2012, 58, 666–677. [Google Scholar] [CrossRef]
- Solis, P.; Huynh, N.T.; Carpenter, D.; de Newbill, M.A.; Ojeda, L. Using an Authentic Project Based Learning Framework to Support Integrated Geography Education Linked to Standards and Geospatial Competencies. Res. Geogr. Educ. 2017, 19, 36–65. [Google Scholar]
- Wu, X.B.; Sandoval, C.; Knight, S.; Jaime, X.; Macik, M.; Schielack, J.F. Web-Based Authentic Inquiry Experiences in Large Introductory Classes Consistently Associated with Significant Learning Gains for All Students. Int. J. STEM. Educ. 2021, 8, 31. [Google Scholar] [CrossRef]
- Oost, K.; De Vries, B.; van der Schee, J. Enquiry-Driven Fieldwork as a Rich and Powerful Teaching Strategy—School Practices in Secondary Geography Education in The Netherlands. Int. Res. Geogr. Environ. Educ. 2021, 20, 309–325. [Google Scholar] [CrossRef]
- Whitworth, B.A.; Rubino-Hare, L.; Boateng, F.; Hamlin, A.; Bloom, N.E.; Nolan, E. Teacher Enactment of the Geospatial Inquiry Cycle in Classrooms Following Scaled Up Professional Learning and Development. Int. J. Sci. Educ. 2022, 44, 379–415. [Google Scholar] [CrossRef]
- Egiebor, E.E.; Foster, E.J. Students’ Perceptions of Their Engagement Using GIS-Story Maps. J. Geogr. 2019, 118, 51–65. [Google Scholar] [CrossRef]
- Van der Schee, J.; Trimp, H.; Beneker, T.; Faver, T. Digital Geography Education in the Twenty-first Century: Needs and Opportunity. In Geospatial Technologies and Geography Education in a Changing World; Springer: Berlin/Heidelberg, Germany, 2015; pp. 11–20. [Google Scholar] [CrossRef]
- Baker, T.R. WebGIS in Education. In Geospatial Technologies and Geography Education in a Changing World; Springer: Berlin/Heidelberg, Germany, 2015; pp. 105–116. [Google Scholar] [CrossRef]
- Bodzin, A.; Anastasio, D. Using Web-Based GIS for Earth and Environmental Systems Education. J. Geosci. Educ. 2006, 54, 295–300. [Google Scholar] [CrossRef]
- ESRI. GeoInquiries. Available online: https://www.esri.com/en-us/industries/k-12-education/geoinquiries (accessed on 31 August 2023).
- National Geographic. The Geo-Inquiry Process. Available online: https://www.nationalgeographic.org/education/programs/geo-inquiry/ (accessed on 31 August 2023).
- Krajcik, J.; Blumenfeld, P.; Marx, R.W.; Bass, K.M.; Fredericks, J.; Soloway, E. Inquiry in Project-Based Science Classrooms: Initial Attempts by Middle School Students. J. Learn. Sci. 1998, 7, 313–350. [Google Scholar] [CrossRef]
- Jonassen, D.H. Computers as Cognitive Tools: Learning with Technology, Not from Technology. J. Comput. High. Educ. 1995, 6, 40–73. [Google Scholar] [CrossRef]
- Tambouris, E.; Hermans, P.; Tarrant, D.; Zotou, M.; Tarabanis, K. Using Problem-Based Learning and Learning Analytics in Open Data Education. In Proceedings of the 19th Annual International Conference on Digital Government Research: Governance in the Digital Age, Delft, The Netherlands, 30 May–1 June 2018; pp. 1–2. [Google Scholar] [CrossRef]
- Kim, J. Exploring Educational Policy Paradigm in Preparation for the Digital Transformation Era. In Proceedings of the Korean Society for Early Childhood Education Conference, Seoul, Republic of Korea, 14–16 November 2022; pp. 41–51. [Google Scholar]
- Cliffe, A.D. A Review of the Benefits and Drawbacks to Virtual Field Guides in Today’s Geoscience Higher Education Environment. Int. J. Educ. Technol. High. Educ 2017, 14, 28. [Google Scholar] [CrossRef]
- Peter, C.; Sprenger, S. Digitalization and Geography Education—A Curriculum Analysis. Erdkunde 2022, 76, 3–20. [Google Scholar] [CrossRef]
- Mishra, P.; Koehler, M.J. Technological Pedagogical Content Knowledge: A Framework for Teacher Knowledge. Teach. Coll. Rec. 2006, 108, 1017–1054. [Google Scholar] [CrossRef]
Figure 1.
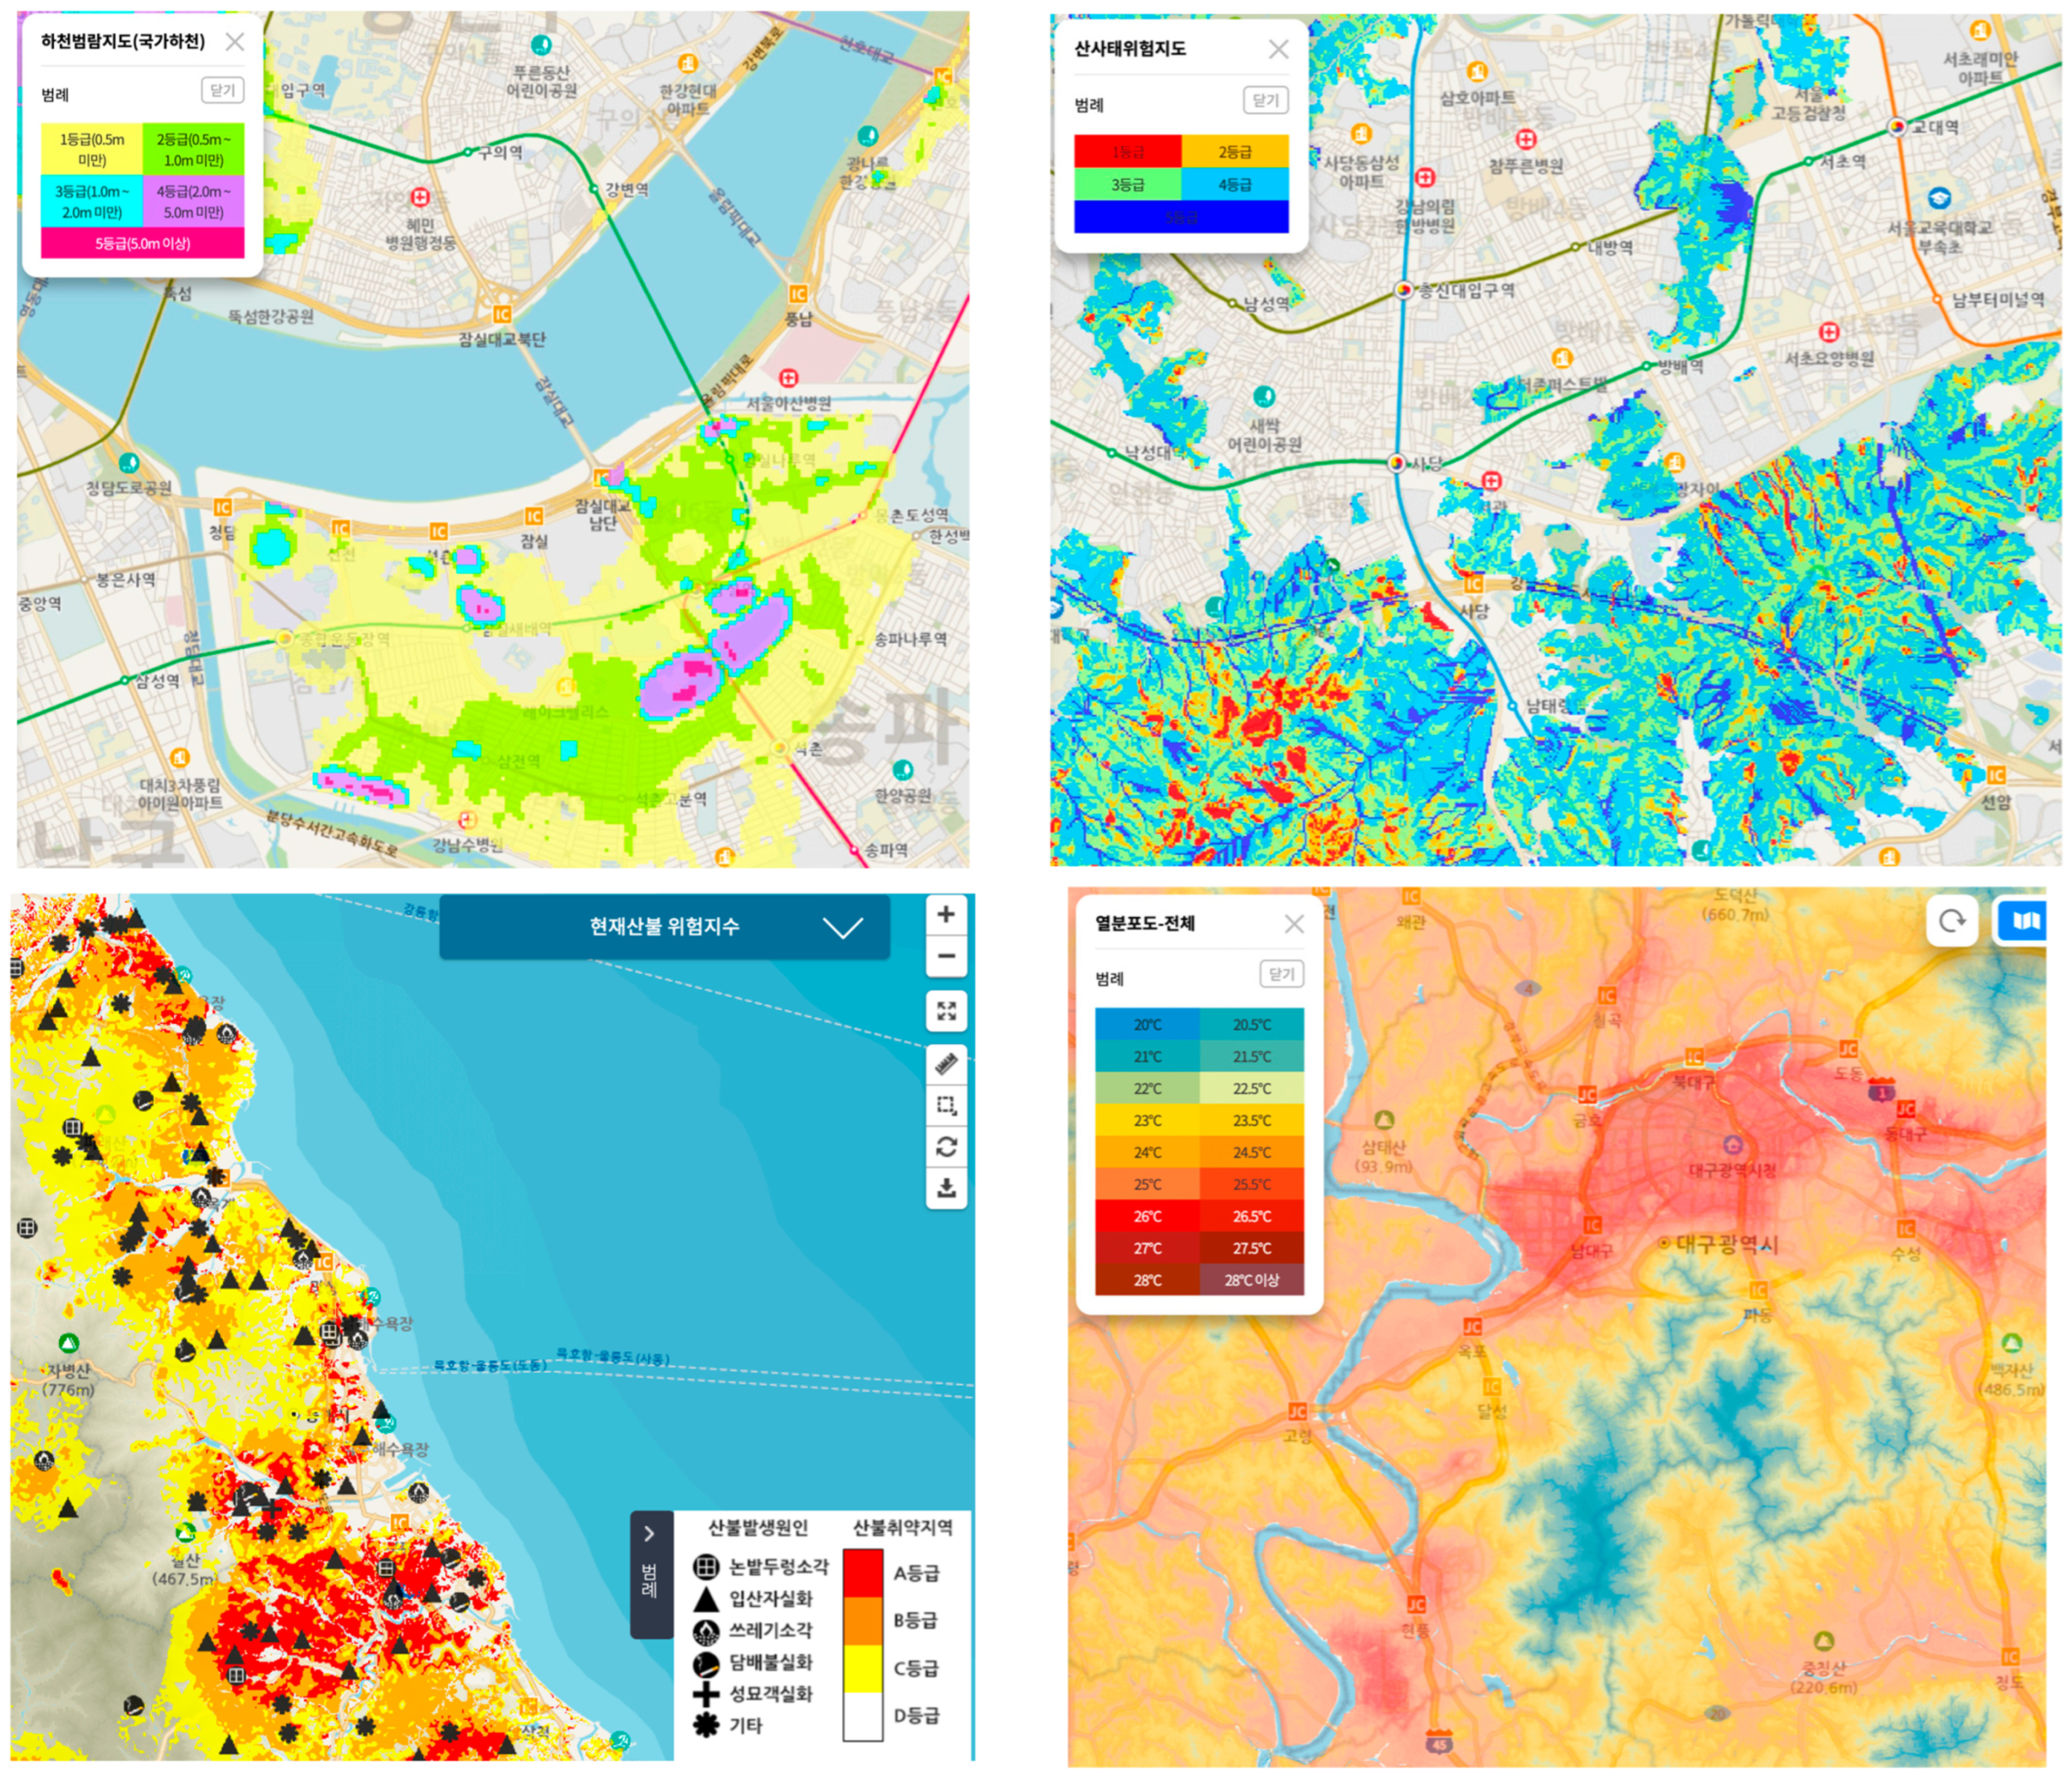
Examples of geospatial information from Geospatial Web used to investigate local natural disasters: Flood Risk Map (Top Left): This map depicts varying levels of potential flood risk, differentiated by a range of colors. The intensity of the color indicates the severity of the risk. Landslide Susceptibility Map (Top Right): This map shows the likelihood of landslides in different areas, with color coding to distinguish between zones of varying susceptibility. Forest Fire Risk Map (Bottom Left): This map identifies both recent forest fire locations and areas at high risk of forest fires, using color differentiation to mark the affected and high-risk zones. Heat Wave Risk Map (Bottom Right): This map presents regional differences in average summer temperatures, with a color-coded approach to highlight areas at potential risk of heat waves.
Figure 1.
Examples of geospatial information from Geospatial Web used to investigate local natural disasters: Flood Risk Map (Top Left): This map depicts varying levels of potential flood risk, differentiated by a range of colors. The intensity of the color indicates the severity of the risk. Landslide Susceptibility Map (Top Right): This map shows the likelihood of landslides in different areas, with color coding to distinguish between zones of varying susceptibility. Forest Fire Risk Map (Bottom Left): This map identifies both recent forest fire locations and areas at high risk of forest fires, using color differentiation to mark the affected and high-risk zones. Heat Wave Risk Map (Bottom Right): This map presents regional differences in average summer temperatures, with a color-coded approach to highlight areas at potential risk of heat waves.

Figure 2.
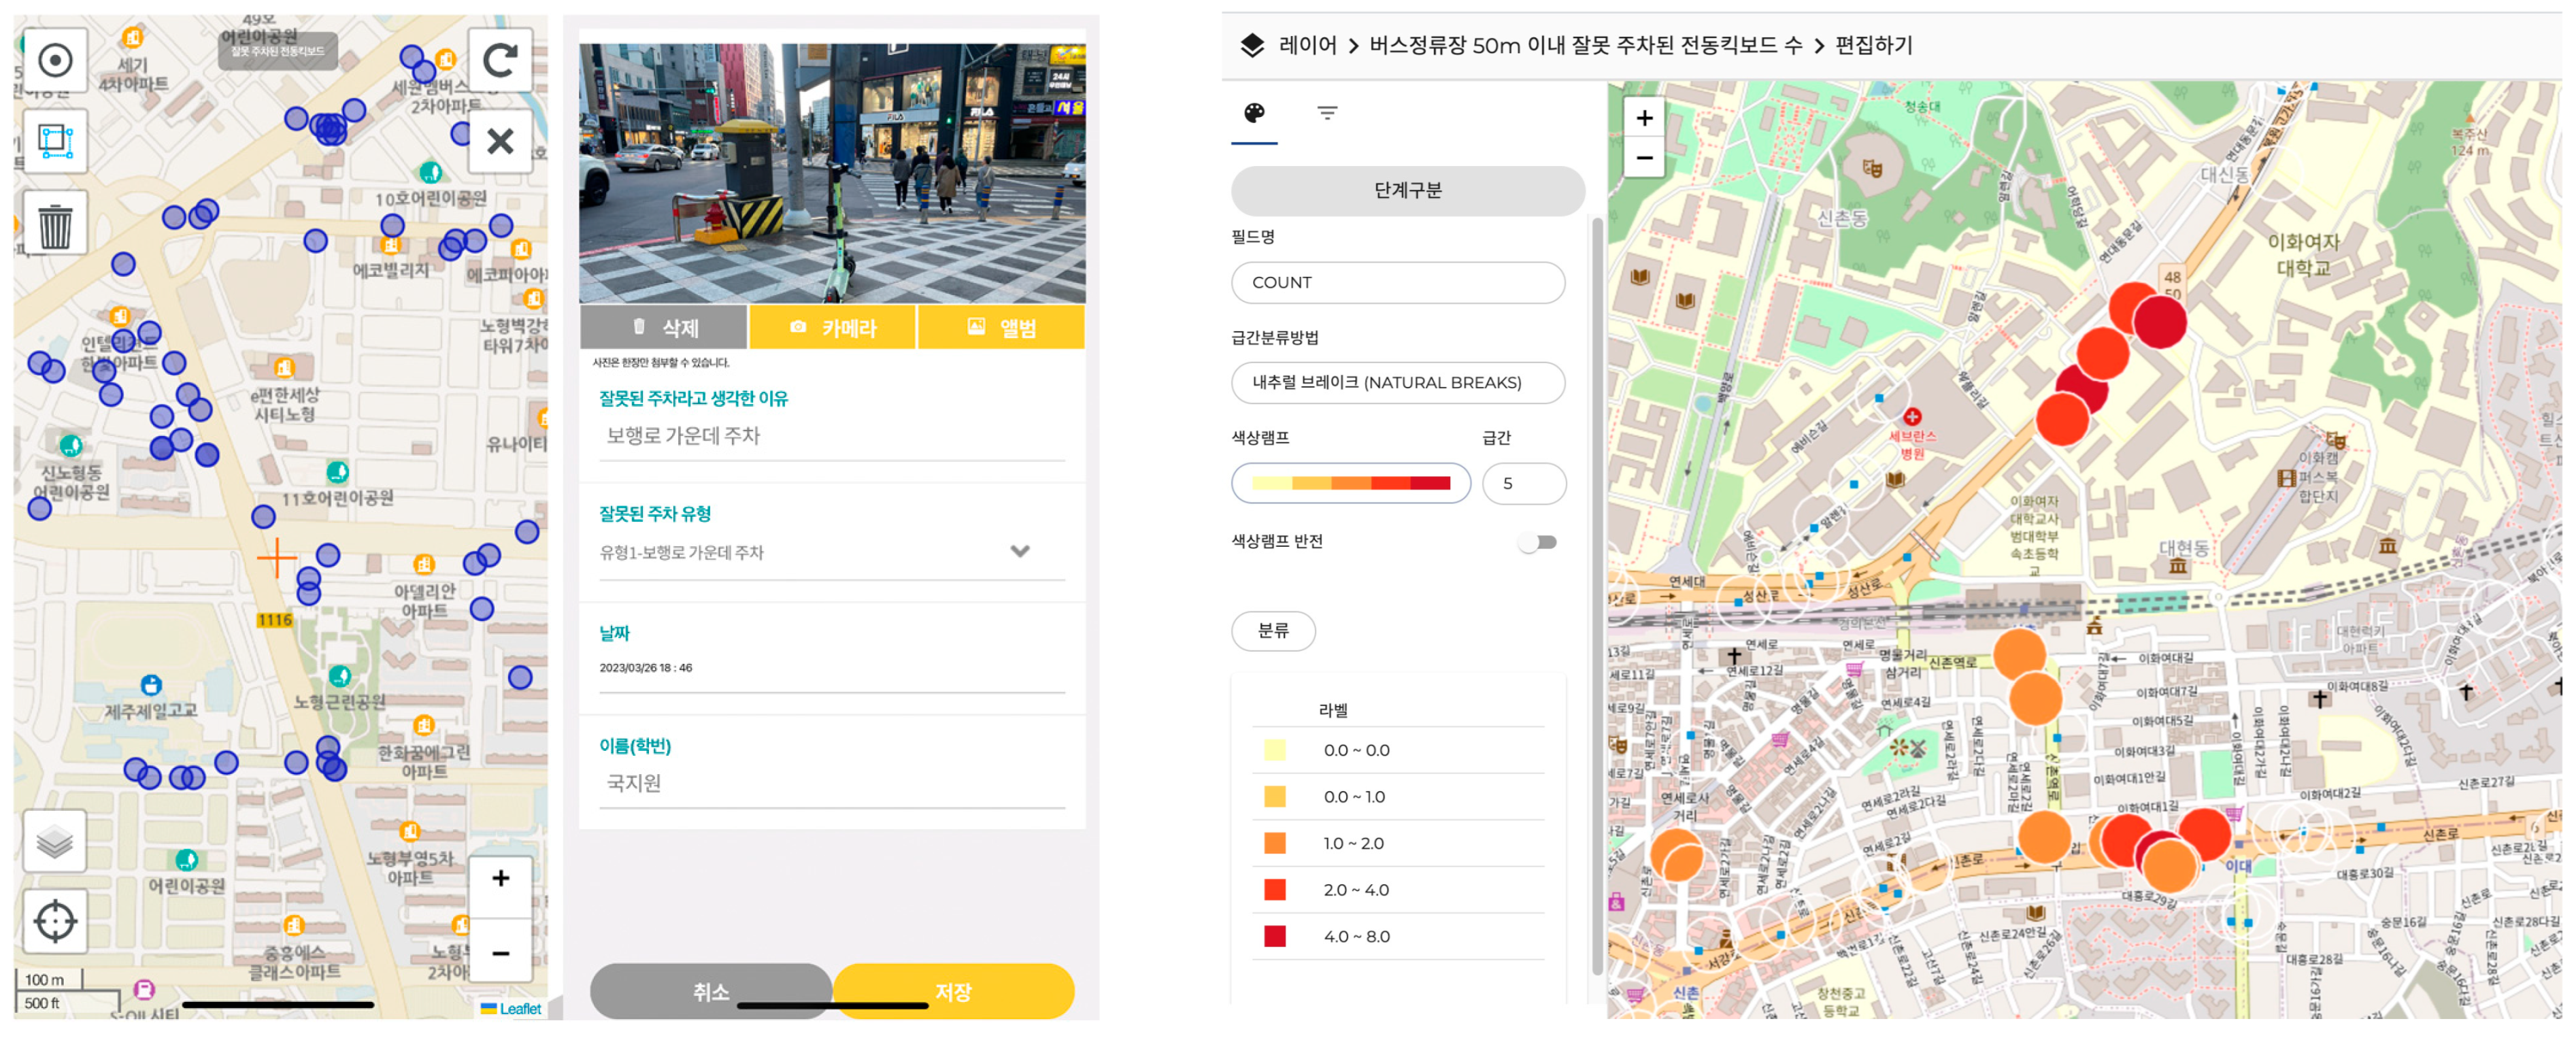
Locations of improperly parked electric kickboards were collected using a smartphone (left), and their spatial patterns were analyzed (right).
Figure 2.
Locations of improperly parked electric kickboards were collected using a smartphone (left), and their spatial patterns were analyzed (right).

Figure 3.
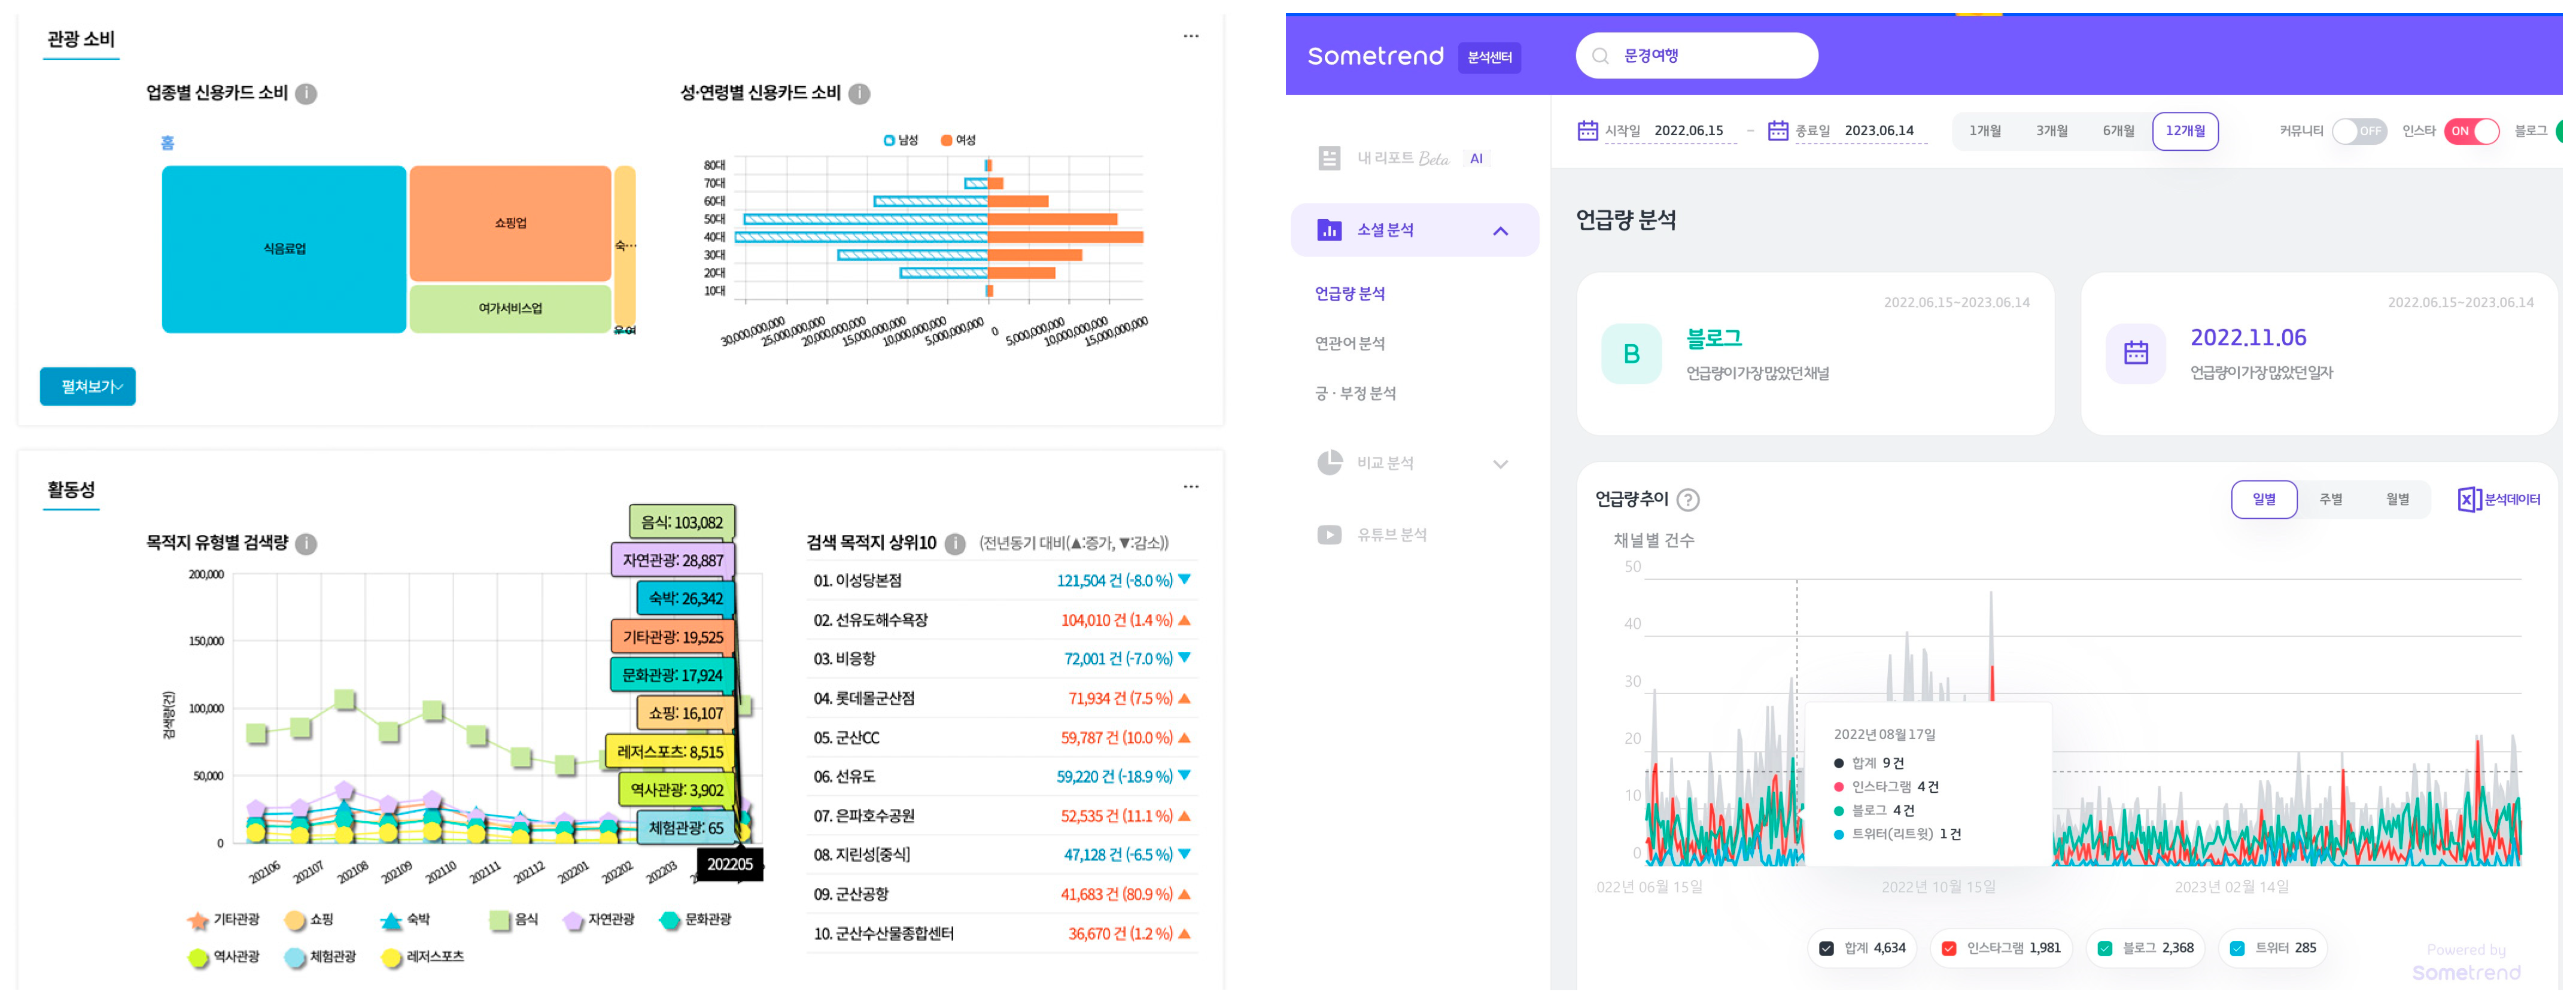
Visitor Credit Card Data Analysis (Top Left): This analysis of credit card usage by tourists highlights consumption trends in different sectors such as food and beverage, shopping, and leisure services. It offers in-sights into spending patterns by gender and age at tourist destinations, enabling users to tailor marketing strategies or services accordingly. Car Navigation Search Data Compilation (Bottom Left): By compiling data from car navigation destination searches made by visitors, this approach allows users to identify and understand the evolving preferences for tourist spots. This data can be instrumental in understanding trends and making informed decisions about destination development or promotional activities. Social Media Mentions Analysis (Right): Using a social big data platform, this tool enables the analysis of mentions on various social media platforms (blogs, Instagram, Twitter) about travel to Mungyeong, Gyeongbuk. It provides valuable insights into public perception and trends, useful for marketing, planning, and strategy development in tourism.
Figure 3.
Visitor Credit Card Data Analysis (Top Left): This analysis of credit card usage by tourists highlights consumption trends in different sectors such as food and beverage, shopping, and leisure services. It offers in-sights into spending patterns by gender and age at tourist destinations, enabling users to tailor marketing strategies or services accordingly. Car Navigation Search Data Compilation (Bottom Left): By compiling data from car navigation destination searches made by visitors, this approach allows users to identify and understand the evolving preferences for tourist spots. This data can be instrumental in understanding trends and making informed decisions about destination development or promotional activities. Social Media Mentions Analysis (Right): Using a social big data platform, this tool enables the analysis of mentions on various social media platforms (blogs, Instagram, Twitter) about travel to Mungyeong, Gyeongbuk. It provides valuable insights into public perception and trends, useful for marketing, planning, and strategy development in tourism.

Figure 4.
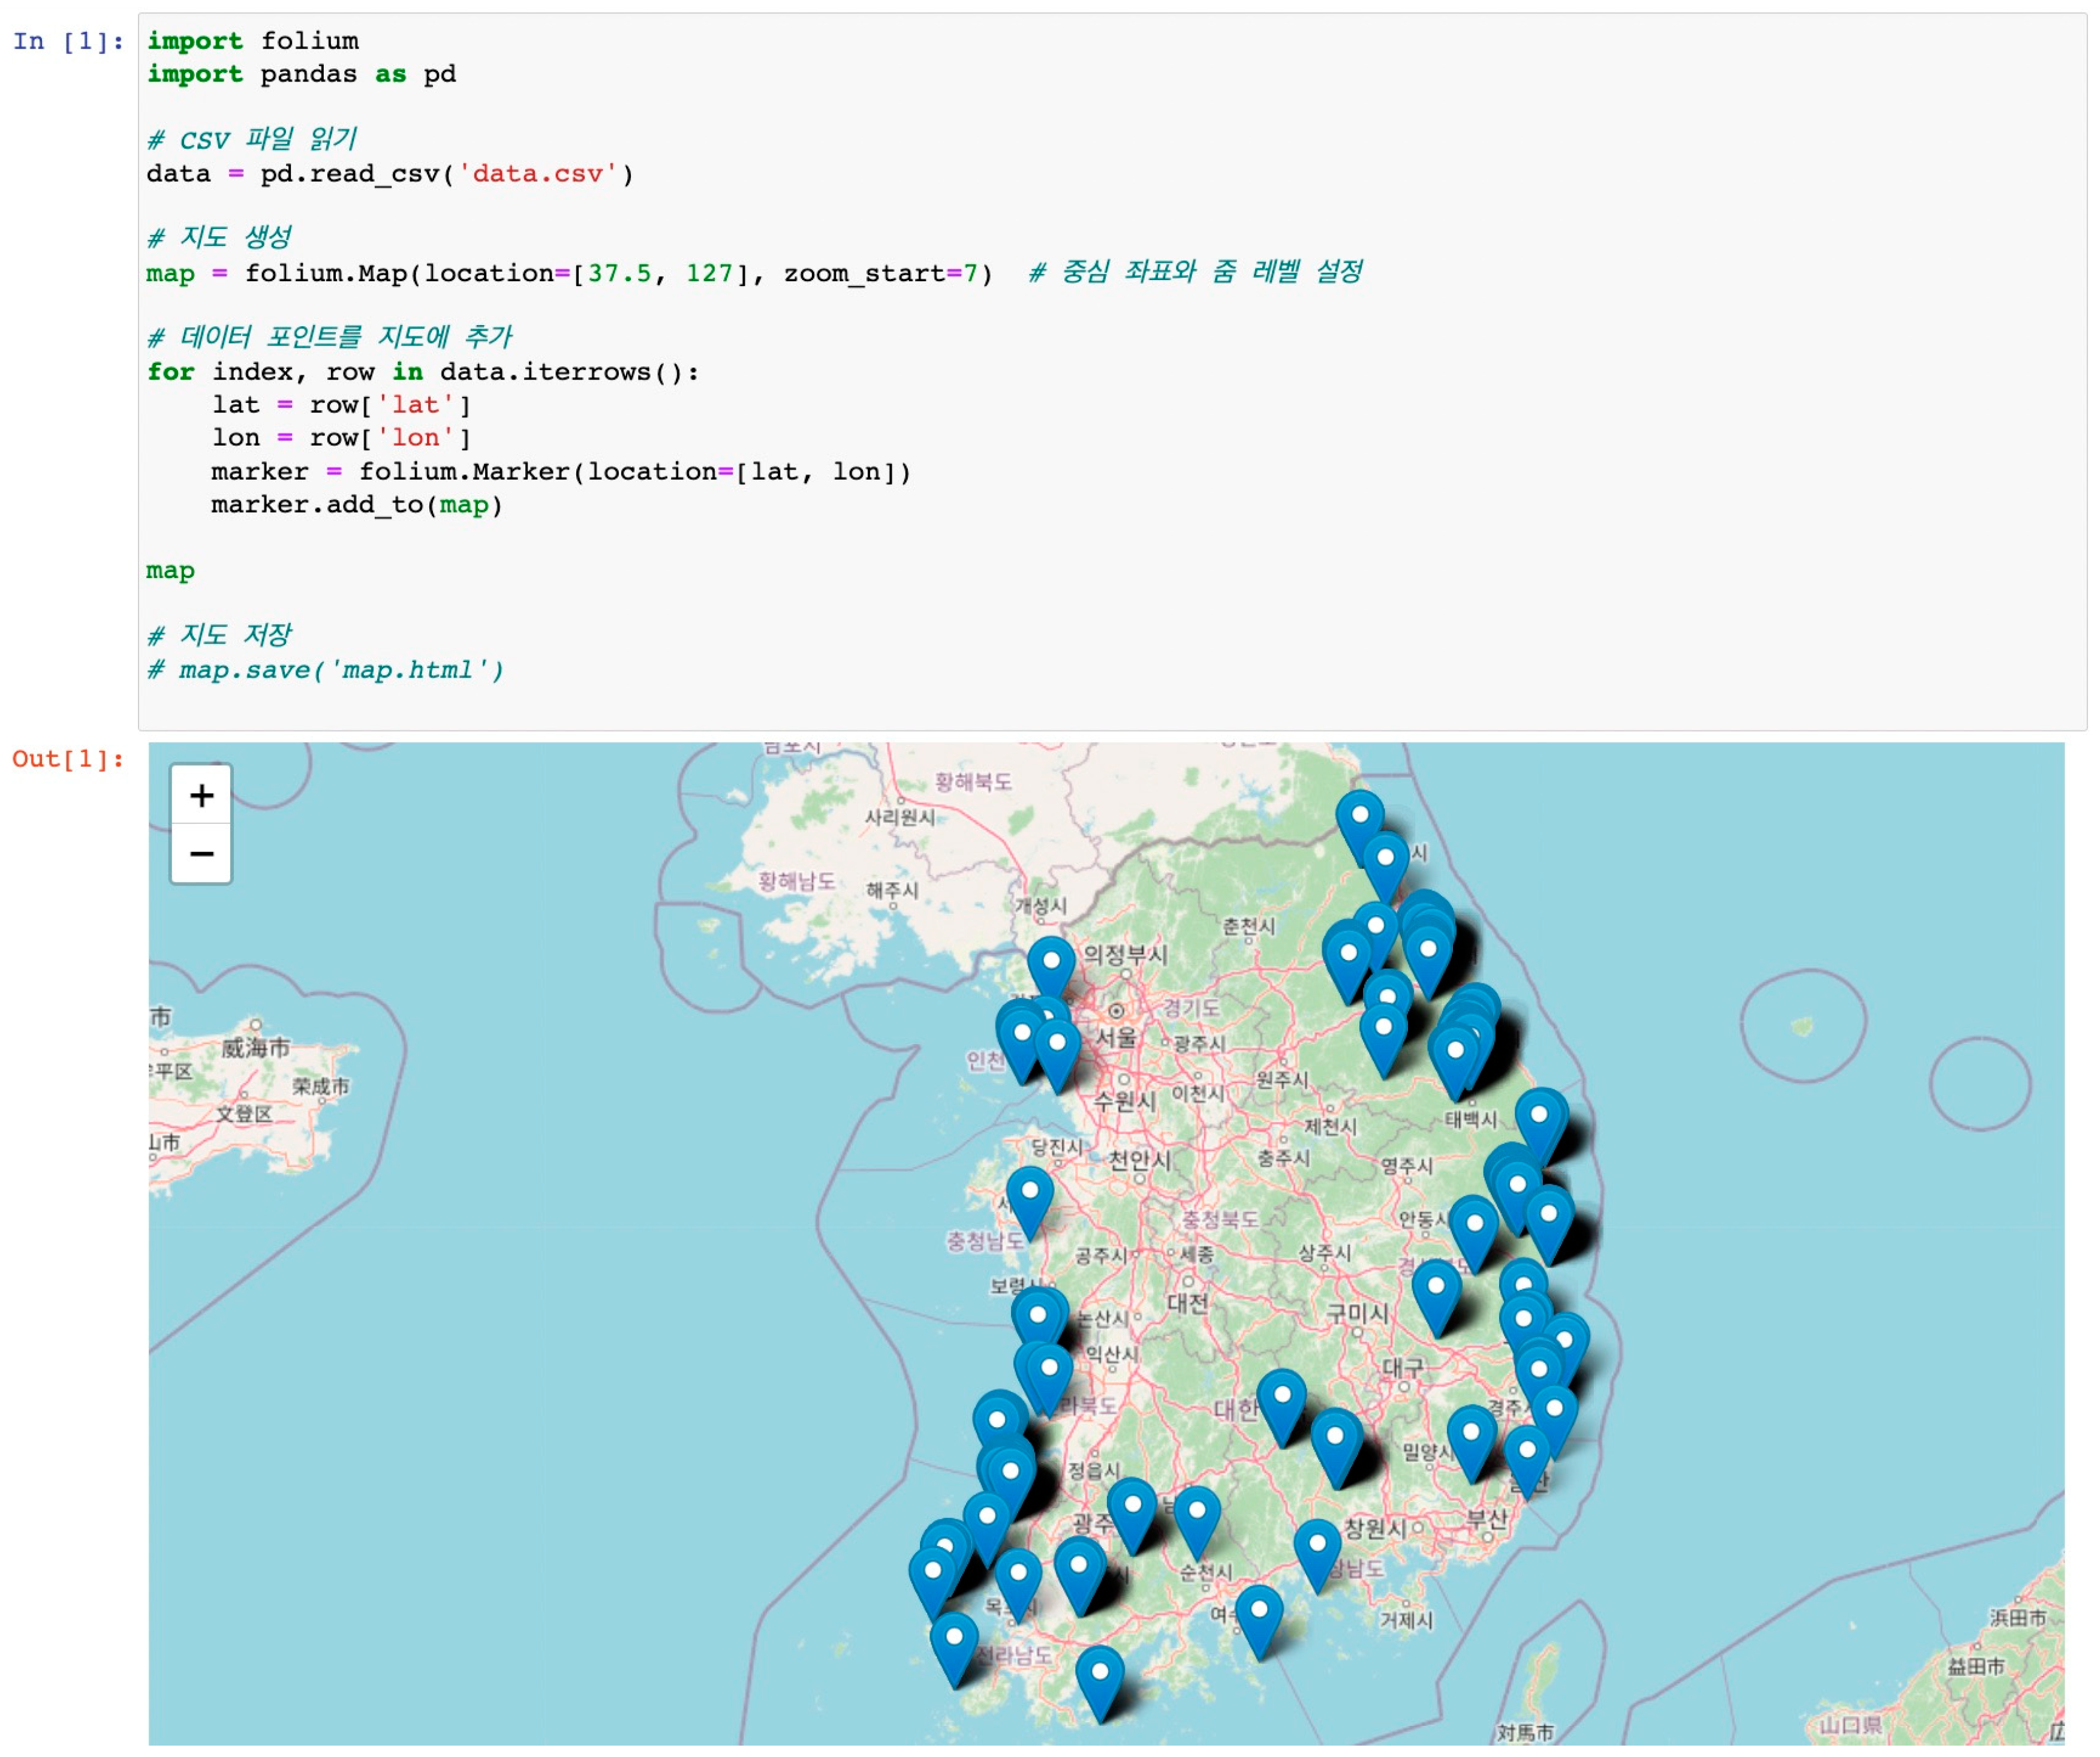
This image illustrates a map of wind power plant locations in South Korea, generated using Python code provided by an artificial intelligence tool, ChatGPT. The initial data for wind power plant locations was sourced from the Open Data Portal and subsequently mapped using Google Colab for visualization. This example demonstrates how publicly available data can be effectively visualized through AI-assisted coding and collaborative platforms like Google Colab.
Figure 4.
This image illustrates a map of wind power plant locations in South Korea, generated using Python code provided by an artificial intelligence tool, ChatGPT. The initial data for wind power plant locations was sourced from the Open Data Portal and subsequently mapped using Google Colab for visualization. This example demonstrates how publicly available data can be effectively visualized through AI-assisted coding and collaborative platforms like Google Colab.

Figure 5.
Changes in geography education due to the digitalization process.


Table 1.
Utilization of data and technology at each stage of geographical inquiry.
| Stage of Inquiry | Geospatial Web Service | Fieldwork Using GIS | Open And Big Data | AI and Coding |
|---|---|---|---|---|
| Asking questions | Use maps of Geospatial Web services to arouse curiosity and create questions. | Use examples of fieldwork using GIS to spark curiosity and formulate questions. | Use research cases to ignite curiosity and generate questions. | Request that AI provides a list of geographic questions for investigation. |
| Planning | Practice the data collection process using a sample Geospatial Web. | Practice the data collection process out-of-doors using GIS. Determine what data need to be collected out-of-doors. | Engage in the steps of locating, downloading, visualizing, and analyzing sample open and big data. | Request the necessary data or data collection method. |
| Collecting data | Search and record the necessary data in Geospatial Web. | Collect data in fields using GIS-based collection tools. | Search, extract, and download the necessary open data. Find a big data platform that contains the required data. | Collect the necessary data using AI’s machine learning functions, such as social data. |
| Presenting and analyzing | Visualize, analyze, and synthesize thematic maps, aerial/satellite photographs, and graphs obtained from Geospatial Web. | Analyze the collected data using GIS visualization and analysis tools. | Use programs (like Excel, Python, QGIS, R, etc.) to visualize and examine open or big data. | Request statistical analysis methods for the collected data. Run coding that employs AI to visualize, analyze, and predict data. |
| Concluding and reflecting | Create and share the outcome using the map-making feature of the Geospatial Web. | Construct and share the results of fieldwork through different methods, such as story maps or posters. | Answering questions and identifying additional usable data. | Compare the results with prior research achievements using AI. |
Table 2.
Example of geospatial inquiry activity focusing on Geospatial Web service.
| Attainment objective |
|
| Inquiry questions |
|
| Student tasks |
|
| Use of data and technologies |
|
| Key data collection, analysis, and visualization process |
|
Table 3.
Example of geospatial inquiry activity focusing on fieldwork using GIS.
| Attainment objective |
|
| Inquiry questions |
|
| Student task |
|
| Use of data and technologies |
|
| Key data collection, analysis, and visualization process |
|
1,2 G-DAM and PINOGIO are the GIS-based field survey tools and data visualization analysis systems developed for this study.
Table 4.
Example of geospatial inquiry activity that is focused on big data.
| Attainment objective |
|
| Inquiry questions |
|
| Student task |
|
| Use of data and technologies |
|
| Key data collection, analysis, and visualization process |
|
Table 5.
Example of geospatial inquiry activity focusing on open data as well as AI and coding.
| Attainment objective |
|
| Inquiry questions |
|
| Student task |
|
| Use of data and technologies |
|
| Key data collection, analysis, and visualization process |
|
Table 6.
Comparison between ESRI’s geo-inquiry and “geospatial inquiry activities”.
| ESRI’s Geo-Inquiry | Category | Geospatial Inquiry Activities |
| Geospatial Web service (ArcGIS online) | Data and technology used for inquiry | Geospatial Web service, open and big data, fieldwork using GIS as well as AI and coding |
| Developed not only for geography but also for history, economics, mathematics, and science. Globalization, population dynamics, language distribution, migration patterns, and urban density are included in world geography. | Scope and themes of inquiry | Developed for High School Korean Geography Natural disasters, tourism, energy, mobility, demographic change, concentration in the metropolitan area, economic structure, agriculture, change in indicators, geopolitics, North Korea, etc. |
| Structured inquiry | Types of inquiry | Structured inquiry |
| Asking questions Finding data Exploring Analyzing Acting | Process of inquiry | Asking questions Planning Collecting data Presenting and analyzing Concluding and reflecting |
Disclaimer/Publisher’s Note: The statements, opinions and data contained in all publications are solely those of the individual author(s) and contributor(s) and not of MDPI and/or the editor(s). MDPI and/or the editor(s) disclaim responsibility for any injury to people or property resulting from any ideas, methods, instructions or products referred to in the content. |
© 2023 by the author. Licensee MDPI, Basel, Switzerland. This article is an open access article distributed under the terms and conditions of the Creative Commons Attribution (CC BY) license (https://creativecommons.org/licenses/by/4.0/).
Share and Cite
MDPI and ACS Style
Lee, J. Beyond Geospatial Inquiry—How Can We Integrate the Latest Technological Advances into Geography Education? Educ. Sci. 2023, 13, 1128. https://doi.org/10.3390/educsci13111128
AMA Style
Lee J. Beyond Geospatial Inquiry—How Can We Integrate the Latest Technological Advances into Geography Education? Education Sciences. 2023; 13(11):1128. https://doi.org/10.3390/educsci13111128
Chicago/Turabian StyleLee, Jongwon. 2023. "Beyond Geospatial Inquiry—How Can We Integrate the Latest Technological Advances into Geography Education?" Education Sciences 13, no. 11: 1128. https://doi.org/10.3390/educsci13111128
Note that from the first issue of 2016, this journal uses article numbers instead of page numbers. See further details here.