


Many-Dimensional Model of Adolescent School Enjoyment: A Test Using Machine Learning from Behavioral and Social-Emotional Problems

1
Learning Sciences and Assessment Academic Group, National Institute of Education, Nanyang Technological University, Singapore 637616, Singapore
2
Psychology and Child & Human Development Academic Group, National Institute of Education, Nanyang Technological University, Singapore 637616, Singapore
*
Author to whom correspondence should be addressed.
Educ. Sci. 2023, 13(11), 1103; https://doi.org/10.3390/educsci13111103
Submission received: 28 September 2023
/
Revised: 27 October 2023
/
Accepted: 31 October 2023
/
Published: 1 November 2023
(This article belongs to the Topic The Causes, Counseling and Prevention Strategies for Maladaptive and Deviant Behaviors in Schools)
Abstract
:There is an emerging, many-dimensional model of human functioning that has yet to be rigorously tested in adolescent psychopathology. The model is based, in part, on research suggesting stronger predictive power at the level of single items compared to the commonly used smaller number of higher-level constructs represented by scores or factors. Here, the model is tested in research relevant for the understanding how psychopathology relates to adolescent school enjoyment. We compared, explained, and clustered machine learning model results from a set of 99 self-reported items from different instruments that measured the behavioral and social-emotional problems of adolescents to predict school enjoyment. There is support for a many-dimensional model. Individual items had unique variances beyond noise that incrementally added out-of-sample predictive power above construct-level prediction, particularly for nonlinear machine learning classifiers. Explainable machine learning uncovered important predictors of low school enjoyment, and these were specific nuances of withdrawn/depressive behaviors, elevated fears and anxieties, lowered sensation-seeking, and some conduct problems—what we term risk nuances (cf. risk factors). Clustering further identified shared risk nuances among different groups of individuals with low school enjoyment. Our results suggest that item nuances are important in revealing many ways in which adolescents’ behavioral and social-emotional problems relate to school enjoyment at the individual and group levels. A many-dimensional model can complement current descriptive, predictive, and intervention efforts in adolescent psychopathology.
1. Introduction
1.1. Power of the Item
What problems do adolescents manifest, and how does the constellation of problems relate to an important aspect of adolescent life, that of schooling [1,2]? To address this question, the current dominant approach is based on two major assumptions, among many. First, from a measurement perspective, it assumes that measured indicators such as individual questionnaire items are noisy, adversely affecting their reliability [3]. Second, from a theoretical perspective, what many are interested in are not the measurements themselves but what they are caused by, which are psychological constructs in the widely-used reflective model [4]. Constructs are “postulated attributes of people”, such as interpersonal hostility or anxiety [5]. Consequently, various theories based on these assumptions have been developed to provide reliable and compact construct-level postulations relevant for adolescent psychopathology, such as, among many, the developmental cascade model of psychopathology [6] and the spillover theory of parent-child-peer relationships [7]. An alternative perspective is emerging, mostly in personality science, of a many-dimensional model [8,9,10]. It is argued that individual questionnaire items representing many different dimensions of feelings, thoughts, and behaviors are themselves worthy of study over and above their assumed role as mere indicators of higher-level constructs. These many narrow descriptions, termed nuances in personality science [11], provide a much richer, many-dimensional view of human functioning compared to the smaller number of higher-level constructs typically studied. In terms of empirical evidence, studies have directly compared predictions by individual items (e.g., “I see myself as someone who is moody”) to higher-level personality constructs such as facets (e.g., anxiety) and domains (e.g., neuroticism), finding extensive evidence for the predictive advantage of items over facets and domains for a wide variety of outcomes [8,12,13,14]. To the extent that mental health research is a prediction science, the power of individual items to make good predictions on unseen data is a noteworthy effort. In terms of theoretical motivations, advances in using items as a unit of study are driven in part by measurement theory. Items are noisy measurement tools [3], and traditionally, this noise is overcome by aggregating many items, for example, via scales or summed scores. However, larger sample sizes that are increasingly common can also compensate for noise, allowing reliable associations at the item level to be uncovered [13]. Further, as argued by Seeboth and Mõttus [8], any theory-building effort needs to first start with precise and accurate descriptions of associations before any theoretical explanations can be offered. Seeboth and Mõttus [8] argued with the example of how the big five personality domains seemed to predict a vast universe of outcomes [15], though very weakly with little specificity, such that similar combinations of personality domains can predict very different life outcomes. The ubiquitous but weak relationships, or weak ubiquity, motivate the search for a stronger predictive theory that is more specific. Lastly, the emerging many-dimensional model is further inspired by the rapid growth of genome-wide association studies (GWAS) in the past decade. These studies have correlated pieces of genetic information (e.g., millions of single nucleotide polymorphisms) with psychiatric disorders [16] and educational outcomes [17], among others. Much in the same way that pieces of genetic sequences constitute the genome, nuances at the item level are argued to constitute the building blocks of the persome [18]. While the genome represents a person’s unique genetic make-up, the persome, using nuances, represents a person’s unique psychological make-up.
1.2. Toward a Many-Dimensional Adolescent Psychopathology
There is a need to test a many-dimensional model in adolescent psychopathology for a number of reasons. First, much, if not all, of the relevant work has been in personality science with a focus on adults, and much less is known about adolescents. Many of the items used in personality science are arguably related to habits of thoughts and behaviors that may have more stable, trait-like properties, especially in adults. However, many widely used instruments relevant to adolescence research may assess more state-like, context-dependent responses. These would include symptom presentations that vary over time [19] or social relationships that change dynamically over development [20]. There is a need to test whether items relevant to adolescent psychopathology can confer predictive power. Adolescence is a stage of change and instability, making it a relevant age group to rigorously test the many-dimensional model. Second, similar to personality research, the phenomenon of the weak ubiquity of constructs is also present in adolescent psychopathology. For example, the widely used psychopathological construct of internalizing behaviors, conceptualized as inner distress, is linked to numerous school functioning measures such as attendance and grades, but only weakly so, typically with an r of less than 0.3 as demonstrated in a previous meta-analysis [21]. Can specific items related to internalizing behaviors more powerfully and specifically predict aspects of adolescent school functioning? One important aspect of adolescent school functioning is how much adolescents enjoy schooling, an indicator of their overall positive feelings about school, classes, and their activities [22]. Children and adolescents who enjoy schooling, are meaningfully engaged in school, or are less bored tend to have better academic, behavioral, and emotional outcomes [23,24]. It is argued that positive feelings about school can foster higher aspirations and greater motivation to learn, which in turn lead to higher achievement [24]. School enjoyment also has broader positive correlates of positive teacher-student [25] and peer relationships [26], while also potentially protecting against further psychopathology and delinquency [22]. Despite its importance, whether or not adolescents enjoy school has not been studied in detail, particularly how specific and narrow behavioral and social-emotional problems may hinder optimal school enjoyment in different adolescents.
1.3. Present Study
The primary aim of the study was to test the relevance of a many-dimensional model of human functioning in adolescent psychopathology. We compared items to constructs in the concurrent prediction of school enjoyment. Nonlinear machine learning classifier models were trained and tested on a large sample of items measuring adolescent behavioral and social-emotional problems to predict how much they enjoy school. Results were then compared to higher-level constructs and to traditional linear models. Further machine learning explainability analysis and clustering were implemented to obtain more insights into how specific problems related to low school enjoyment in different groups of adolescents.
2. Materials and Methods
2.1. Participants
A nationally representative, non-clinical, school-based sample was collected. Participants were 3232 Singaporean adolescents aged 12–18 years (M = 14.0 years, SD = 1.0 year), with 49% female, drawn from four publicly funded schools in Singapore. Participation was voluntary, obtained via written informed consent from each participant and their parents. English, the main language of instruction in Singapore, was used for all questionnaires that were administered in a classroom setting, with responses kept confidential. Other than informed consent, there were no other eligibility criteria for inclusion/exclusion. Supplementary Table S1 provides details of the sample. A subset of the data was previously used for person-centered analysis [27] and machine learning to predict social functioning [28]. In the present research, we focused on a new detailed investigation of how nuances at the item level differed from scores at the construct level in the concurrent prediction of school enjoyment. All procedures involving human participants and secondary data analyses were approved by the Institutional Review Board of Nanyang Technological University.
2.2. Measures
The present study measured nine constructs of behavioral and social-emotional functioning: six related to behavioral and emotional problems in addition to sensation-seeking, peer pressure, and parent-child relationships. A list of all predictors at item level is given in Supplementary Table S2, including the reporting of descriptive statistics for all items.
Behavioral and socio-emotional problems. Behavioral and emotional problems were measured by Youth Self-Report (YSR) [29] using a 3-point Likert scale (“Not true”, “Somewhat or sometimes true”, “Very true or often true”). Items covered factor-separable syndromes assumed to represent latent psychopathologies [30]. Anxious/depressed was measured by 12 items (e.g., “I am nervous or tense”). Cronbach’s alpha was 0.84. Withdrawn/depressed was measured by eight items (e.g., “I don’t have much energy”). Cronbach’s alpha was 0.75. Attention problems were measured by nine items (e.g., “I don’t finish what I start”). Cronbach’s alpha was 0.79. Somatic complaints were measured by 11 items (e.g., “I feel dizzy or light-headed”). Cronbach’s alpha was 0.78. Rule-breaking behaviors were measured by 13 items (e.g., “I steal at home”). Cronbach’s alpha was 0.66. Aggression was measured by 17 items (e.g., “I am louder than other kids”). Cronbach’s alpha was 0.86.
Sensation-seeking. The Brief Sensation Seeking Scale for Chinese (BSSSC) [31] was used with eight items (e.g., “I am interested in almost everything that is new”). Responses were recorded on a 5-point scale (1, “Completely disagree” to 5, “Completely agree”). Cronbach’s alpha was 0.72.
Peer pressure. Nine items from the Peer Pressure Inventory (PPI) [32] were administered to measure the extent of self-perceived peer pressure in school (e.g., “How often do you feel the need to be friends with the popular students?”). Responses were recorded on a 5-point scale (1, “Never” to 5, “All the time”). Cronbach’s alpha was 0.81.
Parent-child relationship. The Parent Environment Questionnaire (PEQ) [33] was used, specifically the 12-item “Parent-Child Conflict” scale from the adolescent’s perspective (e.g., “My parent often hurts my feelings”). Responses were recorded on a 4-point scale (1, “Definitely true” to 4, “Definitely false”). Cronbach’s alpha was 0.90.
School enjoyment. Participants were asked “How much do you enjoy school and school activities?”. Responses were recorded on a 3-point scale (1, “Above average”; 2, “Average”; 3, “Below average”).
2.3. Machine Learning
Because there is currently no community guideline for machine learning reporting, a recent publication initiated a methodology checklist for transparent reporting of machine learning analysis (29) that has since been used by others [34]. The reporting combines items from two recent systematic reviews on the use of machine learning in biomedical and mental health research [35,36]. The checklist of reporting items is provided in Supplementary Table S1.
2.3.1. Variables
Ninety-nine items were used as item-level predictors. These items came from 9 constructs: anxious/depressed, withdrawn/depressed, attention problems, somatic complaints, rule-breaking, aggression, sensation-seeking, peer pressure, and parent-child relationship. Supplementary Table S2 lists all the predictor items and constructs labels. The outcome to be predicted was school enjoyment, collected concurrently with the predictors. A small amount of missing data for each set (development and test) was imputed independently using the K-nearest neighbor algorithm. For main item-level analysis, all predictors were ordinal data and were all similarly entered without any variable selection. For construct-level analysis, linearly summed scores were computed from items belonging to each construct [37]. For events per predictor variable number (EPV), focusing on the combined event count for two minority categories of school enjoyment (“above average” and “below average”), the EPV for the development set was 11.5 events per predictor variable for the main item-level analysis and 126.3 for the construct-level analysis. This ratio indicates a sufficiently large sample size in order to reliably predict the minority categories.
2.3.2. Data and Machine Learning Workflow
An imbalanced 80–20 split, as is common in machine learning research, was performed on the full data (N = 3232 cases or participants), producing a development set and a test set. This was performed once via random selection. The test set consisted of N = 164 (25.4%), 419 (64.9%), and 63 (9.8%) cases in the outcome categories of “above average”, “average” and “below average”, respectively. This test set was reserved for final testing of the optimized models and was not employed in any of the steps in model development. Previous analysis suggested that oversampling minority cases can help increase prediction [28]. Thus, we applied the synthetic minority oversampling technique, SMOTE [38], to the development set to increase the proportion of the minority categories by about 200%. For the 99-item or 9-construct analysis, all items or constructs were used. For the 1-item, 2-item, or 4-item analysis, 1, 2, or 4 items were randomly sampled from each of the item pools belonging to each construct. For example, for 1-item analysis, 1 item was randomly chosen from each of the nine constructs, producing 9 items in total for use in subsequent machine learning, and this was repeated 50 times to assess variability from item sampling. After these steps, the model development set underwent Bayesian hyperparameter optimization and model training (see subsequent text). The best model for each classifier at the end of model development was then used to predict the outcome categories in the test set using the same set of predictor items. We performed three additional analyses to address questions about item-level prediction, which we termed (1) residual variance analysis on the full training set, (2) residual variance analysis on a subsample, and (3) randomly-permuted variance analysis on the full training set. First, we asked the extent to which the machine learning results depended on unique variances at the item level. For this question, we regressed each item onto the summed score of the construct that the item belonged to. The residuals from this regression were then used for further machine learning. This procedure allowed us to assess whether analyzing only items’ unique variances affected the results. Second, we repeated this residual variance analysis, but first randomly subsampled just 20% of the training set, followed by further machine learning. This analysis allowed us to examine the extent to which sample size played a role in driving the items’ predictive power. Third, for a given pool of items belonging to each construct, we randomly assigned the item values using values from another item belonging to the same construct for each respondent. For example, 12 items belonged to the anxious/depressed construct, and the item values were randomly permuted such that one item took on a value from one of the 12 items, then the next item took on a value from one of the remaining 11 items, and so on (this was performed without replacement, thus no values were duplicated). This was then performed for the next respondent, and so on and so forth. This procedure maintained the summed score representing the construct for each respondent but randomized the item values. It allowed us to test whether the machine learning analysis capitalized on item variances that were simply noise, in which case such random permutations would not adversely affect the machine learning results. Alternatively, if the item variances had genuine signals beyond their relationship with the construct (since summed scores were maintained), the randomly permuted values would reduce machine learning performance.
Four classifiers were used to predict the outcome variable of school enjoyment. Nonlinear classifiers were artificial neural networks and K-nearest neighbor. These were nonlinear classifiers that learned complex patterns in the data in an automated manner, such as nonlinear combinations of predictor variables or higher-order terms. These would result in nonlinear decision boundaries to classify the outcome categories. Artificial neural networks use computational units akin to neurons, which transform inputs (predictor values) into outputs (inputs to other layers of neurons or final outcome categories) via weighted summation and nonlinear activation functions [39]. K-nearest neighbor applies the concept of neighbors such that cases with known outcome categories that are most similar in their predictor values to a query case (case to be predicted) are used to predict the outcome category of the query case [40]. These two machine learning classifiers were found to be among the best-performing ones in similar previous analyses [28] and were thus used here. Two other classifiers were linear ones from multinomial logistic regression and linear discriminant analysis. These classifiers are very common in school and clinical psychology research and are under the class of generalized linear models, as their functions for classifying cases into outcome categories are forced to be linear in variable space. Though both are linear classifiers, they differ in other properties (e.g., normality assumption, susceptibility to outliers, etc.), allowing us to assess potential differences in results.
Each of the four classifiers first independently underwent hyperparameter optimization, similar to a previous publication [28]. Briefly, hyperparameters are static parameters that govern model structure and the downstream learning process. An example would be the lambda parameter for regularization in logistic regression, which is typically fixed. Previous research suggested that hyperparameter tuning can be important for optimizing predictive performance [41]. Given the large space of possible hyperparameter combinations, Bayesian optimization (50 evaluations) was instead used to estimate the best set of hyperparameters using 5-fold cross-validation. The best set of hyperparameters was then subsequently used during the training of the classifier model parameters. The trained models were then applied to the test set. There are a variety of performance measures that can be used in machine learning. We chose Matthew’s correlation coefficient (MCC) as it uses all four cells in a confusion matrix (true positives, true negatives, false positive, and false negatives). It is also a type of correlation; thus, MCC and its squared, MCC2, which is a measure of outcome variance explained by the model, can be directly compared to commonly used R and R2 measures in the social sciences. However, we note that the pattern of results remained essentially the same when considering other metrics such as the F1 score. MCC ranges from −1 (a perfectly opposite prediction to actual outcome) to 0 (a random prediction) to 1 (a perfect prediction of actual outcome). MCC2 ranges from 0 (zero outcome variance explained by model) to 1 (100% of outcome variance explained by model).
2.3.3. Model Explainability
To interpret the machine learning models, model explainers were used on the test set, in particular local interpretable model agnostic explanations (LIME) [42]. Briefly, LIME assumes that for a single query case, one can apply a simple approximation of the prediction function for a local region, even though globally for all cases, the prediction function might be highly complex in the machine learning model. This approximation is achieved by producing synthetic (artificial) data, weighing each synthetic datapoint by its proximity to the query case, and then fitting a simple model to identify important predictors specific to the query case. As a simple model, we used a decision tree that still allowed some limited form of nonlinear complexity. The top 20 predictors for each correctly classified case in the test set were identified using Gini impurity-based predictor importance (how well the predictor node in the tree classified cases into the different classes). To interpret the directionality of the relationship between the top predictors and outcomes, an overall measure of effect size (Cohen’s d, mean difference divided by standard deviation) was used, comparing those with low (“below average”) to high (“above average”) school enjoyment for each of the top predictors.
Model explainability operates at the individual case level, but because there are too many cases, it can become difficult to visualize each and every case’s list of predictors. Thus, using the ordered list of the top 20 predictors across all cases, we then performed t-SNE dimensionality reduction (to 3 dimensions) [43]. t-SNE, like factor analysis and principal components analysis, reduces high-dimensional data to a smaller number of dimensions based on similarities (e.g., correlation or distance). Unlike other commonly used linear dimensionality reduction techniques, t-SNE is nonlinear, allowing us to capture more complex structural features while preserving local similarities. Clustering was subsequently performed on the t-SNE-reduced dimensions using k-means clustering. The optimal number of clusters (ranging from 1 to 15) was estimated via the commonly used variance-ratio criterion (maximum ratio of between- and within-cluster variance) [44]. These putative clusters represented cases with an overlapping list of top predictors. One top predictor that was most common among all the cases in each cluster was then identified to qualitatively interpret the cluster.
All data processing, machine learning, and model explainability were performed in Matlab 2021b programming environment using the Statistics and Machine Learning Toolbox and custom scripts. The machine models are available as Matlab objects upon request.
3. Results
3.1. Items Versus Constructs
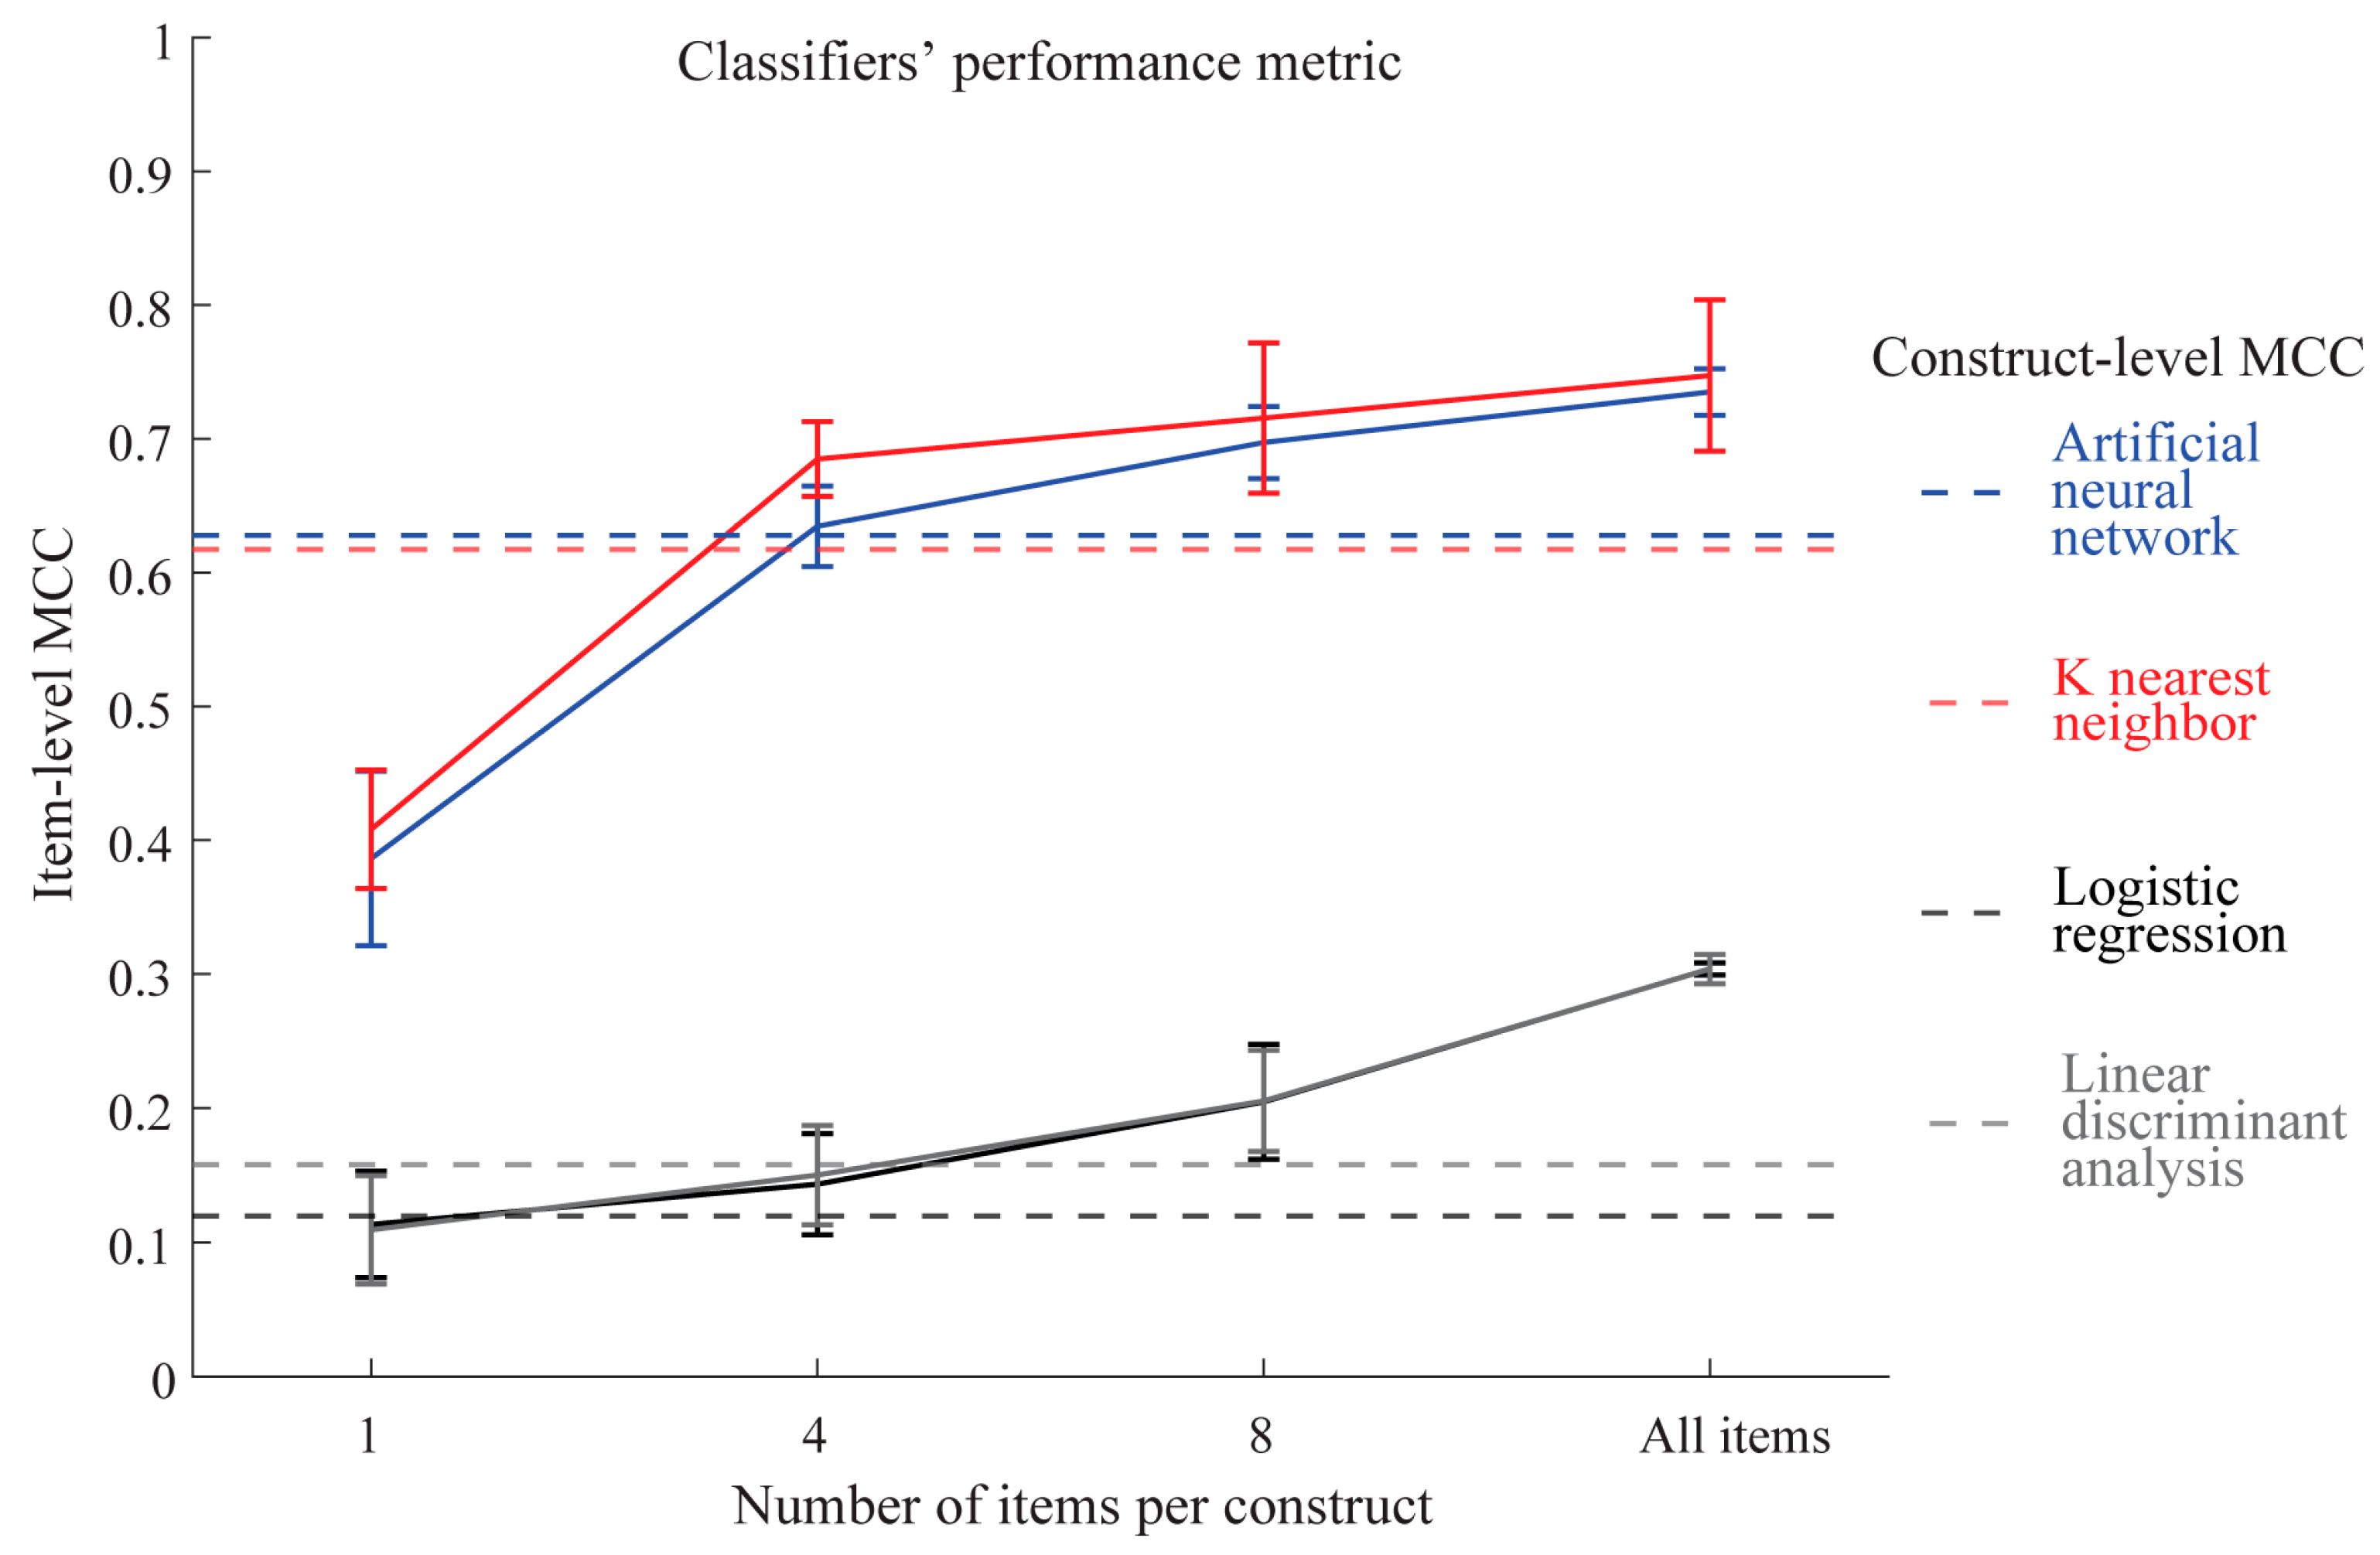
Four types of classifier models to predict school enjoyment were built using the model development set consisting of either individual items or linearly summed scores for all nine constructs. The models’ performance was then evaluated on the unseen test set based on MCC. Figure 1 shows the results. As the number of sampled items per construct increased, the classifiers generally increased in performance on the test set. However, nonlinear machine learning classifiers of artificial neural networks and K-nearest neighbor exceeded the performance of linear classifiers for all sampled items, suggesting complexities in our data that nonlinear classifiers were able to discover for prediction purposes. Importantly, both linear and nonlinear classifiers started to outperform construct-level classifiers when more than four items were sampled per construct. This result indicated that a small number of items did not lend itself to good prediction but that as more items were added, the classifiers could leverage the additional information to improve prediction. The best prediction performance was demonstrated by artificial neural networks and K-nearest neighbor using all 99 items in the model. These 99-item models had MCC = 0.74 and 0.75, respectively, exceeding the performance of the same types of classifiers using constructs (MCC = 0.63 and 0.62, respectively). MCC is a form of correlation comparable to R, and MCC2 is comparable to R2. Thus, our nonlinear classifiers can explain about 55% (0.742) of the variance of the outcome variable.
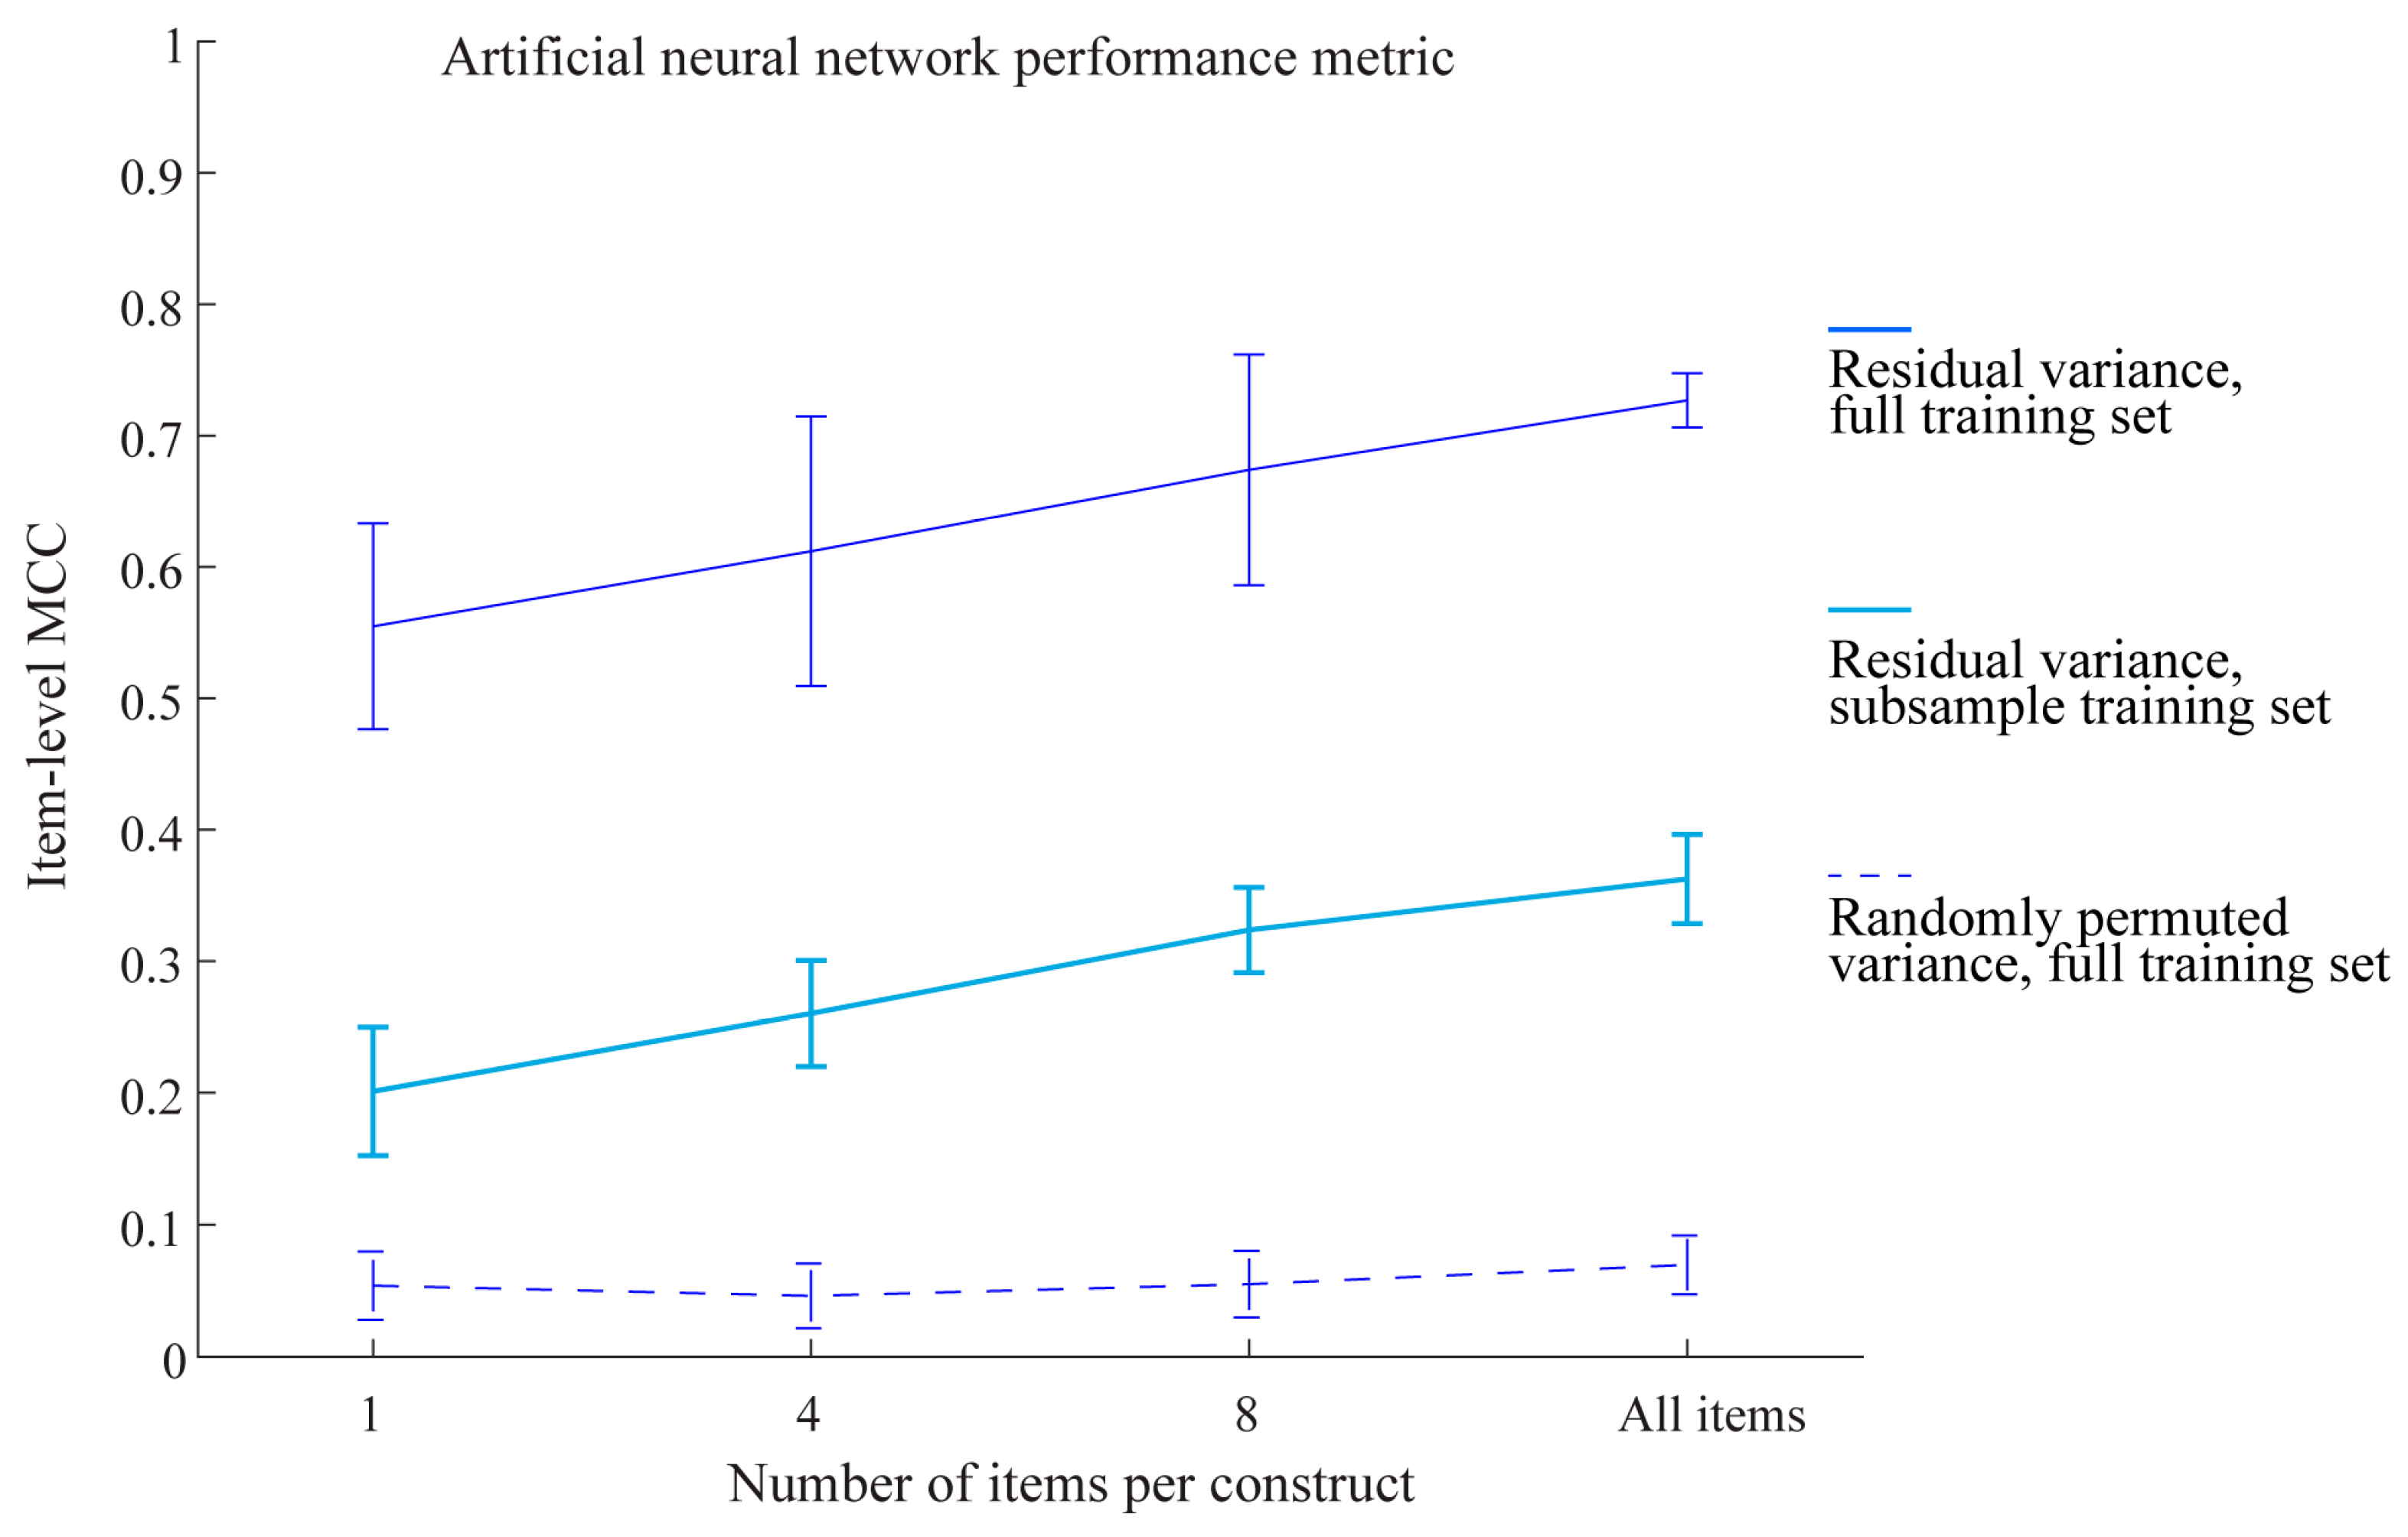
We further investigated the nature of item-level signals, focusing on our artificial neural network classifier. Items belonging to the same construct were correlated to one another and to the summed scores representing constructs, so the prediction performance at the item level could conceivably be driven by common variance with only marginal unique contribution by each item. The finding that items outperformed constructs that relied on common variance suggests that this was not likely to be the case. Nonetheless, to formally test this possibility, we regressed each item onto the summed construct score that the item belonged to and used the residuals as data for model development and test sets. As expected, this procedure did not change the performance at the item level for artificial neural networks (Figure 2). The MCC for the 99-item residual variance model was still higher than the construct-level MCC. This finding supports the idea that individual items had unique variances (beyond the construct) that were driving our main machine learning results. To test whether sample size played a role, we randomly subsampled 20% of the training set with the residual variance data before model development and model testing. Performance dropped substantially but not fully, suggesting the contribution of large sample sizes for machine learning. Another test of the predictive power of items is to randomly permute the values of items belonging to each construct. This procedure would maintain the summed scores for each construct but destroy any signals at the item level. If the models were simply capturing noise in the items and overfitting them to the data, we would expect similarly good predictions. However, this was not the case: randomly-permuted variance essentially eliminated any prediction performance on the test set (Figure 2). Overall, this pattern of results suggests that individual items had genuine signals beyond noise that incrementally added predictive power above construct-level prediction. This predictive power was maximized by using the largest number of items in a large sample size for nonlinear machine learning models.
3.2. Model Explainability
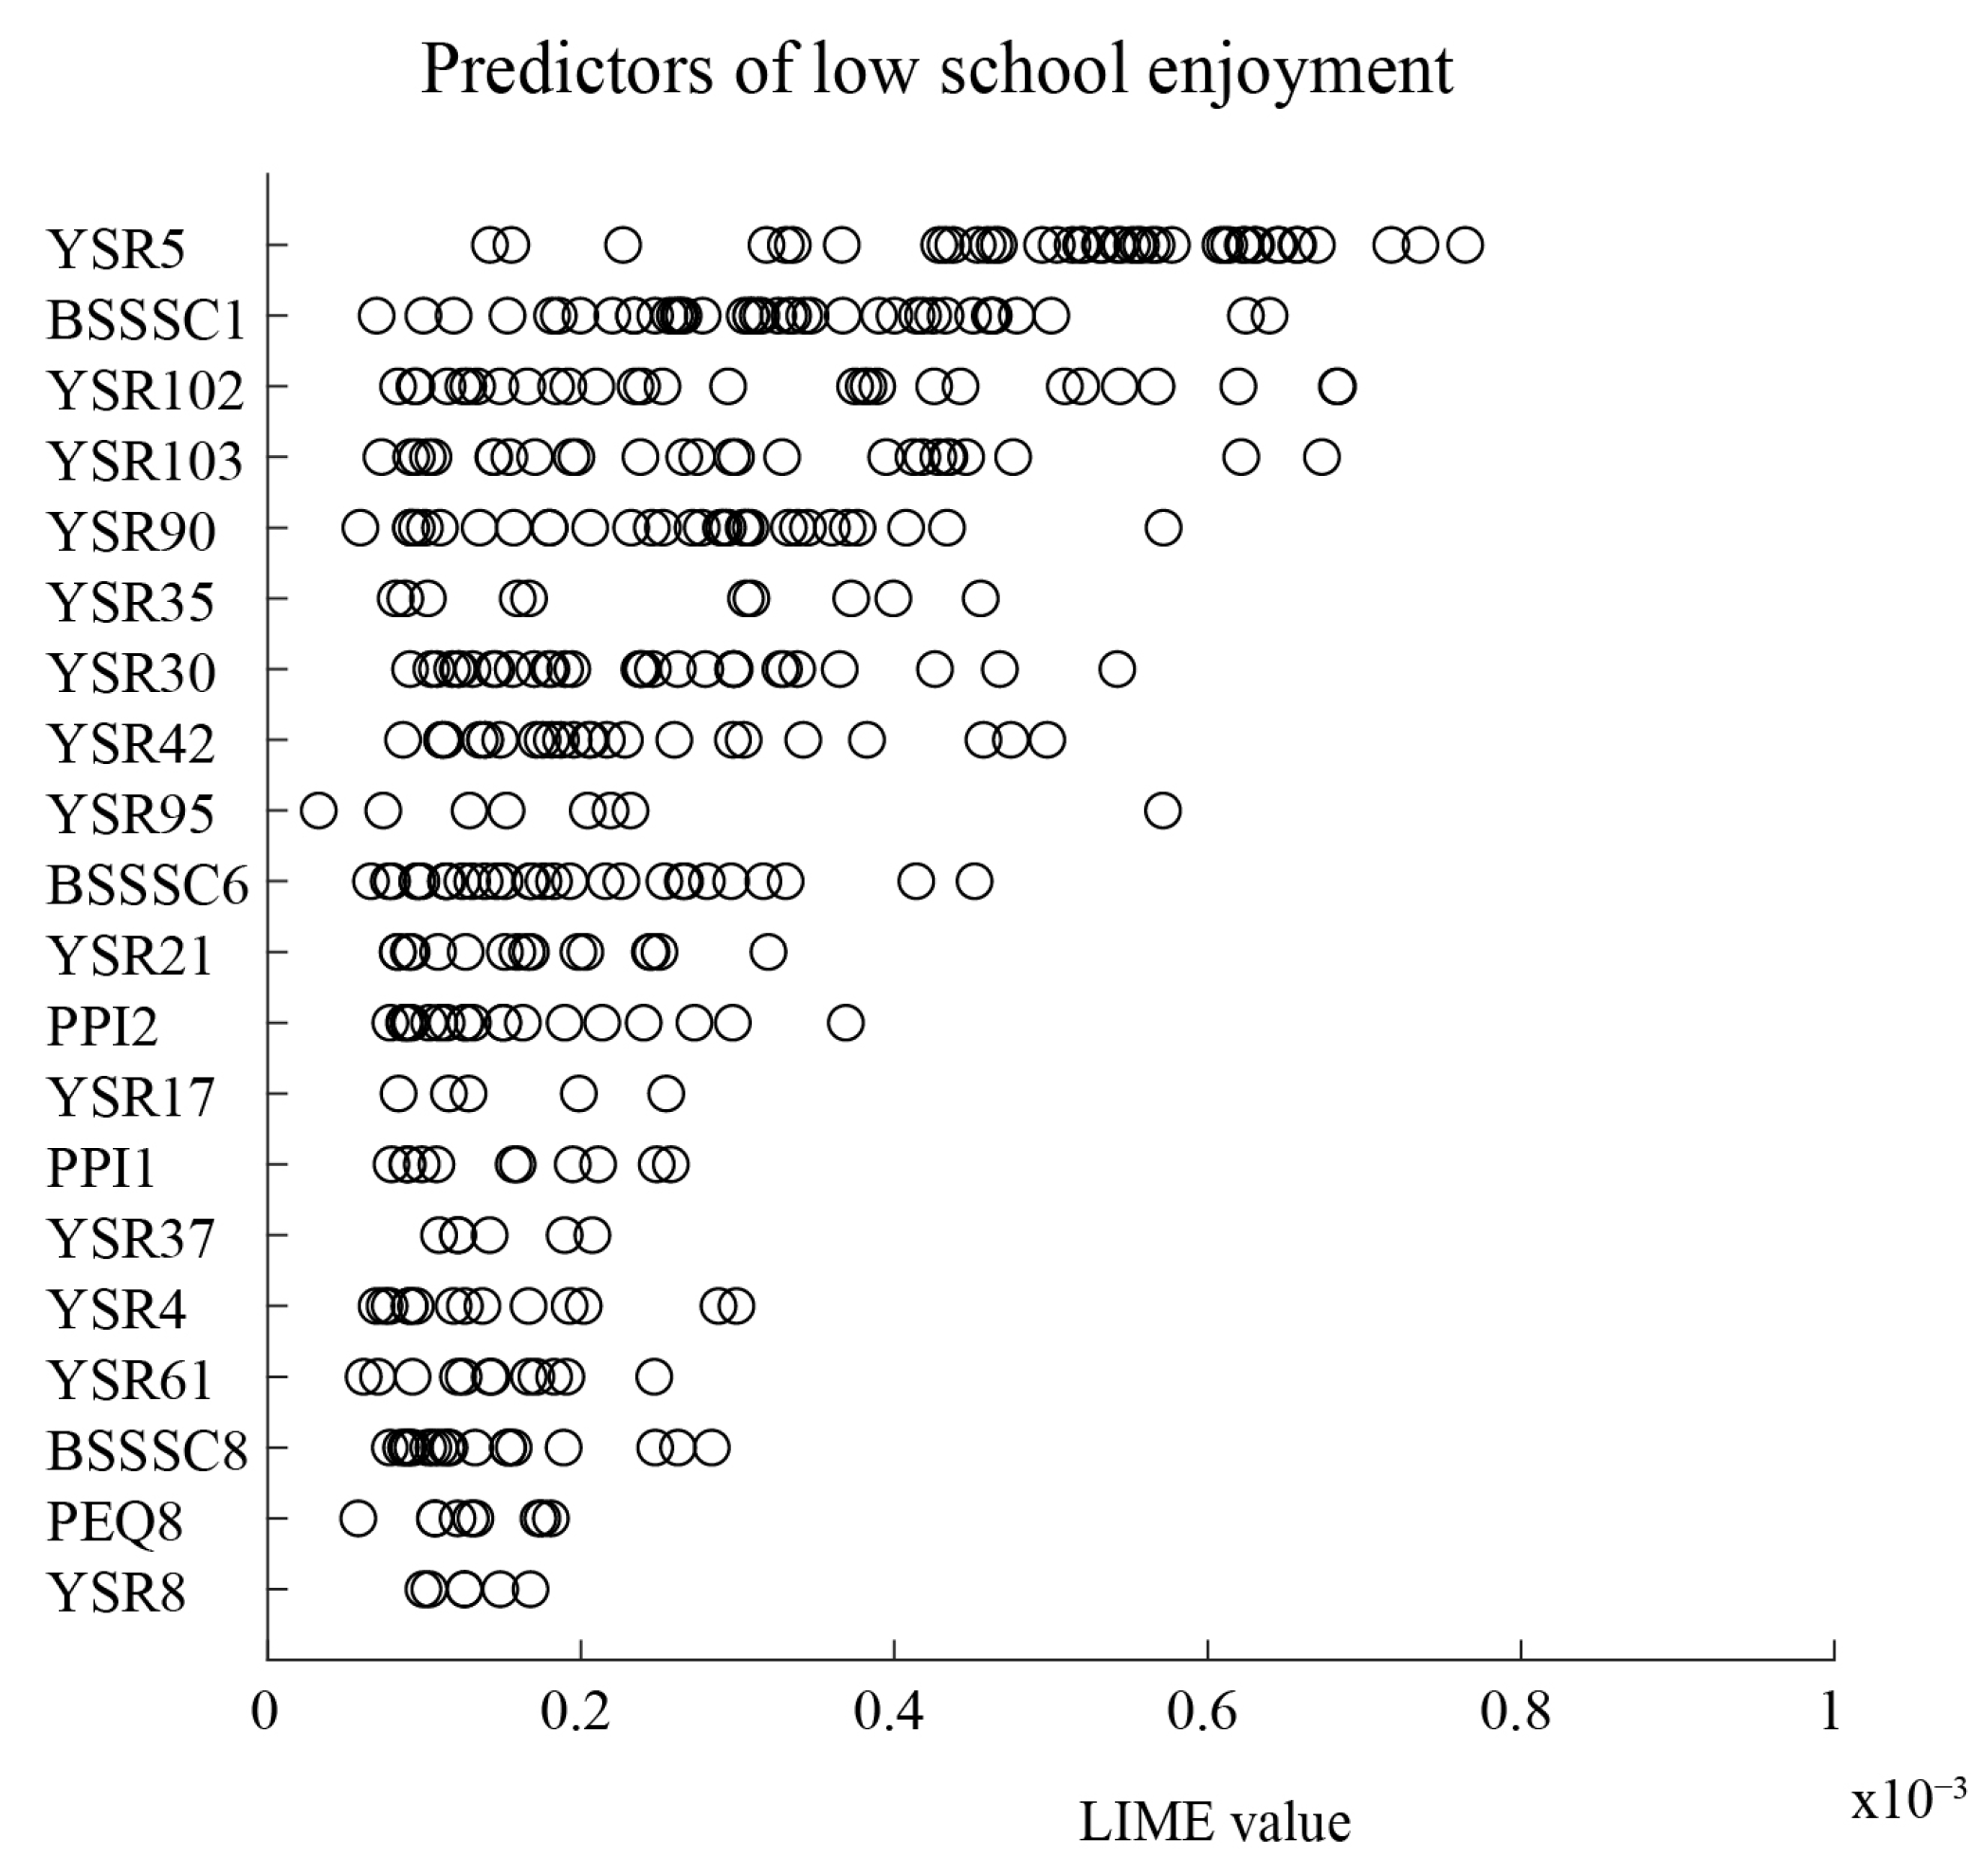
We next focused on our 99-item artificial neural network model, attempting to explain its prediction function specifically for low school enjoyment (rated as “below average” by respondents). In other words, we tried to identify items contributing to individual risk for low school enjoyment. LIME analysis was employed [42]. LIME is based on the insight that simple model explanations can be applied at the local level for each case, even though the black-box machine learning model may involve complex, nonlinear decision boundaries at a global level for all cases. LIME, therefore, allows us to identify important predictors specific to each case. We used simple tree explainers of our artificial neural network model. The ranking of the top 20 predictors of low school enjoyment is shown in Figure 3. Each circle indicates a case and its LIME value. A higher value shows a stronger influence on a particular case’s prediction, while the number of circles indicates how many cases the predictor has an influence on. Thus, both the LIME value and the number of circles can be interpreted together as representing the overall importance of a predictor. The top five predictors were: YSR5, There is very little that I enjoy; BSSSC1, I’m interested in almost everything that is new; YSR102, I don’t have much energy; YSR103, I am unhappy, sad, or depressed; and YSR90, I swear or use dirty language. These top five predictors were generally related to emotional nuances of being withdrawn/depressed, personality characteristics of low sensation-seeking, and conduct problems/rule-breaking behaviors. Having some conduct problems is not inconsistent with withdrawn and depressed behaviors because, in children, irritability is a notable feature of depression [45]. Additionally, it is not uncommon to see interrelationships between internalizing and externalizing symptoms and school-related concerns or issues [46]. We observed that many other items subsumed under the same constructs were not identified as being important predictors. For example, YSR75—I am shy or timid—though part of the withdrawn/depressed symptom construct was not identified as a top 20 predictor. Other top 20 predictors related to school fears and anxieties and school functioning, such as YSR30, I am afraid of going to school and YSR61, My school work is poor, suggesting some face validity in the list of predictors of school enjoyment.
To further interpret the directionality of the predictor-school enjoyment relationship, we examined simple effect sizes (Cohen’s d) for each predictor, comparing low to high school enjoyment outcome categories. For all YSR-related items, as expected, adolescents with more problems had low school enjoyment (Cohen’s d = 0.41 to 0.92 for all YSR predictors in the top 20; a positive value shows a higher mean for those with low school enjoyment compared to high school enjoyment). For BSSSC-related items, the pattern was more complex. Low sensation-seeking via items BSSSC1 and BSSSC6 tapping into experience seeking was linked to low school enjoyment (Cohen’s d = −0.67 and −0.45 respectively), but the opposite seemed to be the case for BSSSC8 (Cohen’s d = 0.52), as was the finding for the YSR items. BSSSC8 has a positive association with low school enjoyment, likely because it taps into the disinhibition dimension of sensation seeking, which aligns with acting out and conduct problems. Overall, across all individuals, important predictors of low school enjoyment were specific nuances of withdrawn/depressive behaviors, elevated fears and anxieties, low sensation-seeking, and some manifestations of conduct problems. Figure 3 provides an aggregate view of the top predictors, combining all individual cases with low school enjoyment. To better understand the distribution of predictors for each individual, we additionally performed dimensionality reduction of the list of top 20 predictors for each individual, followed by clustering. Figure 4 visualizes the clustered distribution of cases in lower-dimensional space. Cases with the same color belonged to the same cluster with an overlapping distribution of top predictors. Four clusters were optimally inferred for individuals with the outcome of low school enjoyment. For each cluster, we identified the most common top three predictors from the overlapping distribution of top predictors. We conceptualized these common top predictors as shared risk nuances, as reported in Table 1. Interestingly, each cluster had a different common top predictor. Two clusters had different common top predictors, but both related to sensation-seeking: BSSSC1, I’m interested in almost everything that is new, and BSSSC6, Going on adventures always makes me happy. Both BSSSC1 and BSSSC6 items tap into the experience and adventure seeking dimensions of the sensation-seeking construct, whereby low levels of sensation seeking are associated with low school enjoyment. Two other clusters had different common top predictors of PPI2, How often do you feel the need to be part of a group in school? and YSR30, I am afraid of going to school. With respect to PPI2, these adolescents did not feel the need to be part of a group in school. Given the profile of an adolescent who manifests withdrawn and depressive symptoms and is somewhat fearful of novel and adventure-related experiences, such an individual would typically not be found seeking out cliques and groups in school. In other words, we uncovered evidence of different important predictors for distinct groups of individuals related to specific nuances of low sensation-seeking, school anxiety, and a low need for peer conformity pressure with respect to a sense of belonging derived from peer groups.
4. Discussion
How can we better understand adolescent psychopathology so as to best describe and predict an important aspect of adolescence, that of school enjoyment? Traditional analysis has relied on linear models that aggregate items to represent higher-level constructs and then build compact descriptions and models averaged across all individuals. However, our results strongly suggest that there is unique information at the level of single items that can be used to build highly predictive models of school enjoyment in support of the many-dimensional model [8,9,10]. Further machine learning explainability analysis and clustering can reveal important predictive items at the individual or group level.
Our study can be compared to previous studies on psychopathology and school functioning. In the most recent study on psychopathology and school enjoyment, Cadman and Hughes [22] examined a multivariate model to predict school enjoyment from the latent construct of externalizing problems. However, the predictive relationship was very small (standardized beta coefficient of −0.08). They also found that depressive symptoms, part of the internalizing problems construct, predicted school enjoyment, but similarly, very weakly. This weak ubiquity contrasts with our study’s possibility of building a stronger predictive model with more specificity. However, our approach does make the model less compact since many more non-aggregated items are involved. Our procedure, however, guards against overfitting because performance was tested on an unseen test set kept separate from model development. Further, psychopathology can be dimensionalized at different hierarchical levels [47]. In contrast to our results, Allen et al.’s [21] meta-analysis found that broadband scores involving high-level internalizing and externalizing constructs had better predictive power on various school-related behaviors compared to narrowband scores involving aggregations at the lower level. We found the opposite: narrower measurements at the item level had better predictive power compared to higher-level aggregates (Figure 1). The reasons for these different results from past literature may have to do with the samples, specific outcomes being predicted, and methodological differences, as none of the previous studies used nonlinear machine learning models.
Further contrasts can be made to a recent study that predicted poor school social functioning using the same dataset and methodology [28]. Just two of the top 10 predictor items of school social functioning overlapped with our current study focusing on poor school enjoyment (YSR5, There is very little that I enjoy and YSR42, I would rather be alone than with others). The rest of the top 10 predictors of school social functioning were related to psychosomatic complaints and social problems, unlike our current study. This result of strong specificity at the item level contrasts with the weak ubiquity of broad constructs in past literature and suggests that school functioning may involve different mechanisms depending on whether it relates to social functioning, general feelings about school, or any other outcomes.
Our study complements existing theory-building approaches in adolescent psychopathology. One of the biggest insights from GWAS is that behavioral phenotypes are associated with large numbers of genetic markers, each with small effect sizes (also known as the fourth law of behavior genetics), but all of which additively contribute to making powerful combined predictions with medium-to-large effect sizes [48]. Such a situation of non-compactness, in which many small associations and explanations co-exist, may similarly be important for non-genetic studies of adolescent behavior. Furthermore, items with unique variances are highly underused because scale development generally discards items that do not strongly load (correlate) onto the same factor (construct) as other items. Our results thus likely underestimate the overall power of nuances at the level of single items (12). The research suggests the importance of developing alternative measurements and theories that are less overly broad with more specific descriptions and predictions in adolescent psychopathology. This may involve using a much wider universe of items, even though they may typically be excluded by traditional measures (e.g., internal reliability via Cronbach’s alpha). Our understanding of adolescent psychopathology is enriched by embracing both scale-level theoretical constructs as well as item-level nuances; there is much potential and power in using both in a complementary and comprehensive manner, depending on the goals and needs of the research.
Finding support for a many-dimensional view may expand our conceptualization of how we design and implement school interventions. Many current intervention efforts revolve around using broad theoretical constructs such as school belonging [49] or even broader ones still under the umbrella of positive education [50]. However, an alternative many-dimensional view suggests that interventions can be conceptualized at the most elementary level, identifying specific thoughts, feelings, and behaviors that have the strongest risk for the outcome, what we call risk nuances (cf. risk factors). Focusing on risk nuances carries immense utility, especially for specific behaviors, feelings, and thoughts that would be the target of intervention and prevention efforts. This is easily achieved using machine learning with explainable simple models followed by clustering to identify shared risk nuances for interventions in groups of individuals. To put it concretely, instead of relying solely on interventions aimed at the broad factor of depression for all adolescents that report lower school enjoyment, one can consider interventions with risk nuances. For example, targeting “I am afraid of going to school” for one group of adolescents and “I’m interested in almost everything that is new” (negatively related) for another group, as these are the shared risk nuances for two different clusters of adolescents with low school enjoyment (Figure 4). The former group may require interventions addressing negative beliefs about school, while the latter involves a scaffolded approach toward coping with novel school activities. However, targeting one risk nuance may not be sufficient, as our results suggest that each risk nuance plays a small, incremental role and that more risk nuances need to be addressed.
Furthermore, a multidimensional view may also affect how we evaluate school interventions. For example, when synthesizing evidence for interventions such as via meta-analysis, one may consider dispensing with higher-level constructs that average out effects since the specific thoughts, feelings, and behaviors themselves should be the focus of evidence evaluation instead of common constructs they are hypothesized to tap upon. In other words, a many-dimensional view may require a bottom-up way to organize the plethora of interventions and their evidence base by focusing on the elementary levels of human psychology, e.g., [51]. One idea is the use of network graphical representations for a potentially large number of effect sizes, something frequently used in the biomedical field for network meta-analysis [52]. Further research is necessary on how to better synthesize and summarize these disaggregated effect sizes, given the overwhelming number of different interventions when analyzed at the lowest levels.
In addition to conceptual and practical contributions, our study also expands the literature methodology-wise. Our approach may be reminiscent of person-centered analysis, in which individual items are used to form profiles of groups of individuals (28) in contrast to variable-centered analyses. However, the current study has important differences from previous traditional person-centered analysis. First, we used nonlinear machine learning classifiers followed by nonlinear dimensionality reduction in contrast to the typically linear models used in person-centered analysis. This approach allowed us to uncover potentially more complex and informative relationships among predictors and outcomes that may have been missed by previous profiling studies. Second, non-parametric approach of LIME was used to simulate data to identify important predictors specific to an individual, something missing from traditional person-centered analysis. Further, Mõttus and colleagues [8,12] have performed extensive analyses to demonstrate the power of the item, including the use of item residuals, which we broadly replicated. However, our analysis in Figure 3 went further to uncover more details as to how items may be driving good predictions. For example, when we randomly permuted item values while keeping construct scores, item-level prediction fell substantially, suggesting that a large portion of construct-level prediction was instead driven by individual item patterns. There was also reduced performance when using a smaller number of items and smaller sample sizes. Taken together, power from items is derived from having many of them combine in unique ways in large sample sizes.
The present study has numerous limitations. First, we are unable to draw causal conclusions given the observational nature of the data. Thus, we can only speculate about whether these identified risk nuances can indeed influence subsequent school enjoyment in a causal manner. There may also be residual confounding given that we did not analyze other covariates that may potentially affect the results, such as family background. Future research can consider additional background variables. Furthermore, our measures were all self-reported from a single timepoint. One possibility is the use of multi-informant reports to predict longitudinal outcomes more robustly. Finally, our sample was a school-based, non-clinical one. It is unclear if our results can be generalized to predict clinical cases. Further research is necessary to test whether a many-dimensional model is useful for clinical use in adolescent psychopathology.
5. Conclusions
We tested an emerging model of human functioning in research relevant to adolescent psychopathology. Using machine learning, we uncovered extensive evidence of items from behavioral and social-emotional problems that represented risk nuances for low school enjoyment. Our results strongly supported the many-dimensional model, with implications for how to complement current descriptive, predictive, and intervention efforts in adolescent psychopathology and, more broadly, in adolescence research.
Supplementary Materials
The following supporting information can be downloaded at: https://www.mdpi.com/article/10.3390/educsci13111103/s1, Table S1: Reporting items checklist for assessing machine learning methodology based on Senior et al. (2021) and Christodoulou et al. (2019); Table S2: List of PEQ, BSSS-C, PPI and YSR items used as predictors; Table S3: Descriptive statistics of individual predictor and outcome items.
Author Contributions
Conceptualization, F.A. and R.P.A.; methodology, F.A.; Writing—original draft, F.A.; Writing—review and editing, F.A. and R.P.A. All authors have read and agreed to the published version of the manuscript.
Funding
This research received no external funding.
Institutional Review Board Statement
The study was conducted in accordance with the Declaration of Helsinki, and approved by the Institutional Review Board of Nanyang Technological University (IRB-2014-07-035 and IRB-2021-532, approved in 2014 and 2021 respectively).
Informed Consent Statement
Written informed consent was obtained from each participant and their parents.
Data Availability Statement
Related data and analysis codes are available in the National Institute of Education Data Repository, https://doi.org/10.25340/R4/C0WCB7 (accessed on 27 September 2023).
Conflicts of Interest
The authors declare no conflict of interest.
References
- Ang, R.P.; Huan, V.S.; Chan, W.T.; Cheong, S.A.; Leaw, J.N. The role of delinquency, proactive aggression, psychopathy and behavioral school engagement in reported youth gang membership. J. Adolesc. 2015, 41, 148–156. [Google Scholar] [CrossRef] [PubMed]
- Yusof, N.; Oei, T.P.S.; Ang, R.P. Voices of adolescents on school engagement. Asia-Pac. Educ. Res. 2018, 27, 23–32. [Google Scholar] [CrossRef]
- Traub, R.E. Classical test theory in historical perspective. Educ. Meas. 1997, 16, 8–13. [Google Scholar] [CrossRef]
- Edwards, J.R.; Bagozzi, R.P. On the nature and direction of relationships between constructs and measures. Psychol. Methods 2000, 5, 155. [Google Scholar] [CrossRef] [PubMed]
- Cronbach, L.J.; Meehl, P.E. Construct validity in psychological tests. Psychol. Bull. 1955, 52, 281–302. [Google Scholar] [CrossRef] [PubMed]
- Moilanen, K.L.; Shaw, D.S.; Maxwell, K.L. Developmental cascades: Externalizing, internalizing, and academic competence from middle childhood to early adolescence. Dev. Psychopathol. 2010, 22, 635–653. [Google Scholar] [CrossRef] [PubMed]
- Kaufman, T.M.; Kretschmer, T.; Huitsing, G.; Veenstra, R. Caught in a vicious cycle? Explaining bidirectional spillover between parent-child relationships and peer victimization. Dev. Psychopathol. 2020, 32, 11–20. [Google Scholar] [CrossRef]
- Seeboth, A.; Mõttus, R. Successful explanations start with accurate descriptions: Questionnaire items as personality markers for more accurate predictions. Eur. J. Pers. 2018, 32, 186–201. [Google Scholar] [CrossRef]
- Mõttus, R.; Kandler, C.; Bleidorn, W.; Riemann, R.; McCrae, R.R. Personality traits below facets: The consensual validity, longitudinal stability, heritability, and utility of personality nuances. J. Pers. Soc. Psychol. 2017, 112, 474–490. [Google Scholar] [CrossRef]
- Hang, Y.; Speyer, L.G.; Haring, L.; Murray, A.L.; Mõttus, R. Investigating general and specific psychopathology factors with nuance-level personality traits. Personal. Ment. Health 2023, 17, 67–76. [Google Scholar] [CrossRef]
- McCrae, R.R. A more nuanced view of reliability: Specificity in the trait hierarchy. Pers. Soc. Psychol. Rev. 2015, 19, 97–112. [Google Scholar] [CrossRef]
- Mõttus, R.; Rozgonjuk, D. Development is in the details: Age differences in the Big Five domains, facets, and nuances. J. Pers. Soc. Psychol. 2021, 120, 1035–1048. [Google Scholar] [CrossRef]
- Revelle, W.; Dworak, E.M.; Condon, D.M. Exploring the persome: The power of the item in understanding personality structure. Personal. Individ. Differ. 2021, 169, 109905. [Google Scholar] [CrossRef]
- Weiss, A.; Gale, C.R.; Batty, G.D.; Deary, I.J. A questionnaire-wide association study of personality and mortality: The Vietnam Experience Study. J. Psychosom. Res. 2013, 74, 523–529. [Google Scholar] [CrossRef] [PubMed]
- Ozer, D.J.; Benet-Martinez, V. Personality and the prediction of consequential outcomes. Annu. Rev. Psychol. 2006, 57, 401–421. [Google Scholar] [CrossRef] [PubMed]
- Pantelis, C.; Papadimitriou, G.N.; Papiol, S.; Parkhomenko, E.; Pato, M.T.; Paunio, T.; Pejovic-Milovancevic, M.; Perkins, D.O.; Pietiläinen, O. Biological insights from 108 schizophrenia-associated genetic loci. Nature 2014, 511, 421–427. [Google Scholar]
- Lee, J.J.; Wedow, R.; Okbay, A.; Kong, E.; Maghzian, O.; Zacher, M.; Nguyen-Viet, T.A.; Bowers, P.; Sidorenko, J.; Karlsson Linnér, R. Gene discovery and polygenic prediction from a genome-wide association study of educational attainment in 1.1 million individuals. Nat. Genet. 2018, 50, 1112–1121. [Google Scholar] [CrossRef] [PubMed]
- Mõttus, R.; Bates, T.C.; Condon, D.M.; Mroczek, D.K.; Revelle, W.R. Leveraging a more nuanced view of personality: Narrow characteristics predict and explain variance in life outcomes. PsyArXiv 2022. [Google Scholar] [CrossRef]
- Freichel, R.; Pfirrmann, J.; de Jong, P.J.; Cousijn, J.; Franken, I.H.; Oldehinkel, A.; Veer, I.; Wiers, R. Executive functioning and the interplay of internalizing and externalizing symptoms–understanding developmental dynamics through panel network approaches. PsyArxiv 2023. [Google Scholar] [CrossRef]
- Branje, S. Development of parent–adolescent relationships: Conflict interactions as a mechanism of change. Child. Dev. Perspect. 2018, 12, 171–176. [Google Scholar] [CrossRef]
- Allen, A.N.; Kilgus, S.P.; Burns, M.K.; Hodgson, C. Surveillance of internalizing behaviors: A reliability and validity generalization study of universal screening evidence. Sch. Ment. Health 2019, 11, 194–209. [Google Scholar] [CrossRef]
- Cadman, T.; Hughes, A.; Wright, C.; Lopez-Lopez, J.A.; Morris, T.; Rice, F.; Smith, G.D.; Howe, L.D. The role of school enjoyment and connectedness in the association between depressive and externalising symptoms and academic attainment: Findings from a UK prospective cohort study. J. Affect. Disord. 2021, 295, 974–980. [Google Scholar] [CrossRef]
- Tze, V.M.; Daniels, L.M.; Klassen, R.M. Evaluating the relationship between boredom and academic outcomes: A meta-analysis. Educ. Psychol. Rev. 2016, 28, 119–144. [Google Scholar] [CrossRef]
- Morris, T.T.; Dorling, D.; Davies, N.M.; Davey Smith, G. Associations between school enjoyment at age 6 and later educational achievement: Evidence from a UK cohort study. npj Sci. Learn. 2021, 6, 18. [Google Scholar] [CrossRef]
- Baker, J.A. Teacher-student interaction in urban at-risk classrooms: Differential behavior, relationship quality, and student satisfaction with school. Elem. Sch. J. 1999, 100, 57–70. [Google Scholar] [CrossRef]
- Wasberg, A. Investigating Associations between Early Adolescents’ School Enjoyment, Perceived Social Support and Social Emotions in a Finnish High School: Results from an Explorative Study Based on Cross-Sectional and Intense Longitudinal Data from the REBOOT-project. Master’s Thesis, Åbo Akademi University, Vaasa, Finland, 2020. [Google Scholar]
- Ang, R.P.; Li, X.; Huan, V.S.; Liem, G.A.D.; Kang, T.; Wong, Q.; Yeo, J.Y. Profiles of antisocial behavior in school-based and at-risk adolescents in Singapore: A latent class analysis. Child. Psychiatry Hum. Dev. 2020, 51, 585–596. [Google Scholar] [CrossRef] [PubMed]
- Ali, F.; Ang, R.P. Predicting how well adolescents get along with peers and teachers: A machine learning approach. J. Youth Adolesc. 2022, 51, 1241–1256. [Google Scholar] [CrossRef] [PubMed]
- Achenbach, T.M.; Rescorla, L.A. Manual for the ASEBA School-Age Forms and Profiles; University of Vermont, Research Center for Children, Youth & Families: Burlington, VT, USA, 2001. [Google Scholar]
- Ivanova, M.Y.; Achenbach, T.M.; Dumenci, L.; Rescorla, L.A.; Almqvist, F.; Weintraub, S.; Bilenberg, N.; Bird, H.; Chen, W.J.; Dobrean, A. Testing the 8-syndrome structure of the child behavior checklist in 30 societies. J. Clin. Child. Adolesc. Psychol. 2007, 36, 405–417. [Google Scholar] [CrossRef]
- Chen, X.; Li, F.; Nydegger, L.; Gong, J.; Ren, Y.; Dinaj-Koci, V.; Sun, H.; Stanton, B. Brief sensation seeking scale for Chinese–cultural adaptation and psychometric assessment. Personal. Individ. Differ. 2013, 54, 604–609. [Google Scholar] [CrossRef] [PubMed]
- Clasen, D.R.; Brown, B.B. The multidimensionality of peer pressure in adolescence. J. Youth Adolesc. 1985, 14, 451–468. [Google Scholar] [CrossRef]
- Elkins, I.J.; McGue, M.; Iacono, W.G. Genetic and environmental influences on parent–son relationships: Evidence for increasing genetic influence during adolescence. Dev. Psychol. 1997, 33, 351–363. [Google Scholar] [CrossRef]
- Rothenberg, W.A.; Bizzego, A.; Esposito, G.; Lansford, J.E.; Al-Hassan, S.M.; Bacchini, D.; Bornstein, M.H.; Chang, L.; Deater-Deckard, K.; Di Giunta, L. Predicting Adolescent Mental Health Outcomes Across Cultures: A Machine Learning Approach. J. Youth Adolesc. 2023, 52, 1595–1619. [Google Scholar] [CrossRef]
- Senior, M.; Fanshawe, T.; Fazel, M.; Fazel, S. Prediction models for child and adolescent mental health: A systematic review of methodology and reporting in recent research. JCPP Adv. 2021, 1, e12034. [Google Scholar] [CrossRef]
- Christodoulou, E.; Ma, J.; Collins, G.S.; Steyerberg, E.W.; Verbakel, J.Y.; Van Calster, B. A systematic review shows no performance benefit of machine learning over logistic regression for clinical prediction models. J. Clin. Epidemiol. 2019, 110, 12–22. [Google Scholar] [CrossRef]
- Thurber, S.; Sheehan, W. Note on truncated T scores in discrepancy studies with the Child Behavior Checklist and Youth Self Report. Arch. Psychol. 2012, 2, 73–80. [Google Scholar]
- Chawla, N.V.; Bowyer, K.W.; Hall, L.O.; Kegelmeyer, W.P. SMOTE: Synthetic minority over-sampling technique. J. Artif. Intell. Res. 2002, 16, 321–357. [Google Scholar] [CrossRef]
- Urban, C.J.; Gates, K.M. Deep learning: A primer for psychologists. Psychol. Methods 2021, 26, 743–773. [Google Scholar] [CrossRef]
- Cunningham, P.; Delany, S.J. k-Nearest neighbour classifiers-A Tutorial. ACM Comput. Surv. (CSUR) 2021, 54, 1–25. [Google Scholar] [CrossRef]
- Yu, T.; Zhu, H. Hyper-parameter optimization: A review of algorithms and applications. arXiv 2020, arXiv:2003.05689. [Google Scholar]
- Ribeiro, M.T.; Singh, S.; Guestrin, C. “Why should I trust you?” Explaining the predictions of any classifier. In Proceedings of the 22nd ACM SIGKDD International Conference on Knowledge Discovery and Data Mining, San Francisco, CA, USA, 13–17 August 2016; pp. 1135–1144. [Google Scholar]
- Van der Maaten, L.; Hinton, G. Visualizing data using t-SNE. J. Mach. Learn. Res. 2008, 9, 2579–2605. [Google Scholar]
- Caliński, T.; Harabasz, J. A dendrite method for cluster analysis. Commun. Stat.-Theory Methods 1974, 3, 1–27. [Google Scholar] [CrossRef]
- Leibenluft, E. Irritability in children: What we know and what we need to learn. World Psychiatry 2017, 16, 100. [Google Scholar] [CrossRef]
- Ritakallio, M.; Koivisto, A.M.; von der Pahlen, B.; Pelkonen, M.; Marttunen, M.; Kaltiala-Heino, R. Continuity, comorbidity and longitudinal associations between depression and antisocial behaviour in middle adolescence: A 2-year prospective follow-up study. J. Adolesc. 2018, 31, 355–370. [Google Scholar] [CrossRef]
- Michelini, G.; Barch, D.M.; Tian, Y.; Watson, D.; Klein, D.N.; Kotov, R. Delineating and validating higher-order dimensions of psychopathology in the Adolescent Brain Cognitive Development (ABCD) study. Transl. Psychiatry 2019, 9, 261. [Google Scholar] [CrossRef]
- Chabris, C.F.; Lee, J.J.; Cesarini, D.; Benjamin, D.J.; Laibson, D.I. The fourth law of behavior genetics. Curr. Dir. Psychol. Sci. 2015, 24, 304–312. [Google Scholar] [CrossRef]
- Allen, K.-A.; Jamshidi, N.; Berger, E.; Reupert, A.; Wurf, G.; May, F. Impact of school-based interventions for building school belonging in adolescence: A systematic review. Educ. Psychol. Rev. 2022, 34, 229–257. [Google Scholar] [CrossRef]
- Waters, L. A review of school-based positive psychology interventions. Aust. Educ. Dev. Psychol. 2011, 28, 75–90. [Google Scholar] [CrossRef]
- Rusk, R.D.; Waters, L. A psycho-social system approach to well-being: Empirically deriving the five domains of positive functioning. J. Posit. Psychol. 2015, 10, 141–152. [Google Scholar] [CrossRef]
- Mavridis, D.; Giannatsi, M.; Cipriani, A.; Salanti, G. A primer on network meta-analysis with emphasis on mental health. BMJ Ment. Health 2015, 18, 40–46. [Google Scholar] [CrossRef]
Figure 1.
Classifiers’ prediction performance as measured by MCC on the test set. Each solid line (mean ± S.D.) is MCC based on the number of items per construct in the x-axis. Broken horizontal lines are the MCC at construct-level (9 summed scores representing 9 constructs). MCC and MCC2 are comparable to R and R2, respectively.

Figure 2.
Performance of an artificial neural network on the test set using residual variance on the full training set, residual variance on a subsample of the training set, or randomly permuted variance on the full training set.
Figure 2.
Performance of an artificial neural network on the test set using residual variance on the full training set, residual variance on a subsample of the training set, or randomly permuted variance on the full training set.

Figure 3.
Top 20 predictors of low school enjoyment. Each circle represents a predictor importance value as measured by the Gini impurity of the local decision tree for a single case (respondent) prediction in the test set. Predictors are ranked by average predictor importance. YSR5, There is very little that I enjoy; BSSSC1, I’m interested in almost everything that is new; YSR102, I don’t have much energy; YSR103, I am unhappy, sad, or depressed; YSR90, I swear or use dirty language; YSR35, I feel worthless; YSR30, I am afraid of going to school; YSR42, I would rather be alone than with others; YSR95, I have a hot temper; BSSSC6, Going on adventures always makes me happy; YSR21, I destroy things belonging to others; PPI2, How often do you feel the need to be part of a group in school?; YSR17, I daydream a lot; PPI1, How often do you feel the need to take the same co-curricular activities (CCAs) that your friends take? YSR37, I get in many fights; YSR4, I don’t finish things that I start; YSR61, My school work is poor; BSSSC8, To pursue new experiences and excitement, I can go against rules and regulations; PEQ8, My parent and I often get into arguments; YSR8, I have trouble concentrating or paying attention.

Figure 4.
Dimensionality reduction of the top 20 predictors of low school enjoyment. Refer to Table 1 for the list of shared risk nuances (the most common top predictors) for each cluster.
Figure 4.
Dimensionality reduction of the top 20 predictors of low school enjoyment. Refer to Table 1 for the list of shared risk nuances (the most common top predictors) for each cluster.


Table 1.
Shared risk nuances for each of the four clusters identified in Figure 4.
Table 1.
Shared risk nuances for each of the four clusters identified in Figure 4.
| Cluster 1 |
| BSSSC1, I’m interested in almost everything that is new (negatively related) PEQ11, My parent sometimes hits me in anger (negatively related) BSSSC6, Going on adventures always makes me happy (negatively related) |
| Cluster 2 |
| PPI2, How often do you feel the need to be part of a group in school? (negatively related) YSR90, I swear or use dirty language BSSSC1, I’m interested in almost everything that is new (negatively related) |
| Cluster 3 |
| YSR30, I am afraid of going to school YSR42, I would rather be alone than with others YSR61, My school work is poor |
| Cluster 4 |
| BSSSC6, Going on adventures always makes me happy (negatively related) YSR42, I would rather be alone than with others BSSSC8, To pursue new experiences and excitement, I can go against rules and regulations |
Disclaimer/Publisher’s Note: The statements, opinions and data contained in all publications are solely those of the individual author(s) and contributor(s) and not of MDPI and/or the editor(s). MDPI and/or the editor(s) disclaim responsibility for any injury to people or property resulting from any ideas, methods, instructions or products referred to in the content. |
© 2023 by the authors. Licensee MDPI, Basel, Switzerland. This article is an open access article distributed under the terms and conditions of the Creative Commons Attribution (CC BY) license (https://creativecommons.org/licenses/by/4.0/).
Share and Cite
MDPI and ACS Style
Ali, F.; Ang, R.P. Many-Dimensional Model of Adolescent School Enjoyment: A Test Using Machine Learning from Behavioral and Social-Emotional Problems. Educ. Sci. 2023, 13, 1103. https://doi.org/10.3390/educsci13111103
AMA Style
Ali F, Ang RP. Many-Dimensional Model of Adolescent School Enjoyment: A Test Using Machine Learning from Behavioral and Social-Emotional Problems. Education Sciences. 2023; 13(11):1103. https://doi.org/10.3390/educsci13111103
Chicago/Turabian StyleAli, Farhan, and Rebecca P. Ang. 2023. "Many-Dimensional Model of Adolescent School Enjoyment: A Test Using Machine Learning from Behavioral and Social-Emotional Problems" Education Sciences 13, no. 11: 1103. https://doi.org/10.3390/educsci13111103
Note that from the first issue of 2016, this journal uses article numbers instead of page numbers. See further details here.