Article

Equity Gaps in Literacy among Elementary School Students from Two Countries: The Negative Social Resonance Effect of Intersectional Disadvantage and the Dampening Effect of Learning Capital

1
Department of Educational Psychology and Research on Excellence, Friedrich Alexander University of Erlangen-Nuremberg, 90478 Nuremberg, Germany
2
Department of School Research, School Development, and Evaluation, University of Regensburg, 93053 Regensburg, Germany
*
Author to whom correspondence should be addressed.
Educ. Sci. 2023, 13(8), 827; https://doi.org/10.3390/educsci13080827
Submission received: 30 June 2023 / Revised: 7 August 2023 / Accepted: 10 August 2023 / Published: 12 August 2023

Abstract

:
Students may be members of multiple disadvantaged groups whose negative effects may reinforce each other (intersectionality). In two studies dealing with elementary students’ literacy skills, we examine one negative reinforcing effect and one dampening effect of intersectionality. In Study 1, we tested the negative social resonance effect of intersectional disadvantage, which means that disadvantages in achievement of intersecting disadvantaged groups would be stronger in social judgments of achievement than in objective measurement. This assumption was confirmed with a sample of 1926 German fourth-grade students. A MANOVA showed that the disadvantages in SES, migration background, and gender were cumulative. A path analysis revealed that the negative effects were larger in teachers’ performance assessments than in objective test performance in literacy. In Study 2, the negative social resonance effect of intersectional disadvantage was replicated with a sample of 777 students from Grades 4 and 5 in the United Arab Emirates. In addition, a dampening effect of learning capital was found. This effect was comparatively larger than the negative social resonance effect of intersectional disadvantage.

1. Introduction

Equity gaps refer to differences between groups that violate notions of equity [1]. They describe “the inequitable treatment of diverse groups” [2] (p. 377) such as social class [3], ethnic groups [4], or gender [5]. Equity gaps in education occur in many fields, such as reading, sciences, and mathematics [4,6,7], and take a variety of forms, including achievement gaps [8], excellence gaps [9,10], and opportunity gaps [11].
The design of equity-gap prevention and intervention is complicated by the phenomenon of intersectionality; that is, individuals can be disadvantaged across multiple gaps by possessing multiple characteristics [12,13]. The term “intersectionality” was introduced by the US legal scholar Kimberlé Crenshaw [14], who illustrated how the manifold discriminatory experiences black women had were distorted by a one-sided focus on a single category of social inequality such as either femaleness or blackness. However, the intersectionality of the multiple disadvantaged group memberships resulted in discrimination that was “greater than the sum of racism and sexism” [14] (p. 140). Consequently, the concept of intersectionality can be extended beyond the effects of multiple membership in disadvantaged groups. On one hand, an individual may be disadvantaged in multiple fields. For example, low socioeconomic status (SES) is associated with poorer performance in both language and math skills [15,16,17]. On the other hand, an individual may suffer from multiple equity gaps due to their group membership, and these equity gaps may be mutually reinforcing. For example, compared to female students, male students applying to universities were judged to be more competent (i.e., excellence gaps), and consequently male students received more offers to obtain a mentor (i.e., opportunity gaps) [18].
Further complicating the issue is that each equity gap has its own history and characteristic causal network [1]. It is less clear what the common factors across the intersectionality of disadvantaged groups, fields, and types of equity gaps are from an educational perspective. In addition, research on potential causal mechanisms in the emergence and modulation of equity gaps is also lacking. Therefore, our goal is to empirically examine two educational factors that may impact equity gaps among intersectionally disadvantaged groups: social judgments and students’ learning capital. In particular, we seek to establish two causal mechanisms to explain the emergence and potential widening of equity gaps using these factors. Namely, the negative social resonance effect of intersectional disadvantage, which further increases equity gaps that are evident in objective disadvantages via social judgments, and the dampening effect of learning capital on equity gaps, which may help to narrow the equity gap by increasing students’ learning capital. Identifying such factors and mechanisms is of great importance for developing prevention and intervention strategies.
In what follows, we will first introduce the phenomenon of intersectionality among the three affected groups we studied: gender, migration background, and SES. Next, we introduce the negative social resonance effect of intersectional disadvantage and the dampening effect of learning capital on equity gaps.

1.1. Gender

For a long time, research on gender equity focused on females. Important reasons for this were the low participation rates of females in science, technology, engineering, and mathematics (STEM) and their sometimes-poorer performance in mathematics and science [19,20,21,22]. Meanwhile, the participation rates in STEM are showing signs of improvement in some fields, but females are still less likely to opt for mathematics-intensive fields such as physics, computer science, or engineering [23,24,25,26]. In terms of performance in mathematics and science, girls are catching up with boys [22]. International comparison studies such as the Programme for International Student Assessment (PISA) show hardly any differences in the performance of boys and girls, although these vary between countries [20].
In the meantime, researchers also pay attention to the disadvantages of boys in the education system [27]. Boys on average perform worse on standardized reading tests, achieve lower grades, and are more likely to drop out of school prematurely than girls [28,29,30]. In particular, boys’ poorer performance in reading, which has been evident for nearly 50 years [31,32,33,34,35,36], has led to discussions about whether schools may not be appropriately designed for boys [37]. Although the achievement gaps between girls and boys have narrowed over the decades in some countries, PISA data indicate that gender gaps in reading are larger and more persistent than those in mathematics [7,38]. Achievement gaps for boys in reading also appear to persist throughout the educational career. International studies found that boys perform worse in reading than girls in the majority of countries in both the International Reading Literacy Study (PIRLS), which is administered at the fourth-grade level, and in the PISA, which is administered to 15-year-olds [39,40,41,42]. Longitudinal studies indicate that while achievement gaps in reading narrow somewhat over the course of an educational career, they do not dissipate. Robinson and Lubienski [27] showed in a longitudinal study from kindergarten to eighth grade that the achievement disadvantage in reading for boys narrowed somewhat over time but remained overall. On the contrary, the gender achievement gap for low-achieving students widened over time [27].

1.2. Migration Background

International studies point to the importance of migration background for achievement gaps. On average, students with a migration background are disadvantaged in the education system. They perform worse on standardized tests, are less likely to take advantage of institutionalized early intervention, are more likely to leave school without a certificate, and achieve lower levels of educational attainment [7,38,43,44,45,46,47,48,49]. However, the patterns of disadvantage for different groups of migrants vary in different educational systems. For instance, a Turkish migration background is found to be particularly disadvantageous in Belgium, Germany, the Netherlands, and Norway [50].
There are also performance differences in reading between students with a migration background and native students. In a quantitative synthesis of PISA and PIRLS data from 2000 to 2009, Andon et al. [44] found that students with a migration background performed worse in both assessments. Although the authors were able to find a slight decrease in the reading achievement gap over the period considered, the result should be interpreted with caution, as only cross-sectional data were examined [44].

1.3. Socioeconomic Status

The positive relationship between socioeconomic status (SES) and educational attainment is among the most widely documented findings in educational research [38,51,52,53,54]. Such a positive relationship between SES and educational attainment was found both in within-country and between-country comparisons [55,56]. Furthermore, the achievement gap between students of higher and lower SES families tends to widen as students advance in their education [57]. The variations from low to high correlations between SES and achievement in different domains found in meta-analyses [58,59] can be attributed to various factors such as the way SES was assessed but also to the moderating influences of various individual characteristics such as age, gender, and race/ethnicity, as well as environmental characteristics such as peers’ background or school factors (for an overview [55,58]). However, it is important to note that the correlations between SES and academic achievement persist even after controlling for various co-variates.
Moderate-to-high correlations also exist for SES and reading. Children from families with low SES show significantly lower reading skills than their peers from families with high SES [59,60,61,62,63]. However, no direct causal effects of SES on reading are evident. Instead, the relationships are often moderated by other variables [60]. For example, children with low-SES backgrounds are exposed to a less nurturing environment and are less likely to attend preschools, which leads to insufficient acquisition of important preliteracy skills such as phonological awareness and vocabulary [60].

1.4. The Intersection of Gender, Migration Background, and SES

As discussed above, numerous studies show achievement gaps in relation to gender, migration background, and SES. However, the intersection of two or three of these demographic variables seems to be especially disadvantageous for educational attainment [64,65]. Gender gaps in achievement tests are more pronounced among low-SES students [66,67]. Furthermore, male students with a migrant background reach lower educational qualifications and competence levels, with disadvantage patterns varying for different groups of migrants [68,69,70,71,72]. Similarly, students with a migrant background from low-SES families reach lower educational achievement, including linguistic and mathematical competences [73,74,75], and male students from a lower SES background reach lower educational qualifications and skill levels [76,77,78,79]. Furthermore, being male with a migrant background and low SES has an especially strong negative impact on educational outcomes [80,81,82]. In a descriptive analysis of the results of the UK national examinations taken by 16-year-olds from 1988 to 1995, Demack et al. [83] showed that boys with migration backgrounds and low SES consistently achieved the lowest scores and graduation rates. PISA data also indicate that male students with migration backgrounds and from lower SES families have the lowest reading skills [84,85]. Therefore, the intersection of being a male, having a migrant background, and low SES seems to be especially disadvantageous for educational attainment.

1.5. Negative Social Resonance Effect of Intersectional Disadvantage

Equity gaps in education have an objective component; that is, disadvantaged groups have restricted access to many resources and opportunities for developing their abilities [86,87]. To put this in the framework of the educational and learning capital model [88,89], disadvantaged groups have restricted access to educational capital (i.e., exogenous resources in their environment) such as didactic capital (e.g., adequate learning material at home and good schools) or infrastructural capital (e.g., libraries and museums; for more information concerning the five types of educational capital refer to Table 1).
In addition to these objective factors, various subjective factors are discussed as reasons for achievement gaps. One such subjective factor is social judgements of authority figures (e.g., teachers principals, and school counselors). Studies indicate that teachers’ subjective judgements of students’ performance can differ greatly from students’ performance assessed by standardized tests [90,91] and that these judgements tend to be influenced by students’ gender, migration background, and SES, independent of objectively measured performance [92,93,94]. In a longitudinal study from kindergarten to eighth grade, Robinson and Lubienski [27] found that teachers consistently rated girls higher than boys in both math and reading, even when boys’ performance on standardized tests was better than girls’ performance. Voyer and Voyer [95], in a meta-analysis based on 503 effect sizes drawn from 369 samples from elementary school to university, also found gender differences in teacher-assigned grades, moderated by nationality and racial composition of samples, among other factors. Similarly, Luedemann and Schwerdt [96] found that students with migration backgrounds and from comparatively low-SES families received lower grades from their teachers than the other classmates. However, these grade differences could not be explained by differences in PIRLS test scores or student intelligence.
These social judgments form an own reality that might superimpose on or add to objective realities [97]. Thus, objective disadvantages might resonate in social judgments that once again distort reality according to stereotypes and prejudices. For instance, children with a migration background often have inferior conditions to develop their reading skills [98,99]. But, besides this objective disadvantage, their teachers may judge their reading skills less favorably due to their migration status [100]. Thus, the objective disadvantages may be amplified by subjective biases in teachers’ social judgments. The associated low expectations of the disadvantaged may lead to even poorer performance, known as the Golem effect [101,102]. In other words, those who are already disadvantaged are likely to adapt to the low expectations of authority figures (e.g., teachers, principals, and school counselors), which puts them even further below their own ability to perform. This additional disadvantage of social resonating of objective disadvantages is likely to be found in the intersection of group memberships. We will henceforth address this effect as the negative social resonance effect of intersectional disadvantage. Specifically, it means that teachers, for example, would judge the abilities of intersectionally disadvantaged students even worse than their objective test performance. In summary, this effect may widen the equity gaps even more.

1.6. Dampening Effect of Learning Capital on Intersectionality

Intersectionality describes the phenomenon and consequences for students who belong to multiple disadvantaged groups and how they are denied access to resources and opportunities that are crucial for learning, development, and advancement. Although this does not necessarily mean that these students are generally denied access to resources or opportunities, their capacity to take advantage of the few opportunities and resources that are offered to them may also be limited. To put this in the framework of the educational and learning capital model [88,89], intersectionality refers to students who have limited educational capital (i.e., exogenous resources for learning in their environment; for more information concerning the five types of educational capital refer to Table 1) and lack the learning capital (i.e., endogenous resources within the individual; for more information concerning the five types of learning capital refer to Table 2) to exploit fully even the scarce resources and opportunities they have. In other words, these students not only lack adequate learning opportunities due to missing didactic or infrastructural capital but they in many cases also lack the motivation (telic learning capital) or learning strategies (episodic learning capital) to use the available resources (i.e., educational capital). However, there might also be a dampening effect of learning capital on intersectionality. In other words, students with more learning capital (e.g., higher motivation and better learning strategies) might be able to reduce the negative effects of missing or scarce resources and opportunities to a certain degree.
In the following we will use the example of gender gaps in reading to illustrate how learning and educational capital interact and how the availability of learning capital might have dampening effects on intersectionality. Boys formally have the same access as girls to reading instruction (didactic capital). But standardized educational curricula have a less advantageous effect on boys’ reading performance than on girls’ reading performance [103]. Van Hek et al. [103] explained this finding by suggesting that boys’ reading performance was more strongly influenced by whether they found the reading content interesting [104]. In highly standardized educational systems, this is often a problem for boys [105] because reading materials may not be well-matched to their interests and teachers do not have the flexibility to adjust reading materials accordingly. According to the education and learning capital model, in order to stimulate boys’ interest there should have been an adaptation to their interests, but this didactic education capital was not attended to. However, if a boy possesses more learning capital such as a higher interest in learning to read (i.e., telic learning capital) and effective learning strategies to stay focused even when interest is low (i.e., episodic learning capital), he is more likely to excel in the same learning environments of highly standardized reading instruction than boys with less learning capital. This is what we refer to as the dampening effect of learning capital on equity gaps. In the same sense, the dampening effect of learning capital also applies to intersectionality. Even for students who belong to multiple disadvantaged groups, those who have more learning capital may experience less severe disadvantages. The dampening effect of learning capital on intersectionality thus leads to a mitigation of equity gaps.

1.7. The Present Study

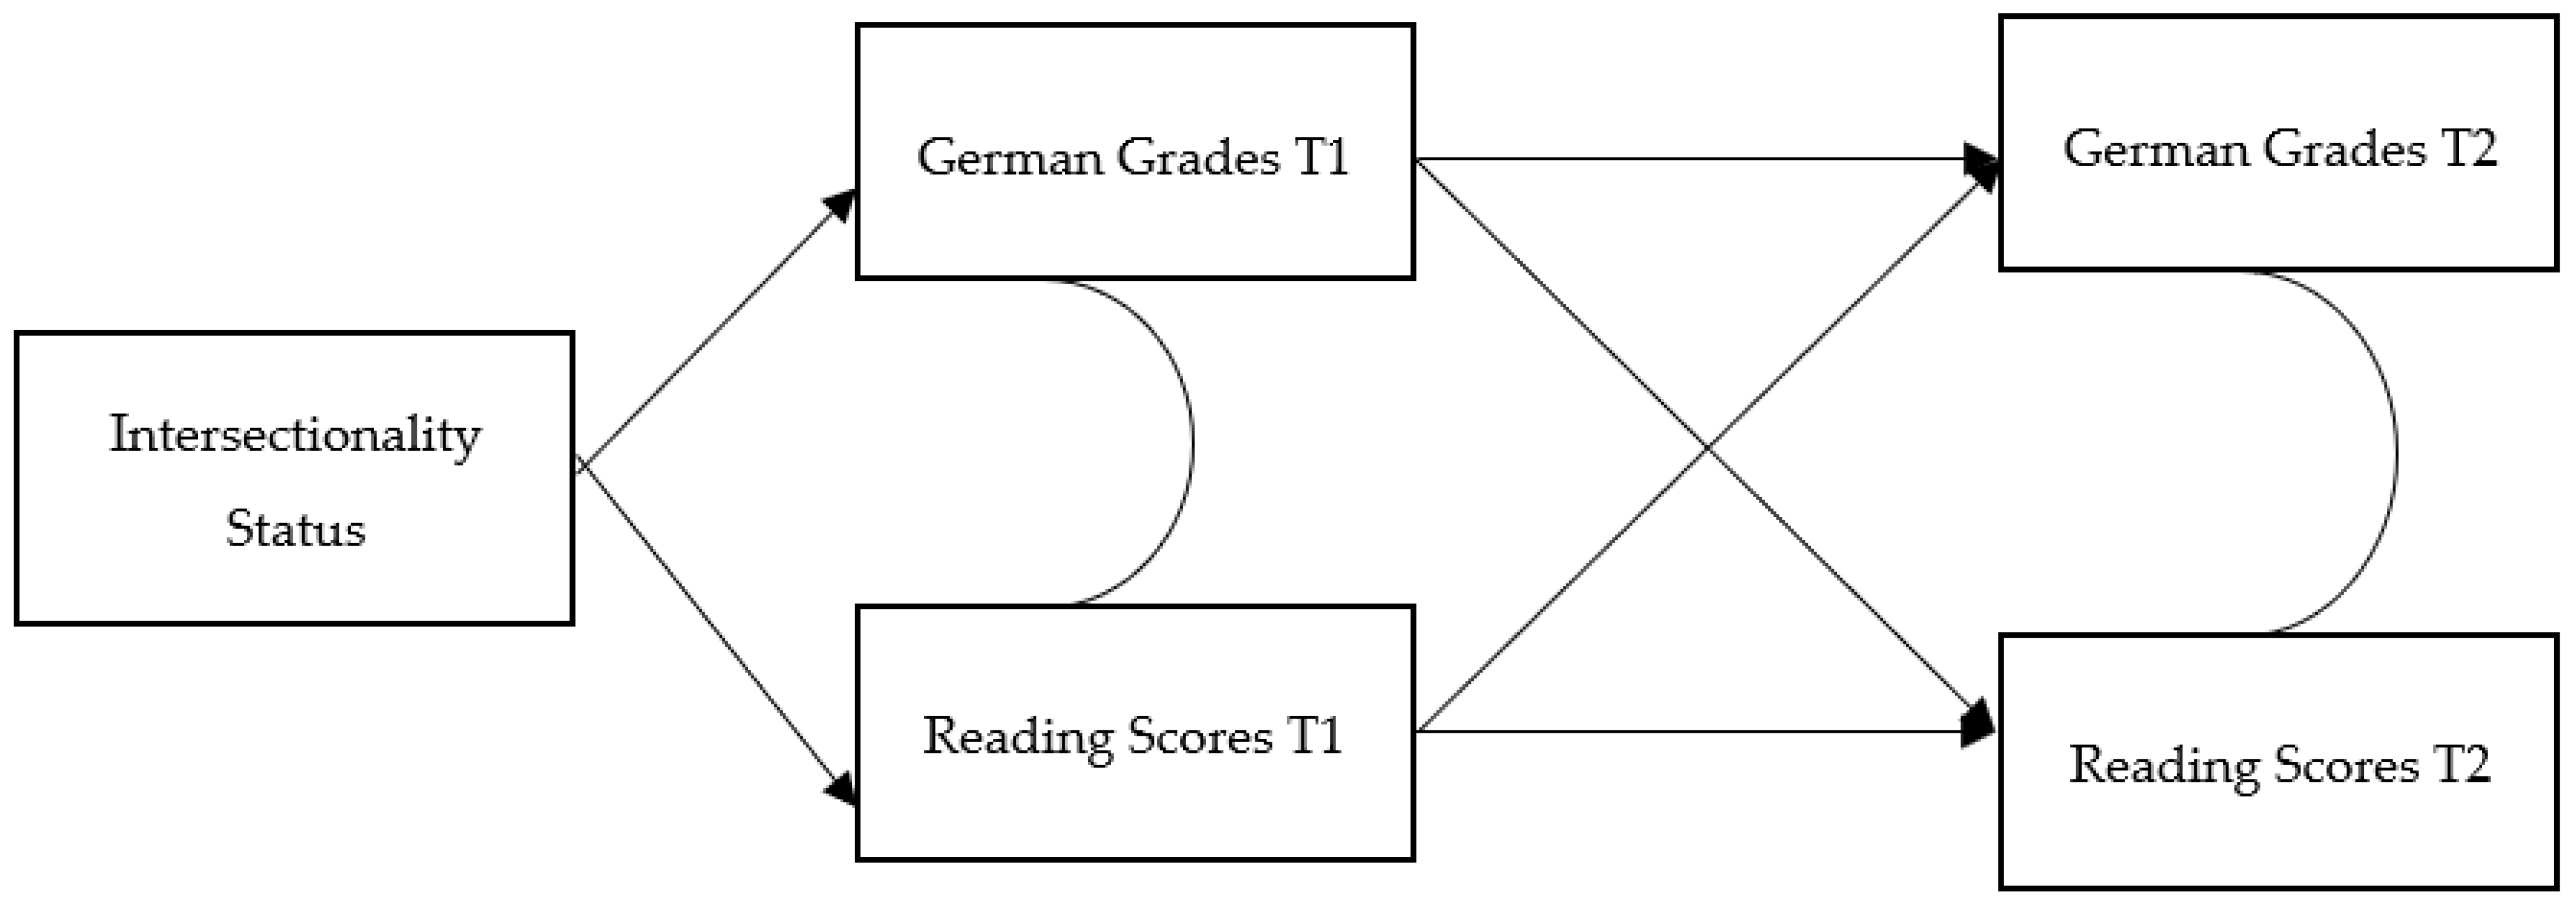
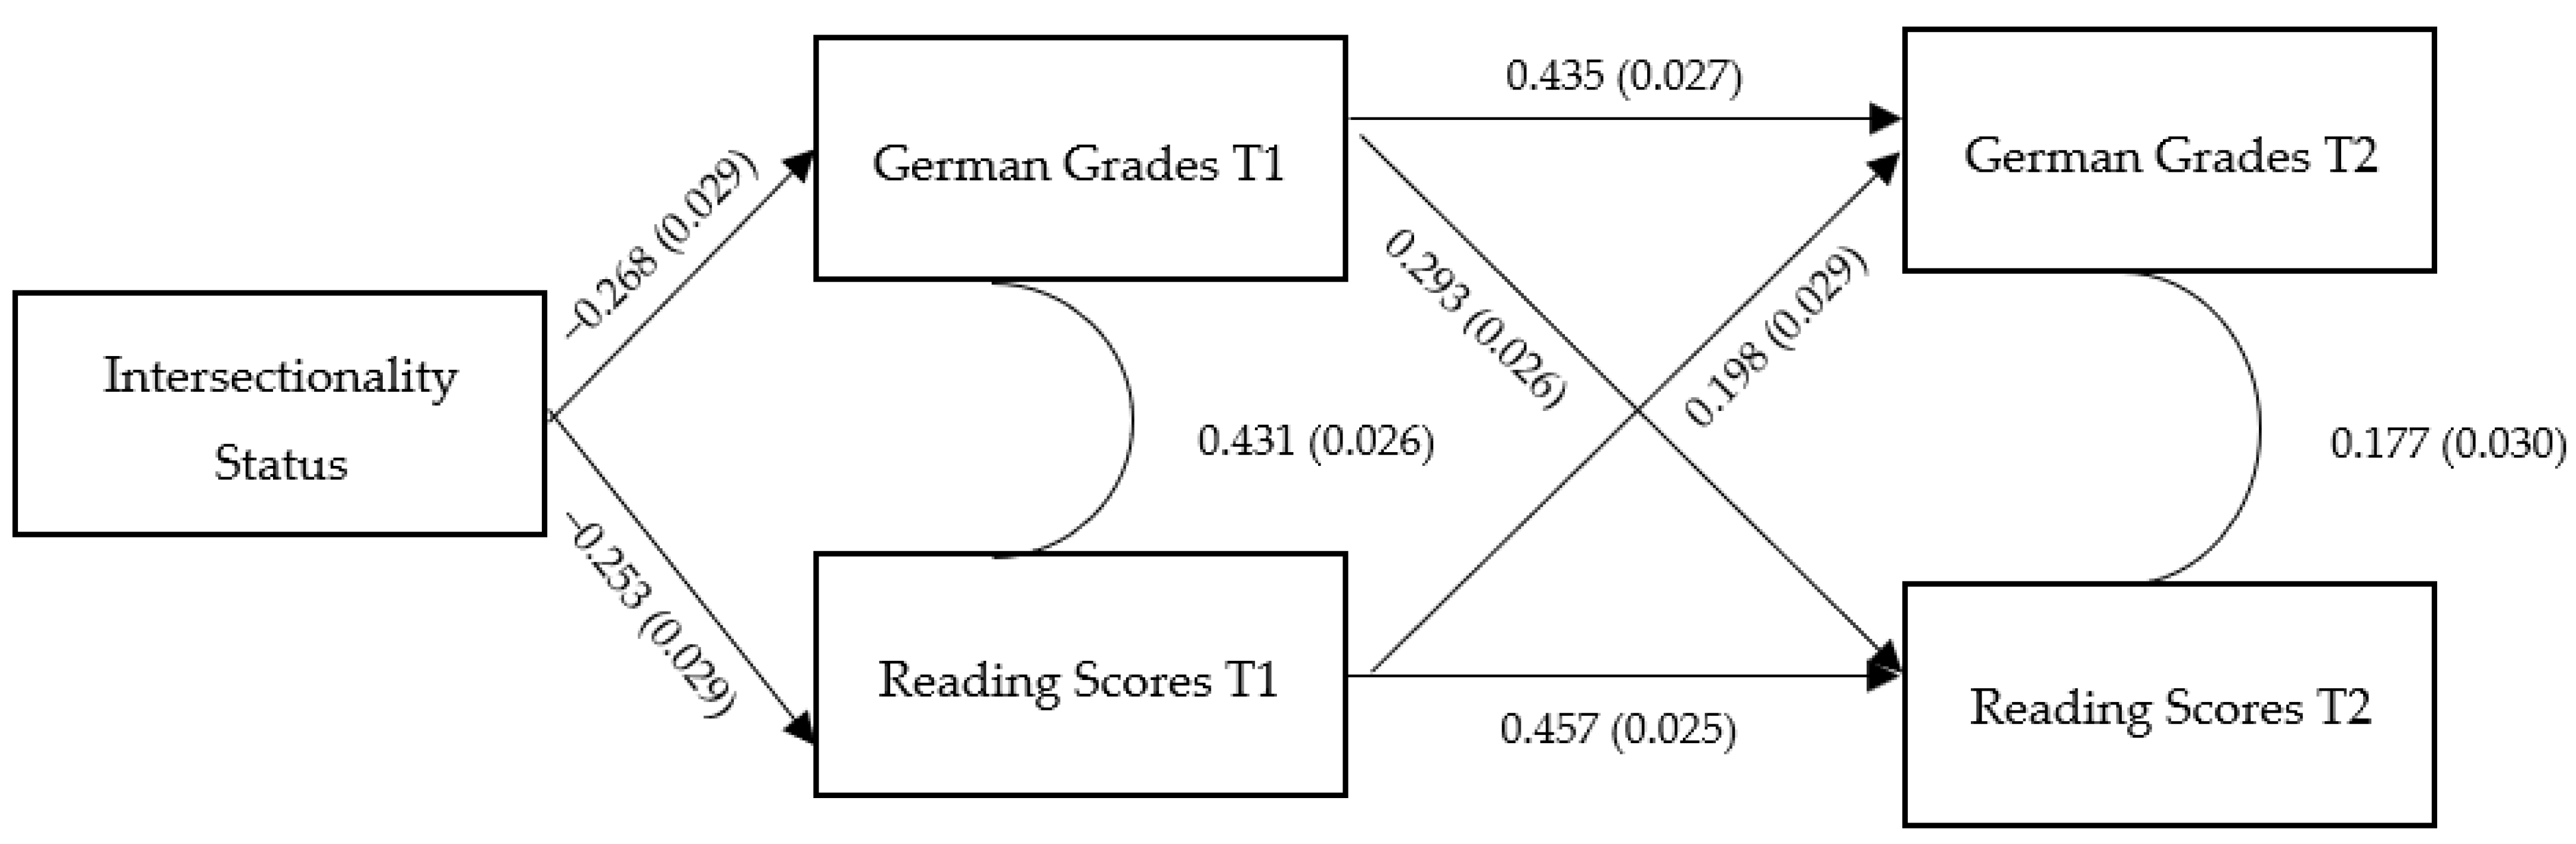
We undertook two studies of intersectionality and explored the two equity-gap modulating effects: the negative social resonance effect of intersectional disadvantage and the dampening effect of learning capital. Male students, students with migration backgrounds, and students with low SES typically exhibit lower achievement in their literacy skills [7]. Therefore, we assumed in both studies that, first, these equity gaps exist. Second, we expected the equity gaps to be more evident in scores based on teacher judgments of students’ competence of reading comprehension than in objective reading tests (the negative social resonance effect of intersectional disadvantage). We attempted to replicate this effect in Study 2 with a different sample from another culture. In addition, we investigated whether the possession of learning capital can mitigate equity gaps (the dampening effect of learning capital).

2. Study 1

2.1. Method

2.1.1. Participants

The sample examined in Study 1 was participants originally from a large-scale evaluation study conducted in Germany on the effectiveness of a self-regulated training intervention (see [106] for more detail). The original sample consisted of 1926 fourth-grade students in urban, suburban, and rural areas in southern Germany. The students were on average 9.9 years old (SD = 0.51), ranging from 7.8 years old to 11.8 years old. More than 95% of the sample fell between 9.3 and 10.6 years old at the time of data collection. The percentage of female students was about 50%. Among the participating students, about 22% had a migration background, which means either the student or at least one of their parents was born outside of Germany.

2.1.2. Study Design

We wanted to find out whether students’ intersectionality status predicted their (a) German grades, which reflected teachers’ subjective judgment of students’ performance in the subject German, and (b) reading comprehension scores, which reflected students’ actual performance in a standardized reading comprehension test. Furthermore, we were interested in the relationship between the subjective measure (i.e., teacher’s judgment) and the objective measure (i.e., students’ test scores). We wanted to test whether teachers’ subjective judgment (German grades at T1) was a stronger predictor of students’ later reading comprehension (test scores at T2), or whether students’ reading comprehension (test scores at T1) was a stronger predictor of teachers’ later judgment of students’ performance (German grades at T2). The two time points were three months apart. Therefore, we specified a path model, depicted in Figure 1, to be tested.

2.1.3. Variables

Intersectionality Scores. Intersectionality scores were composite scores generated from three demographic variables: gender, migration background, and a proxy measure of socioeconomic status (SES). For each demographic variable, we assigned disadvantage scores for each group. Specifically, with respect to gender, we assigned 1 for male students and 0 for female students. With respect to migration background, we assigned 1 for students with a migration background and 0 for students without a migration background. With respect to SES, we used the number of books at home as a proxy for SES. The number of books at home was measured using a categorical variable in the original study: none or very few (0–10), enough to fill a shelf (11–25), enough to fill two shelves (26–100), enough to fill two shelves (101–200), and enough to fill three or more shelves (over 200). For the present study, we combined the first two categories because very few participants reported none or very few books at home. Next, we assigned disadvantage scores between 0 and 1 for the proxy SES. We assigned 1 for students who reported having 25 or fewer books at home, 0.67 for those who had 26 to 100 books, 0.33 for those who had 101 to 200 books, and 0 for students who had more than 200 books at home. Then, we computed the intersectionality scores by summing up the disadvantage scores for gender, migration background, and SES. Therefore, the intersectionality scores ranged from 0 to 3, and a higher intersectionality score indicated a more disadvantaged status in terms of gender, migration background, and SES.
German Grades. German grades were teacher-assigned grades of students’ performance in the subject of German. The German grading scale ranges from 1 (very good) to 6 (insufficient). There were two time points of German grades (at T1 and T2) included in the current analysis. The two time points were twelve weeks apart. The grades were reversely coded for the analysis.
Reading Comprehension Scores. Reading comprehension was also assessed at T1 and T2. At T1, reading comprehension was measured using the text comprehension section of Ein Lesetest für Erst- bis Sechstklässler (ELFE 1–6) [Reading Test for First to Sixth Graders], by Lenhard and Schneider [107]. In this test, students were asked to read 13 short texts (15–56 words) in seven minutes and answer 20 multiple-choice questions. The reading comprehension scores at T1 ranged from 0 to 20.
At T2, reading comprehension was assessed using a different test, Hamburger Lesetest für 3. und 4. Klassen (HAMLET 3–4) [Hamburg Reading Comprehension Test for Grades 3 and 4] by Lehmann et al. [108]. This change was due to the unexpected ceiling effects found at T1 using the ELFE test (see [106] for more detail). The HAMLET test was more difficult than the ELFE test used at T1, but it was designed to assess similar aspects of reading and text comprehension. The HAMLET test consisted of 10 texts, ranging from 57 to 592 words. Students were asked to answer four multiple-choice questions following each text. The reading comprehension scores of the HAMLET test ranged from 0 to 40.

2.2. Results

2.2.1. Preliminary Analysis

Prior to creating composite intersectionality scores from the three demographic variables (i.e., gender, migration background, and SES), we first ran a preliminary analysis—a three-way factorial MANOVA—to assess whether all three of the demographic variables were indeed associated with the outcome variables (i.e., German grades and reading comprehension scores at T1 and T2). Table 3 provides the means and standard deviations of the outcome variables for each demographic group.
The three-way factorial MANOVA revealed significant main effects of gender (F = 4.041, p = 0.003), migration background (F = 7.215, p < 0.001), and books at home, which was used as a proxy measure for SES (F = 7.119, p = 0.003). In addition, there was a significant interaction effect of migration background and SES (F = 2.083, p = 0.015). Therefore, we proceeded to create composite intersectionality scores that reflected the students’ disadvantaged status in terms of gender, migration background, and SES. Table 4 shows the main and interaction effects of the demographic variables for each outcome variable.

2.2.2. Path Analysis

Path analyses, using the Mplus 8.0 software [109], were conducted to test the model depicted in Figure 1. The sample size for testing the model was 1,018, which was sufficient to meet the 20:1 ratio of a sample size to the number of estimated paths to ensure reliable results [110].
Table 5 provides the descriptive statistics for measured variables. The model fit of the specified path model was very good: RMSEA = 0.079, CFI = 0.990, and TLI = 0.952. The proportion of total variation of German grades at T2 explained by intersectionality, German grades at T1, and reading comprehension scores at T1 was 0.309. The proportion of total variation of reading comprehension scores at T2 explained by intersectionality, German grades at T1, and reading comprehension scores at T1 was 0.421. Standardized path coefficients are reported in Table 6 and marked above each path in Figure 2. The size of the path coefficients indicates the relative strength of the relationships between the variables.
As shown in Figure 2, intersectionality scores negatively predicted German grades at T1 and reading comprehension scores at T1. The more disadvantaged groups (e.g., male, migration background, or low SES) a student belonged to, the lower the German grades they received, and the worse they performed on the reading comprehension test. Furthermore, intersectionality status had a slightly larger negative effect on German grades at T1 compared to its effect on reading comprehension scores at T1. In other words, intersectionality status affected teachers’ subjective judgment of students’ German performance more negatively than students’ actual performance in a German reading comprehension test.
Moreover, German grades at T1 predicted reading comprehension scores at T2, and reading comprehension scores at T1 also predicted German grades at T2. Comparing these two coefficients, German grades at T1 had a larger effect on reading scores at T2. In other words, teachers’ judgment of students’ German performance at T1 was a stronger prediction of students’ performance on the reading comprehension test at T2 than the other way around.

2.3. Summary of Study 1

In Study 1, we examined intersectional disadvantages of gender (male), migration background, and low SES for literacy in a sample of German fourth-grade students. Students’ literacy was assessed in two ways: objectively through reading comprehension tests and subjectively through their teacher-assigned German grades. We confirmed that intersectionality (i.e., higher intersectionality index scores) resulted in worse reading comprehension performance on the tests and lower German grades. Furthermore, we tested and validated the negative social resonance effect of intersectional disadvantage in that the equity gaps were more evident in German grades that were based on teacher judgments of students’ competence of reading comprehension than in the scores of objective reading tests.

3. Study 2

3.1. Method

3.1.1. Participants

The sample examined in Study 2 was a sub-sample of participants from a large-scale Gifted Identification Kit (GIK 4–6; Ref. [111]) validation study (see [112] for more detail). The current sample consisted of 777 students from Grades 4 and 5 in the United Arab Emirates (UAE). The students were on average 9.3 years old (SD = 0.83), ranging from 8 years old to 13 years old. About 90% of the sample fell between 9 and 10 years old at the time of data collection. The percentage of female students was 57.3%. Among the students, about 14% had a migration background, which means either the student or at least one of their parents was born outside of the UAE.

3.1.2. Study Design

Following Study 1, we hypothesized that students’ intersectionality scores (reflecting the degree to which they belonged to disadvantaged groups in terms of gender, migration background, and SES) would negatively predict their Arabic grades and reading comprehension scores. Furthermore, intersectionality would have a larger negative effect on teachers’ judgment of students’ performance (measured by Arabic grades) than on the actual reading comprehension test scores. In addition, we wanted to examine whether students’ learning capital (i.e., resources within the individual that support learning) served as a protective factor that positively influenced Arabic grades and reading comprehension. If so, we were interested in which influence was greater: the negative effect of intersectionality or the positive effect of learning capital?
To examine the direct and indirect effects of intersectionality and learning capital on students’ Arabic grades and reading comprehension scores, we specified a path model, as depicted in Figure 3.

3.1.3. Variables

Intersectionality Scores. Intersectionality scores were composite scores generated from three demographic variables: gender, migration background, and a proxy measure of socioeconomic status (SES). For each demographic variable, we assigned disadvantage scores for each group. Specifically, with respect to gender, we assigned 0 for female participants and 1 for male participants. With respect to migration background, we assigned 0 for students without a migration background and 1 for those with a migration background. With respect to SES, we used teachers’ assessment of students’ economic educational capital as a proxy for SES, as the economic educational capital referred to “wealth, possession, money, or valuables that can be invested in the initiation and maintenance of one’s educational and learning processes” [113] (p. 27). Two items were used to assess students’ economic capital: (1) the student’s parents invest additional money for specific additional learning experiences for their child (e.g., tutors for homework, learning software, and additional books); and (2) the student’s family is willing to make substantial financial investments in their child’s education. Teachers were asked to rate each item as not at all true (0), somewhat true (1), or absolutely true (2) for each student. The average score of the two economic educational capital items was used as a proxy SES score. We then converted the score to be in the range of 0–1 and reversed it to create the composite intersectionality score, which was the sum of the disadvantage scores for gender, migration background, and SES. Therefore, the intersectionality scores ranged from 0 to 3, and a higher intersectionality score indicated a more disadvantaged status in terms of gender, migration background, and SES.
Learning Capital Scores. To assess students’ resources for learning, we used teacher-rated learning capital scores from the GIK teacher checklist. The GIK teacher checklist contained 10 items for learning capital. A sample item was: “The student works in a highly concentrated manner and is not easily distracted.” Teachers were asked to rate each item as not at all true (0), somewhat true (1), or absolutely true (2) for each student. The learning capital scale was validated, showing good reliability with Cronbach’s α = 0.88 [114]. The average score of the 10 items was the student’s learning capital score.
Arabic Grades. Arabic grades were teacher-assigned grades for students’ performance in the subject of Arabic. The grades ranged from 0 to 100.
Reading Comprehension Scores. Reading comprehension scores were computed from two verbal ability tests in Arabic. In the first test, students were given 50 short sentences. Each sentence contained a word pair in parentheses. Students were instructed to cross out the incorrect word in order to complete the sentence in a meaningful way. Students received one point for each correctly answered item (i.e., if they crossed out the correct word). The first test scores ranged from 0 to 50. In the second test, students read two texts and answered 40 true–false reading comprehension questions. The second test scores ranged from 0 to 40. The final reading comprehension scores were the sum of the two test scores, ranging from 0 to 90.

3.2. Results

Descriptive statistics for measured variables are displayed in Table 7. The hypothesized path model was just identified with zero degrees of freedom; therefore, the model fit cannot be assessed in this case. The proportion of total variation of Arabic grades explained by intersectionality and learning capital was 0.301. The proportion of total variation of reading comprehension scores explained by the full model was 0.126. Standardized path coefficients are reported in Table 8 and marked above each path in Figure 4. The size of the path coefficients shows the relative strength of the relationships between the variables.
Intersectionality status negatively predicted Arabic grades and reading comprehension scores, as hypothesized. In other words, the higher a student’s intersectionality score was, the lower the Arabic grades and reading comprehension scores they received. The negative effect of intersectionality status on Arabic grades (teachers’ subjective judgment) was larger than its effect on reading comprehension scores. On the other hand, learning capital positively predicted both Arabic grades and reading comprehension scores. Students who possessed more resources conducive to learning within themselves (e.g., ability to focus and a healthy physical and mental status) received higher Arabic grades and reading comprehension scores. Moreover, the positive effects of learning capital on the achievement variables were larger than the negative effects of intersectionality on the achievement variables.

3.3. Summary of Study 2

In Study 2, we examined intersectional disadvantages of gender, migration background, and SES for reading comprehension in a sample of fourth-grade and fifth-grade students from the UAE. Similar to Study 1, students’ reading comprehension was assessed in two ways: objectively through reading comprehension tests and subjectively through their teacher-assigned Arabic grades. We attempted to replicate the findings of Study 1 with a different sample from another culture and confirmed that intersectionality (i.e., higher intersectionality index scores) resulted in worse reading comprehension scores and lower Arabic grades. In addition, we investigated whether the possession of learning capital might mitigate equity gaps and found that the positive effects of learning capital on both outcome variables were larger than the negative effects of intersectionality on these variables. Therefore, the dampening effect of learning capital on intersectionality was supported.

4. Discussion

Equity gaps in education are arguably the most central of all educational problems in a world committed to human rights. Numerous research studies have been conducted on the topic [1,115,116,117]. They have shown equally the universality as well as the multifaceted nature and complexity of this challenge of modern societies. Equity gaps in education occur in many forms, in all domains studied so far, and among a variety of different groups [3,4,5,6,8,9,11]. To make matters worse, they are localized at different scale levels. For example, many gender gaps can ultimately be traced back to patriarchal social structures [118,119,120] and ethnicity gaps ultimately to racism [121,122]. But changing them is beyond the direct reach of the educational system. This is not to say that the education system should not work to overcome outmoded social and cultural structures, but this requires a whole-of-society commitment that extends beyond the education system. To do so, coalitions and alliances must be formed. In this paper, we focus on the phenomenon of intersectionality and on two causal mechanisms that clearly fall within the purview of the educational system, even though their distal causes may lie largely outside the educational system.
We conducted two studies in two countries that differ in many ways. Germany is a typical WEIRD (Western, educated, industrialized, rich, and democratic) country [123] with a strong educational tradition, whereas the UAE is an emerging Arab nation that has made impressive progress in recent years in establishing a modern education system [124]. In the last assessments in PISA and the Trends in International Mathematics and Science Study (TIMSS), Germany scored 498 points compared to an average of 487 points in the Organization for Economic Cooperation and Development (OECD) countries on PISA 2018 reading literacy, while the UAE scored 432 points [7]. On TIMSS 2019, Germany scored 521 and 518 points on mathematics and science (both Grade 4), respectively, above the scale center point, whereas the UAE scored 481 and 473 points, respectively, below the scale center point [125]. In TheGlobalEconomy.com’s human rights and rule of law index [126], the average among 177 countries was 5.37 index points (0 = high, 10 = low). Germany ranked among the top nations with a score of 0.80, while the UAE ranked among the bottom 35% with a score of 7.1 [126]. Despite the diversity of countries, the expected equity gaps between boys and girls, between students with and without a migrant background, and between students with lower and higher SES were found in both samples. In some cases, group memberships interacted. This makes the development of prevention and intervention strategies more complex and increases the need to identify common causal mechanisms in the emergence of equity gaps.
The main objective of the two studies was to investigate two causal mechanisms that can modulate equity gaps. The first causal mechanism, the negative social resonance effect of intersectional disadvantage, further increases equity gaps that were already evident in objective disadvantages via social judgments. Those affected by equity gaps experience multiple disadvantages, including exclusions from learning opportunities and less access to learning resources [1]. A crucial consequence is poorer learning outcomes [127,128]. This is bad enough; however, when access to learning resources and further learning opportunities is contingent on social judgments, further disadvantages can be imposed. When persons making these judgments are themselves a part of the educational system, the educational system has a responsibility to address and eliminate the source of disadvantage. In the present study, we were able to show that students from certain groups (male, migration background, and low SES) were already at a significant disadvantage when it comes to reading comprehension, as measured by test performance. The negative social resonance effect of intersectional disadvantage exacerbated the equity gaps: the equity gaps were even more pronounced in teachers’ judgments, as reflected in students’ grades in the subject. Our findings are consistent with other research. For instance, teachers make career recommendations [129] according to disadvantaging stereotypes despite objectively equal student achievement. This is a source of equity gaps that appears avoidable. Teacher preparation and training can help reduce teachers’ bias, and providing teachers with more objective diagnostic tools is also critical [130,131,132]. It is also important to consider how we measure students’ reading comprehension (e.g., multiple-choice tests, retelling what they read, and writing a summary), as there are also equity gaps in the ways we assess students from varying backgrounds.
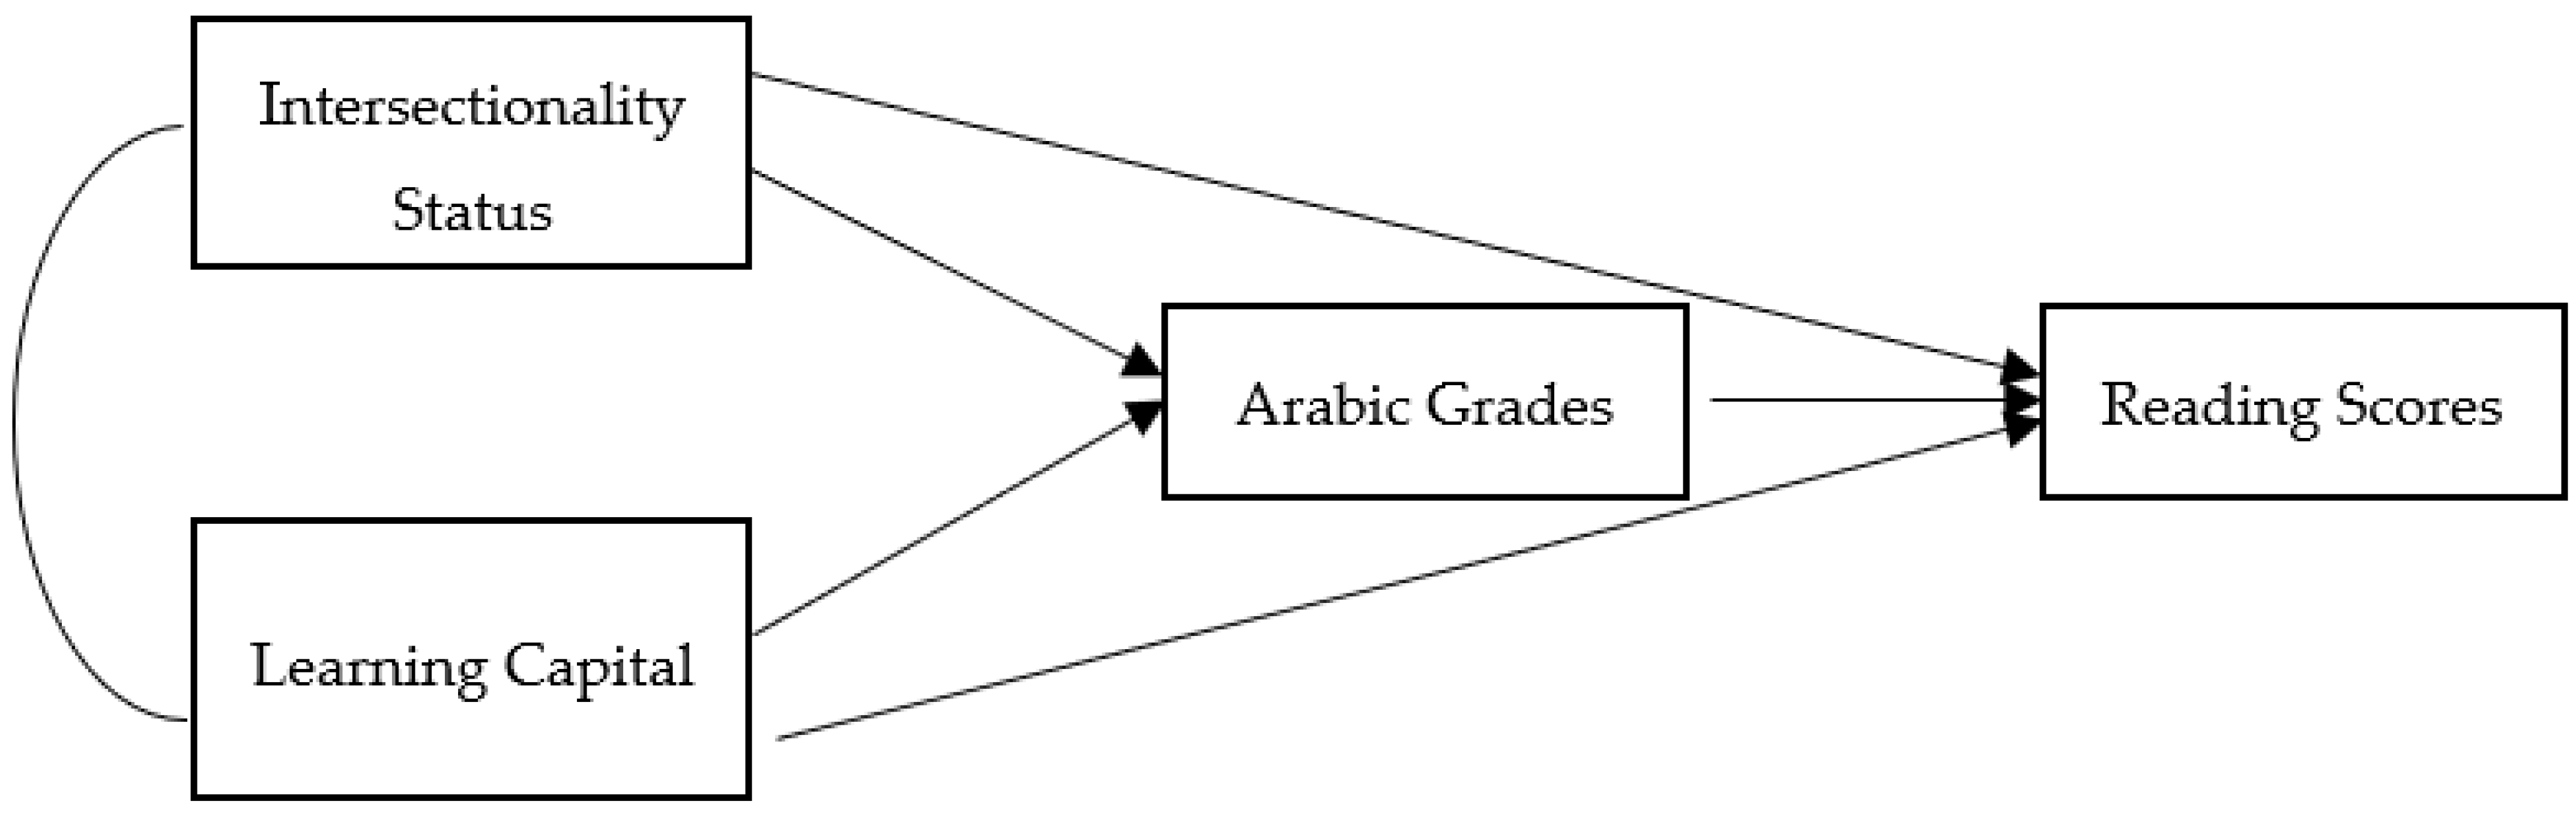
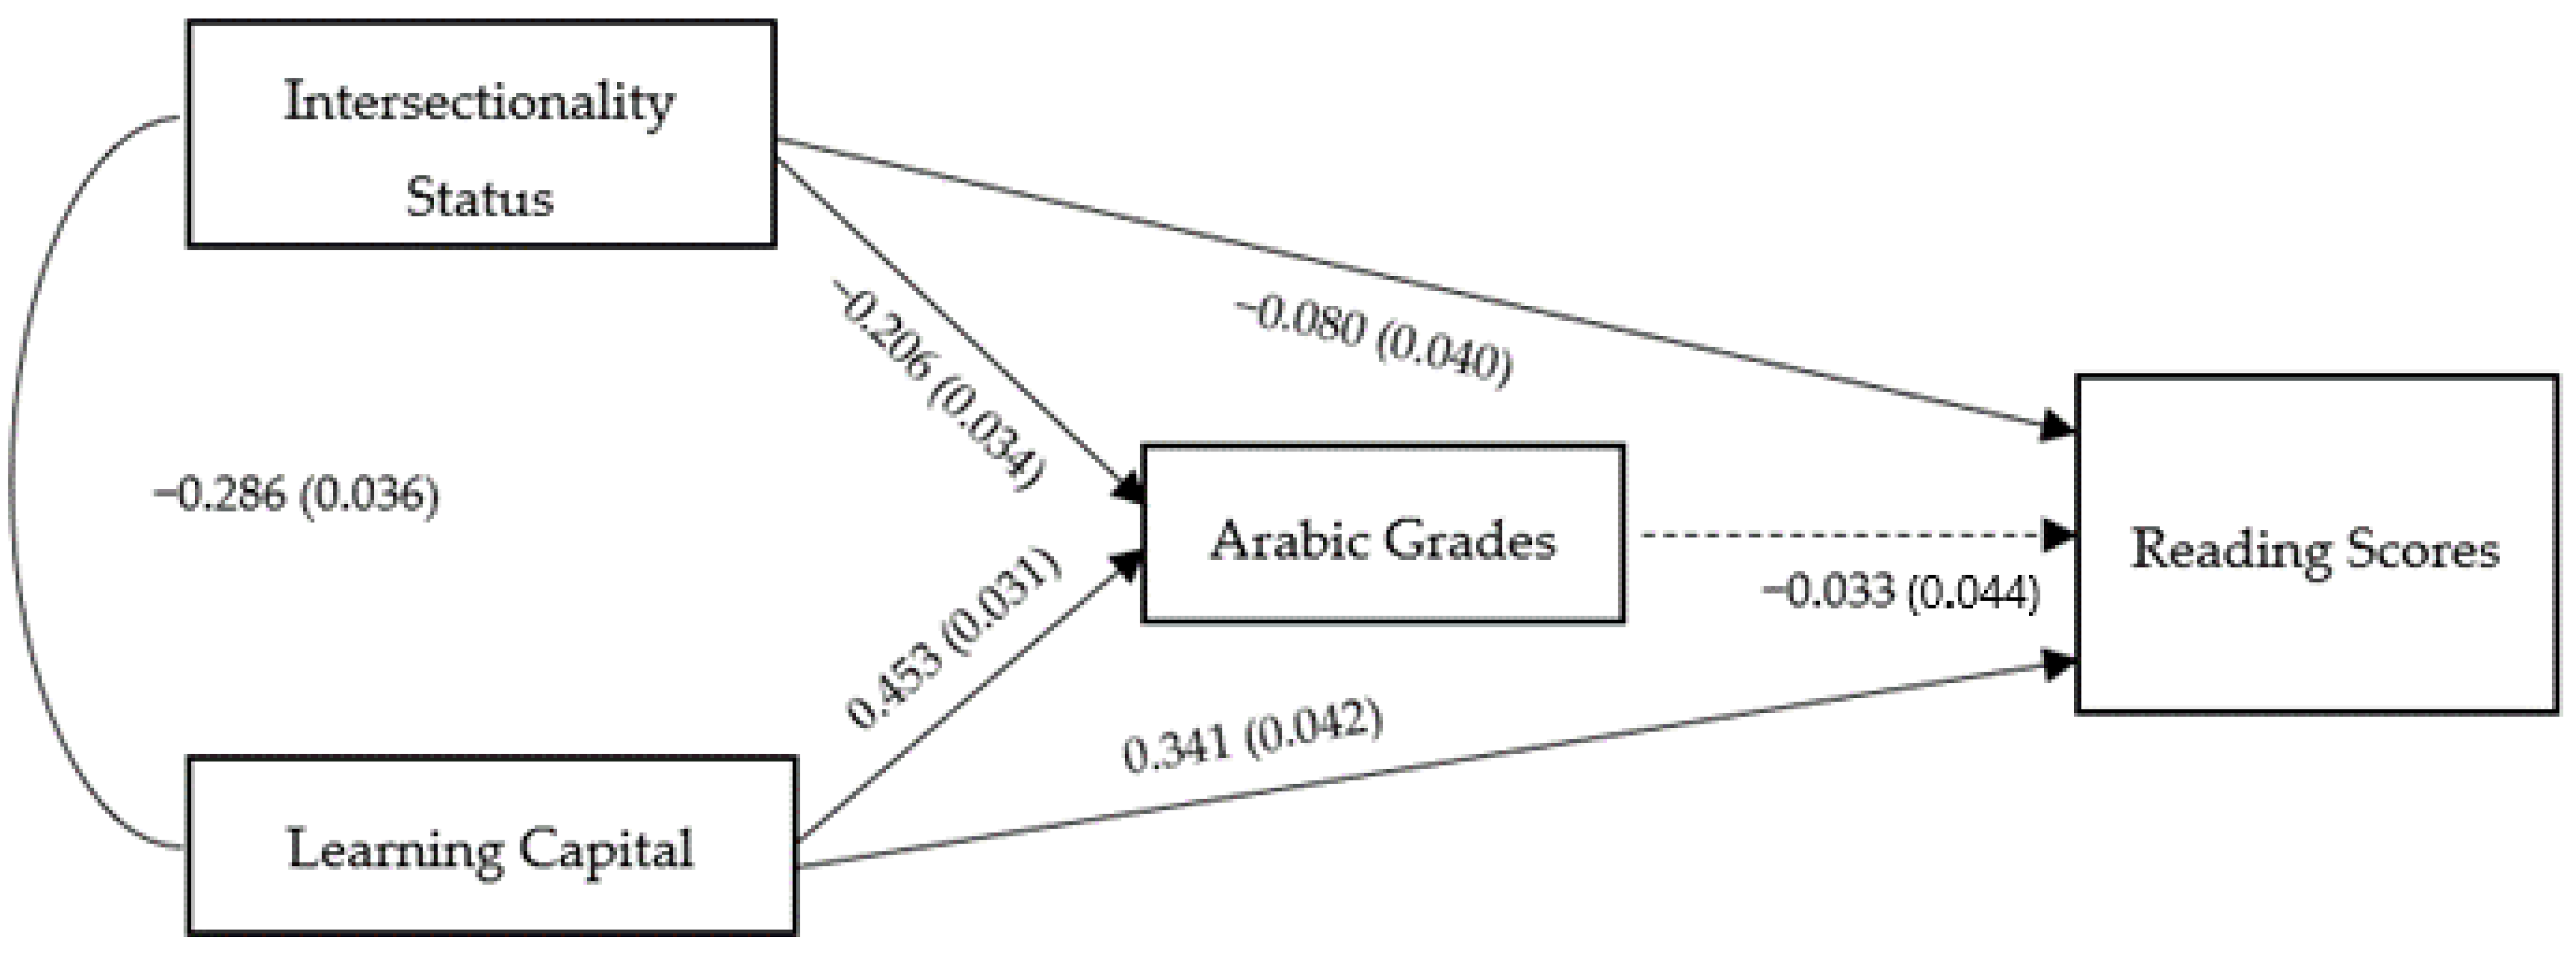
The second causal mechanism we examined was the dampening effect of learning capital. The framework of educational and learning capital illustrates that equity gaps are due to both exogenous and endogenous factors. Those affected have less educational capital; that is, access to exogenous resources such as materials, devices, and institutions for learning. Furthermore, they lack learning capital (i.e., endogenous resources) to take advantage of the limited exogenous resources they have [133]. This results in a double responsibility for modern societies and their specialized subsystems (educational, political, legal, economic, and cultural). They have to ensure that all those concerned are (or can be) equally provided with educational capital. This is not even close to being achieved in any society in the world, as the many equity gaps show. The second responsibility is to ensure that everyone can draw equal benefit from educational capital. We addressed this obligation in Study 2. The results show that students can capitalize from the same amount of educational capital depending on the amount of learning capital available to them. This has enormous educational consequences and requires a strategic rethink.
Equity gaps have often been associated with underprivileged groups having less access to resources and opportunities, and closing these gaps helps restore equity [134,135]. However, the dampening effect of learning capital found in Study 2 shows that the strategy of equal opportunities and resources runs up against an obvious limit defined by differential learning capital possession. Rather, in the reality of education, there is a reasonable possibility that equity gaps are steadily widening in line with a Matthew effect [136]. Indeed, at its core, the Matthew effect is defined in such a way that some subgroups (who already possess more) benefit disproportionately from identical educational opportunities compared to other subgroups. Thus, equity gaps, once formed, can become increasingly pronounced. Such cumulative effects have already been shown empirically [137] as well as theoretically thoroughly discussed [138]. In order to close equity gaps, it is therefore necessary not only to ensure that at least as many exogenous resources reach the disadvantaged as the privileged, but also to ensure that they have the capacities to use them for successful learning and development processes. With the dampening effect of learning capital, the educational starting points are identified by the five learning capitals. For example, if boys conform to the stereotype of the non-reading male gender in the media and at home [139,140], schools can try to provide appropriate telic and episodic learning capital (e.g., via a reading curricular also tailored to boys’ interests or reading strategy training). If children with a migration background are inhibited by language barriers, appropriate actional and episodic learning capital (e.g., via language courses and joint project work with natives) might be provided.

Limitations and Future Research

There are several limitations to the design of the present studies and findings. First, both studies were questionnaire studies. Thus, all the limitations of questionnaire studies such as the accuracy of the responses due to the self-reported nature can be a problem. For instance, students may not accurately assess the number of books in their household in Study 1. Similarly, teachers’ assessment of each student’s economic educational capital in Study 2 may not reflect the actual economic capital a student had. Furthermore, in both studies, we used a proxy measure for SES. We used the number of books in the household to gauge SES in Study 1 and teachers’ assessment of economic educational capital as a proxy for SES in Study 2. Even though studies show that books in the household, as well as economic educational capital, are strongly correlated with family’s SES [141,142], it would have been better to use a composite measure for SES, such as the Duncan Socioeconomic Index or the Nam–Powers Occupational Status Score [143,144].
Further, Study 2 was a cross-sectional study in which students’ test scores and grades were both examined at the same time. Therefore, no causal conclusion could be drawn. It would have been more ideal to collect data at multiple time points as in Study 1 and compare the predictive power of teachers’ subjective judgment and students’ previous test performance on their later test performance and course grades. Still, Study 2 was able to show the dampening effect of learning capital for intersectional disadvantages on students’ literacy achievement. The initial findings have value for the practice and policy for narrowing equity gaps by equipping students subject to intersectionality with learning resources. Future research on the dampening effect of learning capital on intersectionality and equity gaps should also plan and implement a longitudinal study.
Another limitation of our study is that there was no objective measurement as a substitute for the subjective school grades in native language education given by teachers. Course grades of a native language class may include multiple aspects such as spelling, reading, and creative writing. Although one can argue that reading is among the most important sub-skills and that it is often correlated with all other literacy sub-skills, future research should nonetheless employ additional objective testing procedures that measure other facets that go into a native language classroom grade. Our prediction is that all sub-scores will show smaller equity gaps than in the native language grade, as they are amplified by the social resonance effect.

Author Contributions

Conceptualization, A.Z. and H.S.; Methodology, L.L.; Formal analysis, L.L.; Data curation, H.S.; Writing—original draft, A.Z., L.L. and H.S.; Writing—review and editing, A.Z., L.L. and H.S. All authors have read and agreed to the published version of the manuscript.

Funding

Data from Study 2 in this article was collected for a larger study funded by the Hamdan bin Rashid Al Maktoum Foundation for Distinguished Academic Performance.

Institutional Review Board Statement

The study was conducted in accordance with the Declaration of Helsinki, and approved by the Ministry of Education of Bavaria, Germany.

Informed Consent Statement

Informed consent was obtained from all subjects involved in the study.

Data Availability Statement

The dataset analyzed in the present study may be obtained via the third author upon reasonable requests.

Conflicts of Interest

The authors declare no conflict of interest.

References

  1. Ziegler, A.; Kuo, C.-C.; Eu, S.-P.; Gläser-Zikuda, M.; Nuñez, M.; Yu, H.-P.; Harder, B. Equity gaps in education: Nine points toward more transparency. Educ. Sci. 2021, 11, 711. [Google Scholar] [CrossRef]
  2. Leithwood, K. A review of evidence about equitable school leadership. Educ. Sci. 2021, 11, 377. [Google Scholar] [CrossRef]
  3. Aikens, N.L.; Barbarin, O. Socioeconomic differences in reading trajectories: The contribution of family, neighborhood, and school contexts. J. Educ. Psychol. 2008, 100, 235–251. [Google Scholar] [CrossRef]
  4. Lee, J. Racial and ethnic achievement gap trends: Reversing the progress toward equity? Educ. Res. 2002, 31, 3–12. [Google Scholar] [CrossRef] [Green Version]
  5. Logan, S.; Johnston, R. Investigating gender differences in reading. Educ. Rev. 2010, 62, 175–187. [Google Scholar] [CrossRef]
  6. Crabtree, L.M.; Richardson, S.C.; Lewis, C.W. The gifted gap, STEM education, and economic immobility. J. Adv. Acad. 2019, 30, 203–231. [Google Scholar] [CrossRef]
  7. OECD. PISA 2018 Results (Volume II): Where All Students Can Succeed; OECD Publishing: Paris, France, 2019. [Google Scholar] [CrossRef]
  8. Pang, V.O.; Han, P.P.; Pang, J.M. Asian American and Pacific Islander students: Equity and the achievement gap. Educ. Res. 2011, 40, 378–389. [Google Scholar] [CrossRef]
  9. Plucker, J.A.; Peters, S.J. Excellence Gaps in Education: Expanding Opportunities for Talented Students; Harvard Education Press: Cambridge, MA, USA, 2020. [Google Scholar]
  10. Ziegler, A.; Stoeger, H. Talent denied: Excellence gaps in, STEMM. Manuscript under review. 2023.
  11. Olszewski-Kubilius, P.; Clarenbach, J. Closing the opportunity gap: Program factors contributing to academic success in culturally different youth. Gift. Child Today 2014, 37, 103–110. [Google Scholar] [CrossRef] [Green Version]
  12. Gross, C.; Gottburgsen, A.; Phoenix, A. Education Systems Intersectionality. In Education Systems and Inequalities; Hadjar, A., Gross, C., Eds.; Policy Press: Bristol, UK, 2016; pp. 51–72. [Google Scholar]
  13. Tefera, A.A.; Powers, J.M.; Fischman, G.E. Intersectionality in education: A conceptual aspiration and research imperative. Rev. Res. Educ. 2018, 42, vii–xvii. [Google Scholar] [CrossRef] [Green Version]
  14. Crenshaw, K. Demarginalizing the Intersection of Race and Sex: A Black Feminist Critique of Antidiscrimination Doctrine, Feminist Theory and Antiracist Politics. Univ. Chic. Leg. Forum 1989, 1989, 8. Available online: http://chicagounbound.uchicago.edu/uclf/vol1989/iss1/8 (accessed on 30 April 2023).
  15. Broer, M.; Bai, Y.; Fonseca, F. A review of the literature on socioeconomic status and educational achievement. In Socioeconomic Inequality and Educational Outcomes: Evidence from Twenty Years of TIMSS, 5, 7–17; IEA Research for Education; Springer: Cham, Switzerland, 2019. [Google Scholar] [CrossRef] [Green Version]
  16. Liu, J.; Peng, P.; Luo, L. The relation between family socioeconomic status and academic achievement in China: A meta-analysis. Educ. Psychol. Rev. 2020, 32, 49–76. [Google Scholar] [CrossRef]
  17. Lurie, L.A.; Hagen, M.P.; McLaughlin, K.A.; Sheridan, M.A.; Meltzoff, A.N.; Rosen, M.L. Mechanisms linking socioeconomic status and academic achievement in early childhood: Cognitive stimulation and language. Cogn. Dev. 2021, 58, 101045. [Google Scholar] [CrossRef] [PubMed]
  18. Moss-Racusin, C.A.; Dovidio, J.F.; Brescoll, V.L.; Graham, M.J.; Handelsman, J. Science faculty’s subtle gender biases favor male students. Proc. Natl. Acad. Sci. USA 2012, 109, 16474–16479. [Google Scholar] [CrossRef]
  19. Appels, L.; De Maeyer, S.; Faddar, J.; Van Petegem, P. Unpacking equity. Educational equity in secondary analyses of international large-scale assessments: A systematic review. Educ. Res. Rev. 2023, 38, 100494. [Google Scholar] [CrossRef]
  20. Else-Quest, N.M.; Hyde, J.S.; Linn, M.C. Cross-national patterns of gender differences in mathematics: A meta-analysis. Psychol. Bull. 2010, 136, 103–127. [Google Scholar] [CrossRef] [PubMed] [Green Version]
  21. Perez Mejias, P.; McAllister, D.E.; Diaz, K.G.; Ravest, J. A longitudinal study of the gender gap in mathematics achievement: Evidence from Chile. Educ. Stud. Math. 2021, 107, 583–605. [Google Scholar] [CrossRef]
  22. Zhu, Y.; Kaiser, G.; Cai, J. Gender equity in mathematical achievement: The case of China. Educ. Stud. Math. 2018, 99, 245–260. [Google Scholar] [CrossRef]
  23. Ceci, S.J.; Williams, W.M. Sex differences in math-intensive fields. Curr. Dir. Psychol. Sci. 2010, 19, 275–279. [Google Scholar] [CrossRef] [PubMed] [Green Version]
  24. Cheryan, S.; Ziegler, S.A.; Montoya, A.K.; Jiang, L. Why are some STEM fields more gender balanced than others? Psychol. Bull. 2017, 143, 1–35. [Google Scholar] [CrossRef] [PubMed]
  25. Halpern, D.; Penbow, C.; Geary, D.; Gur, R.; Shibley Hyde, J.; Gernsbacher, M. The science of sex differences in science and mathematics. Psychol. Sci. Public Interest 2007, 8, 1–51. [Google Scholar] [CrossRef] [Green Version]
  26. Wang, M.-T.; Degol, J.L. Gender gap in science, technology, engineering, and mathematics (STEM): Current knowledge, implications for practice, policy, and future directions. Educ. Psychol. Rev. 2017, 29, 119–140. [Google Scholar] [CrossRef] [Green Version]
  27. Robinson, J.P.; Lubienski, S.T. The development of gender achievement gaps in mathematics and reading during elementary and middle school: Examining direct cognitive assessments and teacher ratings. Am. Educ. Res. J. 2011, 48, 268–302. [Google Scholar] [CrossRef] [Green Version]
  28. Hall, J. Gender issues in mathematics: An Ontario perspective. J. Teach. Learn. 2012, 8, 59–72. [Google Scholar] [CrossRef] [Green Version]
  29. Hyde, J.; Mertz, J. Gender, culture, and mathematics performance. Proc. Natl. Acad. Sci. USA 2009, 106, 8801–8807. [Google Scholar] [CrossRef] [PubMed]
  30. Mullis IV, S.; Martin, M.O.; Foy, P.; Arora, A. TIMSS 2011 International Results in Mathematic Sematics; TIMSS & PIRLS International Study Center, Boston College: Chestnut Hill, MA, USA, 2012; Available online: http://timssandpirls.bc.edu/timss2011/international-results-mathematics.html (accessed on 30 April 2023).
  31. Gates, A.I. Sex differences in reading ability. Elem. Sch. J. 1961, 61, 431–434. [Google Scholar] [CrossRef]
  32. Hogrebe, M.C.; Nist, S.L.; Newman, I. Are there gender differences in reading achievement? An investigation using the high school and beyond data. J. Educ. Psychol. 1985, 6, 716–724. [Google Scholar] [CrossRef]
  33. McTigue, E.M.; Schwippert, K.; Uppstad, P.H.; Lundetræ, K.; Solheim, O.J. Gender Differences in Early Literacy: Boys’ Response to Formal Instruction. J. Educ. Psychol. 2021, 113, 690–705. [Google Scholar] [CrossRef]
  34. Rosén, M. Gender differences in reading performance on documents across countries. Read. Writ. 2001, 14, 1–38. [Google Scholar] [CrossRef]
  35. Wagemaker, H.; Taube, K.; Munck, I.; Kontogiannopoulou-Polydorides, G.; Martin, M. Are Girls Better Readers? IEA: Paris, France, 1996. [Google Scholar]
  36. Watson, A.; Kehler, M.; Martino, W. The problem of boys’ literacy underachievement: Raising some questions. J. Adolesc. Adult Lit. 2010 1996, 53, 356–361. [Google Scholar] [CrossRef] [Green Version]
  37. Sommers, C.H. The War against Boys: How Misguided Feminism is Harming Our Young Men; Simon and Schuster: New York, NY, USA, 2001. [Google Scholar]
  38. OECD. Equity and Quality in Education: Supporting Disadvantaged Students and Schools; OECD Publishing: Paris, France, 2012. [Google Scholar] [CrossRef]
  39. Bijou, M.; Liouaeddine, M. Gender and students’ achievements: Evidence from PISA 2015. World J. Educ. 2018, 8, 24–35. [Google Scholar] [CrossRef]
  40. Brozo, W.G.; Sulkunen, S.; Shiel, G.; Garbe, C.; Pandian, A.; Valtin, R. Reading, gender, and engagement: Lessons from five PISA countries. J. Adolesc. Adult Lit. 2014, 57, 584–593. [Google Scholar] [CrossRef]
  41. Mullis, I.V.; Martin, M.O.; Gonzalez, E.J. International Achievement in the Processes of Reading Comprehension: Results from PIRLS 2001 in 35 Countries; Boston College: Chestnut Hill, MA, USA, 2004; Available online: https://www.iea.nl/sites/default/files/2019-03/IRC2004_Mullis_Martin_etal.pdf (accessed on 30 April 2023).
  42. Solheim, O.J.; Lundetræ, K. Can test construction account for varying gender differences in international reading achievement tests of children, adolescents and young adults?—A study based on Nordic results in PIRLS, PISA and PIAAC. Assess. Educ. Princ. Policy Pract. 2018, 25, 107–126. [Google Scholar] [CrossRef] [Green Version]
  43. Ammermüller, A. Poor background or low returns? Why immigrant students in Germany perform so poorly in the programme for international student assessment. Educ. Econ. 2007, 15, 215–230. [Google Scholar] [CrossRef]
  44. Andon, A.; Thompson, C.G.; Becker, B.J. A quantitative synthesis of the immigrant achievement gap across OECD countries. Large-Scale Assess. Educ. 2014, 2, 7. [Google Scholar] [CrossRef] [Green Version]
  45. Ma, X. Measuring up: Academic performance of Canadian immigrant children in reading, mathematics, and science. J. Int. Migr. Integr. Rev. L’integration Migr. Int. 2003, 4, 541–576. [Google Scholar] [CrossRef]
  46. Portes, A.; MacLeod, D. Educational progress of children of immigrants: The roles of class, ethnicity, and school context. Sociol. Educ. 1996, 69, 255–275. [Google Scholar] [CrossRef]
  47. Portes, A.; MacLeod, D. Educating the second generation: Determinants of academic achievement among children of immigrants in the United States. J. Ethn. Migr. Stud. 1999, 25, 373–396. [Google Scholar] [CrossRef]
  48. Rangvid, B.S. Sources of immigrants’ underachievement: Results from PISA—Copenhagen. Educ. Econ. 2007, 15, 293–326. [Google Scholar] [CrossRef]
  49. Rangvid, B.S. Source country differences in test score gaps: Evidence from Denmark. Educ. Econ. 2010, 18, 269–295. [Google Scholar] [CrossRef]
  50. Heath, A.; Brinbaum, Y. Guest editorial: Explaining ethnic inequalities in educational attainment. Ethnicities 2007, 7, 291–304. [Google Scholar] [CrossRef] [Green Version]
  51. Bradley, R.H.; Corwyn, R.F. Socioeconomic status and child development. Annu. Rev. Psychol. 2002, 53, 371399. [Google Scholar] [CrossRef] [Green Version]
  52. Bynner, J.; Joshi, H. Equality and opportunity in education: Evidence from the 1958 and 1970 birth cohort studies. Oxf. Rev. Educ. 2002, 28, 405–425. [Google Scholar] [CrossRef]
  53. Duncan, G.J.; Magnuson, K.; Votruba-Drzal, E. Moving beyond correlations in assessing the consequences of poverty. Annu. Rev. Psychol. 2017, 68, 413–434. [Google Scholar] [CrossRef] [Green Version]
  54. Filmer, D.; Pritchett, L.H. Estimating wealth effects without expenditure data—Or tears: An application to educational enrollments in states of India. Demography 2001, 38, 115–132. [Google Scholar] [CrossRef]
  55. Hanushek, E.A.; Woessmann, L. The economics of international differences in educational achievement. In Handbook of the Economics of Education; North Holland: Amsterdam, The Netherlands, 2011; Volume 3, pp. 89–200. [Google Scholar] [CrossRef] [Green Version]
  56. Schuetz, G.; Ursprung, H.W.; Woessmann, L. Education policy and equality of opportunity. Kyklos 2008, 61, 279–308. [Google Scholar] [CrossRef] [Green Version]
  57. Caro, D.H.; McDonald, J.T.; Willms, J.D. Socio-economic status and academic achievement trajectories from childhood to adolescence. Can. J. Educ./Rev. Can. L’éducation 2009, 32, 558–590. [Google Scholar]
  58. Korous, K.M.; Causadias, J.M.; Bradley, R.H.; Luthar, S.S.; Levy, R. A systematic overview of meta-analyses on socioeconomic status, cognitive ability, and achievement: The need to focus on specific pathways. Psychol. Rep. 2022, 125, 55–97. [Google Scholar] [CrossRef] [PubMed]
  59. Sirin, S.R. Socioeconomic status and academic achievement: A meta-analytic review of research. Rev. Educ. Res. 2005, 75, 417–453. [Google Scholar] [CrossRef] [Green Version]
  60. Buckingham, J.; Wheldall, K.; Beaman-Wheldall, R. Why poor children are more likely to become poor readers: The school years. Aust. J. Educ. 2013, 57, 190–213. [Google Scholar] [CrossRef]
  61. Buckingham, J.; Beaman, R.; Wheldall, K. Why poor children are more likely to become poor readers: The early years. Educ. Rev. 2014, 66, 428–446. [Google Scholar] [CrossRef]
  62. Hart, B.; Risley, T.R. Meaningful Differences in the Everyday Experience of Young American Children; Paul H Brookes Publishing: Baltimore, MD, USA, 1995. [Google Scholar]
  63. Pan, B.A.; Rowe, M.L.; Singer, J.D.; Snow, C.E. Maternal correlates of growth in toddler vocabulary production in low-income families. Child Dev. 2005, 76, 763–782. [Google Scholar] [CrossRef]
  64. Bécares, L.; Priest, N. Understanding the influence of race/ethnicity, gender, and class on inequalities in academic and non-academic outcomes among eighth-grade students: Findings from an intersectionality approach. PLoS ONE 2015, 10, e0141363. [Google Scholar] [CrossRef] [Green Version]
  65. Priest, N.; Walton, J.; White, F.; Kowal, E.; Baker, A.; Paradies, Y. Understanding the complexities of ethnic-racial socialization processes for both minority and majority groups: A 30-year review. Int. J. Intercult. Relat. 2014, 43, 139–155. [Google Scholar] [CrossRef]
  66. Entwisle, D.R.; Alexander, K.L.; Olson, L.S. Early schooling: The handicap of being poor and male. Sociol. Educ. 2007, 80, 114–138. [Google Scholar] [CrossRef]
  67. Hinshaw, S.P. Externalizing behavior problems and academic underachievement in childhood and adolescence: Causal relationships and underlying mechanisms. Psychol. Bull. 1992, 111, 127–155. [Google Scholar] [CrossRef]
  68. Feliciano, C.; Rumbaut, R.G. Gendered paths: Educational and occupational expectations and outcomes among adult children of immigrants. Ethn. Racial Stud. 2005, 28, 1087–1118. [Google Scholar] [CrossRef]
  69. Pinar, C. Eighth Grade Mathematics Achievement Gaps across Race, Ethnicity, and Gender. Multicult. Learn. Teach. 2011, 6. Available online: https://www.degruyter.com/document/doi/10.2202/2161-2412.1108/pdf (accessed on 30 April 2023). [CrossRef]
  70. Portes, A.; Rumbaut, R.G. Introduction: The second generation and the children of immigrants longitudinal study. Ethn. Racial Stud. 2005, 28, 983–999. [Google Scholar] [CrossRef]
  71. Støren, L.A.; Helland, H. Ethnicity differences in the completion rates of upper secondary education: How do the effects of gender and social background variables interplay? Eur. Sociol. Rev. 2010, 26, 585–601. [Google Scholar] [CrossRef]
  72. Takenoshita, H.; Chitose, Y.; Ikegami, S.; Ishikawa, E.A. Segmented assimilation, transnationalism, and educational attainment of Brazilian migrant children in Japan. Int. Migr. 2014, 52, 84–99. [Google Scholar] [CrossRef]
  73. Alba, R.; Waters, M.C. (Eds.) The Next Generation: Immigrant Youth in a Comparative Perspective; NYU Press: New York, NY, USA, 2011. [Google Scholar]
  74. Levels, M.; Dronkers, J.; Kraaykamp, G. Immigrant children’s educational achievement in western countries: Origin, destination, and community effects on mathematical performance. Am. Sociol. Rev. 2008, 73, 835–853. [Google Scholar] [CrossRef] [Green Version]
  75. Pong, S.L.; Hao, L. Neighborhood and school factors in the school performance of immigrants’ children. Int. Migr. Rev. 2007, 41, 206–241. [Google Scholar] [CrossRef]
  76. Breen, R.; Luijkx, R.; Müller, W.; Pollak, R. Long-term trends in educational inequality in Europe: Class inequalities and gender differences. Eur. Sociol. Rev. 2010, 26, 31–48. [Google Scholar] [CrossRef]
  77. Buchmann, C.; DiPrete, T.A.; McDaniel, A. Gender inequalities in education. Annu. Rev. Sociol. 2008, 34, 319–337. [Google Scholar] [CrossRef] [Green Version]
  78. Gong, X.; Ding, Y.; Tsang, M.C. Gender differences of academic performance in compulsory education in rural Southwestern China. Int. J. Educ. Dev. 2014, 39, 193–204. [Google Scholar] [CrossRef]
  79. Legewie, J.; DiPrete, T.A. School context and the gender gap in educational achievement. Am. Sociol. Rev. 2012, 77, 463–485. [Google Scholar] [CrossRef] [Green Version]
  80. Gillborn, D.; Mirza, H.S. Educational Inequality: Mapping Race, Class and Gender: A Synthesis of Research Evidence; Office for Standards in Education: London, UK, 2000. Available online: https://dera.ioe.ac.uk/id/eprint/4428/2/Educational_inequality_mapping_race,_class_and_gender_(PDF_format).pdf (accessed on 30 April 2023).
  81. Grant, C.A.; Sleeter, C.E. Race, class, and gender in education research: An argument for integrative analysis. Rev. Educ. Res. 1986, 56, 195–211. [Google Scholar] [CrossRef]
  82. Grant, C.A.; Zwier, E. Intersectionality and student outcomes: Sharpening the struggle against racism, sexism, classism, ableism, heterosexism, nationalism, and linguistic, religious, and geographical discrimination in teaching and learning. Multicult. Perspect. 2011, 13, 181–188. [Google Scholar] [CrossRef]
  83. Demack, S.; Drew, D.; Grimsley, M. Minding the gap: Ethnic, gender and social class differences in attainment at 16, 1988–95. Race Ethn. Educ. 2000, 3, 117–143. [Google Scholar] [CrossRef]
  84. Gottburgsen, A.; Gross, C. Welchen Beitrag Leistet, „Intersektionalität“ zur Klärung von Kompetenzunterschieden bei Jugendlichen? In Soziologische Bildungsforschung; Becker, R., Solga, H., Eds.; Springer VS: Wiesbaden, Germany, 2012; pp. 86–110. [Google Scholar]
  85. Gross, C.; Gottburgsen, A. Gender, soziale Herkunft und Migration: „Intersektionalität“ im Erwerb von Mathematikkompetenzen In Migrationshintergrund, Geschlecht und Bildungserfolg; Hadjar, A., Hupka-Brunner, S., Eds.; Juventa Verlag: Weinheim Basel, Switzerland, 2013; pp. 188–212. [Google Scholar]
  86. Braveman, P.A.; Cubbin, C.; Egerter, S.; Williams, D.R.; Pamuk, E. Socioeconomic disparities in health in the United States: What the patterns tell us. Am. J. Public Health 2010, 100, S186–S196. [Google Scholar] [CrossRef] [PubMed]
  87. Williams, D.R.; Mohammed, S.A.; Leavell, J.; Collins, C. Race, socioeconomic status, and health: Complexities, ongoing challenges, and research opportunities. Ann. N. Y. Acad. Sci. 2010, 1186, 69–101. [Google Scholar] [CrossRef]
  88. Stoeger, H.; Almulhim, N.; Ziegler, A. Correspondence heuristic and filter-empowerment heuristic: Investigating the reversed gender achievement gap in a sample of secondary school students in Saudi Arabia within the framework of educational and learning capital. Educ. Sci. 2022, 12, 811. [Google Scholar] [CrossRef]
  89. Ziegler, A.; Chandler, K.; Vialle, W.; Stoeger, H. Exogenous and endogenous learning resources in the Actiotope Model of Giftedness and its significance for gifted education. J. Educ. Gift. 2017, 40, 310–333. [Google Scholar] [CrossRef]
  90. Harlen, W. Trusting teachers’ judgement: Research evidence of the reliability and validity of teachers’ assessment used for summative purposes. Res. Pap. Educ. 2005, 20, 245–270. [Google Scholar] [CrossRef]
  91. Ziegler, A.; Stoeger, H. Identification of underachievement: An empirical study on the agreement among various diagnostic sources. Gift. Talent. Int. 2003, 18, 87–94. [Google Scholar] [CrossRef]
  92. Fischbach, A.; Baudson, T.G.; Preckel, F.; Martin, R.; Brunner, M. Do teacher judgments of student intelligence predict life outcomes? Learn. Individ. Differ. 2013, 27, 109–119. [Google Scholar] [CrossRef]
  93. Meissel, K.; Meyer, F.; Yao, E.S.; Rubie-Davies, C.M. Subjectivity of teacher judgments: Exploring student characteristics that influence teacher judgments of student ability. Teach. Teach. Educ. 2017, 65, 48–60. [Google Scholar] [CrossRef]
  94. Ready, D.D.; Wright, D.L. Accuracy and inaccuracy in teachers’ perceptions of young children’s cognitive abilities: The role of child background and classroom context. Am. Educ. Res. J. 2011, 48, 335–360. [Google Scholar] [CrossRef]
  95. Voyer, D.; Voyer, S.D. Gender differences in scholastic achievement: A meta-analysis. Psychol. Bull. 2014, 140, 1174–1204. [Google Scholar] [CrossRef] [Green Version]
  96. Luedemann, E.; Schwerdt, G. Migration background and educational tracking: Is there a double disadvantage for second-generation immigrants? J. Popul. Econ. 2013, 26, 455–481. [Google Scholar] [CrossRef]
  97. Kruglanski, A.W.; Higgins, E.T. (Eds.) Social Psychology: Handbook of Basic Principles; Guilford Publications: New York, NY, USA, 2013. [Google Scholar]
  98. Campano, G. Immigrant Students and Literacy: Reading, Writing, and Remembering; Teachers College Press: New York, NY, USA, 2019. [Google Scholar]
  99. Free, J.L.; Križ, K.; Konecnik, J. Harvesting hardships: Educators’ views on the challenges of migrant students and their consequences on education. Child. Youth Serv. Rev. 2014, 47, 187–197. [Google Scholar] [CrossRef]
  100. Bonefeld, M.; Dickhäuser, O.; Karst, K. Do preservice teachers’ judgments and judgment accuracy depend on students’ characteristics? The effect of gender and immigration background. Soc. Psychol. Educ. 2020, 23, 189–216. [Google Scholar] [CrossRef]
  101. Babad, E.Y.; Inbar, J.; Rosenthal, R. Pygmalion, Galatea, and the Golem: Investigations of biased and unbiased teachers. J. Educ. Psychol. 1982, 74, 459–474. [Google Scholar] [CrossRef]
  102. Oz, S.; Eden, D. Restraining the Golem: Boosting performance by changing the interpretation of low scores. J. Appl. Psychol. 1994, 79, 744–754. [Google Scholar] [CrossRef]
  103. van Hek, M.; Buchmann, C.; Kraaykamp, G. Educational systems and gender differences in reading: A comparative multilevel analysis. Eur. Sociol. Rev. 2019, 35, 169–186. [Google Scholar] [CrossRef]
  104. Oakhill, J.V.; Petrides, A. Sex differences in the effects of interest on boys’ and girls’ reading comprehension. Br. J. Psychol. 2007, 98, 223–235. [Google Scholar] [CrossRef]
  105. Ayalon, H.; Livneh, I. Educational standardization and gender differences in mathematics achievement: A comparative study. Soc. Sci. Res. 2013, 43, 432–445. [Google Scholar] [CrossRef]
  106. Stoeger, H.; Sontag, C.; Ziegler, A. Impact of a teacher-led intervention on preference for self-regulated learning, finding main ideas in expository texts, and reading comprehension. J. Educ. Psychol. 2014, 106, 799–814. [Google Scholar] [CrossRef]
  107. Lenhard, W.; Schneider, W. ELFE 1–6: Ein Leseverständnistest für Erst-bis Sechstklässler [ELFE 1–6: A Reading Comprehension Test for Students in Grades 1 through 6]; Hogrefe: Boston, MA, USA, 2006. [Google Scholar]
  108. Lehmann, R.H.; Peek, R.; Poerschke, J. HAMLET 3–4: Hamburger Lesetest für 3. Und 4. Klassen [Hamburg Reading Comprehension Test for Grades 3 and 4]; Hogrefe: Boston, MA, USA, 2006. [Google Scholar]
  109. Muthén, L.K.; Muthén, B.O. Mplus User’s Guide, 8th ed.; Muthén & Muthén: Los Angeles, CA, USA, 1998–2017. [Google Scholar]
  110. Petraitis, P.S.; Dunham, A.E.; Niewiarowski, P.H. Inferring multiple causality: The limitations of path analysis. Funct. Ecol. 1996, 10, 421–431. [Google Scholar] [CrossRef]
  111. Ziegler, A.; Stoeger, H. Gifted Identification Kit 4–6 for the United Arab Emirates; HADAP: Jalna, India, 2016. [Google Scholar]
  112. Debatin, T.; Aljughaiman, A.; Alghawi, M.; Stoeger, H.; Ziegler, A. Reliability and interpretation of total scores from multidimensional cognitive measures—Evaluating the GIK 4–6 using bifactor analysis. Psychol. Test Assess. Model. 2018, 60, 393–401. [Google Scholar]
  113. Ziegler, A.; Baker, J. Talent development as adaptation: The role of educational learning capital. In Exceptionality in East Asia: Explorations in the Actiotope Model of Giftedness; Phillipson, S.N., Stoeger, H., Ziegler, A., Eds.; Routledge: London, UK, 2013; pp. 18–39. [Google Scholar]
  114. Harder, B.; Trottler, S.; Vialle, W.; Ziegler, A. Diagnosing resources for effective learning via teacher and parent checklists. Psychol. Test Assess. Model. 2015, 57, 201–221. [Google Scholar]
  115. Jurado de Los Santos, P.; Moreno-Guerrero, A.J.; Marín-Marín, J.A.; Soler Costa, R. The term equity in education: A literature review with scientific mapping in Web of Science. Int. J. Environ. Res. Public Health 2020, 17, 3526. [Google Scholar] [CrossRef]
  116. Meyer, M.S.; Shen, Y.; Plucker, J.A. Reducing excellence gaps: A systematic review of research on equity in advanced education. Rev. Educ. Res. 2023. online first. [Google Scholar] [CrossRef]
  117. Thomas, M.A.; McCormick, A. Exploring equity gaps in education: Toward unity, not uniformity. Int. Educ. J. Comp. Perspect. 2017, 16, 1–4. [Google Scholar]
  118. Anderson, K.J. Modern Misogyny: Anti-Feminism in a Post-Feminist Era; Oxford University Press: Oxford, UK, 2015. [Google Scholar]
  119. Bertocchi, G.; Bozzano, M. Gender Gaps in Education; Springer International Publishing: Berlin/Heidelberg, Germany, 2020; pp. 1–31. [Google Scholar]
  120. Savolainen, J.; Applin, S.; Messner, S.F.; Hughes, L.A.; Lytle, R.; Kivivuori, J. Does the gender gap in delinquency vary by level of patriarchy? A cross-national comparative analysis. Criminology 2017, 55, 726–753. [Google Scholar] [CrossRef]
  121. Johnson-Ahorlu, R.N. The academic opportunity gap: How racism and stereotypes disrupt the education of African American undergraduates. Race Ethn. Educ. 2012, 15, 633–652. [Google Scholar] [CrossRef]
  122. Merolla, D.M.; Jackson, O. Structural racism as the fundamental cause of the academic achievement gap. Sociol. Compass 2019, 13, e12696. [Google Scholar] [CrossRef]
  123. Henrich, J.; Heine, S.J.; Norenzayan, A. Most people are not WEIRD. Nature 2010, 466, 29. [Google Scholar] [CrossRef] [PubMed]
  124. Ismail, S.A.; Alghawi, M.A.; AlSuwaidi, K.A. Gifted education in United Arab Emirates: Analyses from a learning-resource perspective. Cogent Educ. 2022, 9, 2034247. [Google Scholar] [CrossRef]
  125. Mullis IV, S.; Martin, M.O.; Foy, P.; Kelly, D.L.; Fishbein, B. TIMSS 2019 International Results in Mathematics and Science. Retrieved from Boston College 2020, TIMSS & PIRLS International Study Center Website. Available online: https://timssandpirls.bc.edu/timss2019/international-results/ (accessed on 30 April 2023).
  126. The Global Economy. Human Rights and Rule of Law Index–Country Rankings. 2022. Available online: https://www.theglobaleconomy.com/rankings/human_rights_rule_law_index/ (accessed on 30 April 2023).
  127. Ferrer, E.; Shaywitz, B.A.; Holahan, J.M.; Marchione, K.E.; Michaels, R.; Shaywitz, S.E. Achievement gap in reading is present as early as first grade and persists through adolescence. J. Pediatr. 2015, 167, 1121–1125. [Google Scholar] [CrossRef]
  128. Scammacca, N.; Fall, A.M.; Capin, P.; Roberts, G.; Swanson, E. Examining factors affecting reading and math growth and achievement gaps in grades 1–5: A cohort-sequential longitudinal approach. J. Educ. Psychol. 2020, 112, 718–734. [Google Scholar] [CrossRef]
  129. Schneider, T. Die Bedeutung der sozialen Herkunft und des Mingrationshintergrundes für Lehrerurteile am Beispiel des Schulübertritts [The importance of social background and mingration background for teacher judgments exemplified by school transition]. Z. Erzieh. 2011, 14, 371–396. [Google Scholar] [CrossRef]
  130. Hoffman, J.V.; Svrcek, N.; Lammert, C.; Daly-Lesch, A.; Steinitz, E.; Greeter, E.; DeJulio, S. A research review of literacy tutoring and mentoring in initial teacher preparation: Toward practices that can transform teaching. J. Lit. Res. 2019, 51, 233–251. [Google Scholar] [CrossRef]
  131. Singleton, C. Computer-based assessment of reading. In The Psychological Assessment of Reading; Beech, J., Singleton, C., Eds.; Routledge: London, UK, 2021; pp. 257–278. [Google Scholar] [CrossRef]
  132. Stahl KA, D.; Flanigan, K.; McKenna, M.C. Assessment for Reading Instruction; Guilford Publications: New York, NY, USA, 2019. [Google Scholar]
  133. Veas, A.; Castejón, J.-L.; O’Reilly, C.; Ziegler, A. Mediation analysis of the relationship between educational capital, learning capital, and underachievement among gifted secondary school students. J. Educ. Gift. 2018, 41, 369–385. [Google Scholar] [CrossRef] [Green Version]
  134. Meier, R. Regulationsprozesse im Lernverhalten von Kindern, Jugendlichen und Studierenden—Eine qualitative Untersuchung auf Grundlage des systemischen Ansatzes [Regulation Processes in the Learning Behavior of Children, Adolescents and Students—A Qualitative Investigation Based on the Systemic Approach]. Friedrich-Alexander-Universität Erlangen-Nürnberg (FAU). Urn:nbn:de:bvb:29-opus4-215153. 2023. Available online: https://opus4.kobv.de/opus4-fau/frontdoor/index/index/docId/21515 (accessed on 30 April 2023).
  135. Roemer, J.E. Equality of Opportunity: A Progress Report. Soc. Choice Welf. 2002, 19, 455–471. Available online: http://www.jstor.org/stable/41106460 (accessed on 30 April 2023). [CrossRef]
  136. Merton, R.K. The Matthew effect in science, II: Cumulative advantage and the symbolism of intellectual property. ISIS 1988, 79, 606–623. [Google Scholar] [CrossRef] [Green Version]
  137. Giofrè, D.; Cornoldi, C.; Martini, A.; Toffalini, E. A population level analysis of the gender gap in mathematics: Results on over 13 million children using the INVALSI dataset. Intelligence 2020, 81, 101467. [Google Scholar] [CrossRef]
  138. Ceci, S.J.; Papierno, P.B. The rhetoric and reality of gap closing: When the “have-nots” gain but the “haves” gain even more. Am. Psychol. 2005, 60, 149–160. [Google Scholar] [CrossRef] [Green Version]
  139. Muntoni, F.; Retelsdorf, J. At their children’s expense: How parents’ gender stereotypes affect their children’s reading outcomes. Learn. Instr. 2019, 60, 95–103. [Google Scholar] [CrossRef]
  140. Muntoni, F.; Wagner, J.; Retelsdorf, J. Beware of stereotypes: Are classmates’ stereotypes associated with students’ reading outcomes? Child Dev. 2021, 92, 189–204. [Google Scholar] [CrossRef] [PubMed] [Green Version]
  141. Liu, C.; Georgiou, G.K.; Manolitsis, G. Modeling the relationships of parents’ expectations, family’s SES, and home literacy environment with emergent literacy skills and word reading in Chinese. Early Child. Res. Q. 2018, 43, 1–10. [Google Scholar] [CrossRef]
  142. Wiberg, M.; Rolfsman, E. Students’ self-reported background SES measures in TIMSS in relation to register SES measures when analysing students’ achievements in Sweden. Scand. J. Educ. Res. 2023, 67, 69–82. [Google Scholar] [CrossRef]
  143. Mueller, C.W.; Parcel, T.L. Measures of socioeconomic status: Alternatives and recommendations. Child Dev. 1981, 52, 13–30. [Google Scholar] [CrossRef]
  144. Oakes, J.M.; Andrade, K.E. The measurement of socioeconomic status. In Methods in Social Epidemiology; Oakes, J.M., Kaufman, J.S., Eds.; Jossey-Bass & Sons: Hoboken, NJ, USA, 2017; pp. 23–42. [Google Scholar]
Figure 1. Specified Path Model for Analysis in Study 1.
Education 13 00827 g001
Figure 2. Final Path Model with Standardized Path Coefficients in Study 1.
Education 13 00827 g002
Figure 3. Specified Path Model for Analysis in Study 2.
Education 13 00827 g003
Figure 4. Final Path Model with Standardized Path Coefficients. Solid lines indicate significant coefficients. The dotted line indicates a non-significant coefficient.
Education 13 00827 g004
Table 1. Definitions of Educational Capital from [88].
Types of Exogenous Resources: Educational CapitalDefinition
Economicevery kind of wealth, possession, money, or valuable that can be invested in the initiation and maintenance of educational and learning processes
Culturalvalue systems, thinking patterns, models, and the like that can facilitate—or hinder—the attainment of learning and educational goals
Socialall persons and social institutions that can directly or indirectly contribute to the success of learning and educational processes
Infrastructuralmaterially implemented possibilities for action that allow learning and education to take place
Didacticthe assembled know-how involved in the design and improvement of educational and learning processes
Table 2. Definitions of Learning Capital from [88].
Types of Endogenous Resources: Learning CapitalDefinition
Organismicthe physiological and constitutional resources of a person
Telicthe totality of a person’s anticipated goal states that offer possibilities for satisfying their needs
Attentionalthe quantitative and qualitative attentional resources that a person can apply to learning
Actionalthe action repertoire of a person; as such, it describes the totality of actions a person is capable of performing
Episodicthe simultaneous goal-relevant and situation-relevant action patterns that are accessible to a person
Table 3. Means and Standard Deviations of Outcome Variables for Each Demographic Group.
German Grades
(Reverse-Coded)
Reading Comprehension Scores
T1T2T1T2
nMSDMSDMSDMSD
original values
Gender
    Girl503453.08107.606460.69112.76316.173.29729.145.874
    Boy515415.68119.216438.59108.92715.183.74028.106.220
Migration Background (MB)
    Yes192405.34119.831419.27127.93614.943.80026.066.511
    No826440.86113.002456.54105.96415.843.48429.215.809
Books at Home (SES Proxy)
    0–25 books166382.23121.732400.60120.76013.963.83825.805.980
    26–100 books297429.21112.252446.63108.20115.643.41728.205.875
    101–200 books223439.57112.584452.69110.04515.333.59028.825.734
    >200 books332460.92106.950474.40101.92516.783.12230.275.966
z-transformed values
Gender
    Girl5030.1630.9290.12610.0040.0940.9250.1270.961
    Boy515−0.16010.029−0.0710.970−0.18510.049−0.04310.018
Migration Background (MB)
    Yes192−0.24910.035−0.24310.14−0.25110.066−0.37810.065
    No8260.0580.9760.0890.943<0.0010.9770.1380.951
Books at Home (SES Proxy)
    0–25 books166−0.44910.051−0.40910.075−0.52710.077−0.4210.979
    26–100 books297−0.0430.9690.0010.963−0.0560.958−0.0270.961
    101–200 books2230.0470.9720.5460.980−0.14310.0070.0740.938
    >200 books3320.2310.9240.2480.9070.2650.8760.3110.976
Table 4. Results of Three-Way Factorial MANOVA.
SourceType III Sum of SquaresdfMean SquareFpPartial η2
Gender
    German Grades T110.515110.51511.4880.0010.011
    German Grades T24.04414.0444.4060.0360.004
    Reading Comprehension T15.76515.7656.2960.0120.006
    Reading Comprehension T20.45710.4570.5120.4750.001
Migration Background (MB)
    German Grades T16.27216.2726.8530.0090.007
    German Grades T28.33218.3329.0770.0030.009
    Reading Comprehension T12.80712.8073.0650.0800.003
    Reading Comprehension T222.644122.64425.345<0.0010.025
Books at Home (SES Proxy)
    German Grades T132.044310.68111.670<0.0010.034
    German Grades T243.810314.60315.909<0.0010.045
    Reading Comprehension T144.869314.95615.909<0.0010.045
    Reading Comprehension T249.110316.37018.323<0.0010.052
Gender x MB
    German Grades T10.58410.5840.6380.4240.001
    German Grades T20.24610.2460.2680.605<0.001
    Reading Comprehension T10.92810.9281.0140.3140.001
    Reading Comprehension T21.17511.1751.3150.2520.001
Gender x SES Proxy
    German Grades T11.47730.4920.5380.6570.002
    German Grades T24.55831.5191.6550.1750.005
    Reading Comprehension T11.44830.4830.5270.6640.002
    Reading Comprehension T25.67931.8932.1190.0960.006
MB x SES Proxy
    German Grades T10.82830.2760.3020.8240.001
    German Grades T28.64232.8813.1380.0250.009
    Reading Comprehension T10.34830.1160.1270.944<0.001
    Reading Comprehension T27.50132.5002.7980.0390.008
Gender x MB x SES Proxy
    German Grades T12.00830.6690.7310.5340.002
    German Grades T20.36630.1220.1330.940<0.001
    Reading Comprehension T11.76430.5880.6420.5880.002
    Reading Comprehension T21.02030.3400.3800.7670.001
Note. The symbol “x” stands for interaction effect. For example, Gender x MB refers to the interaction effect of gender and migration background.
Table 5. Descriptive Statistics of and Bivariate Pearson Correlations between Variables in Study 1.
VariablesScaleMSD1234
1. Intersectionality Scores0–31.1250.773
2. German Grades T1 (reversed)100–600434.160115.047−0.250 **
3. German Grades T2 (reversed)100–600449.509111.279−0.228 **0.534 **
4. Reading Comprehension T10–2015.6693.560−0.227 **0.496 **0.425 **
5. Reading Comprehension T20–4028.6176.068−0.286 **0.516 **0.455 **0.599 **
Note. ** p < 0.01, two-tailed.
Table 6. Standardized Path Coefficients for the Path Model in Study 1.
βSEp
  German Grades T1 ON
        Intersectionality−0.2680.029<0.0001
  Reading Comprehension Scores T1 ON
        Intersectionality−0.2530.029<0.0001
  German Grades T2 ON
        German Grades T10.4350.027<0.0001
        Reading Comprehension Scores T10.1980.029<0.0001
  Reading Comprehension Scores T2 ON
        German Grades T10.2930.026<0.0001
        Reading Comprehension Scores T10.4570.025<0.0001
Table 7. Descriptive Statistics of and Bivariate Pearson Correlations between Variables in Study 2.
VariablesScaleMSD123
1. Intersectionality Scores0–30.8220.750
2. Learning Capital Scores0–21.1960.537−0.314 **
3. Arabic Grades0–10080.71814.827−0.362 **0.533 **
4. Reading Comprehension Scores0–9037.70815.295−0.163 **0.356 **0.190 **
Note. ** p < 0.01, two-tailed.
Table 8. Standardized Path Coefficients for the Path Model in Study 2.
βSEp
Arabic Grades ON
    Intersectionality Scores−0.2060.034<0.0001
    Learning Capital Scores0.4530.031<0.0001
Reading Comprehension Scores ON
    Intersectionality Scores−0.0800.0400.044
    Learning Capital Scores0.3410.042<0.0001
    Arabic Grades−0.0330.0440.453
Disclaimer/Publisher’s Note: The statements, opinions and data contained in all publications are solely those of the individual author(s) and contributor(s) and not of MDPI and/or the editor(s). MDPI and/or the editor(s) disclaim responsibility for any injury to people or property resulting from any ideas, methods, instructions or products referred to in the content.

