1. Introduction
New technological applications are being actively integrated into the education process to accommodate students’ diverse learning styles and address educational requirements and demands [
1]. Hence, technology-enhanced learning is becoming more popular as it can constitute an integral part of 21st century education [
2]. It can enrich traditional education, assist educators, improve education quality, and successfully meet the emerging educational needs [
3]. Learners’ interests, preferences, capabilities, personality, and knowledge should be taken into account when designing technology-enhanced learning activities [
4,
5].
The adoption of extended reality technologies, such as augmented reality and virtual reality, in the educational domain is also gaining ground as they provide intriguing experiences through interactive environments [
6,
7,
8,
9]. These safe and secure environments provide a sense of immersion and are in line with instructional theory [
10,
11]. Moreover, they affect all human senses, create more motivating and engaging learning activities, promote positive learning behaviors and attitudes, facilitate teaching and learning processes, lead to improved learning outcomes, and enable students to better comprehend learning subjects and hone their skills [
12,
13,
14]. Thus, immersive technologies can affect learners’ self-regulation, self-efficacy, cognitive load, motivation, embodiment, and interest while also fostering their agency and presence [
15].
More empirical studies regarding the use of extended reality technologies in education are being conducted [
16,
17]. The educational benefits of these technologies have been highlighted in the recent literature and are widely accepted and positively viewed by both students and teachers [
8,
18,
19,
20,
21]. Despite this fact, little is known about the public’s perspectives, sentiments, attitudes, and discourses regarding the use of augmented reality and virtual reality in educational contexts as studies focus on specific populations. Due to their nature, social media platforms can be an invaluable tool to comprehend public opinions on different matters [
22,
23].
Consequently, the main aim of this study is to identify, process, and comprehend public perspectives, sentiments, attitudes, and discourses regarding the adoption and integration of augmented reality and virtual reality in education by analyzing social media data. Particularly, the Twitter platform was selected and over 17 million tweets were retrieved from January 2010 to December 2020. The specific time period was chosen to offer a more coherent and complete overview as well as to present data gathered before the COVID-19 pandemic. The tweets were analyzed using text mining, sentiment analysis, and topic modeling methods. In total, four datasets involving the general and educational use of both augmented reality and virtual reality were created. The research questions (RQ) that guided this research were:
RQ1: What are the perspectives, sentiments, and attitudes of the public toward augmented reality?
RQ2: What are the perspectives, sentiments, and attitudes of the public toward the use of augmented reality in education?
RQ3: What are the perspectives, sentiments, and attitudes of the public toward virtual reality?
RQ4: What are the perspectives, sentiments, and attitudes of the public toward the use of virtual reality in education?
RQ5: What are the main discourse topics regarding augmented reality and virtual reality?
RQ6: How do the results of augmented reality compare to those of virtual reality?
2. Theoretical Background
2.1. Augmented Reality and Virtual Reality
Based on the “reality–virtuality continuum”, a mixed reality is in the middle of a spectrum which has a fully virtual environment at one end and the real physical one at the other end [
24]. Therefore, a mixed reality environment can take place anywhere between the two ends, and can be characterized as an area in which virtual and physical objects co-exist, interact, and are presented in a unified depiction [
25]. Augmented reality is closer to the real environment while virtual reality to the virtual one.
Augmented reality uses technological applications of computer units to enrich users’ perceived physical environment with interactive virtual objects and information in real time [
26]. As it combines the virtual with the physical environment and due to its interactive and immersive nature, augmented reality can effectively be applied in educational contexts of different levels and subjects [
8,
27]. Moreover, it can create inclusive learning environments that motivate students, promote an active learning process, and offer education of high quality at anytime and anyplace [
3,
28]. On the other hand, virtual reality involves computer-generated virtual environments that perceptually surround users and simulate their physical presence within them so that they can be regarded as real [
29,
30,
31]. Its main characteristics are the sense of presence it provides, the immersion and immediacy it offers, and its ability to actively involve users [
32,
33]. Due to its nature, virtual reality can create safe and secure learning environments which motivate and engage students while also providing meaningful learning [
21,
34]. As a result, its integration in educational settings can lead to increased benefits and improved learning outcomes [
7,
18].
2.2. Social Media
Social media are ruled by hybrid media logic [
35], have bottom-up communication, transparency, horizontal knowledge sharing, and personalization at their core, create a sense of belonging and socialization [
36,
37,
38], and are driven by user-generated and freely shareable content [
39]. Additionally, they allow users to interact with others in real time and create a network of relationships within a common information space [
40,
41,
42]. As a result, they constitute a significant component of everyday life and have drastically changed the way people co-create and share information, communicate, and interact [
43].
It should be mentioned that social media can also be a source of fake news [
44,
45,
46] or misinformation [
47,
48]. In many cases, this is caused by bots [
49,
50,
51]. In addition, there are security and privacy concerns that should be taken into account when using social media [
52,
53,
54]. As social media are also being used as a marketing and promotional tool, the overlapping of enterprise interest in different areas, including the educational sector, should be considered [
55,
56,
57]. Despite these facts, the use and analysis of social media data still remain an effective and valid method to comprehend the wisdom of the crowd on specific matters [
58,
59].
Twitter is one of the main social media platforms that people use to share their opinions and discourse on news, matters, and topics as they occur and due to its nature, it urges them to do so concisely and precisely [
60,
61,
62]. Additionally, as Twitter significantly affects people’s opinions compared to other social media platforms, several studies opt to use it as they deem its data more important [
63,
64].
3. Materials and Methods
The methodology used followed the one presented in [
31]. The steps involved in the methodology are the following: (i) setting up the appropriate data requirements, (ii) identifying, retrieving, and collecting the related data, (iii) processing the retrieved data, (iv) analyzing the data, and (v) visualizing the results.
Specific rules and aims (e.g., time period, sources, keywords, variables, etc.) were set to ensure data accuracy and validity and to provide precise results and outcomes. After testing out several combinations and based on previous studies [
8], the keywords used along with the required wildcards to retrieve the 17,278,040 related tweets from January 2010 to December 2020 were:
For the general use of augmented reality: (“augmented reality” OR #AR OR augmentedreality);
For the educational use of augmented reality: (“augmented reality” OR #AR OR augmentedreality) AND (learn OR teach OR train OR education OR university OR college OR school OR class OR student OR pupil);
For the general use of virtual reality: (“virtual reality” OR #VR OR virtualreality);
For the educational use of virtual reality: (“virtual reality” OR #VR OR virtualreality) AND (learn OR teach OR train OR education OR university OR college OR school OR class OR student OR pupil).
The data retrieval process was followed by data processing, cleaning, and storage. Stop-words, single characters, URLs, and punctuation marks were removed. Besides the hashtags, the text was converted into lower case and abbreviated words were expanded. The final four datasets created were stored in JSON and CSV files. The data was analyzed both on a yearly basis and as a whole. For the analysis of the frequency of words, hashtags, tweets, bigrams, and trigrams, text mining methods were used. To detect the emerging topics discussed, topic modeling methods were applied while sentiment analysis was used for the polarity and emotion detection.
3.1. Sentiment Analysis
Sentiment analysis refers to the computational study of subjective information (e.g., opinions, biases, attitudes), affective states, feelings, and emotions within text data using Natural Language Processing (NLP), text analysis, biometrics, and computational linguistics [
31,
65,
66]. The methods of sentiment analysis can either be machine learning-based, lexicon-based, or hybrid [
67] and they can be applied on an aspect, topic, document, or sentence level [
68,
69].
This study adopted a lexicon-based sentiment analysis approach to detect the emotions and polarity of the tweets. More specifically, TextBlob [
70] and Valence Aware Dictionary for Sentiment Reasoning (VADER) [
71] were used to conduct the polarity detection while the National Research Council Canada (NRC) Word-Emotion Association Lexicon (EmoLex) [
72] was used to detect the emotions within the tweets. Furthermore, the emotions detected are in line with Plutchik’s wheel of emotions, which consists of eight basic emotions which are paired, and opposing emotions cannot be felt simultaneously [
73]. The pairs of emotions are: (i) surprise and anticipation, (ii) joy and sadness, (iii) fear and anger as well as (iv) acceptance and disgust.
3.2. Topic Modeling
Topic models aim at identifying the underlying topics and affinities within text datasets and provide actionable insights by extracting the intellectual structure, semantics, and hidden variables [
74,
75,
76,
77]. Moreover, a priori annotations are not required to develop topic models as they constitute unsupervised ubiquitous tools that need only the text datasets and the specific number of topics to be recognized [
78,
79,
80]. Due to its flexibility and effectiveness, topic modeling is widely used to analyze social media data [
81].
The Latent Dirichlet Allocation (LDA) method was selected to create the topic models. LDA is a probabilistic model which analyzes a set of documents, it is one of the most popular methods for topic modeling and has been effectively used to examine Twitter and social media data [
82,
83,
84]. Particularly, LDA is a three-level hierarchical Bayesian model which can be used on discrete datasets and represents each item as a finite mixture over an underlying set of topics [
85].
3.3. Limitations and Challenges
Some limitations to this study that can be mentioned involve the use of only one social media platform and the retrieval of tweets written only in English. Additionally, some data fields could not be analyzed as they are private by default and cannot be retrieved unless users themselves set them to public status. An example of that is the field “country”. In this case, although some tweets contained the country, there is no reference to it in this article as even after normalizing the country data, the data did not reflect the actual numbers. Another field that could be of particular interest which was not included in this study for the same reason is the field “occupation”. As a result, it was not possible to detect if a specific tweet was related to a particular firm or enterprise and used for promotional or marketing reasons. Thus, we opted to create separate datasets for education which used additional keywords related to the educational sector.
Moreover, due to the nature of the study, some limitations involve the sentiment analysis as some tweets could be referring to a specific experience and not to the technologies themselves. This is a common limitation of similar studies. To address it, the educational datasets were manually filtered to include tweets that were directly related to the use of augmented reality and virtual reality in education. Finally, it is worth noting that the use of social media as a means for promotion and marketing may result in particular users or enterprises expressing intentionally positive or negative perspectives.
4. Results
To address the main research questions and meet the aims of the study, the aforementioned methodology was used to generate four datasets containing data from Twitter. The time period of the search was set from January 2010 to December 2020. This choice was made to include years that were key to the development and adoption of augmented reality and virtual reality, to provide a more coherent and complete overview of their advancement and to present results of data which was gathered before the COVID-19 pandemic.
In total, 17,278,040 tweets were retrieved out of which 6,820,696 were related to augmented reality and 10,457,344 to virtual reality. The datasets generated were separated into (i) general use of augmented reality (6,643,458 tweets), (ii) educational use of augmented reality (177,238 tweets), (iii) general use of virtual reality (10,157,427 tweets), and (iv) educational use of virtual reality (299,917 tweets). The data analysis included text mining, sentiment analysis, and topic modeling. In particular, the frequency of words, hashtags, tweets, bigrams, and trigrams as well as the polarity and sentiment of the tweets were analyzed as a whole and per year. Additionally, the topics emerged were identified. When appropriate, cross-validation was conducted to verify the accuracy of the results.
4.1. General Use of Augmented Reality
According to the results of the word frequency analysis, reality, augmented, ar, vr, and app were the top-5 most commonly used words.
Table 1 depicts the top-40 most common words. #AR, #ar, #VR, #AugmentedReality, and #augmentedreality were the top-5 most common hashtags.
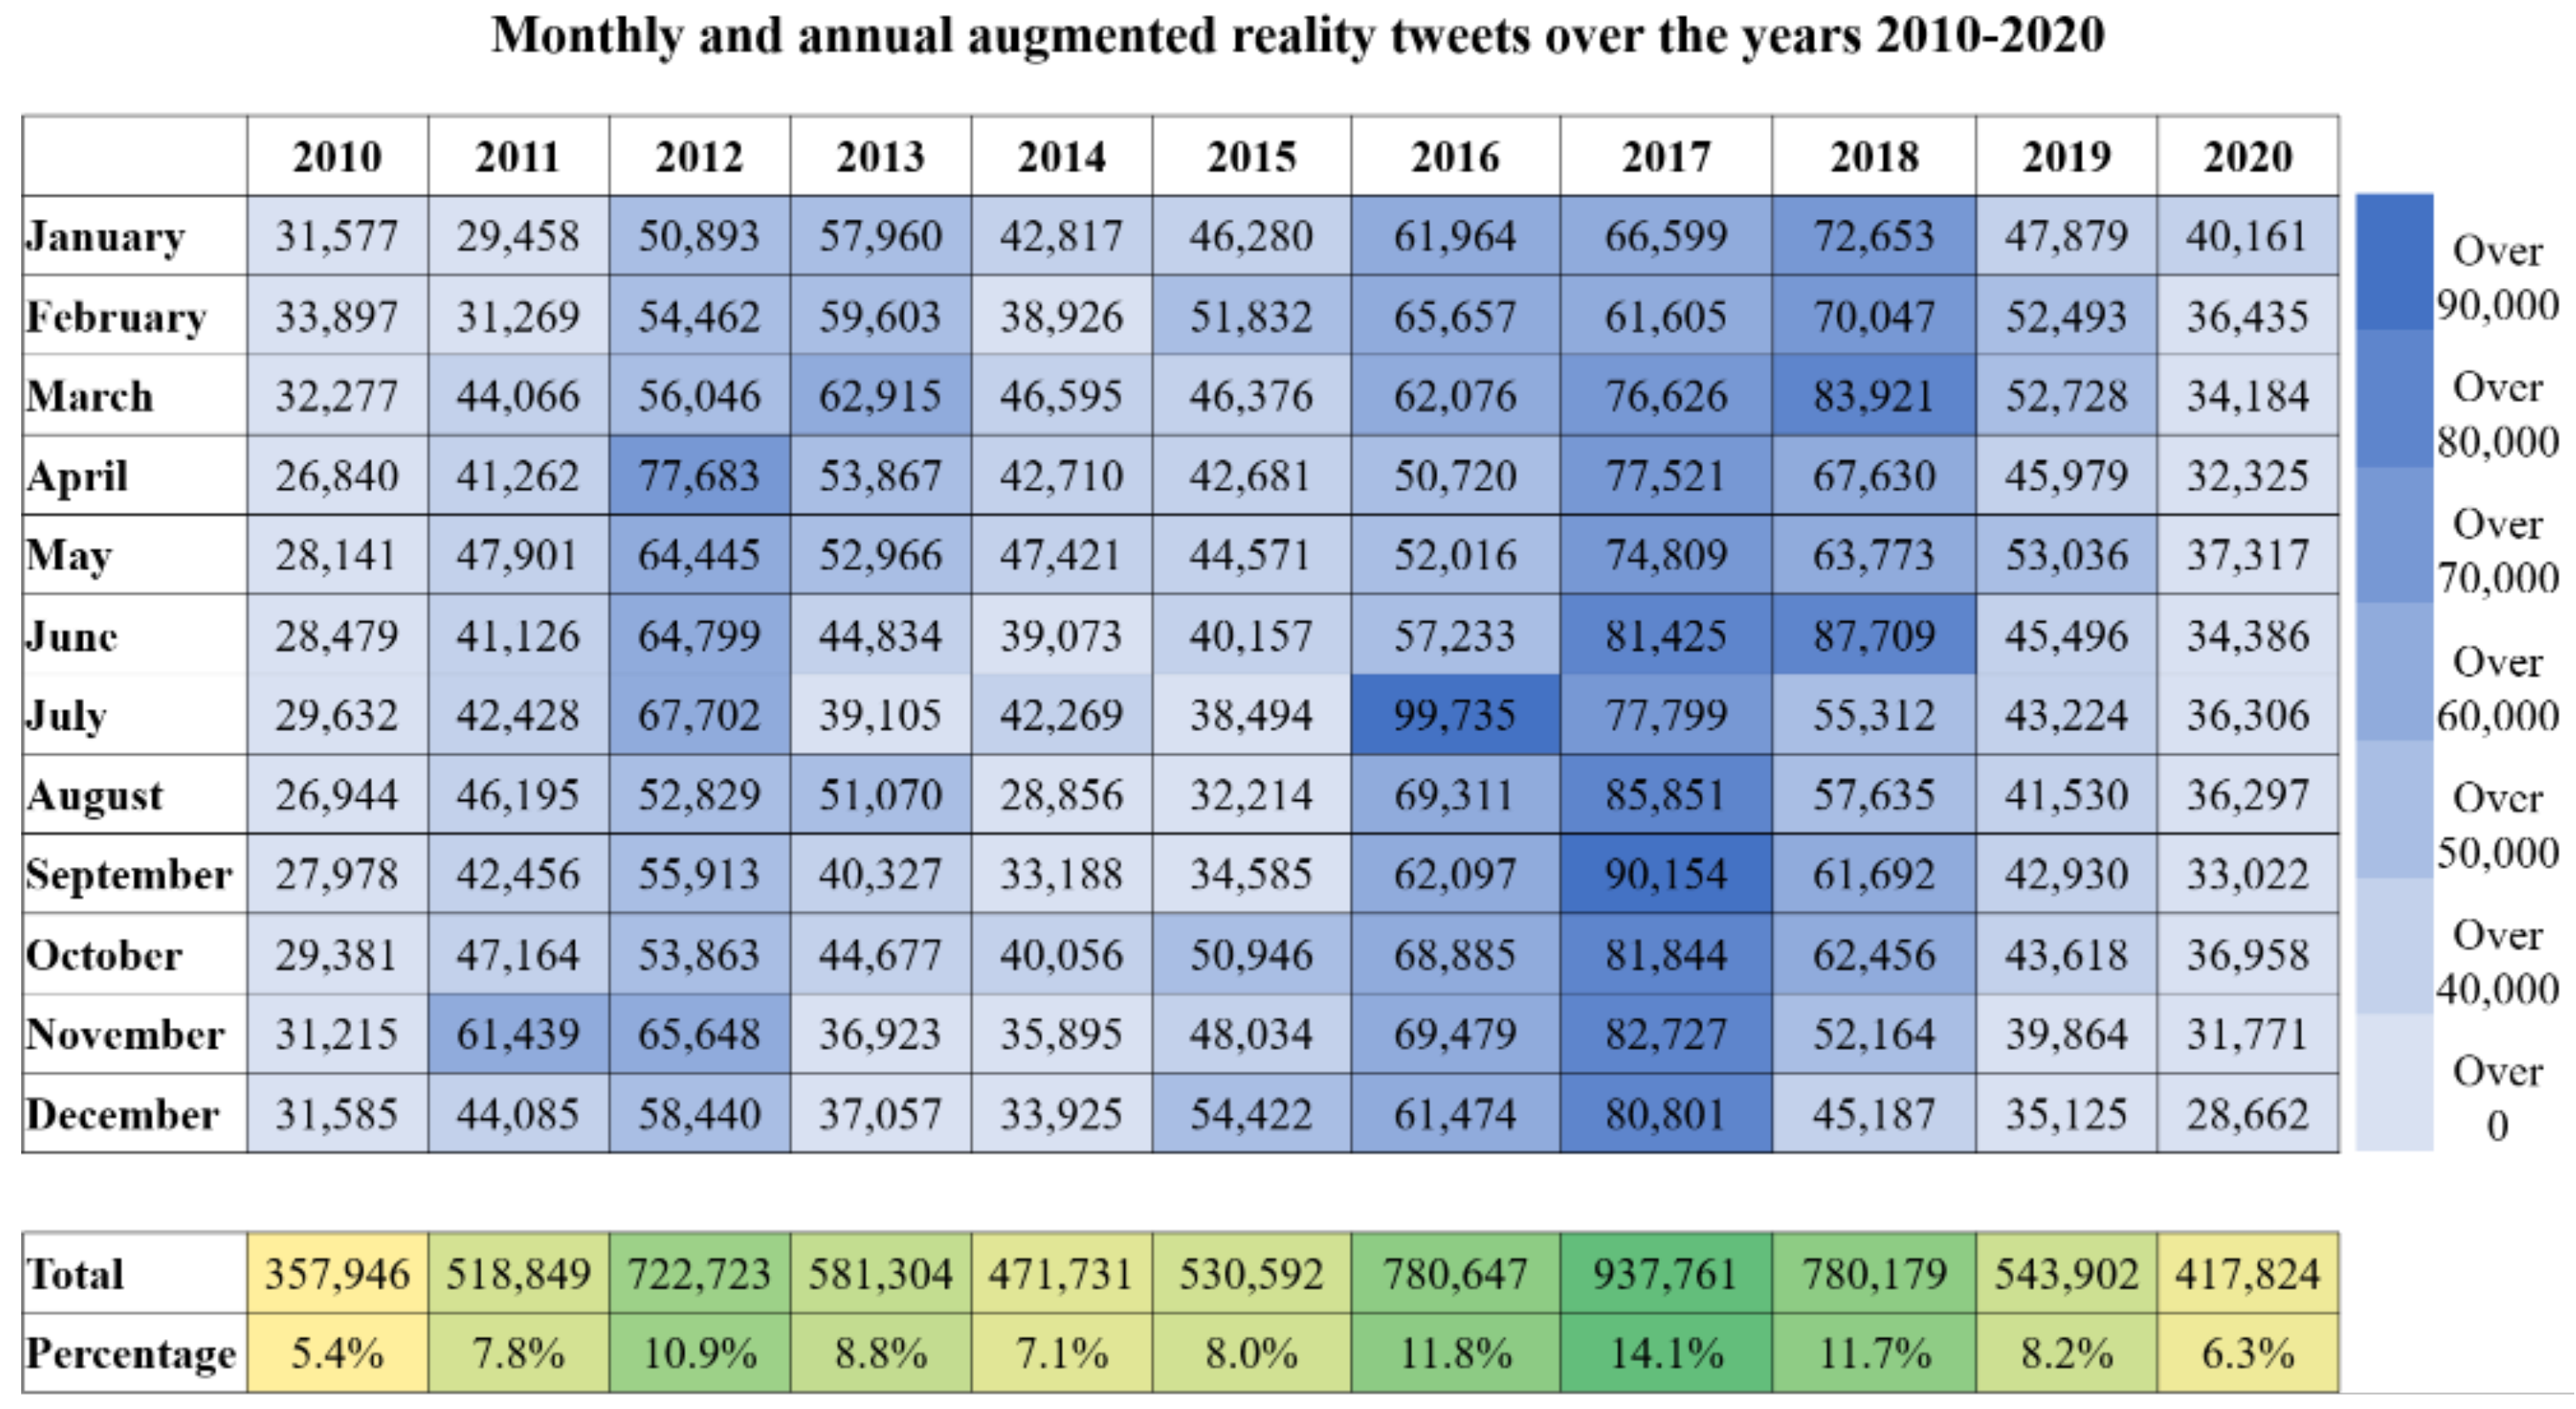
Table 2 displays the top-40 most commonly used hashtags. The frequency of the annual and monthly tweets is presented in
Figure 1. The majority of the tweets were posted in 2017 (14.1%). The frequency of the top-20 most common bigrams and trigrams is showcased in
Table 3 and
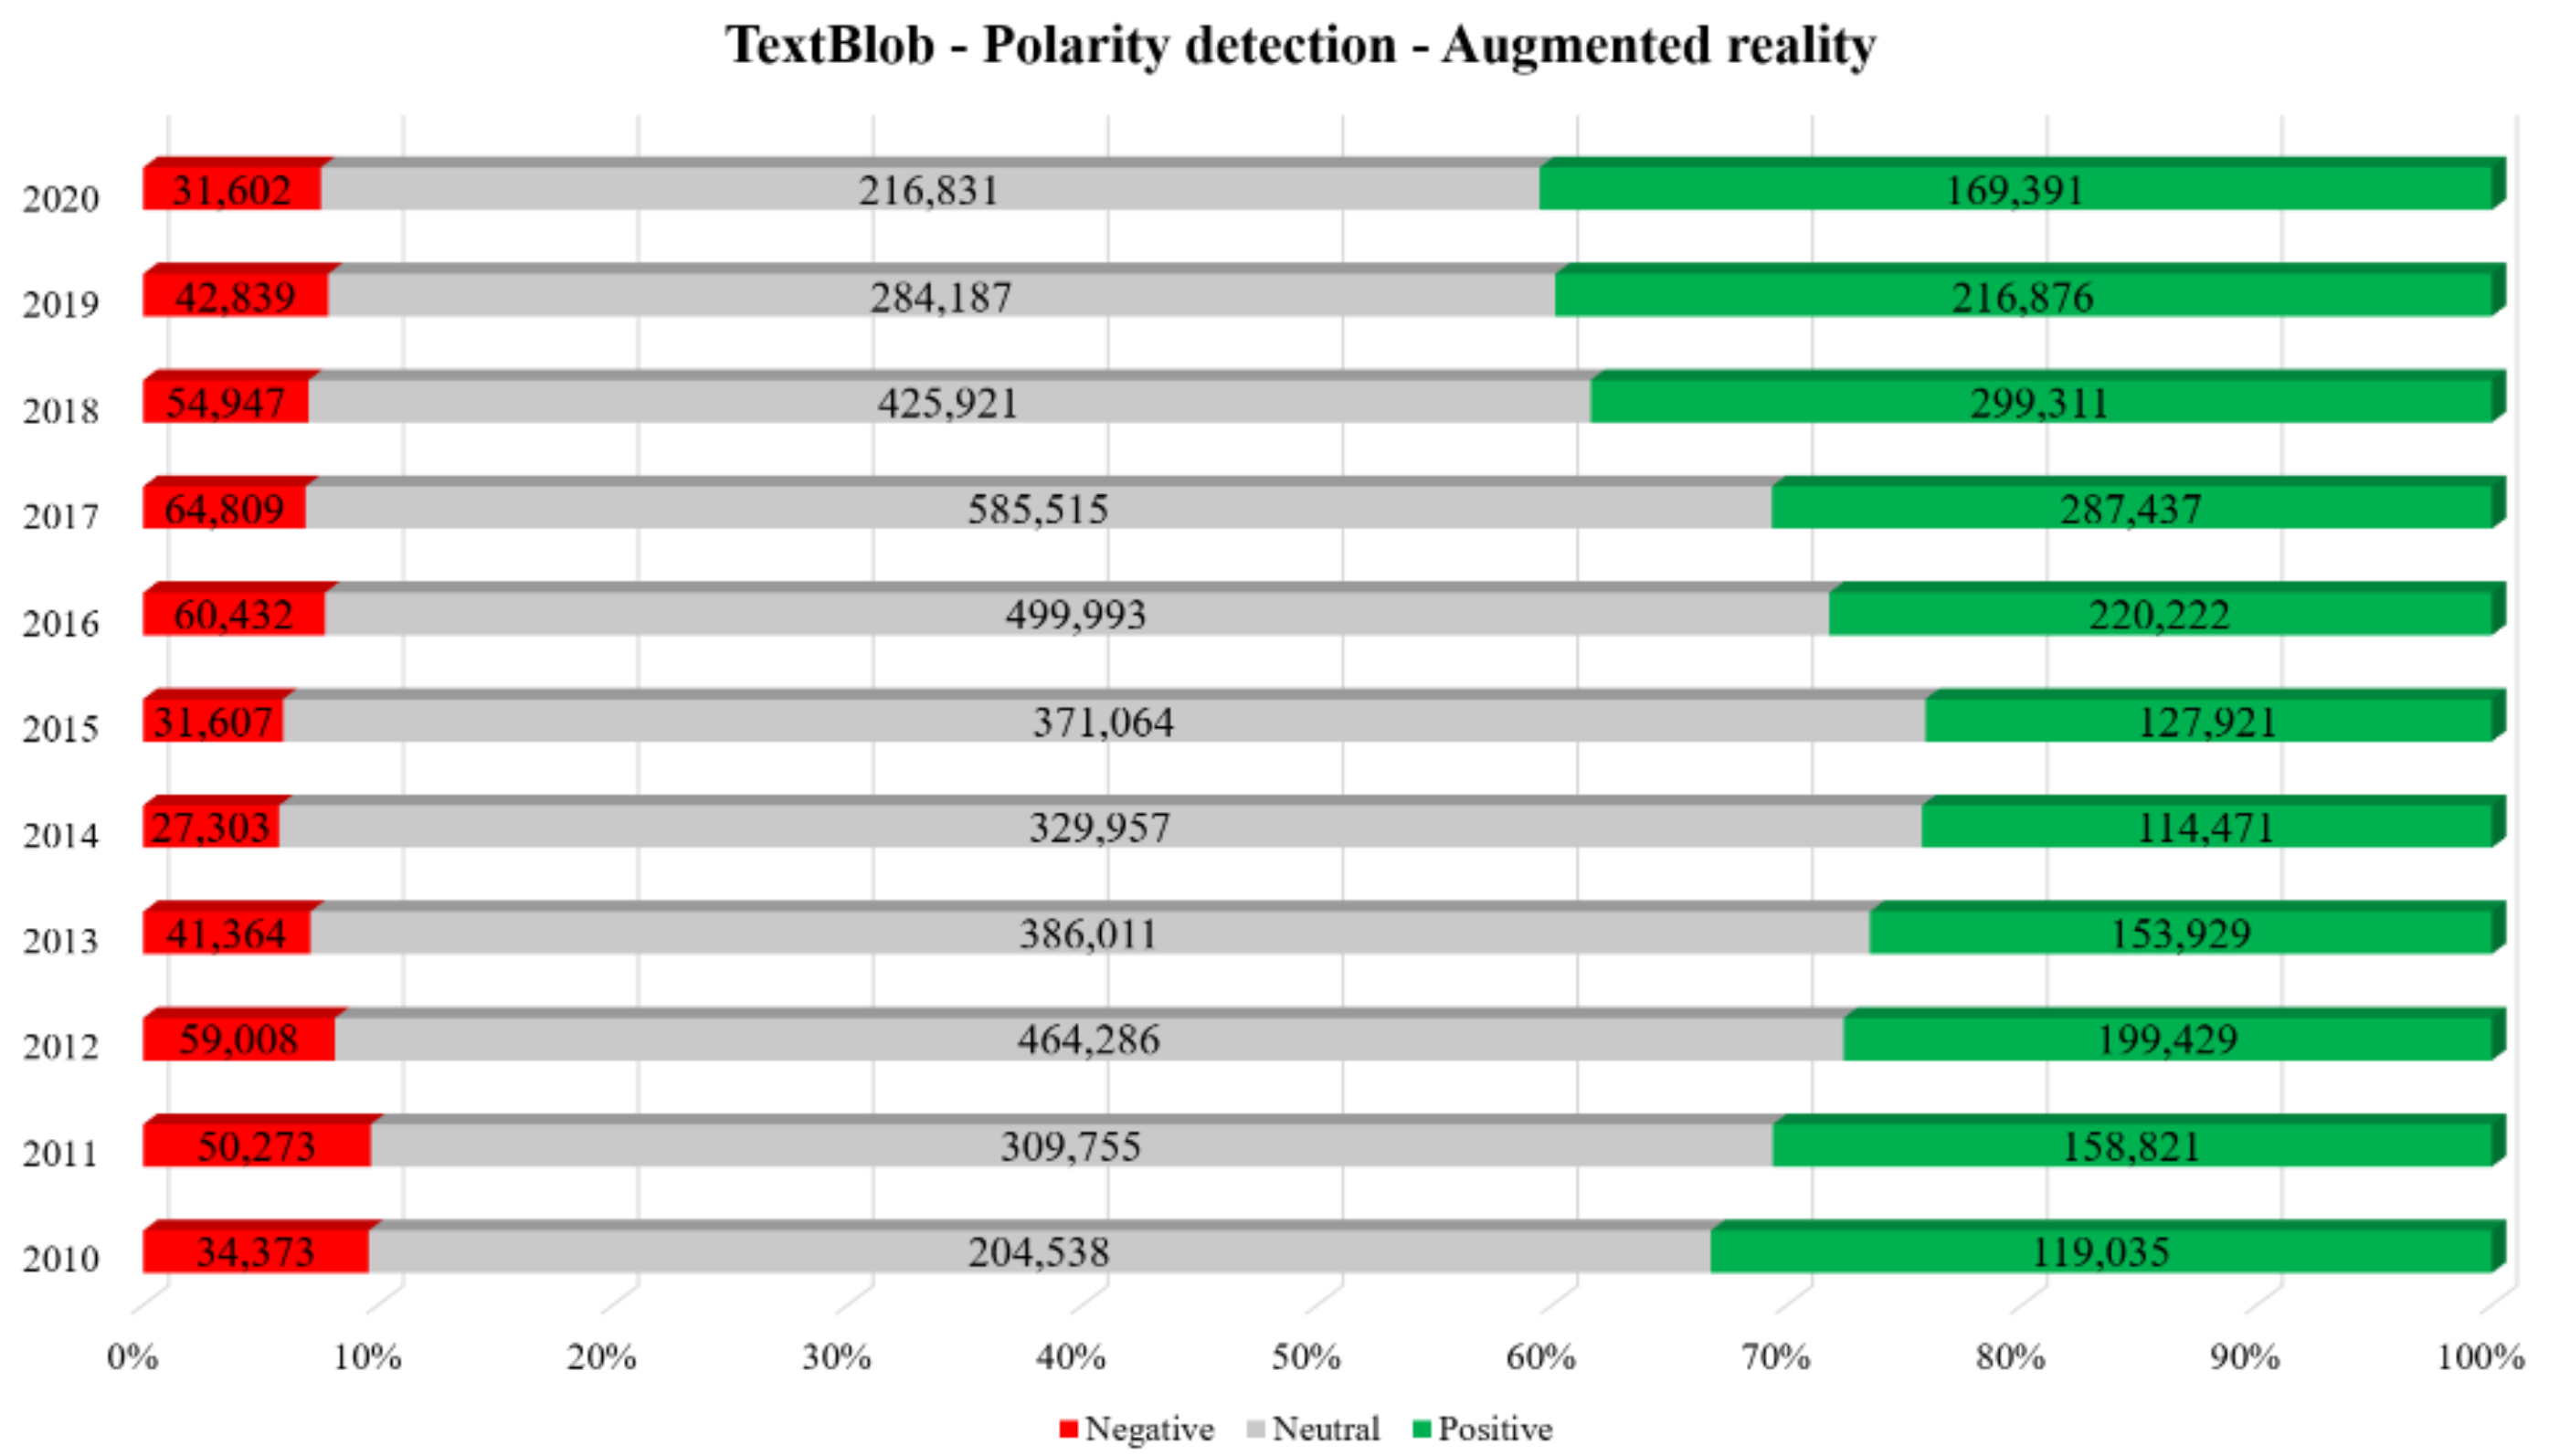
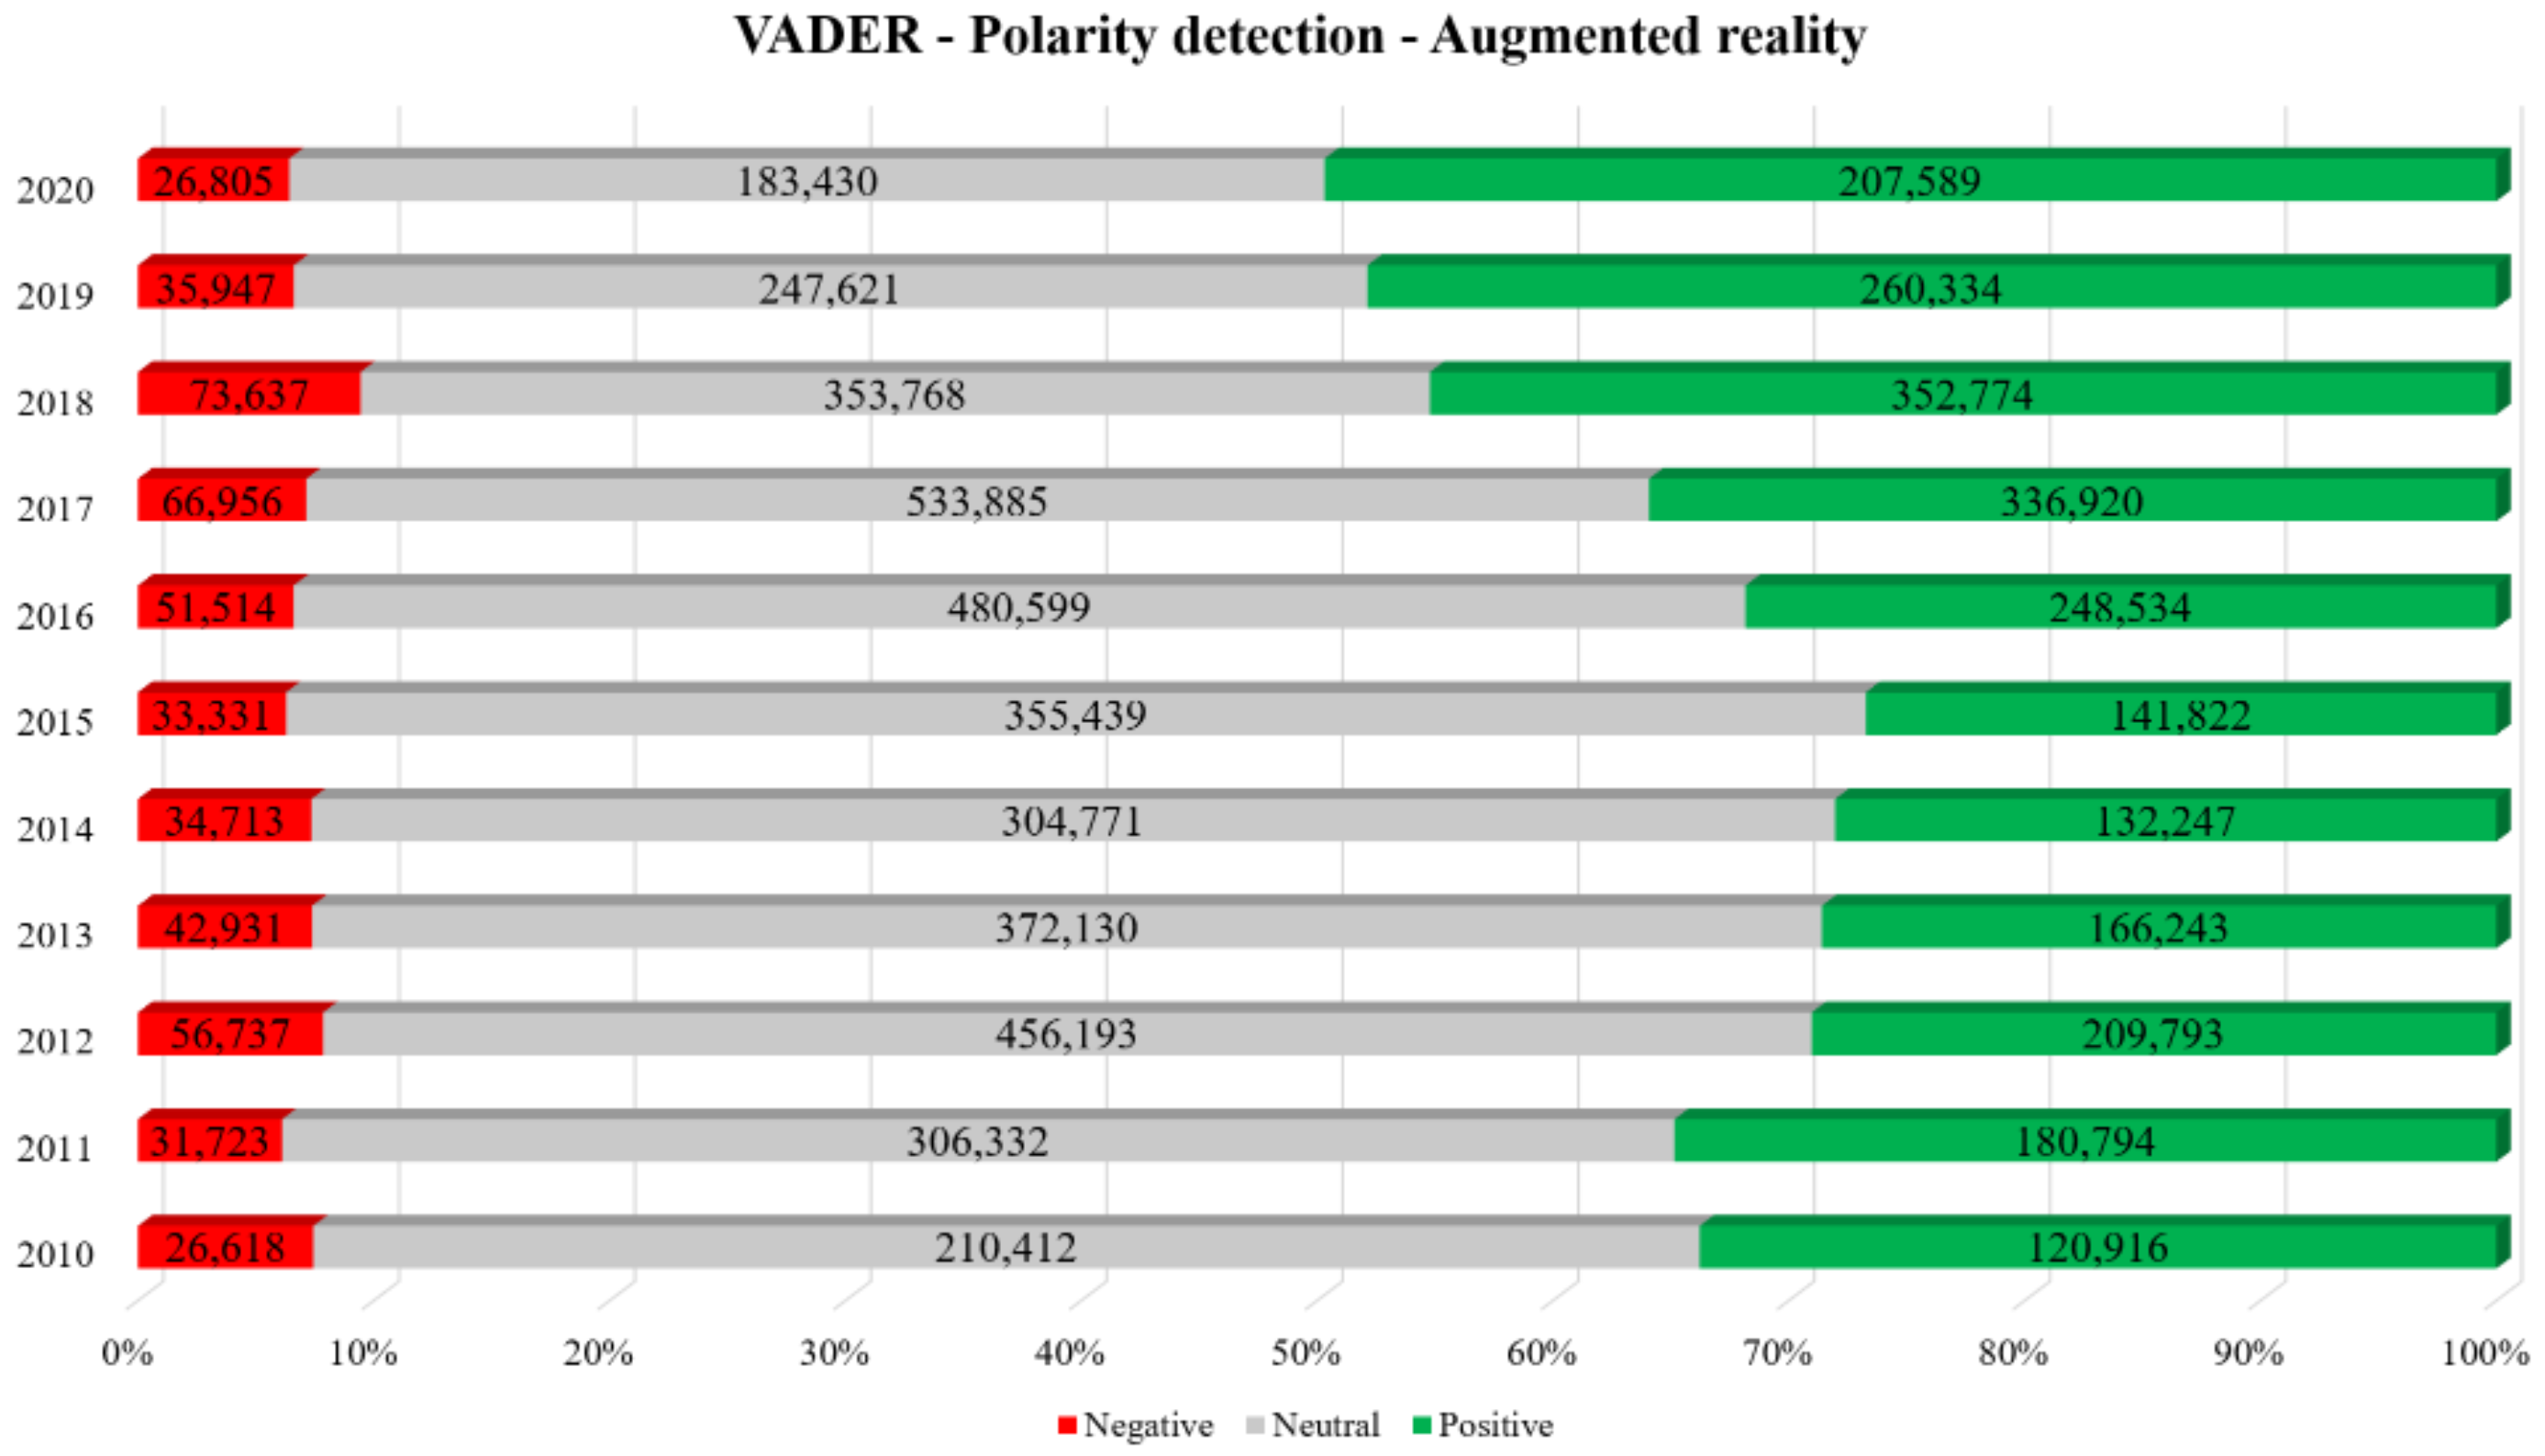
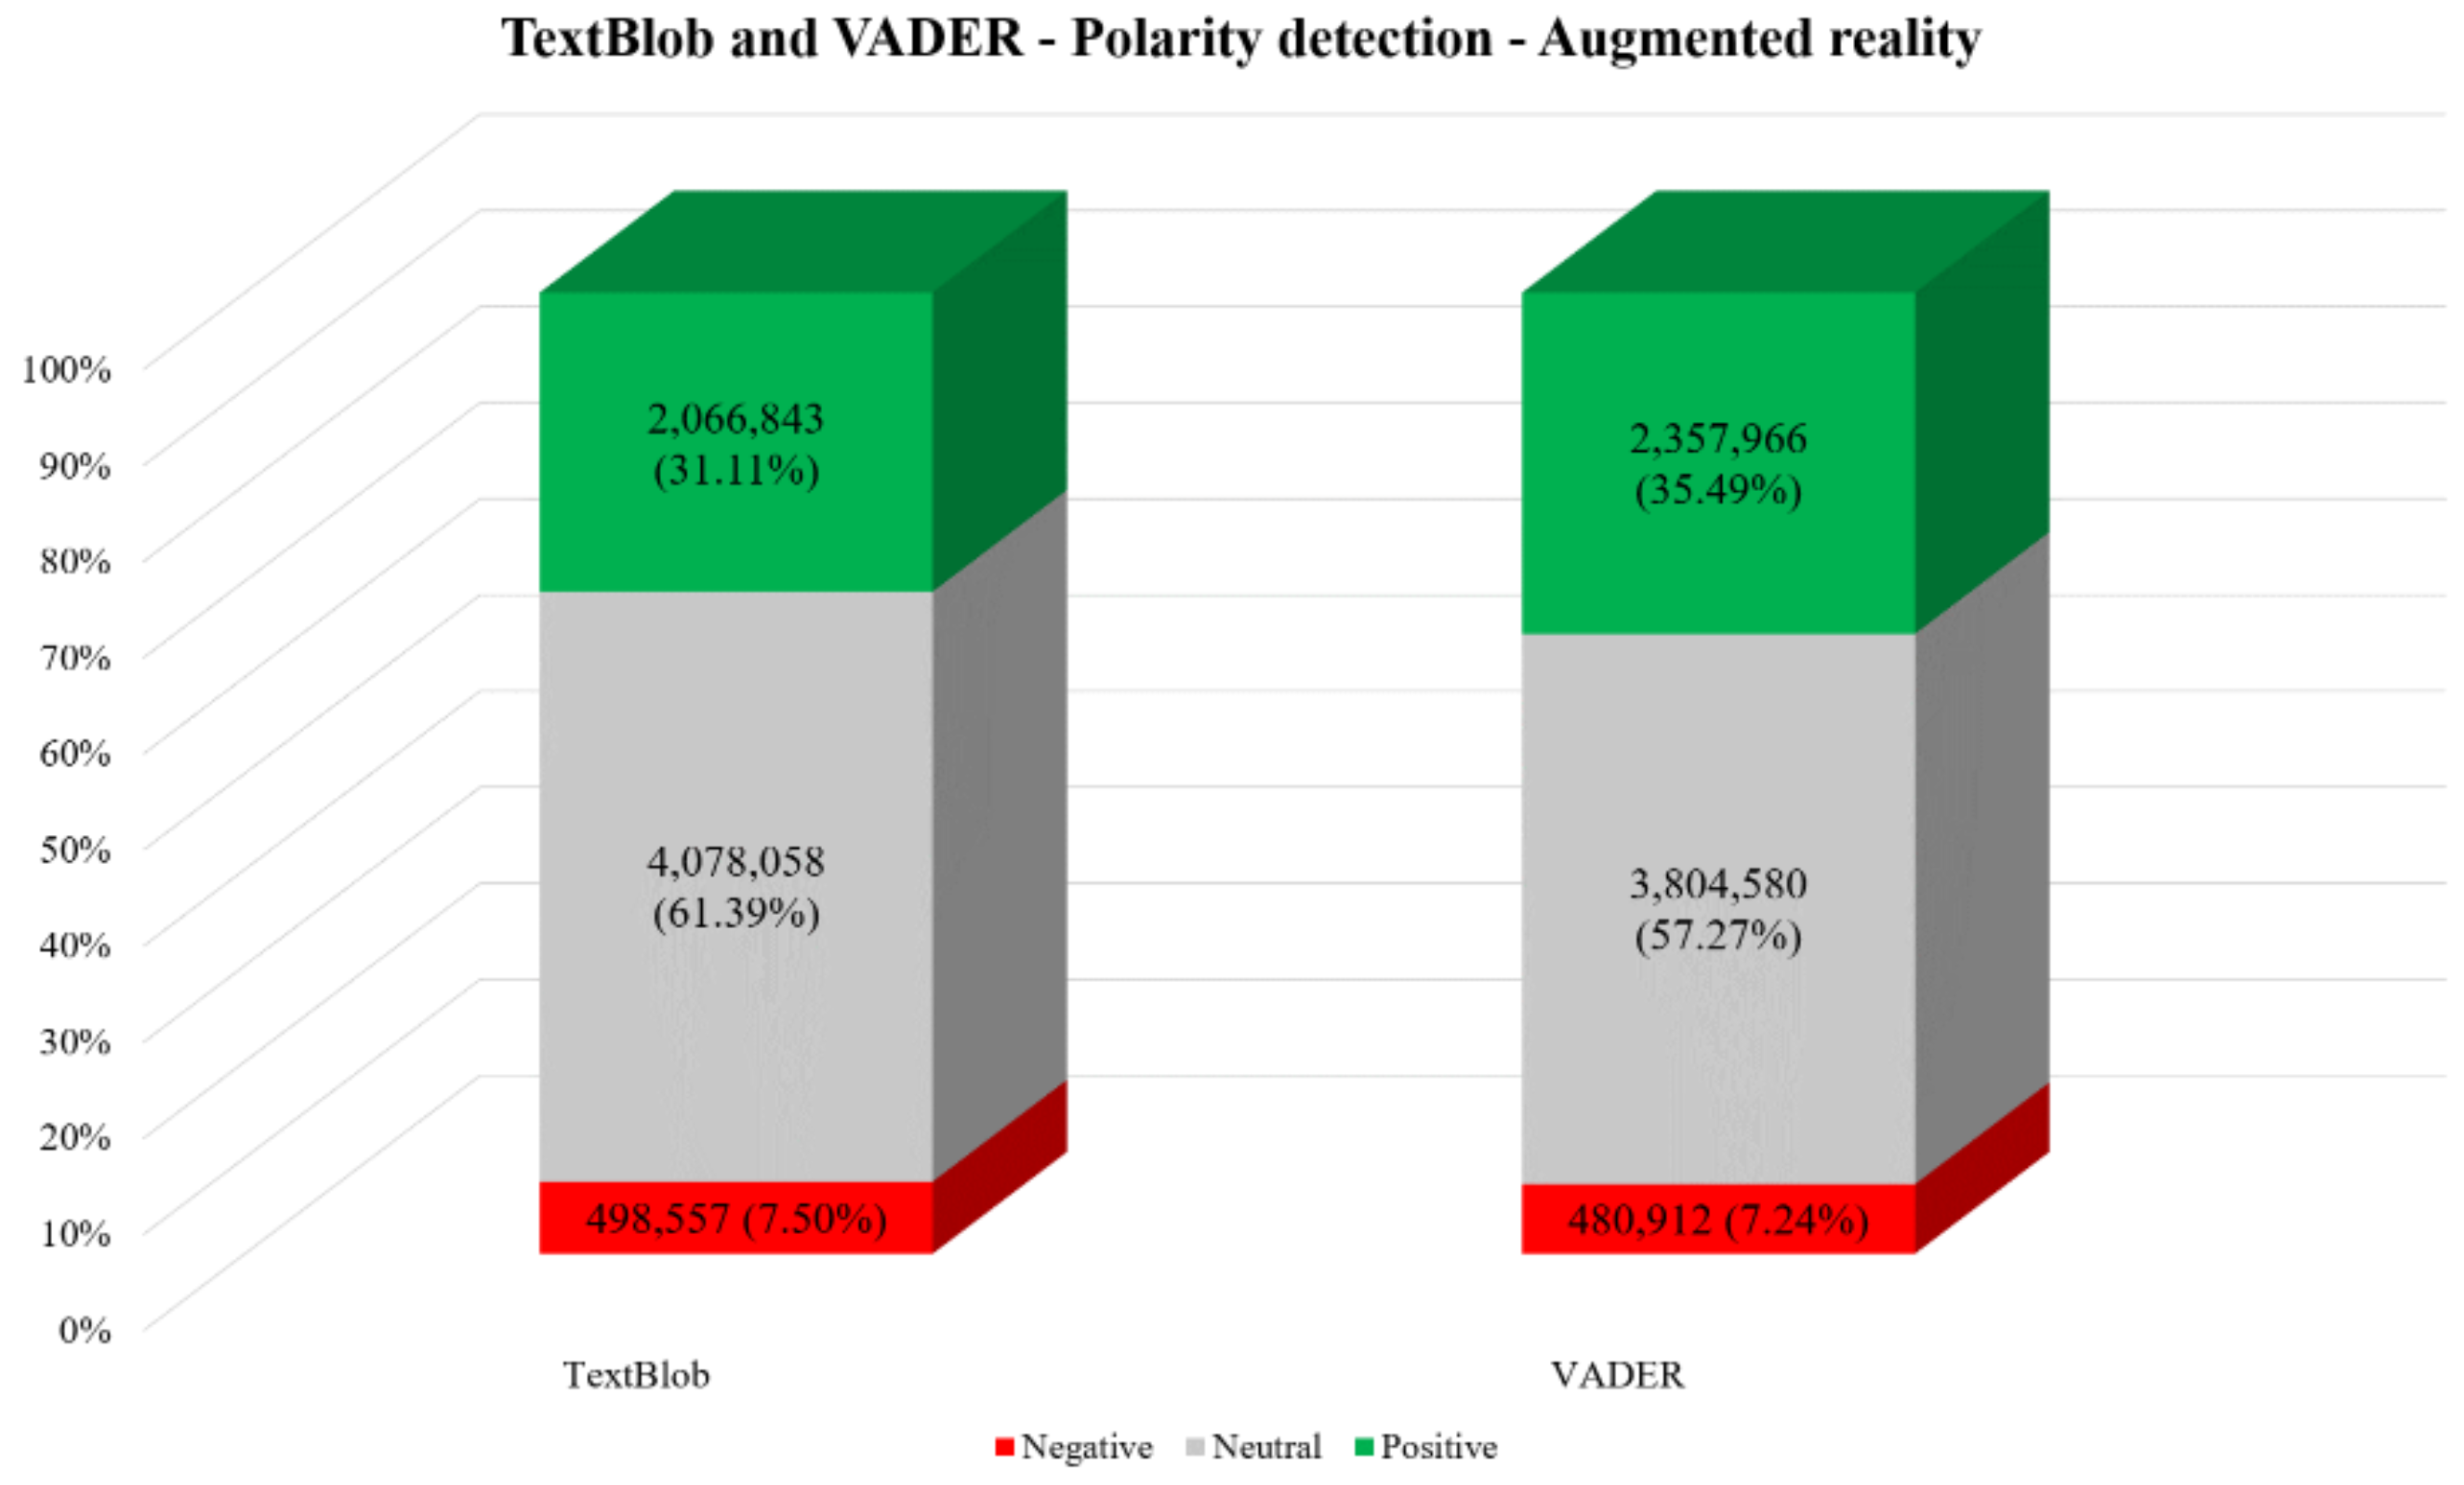
Table 4. Regarding the tweet polarity, the results of both TextBlob and VADER (
Figure 2,
Figure 3 and
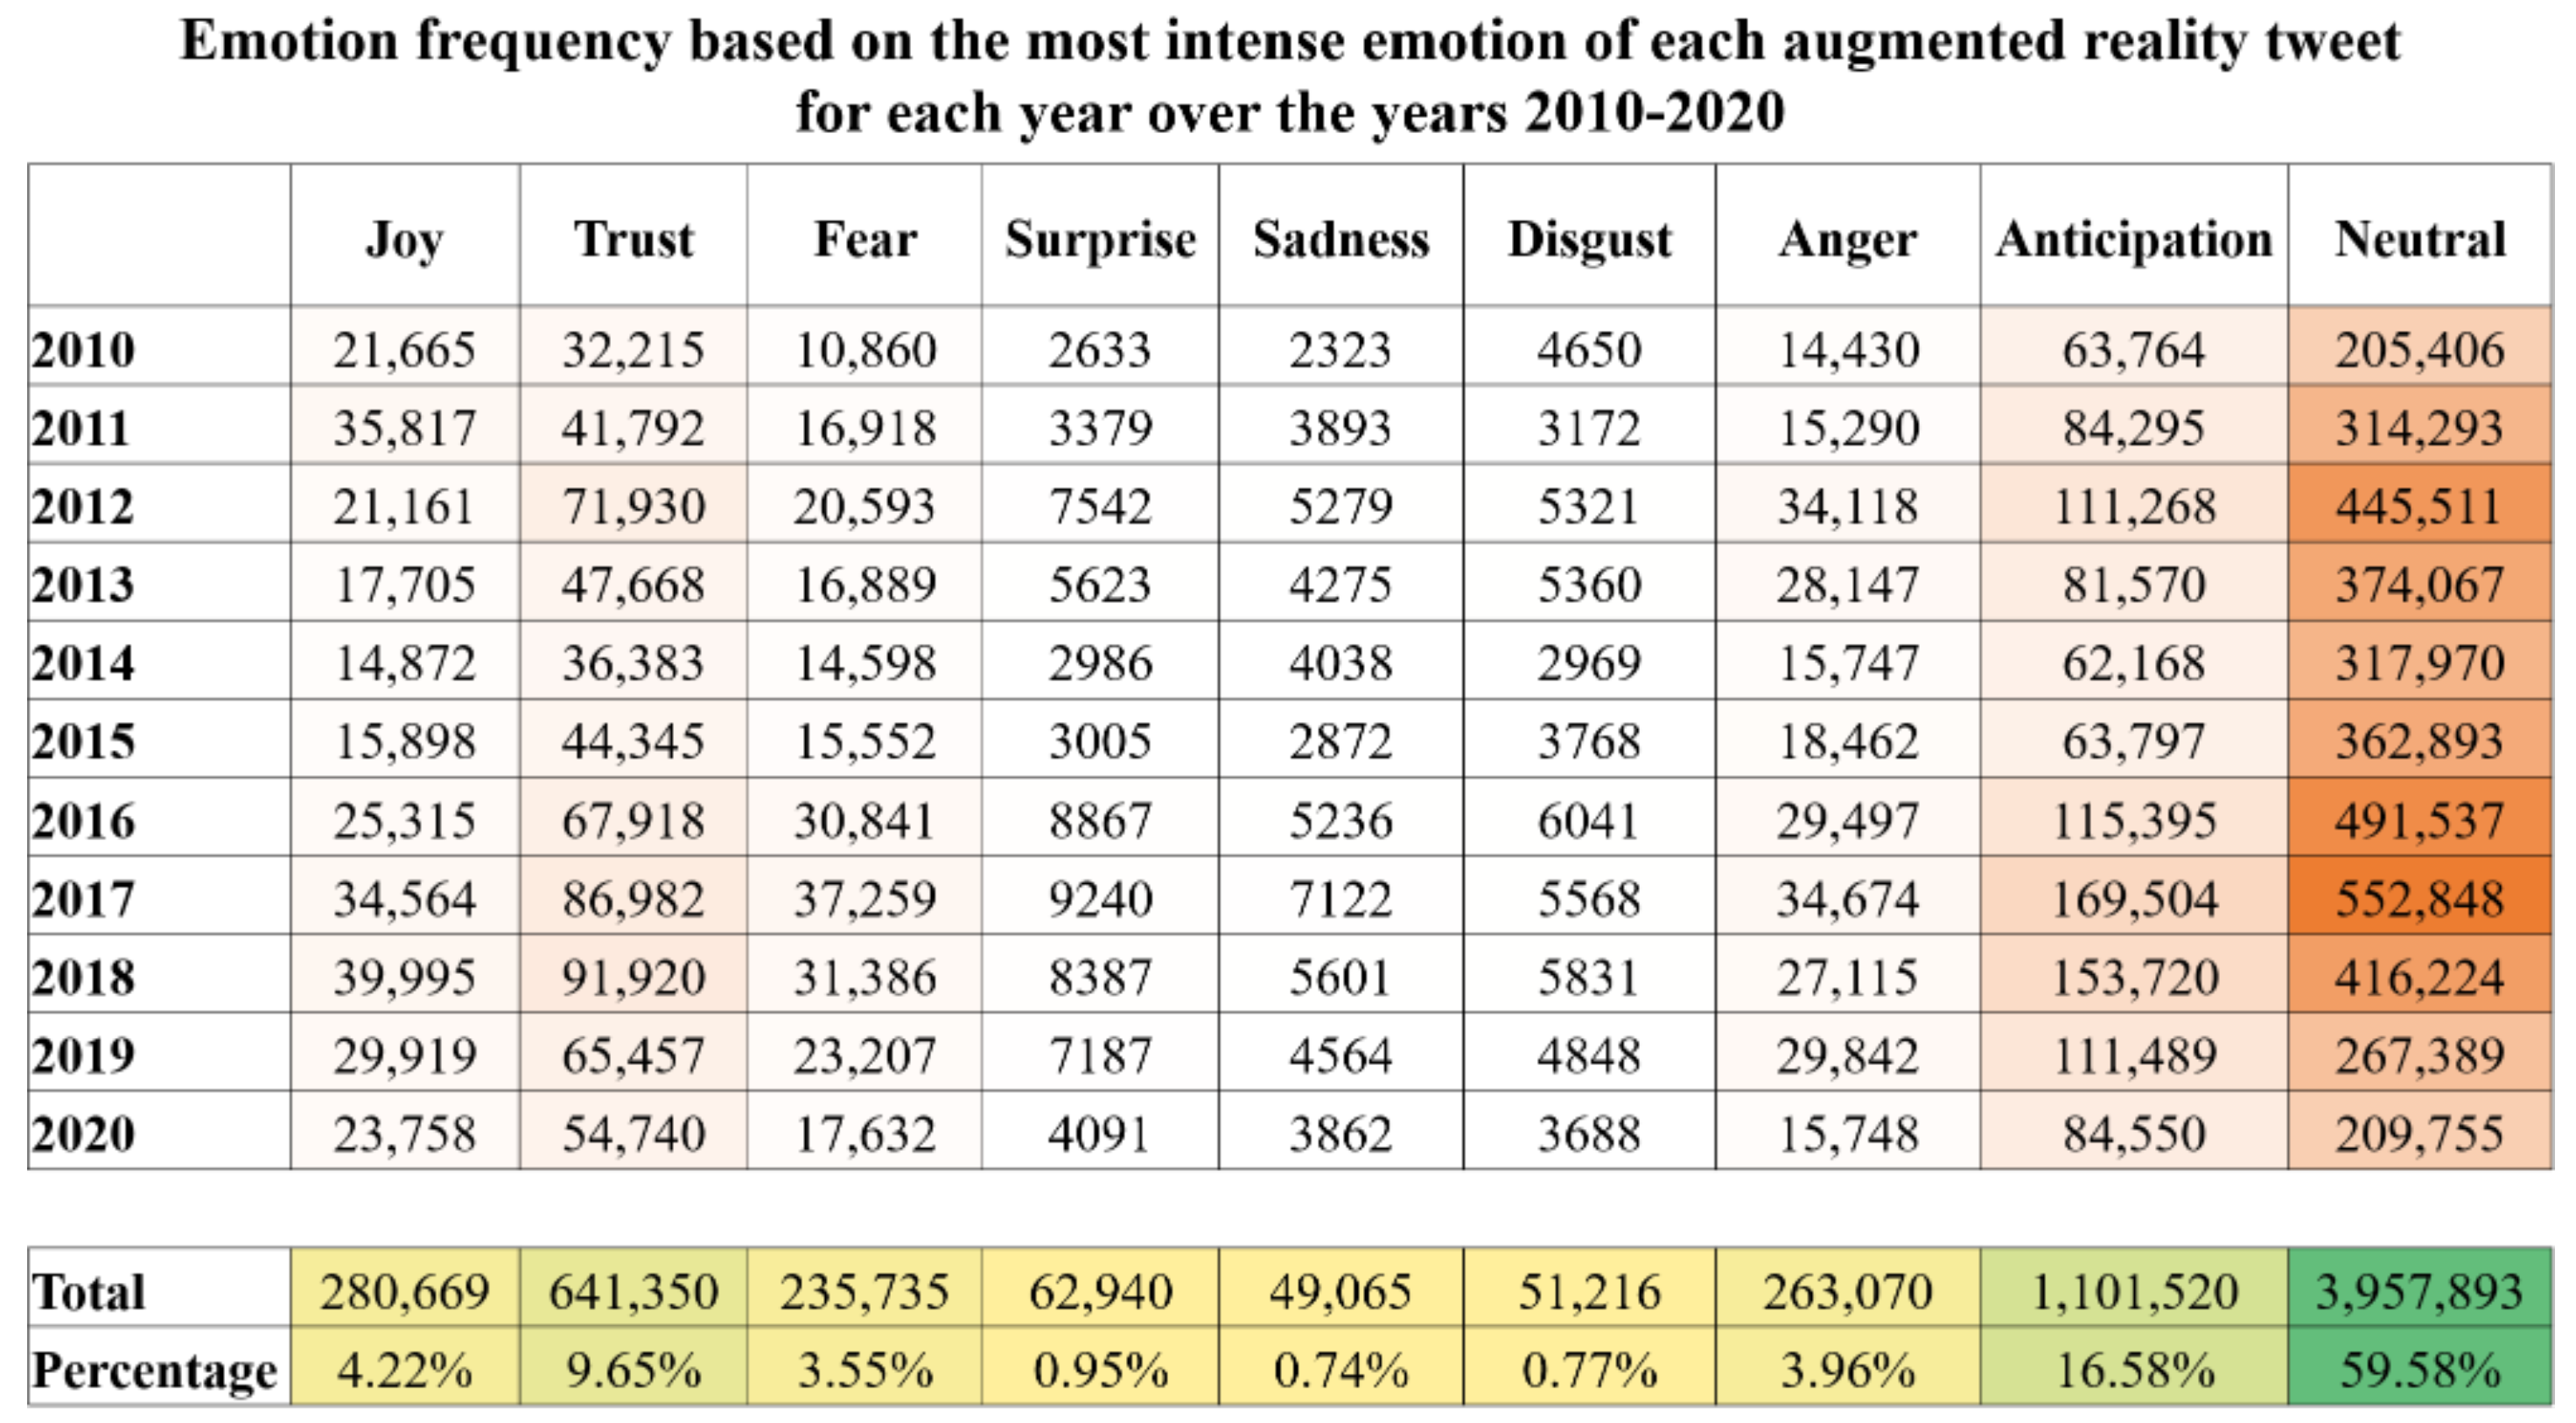
Figure 4) showed the majority of tweets were neutral, followed by positive and negative. The majority of tweets did not express a particular emotion (59.58%). Anticipation (16.58%), trust (9.65%), and joy (4.22%) were the most expressed emotions.
Figure 5 presents the emotion analysis on a yearly basis.
4.2. Educational Use of Augmented Reality
The results of the frequency analysis of the words are presented in
Table 5 while for the hashtags in
Table 6. Reality, augmented, ar, education, and learn were the top-5 most common world while the top-5 most commonly used hashtags were #AR, #VR, #AugmentedReality, #education, and #edtech.
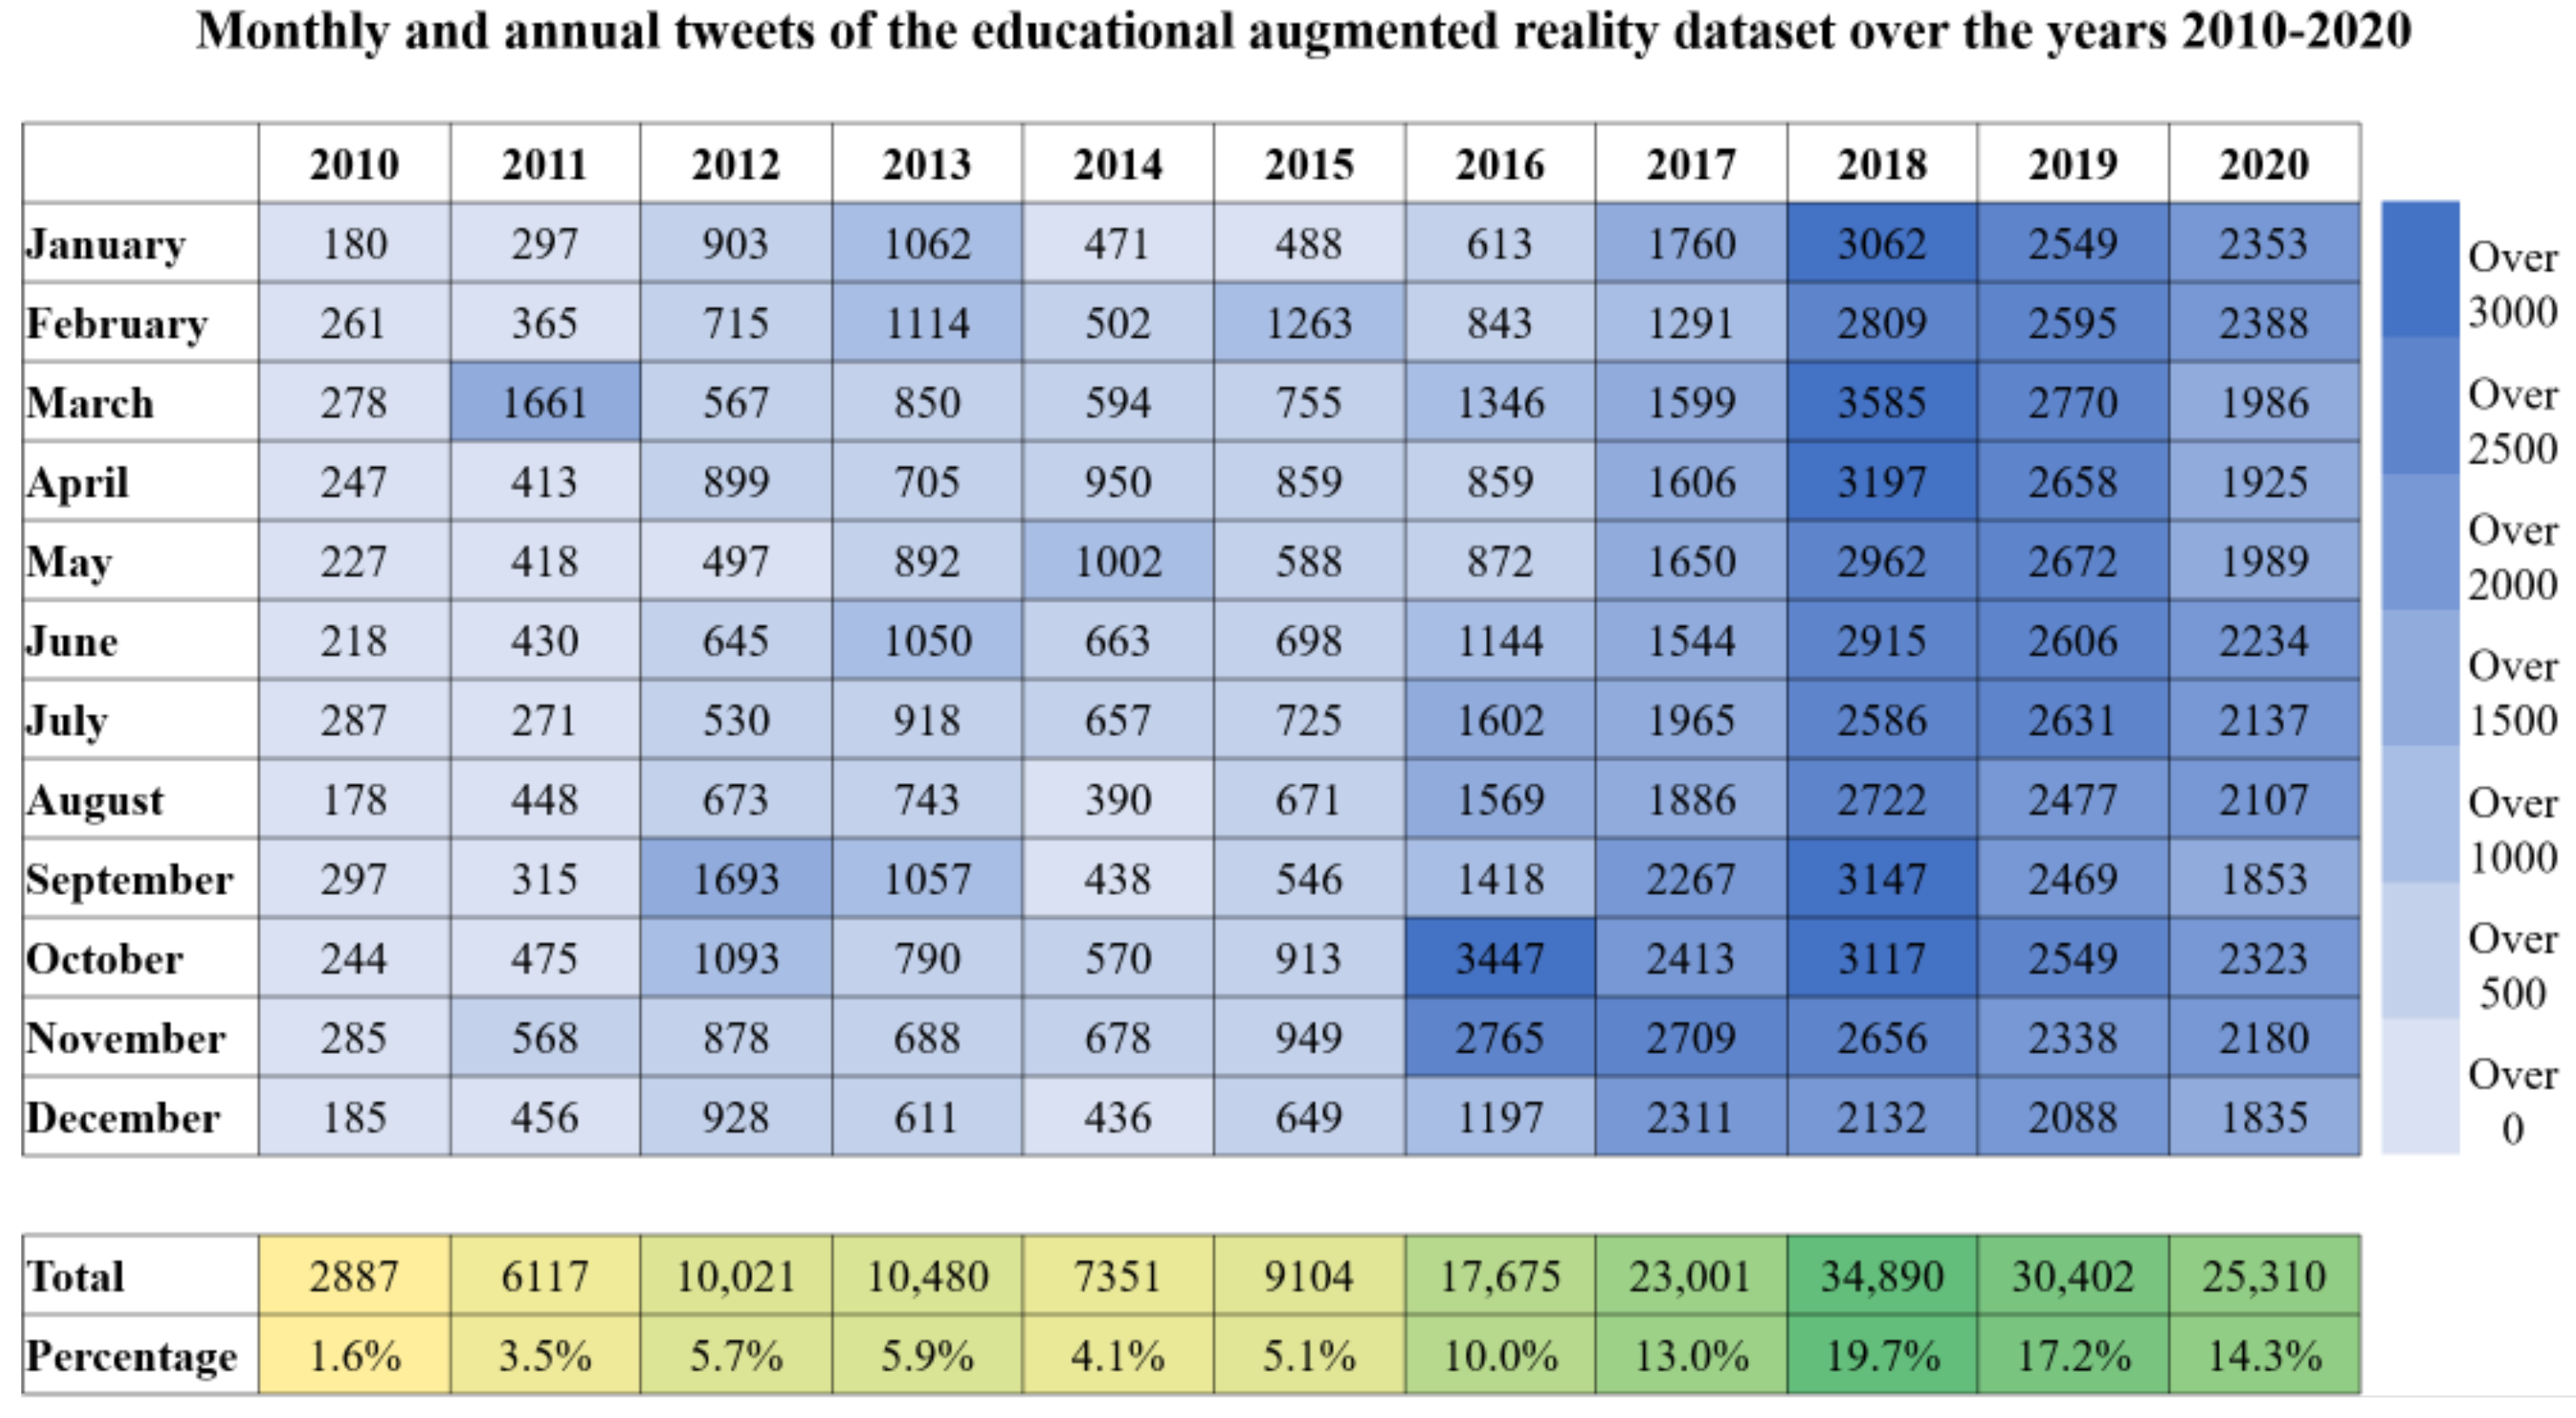
Figure 6 displays the annual and monthly tweet frequency with 2018 (19.7%) being the year with the most relevant tweets. The top-20 most frequently used bigrams and trigrams are presented in
Table 7 and
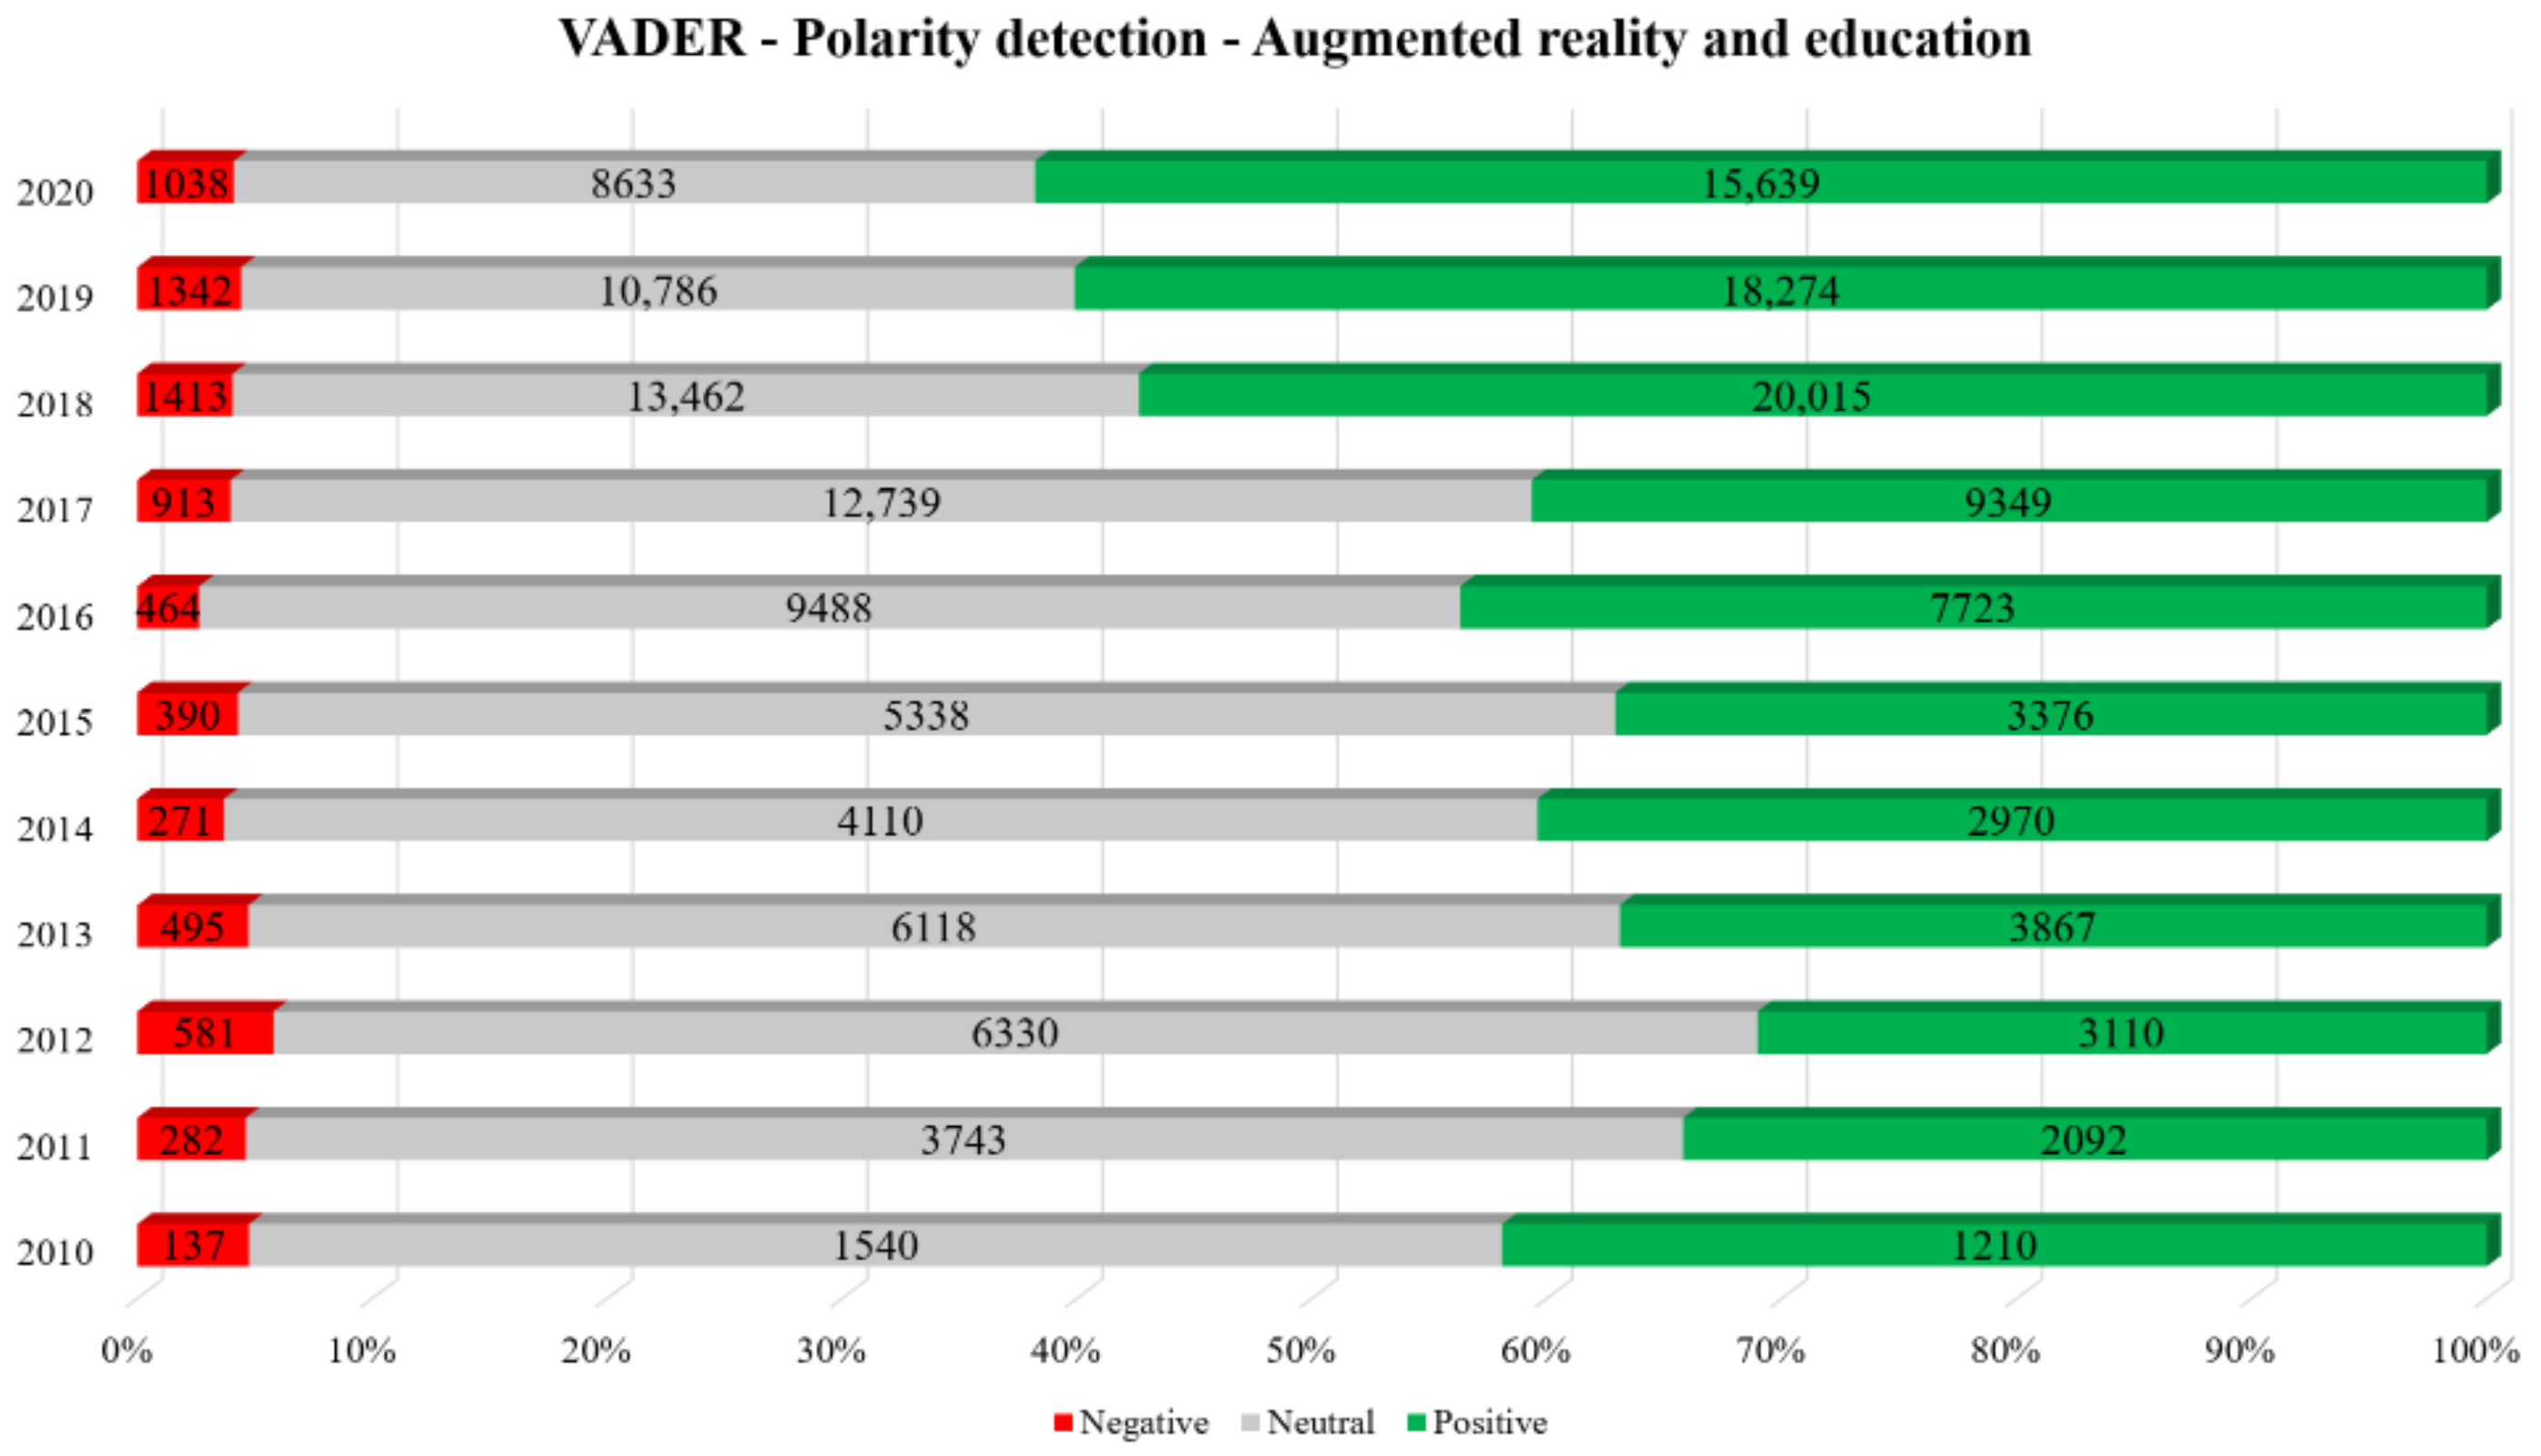
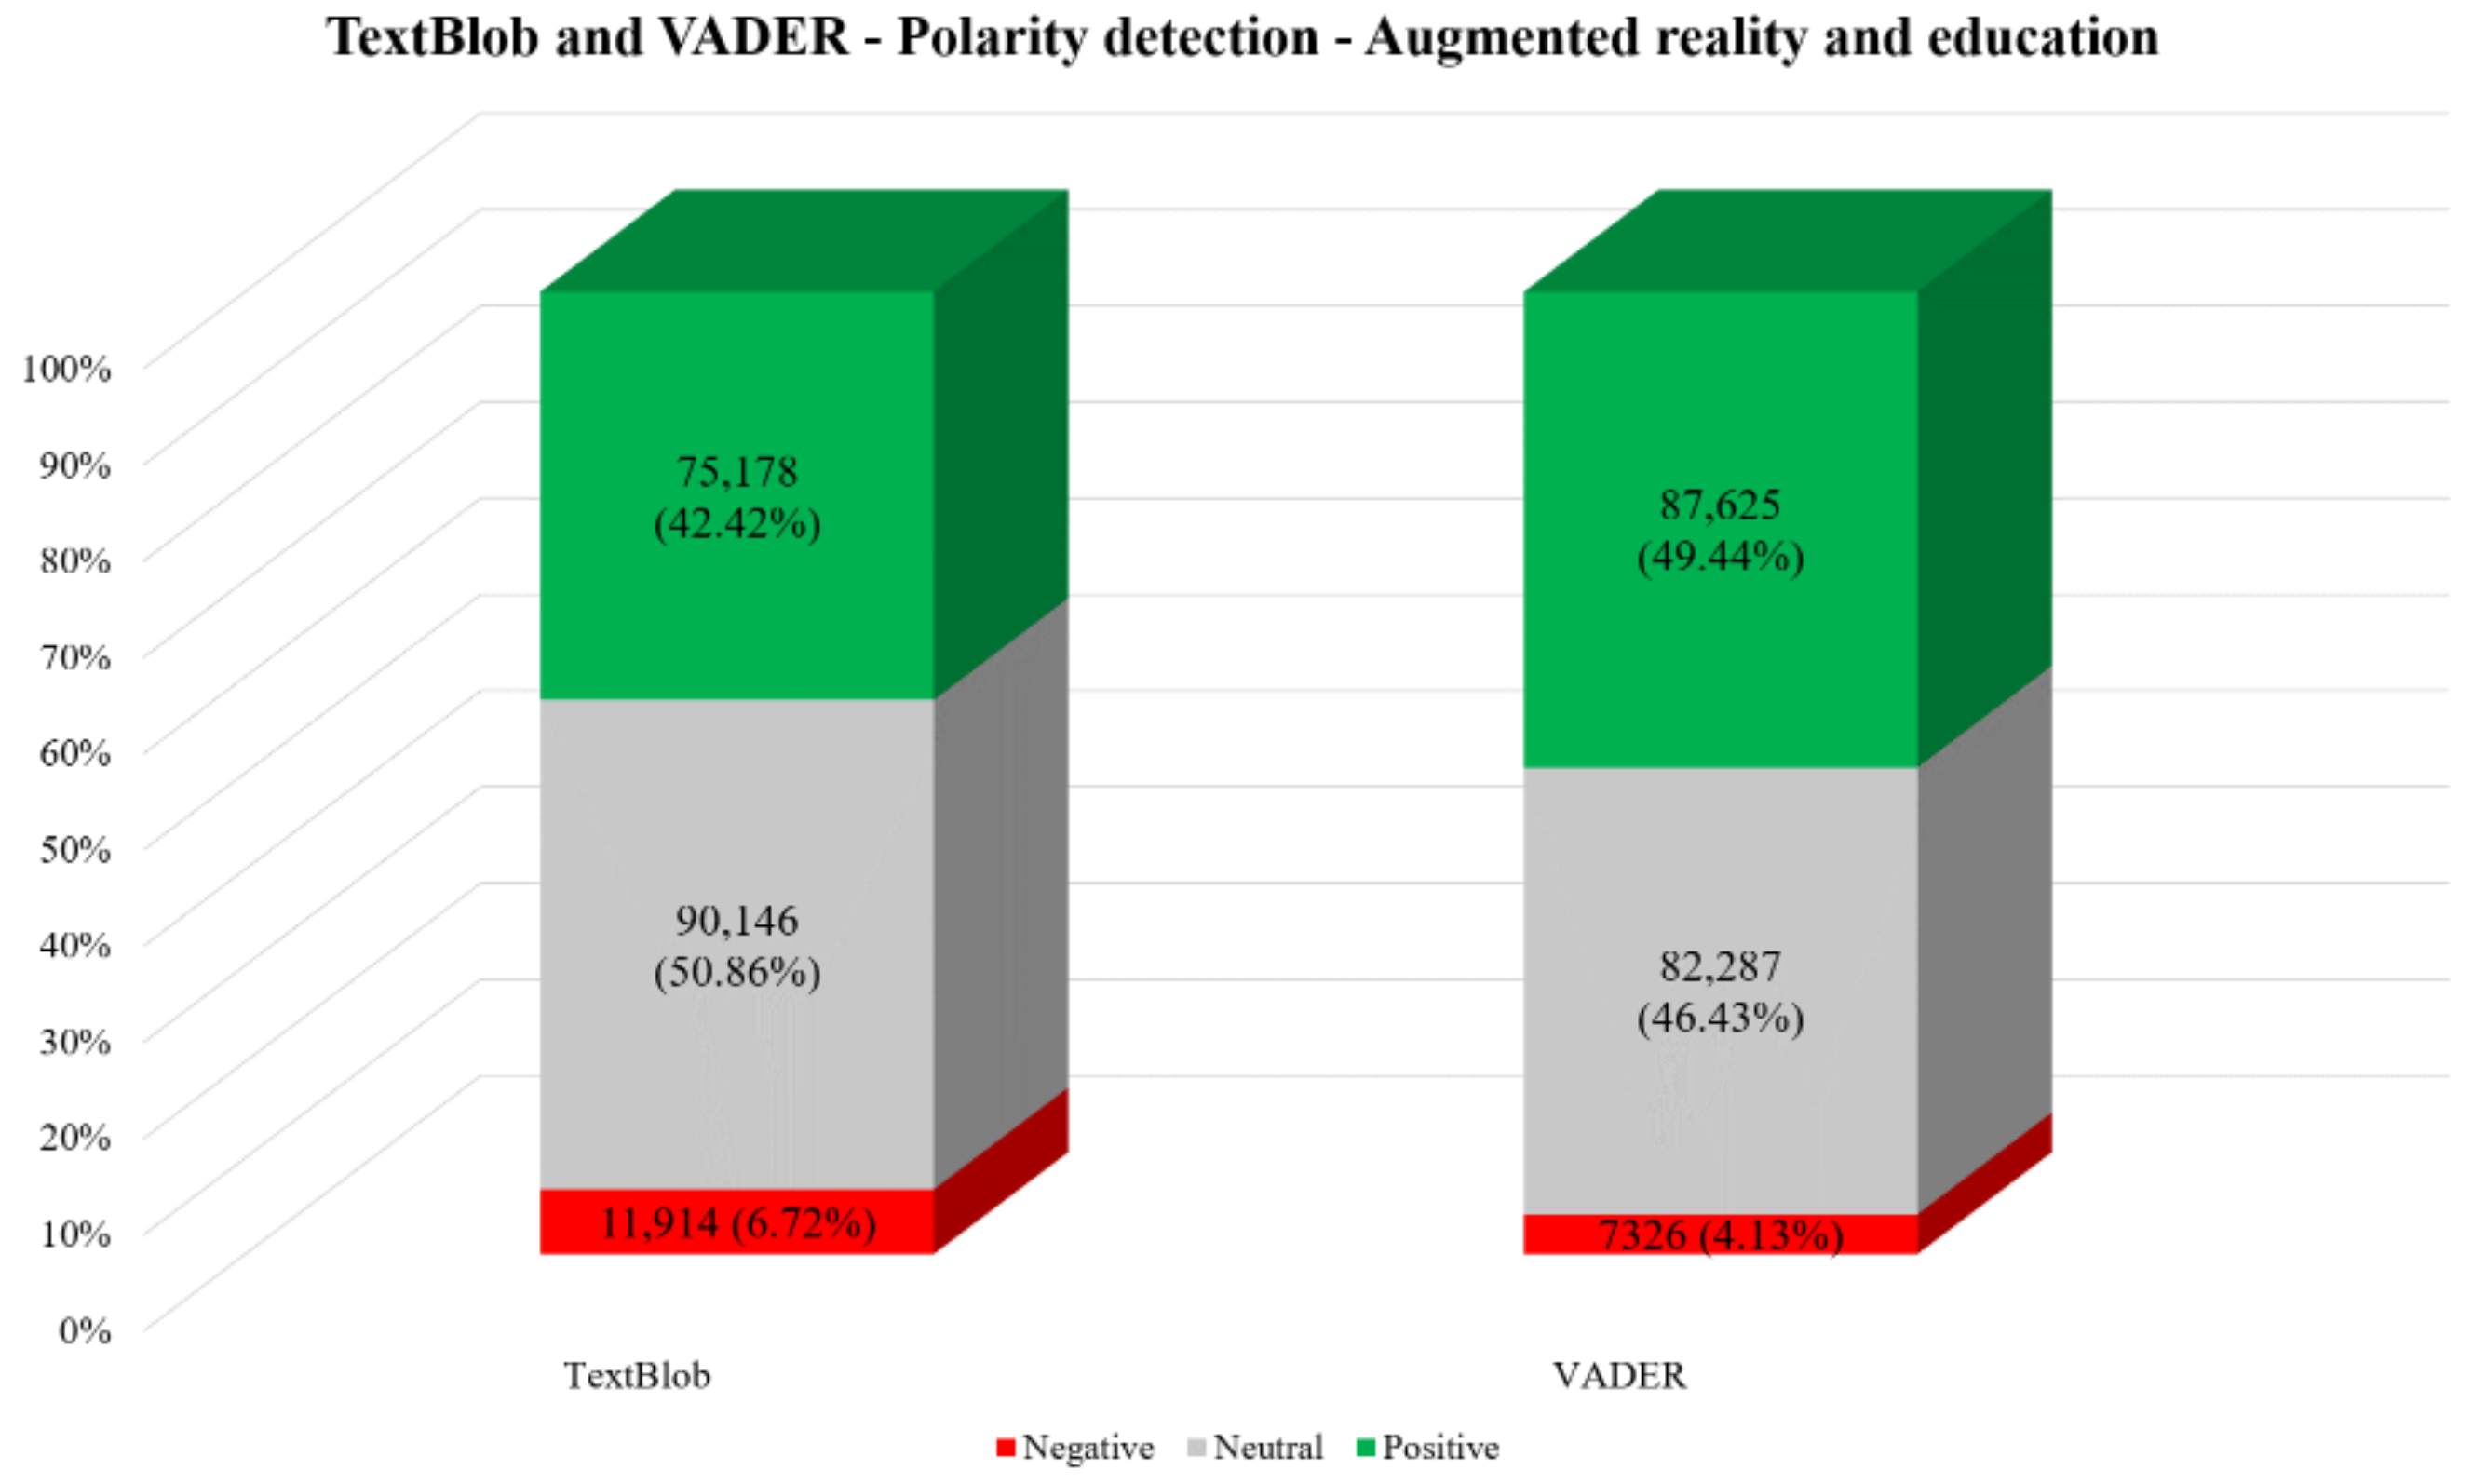
Table 8, respectively. Using TextBlob, the polarity analysis revealed that most tweets were neutral (50.86%), followed by positive (42.42%) and negative (6.72%). When using VADER, the polarity analysis revealed that the majority of tweets were positive (49.44%), followed by neutral (46.43%) and negative (4.13%). The detailed results of the polarity analysis are presented in
Figure 7,
Figure 8 and
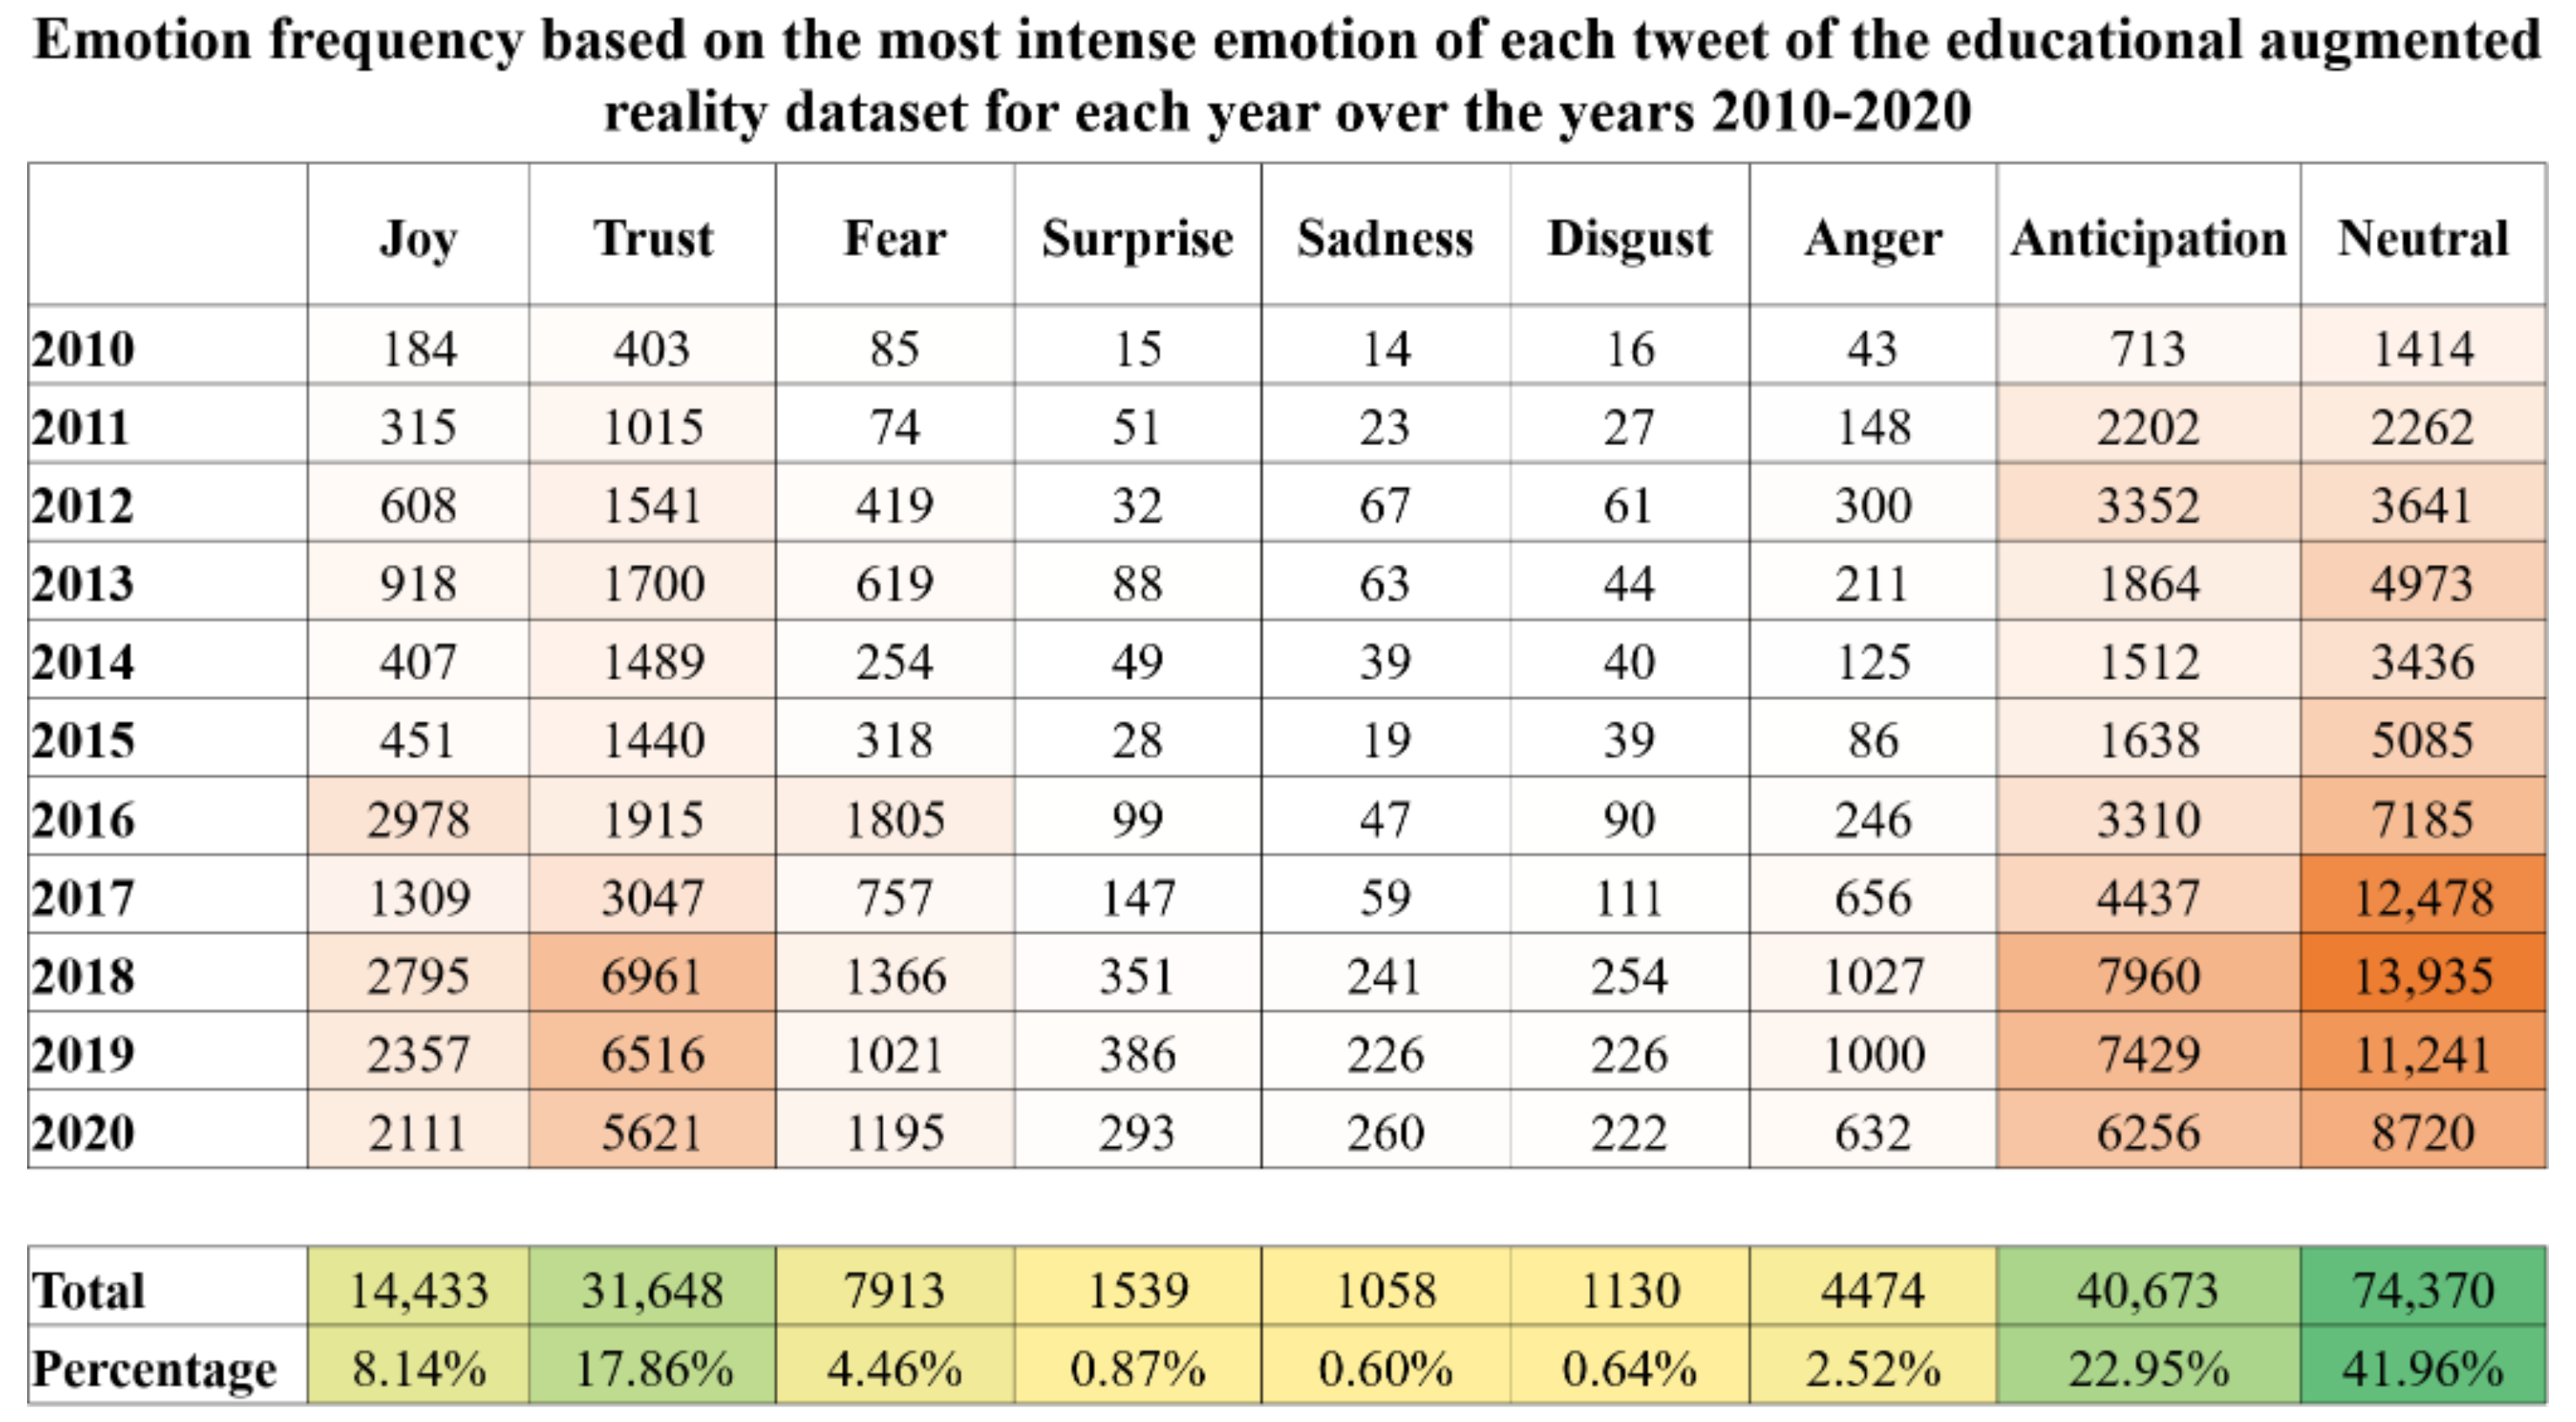
Figure 9. Most tweets expressed anticipation (22.95%), trust (17.86%), and joy (8.14%) while the majority of them were neutral, without expressing any emotion in particular (41.96%). The detailed emotion analysis is displayed for each year in
Figure 10.
4.3. General Use of Virtual Reality
Based on the word frequency analysis, reality, virtual, vr, ar, via were the top-5 most commonly used words. In
Table 9, the top-40 most common words are presented. The hashtag frequency analysis revealed #VR, #VirtualReality, #vr, #virtualreality, and #AR as the top-5 most common hashtags. The top-40 most commonly used hashtags are displayed in
Table 10.
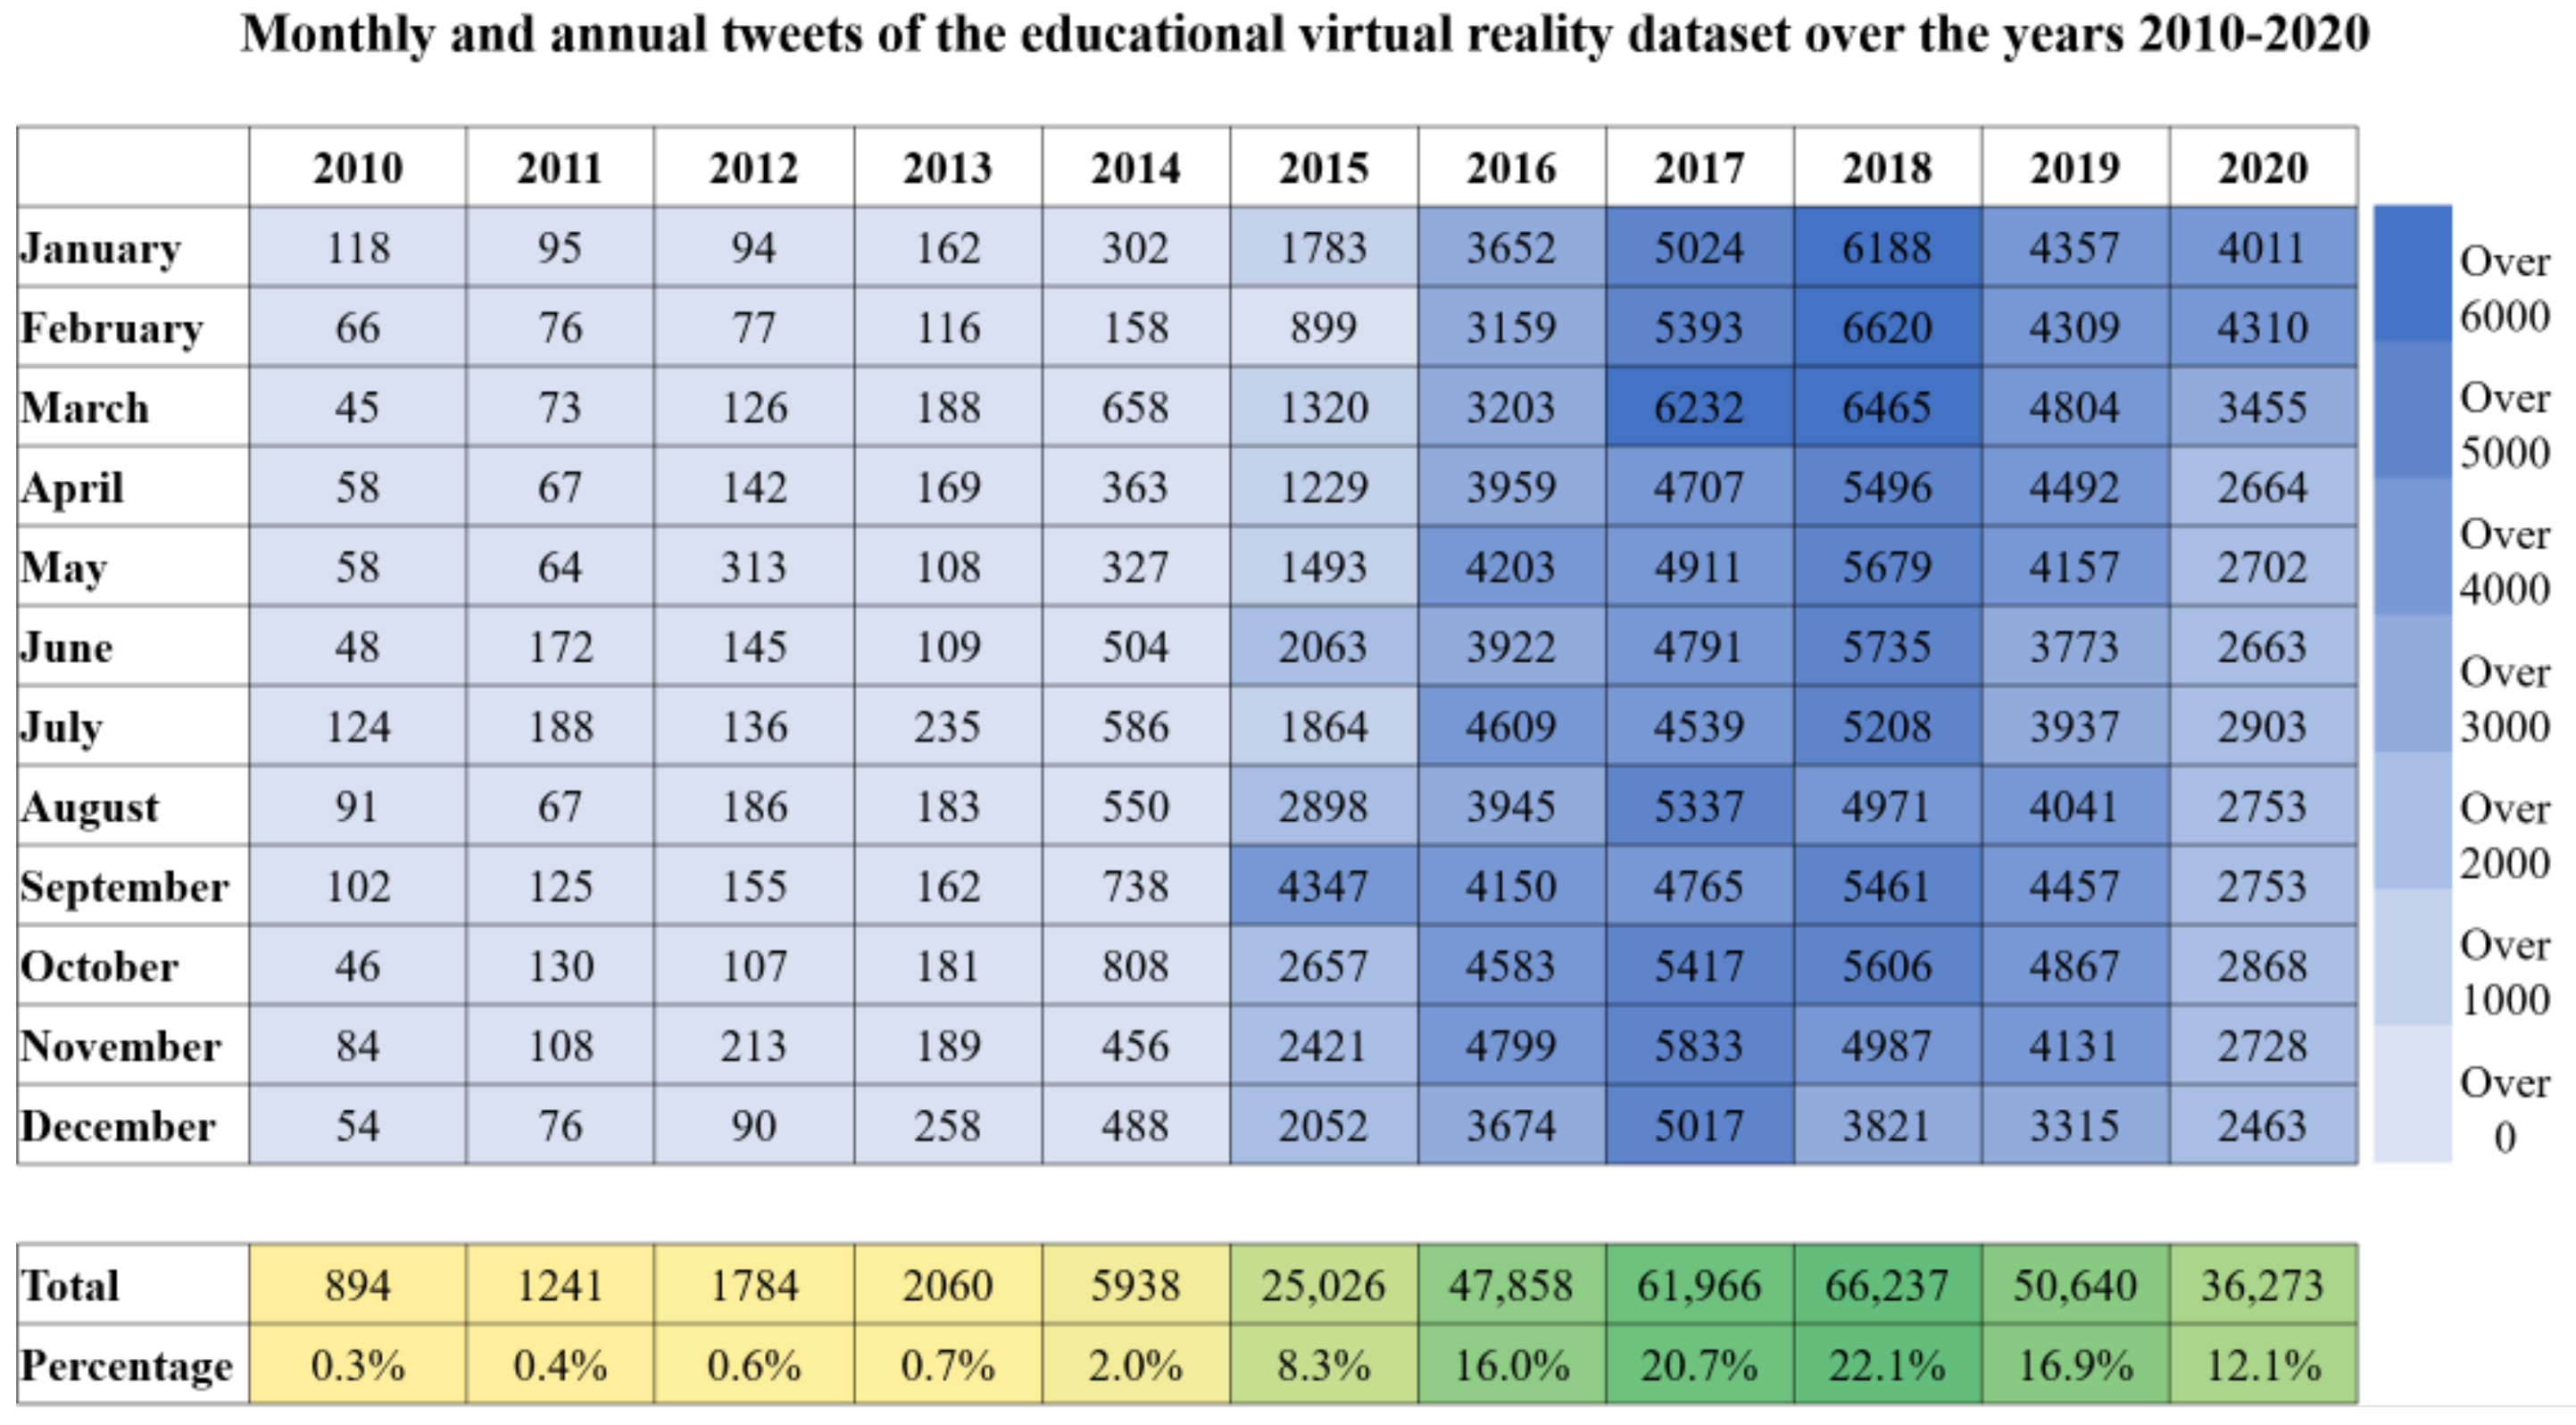
Figure 11 presents the annual and monthly frequency of the relevant tweets. The year with the most tweets was 2016 (27.3%).
Table 11 and
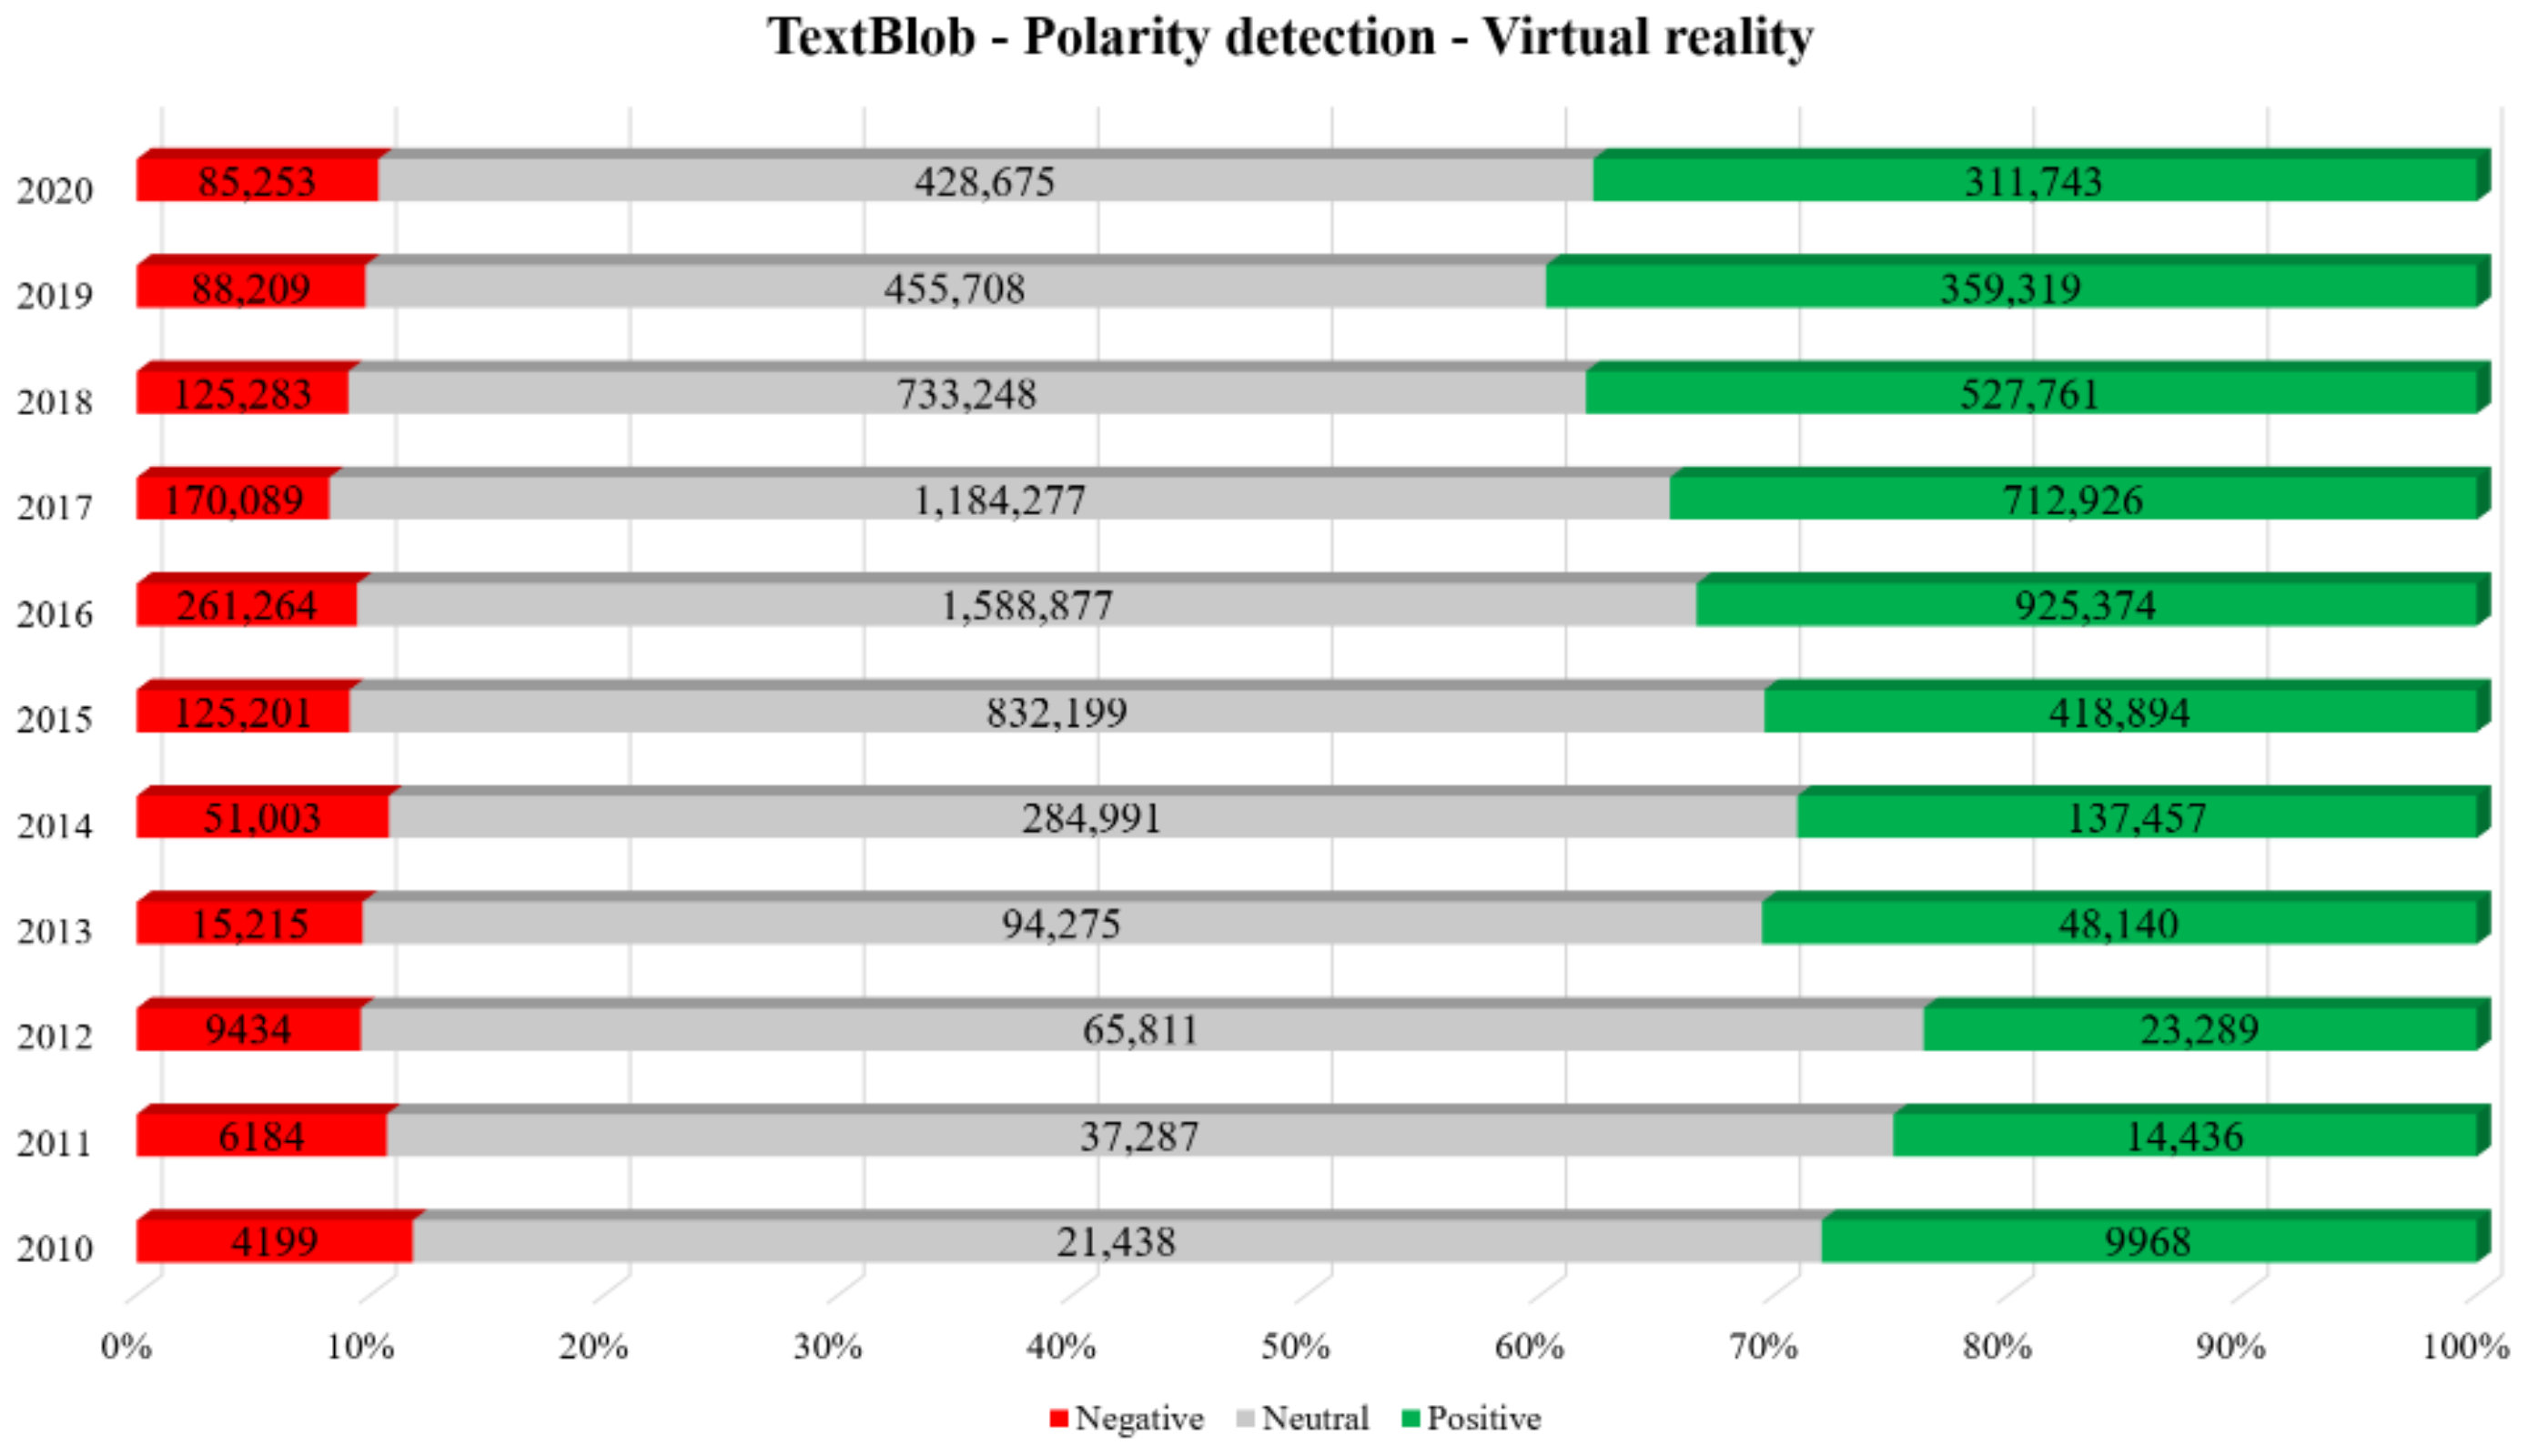
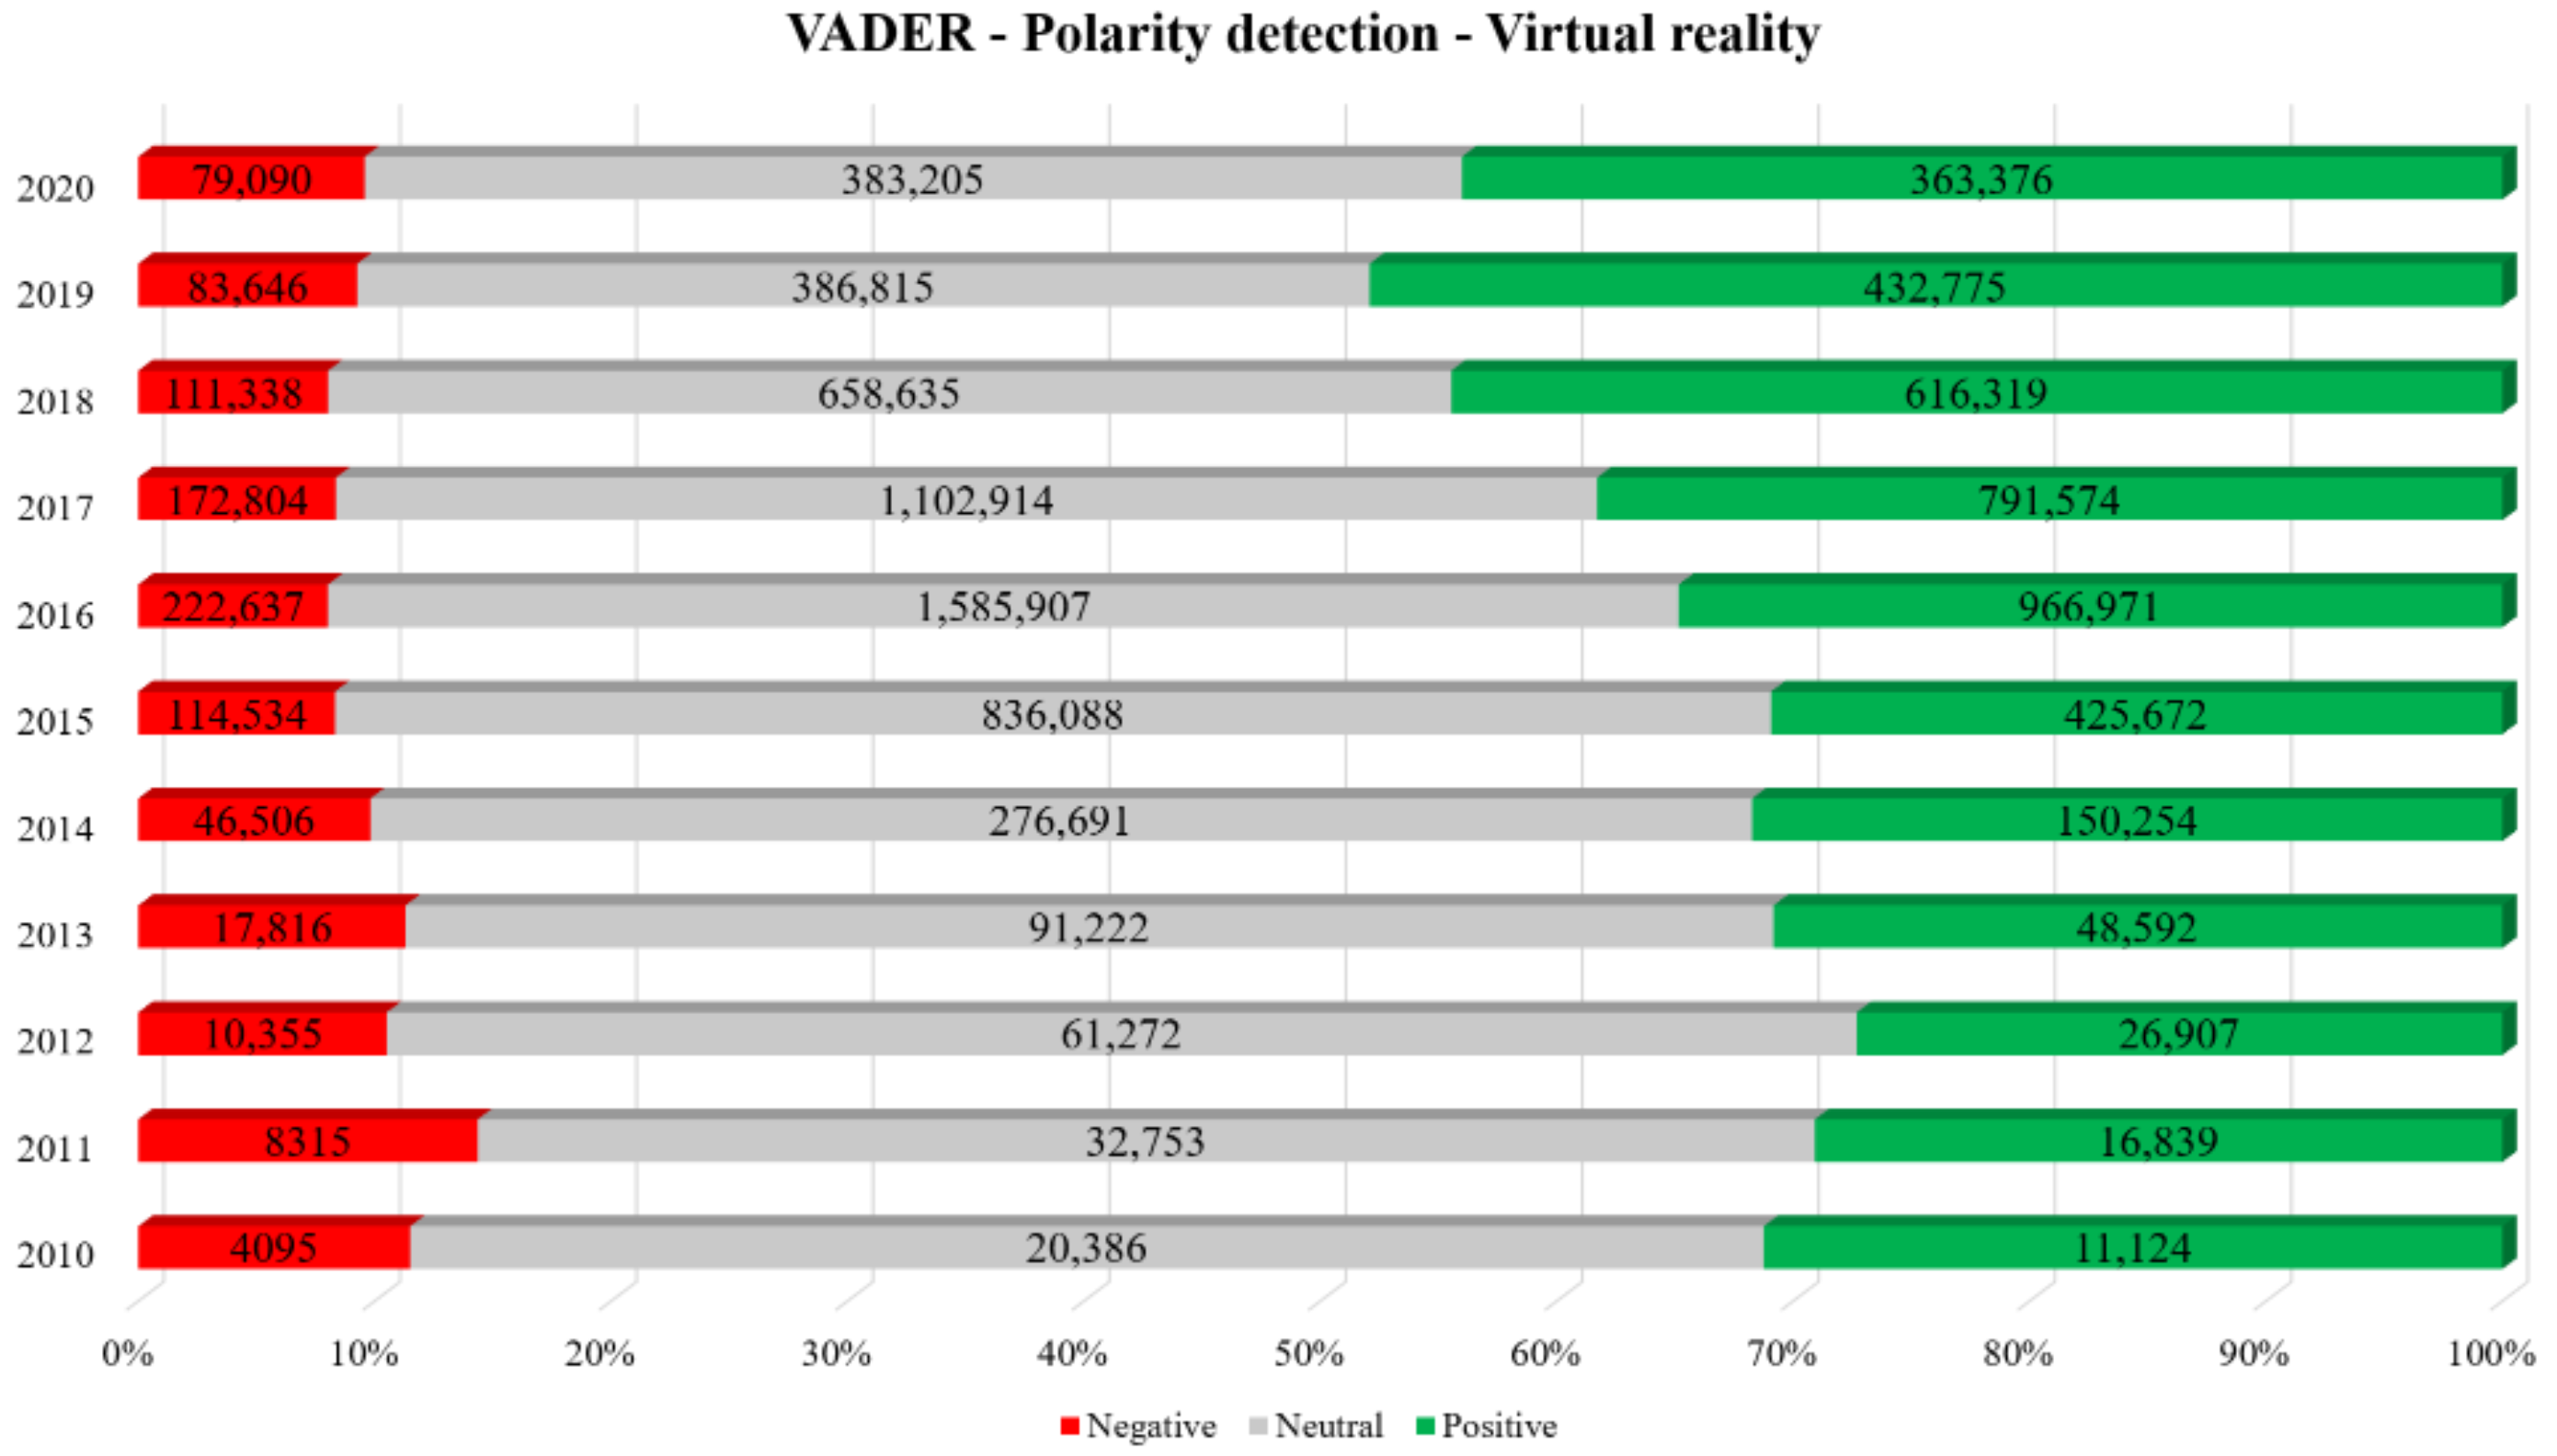
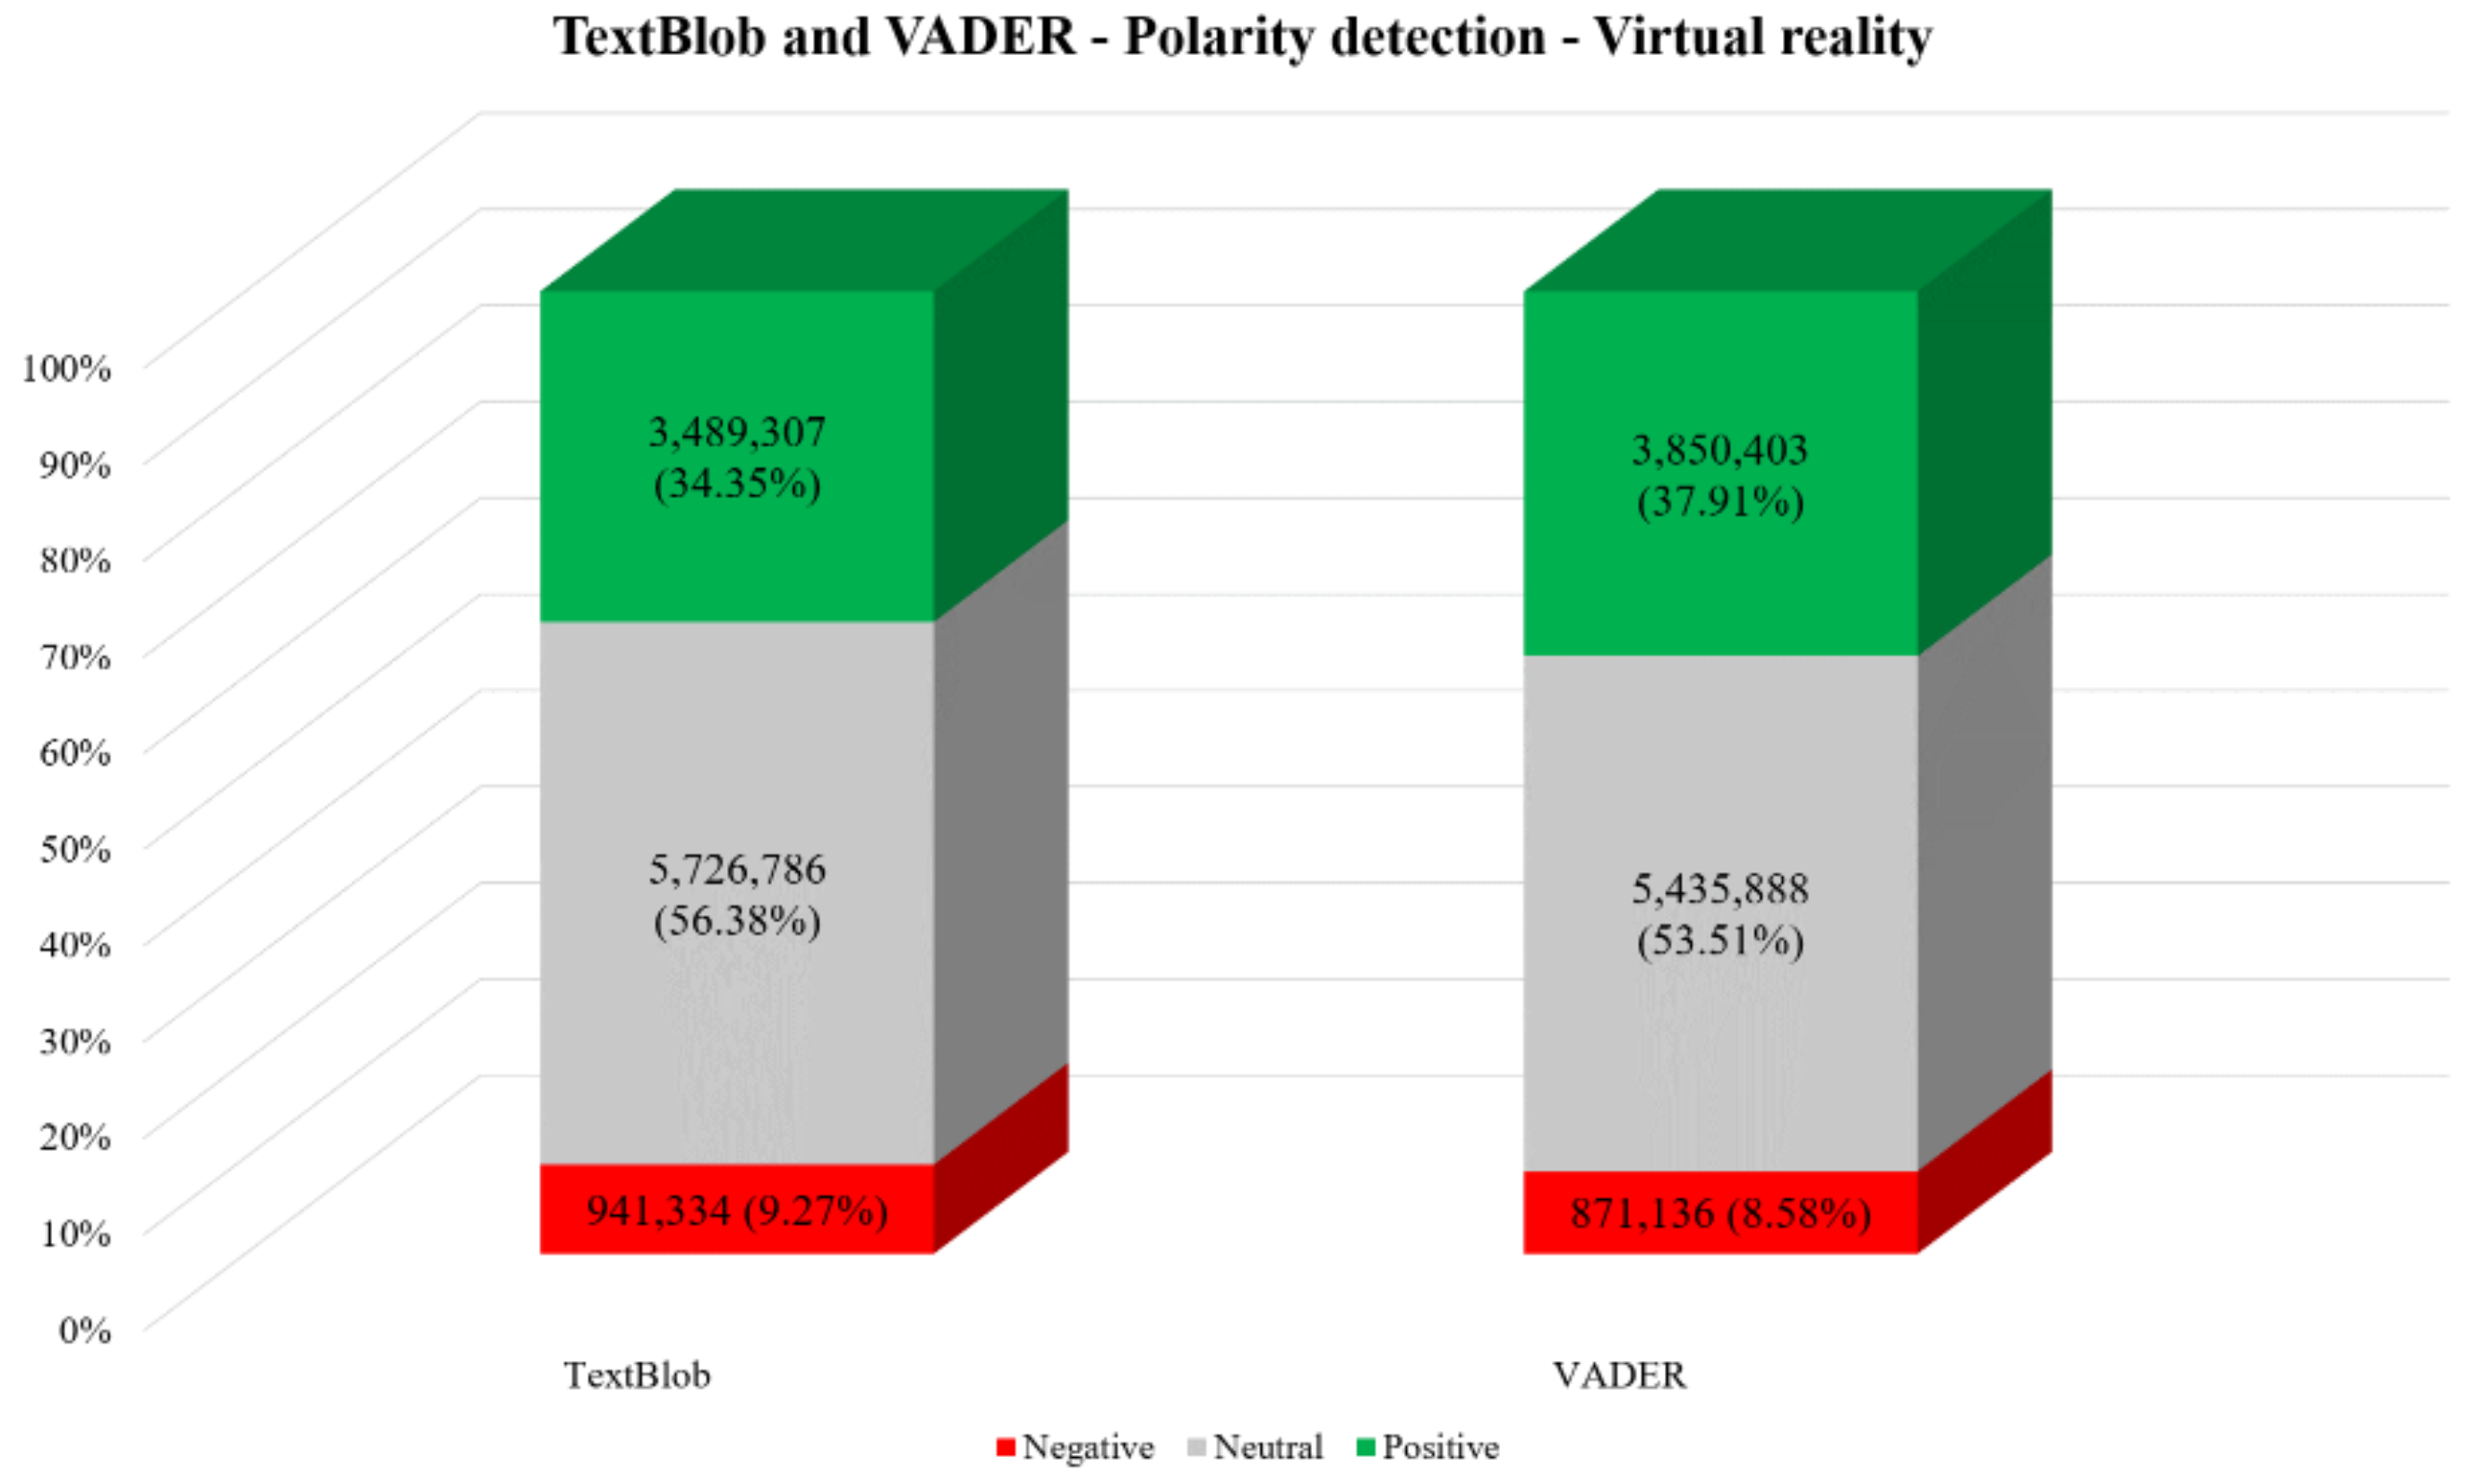
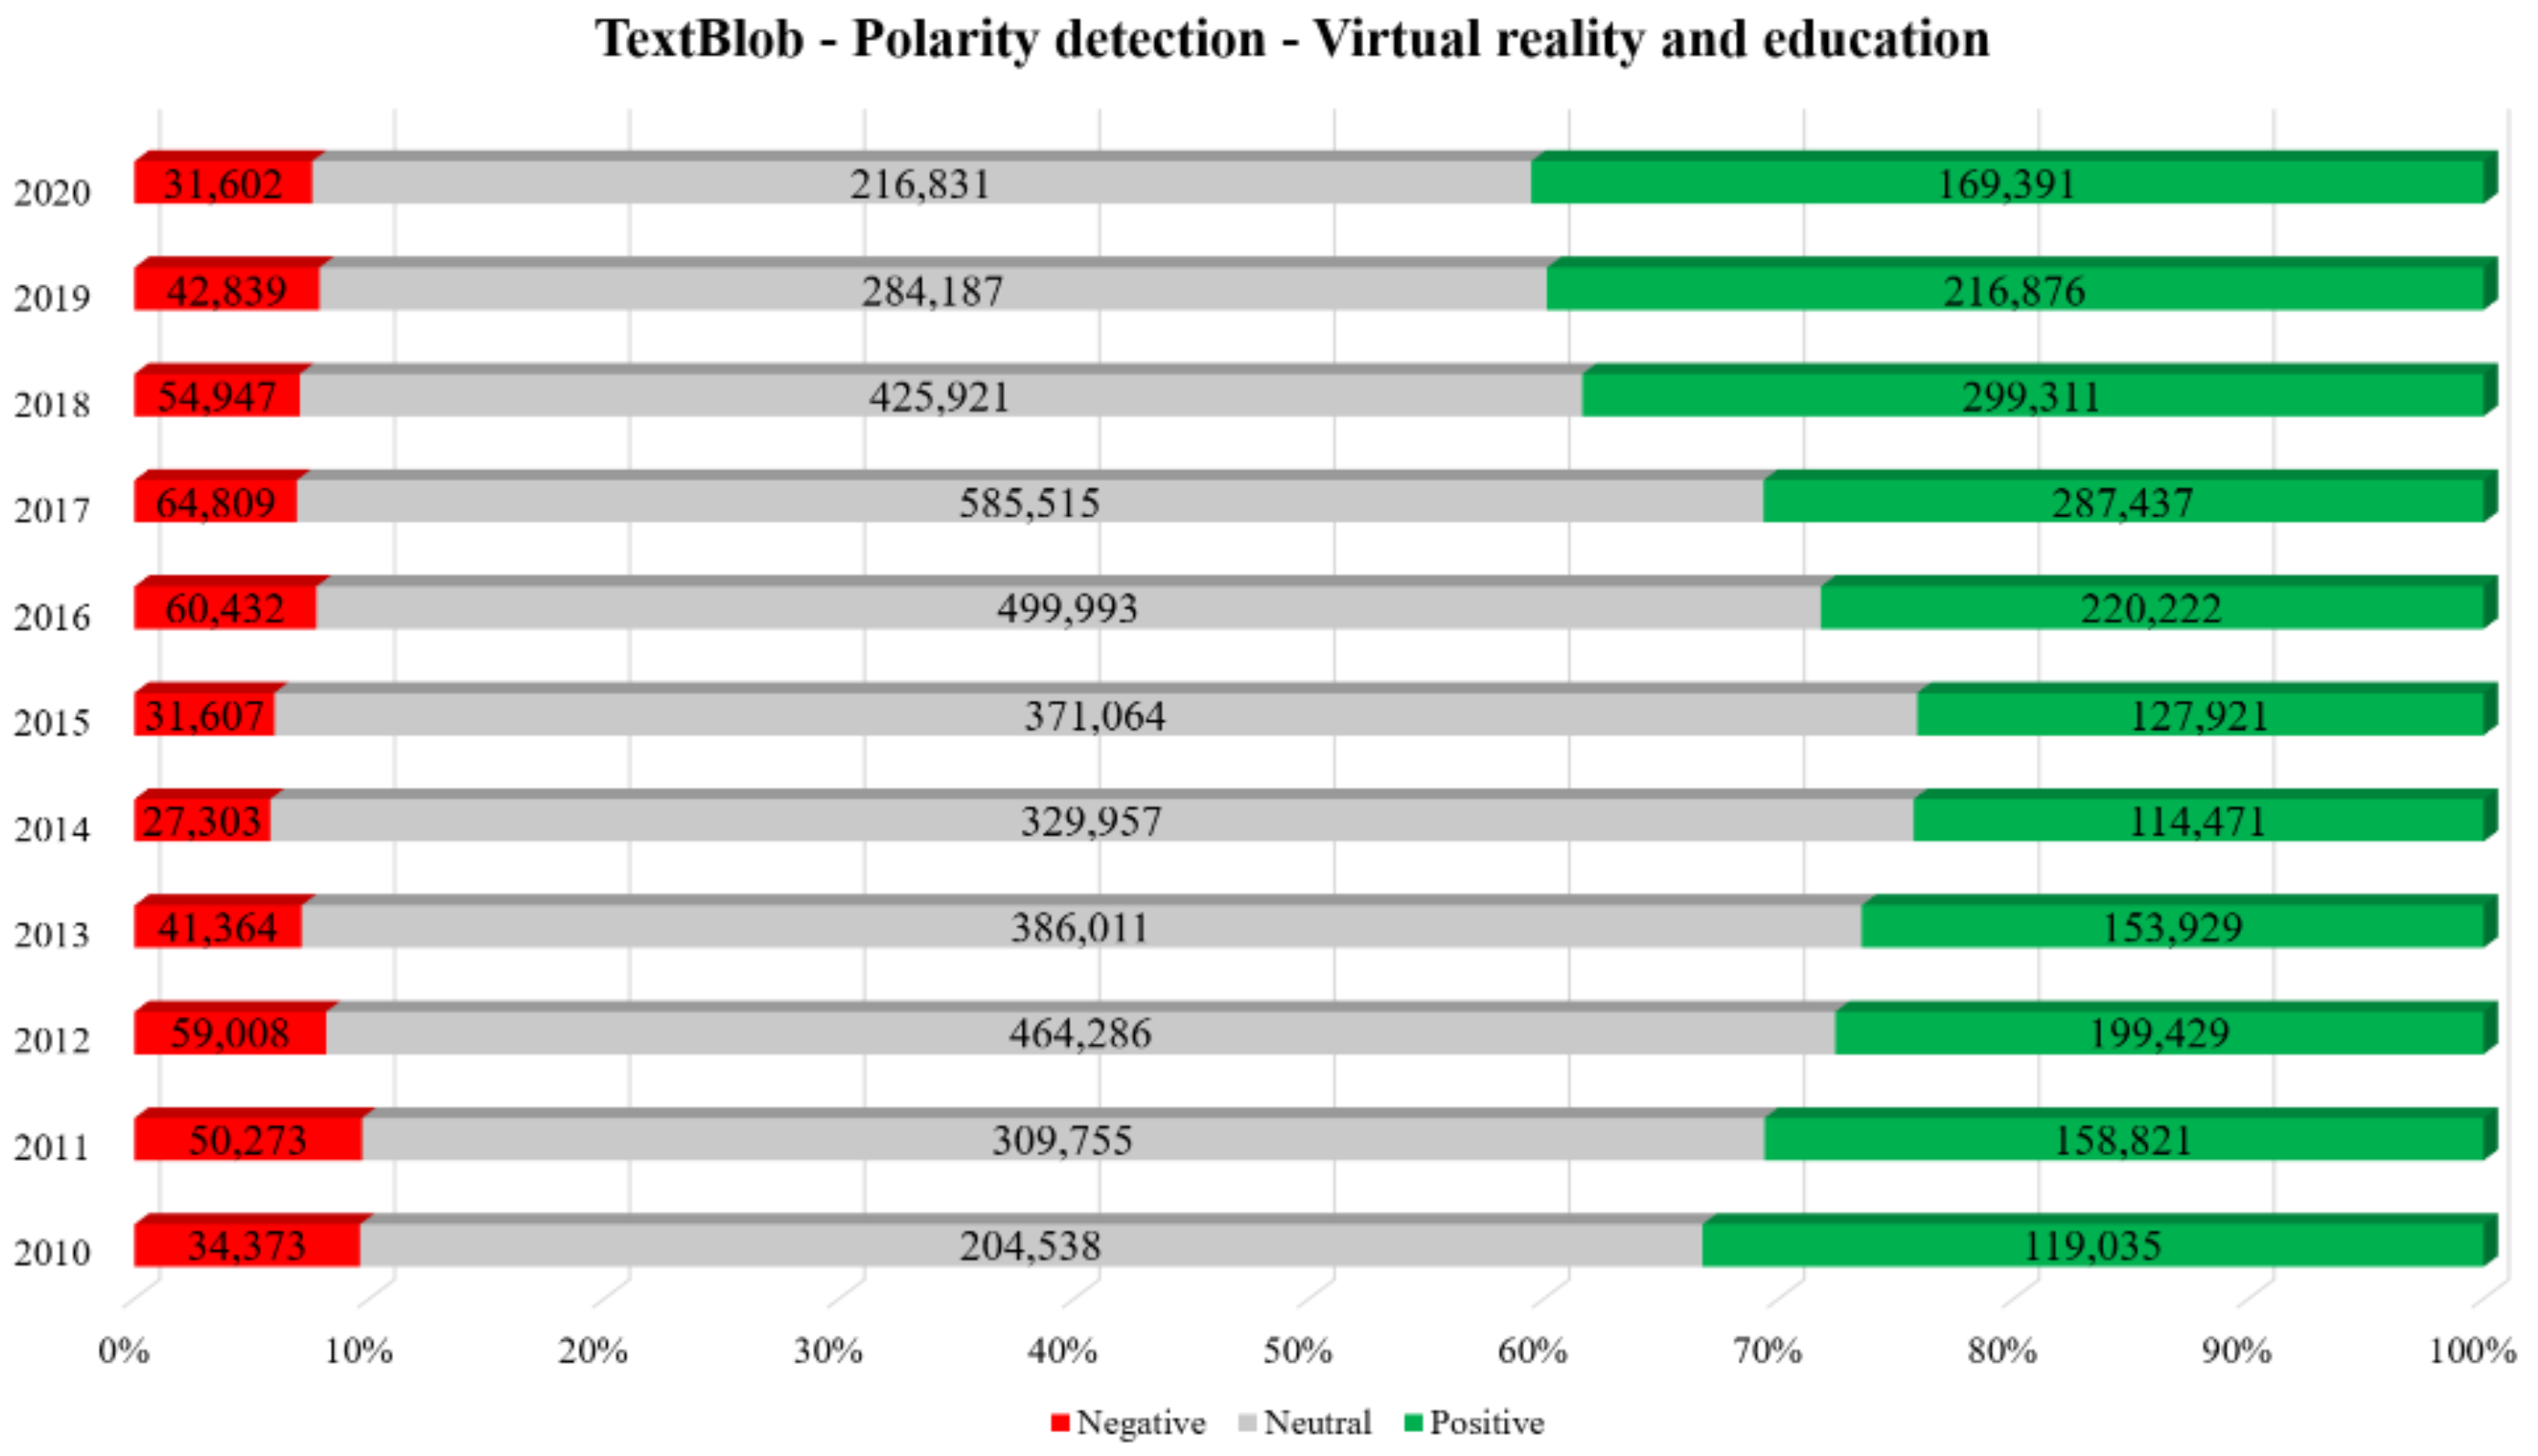
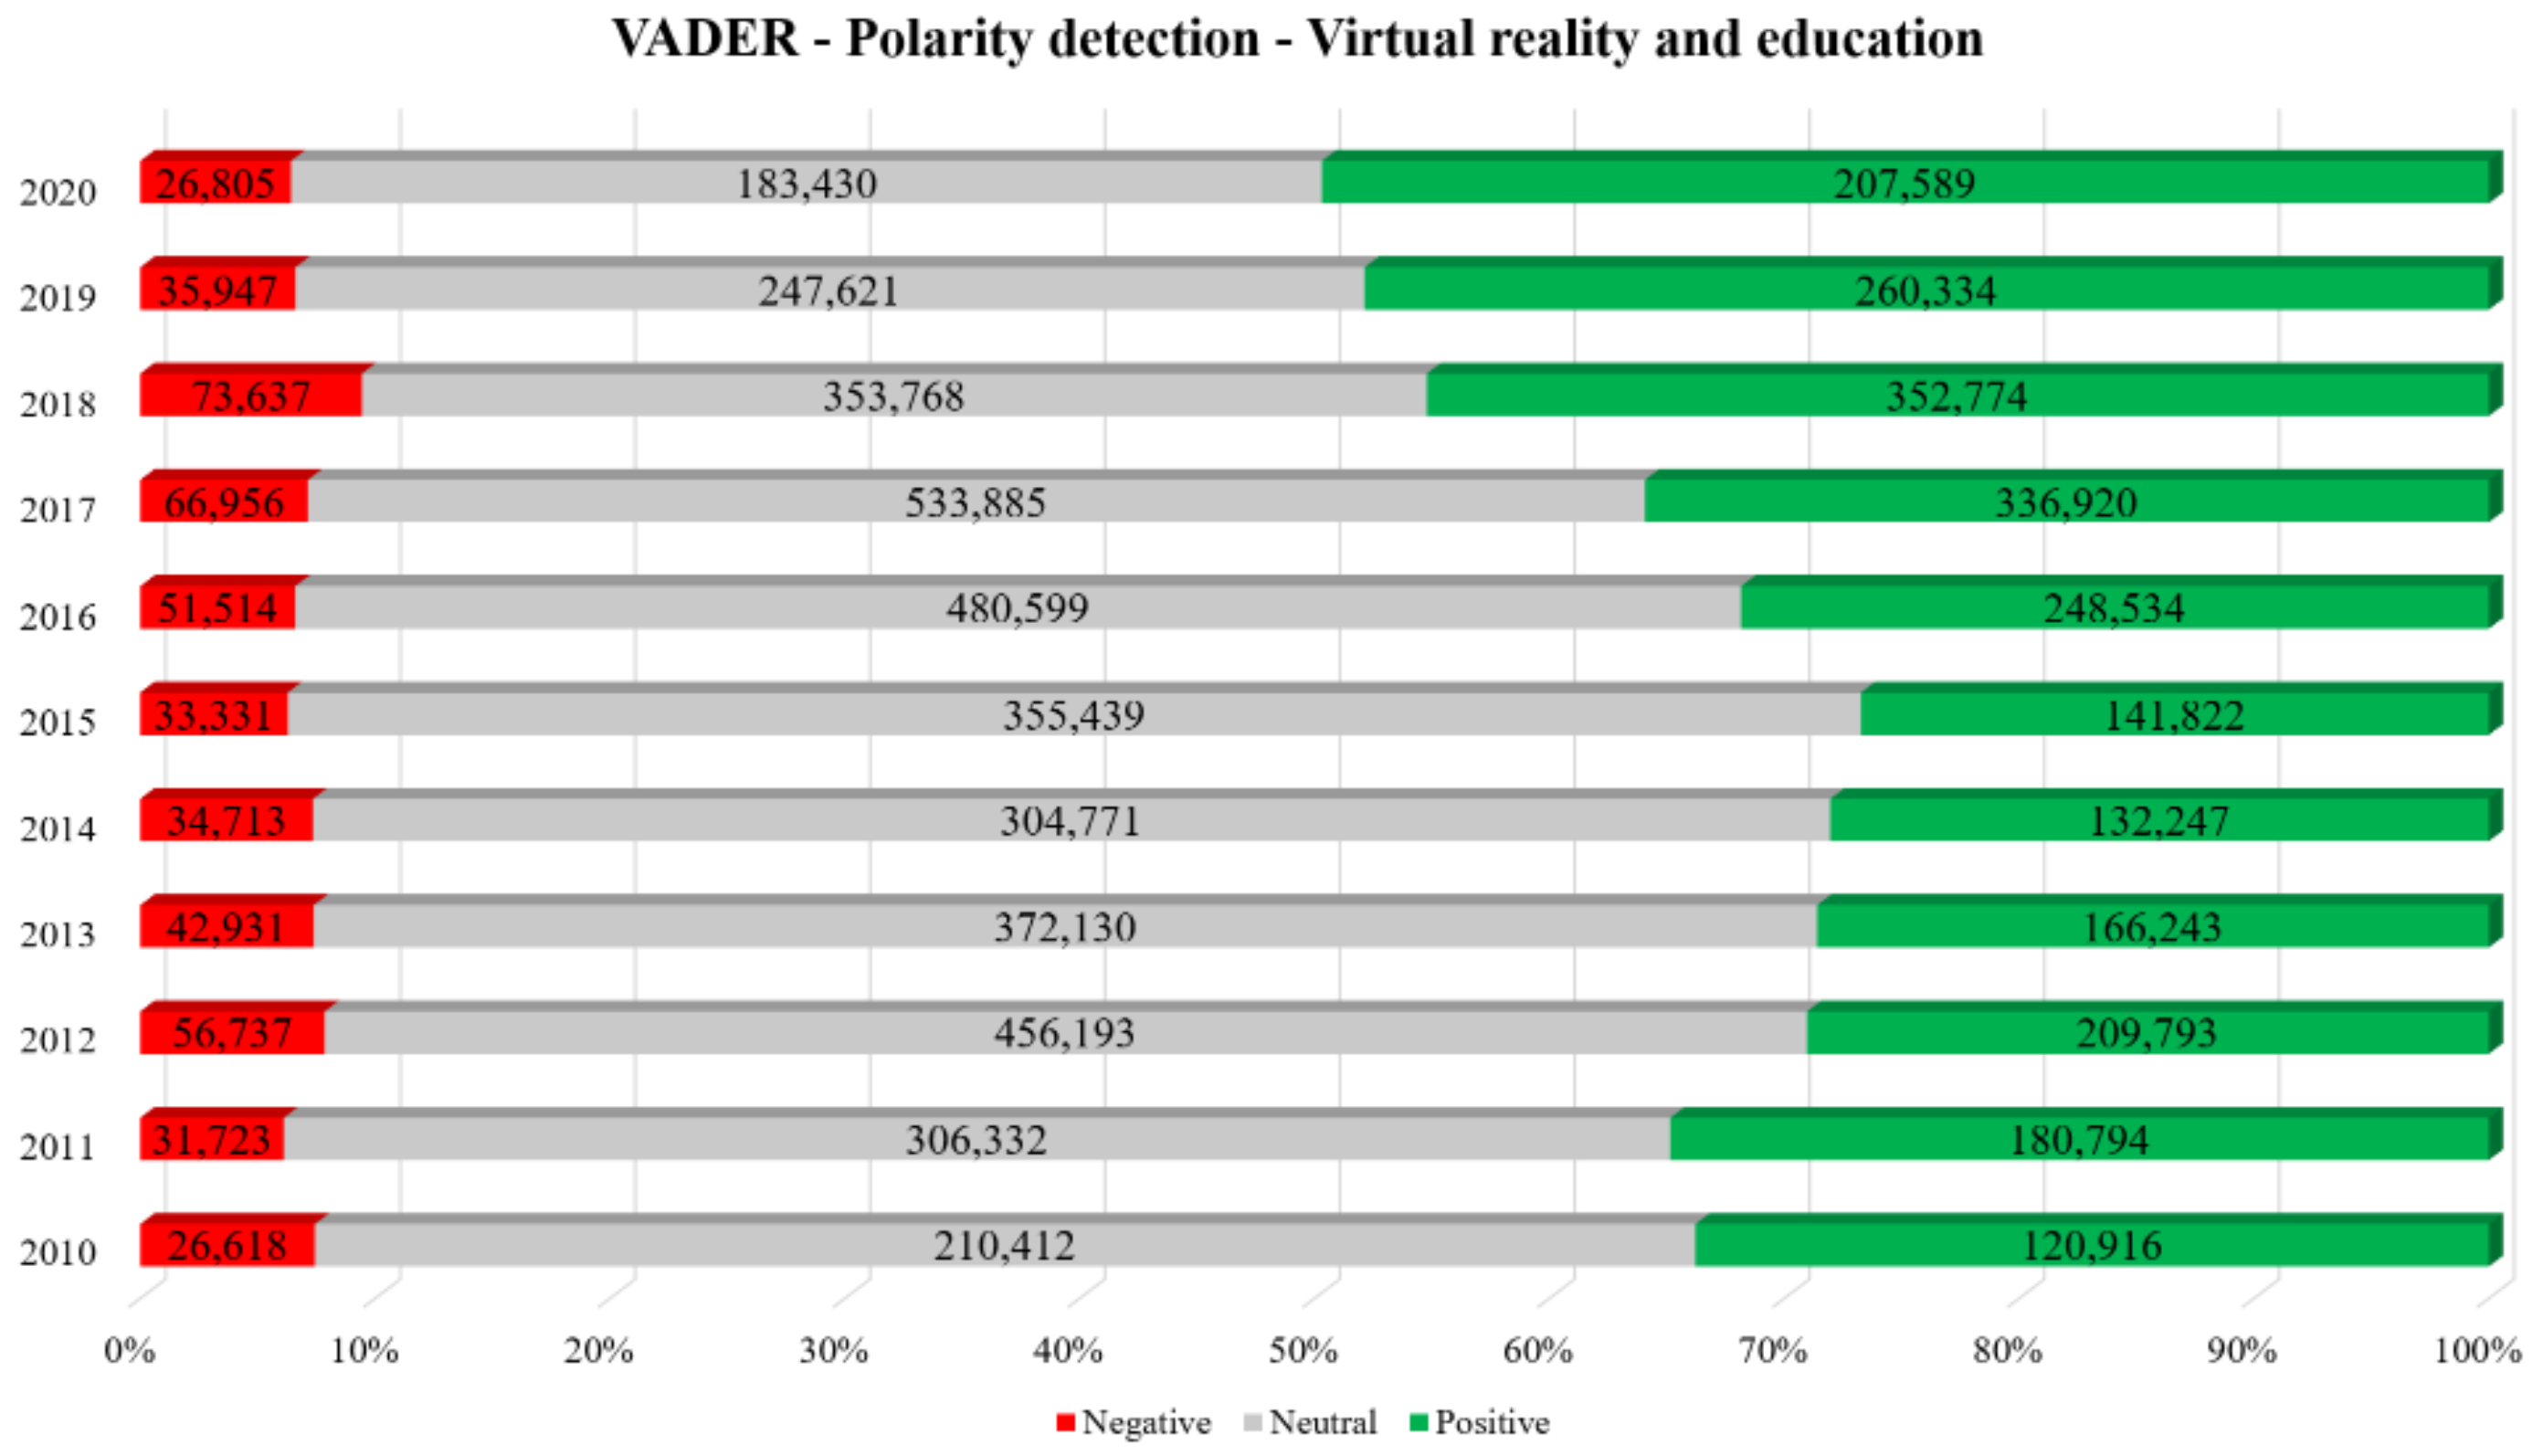
Table 12 depict the frequency of the top-20 most common bigrams and trigrams respectively. The polarity analysis using TextBlob revealed the majority of tweets were neutral (56.38%), followed by positive (34.35%) and negative (9.27%) while the results of VADER also showcased that most of the tweets were neutral (53.51%), followed by positive (37.91%) and negative (8.58%).
Figure 12,
Figure 13 and
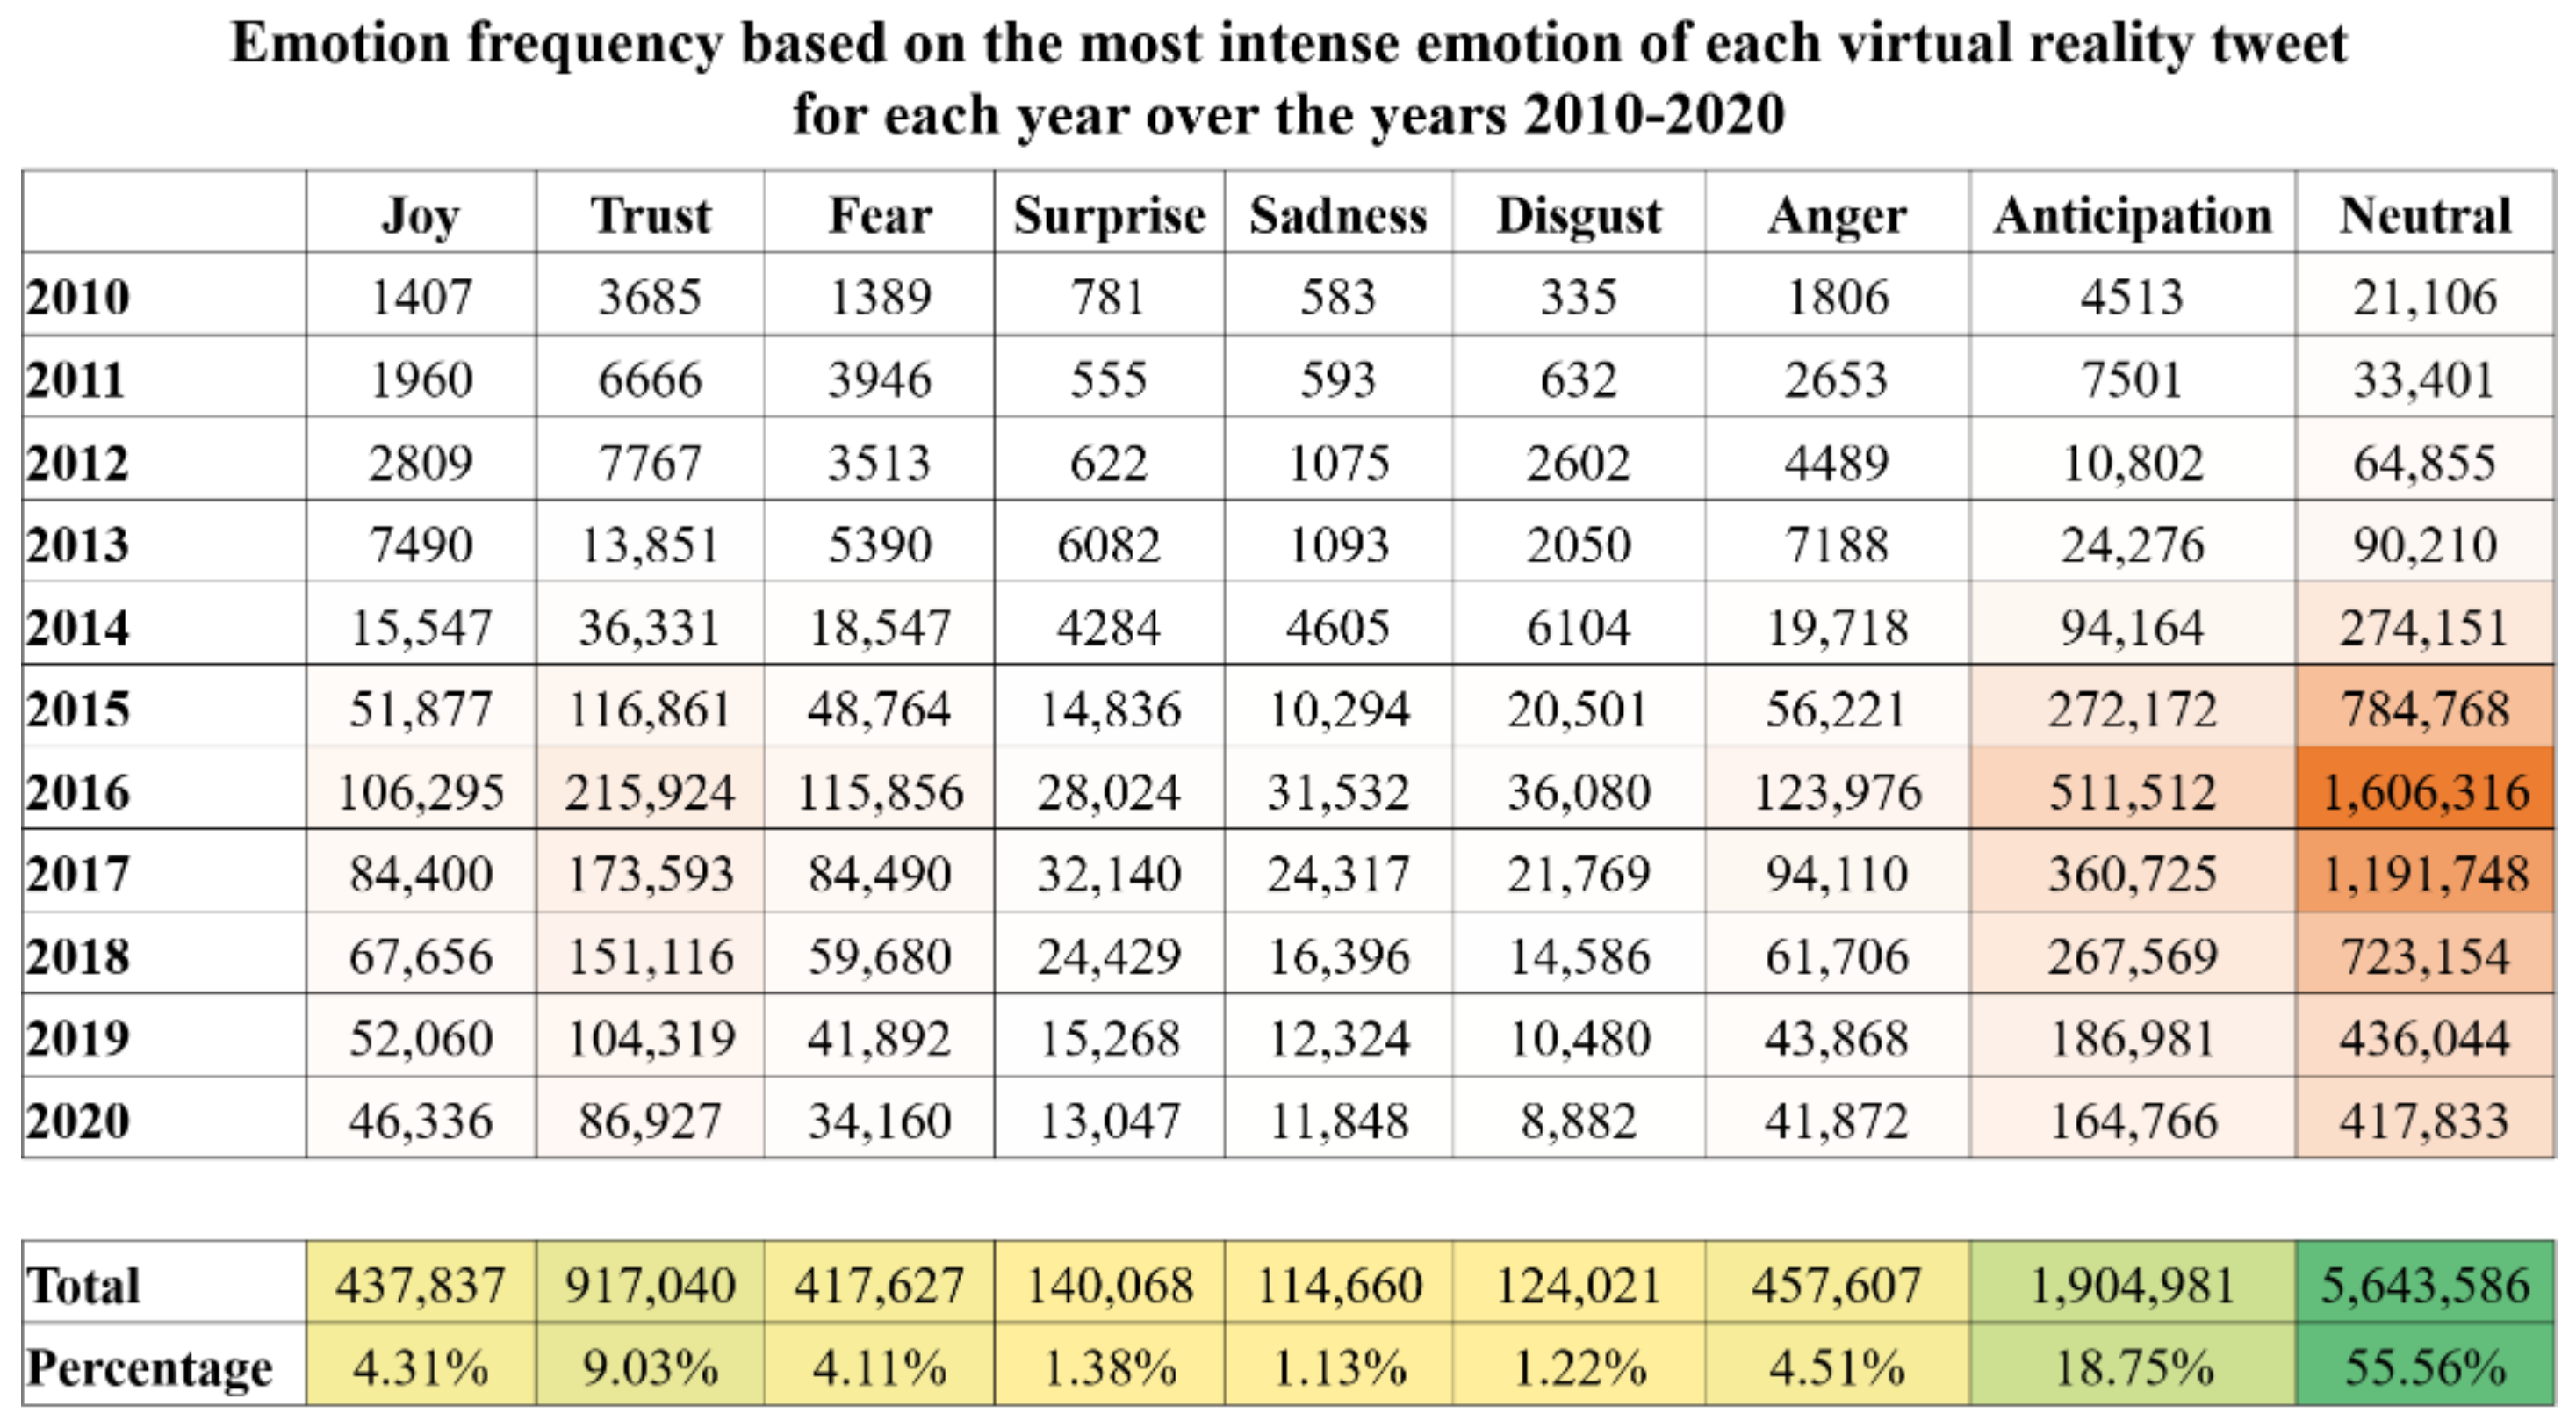
Figure 14 present the polarity of the tweets for each year and tool. Most tweets expressed anticipation (18.75%), trust (9.03%), and anger (4.51%) while the majority of them were neutral (55.56%). The emotion analysis is depicted for each year in
Figure 15.
4.4. Educational Use of Virtual Reality
The 40 most commonly used words are displayed in
Table 13. Reality, virtual, vr, education, and learn were the 5 words used the most.
Table 14 presents the top-40 most frequently used tweets of which the top-5 were #VR, #VirtualReality, #education, #AR, and #edtech. In
Figure 16, the annual and monthly frequency of tweets are presented with 2018 being the year with the most relevant tweets (22.1%). The top-20 most commonly used bigrams and trigrams are displayed in
Table 15 and
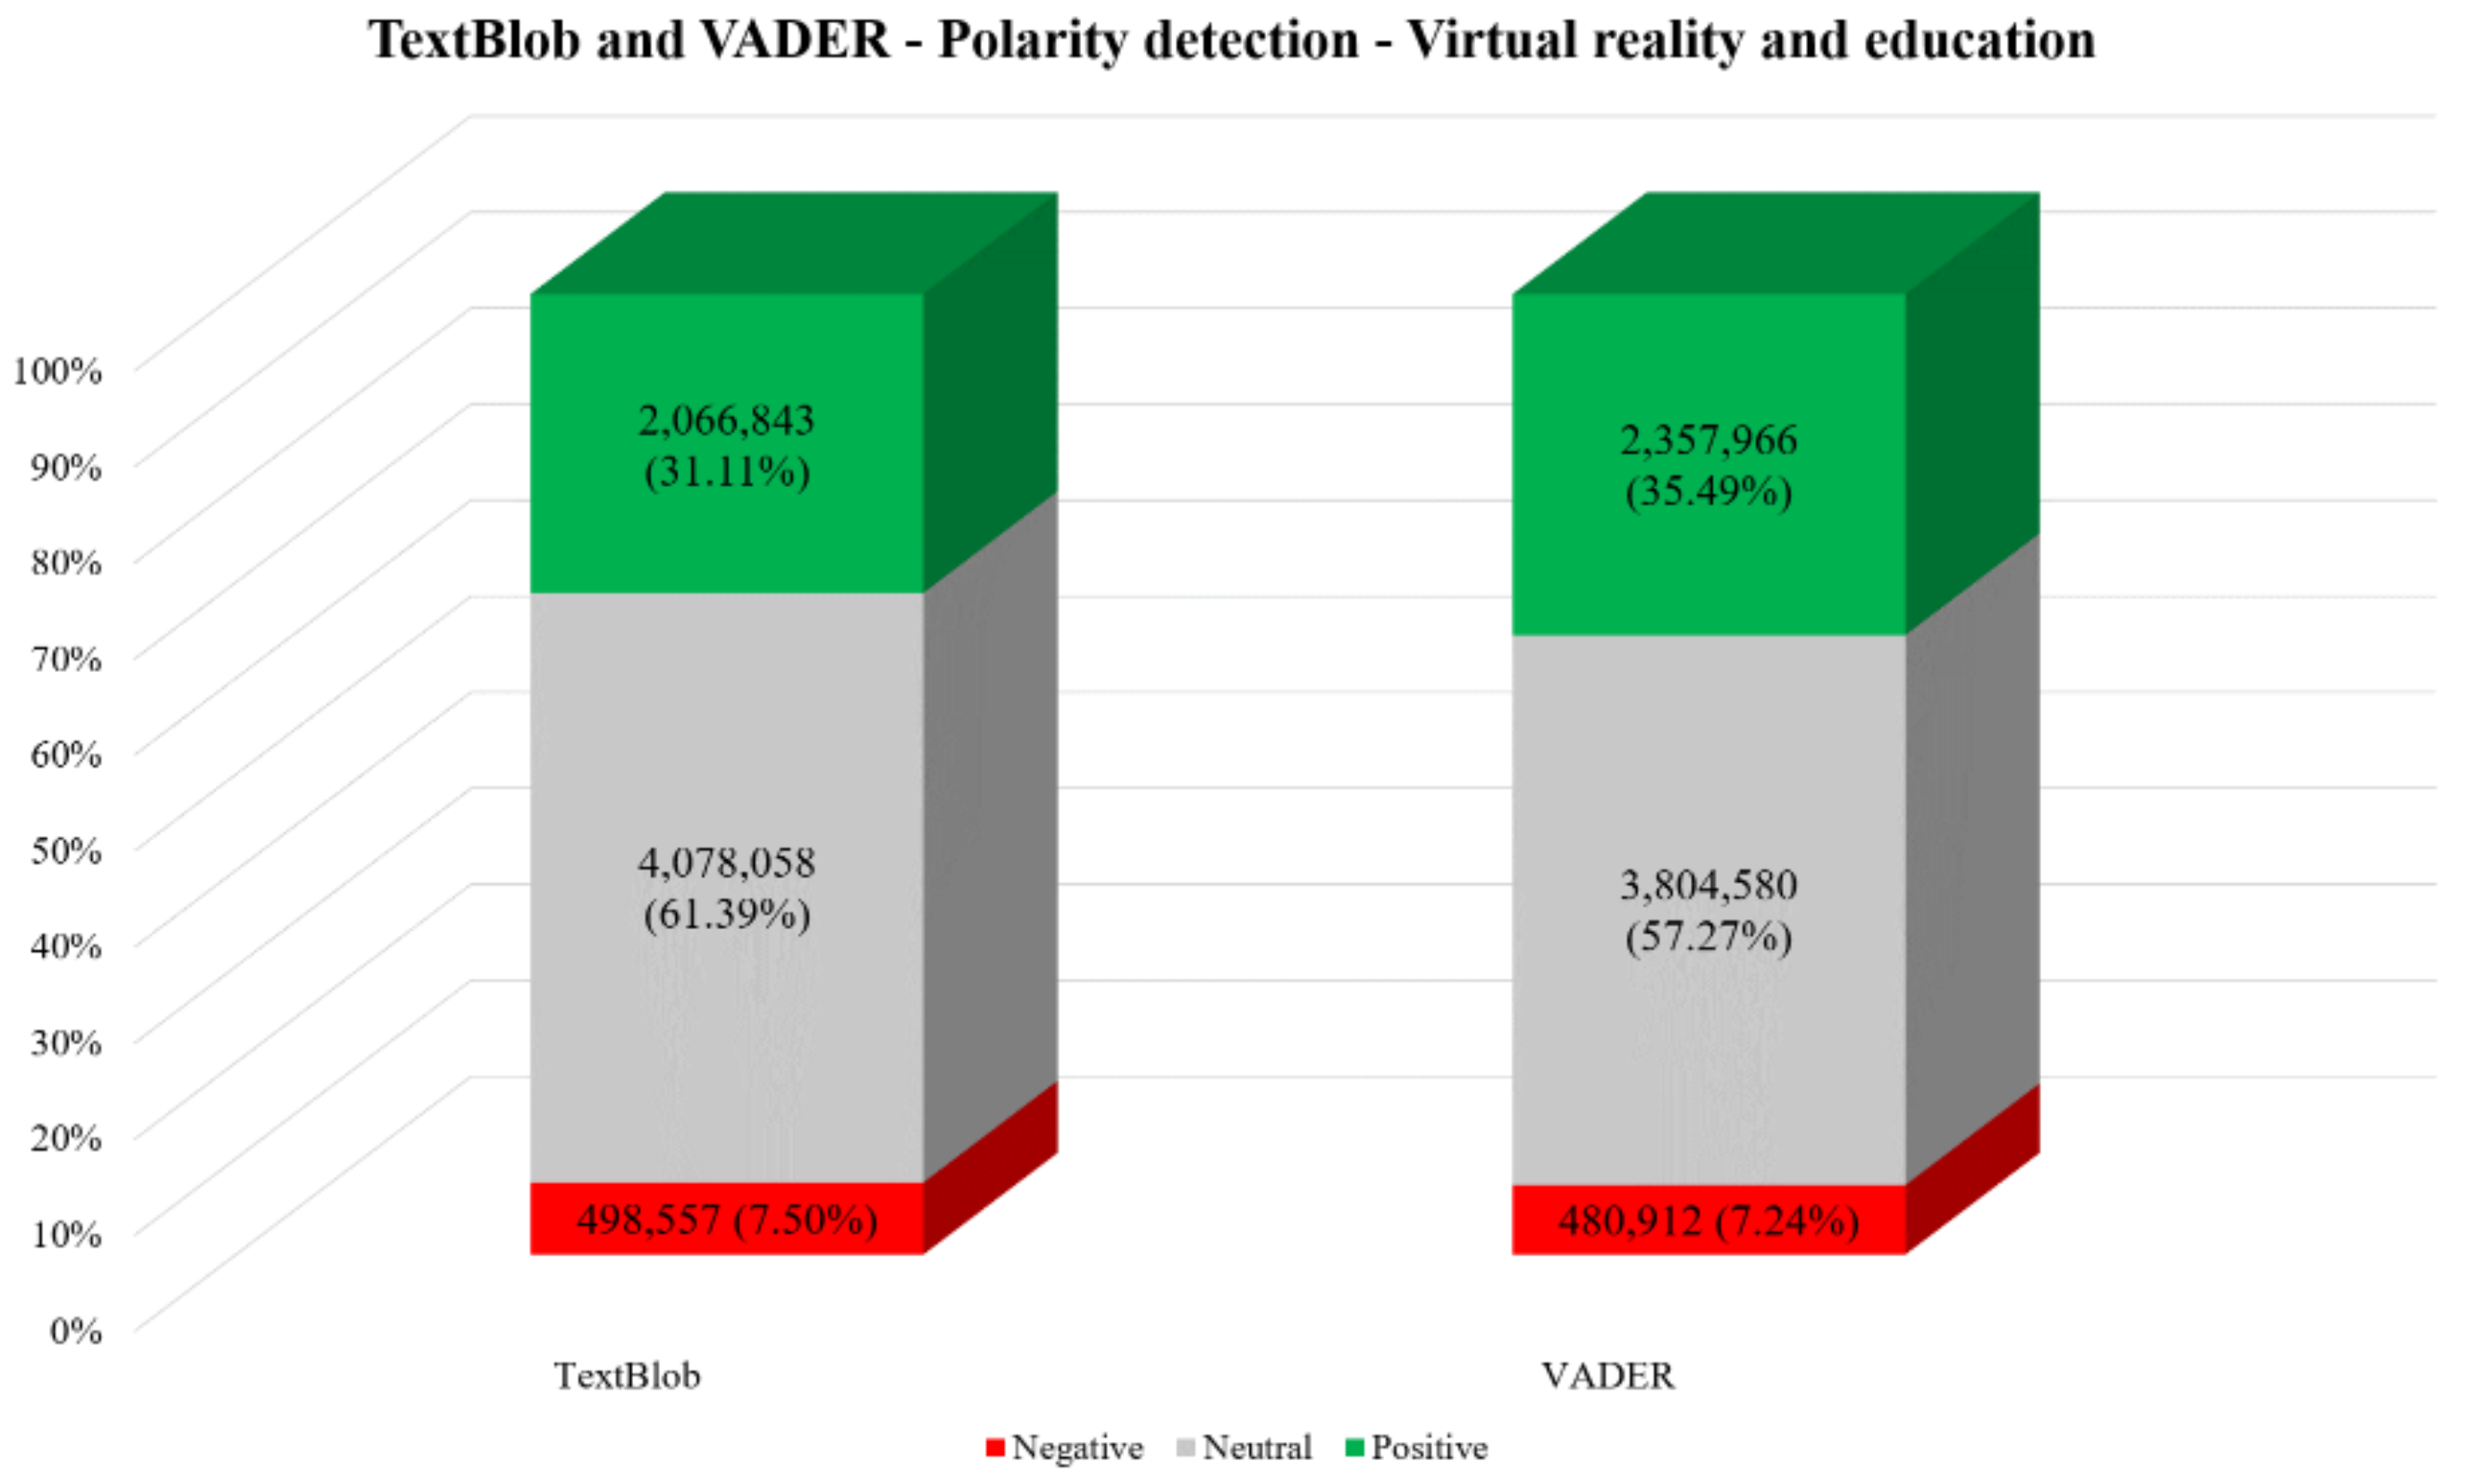
Table 16. The polarity analysis using TextBlob revealed the majority of tweets were neutral (61.39%), followed by positive (31.11%) and negative (7.50%) while the results of VADER also showcased that most of the tweets were neutral (57.27%), followed by positive (35.49%) and negative (7.24%). The results of the polarity analysis are shown in
Figure 17,
Figure 18 and
Figure 19.
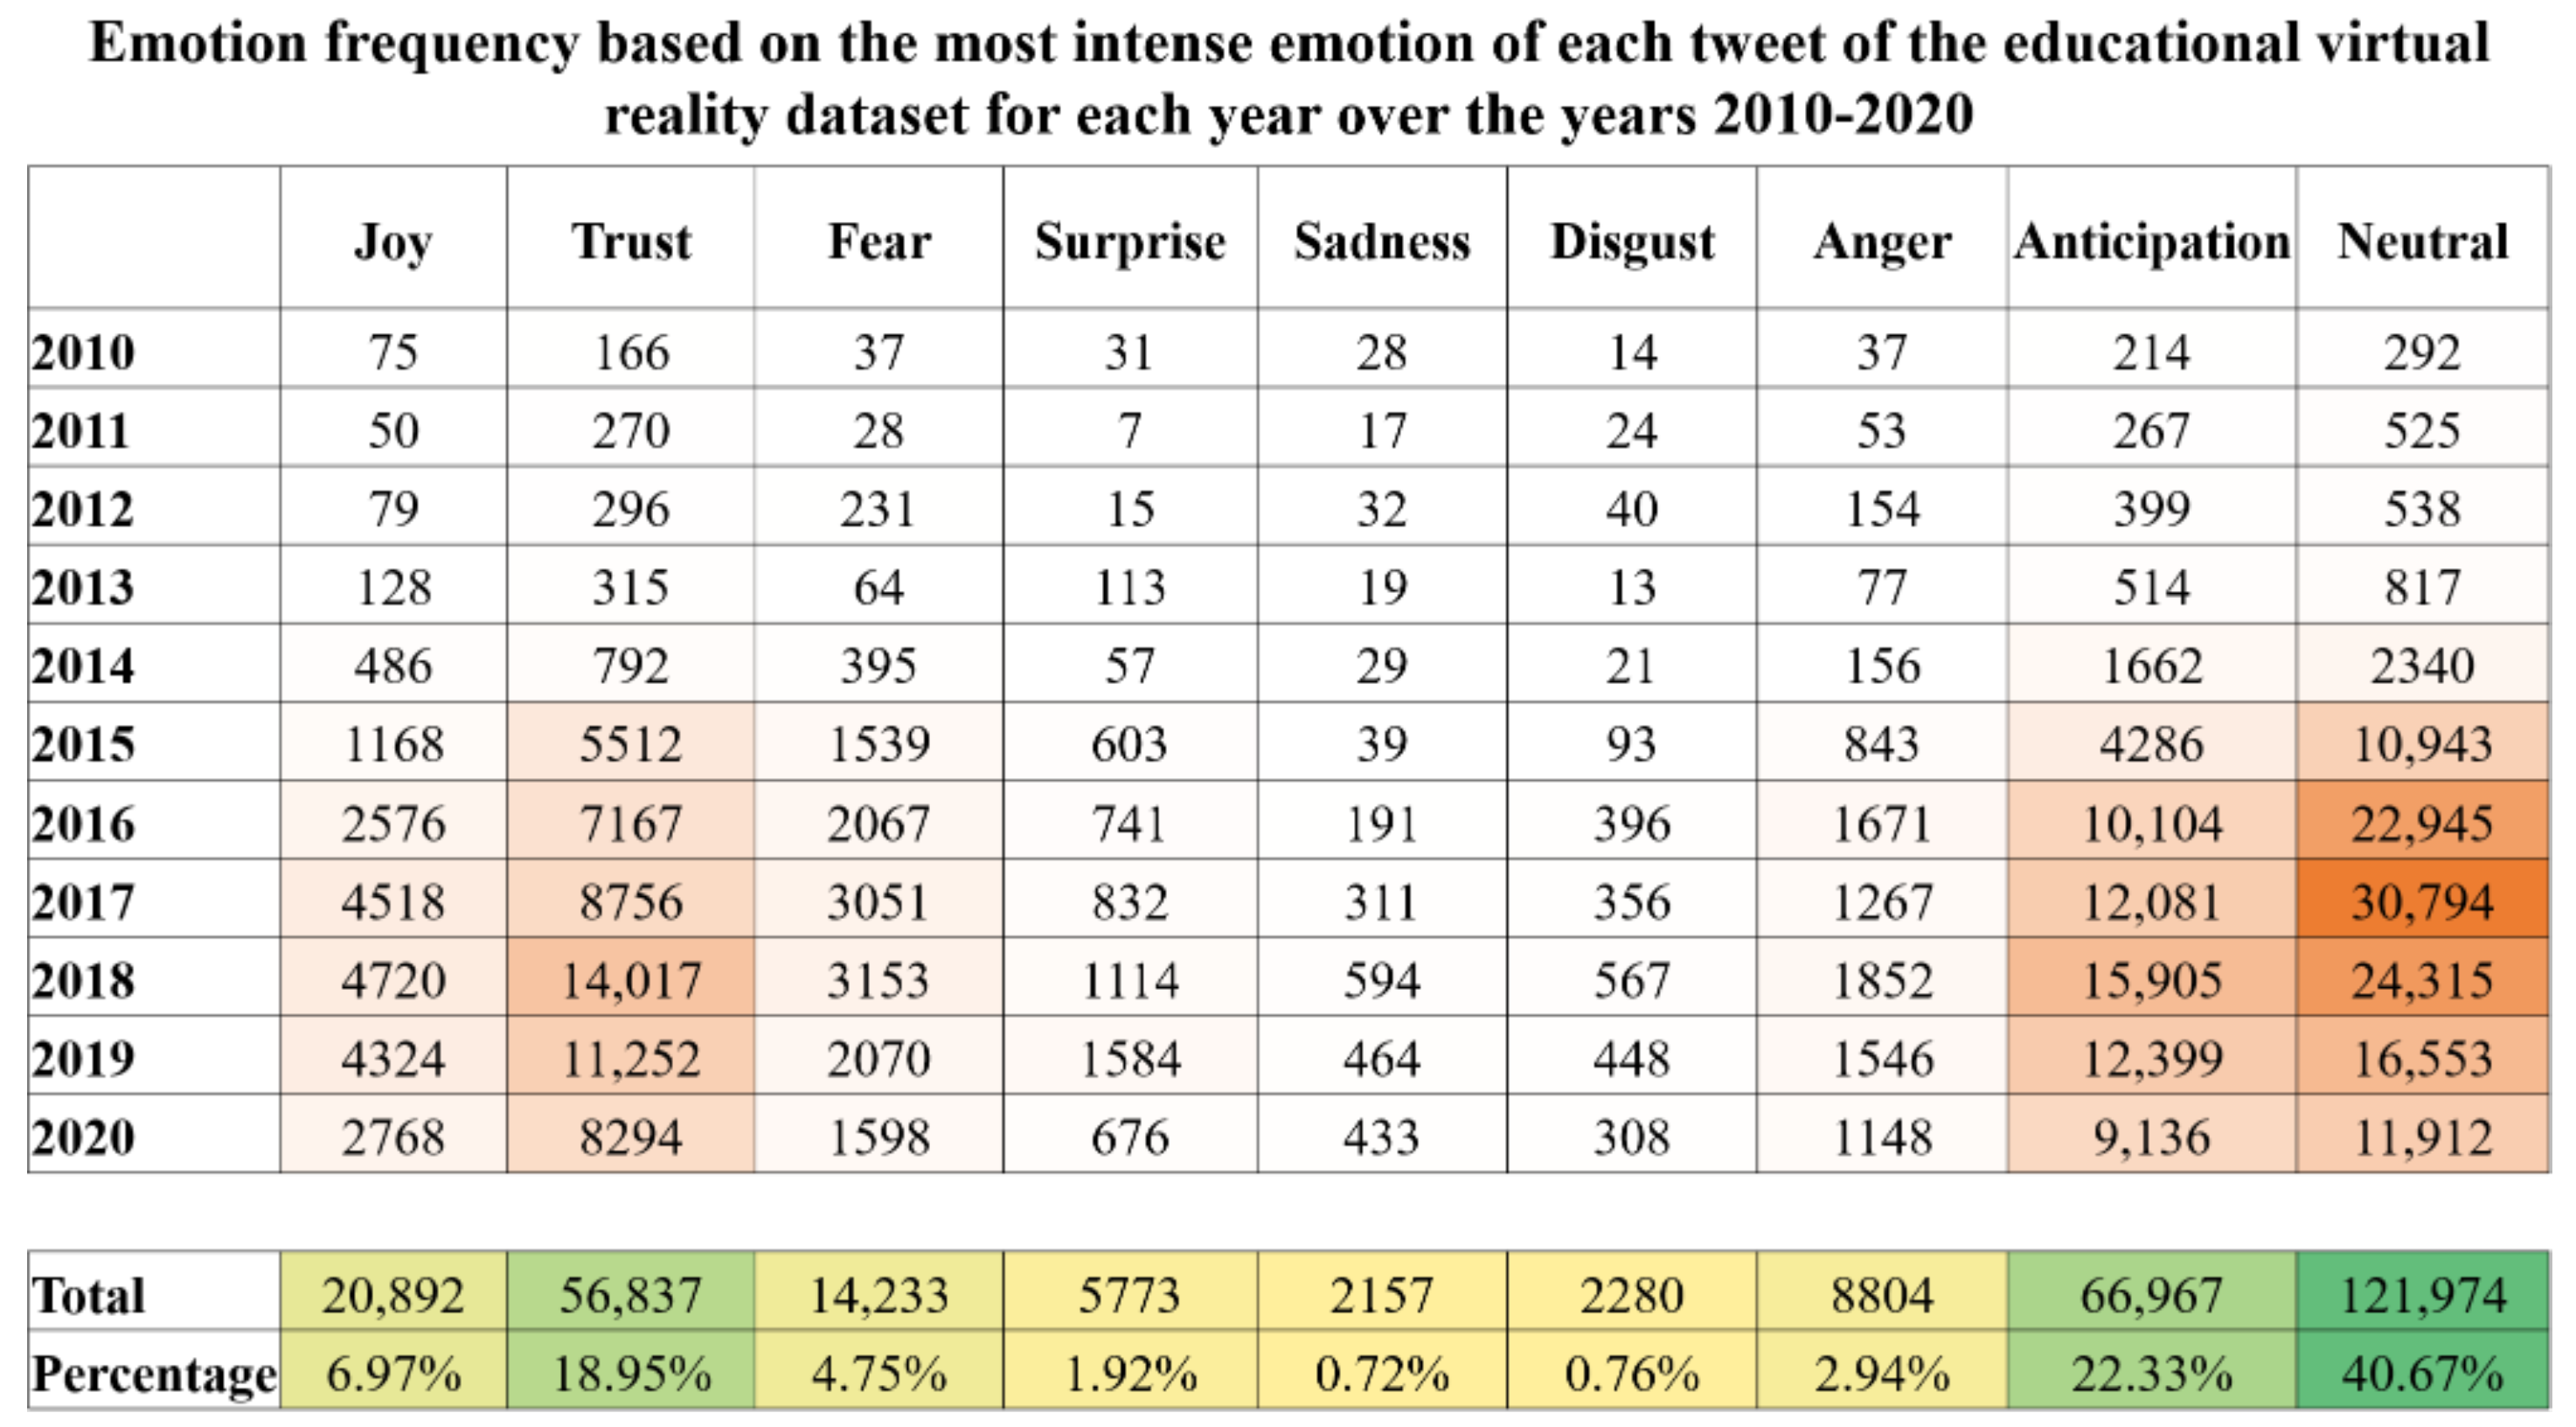
Figure 20 presents the yearly emotion analysis. Anticipation (22.33%), trust (18.95%), and joy (6.97%) were the emotions mostly expressed from the tweets while 40.67% of the tweets were neutral as they did not express any specific emotion.
4.5. Topic Modeling Analysis
To identify the prominent topics discussed, topic modeling was applied to all data. Based on the analysis, 11 topics related to augmented and virtual reality emerged. The topics are related to education, new technologies, digital and social media use, marketing and advertising, the industrial domain, the health domain, gaming, fitness and exercising, devices, the travel and tourism domain, and software development kits (SDK). The related to each topic words are displayed in
Table 17.
5. Discussion
Augmented reality and virtual reality are gradually gaining in popularity as they are being applied in several domains including education. Due to their immersive and interactive nature, they can create safe and secure environments which enrich and improve the educational process, facilitate educators’ job, and lead to increased student academic performance [
8]. Despite this fact, to successfully adapt and integrate these technologies in educational contexts, it is essential to understand the public’s viewpoints. As a result, this study analyzed four datasets of over 17 million tweets from January 2010 to December 2020 using text mining, sentiment analysis, and topic modeling methods to comprehend public perspectives, sentiments, attitudes, and discourses.
According to the analysis, the international acceptance and positive assessment of these technologies can be noticed. This is in line with the positive perspectives and acceptance that the educational community displays regarding these technologies [
18,
19,
20,
21]. More specifically, due to their immersive nature, augmented reality and virtual reality share common elements which can be crucial for their effective application in educational contexts [
14,
86]. As it can be seen from the most commonly used words and hashtags, similar words and hashtags are being used within the general use datasets for both augmented reality and virtual reality and the same applies to the educational datasets. The period of 2016 to 2018 was the time that most people discussed these technologies with 2018 being the year that had the most tweets related to the use of both augmented reality and virtual reality in education. This can be justified by the fact that several consumer devices (e.g., Oculus Rift, HTC Vice, PlayStation VR, etc.) were released during that time period, which, in turn, increased people’s interest in these technologies. Popular areas, such as gaming, also demonstrated a drastic increase in the use of augmented reality and virtual reality applications which further boosted the public’s acceptance and engagement with them.
As far as the sentiment analysis is concerned, it is worth noting that only a small percentage of tweets were negative in all four cases. Most tweets were either positive or neutral. Particularly for the case of education, a significant number of tweets were positive for both augmented reality and virtual reality. The results can be further justified as both tools used have different sentiment scores and yet, resulted in the majority of the sentiments following the exact same order in each case. The ability of both augmented reality and virtual reality to offer entertaining, personalized, and engaging activities as well as the novelty of these technologies could be a reason for their being mostly positively assessed.
Positive emotions, such as anticipation, trust, and joy, were mostly expressed within the tweets when referring to both the general and educational use of these technologies. As a high number of tweets were neutral, it can be said that the benefits that these technologies can yield are not yet widely known to the public. Due to the fact that occupation is a private field, it could not be retrieved. As a result, specific comments based on occupation, enterprise, or marketing activities cannot be made. The role of educators is vital in cultivating the minds of students and preparing them for their future. Despite educators being positive toward including new technologies in their teaching activities and toward receiving suitable training [
87,
88,
89], the lack of appropriate equipment, technical skills, or training to develop augmented reality and virtual reality applications could be a contributory factor to the neutrality of tweets.
Furthermore, augmented reality and virtual reality are characterized by being increasingly flexible, diverse, and applicable [
90,
91]. This fact was also evident from the topic analysis. The results of the topic analysis also revealed the ability of these technologies to be used in combination with other novel technologies (e.g., artificial intelligence, robotics, machine learning, etc.) and to be integrated into several domains, such as education [
92,
93], industry [
94,
95], travel and tourism [
96,
97], health [
98,
99], etc., yielding several benefits. The use of these technologies for marketing and advertising purposes and their ability to be incorporated into social media was also highlighted as a topic. Studies have showcased the benefits of including augmented reality and virtual reality in advertising, marketing, and promotion [
100,
101]. Additionally, their use as a means to help people exercise to stay fit and healthy was evident. Recent studies have demonstrated the benefits of augmented reality and virtual reality in this domain [
102,
103]. Due to their immersive and engaging nature, these technologies are increasingly being used for gaming and entertainment purposes. There are specific SDKs that can be used to develop augmented reality and virtual reality applications which can run on particular devices (e.g., mobiles, head-mounted devices, tablets, etc.) afterwards [
104,
105]. As many software and hardware advances took place during the specific time period to overcome some of the initial technical challenges and limitations, it was not surprising that topics related to SDKs and devices also emerged.
6. Conclusions
As extended reality technologies become more mature, they are being applied to several domains, including education. Although they can yield several educational benefits, it is essential to take the public’s viewpoints into account too in order for their implementation to be more effective.
This study aimed at analyzing social media data to better comprehend the public’s perspectives, sentiments, attitudes, and discourses concerning the adoption and integration of augmented reality and virtual reality in education. For that reason, over 17 million tweets were retrieved, processed, and analyzed using text mining, sentiment analysis, and topic modeling methods. The results showcased that the majority of the public were positively disposed toward the general and educational use of both augmented reality and virtual reality. Moreover, they mostly expressed positive emotions (e.g., anticipation, trust, and joy) when referring to them. The flexibility and applicability of these technologies were also evident as they can be successfully applied into several domains. Based on the topic analysis, 11 topics emerged that were related to education, new technologies, digital and social media use, marketing and advertising, the industrial domain, the health domain, gaming, fitness and exercising, devices, the travel and tourism domain, and SDKs. The close relationship between augmented reality and virtual reality and their common application fields were also highlighted. Overall, their ability to positively affect teaching and learning processes and their role as effective educational means were evident. Future research can look into different social media platforms and use the results of this study to make comparisons with those of specific educational samples.
Author Contributions
Conceptualization and methodology, G.L., data retrieval, processing, and analysis, G.L., tables and figures generation, G.L., formal analysis and investigation, G.L., writing—original draft preparation, G.L., writing—review and editing, G.L., funding acquisition, G.L., supervision, E.K., K.D., and G.E. All authors have read and agreed to the published version of the manuscript.
Funding
The research work was supported by the Hellenic Foundation for Research and Innovation (HFRI) under the 3rd Call for HFRI PhD Fellowships (Fellowship Number: 6454).
Institutional Review Board Statement
Not applicable.
Informed Consent Statement
Not applicable.
Data Availability Statement
The datasets analyzed in this study are available from the corresponding author on reasonable request.
Conflicts of Interest
The authors declare no conflict of interest.
References
- DiLullo, C.; McGee, P.; Kriebel, R.M. Demystifying the Millennial student: A reassessment in measures of character and engagement in professional education. Anat. Sci. Educ. 2011, 4, 214–226. [Google Scholar] [CrossRef]
- Alexander, B.; Ashford-Rowe, K.; Barajas-Murph, N.; Dobbin, G.; Knott, J.; McCormack, M.; Pomerantz, J.; Seilhamer, R.; Weber, N. Horizon Report 2019 Higher Education Edition. Technical Report, EDUCAUSE. 2019. Available online: https://www.learntechlib.org/p/208644/ (accessed on 6 November 2022).
- López-Belmonte, J.; Moreno-Guerrero, A.J.; Marín-Marín, J.A.; Lampropoulos, G. The Impact of Gender on the Use of Augmented Reality and Virtual Reality in Students with ASD. Educ. Knowl. Soc. (EKS) 2022, 23, eks.28418. [Google Scholar] [CrossRef]
- Robinson, R.; Molenda, M.; Rezabek, L. Facilitating learning. In Educational Technology; Routledge: London, UK, 2013; pp. 27–60. [Google Scholar]
- Lampropoulos, G.; Anastasiadis, T.; Siakas, K. Digital Game-based Learning in Education: Significance of Motivating, Engaging and Interactive Learning Environments. In Proceedings of the 24th International Conference on Software Process Improvement-Research into Education and Training (INSPIRE), Southampton, UK, 16 April 2019; pp. 117–127. [Google Scholar]
- Wu, H.K.; Lee, S.W.Y.; Chang, H.Y.; Liang, J.C. Current status, opportunities and challenges of augmented reality in education. Comput. Educ. 2013, 62, 41–49. [Google Scholar] [CrossRef]
- Kavanagh, S.; Luxton-Reilly, A.; Wuensche, B.; Plimmer, B. A systematic review of virtual reality in education. Themes Sci. Technol. Educ. 2017, 10, 85–119. [Google Scholar]
- Lampropoulos, G.; Keramopoulos, E.; Diamantaras, K.; Evangelidis, G. Augmented Reality and Gamification in Education: A Systematic Literature Review of Research, Applications, and Empirical Studies. Appl. Sci. 2022, 12, 6809. [Google Scholar] [CrossRef]
- López-Belmonte, J.; Pozo-Sánchez, S.; Lampropoulos, G.; Moreno-Guerrero, A.J. Design and validation of a questionnaire for the evaluation of educational experiences in the metaverse in Spanish students (METAEDU). Heliyon 2022, 8, e11364. [Google Scholar] [CrossRef]
- Suh, A.; Prophet, J. The state of immersive technology research: A literature analysis. Comput. Hum. Behav. 2018, 86, 77–90. [Google Scholar] [CrossRef]
- Rupp, M.A.; Odette, K.L.; Kozachuk, J.; Michaelis, J.R.; Smither, J.A.; McConnell, D.S. Investigating learning outcomes and subjective experiences in 360-degree videos. Comput. Educ. 2019, 128, 256–268. [Google Scholar] [CrossRef]
- Chang, H.Y.; Hsu, Y.S.; Wu, H.K. A comparison study of augmented reality versus interactive simulation technology to support student learning of a socio-scientific issue. Interact. Learn. Environ. 2016, 24, 1148–1161. [Google Scholar] [CrossRef]
- Calvet, L.; Bourdin, P.; Prados, F. Immersive Technologies in Higher Education. In Proceedings of the 2019 3rd International Conference on Education and E-Learning, Barcelona, Spain, 5–7 November 2019. [Google Scholar] [CrossRef]
- Beck, D. Special Issue: Augmented and Virtual Reality in Education: Immersive Learning Research. J. Educ. Comput. Res. 2019, 57, 1619–1625. [Google Scholar] [CrossRef]
- Makransky, G.; Petersen, G.B. The Cognitive Affective Model of Immersive Learning (CAMIL): A Theoretical Research-Based Model of Learning in Immersive Virtual Reality. Educ. Psychol. Rev. 2021, 33, 937–958. [Google Scholar] [CrossRef]
- Rojas-Sánchez, M.A.; Palos-Sánchez, P.R.; Folgado-Fernández, J.A. Systematic literature review and bibliometric analysis on virtual reality and education. Educ. Inf. Technol. 2022, 1–38. [Google Scholar] [CrossRef] [PubMed]
- Hincapie, M.; Diaz, C.; Valencia, A.; Contero, M.; Güemes-Castorena, D. Educational applications of augmented reality: A bibliometric study. Comput. Electr. Eng. 2021, 93, 107289. [Google Scholar] [CrossRef]
- Freina, L.; Ott, M. A literature review on immersive virtual reality in education: State of the art and perspectives. In Proceedings of the International Scientific Conference Elearning and Software for Education, Bucharest, Romania, 25–26 April 2015; pp. 1–8. [Google Scholar]
- Akçayır, M.; Akçayır, G. Advantages and challenges associated with augmented reality for education: A systematic review of the literature. Educ. Res. Rev. 2017, 20, 1–11. [Google Scholar] [CrossRef]
- Chen, P.; Liu, X.; Cheng, W.; Huang, R. A review of using Augmented Reality in Education from 2011 to 2016. In Innovations in Smart Learning; Springer: Berlin, Germany, 2017; pp. 13–18. [Google Scholar] [CrossRef]
- Radianti, J.; Majchrzak, T.A.; Fromm, J.; Wohlgenannt, I. A systematic review of immersive virtual reality applications for higher education: Design elements, lessons learned, and research agenda. Comput. Educ. 2020, 147, 103778. [Google Scholar] [CrossRef]
- Neubaum, G.; Krämer, N.C. Monitoring the Opinion of the Crowd: Psychological Mechanisms Underlying Public Opinion Perceptions on Social Media. Media Psychol. 2017, 20, 502–531. [Google Scholar] [CrossRef]
- Perrin, A. Social media usage. Pew Res. Cent. 2015, 125, 52–68. [Google Scholar]
- Milgram, P.; Kishino, F. A taxonomy of mixed reality visual displays. Ieice Trans. Inf. Syst. 1994, 77, 1321–1329. [Google Scholar]
- Lampropoulos, G.; Keramopoulos, E.; Diamantaras, K. Enhancing the functionality of augmented reality using deep learning, semantic web and knowledge graphs: A review. Vis. Inform. 2020, 4, 32–42. [Google Scholar] [CrossRef]
- Azuma, R.T. A Survey of Augmented Reality. Presence Teleoperators Virtual Environ. 1997, 6, 355–385. [Google Scholar] [CrossRef]
- Garzón, J.; Pavón, J.; Baldiris, S. Systematic review and meta-analysis of augmented reality in educational settings. Virtual Real. 2019, 23, 447–459. [Google Scholar] [CrossRef]
- Goff, E.E.; Mulvey, K.L.; Irvin, M.J.; Hartstone-Rose, A. Applications of augmented reality in informal science learning sites: A review. J. Sci. Educ. Technol. 2018, 27, 433–447. [Google Scholar] [CrossRef]
- Schuemie, M.J.; van der Straaten, P.; Krijn, M.; van der Mast, C.A. Research on Presence in Virtual Reality: A Survey. Cyberpsychol. Behav. 2001, 4, 183–201. [Google Scholar] [CrossRef]
- Anthes, C.; Garcia-Hernandez, R.J.; Wiedemann, M.; Kranzlmuller, D. State of the art of virtual reality technology. In Proceedings of the 2016 IEEE Aerospace Conference, Big Sky, MO, USA, 5–12 March 2016. [Google Scholar] [CrossRef]
- Lampropoulos, G.; Barkoukis, V.; Burden, K.; Anastasiadis, T. 360-degree video in education: An overview and a comparative social media data analysis of the last decade. Smart Learn. Environ. 2021, 8, 1–24. [Google Scholar] [CrossRef]
- Sherman, W.R.; Craig, A.B. Understanding virtual reality—Interface, application, and design. Presence Teleoperators Virtual Environ. 2003, 12, 441–442. [Google Scholar] [CrossRef] [Green Version]
- Pozo-Sánchez, S.; Lampropoulos, G.; López-Belmonte, J. Comparing Gamification Models in Higher Education Using Face-to-Face and Virtual Escape Rooms. J. New Approaches Educ. Res. 2022, 11, 307. [Google Scholar] [CrossRef]
- Huang, H.M.; Rauch, U.; Liaw, S.S. Investigating learners’ attitudes toward virtual reality learning environments: Based on a constructivist approach. Comput. Educ. 2010, 55, 1171–1182. [Google Scholar] [CrossRef]
- Gil de Zúñiga, H.; Diehl, T.; Huber, B.; Liu, J. Personality Traits and Social Media Use in 20 Countries: How Personality Relates to Frequency of Social Media Use, Social Media News Use, and Social Media Use for Social Interaction. Cyberpsychol. Behav. Soc. Netw. 2017, 20, 540–552. [Google Scholar] [CrossRef] [PubMed] [Green Version]
- Makkonen, P.; Lampropoulos, G.; Siakas, K. Security and privacy issues and concerns about the use of social networking services. In Proceedings of the E-Learn: World Conference on E-Learning in Corporate, Government, Healthcare, and Higher Education; Association for the Advancement of Computing in Education (AACE): San Diego, CA, USA, 2019; pp. 457–466. [Google Scholar]
- Zolkepli, I.A.; Kamarulzaman, Y. Social media adoption: The role of media needs and innovation characteristics. Comput. Hum. Behav. 2015, 43, 189–209. [Google Scholar] [CrossRef]
- Özgüven, N.; Mucan, B. The Relationship between Personality Traits and Social Media Use. Soc. Behav. Personal. Int. J. 2013, 41, 517–528. [Google Scholar] [CrossRef]
- Narangajavana Kaosiri, Y.; Callarisa Fiol, L.J.; Moliner Tena, M.Á.; Rodríguez Artola, R.M.; Sánchez García, J. User-Generated Content Sources in Social Media: A New Approach to Explore Tourist Satisfaction. J. Travel Res. 2019, 58, 253–265. [Google Scholar] [CrossRef]
- Boyd, D.M.; Ellison, N.B. Social Network Sites: Definition, History, and Scholarship. J. Comput. Mediat. Commun. 2007, 13, 210–230. [Google Scholar] [CrossRef] [Green Version]
- Rehm, M.; Notten, A. Twitter as an informal learning space for teachers!? The role of social capital in Twitter conversations among teachers. Teach. Teach. Educ. 2016, 60, 215–223. [Google Scholar] [CrossRef]
- Lampropoulos, G.; Siakas, K.; Makkonen, P.; Siakas, E. A 10-year Longitudinal Study of Social Media Use in Education. Int. J. Technol. Educ. 2021, 4, 373–398. [Google Scholar] [CrossRef]
- Carr, C.T.; Hayes, R.A. Social Media: Defining, Developing, and Divining. Atl. J. Commun. 2015, 23, 46–65. [Google Scholar] [CrossRef]
- Domenico, G.D.; Sit, J.; Ishizaka, A.; Nunan, D. Fake news, social media and marketing: A systematic review. J. Bus. Res. 2021, 124, 329–341. [Google Scholar] [CrossRef]
- Shu, K.; Sliva, A.; Wang, S.; Tang, J.; Liu, H. Fake News Detection on Social Media. ACM Sigkdd Explor. Newsl. 2017, 19, 22–36. [Google Scholar] [CrossRef]
- Pennycook, G.; Rand, D.G. The Psychology of Fake News. Trends Cogn. Sci. 2021, 25, 388–402. [Google Scholar] [CrossRef]
- Wu, L.; Morstatter, F.; Carley, K.M.; Liu, H. Misinformation in Social Media. ACM Sigkdd Explor. Newsl. 2019, 21, 80–90. [Google Scholar] [CrossRef]
- Wang, Y.; McKee, M.; Torbica, A.; Stuckler, D. Systematic Literature Review on the Spread of Health-related Misinformation on Social Media. Soc. Sci. Med. 2019, 240, 112552. [Google Scholar] [CrossRef]
- Davis, C.A.; Varol, O.; Ferrara, E.; Flammini, A.; Menczer, F. BotOrNot: A System to Evaluate Social Bot. In Proceedings of the 25th International Conference Companion on World Wide Web—WWW ’16 Companion, Montreal, QC, Canada, 11–15 May 2016. [Google Scholar] [CrossRef] [Green Version]
- Orabi, M.; Mouheb, D.; Al Aghbari, Z.; Kamel, I. Detection of Bots in Social Media: A Systematic Review. Inf. Process. Manag. 2020, 57, 102250. [Google Scholar] [CrossRef]
- Assenmacher, D.; Clever, L.; Frischlich, L.; Quandt, T.; Trautmann, H.; Grimme, C. Demystifying Social Bots: On the Intelligence of Automated Social Media Actors. Soc. Media Soc. 2020, 6, 1–14. [Google Scholar] [CrossRef]
- Kanakaris, V.; Lampropoulos, G.; Siakas, K. A Survey and a Case-Study Regarding Social Media Security and Privacy on Greek Future IT Professionals. Int. J. Hum. Cap. Inform. Technol. Prof. 2019, 10, 22–37. [Google Scholar] [CrossRef]
- Senthil Kumar, N.; Saravanakumar, K.; Deepa, K. On Privacy and Security in Social Media – A Comprehensive Study. Procedia Comput. Sci. 2016, 78, 114–119. [Google Scholar] [CrossRef] [Green Version]
- Ellison, N.B.; Vitak, J.; Steinfield, C.; Gray, R.; Lampe, C. Negotiating Privacy Concerns and Social Capital Needs in a Social Media Environment. In Privacy Online; Springer: Berlin, Germany, 2011; pp. 19–32. [Google Scholar] [CrossRef] [Green Version]
- Si, S. Social Media and Its Role in Marketing. Bus. Econ. J. 2015, 7, 1000203. [Google Scholar] [CrossRef] [Green Version]
- Shareef, M.A.; Mukerji, B.; Dwivedi, Y.K.; Rana, N.P.; Islam, R. Social media marketing: Comparative effect of advertisement sources. J. Retail. Consum. Serv. 2019, 46, 58–69. [Google Scholar] [CrossRef] [Green Version]
- Mirrlees, T.; Alvi, S. EdTech Inc.: Selling, Automating and Globalizing Higher Education in the Digital Age; Routledge: London, UK, 2019. [Google Scholar] [CrossRef]
- Chen, H.; De, P.; Hu, Y.J.; Hwang, B.H. Wisdom of Crowds: The Value of Stock Opinions Transmitted Through Social Media. Rev. Financ. Stud. 2014, 27, 1367–1403. [Google Scholar] [CrossRef]
- Savage, N. Gaining wisdom from crowds. Commun. ACM 2012, 55, 13–15. [Google Scholar] [CrossRef] [Green Version]
- Bruns, A.; Highfield, T.; Lind, R.A. Blogs, Twitter, and breaking news: The produsage of citizen journalism. Prod. Theory Digit. World: Intersect. Audiences Prod. Contemp. Theory 2012, 80, 15–32. [Google Scholar]
- Java, A.; Song, X.; Finin, T.; Tseng, B. Why we twitter. In Proceedings of the 9th WebKDD and 1st SNA-KDD 2007 Workshop on Web Mining and Social Network Analysis—WebKDD/SNA-KDD 07, San Jose, CA, USA, 12 August 2007; ACM Press: New York, NY, USA, 2007. [Google Scholar] [CrossRef]
- Phuvipadawat, S.; Murata, T. Breaking News Detection and Tracking in Twitter. In Proceedings of the 2010 IEEE/WIC/ACM International Conference on Web Intelligence and Intelligent Agent Technology, Toronto, ON, Canada, 31 August–3 September 2010. [Google Scholar] [CrossRef]
- Nazir, F.; Ghazanfar, M.A.; Maqsood, M.; Aadil, F.; Rho, S.; Mehmood, I. Social media signal detection using tweets volume, hashtag, and sentiment analysis. Multimed. Tools Appl. 2018, 78, 3553–3586. [Google Scholar] [CrossRef]
- Wu, S.; Hofman, J.M.; Mason, W.A.; Watts, D.J. Who says what to whom on twitter. In Proceedings of the 20th international Conference on World Wide Web—WWW’11, Hyderabad, India, 28 March–1 April 2011; ACM Press: New York, NY, USA, 2011. [Google Scholar] [CrossRef]
- Balaguer, P.; Teixidó, I.; Vilaplana, J.; Mateo, J.; Rius, J.; Solsona, F. CatSent: A Catalan sentiment analysis website. Multimed. Tools Appl. 2019, 78, 28137–28155. [Google Scholar] [CrossRef]
- Lee, S.W.; Jiang, G.; Kong, H.Y.; Liu, C. A difference of multimedia consumer’s rating and review through sentiment analysis. Multimed. Tools Appl. 2020, 80, 34625–34642. [Google Scholar] [CrossRef]
- Medhat, W.; Hassan, A.; Korashy, H. Sentiment analysis algorithms and applications: A survey. Ain Shams Eng. J. 2014, 5, 1093–1113. [Google Scholar] [CrossRef] [Green Version]
- Chen, Z.; Zhang, R.; Xu, T.; Yang, Y.; Wang, J.; Feng, T. Emotional attitudes towards procrastination in people: A large-scale sentiment-focused crawling analysis. Comput. Hum. Behav. 2020, 110, 106391. [Google Scholar] [CrossRef]
- Kastrati, Z.; Dalipi, F.; Imran, A.S.; Pireva Nuci, K.; Wani, M.A. Sentiment Analysis of Students’ Feedback with NLP and Deep Learning: A Systematic Mapping Study. Appl. Sci. 2021, 11, 3986. [Google Scholar] [CrossRef]
- Loria, S.; Keen, P.; Honnibal, M.; Yankovsky, R.; Karesh, D.; Dempsey, E.; Childs, W.; Schnurr, J.; Qalieh, A.; Ragnarsson, L.; et al. Textblob: Simplified text processing. Second Textblob Simpl. Text Process. 2014, 3, 2014. [Google Scholar]
- Hutto, C.; Gilbert, E. Vader: A parsimonious rule-based model for sentiment analysis of social media text. In Proceedings of the International AAAI Conference on Weblogs and Social Media, Ann Arbor, MI, USA, 1–4 June 2014; pp. 216–225. [Google Scholar]
- Mohammad, S.; Turney, P. Emotions evoked by common words and phrases: Using mechanical turk to create an emotion lexicon. In Proceedings of the NAACL HLT 2010 Workshop on Computational Approaches to Analysis and Generation of Emotion in Text, Los Angeles, CA, USA, 5 June 2010; pp. 26–34. [Google Scholar]
- Plutchik, R. Emotions: A general psychoevolutionary theory. Approaches Emot. 1984, 197–219. [Google Scholar]
- Li, X.; Lei, L. A bibliometric analysis of topic modelling studies (2000–2017). J. Inf. Sci. 2021, 47, 161–175. [Google Scholar] [CrossRef]
- Nikolenko, S.I.; Koltcov, S.; Koltsova, O. Topic modelling for qualitative studies. J. Inf. Sci. 2017, 43, 88–102. [Google Scholar] [CrossRef] [Green Version]
- Vayansky, I.; Kumar, S.A. A review of topic modeling methods. Inf. Syst. 2020, 94, 101582. [Google Scholar] [CrossRef]
- Ramage, D.; Rosen, E.; Chuang, J.; Manning, C.D.; McFarland, D.A. Topic modeling for the social sciences. In Proceedings of the NIPS 2009 Workshop on Applications for Topic Models: Text and Beyond, Whistler, BC, Canada, 10–11 December 2009; Volume 5, pp. 1–4. [Google Scholar]
- Wallach, H.M. Topic modeling. In Proceedings of the 23rd International Conference on Machine Learning—ICML ’06, Pittsburgh, PA, USA, 25–29 July 2006. [Google Scholar] [CrossRef]
- Teh, Y.; Jordan, M.; Beal, M.; Blei, D. Sharing Clusters among Related Groups: Hierarchical Dirichlet Processes. In Proceedings of the Advances in Neural Information Processing Systems, Vancouver, BC, Canada, 13–18 December 2004; Saul, L., Weiss, Y., Bottou, L., Eds.; MIT Press: Cambridge, MA, USA, 2004; Volume 17. [Google Scholar]
- Hu, Y.; Boyd-Graber, J.; Satinoff, B.; Smith, A. Interactive topic modeling. Mach. Learn. 2014, 95, 423–469. [Google Scholar] [CrossRef]
- Hong, L.; Davison, B.D. Empirical study of topic modeling in Twitter. In Proceedings of the First Workshop on Social Media Analytics - SOMA ’10, Washington, DC, USA, 25 July 2010. [Google Scholar] [CrossRef] [Green Version]
- Ferner, C.; Havas, C.; Birnbacher, E.; Wegenkittl, S.; Resch, B. Automated Seeded Latent Dirichlet Allocation for Social Media Based Event Detection and Mapping. Information 2020, 11, 376. [Google Scholar] [CrossRef]
- Jelodar, H.; Wang, Y.; Yuan, C.; Feng, X.; Jiang, X.; Li, Y.; Zhao, L. Latent Dirichlet allocation (LDA) and topic modeling: Models, applications, a survey. Multimed. Tools Appl. 2019, 78, 15169–15211. [Google Scholar] [CrossRef] [Green Version]
- Xue, J.; Chen, J.; Chen, C.; Zheng, C.; Li, S.; Zhu, T. Public discourse and sentiment during the COVID 19 pandemic: Using Latent Dirichlet Allocation for topic modeling on Twitter. PLoS ONE 2020, 15, e0239441. [Google Scholar] [CrossRef] [PubMed]
- Blei, D.M.; Ng, A.Y.; Jordan, M.I. Latent dirichlet allocation. J. Mach. Learn. Res. 2003, 3, 993–1022. [Google Scholar]
- Muñoz-Saavedra, L.; Miró-Amarante, L.; Domínguez-Morales, M. Augmented and Virtual Reality Evolution and Future Tendency. Appl. Sci. 2020, 10, 322. [Google Scholar] [CrossRef]
- Tondeur, J.; van Braak, J.; Sang, G.; Voogt, J.; Fisser, P.; Ottenbreit-Leftwich, A. Preparing pre-service teachers to integrate technology in education: A synthesis of qualitative evidence. Comput. Educ. 2012, 59, 134–144. [Google Scholar] [CrossRef]
- Uerz, D.; Volman, M.; Kral, M. Teacher educators’ competences in fostering student teachers’ proficiency in teaching and learning with technology: An overview of relevant research literature. Teach. Teach. Educ. 2018, 70, 12–23. [Google Scholar] [CrossRef]
- Tondeur, J.; Scherer, R.; Baran, E.; Siddiq, F.; Valtonen, T.; Sointu, E. Teacher educators as gatekeepers: Preparing the next generation of teachers for technology integration in education. Br. J. Educ. Technol. 2019, 50, 1189–1209. [Google Scholar] [CrossRef]
- Ashtari, N.; Bunt, A.; McGrenere, J.; Nebeling, M.; Chilana, P.K. Creating Augmented and Virtual Reality Applications: Current Practices, Challenges, and Opportunities. In Proceedings of the 2020 CHI Conference on Human Factors in Computing Systems, Honolulu, HI, USA, 25–30 April 2020. [Google Scholar] [CrossRef]
- Rauschnabel, P.A.; Felix, R.; Hinsch, C.; Shahab, H.; Alt, F. What Is XR? Towards a Framework for Augmented and Virtual Reality. Comput. Hum. Behav. 2022, 133, 107289. [Google Scholar] [CrossRef]
- Avila-Garzon, C.; Bacca-Acosta, J.; Kinshuk; Duarte, J.; Betancourt, J. Augmented Reality in Education: An Overview of Twenty-Five Years of Research. Contemp. Educ. Technol. 2021, 13, ep302. [Google Scholar] [CrossRef]
- Hamilton, D.; McKechnie, J.; Edgerton, E.; Wilson, C. Immersive virtual reality as a pedagogical tool in education: A systematic literature review of quantitative learning outcomes and experimental design. J. Comput. Educ. 2020, 8, 1–32. [Google Scholar] [CrossRef]
- Damiani, L.; Demartini, M.; Guizzi, G.; Revetria, R.; Tonelli, F. Augmented and virtual reality applications in industrial systems: A qualitative review towards the industry 4.0 era. IFAC-PapersOnLine 2018, 51, 624–630. [Google Scholar] [CrossRef]
- Ma, D.; Gausemeier, J.; Fan, X.; Grafe, M. Virtual Reality & Augmented Reality in Industry; Springer: Berlin, Germany, 2011. [Google Scholar]
- Loureiro, S.M.C.; Guerreiro, J.; Ali, F. 20 years of research on virtual reality and augmented reality in tourism context: A text-mining approach. Tour. Manag. 2020, 77, 104028. [Google Scholar] [CrossRef]
- Yung, R.; Khoo-Lattimore, C. New realities: A systematic literature review on virtual reality and augmented reality in tourism research. Curr. Issues Tour. 2019, 22, 2056–2081. [Google Scholar] [CrossRef] [Green Version]
- Moro, C.; Štromberga, Z.; Raikos, A.; Stirling, A. The effectiveness of virtual and augmented reality in health sciences and medical anatomy. Anat. Sci. Educ. 2017, 10, 549–559. [Google Scholar] [CrossRef] [PubMed] [Green Version]
- Sim, K.W.; Baker, B.; Amin, K.; Chan, A.; Patel, K.; Wong, J. Augmented and virtual reality in surgery—The digital surgical environment: Applications, limitations and legal pitfalls. Ann. Transl. Med. 2016, 4. [Google Scholar] [CrossRef] [Green Version]
- Alcañiz, M.; Bigné, E.; Guixeres, J. Virtual Reality in Marketing: A Framework, Review, and Research Agenda. Front. Psychol. 2019, 10, 01530. [Google Scholar] [CrossRef] [Green Version]
- Wedel, M.; Bigné, E.; Zhang, J. Virtual and augmented reality: Advancing research in consumer marketing. Int. J. Res. Mark. 2020, 37, 443–465. [Google Scholar] [CrossRef]
- Alturki, R.; Gay, V. Augmented and Virtual Reality in Mobile Fitness Applications: A Survey. In Applications of Intelligent Technologies in Healthcare; Springer International Publishing: Berlin/Heidelberg, Germany, 2018; pp. 67–75. [Google Scholar] [CrossRef]
- Ng, Y.L.; Ma, F.; Ho, F.K.; Ip, P.; wa Fu, K. Effectiveness of virtual and augmented reality-enhanced exercise on physical activity, psychological outcomes, and physical performance: A systematic review and meta-analysis of randomized controlled trials. Comput. Hum. Behav. 2019, 99, 278–291. [Google Scholar] [CrossRef]
- Amin, D.; Govilkar, S. Comparative study of augmented reality SDKs. Int. J. Comput. Sci. Appl. 2015, 5, 11–26. [Google Scholar] [CrossRef]
- Jensen, L.; Konradsen, F. A review of the use of virtual reality head-mounted displays in education and training. Educ. Inf. Technol. 2018, 23, 1515–1529. [Google Scholar] [CrossRef]
Figure 1.
Monthly and annual augmented reality tweets over the years 2010–2020.
Figure 1.
Monthly and annual augmented reality tweets over the years 2010–2020.
Figure 2.
TextBlob polarity detection: Augmented reality dataset.
Figure 2.
TextBlob polarity detection: Augmented reality dataset.
Figure 3.
VADER polarity detection: Augmented reality dataset.
Figure 3.
VADER polarity detection: Augmented reality dataset.
Figure 4.
TextBlob and VADER polarity detection: Augmented reality dataset.
Figure 4.
TextBlob and VADER polarity detection: Augmented reality dataset.
Figure 5.
Emotion frequency based on the most intense emotion of each augmented reality tweet for each year over the years 2010–2020.
Figure 5.
Emotion frequency based on the most intense emotion of each augmented reality tweet for each year over the years 2010–2020.
Figure 6.
Monthly and annual tweets of the educational augmented reality dataset over the years 2010–2020.
Figure 6.
Monthly and annual tweets of the educational augmented reality dataset over the years 2010–2020.
Figure 7.
TextBlob polarity detection: Educational augmented reality dataset.
Figure 7.
TextBlob polarity detection: Educational augmented reality dataset.
Figure 8.
VADER polarity detection: Educational augmented reality dataset.
Figure 8.
VADER polarity detection: Educational augmented reality dataset.
Figure 9.
TextBlob and VADER polarity detection: Educational augmented reality dataset.
Figure 9.
TextBlob and VADER polarity detection: Educational augmented reality dataset.
Figure 10.
Emotion frequency based on the most intense emotion of each tweet of the educational augmented reality dataset for each year over the years 2010–2020.
Figure 10.
Emotion frequency based on the most intense emotion of each tweet of the educational augmented reality dataset for each year over the years 2010–2020.
Figure 11.
Monthly and annual virtual reality tweets over the years 2010–2020.
Figure 11.
Monthly and annual virtual reality tweets over the years 2010–2020.
Figure 12.
TextBlob polarity detection: Virtual reality dataset.
Figure 12.
TextBlob polarity detection: Virtual reality dataset.
Figure 13.
VADER polarity detection: Virtual reality dataset.
Figure 13.
VADER polarity detection: Virtual reality dataset.
Figure 14.
TextBlob and VADER polarity detection: Virtual reality dataset.
Figure 14.
TextBlob and VADER polarity detection: Virtual reality dataset.
Figure 15.
Emotion frequency based on the most intense emotion of each virtual reality tweet for each year over the years 2010–2020.
Figure 15.
Emotion frequency based on the most intense emotion of each virtual reality tweet for each year over the years 2010–2020.
Figure 16.
Monthly and annual tweets of the educational virtual reality dataset over the years 2010–2020.
Figure 16.
Monthly and annual tweets of the educational virtual reality dataset over the years 2010–2020.
Figure 17.
TextBlob polarity detection: Educational virtual reality dataset.
Figure 17.
TextBlob polarity detection: Educational virtual reality dataset.
Figure 18.
VADER polarity detection: Educational virtual reality dataset.
Figure 18.
VADER polarity detection: Educational virtual reality dataset.
Figure 19.
TextBlob and VADER polarity detection: Educational virtual reality dataset.
Figure 19.
TextBlob and VADER polarity detection: Educational virtual reality dataset.
Figure 20.
Polarity frequency of the tweets of the educational virtual reality dataset.
Figure 20.
Polarity frequency of the tweets of the educational virtual reality dataset.
Table 1.
Frequency of the top-40 most common words within the augmented reality tweets.
Table 1.
Frequency of the top-40 most common words within the augmented reality tweets.
| Word | Freq. | Word | Freq. | Word | Freq. | Word | Freq. |
|---|
| reality | 4,346,364 | tech | 255,979 | see | 147,720 | news | 116,313 |
| augmented | 4,049,674 | ai | 245,673 | apple | 147,355 | go | 111,963 |
| ar | 3,290,094 | video | 222,395 | iphone | 144,767 | make | 110,855 |
| vr | 790,815 | future | 221,923 | world | 142,387 | business | 109,236 |
| app | 535,416 | game | 204,320 | experience | 133,371 | next | 104,398 |
| via | 486,831 | iot | 193,118 | get | 124,164 | first | 102,993 |
| virtual | 458,072 | google | 179,928 | digital | 119,503 | real | 100,762 |
| new | 393,814 | 3d | 178,210 | marketing | 117,682 | one | 100,170 |
| use | 249,786 | glass | 173,213 | like | 117,677 | way | 99,163 |
| technology | 259,955 | mobile | 173,036 | check | 116,395 | android | 97,611 |
Table 2.
Frequency of the top-40 most common hashtags within the augmented reality tweets.
Table 2.
Frequency of the top-40 most common hashtags within the augmented reality tweets.
| Hashtag | Freq. | Hashtag | Freq. | Hashtag | Freq. | Hashtag | Freq. |
|---|
| #AR | 2,148,784 | #MR | 83,589 | #blurreal | 41,253 | #marketing | 35,311 |
| #ar | 864,263 | #technology | 71,169 | #socialmedia | 40,170 | #layar | 35,061 |
| #VR | 632,177 | #virtualreality | 58,102 | #MixedReality | 39,370 | #XR | 35,000 |
| #AugmentedReality | 552,546 | #3D | 56,668 | #realestate | 39,008 | #blockchain | 33,264 |
| #augmentedreality | 316,271 | #Ar | 53,589 | #ML | 38,698 | #MachineLearning | 32,970 |
| #AI | 208,732 | #Tech | 49,588 | #social | 38,220 | #Technology | 32,883 |
| #IoT | 161,095 | #innovation | 47,169 | #mobile | 36,910 | #Augmented | 32,207 |
| #VirtualReality | 130,075 | #ARNews | 46,296 | #ArtificialIntelligence | 36,296 | #StarWars | 29,499 |
| #tech | 103,983 | #BigData | 45,815 | #Robotics | 35,842 | #LittleRock | 29,289 |
| #vr | 93,960 | #edtech | 45,138 | #jobs | 35,678 | #Blockchain | 29,196 |
Table 3.
Frequency of the top-20 most common bigrams within the augmented reality tweets.
Table 3.
Frequency of the top-20 most common bigrams within the augmented reality tweets.
| Bigram | Freq. | Bigram | Freq. |
|---|
| (augmented, reality) | 3,059,128 | (new, augmented) | 45,453 |
| (ar, vr) | 524,877 | (reality, apps) | 41,722 |
| (reality, app) | 135,588 | (blurreal, ar) | 41,247 |
| (virtual, reality) | 117,379 | (magic, leap) | 39,968 |
| (reality, ar) | 71,204 | (ai, ar) | 39,569 |
| (use, augmented) | 79,297 | (reality, augmented) | 35,123 |
| (reality, glasses) | 65,698 | (ar, realestate) | 34,098 |
| (virtual, augmented) | 59,410 | (vr, mr) | 33,701 |
| (let, us) | 58,415 | (use, augmented) | 33,556 |
| (reality, game) | 50,057 | (app, augmented) | 33,289 |
Table 4.
Frequency of the top-20 most common trigrams within the augmented reality tweets.
Table 4.
Frequency of the top-20 most common trigrams within the augmented reality tweets.
| Trigram | Freq. | Trigram | Freq. |
|---|
| (augmented, reality, app) | 134,397 | (reality, augmented, reality) | 31,465 |
| (use, augmented, reality) | 66,851 | (future, augmented, reality) | 30,900 |
| (augmented, reality, ar) | 65,371 | (find, layar, ar) | 30,727 |
| (augmented, reality, glasses) | 64,975 | (augmented, reality, via) | 29,238 |
| (virtual, augmented, reality) | 57,103 | (augmented, reality, headset) | 25,980 |
| (augmented, reality, game) | 49,209 | (augmented, reality, future) | 24,508 |
| (new, augmented, reality) | 44,534 | (augmented, reality, technology) | 24,483 |
| (using, augmented, reality) | 44,024 | (augmented, reality, virtual) | 24,142 |
| (augmented, reality, apps) | 40,552 | (mobile, augmented, reality) | 23,067 |
| (app, augmented, reality) | 32,852 | (virtual, reality, augmented) | 22,943 |
Table 5.
Frequency of the top-40 most common words within the tweets of the educational augmented reality dataset.
Table 5.
Frequency of the top-40 most common words within the tweets of the educational augmented reality dataset.
| Word | Freq. | Word | Freq. | Word | Freq. | Word | Freq. |
|---|
| reality | 143,343 | app | 16,522 | ai | 8999 | game | 5146 |
| augmented | 125,452 | technology | 16,007 | teach | 8971 | classroom | 5085 |
| ar | 88,735 | student | 13,908 | future | 7783 | business | 4958 |
| education | 64,831 | new | 12,904 | way | 7506 | iot | 4934 |
| learn | 52,990 | learning | 12,724 | experience | 7240 | innovation | 4775 |
| vr | 38,182 | via | 12,338 | help | 6591 | digital | 4677 |
| virtual | 25,030 | class | 10,088 | more | 5646 | elearning | 4656 |
| use | 23,737 | tech | 9962 | video | 5578 | world | 4629 |
| school | 17,889 | university | 9147 | kid | 5466 | tool | 4513 |
| edtech | 16,902 | train | 9083 | 3d | 5369 | college | 4401 |
Table 6.
Frequency of the top-40 most common hashtags within the tweets of the educational augmented reality dataset.
Table 6.
Frequency of the top-40 most common hashtags within the tweets of the educational augmented reality dataset.
| Hashtag | Freq. | Hashtag | Freq. | Hashtag | Freq. | Hashtag | Freq. |
|---|
| #AR | 68,038 | #tech | 4144 | #XR | 2537 | #BigData | 1413 |
| #VR | 31,051 | #IoT | 4102 | #STEM | 2382 | #school | 1314 |
| #AugmentedReality | 24,298 | #technology | 4101 | #learning | 2333 | #ArtificialIntelligence | 1211 |
| #education | 20,548 | #elearning | 3792 | #innovation | 2299 | #teaching | 1201 |
| #edtech | 13,283 | #vr | 3596 | #3D | 2125 | #ai | 1172 |
| #augmentedreality | 11,933 | #MR | 3578 | #mlearning | 1993 | #marketing | 1162 |
| #ar | 9694 | #edchat | 3342 | #k12 | 1776 | #UX | 1033 |
| #Education | 8256 | #EdTech | 3049 | #Tech | 1733 | #healthcare | 1026 |
| #VirtualReality | 7636 | #virtualreality | 3023 | #Technology | 1637 | #art | 1021 |
| #AI | 7266 | #ARVRinEDU | 2756 | #MixedReality | 1611 | #MachineLearning | 1011 |
Table 7.
Frequency of the top-20 most common bigrams within the tweets of the educational augmented reality dataset.
Table 7.
Frequency of the top-20 most common bigrams within the tweets of the educational augmented reality dataset.
| Bigram | Freq. | Bigram | Freq. |
|---|
| (augmented, reality) | 85,330 | (education, edtech) | 2702 |
| (ar, vr) | 25,742 | (learn, augmented) | 2364 |
| (reality, education) | 10,717 | (learn, ar) | 2082 |
| (use, augmented) | 9387 | (augmentedreality, ar) | 2053 |
| (virtual, reality) | 6970 | (education, ar) | 1943 |
| (reality, app) | 5783 | (reality, augmented) | 1912 |
| (learn, consultants) | 3884 | (reality, teach) | 1889 |
| (ar, education) | 3027 | (reality, learn) | 1882 |
| (virtual, augmented) | 2878 | (future, education) | 1880 |
| (reality, ar) | 2849 | (teach, kids) | 1687 |
Table 8.
Frequency of the top-20 most common trigrams within the tweets of the educational augmented reality dataset.
Table 8.
Frequency of the top-20 most common trigrams within the tweets of the educational augmented reality dataset.
| Trigram | Freq. | Trigram | Freq. |
|---|
| (augmented, reality, education) | 9713 | (augmented, reality, learn) | 1713 |
| (use, augmented, reality) | 8940 | (augmented, reality, tool) | 1422 |
| (augmented, reality, app) | 3651 | (augmented, reality, experiments) | 1421 |
| (augmented, reality, ar) | 2693 | (reality, experiments, education) | 1386 |
| (virtual, augmented, reality) | 2692 | (change, med, school) | 1349 |
| (learn, augmented, reality) | 2316 | (totally, change, med) | 1347 |
| (augmented, reality, apps) | 1931 | (reality, tool, could) | 1322 |
| (reality, augmented, reality) | 1851 | (introduction, augmented, reality) | 1201 |
| (augmented, reality, teach) | 1848 | (augmented, reality, web) | 1143 |
| (virtual, reality, augmented) | 1762 | (reality, teach, kids) | 1107 |
Table 9.
Frequency of the top-40 most common words within the virtual reality tweets.
Table 9.
Frequency of the top-40 most common words within the virtual reality tweets.
| Word | Freq. | Word | Freq. | Word | Freq. | Word | Freq. |
|---|
| reality | 6,891,651 | tech | 458,588 | youtube | 245,198 | htc | 192,938 |
| virtual | 6,776,767 | 3d | 413,478 | get | 244,590 | facebook | 185,227 |
| vr | 5,792,465 | experience | 404,629 | rift | 226,343 | time | 182,484 |
| ar | 741,303 | technology | 370,107 | like | 218,515 | next | 179,254 |
| via | 686,991 | augmented | 370,834 | vive | 215,830 | one | 178,856 |
| new | 642,332 | future | 318,930 | first | 215,393 | using | 178,252 |
| oculus | 593,164 | ai | 296,717 | iot | 207,227 | check | 178,092 |
| headset | 557,119 | gaming | 292,711 | make | 204,167 | real | 174,467 |
| game | 525,340 | google | 274,487 | news | 201,863 | could | 171,022 |
| video | 458,588 | world | 250,911 | see | 196,718 | help | 158,504 |
Table 10.
Frequency of the top-40 most common hashtags within the virtual reality tweets.
Table 10.
Frequency of the top-40 most common hashtags within the virtual reality tweets.
| Hashtag | Freq. | Hashtag | Freq. | Hashtag | Freq. | Hashtag | Freq. |
|---|
| #VR | 3,802,049 | #gamedev | 116,208 | #oculus | 67,717 | #Technology | 49,462 |
| #VirtualReality | 962,281 | #3D | 112,055 | #edtech | 66,858 | #blockchain | 46,388 |
| #vr | 869,986 | #Oculus | 105,903 | #Gaming | 63,442 | #Blockchain | 45,690 |
| #virtualreality | 693,700 | #technology | 105,146 | #OculusRift | 62,363 | #news | 44,708 |
| #AR | 615,182 | #gaming | 99,185 | #innovation | 62,320 | #PSVR | 44,591 |
| #AI | 244,152 | #ar | 86,645 | #oculusrift | 60,668 | #XR | 40,870 |
| #tech | 201,637 | #indiedev | 79,976 | #htcvive | 56,655 | #marketing | 40,582 |
| #IoT | 168,825 | #MR | 78,569 | #HTCVive | 52,607 | #MixedReality | 39,230 |
| #blurreal | 140,928 | #Tech | 76,105 | #augmentedreality | 51,899 | #vive | 37,919 |
| #AugmentedReality | 131,402 | #BigData | 68,587 | #ML | 50,836 | #virtual | 37,814 |
Table 11.
Frequency of the top-20 most common bigrams within the virtual reality tweets.
Table 11.
Frequency of the top-20 most common bigrams within the virtual reality tweets.
| Bigram | Freq. | Bigram | Freq. |
|---|
| (virtual, reality) | 4,757,432 | (youtube, video) | 90,142 |
| (vr, ar) | 531,535 | (liked, youtube) | 88,401 |
| (vr, virtualreality) | 316,262 | (3d, vr) | 87,600 |
| (reality, headset) | 234,978 | (let, us) | 81,171 |
| (oculus, rift) | 189,975 | (vr, virtual) | 74,716 |
| (virtualreality, vr) | 145,937 | (reality, experience) | 72,097 |
| (vr, headset) | 117,740 | (new, virtual) | 67,640 |
| (augmented, reality) | 115,053 | (reality, game) | 58,105 |
| (reality, vr) | 101,034 | (vr, tech) | 56,944 |
| (use, virtual) | 98,290 | (oculus, vr) | 56,069 |
Table 12.
Frequency of the top-20 most common trigrams within the virtual reality tweets.
Table 12.
Frequency of the top-20 most common trigrams within the virtual reality tweets.
| Trigram | Freq. | Trigram | Freq. |
|---|
| (virtual, reality, headset) | 231,622 | (virtual, reality, via) | 47,828 |
| (use, virtual, reality) | 95,902 | (augmented, virtual, reality) | 45,616 |
| (virtual, reality, vr) | 91,366 | (3d, virtual, reality) | 41,961 |
| (liked, youtube, video) | 87,992 | (future, virtual, reality) | 38,682 |
| (virtual, reality, experience) | 71,045 | (virtual, reality, video) | 38,072 |
| (vr, virtual, reality) | 67,669 | (virtual, reality, gaming) | 37,078 |
| (new, virtual, reality) | 65,221 | (virtual, reality, games) | 33,789 |
| (virtual, reality, game) | 57,091 | (first, virtual, reality) | 33,210 |
| (virtual, reality, headsets) | 54,287 | (virtual, reality, glasses) | 33,054 |
| (virtual, reality, technology) | 49,989 | (virtual, reality, 3d) | 32,894 |
Table 13.
Frequency of the top-40 most common words within the tweets of the educational virtual reality dataset.
Table 13.
Frequency of the top-40 most common words within the tweets of the educational virtual reality dataset.
| Word | Freq. | Word | Freq. | Word | Freq. | Word | Freq. |
|---|
| reality | 234,955 | train | 26,086 | future | 15,145 | classroom | 8484 |
| virtual | 226,367 | technology | 23,860 | teach | 13,936 | history | 8266 |
| vr | 172,733 | new | 23,748 | way | 13,668 | video | 8177 |
| education | 109,421 | augmented | 20,629 | help | 13,508 | art | 8157 |
| learn | 95,539 | via | 19,994 | training | 12,940 | stem | 8117 |
| ar | 35,500 | university | 18,081 | ai | 11,060 | more | 8093 |
| edtech | 33,823 | class | 17,041 | college | 10,660 | elearning | 8019 |
| student | 33,097 | experience | 16,748 | game | 10,618 | teacher | 7934 |
| use | 30,878 | 3d | 16,021 | world | 10,279 | like | 7864 |
| school | 29,584 | tech | 15,747 | immersive | 8630 | first | 7699 |
Table 14.
Frequency of the top-40 most common hashtags within the tweets of the educational virtual reality dataset.
Table 14.
Frequency of the top-40 most common hashtags within the tweets of the educational virtual reality dataset.
| Hashtag | Freq. | Hashtag | Freq. | Hashtag | Freq. | Hashtag | Freq. |
|---|
| #VR | 121,439 | #3D | 7905 | #edtechchat | 4543 | #EdTech | 3396 |
| #VirtualReality | 44,094 | #AugmentedReality | 7642 | #dyslexia | 4400 | #MR | 3385 |
| #education | 35,220 | #elearning | 6828 | #k12 | 4374 | #schools | 3281 |
| #AR | 30,131 | #tech | 6706 | #tourism | 4359 | #ece | 3048 |
| #edtech | 28,922 | #history | 6511 | #stem | 4146 | #earlyed | 3031 |
| #virtualreality | 21,475 | #edchat | 6188 | #highered | 4028 | #collegechat | 3029 |
| #vr | 17,884 | #learning | 6150 | #WebVR | 3669 | #innovation | 3006 |
| #Education | 11,961 | #technology | 5874 | #ar | 3636 | #STEM | 2971 |
| #AI | 8716 | #art | 5367 | #IoT | 3566 | #XR | 2845 |
| #ARVRinEDU | 8490 | #museum | 4899 | #teacher | 3516 | #musetech | 2841 |
Table 15.
Frequency of the top-20 most common bigrams within the tweets of the educational virtual reality dataset.
Table 15.
Frequency of the top-20 most common bigrams within the tweets of the educational virtual reality dataset.
| Bigram | Freq. | Bigram | Freq. |
|---|
| (virtual, reality) | 147,007 | (future, education) | 3943 |
| (vr, ar) | 26,161 | (learn, vr) | 3938 |
| (vr, virtualreality) | 18,003 | (history, museum) | 3931 |
| (vr, education) | 12,832 | (virtualreality, education) | 3863 |
| (reality, education) | 10,107 | (learning, edchat) | 3796 |
| (using, virtual) | 7436 | (changing, education) | 3721 |
| (augmented, reality) | 6013 | (reality, train) | 3619 |
| (education, edtech) | 4905 | (art, history) | 3617 |
| (education, art) | 4217 | (using, vr) | 3517 |
| (students, learn) | 4123 | (learn, virtual) | 3363 |
Table 16.
Frequency of the top-20 most common trigrams within the tweets of the educational virtual reality dataset.
Table 16.
Frequency of the top-20 most common trigrams within the tweets of the educational virtual reality dataset.
| Trigram | Freq. | Trigram | Freq. |
|---|
| (use, virtual, reality) | 12,558 | (augmented, virtual, reality) | 2906 |
| (virtual, reality, education) | 9222 | (virtual, reality, vr) | 2885 |
| (virtual, reality, train) | 3581 | (virtual, reality, apps) | 2768 |
| (education, art, history) | 3477 | (virtualreality, 3d, edtech) | 2722 |
| (art, history, museum) | 3470 | (virtual, reality, teach) | 2629 |
| (vr, virtualreality, 3d) | 3147 | (virtual, reality, could) | 2454 |
| (learn, virtual, reality) | 3106 | (virtual, reality, changing) | 2391 |
| (learning, edchat, edtechchat) | 3044 | (virtual, reality, headset) | 2289 |
| (edchat, edtechchat, elearning) | 3021 | (virtual, reality, field) | 2166 |
| (virtual, reality, technology) | 2930 | (way, students, learn) | 2128 |
Table 17.
Topics identified.
Table 17.
Topics identified.
| Topics | Related Words |
|---|
| Education | classroom, class, edtech, education, learning, elearning, mobile learning, educational, training, books, students, teaching, webinar, seminar, university, college, school, teacher, and study. |
| New technologies | artificial intelligence, machine learning, robotics, blockchain, innovative technologies, and emerging technologies. |
| Digital and social media use | youtube, twitter, facebook, instagram, snapchat, content, sharing, social media, video, music, movies, trailer, and ebooks. |
| Marketing and advertising | marketing, campaign, brand, advertisement, design, startup, information, business, trends, events, restaurants, entrepreneur, newsletter, sales, survey, market, and ecommerce. |
| Industrial domain | industrial transformation, workforce, maintenance, systems, innovation, manufacturing, industry, and fintech. |
| Health domain | medical, medicine, doctor, patients, health, healthcare, surgery, therapy, and anatomy. |
| Gaming | gaming, games, gamification, multiplayer, player, playing, cardboard games, digital games, virtual games, and indie games. |
| Fitness and exercising | physical activity, exercise, fit, fitness, train, training, trainer, sport, and active. |
| Devices | mobiles, glasses, oculus, hololense, gadgets, wearables, drones, headset, camera, phones, smartphones, desktop, and gopro. |
| Travel and tourism domain | Travel, tourist, etourism, tourism, location, and sights. |
| Software development kits | unity, arcore, and arkit. |
| Publisher’s Note: MDPI stays neutral with regard to jurisdictional claims in published maps and institutional affiliations. |
© 2022 by the authors. Licensee MDPI, Basel, Switzerland. This article is an open access article distributed under the terms and conditions of the Creative Commons Attribution (CC BY) license (https://creativecommons.org/licenses/by/4.0/).


 ,
, 


