Proceeding Paper

A Pore Classification System for the Detection of Additive Manufacturing Defects Combining Machine Learning and Numerical Image Analysis †

by
Sahar Mahdie Klim Al-Zaidawi
1,2,* and
Stefan Bosse
2
1
Leibniz-Institute for Materials Engineering-IWT, Badgasteiner Str. 3, 28359 Bremen, Germany
2
Department of Mathematics and Computer Science, University of Bremen, Bibliothekstr. 5, 28359 Bremen, Germany
*
Author to whom correspondence should be addressed.
Presented at the 10th International Electronic Conference on Sensors and Applications (ECSA-10), 15–30 November 2023; Available online: https://ecsa-10.sciforum.net/.
Eng. Proc. 2023, 58(1), 122; https://doi.org/10.3390/ecsa-10-16024
Published: 15 November 2023

Abstract

:
This study aims to enhance additive manufacturing (AM) quality control. AM builds 3D objects layer by layer, potentially causing defects. High-resolution micrograph data capture internal material defects, e.g., pores, which are vital for evaluating material properties, but image acquisition and analysis are time-consuming. This study introduces a hybrid machine learning (ML) approach that combines model-based image processing and data-driven supervised ML to detect and classify different pore types in AM micrograph data. Pixel-based features are extracted using, e.g., Sobel and Gaussian filters on the input micrograph image. Standard image processing algorithms detect pore defects, generating labels based on different features, e.g., area, convexity, aspect ratio, and circularity, and providing an automated feature labeling for training. This approach achieves sufficient accuracy by training a Random Forest as a hybrid-model data-driven classifier, compared with a pure data-driven model such as a CNN.

1. Introduction

1.1. General Motivation

Medical implants have transformed healthcare, yet their production presents significant challenges. Additively manufactured Ti6Al4V implants can develop porosity, influencing their mechanical properties, particularly under dynamic loads. Understanding the relationship between manufacturing parameters and implant quality, especially post-HIP treatment, is crucial. Laser powder bed fusion (LPBF) is an additive manufacturing technique that constructs intricate components with complex shapes layer-by-layer [1]. This technique involves the application of a fine powder layer using a thin blade, followed by localized melting using a laser. These steps are iteratively performed until the components reach their desired final height [2]. A component’s mechanical characteristics, similar to powder metallurgy, depend on factors like relative density and defect shapes [3], which are influenced by several variables such as laser power, scanning speed, and particle properties [4]. These factors can lead to defects like cracks and porosity, which are linked to the applied energy density [5]. This research aims to study critical defects in additively manufactured medical implants, offering supervised machine learning methods for feature extraction of metallurgical micrographs to detect and classify different defects. To detect defects, different model- and data-driven approaches are investigated. The major advantage of a model-driven over a pure data-driven approach is the ability to be explained and tractability of the model, i.e., a correlation between classification output and geometric features that are amplified by the selected filter operators.

1.2. Related Work

In our investigation of common pore types in additive manufacturing, we have identified several distinct categories. Keyhole pores [6,7], characterized by vapor bubbles trapped in the melt pool during printing and the potential for merge process pores, exhibit dimensions ranging from microscopic to millimeters, featuring keyhole-like voids and channeling. These defects result in reduced mechanical strength, diminished fatigue resistance, and heightened susceptibility to crack initiation. Gas pores [8], closely related to keyhole pores but with slight shape differences (a gas pore is a circular keyhole), share the same vapor bubble characteristics and similar size dimensions. They display an irregular distribution and spherical shapes, contributing to decreased fatigue life, lowered mechanical strength, and compromised surface finish. Lake of Fusion (LOF) pores [8,9], attributed to insufficiently melted material, can vary in size up to millimeters, presenting interlayer gaps and unfused regions that serve as starting points for cracks under stress. Unmelted Particle Pores [8,10,11], a subset of LOF pores, are characterized by the inclusion of unmelted powder within the pore, sharing similar dimensions and geometric features and similarly contributing to crack initiation and growth. Process pores [9], identified by a low packing density of powder, hollow particles, and entrapped inert gas, are typically microscopic to less than 100 μm in size, with an irregular distribution and spherical shapes of a minimal area, exerting a relatively minor impact on material properties. Finally, cracks [3], ranging from microscopic to millimeter dimensions and featuring a large aspect ratio, pose the most significant risk for initiating mechanical failures within the additive manufacturing process, often arising from the presence of other pore types or inherent defects. A detailed summary of these pore types is available in Table A1 in Appendix A for reference.
Most of the work in the classification of defects in additive manufacturing using supervised machine learning focuses on categorizing defects in images. For instance, Mika [9] utilized a Random Forest Tree model to examine the occurrence of pores in binary micrograph images, achieving a classification accuracy of around 95% for keyhole, lack of fusion, and process pores.
Another approach by Zhang et al. [12] involved the use of Support Vector Machines (SVMs) for defect detection in Ti-6Al-4 V additive manufacturing. It involved extracting geometric features from thermal images, resulting in an accuracy of 90.1% for distinguishing porous and non-porous defects. In contrast, Convolutional Neural Networks (CNNs) excelled in handling image-based defect detection problems. Scime et al. [13] applied multi-scale CNNs for in situ defect detection, achieving high accuracy in anomaly detection and differentiation (97%, 85%, and 93%, respectively).
While these models perform well with larger datasets, the challenge of limited data and their annotation (labeling without ground truth) has led to the adoption of semantic segmentation. Semantic segmentation assigns human-interpretable classes to each pixel in an image. Recent research addressed the binary pixel segmentation of additive manufacturing defects in X-ray Computed Tomography (XCT) 3D images. To address issues such as poor contrast, small defect sizes, and appearance variations, a 3D U-Net model was proposed. When applied to an AM dataset, this model achieved a mean Intersection over Union (IOU) value of 88.4% [14].

1.3. Contribution of Our Research

In this study, we employ semantic segmentation techniques with reduced training data due to the time-intensive nature of data generation. We introduce a model-driven data-driven approach utilizing a Random Forest (RF) classifier, a supervised machine learning method, for efficient pore classification, which is particularly effective with limited training data. Comparative analysis reveals that conventional purely data-driven models like Convolutional Neural Networks (CNNs) underperform in contrast to our model-driven data-driven model. Our model is primarily designed to predict four distinct pixel classes: background (class 0, trivial class), lack of fusion (LOF) (class 1), gas keyhole pores (class 2), and process pores (class 3).
The next sections proceed with an overview of the used materials and methods, subdivided into subsections describing the dataset, preprocessing, and machine learning classifiers, including Random Forest (RF) and Convolutional Neural Network (CNN). The performance metrics used are also explained. The “Experimental Design” section details the research methodology. “Results and Discussion” presents the experimental outcomes, comparing classifier performance and discussing findings. Finally, the “Conclusion and Future Work” section will summarize our preliminary results and key findings.

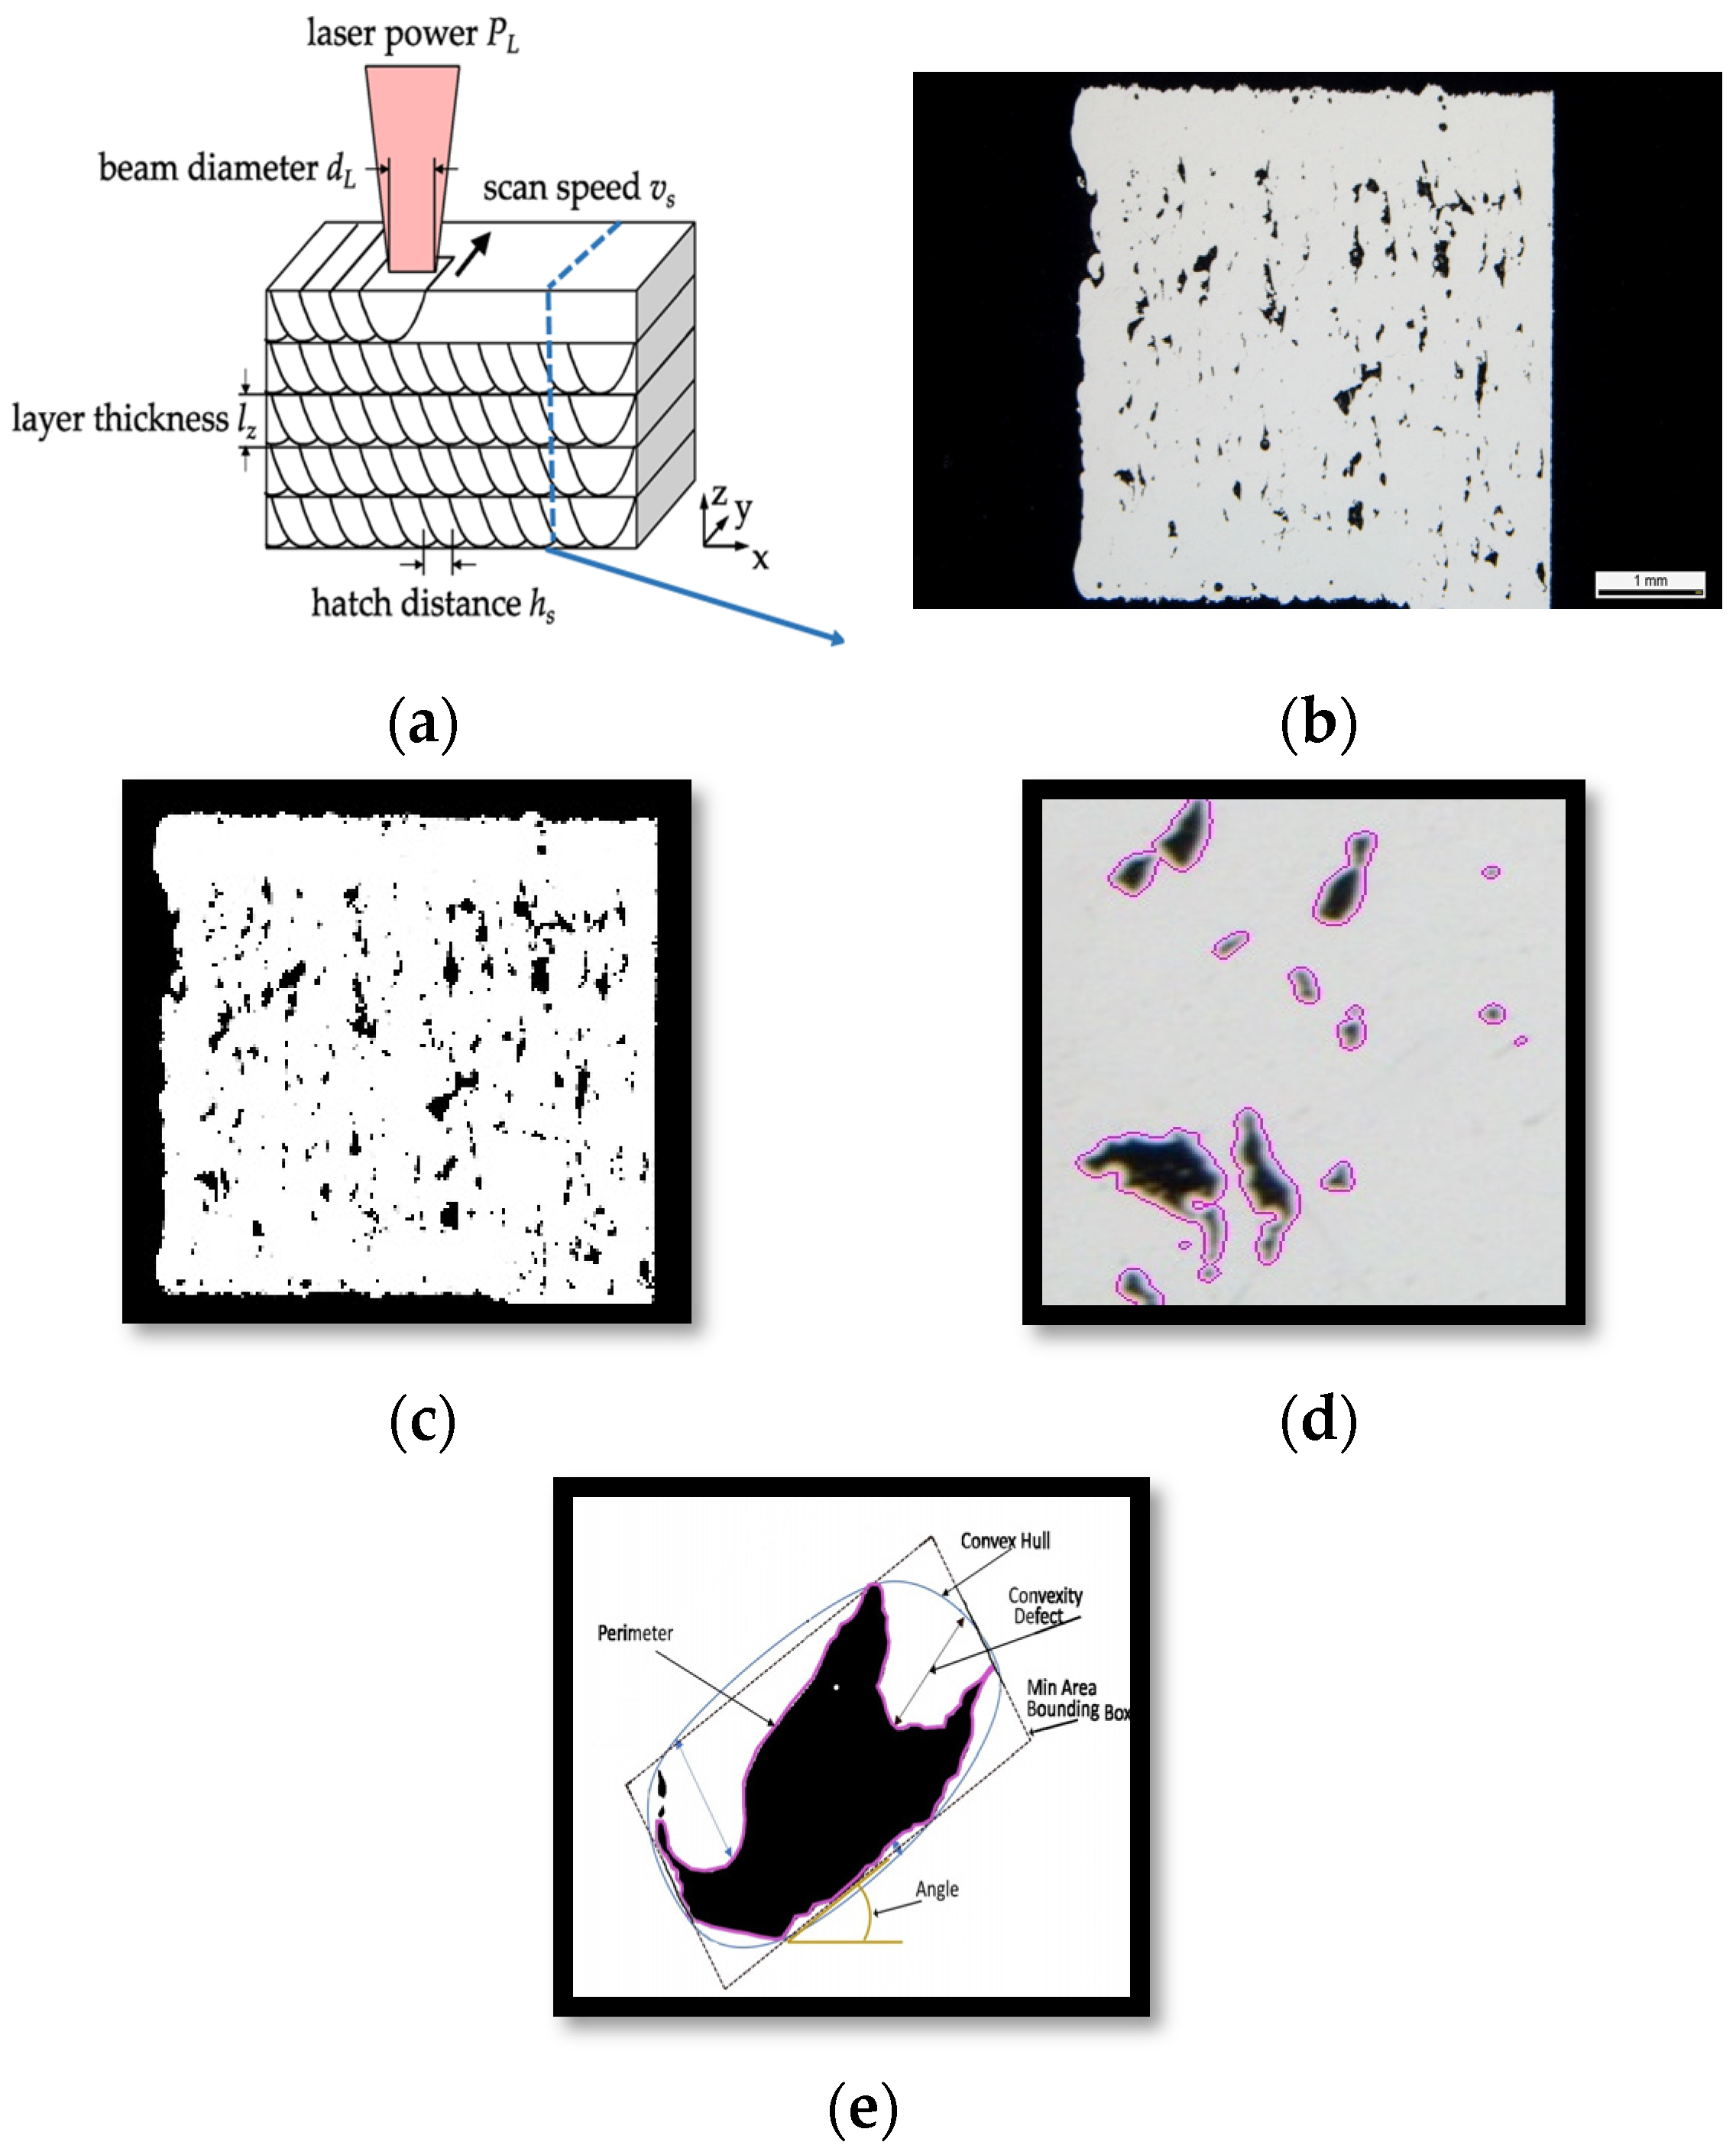
2. Materials and Methods
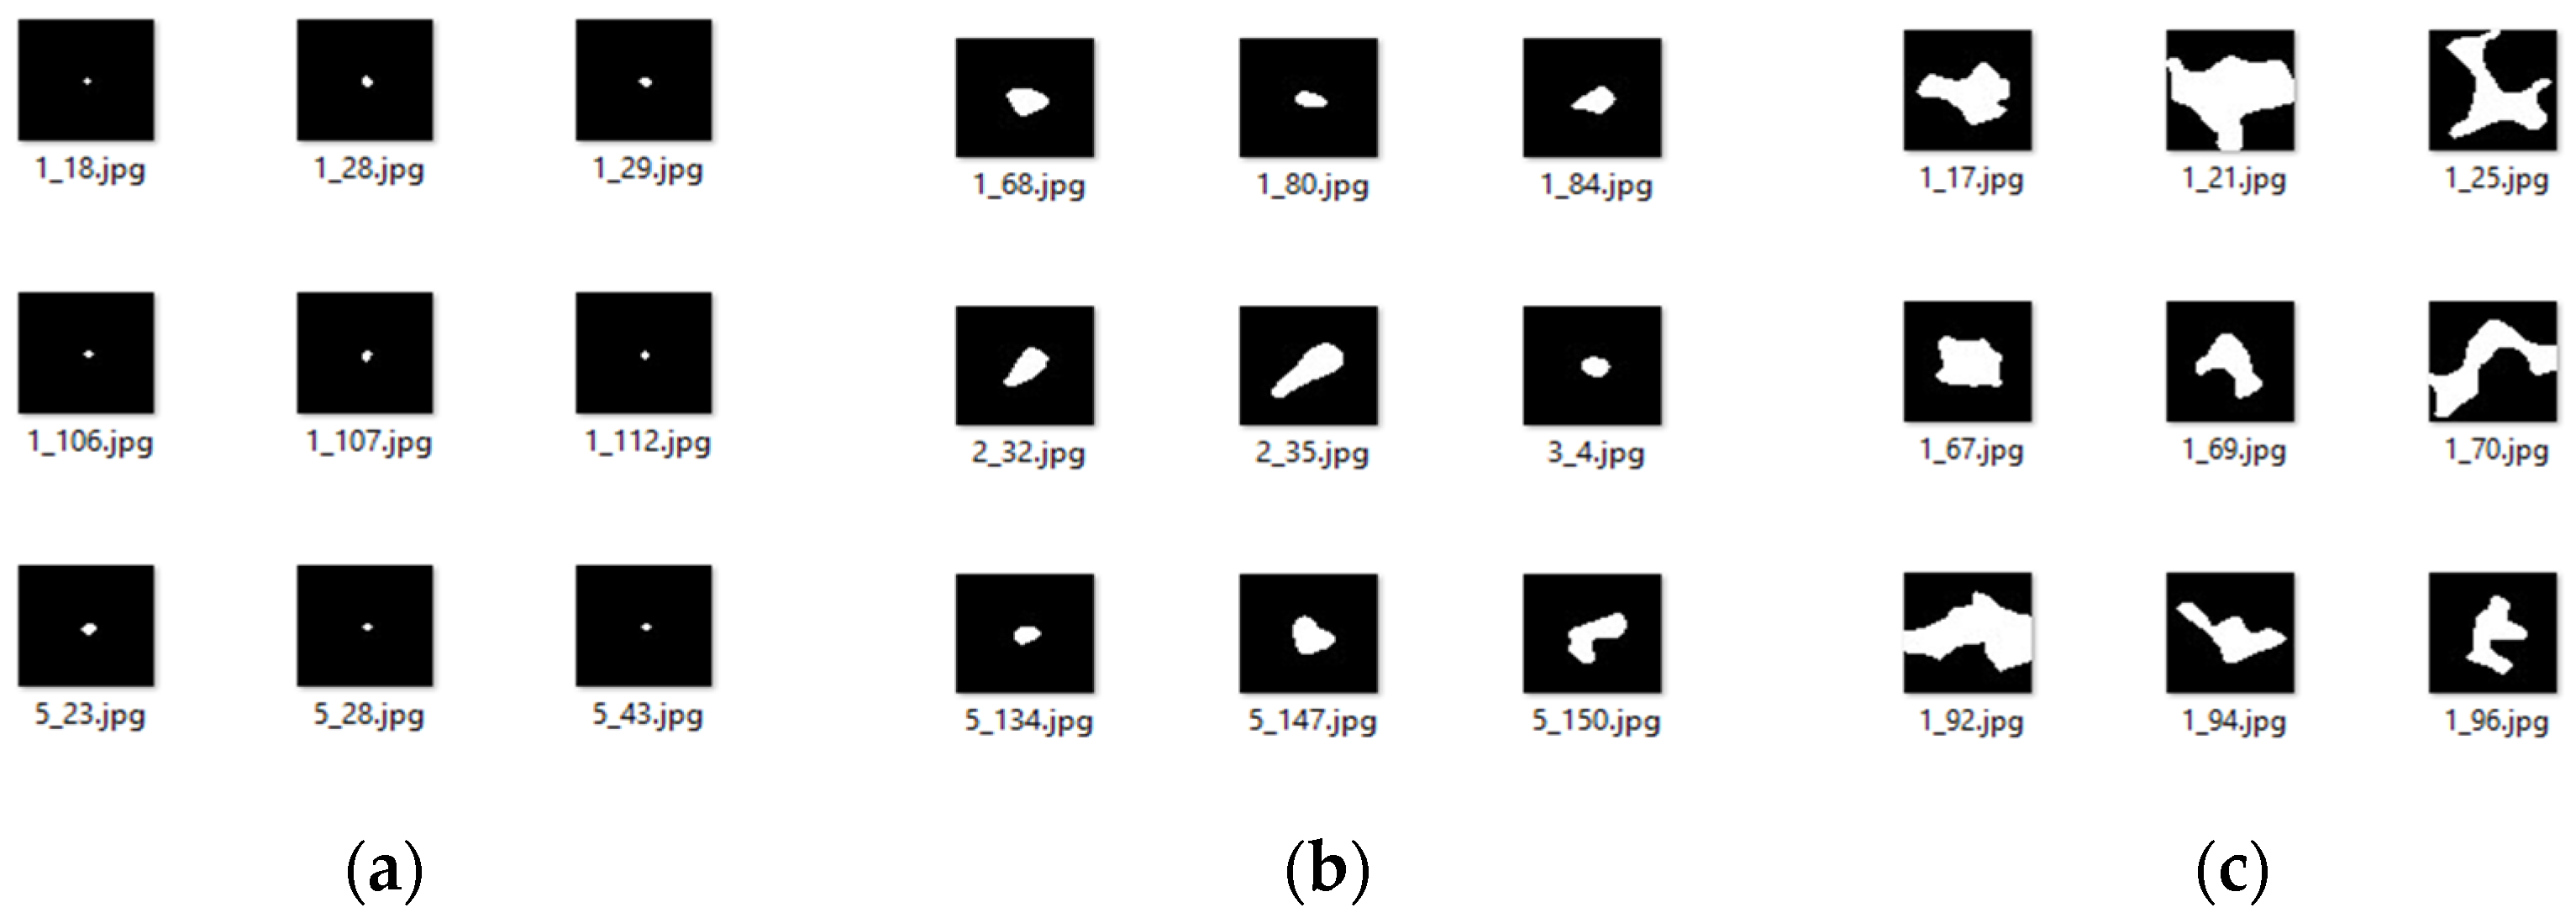
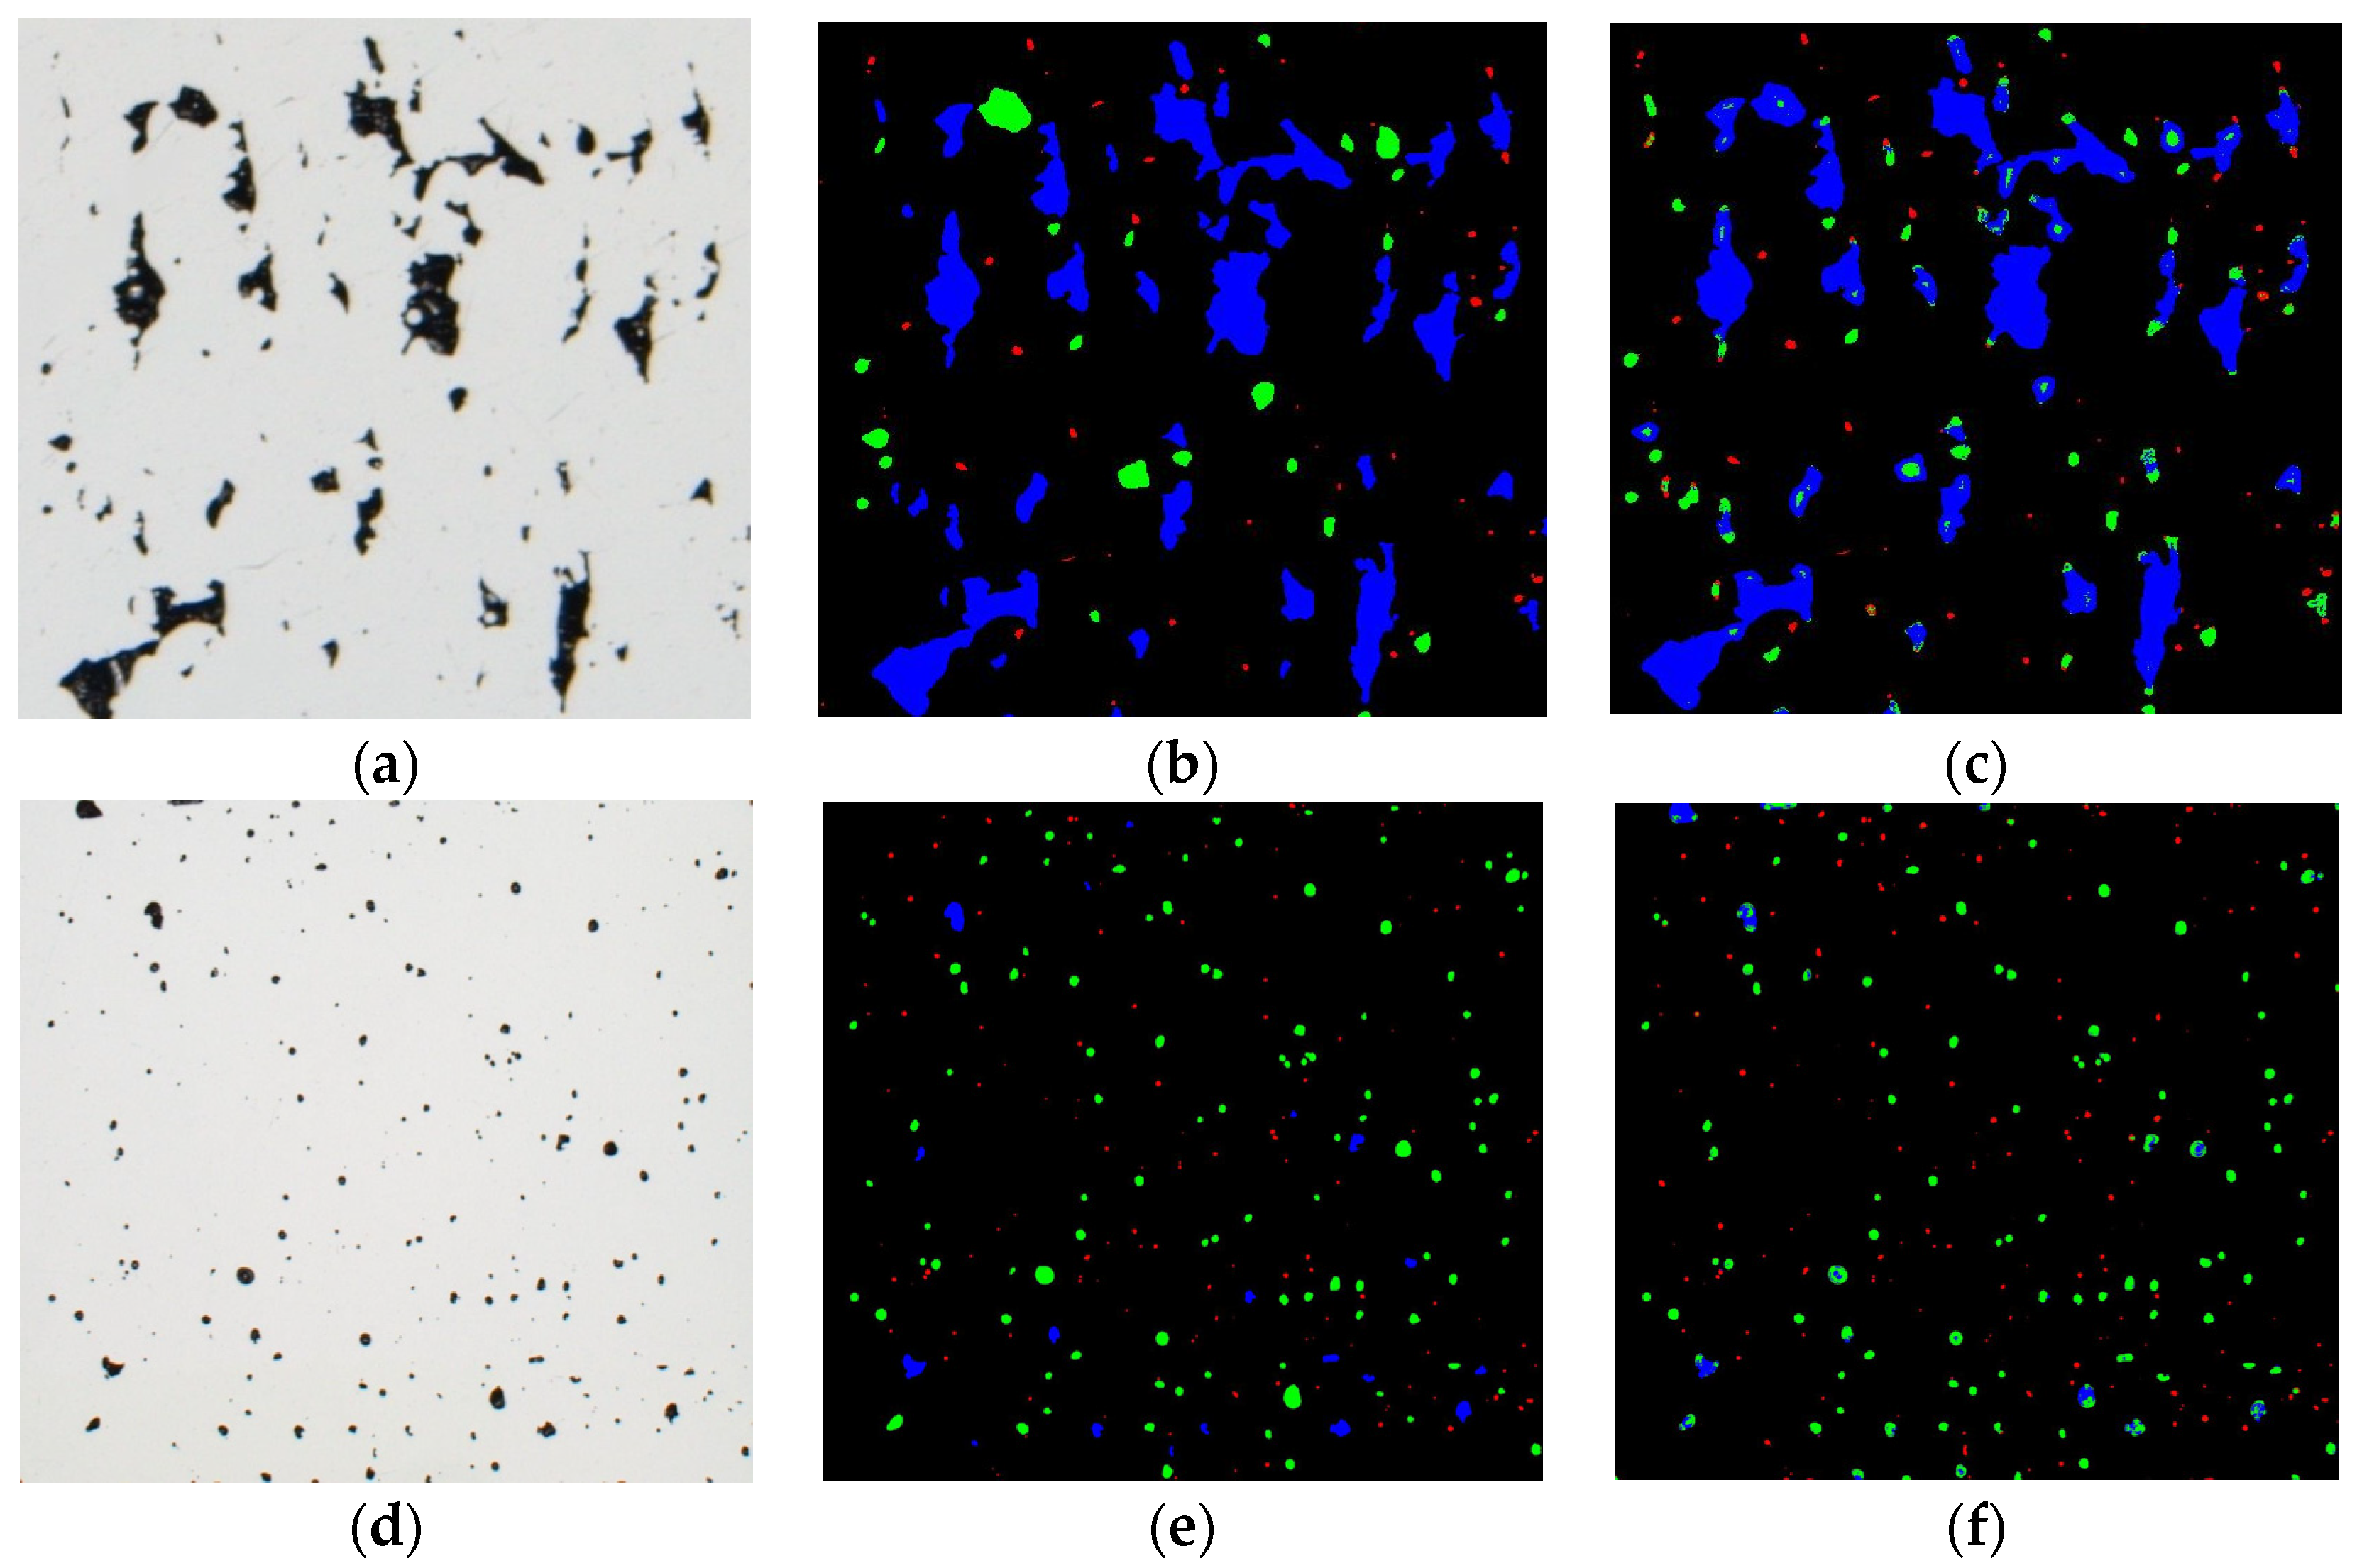
2.1. Dataset

To facilitate both unsupervised and supervised defect classification modeling, a dedicated data pipeline and database were established for our study. The dataset encompasses diverse manufacturing process parameters for Ti6Al4V, including laser power, layer thickness, hatch distance, and scan speed. The dataset comprises 400 distinct process parameter combinations, printed in Ti6Al4V on an SLM 125 HL (SLM Solutions GmbH, Lübeck, Germany). Specifically, the laser power, scan speed, hatch distance, and layer thickness were systematically varied. Laser power ranged randomly from 152 W to 350 W, scan speed varied randomly between 803 mm/s and 1599 mm/s, and hatch distance was randomly adjusted between 0.07 mm and 0.15 mm. Layer thicknesses were selected in increments of 0.025 mm, encompassing 0.05 mm, 0.075 mm, and 0.1 mm. In the manufacturing process, the parameter combinations were randomly positioned on the build platform. Three process parameter combinations were consistently produced in close proximity to each other, utilizing the skip layer function to enable the construction of all four layer thicknesses in a single process. To minimize heat transfer effects between combined parameter combinations, a small gap was maintained between the three sections, with minimal contact at the bottom. Following the printing process, specimens underwent embedding, grinding, and polishing, culminating in microscopic imaging.
We also created a new dataset of human annotated pores, so we cut the images of different pore types to obtain (see Figure 1) a bunch of images that show three types of pores with a total of 200 pores for each pore type. This dataset was used for statistical computations of the pore characteristics.

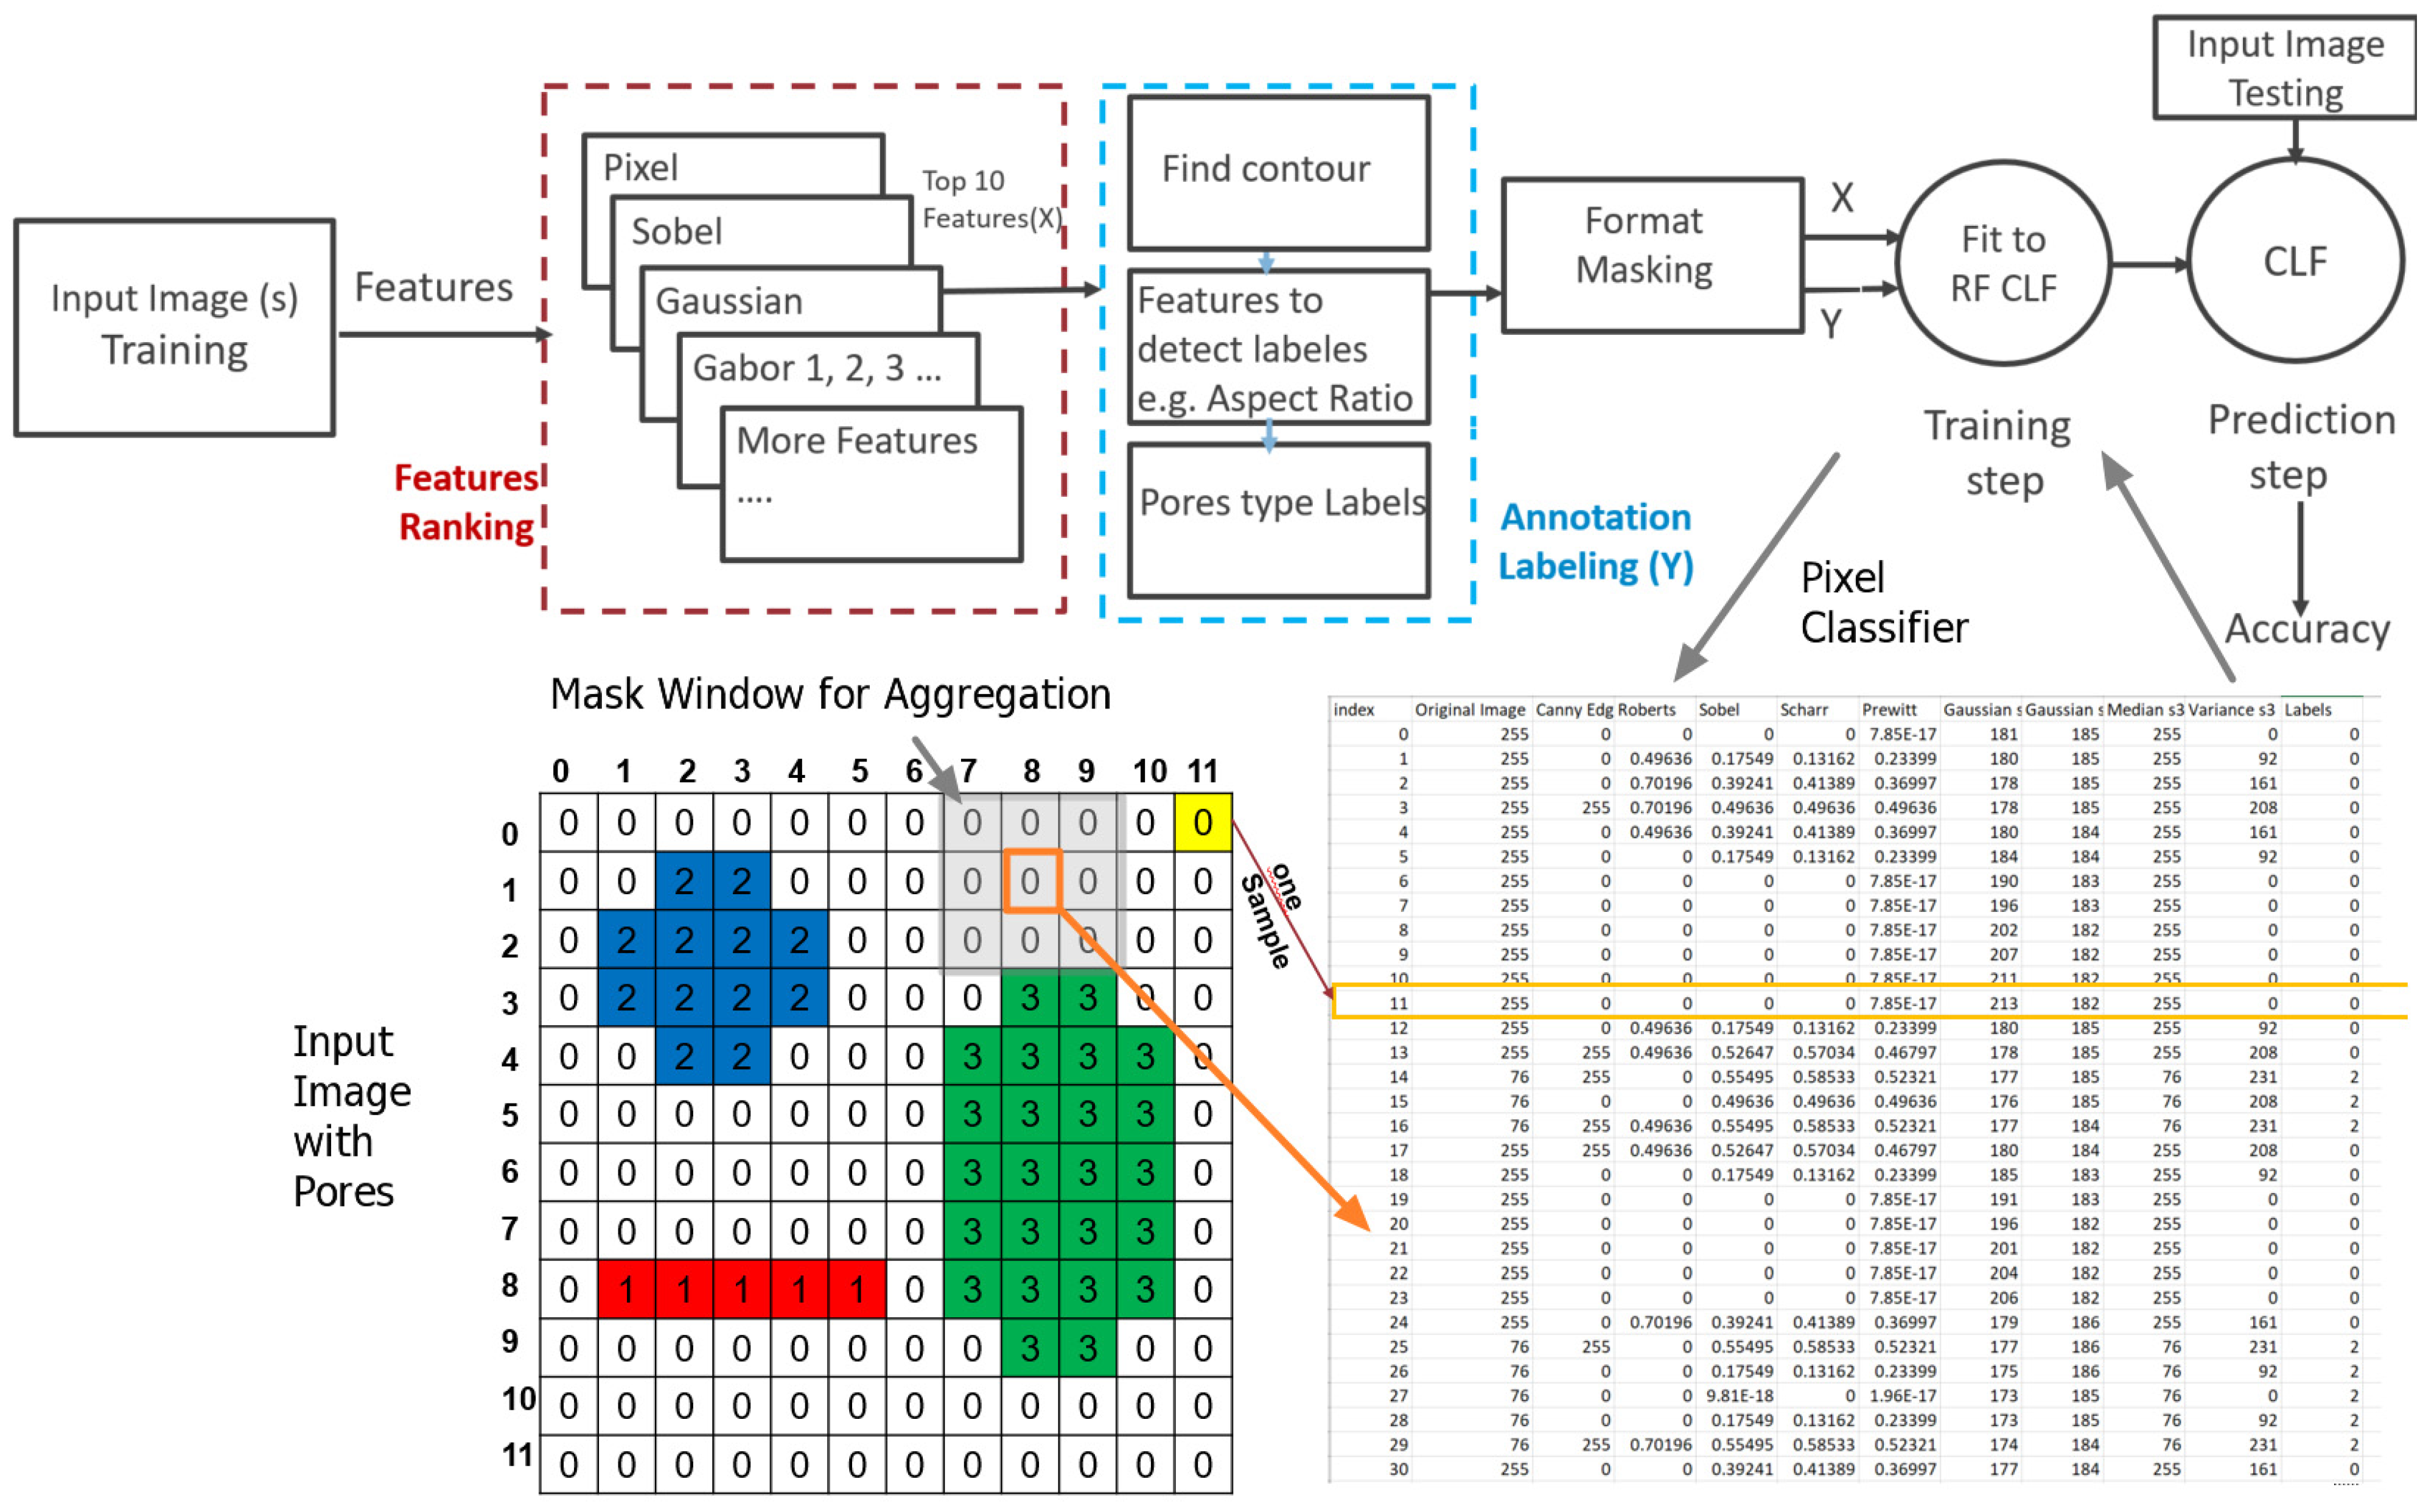
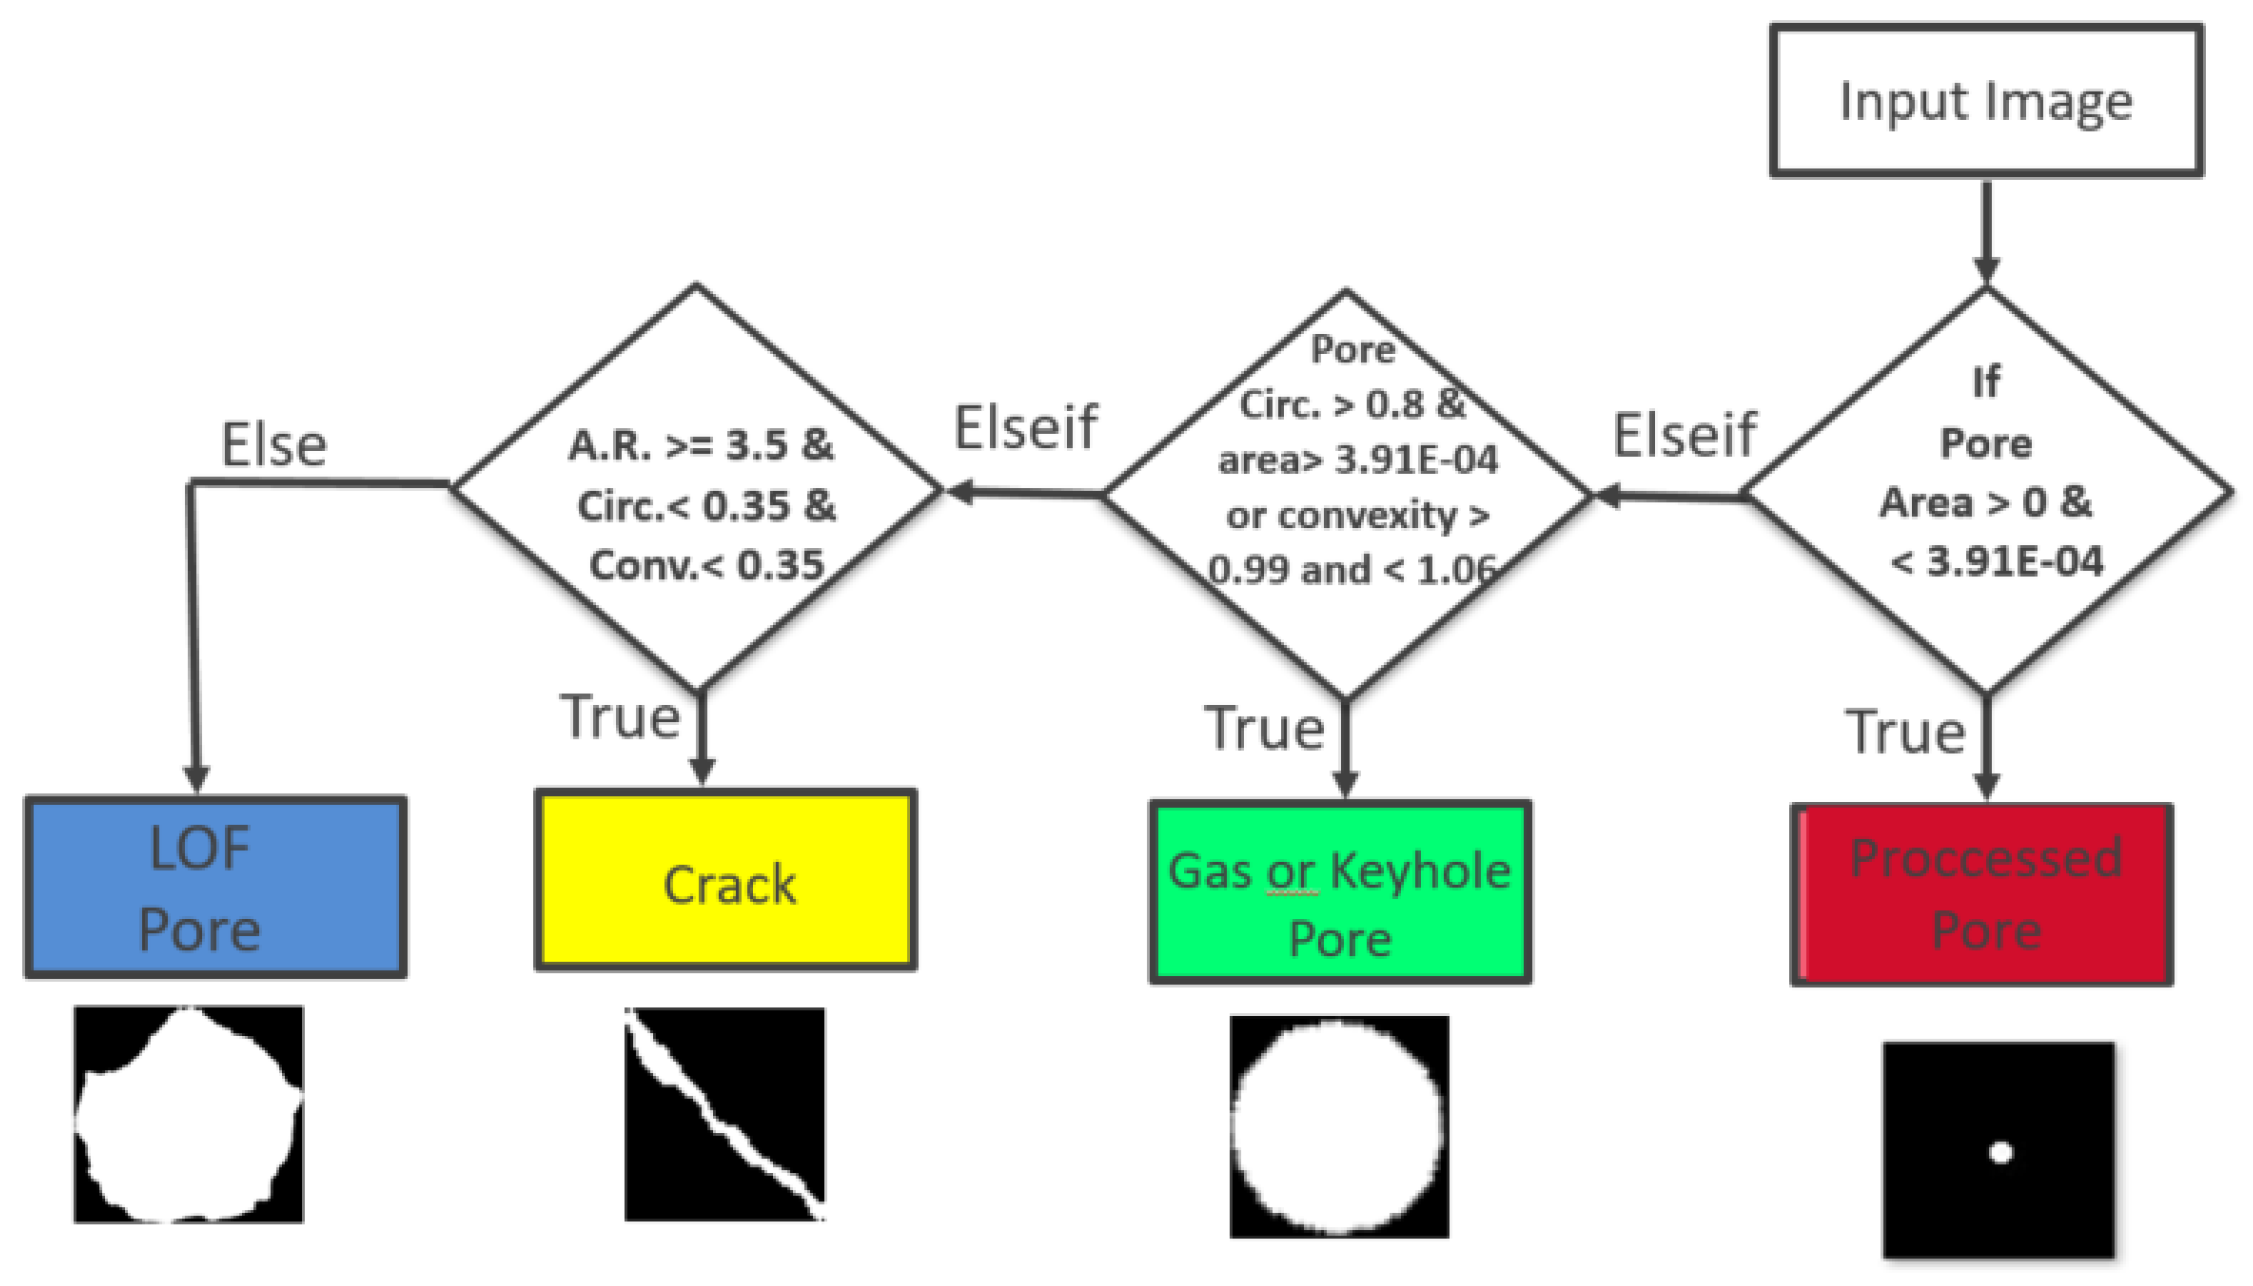
2.2. Preprocessing and Feature Extraction

The initial data preparation involved vertically slicing specimens to create micrograph image scanning (see Figure 2a,b). Within these micrograph images, discernible porosity defects resulting from the manufacturing process were observed. To analyze various pore types, we initially converted the color images to grayscale, unifying image intensity within a single channel and thus streamlining subsequent image processing and analysis. Subsequently, binary thresholding and post-cropping were applied using the OpenCV library [15] (see Figure 2c). Following this, we employed the same image processing approach to identify pore contours, utilizing an iterative bounding box method based on the algorithm detailed by Satoshi Suzuki and others in [16] (see Figure 2d). These identified pore contours allowed for the extraction of local features, such as pore area, position, and angle, as well as shape descriptors like solidity, circularity, and convexity (see Figure 2e).

2.3. Machine Learning Classifiers

ML algorithms that are applied to images commonly perform two tasks: (1) region of interest prediction and geometric feature and contour approximation and (2) classification of ROI areas or the entire image. ML algorithms are typically purely data-driven, requiring a solid database, which in engineering is mostly based on measurements and experiments. In our work, we try to combine data-driven with model-based approaches and to use primarily models with low complexity.

2.3.1. Random Forest Classifier (RF)

The Random Forest (RF) algorithm is a powerful and widely used classification supervised machine learning method [17,18]. RF builds multiple decision trees, combining them as weak classifiers using “bagging” [19]. The RF classifier creates several decision trees, which are combined to improve the outcomes. It uses majority-voting technique to decide the final outcome from the various decision trees. In a Random Forest model, each decision tree relies on values from a randomly selected vector with the same distribution [17]. This classifier has many parameters, e.g., maximum features, n-estimators, minimum samples split, minimum samples leaf, and maximum depth. Most of the parameters were the default algorithmic and model parameters using the scikit-learn software package [20]. Only one selectable parameter was optimized by grid search, which is the number of trees (we used n-estimators = 100). The RF is used in this work as mapping algorithm that maps geometric model-based precomputed latent features on classification features (pore classes). The input feature vectors of the RF model are aggregate variables derived from the micrograph input image. The kernel-based aggregating filter operators can be freely chosen, e.g., mean, Gaussian blurring, or Sobel filters. A broad set of filters were applied, and the best were selected by feature ranking, mainly edge and shape boundary amplifying detectors.

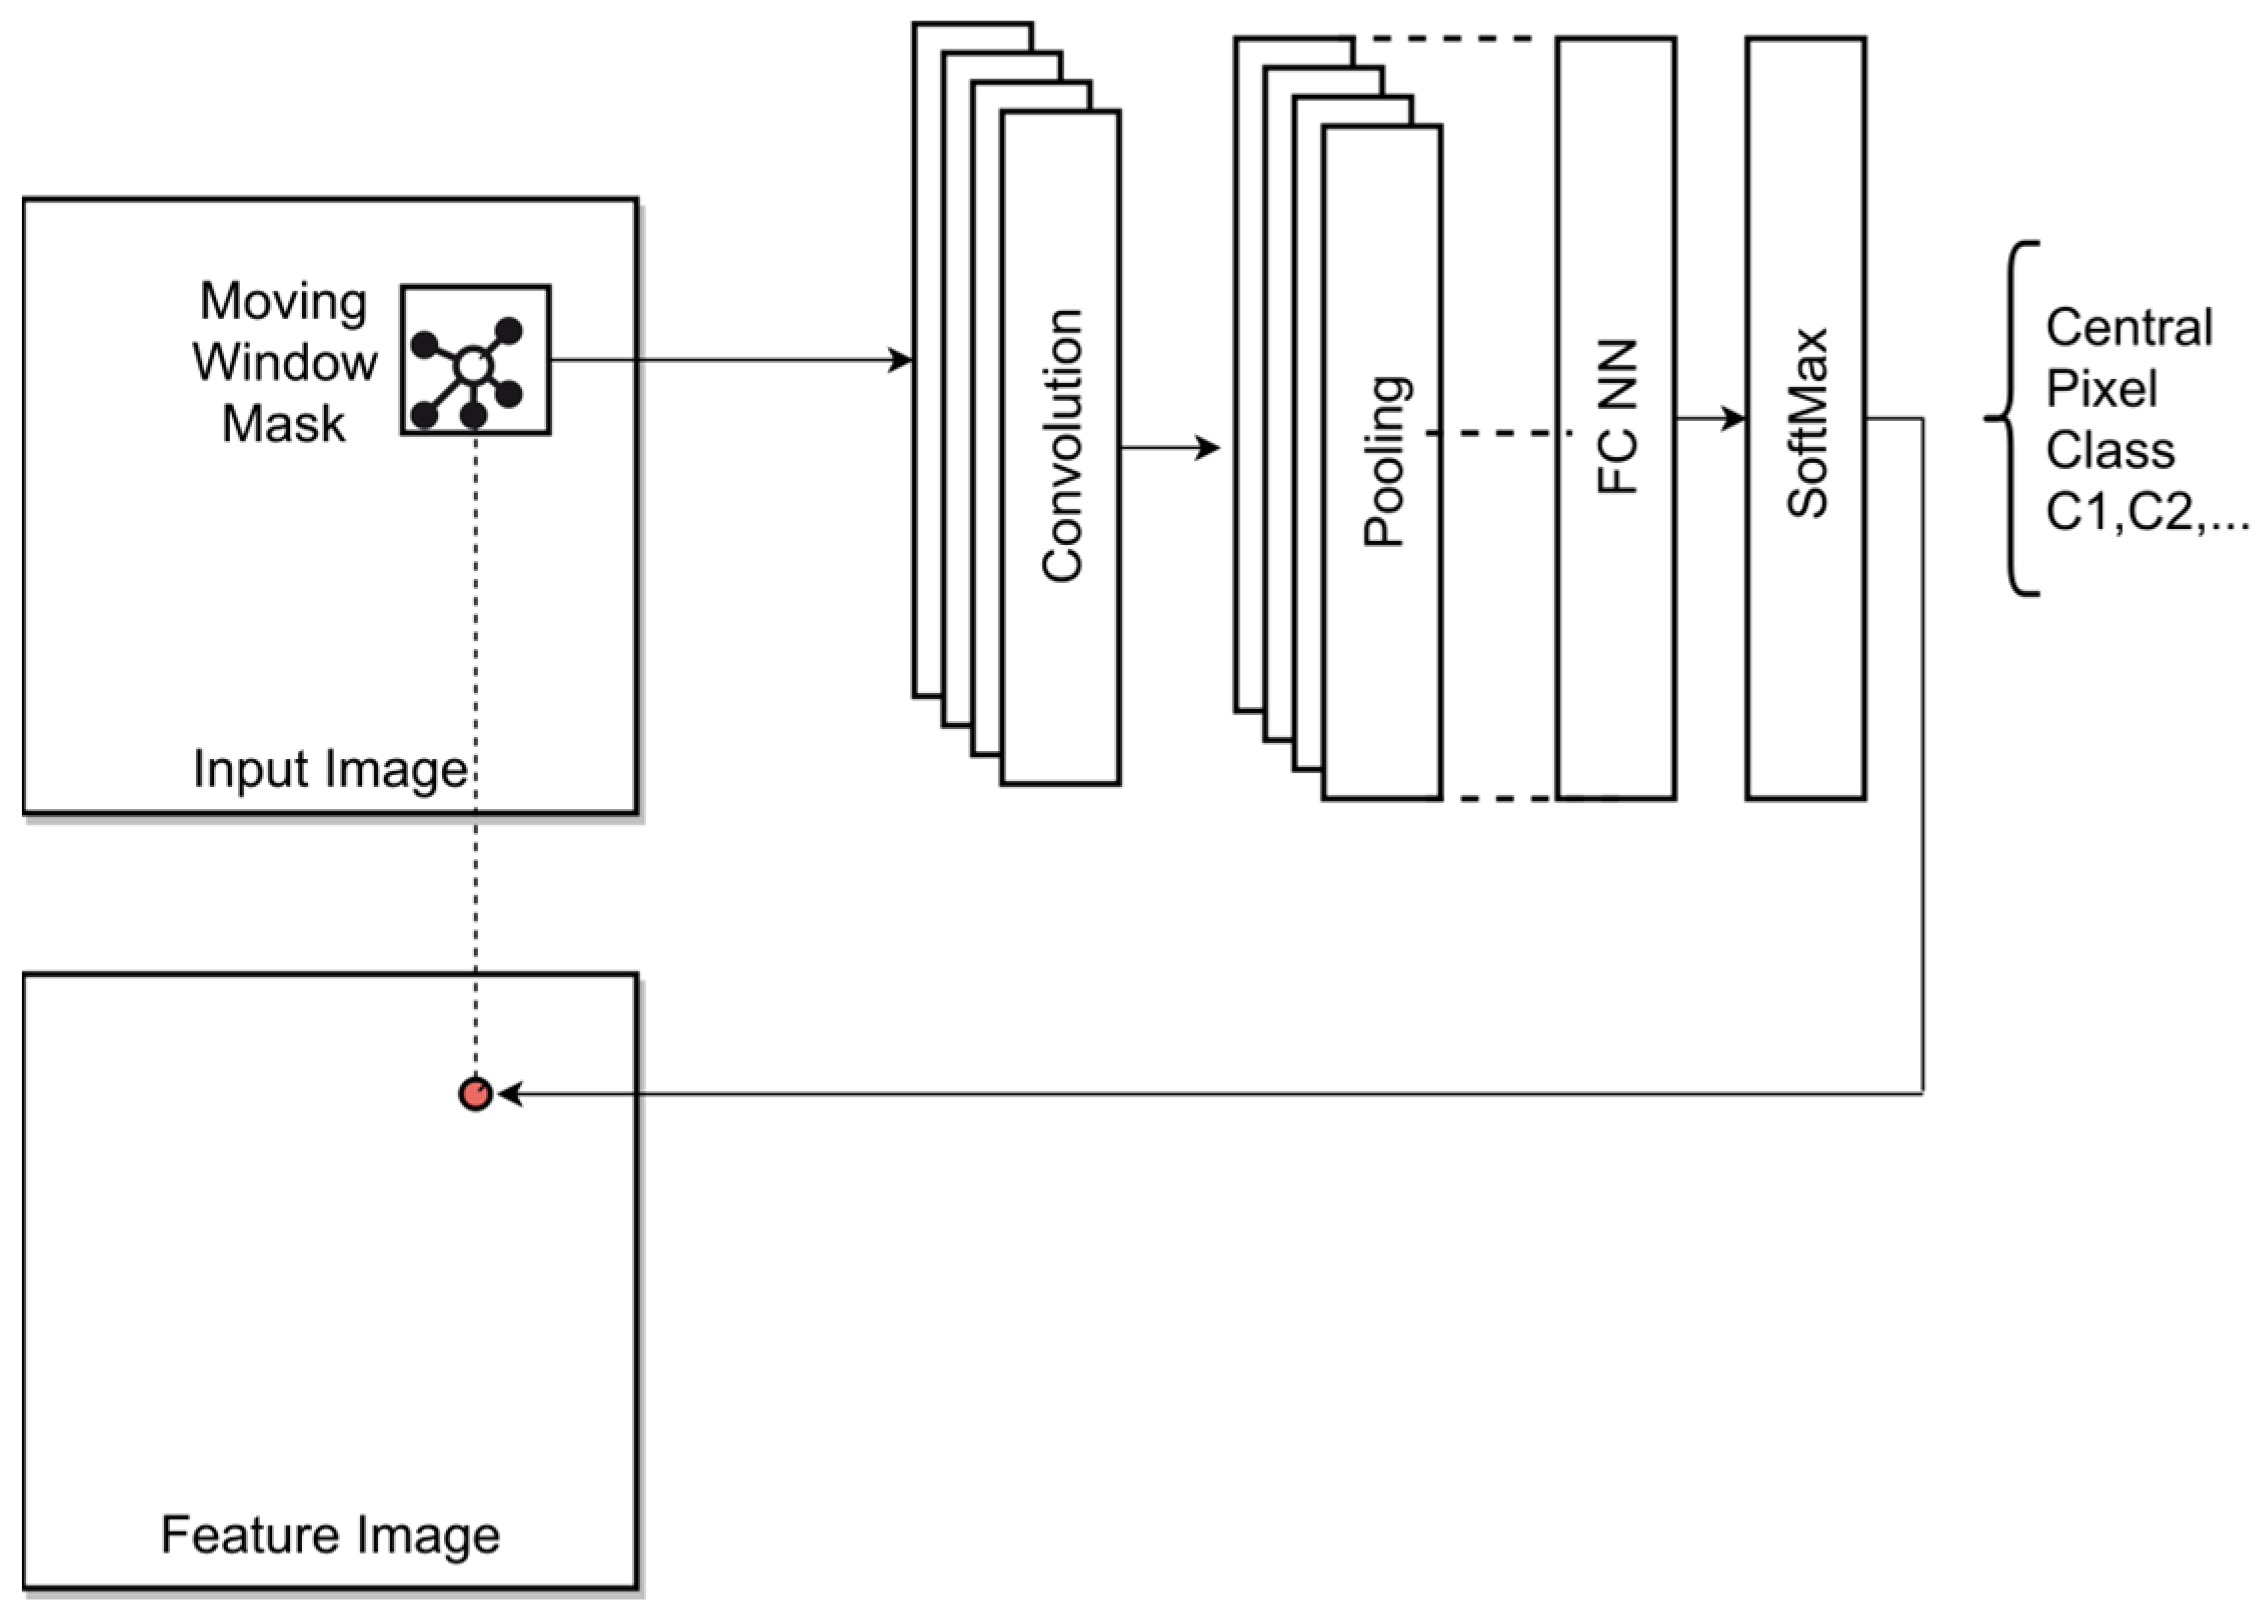
2.3.2. Semantic Pixel Classifier

A pixel classifier is applied to sub-images (mask window) of an image to predict the class of the central pixel of the current mask window, as illustrated in Figure 3. A variant is a segment classifier. The input image is segmented, and the classifier is applied to each segment annotating the entire segment (not suitable for pore annotation). If the window mask is moved over all pixels of the input image, an annotated semantic class feature map output image can be created. The pixel classifier can be implemented by the aforementioned RF or CNN models, introduced in the next sub-section. Semantic pixel classifiers, e.g., based on CNN architectures, were already successfully deployed for image feature segmentation, e.g., for defect detection in X-ray images [21,22].

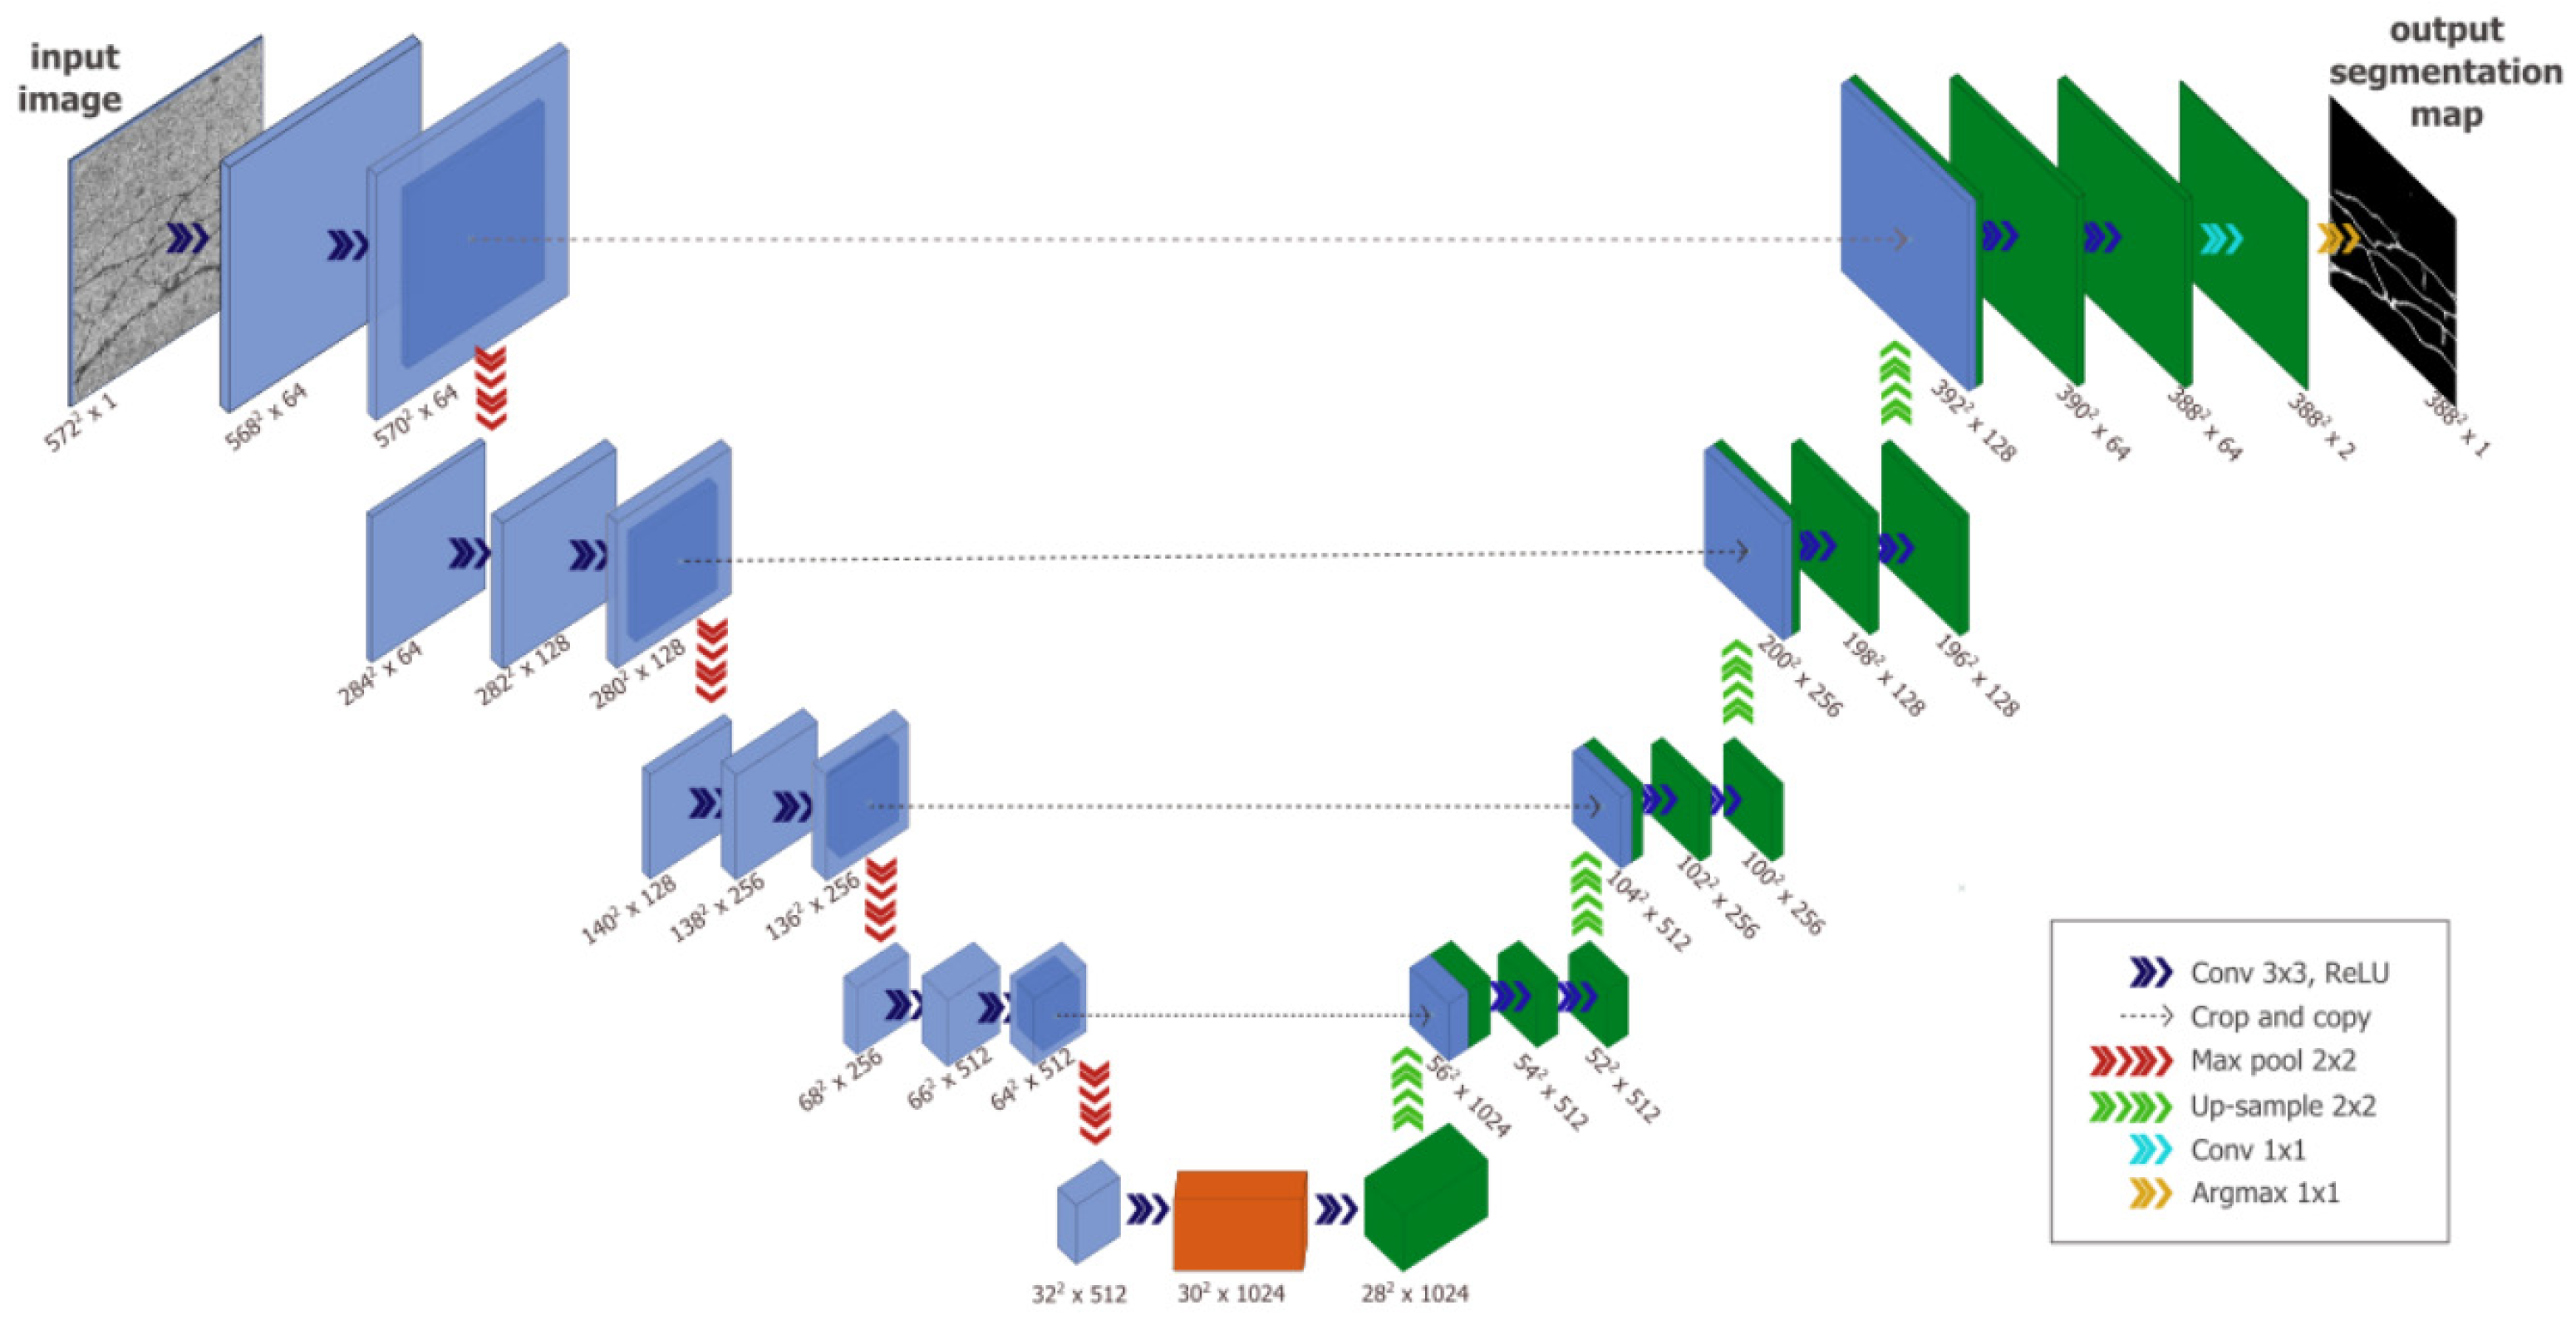
2.3.3. Convolutional Neural Network (CNN) and U-Shaped Neural Network (U-Net)

Convolutional Neural Networks (CNNs) [23] are widely used models that are deployed in image recognition and feature extraction tasks. CNNs are used for tasks like image classification and object detection. They operate by making predictions at both the image and object levels, focusing on tasks such as assigning labels or bounding boxes to entire images or objects within them.
U-Net, a multi-level and complex CNN architecture with automated embedded or separated ROI proposal algorithms that is often used for automated image segmentation and ROI searches, particularly in medical analysis, features a U-shaped design, with encoding and decoding paths connected via a central bottleneck (based on auto encoder principles). It excels at capturing fine-grained spatial information in images and has proven effective in tasks such as medical image segmentation. Designed by Ronneberger and colleagues in 2015, U-Net specializes in image segmentation, classifying each pixel. It is tailored for scenarios with limited training data and avoids substantial resolution reduction. Importantly, U-Net and similar architectures tackle a significant computer vision challenge by delivering better performance with smaller training datasets. However, if the model complexity increases, the required training data instance volume and their variance must be increased significantly to achieve suitable generalized and robust predictive models. This extended and large database is not available in this work. This capability is especially valuable in scenarios where amassing extensive labeled data is impractical [24]
Hyper-parameters that are tunable in both CNNs and U-Net encompass learning rate, batch size, layer count, filter size, activation functions, pooling size, and loss function, influencing network performance and training progress.

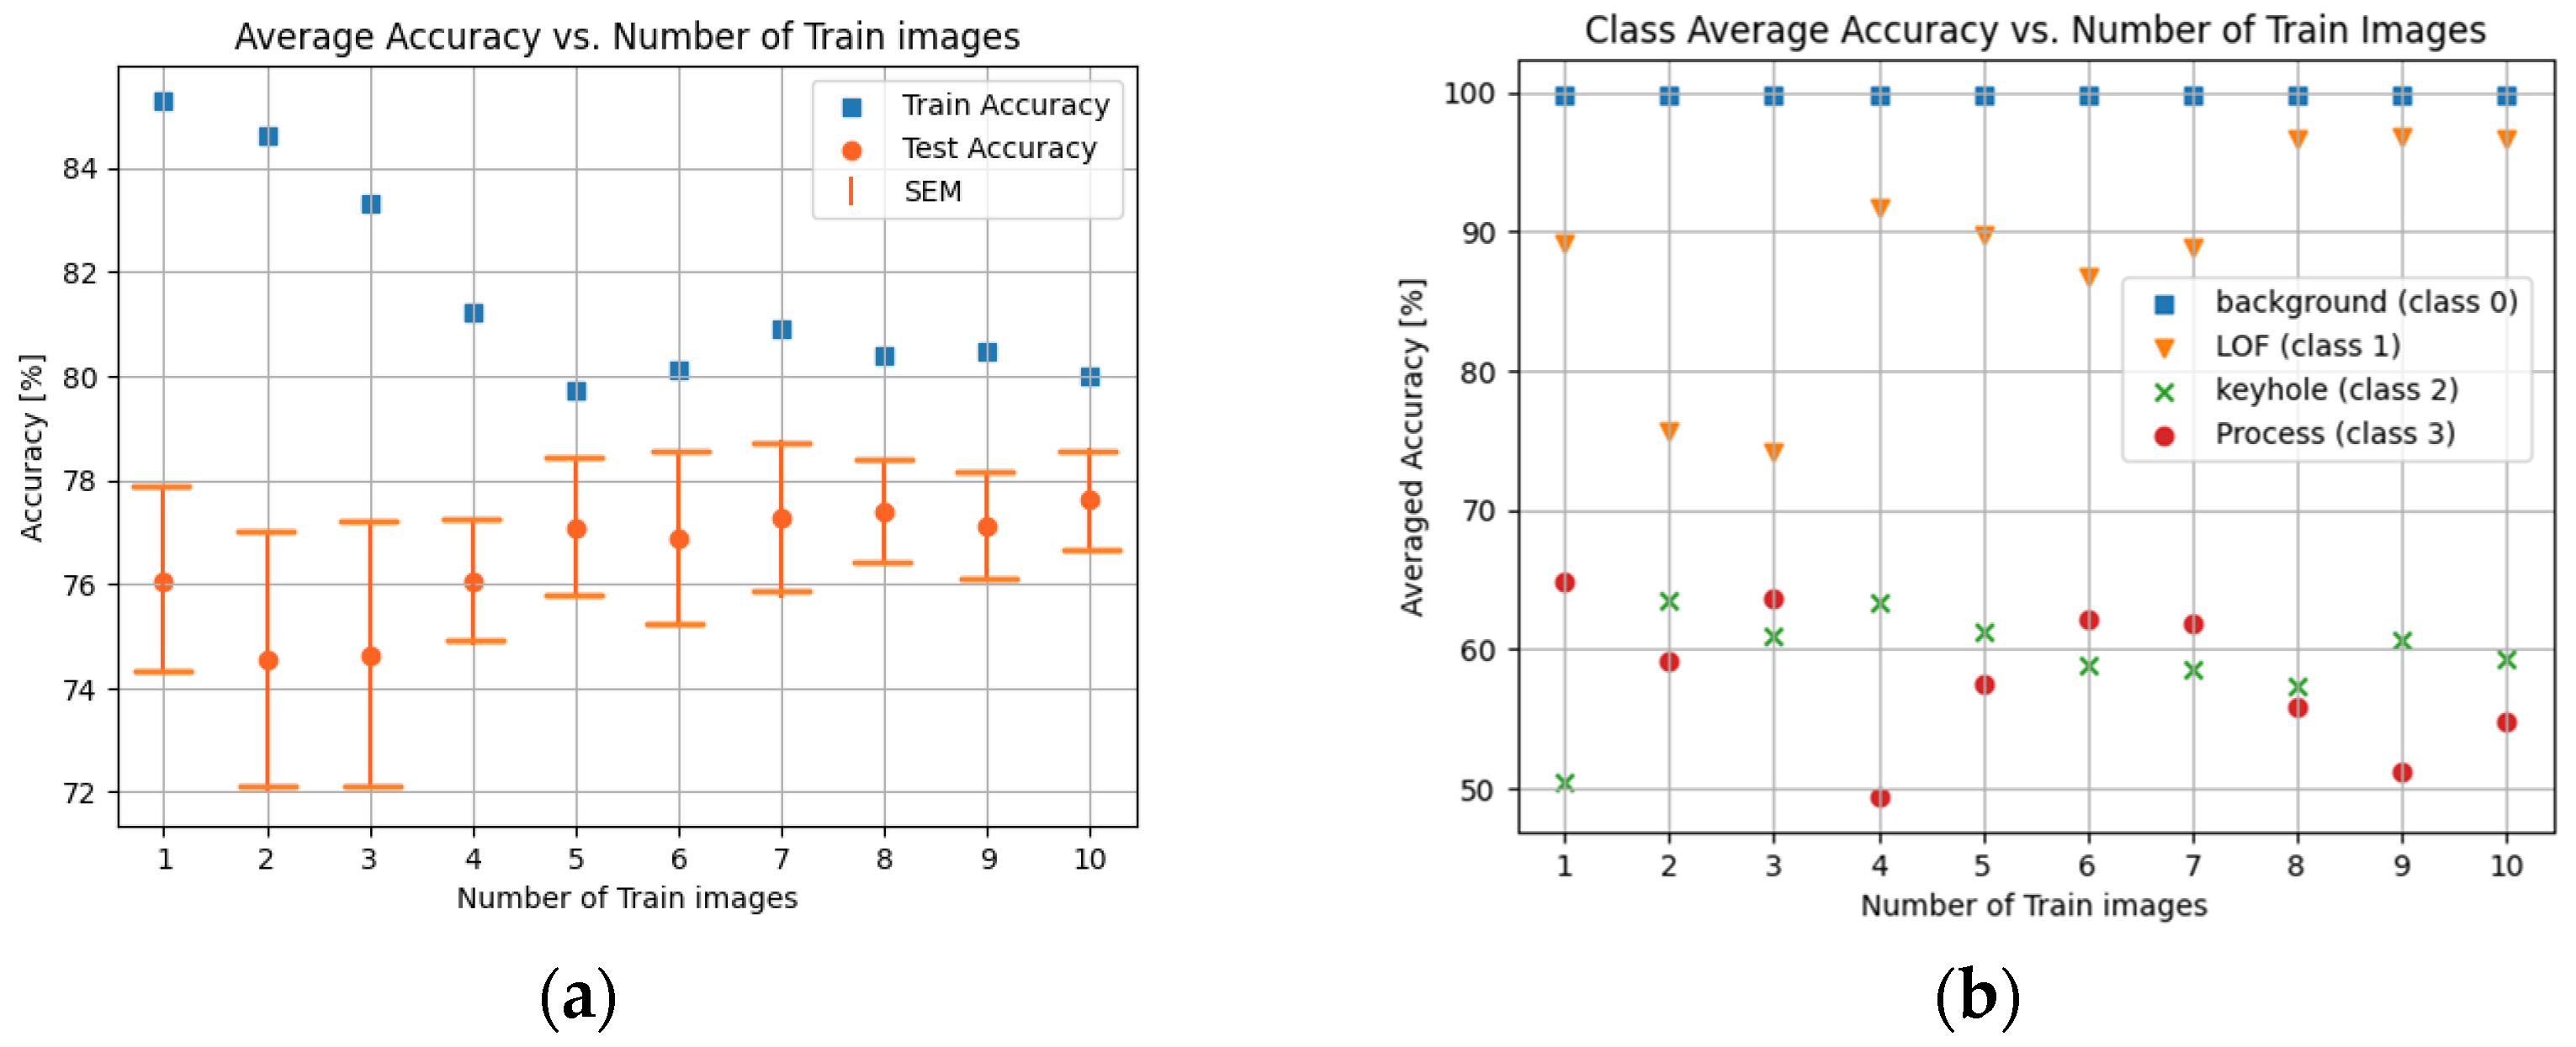
2.4. Performance Metrics

Metrics are used for the assessment of the machine learning model’s performance throughout training and testing. The model assessment metrics considered in this work are as follows [25]:
Accuracy quantifies the model’s performance by dividing correct predictions by total predictions, averaged either for all classes or for individual classes (1-error). The standard error of the mean (SEM) measures how the sample mean differs from the actual population mean. σμ = σ/√k, where σ is the standard deviation of the results and k the number of runs. Precision (Positive Predictive Value) gauges the classifier’s bias toward false positives. Recall (sensitivity) indicates the classifier’s bias toward false negatives; low recall implies numerous false negatives. F1-Score (F-measure) is a harmonic mean of accuracy and recall, combining precision and recall. The segmentation performance is quantified using Mean Intersection over Union (Mean IoU), which measures the percentage overlap between predicted and true segmentation masks. Traditionally, an IoU value exceeding 0.5 is regarded as indicative of “good” segmentation [26].

3. Experimental Design

In this section, we elucidate our machine learning pipeline, illustrated in Figure 4, designed for pore detection and analysis, subsequently leading to the prediction of diverse pore types. The training process utilizes input image(s), from which we extract pixel-based features employing different filters: Canny, Roberts, Sobel, Scharr, Prewitt, Gaussian, Median, and Variance filters. Different kernel sizes employed for these operations were investigated: 3 × 3, 5 × 5, 25 × 25, and 50 × 50 pixels. In our supervised machine learning (ML) approach, annotation is essential for distinguishing between various pore types. To accomplish this, we applied classical image processing algorithms, as detailed in Section 2.2 of our study. This tool facilitates the iterative detection of object (pore) contours and then derives different features such as aspect ratio, area, and convexity, as elaborated in Section 2.2. Drawing upon statistical analyses of pore characteristics conducted using the data presented in Figure 1, we formulated criteria for pore classification, an example of which is documented in Table A2 in Appendix B. These criteria are structured as an if–else logic system, enabling the classification of diverse pore types based on their statistical attributes. This classification scheme, as depicted in Appendix B Figure A1, encompasses process pores, gas or pore keyholes, LOFs, and another category. It is worth noting that our dataset lacks information on cracks. Consequently, our RF classifier is configured to predict four classes: 0 for background, 1 for LOF pores, 2 for keyhole pores, and 3 for process pores, aligning with the available data characteristics. Subsequently, following the conditions outlined in Figure A1 in Appendix B, we assign labels to the pores and employ this information to generate a pixel-based mask, effectively attributing each pixel to its corresponding pore. This mask is then input into the RF classifier. Finally, the classifier’s performance is assessed with new testing images, yielding the predictive accuracy. In Appendix B, Figure A2 depicts examples of the input image, labeled image, and predicted image, respectively.
The CNN model used in this work employs two or three Conv2D-MaxPooling2D layer pairs for feature extraction and classification, typically with 4–8 filters in each layer using a filter mask size of 5 × 5 pixels. ReLU (Rectified Linear Unit) activation functions are applied throughout the network to introduce amplification of positive features and damping of negative latent features and enhance feature separation capabilities. The objective of this architecture is to classify each pixel in the input images into one of four classes: background, LOF pores, keyhole pores, and process pores, creating a feature map image.
We also utilized the U-Net architecture, which is designed for pixel-level segmentation tasks, as introduced by Ronneberger et al. in 2015 [25]. U-Net’s distinctive features include an encoder (down-sampling) and decoder (up-sampling) CNN framework (see an example of this model architecture in Appendix C Figure A3), skip connections linking encoder and decoder layers, transposed convolution for up-sampling, and crop-concatenate for contextual information integration, concluding with a 1 × 1 convolution layer. In comparison to standard CNNs with broader applications in computer vision, U-Net specializes in pixel-level image segmentation and ROI detection. Our custom U-Net design incorporates five Conv2D layers for down-sampling (64 × 64, 32 × 32, 16 × 16, 8 × 8, and 4 × 4) and four Conv2DTranspose layers for up-sampling (4 × 4 to 8 × 8, 16 × 16, 32 × 32, and 64 × 64), interconnected through skip connections, culminating in a Conv2DTranspose layer with a 3 × 3 kernel to achieve a 128 × 128 resolution. Loss and activation functions are customizable, with categorical cross-entropy and ReLU often chosen. Our model aims for precise pixel-wise classification.

4. Results and Discussion

In our study, we trained a Random Forest (RF) model using up to 10 million classes of imbalanced training samples (i.e., pixel vectors, but background pixels are the majority), as detailed in Section 3, using a progressive approach where we employed an increasing number of ten images randomly selected from our dataset and tested with all these ten images. This approach was adopted due to the non-normal distribution of the accuracy results, leading us to calculate the standard error of the mean (SEM) as a more robust measure, representing one standard deviation. Training the model with eight images achieved a lower SEM of testing the model. The model’s overall average test accuracy across all classes, along with its SEM, was determined to be 77% ± 1% (refer to Figure 5a). Since the background class is trivial in this use case, the three-class average accuracy is about 76%. Notably, the model achieved a maximum test accuracy of 82% among the ten tested images. When trained with eight images, the model demonstrated an overall average test precision of 67%, recall of 77%, F1 score of 69%, and an impressive Area Under the Curve (AUC) of 99.7%. The class-specific accuracy is not homogeneous. Only the LOF class, which was the majority class in the initial training sample distribution, can be clearly identified. We repeated the training with a balanced training set, but without significant improvement, concluding that the RF training is insensitive to imbalanced training examples.
A comprehensive breakdown of individual class training and test accuracies can be found in Figure 5b. Notably, the model excelled in predicting classes with larger pixel counts, such as the LOF pore type, as exemplified in Figure A2c, where a predicted image is showcased. The decrease in the overall model prediction accuracy of the training data and a parallel increase in the test data accuracy with the increasing number of training images, as shown in Figure 5a, is an indicator for the high variance (class distribution and geometric variations) of particular images.
We trained the CNN with a moving input window size of 20 × 20 pixels (with about 10,000 training examples), as well as the RF with eight images, and tested the model with all ten images. The results, as summarized in Table 1, show that the CNN model that is described is not performing well, either. After 30 training epochs with a training rate of alpha = 0.01, we obtain a total accuracy on the test set (70% of the entire image segment database consisting of 27,000 segments) of about 80%, but the keyhole and LOF classes pose an individual error of about 30–40% due to misclassification (mostly overlapping classification of these classes). Only the process pore class (with its small geometric size, see Appendix for details) can be detected with a low error (about 6%). The error is an individual pixel classification error without considering neighboring pixel results. After pixel feature classification, a pixel clustering (DBSCAN) can be applied. Spurious misclassification can be suppressed by clustering, resulting in a much lower pore-wise classification error.
The RF and CNN models rely on a divide-and-conquer principle posing a low model complexity. For comparison, we employed a complex U-Net model that is also described in Section 3. The training process was not suitable to create a usable model, as shown in Figure A4. The predicted images still look different to the labeled images, as can be seen in Figure A5 (a: input test image, b: labeled image, and c: the predicted labeled image). The model was trained with eight images, resulting in a training and testing dataset accuracy of 54% and 25%, respectively, i.e., the training failed completely, basically due to the limited training dataset size (here, only eight different instances).
As concluded in this section, the RF-based model performed slightly better than both the simple CNN and the U-Net models for our task of predicting different pore types. However, both RF and CNNs can only predict one of the three pore class with high accuracy, while two of three are not clearly distinguishable. The currently unusable U-NET needs to be tuned, and data augmentation is important in order to improve the results. We emphasize the importance of employing data augmentation techniques such as geometric transformations involving random cropping, shifting, and rotation. These strategies hold great promise for enhancing classifier performance and advancing pore classification.
The RF and CNN show different distributions of the per-class accuracy, so they could be combined to create a more robust class-specific classifier model. The misclassification noise, as illustrated in the images in Figure A2c–f, depends on the filter mask sizes. Too small masks reduce the spatial correlation and increase noise significantly, while too large masks increase averaging and extended area misclassification (e.g., by multiple pores inside the mask).

5. Conclusions and Future Work

Our research has introduced a hybrid classifier model using model-driven feature selection combined with an RF classifier, a supervised machine learning model that is designed to perform well even with limited training data. Compared with purely data-driven models like CNNs, our RF approach has demonstrated a competitive quality in pore classification, which can be trained with a highly class-imbalanced training set without compromising accuracy. Both RF and CNN approaches used local data models of a low complexity combined with a divide-and-conquer methodology. One major contribution is an automated feature annotation using classical image processing and iterative object search, finally providing shape boundary approximations and elliptical shape fitting. Based on a few characteristic features, the pores can be classified using a simple decision tree. The image processing approach always depends on a global context limiting parallelism, whereas the pixel classifier depends only on bound local data, enabling the usage of parallel Cellular Automata processing architectures. The U-NET approach uses a highly complex and deep functional graph model, which is not suitable for being trained with only a few images as was done in this work.
The major advantage of the model-driven over the purely data-driven approach is the ability to be explained and tractability of the model, i.e., a correlation between the classification output and geometric features that are amplified by the selected filter operators. Finally, the RF approach showed low sensitivity to highly imbalanced datasets with respect to the target class distributions.
Given the challenges in gathering micrograph data, we emphasize the importance of employing data augmentation techniques such as geometric transformations, including random cropping, shifting, and rotation. These strategies hold great promise for enhancing classifier performance and advancing pore classification.
In future work, we aim to:
  • Use a semantic pixel clustering based on DBSCAN to improve pore classification by majority decision and to derive ROI boundaries of the pores;
  • Enhance the RF- and CNN-based micrograph data classification model, finally fusing these models to create a more robust meta model;
  • Develop a forward ML model for predicting mechanical properties;
  • Create an inverse ML model for predicting AM process parameters.

Author Contributions

Conceptualization, S.M.K.A.-Z. and S.B.; methodology, S.M.K.A.-Z. and S.B.; software, S.M.K.A.-Z.; validation, S.M.K.A.-Z. and S.B.; investigation, S.M.K.A.-Z. and S.B.; writing—original draft preparation, S.M.K.A.-Z. and S.B.; writing—review and editing, S.B.; visualization, S.B.; supervision. All authors have read and agreed to the published version of the manuscript.

Funding

This work is funded by the University of Bremen Research Alliance (UBRA) AI Center for Healthcare within the project PORTAL (grant number 40301026).

Institutional Review Board Statement

Not applicable.

Informed Consent Statement

Not applicable.

Data Availability Statement

The data that support the findings of this study are available from the corresponding author upon reasonable request.

Acknowledgments

The authors would like to thank Mika Altmann for providing experimental data for the defect classification.

Conflicts of Interest

The authors declare no conflicts of interest.

Appendix A

Table A1. Summary of the pore types.
Defect TypeCharacteristicsGeometric FeaturesMaterial and Mechanical Properties
Engproc 58 00122 i001Keyhole pore [6,7]Vapor bubbles trapped in melt pool during printing and vaporized metal at high local temperatures or merge process poresKeyhole-like voids, channelingReduced mechanical strength, reduced fatigue resistance, susceptibility to crack initiation
Engproc 58 00122 i002Gas pore (circular keyhole) [8]Vapor bubbles trapped in melt pool during printing (or merge process pores)Irregular distribution, sphericalDecreased fatigue life, lowered mechanical strength, compromised surface finish
Engproc 58 00122 i003Lake of Fusion (LOF) [8,9]Due to insufficiently melted materialInterlayer gaps, unfused regions, not necessarily sphericalStarting point for cracks which may grow further due to stress
Engproc 58 00122 i004Unmelted particle (LOF) [8,10,11]Due to insufficiently melted material
(inclusion of unmelted powder)
Same as above but with unmelted powder trapped insideStarting point for cracks which may grow further due to stress
Engproc 58 00122 i005Process pore [9]Low packing density of the powder, hollow powder particles, and entrapped inert gasIrregular distribution, spherical with smallest areaLess effect on the material
Engproc 58 00122 i006Crack [3]Fractures in printed layers or at interfaces or can be caused due to failure induced by other poresLarge aspect ratioBiggest risk for initiating mechanical failure

Appendix B

Figure A1. Automatic annotation procedure for the pore type classification.
Engproc 58 00122 g0a1
Figure A2. (a) Example of an input micrograph image. (b) Automatically labeled image where blue pixels represent the LOF pore, green keyhole or gas pores, and red is the process pores. (c) Predicted pixel classification by the RF model with a filter operator mask of 25 × 25 pixels. (d) Another example. (e) Automatically labeled image. (f) Prediction using a 3 × 3 filter mask with noisy classification.
Engproc 58 00122 g0a2
Table A2. The mean area, convexity defects, and aspect ratio features of three pore types.
Pore TypeMean Area
mm
Convexity
Defects
Aspect
Ratio
Process8.59 × 10−51.1351.397
Keyhole0.01823.7501.211
LOF0.02912.517 1.972

Appendix C

Figure A3. Example of U-Net architecture. The blue tiles on the left hand side represent the encoder (down-sampling) section of the network, and the green tiles on the right show the decoder (up-sampling) section [24].
Engproc 58 00122 g0a3
Figure A4. Results of using U-Net model (a) accuracy vs. increasing number of training images, (b) IoU vs. increasing number of training images, (c) each class accuracy vs. increasing number of training images.
Engproc 58 00122 g0a4
Figure A5. Results of U-Net model trained with eight images: (a) test image, (b) labeled test image (c) predicted image.
Engproc 58 00122 g0a5

References

  1. Khorasani, A.; Gibson, I.; Veetil, J.K.; Ghasemi, A.H. A review of technological improvements in laser-based powder bed fusion of metal printers. Int. J. Adv. Manuf. Technol. 2020, 108, 191. [Google Scholar] [CrossRef]
  2. Kruth, J.-P.; Mercelis, P.; van Vaerenbergh, J.; Froyen, L.; Rombouts, M. Binding mechanisms in selective laser sintering and selective laser melting. Rapid Prototyp. J. 2005, 11, 26. [Google Scholar] [CrossRef]
  3. Gong, H.; Rafi, K.; Gu, H.; Ram, G.D.J.; Starr, T.; Stucker, B. Influence of defects on mechanical properties of Ti-6Al-4V components produced by selective laser melting and electron beam melting. Mater. Des. 2015, 86, 545–554. [Google Scholar] [CrossRef]
  4. Keshavarzkermani, A.; Marzbanrad, E.; Esmaeilizadeh, R.; Mahmoodkhani, Y.; Ali, U.; Enrique, P.D.; Zhou, N.Y.; Bonakdar, A.; Toyserkani, E. An investigation into the effect of process parameters on melt pool geometry, cell spacing, and grain refinement during laser powder bed fusion. Opt. Laser Technol. 2019, 116, 83. [Google Scholar] [CrossRef]
  5. Cepeda-Jiménez, C.M.; Potenza, F.; Magalini, E.; Luchin, V.; Molinari, A.; Pérez-Prado, M.T. Effect of energy density on the microstructure and texture evolution of Ti-6Al-4V manufactured by laser powder bed fusion. Mater. Charact. 2020, 163, 110238. [Google Scholar] [CrossRef]
  6. Wang, T.; Dai, S.; Liao, H.; Zhu, H. Pores and the formation mechanisms of SLMed AlSi10Mg. Rapid Prototyp. J. 2020, 26, 1657–1664. [Google Scholar] [CrossRef]
  7. Martin, A.A.; Calta, N.P.; Khairallah, S.A.; Wang, J.; Depond, P.J.; Fong, A.Y.; Thampy, V.; Guss, G.M.; Kiss, A.M.; Stone, K.H.; et al. Dynamics of pore formation during laser powder bed fusion additive manufacturing. Nat. Commun. 2019, 10, 1987. [Google Scholar] [CrossRef]
  8. Ellendt, N.; Fabricius, F.; Toenjes, A. PoreAnalyzer—An Open-Source Framework for the Analysis and Classification of Defects in Additive Manufacturing. Appl. Sci. 2021, 11, 6086. [Google Scholar] [CrossRef]
  9. Altmann, M.L.; Benthien, T.; Ellendt, N.; Toenjes, A. Defect Classification for Additive Manufacturing with Machine Learning. Materials 2023, 16, 6242. [Google Scholar] [CrossRef]
  10. Kruth, J.P.; Froyen, L.; Van Vaerenbergh, J.; Mercelis, P.; Rombouts, M.; Lauwers, B. Selective laser melting of iron-based powder. J. Mater. Process. Technol. 2004, 149, 616–622. [Google Scholar] [CrossRef]
  11. Wang, W.; Ning, J.; Liang, S.Y. Prediction of lack-of-fusion porosity in laser powder-bed fusion considering boundary conditions and sensitivity to laser power absorption. Int. J. Adv. Manuf. Technol. 2021, 112, 61–70. [Google Scholar] [CrossRef]
  12. Zhang, Y.; Hong, G.S.; Ye, D.; Zhu, K.; Fuh, J.Y. Extraction and evaluation of melt pool, plume and spatter information for powder-bed fusion AM process monitoring. Mater. Des. 2018, 156, 458–469. [Google Scholar] [CrossRef]
  13. Scime, L.; Beuth, J. Anomaly detection and classification in a laser powder bed additive manufacturing process using a trained computer vision algorithm. Addit. Manuf. 2018, 19, 114–126. [Google Scholar] [CrossRef]
  14. Wong VW, H.; Ferguson, M.; Law, K.H.; Lee YT, T.; Witherell, P. Automatic volumetric segmentation of additive manufacturing defects with 3D U-Net. arXiv 2021, arXiv:2101.08993. [Google Scholar]
  15. Bradski, G. The openCV library. Dr. Dobb’s J. Softw. Tools Prof. Program. 2000, 25, 120–123. [Google Scholar]
  16. Suzuki, S. Topological structural analysis of digitized binary images by border following. Comput. Vis. Graph. Image Process. 1985, 30, 32–46. [Google Scholar] [CrossRef]
  17. Breiman, L. Random forests. Mach. Learn. 2001, 45, 5–32. [Google Scholar] [CrossRef]
  18. Cutler, A.; Cutler, D.R.; Stevens, J.R. Random forests. Ensemble Mach. Learn. Methods Appl. 2012, 157–175. [Google Scholar] [CrossRef]
  19. Breiman, L. Bagging predictors. Mach. Learn. 1996, 24, 123–140. [Google Scholar] [CrossRef]
  20. Fabian, P.; Gael, V.; Alexandre, G.; Vincent, M.; Bertrand, T.; Olivier, G.; Mathieu, B.; Peter, P.; Ron, W.; Vincent, D.; et al. Scikit-learn: Machine learning in Python. J. Mach. Learn. Res. 2011, 12, 2825–2830. [Google Scholar]
  21. Bosse, S.; Lehmhus, D. Automated Detection of hidden Damages and Impurities in Aluminum Die Casting Materials and Fibre-Metal Laminates using Low-quality X-ray Radiography, Synthetic X-ray Data Augmentation by Simulation, and Machine Learning. arXiv 2023, arXiv:2311.12041. [Google Scholar] [CrossRef]
  22. Shah, C.; Bosse, S.; von Hehl, A. Taxonomy of Damage Patterns in Composite Materials, Measuring Signals, and Methods for Automated Damage Diagnostics. Materials 2022, 15, 4645. [Google Scholar] [CrossRef] [PubMed]
  23. Boser, B.; Denker, J.S.; Henderson, D.; Howard, R.E.; Hubbard, W.; Jackel, L.D.; Laboratories, H.Y.L.B.; Zhu, Z.; Cheng, J.; Zhao, Y.; et al. Backpropagation applied to handwritten zip code recognition. Neural Comput. 1989, 1, 541–551. [Google Scholar]
  24. Jenkins, M.D.; Carr, T.A.; Iglesias, M.I.; Buggy, T.; Morison, G. A deep convolutional neural network for semantic pixel-wise segmentation of road and pavement surface cracks. In Proceedings of the 2018 26th European Signal Processing Conference (EUSIPCO), Rome, Italy, 3–7 September 2018; pp. 2120–2124. [Google Scholar] [CrossRef]
  25. Al-Zaidawi, S.M.K. Machine Learning Classification of User Attributes via Eye Movements. Ph.D. Thesis, Universität Bremen, Bremen, Germany, 2022. [Google Scholar] [CrossRef]
  26. Rezatofighi, H.; Tsoi, N.; Gwak, J.; Sadeghian, A.; Reid, I.; Savarese, S. Generalized intersection over union: A metric and a loss for bounding box regression. In Proceedings of the IEEE/CVF Conference on Computer Vision and Pattern Recognition (CVPR), Long Beach, California, USA, 15–20 June 2019; pp. 658–666. [Google Scholar]
Figure 1. The extracted pore types as (a) process pores; (b) keyhole (gas) pores; (c) lack of fusion pores.
Engproc 58 00122 g001
Figure 2. Illustration of the preprocessing and feature extraction pipeline (a) SLM; (b) micrograph slicing; (c) image binarization; (d) contour and ROI marking; (e) pore characterization and classification.
Engproc 58 00122 g002
Figure 3. Pixel classifier principle using a CNN (alternatively replaced by the proposed RF approach).
Engproc 58 00122 g003
Figure 4. (Top) RF-based model pipeline. Input is a sub-window from the original input image at a specific index position x, y. (Bottom) Feature vector generation and local pixel aggregation.
Engproc 58 00122 g004
Figure 5. Figure 5. (a) Overall averaged accuracy of RF classifier vs. increasing number of training images, (b) each class-averaged accuracy of RF classifier vs. increasing number of training images.
Engproc 58 00122 g005
Table 1. Summarized comparison of the accuracies for the three approaches considered in this work (FC: False classification).
Class\MethodRFCNNU-NET
Process Pore Class54%
(40% Keyhole FC)
93%50%
LOF Class99%60% (25% Keyhole FC)5%
Keyhole Class75%
(20% Pro FC)
65% (25% LOF FC)20%
Total76%73%25% (failed)
Disclaimer/Publisher’s Note: The statements, opinions and data contained in all publications are solely those of the individual author(s) and contributor(s) and not of MDPI and/or the editor(s). MDPI and/or the editor(s) disclaim responsibility for any injury to people or property resulting from any ideas, methods, instructions or products referred to in the content.

