Does Financial Integration Enhance Economic Growth in China?


Business and Economics Research Group, Ho Chi Minh City Open University, Ho Chi Minh City 700000, Vietnam
*
Author to whom correspondence should be addressed.
Economies 2020, 8(3), 65; https://doi.org/10.3390/economies8030065
Submission received: 27 May 2020
/
Revised: 23 July 2020
/
Accepted: 3 August 2020
/
Published: 13 August 2020
(This article belongs to the Special Issue Anti-Globalization vs. Regional Integration)
Abstract
:China is a fascinating country in Asia, the second-largest economy in the world, with incredible economic growth and development in the last two decades. In addition, China has dramatically enjoyed a disciplined and successful financial integration with the region and the world in the same period. As such, it is interesting to examine a potential link between economic growth and financial integration in this most populous country. This paper was conducted to identify whether financial integration fosters Chinese economic growth. The Auto-Regressive Distributed Lags (ARDL) model is selected, utilizing the most updated data on a globalization (or integration) index. Two distinct aspects of financial integration, the de facto (proxied for economic activities) and the de jure (proxied for the Government policies leading to integration), are considered in this paper. We apply an econometric technique, using yearly aggregated data, to examine a long-term co-integration and a causal relationship between financial integration and economic growth in China. Findings from this paper indicate a long-term co-integration between financial integration de facto and economic growth in China. The bidirectional causality between financial integration and economic growth in China is also confirmed using the Granger causality test.
JEL Classification:
F15; F36; F431. Introduction
How did China become the world’s second-largest economy in the last few decades? Starting from the emergence of China, since the 1990s, the country appears to develop regardless of economic uncertainties around the globe. With these incredible developments, economic and social issues on China have attracted great attention from governments, scholars, practitioners, and policymakers (Girardin and Liu 2007; Okazaki and Fukumoto 2011; Xu and Gui 2019; Wang and Schuh 2000; Yin and Ma 2009). The Chinese market presents interesting information. First, the broad money in China began to increase in 1979, when the Chinese government brought the most economic reform in the country. Second, Chinese domestic capital formation began to increase, from 2000 (around 417 billion USD) to 2015 (around 5000 billion USD). Third, FDI flows into China were also significant. FDI inflow to China went up, starting in the early 1990s, from 68 billion USD in 2004 to 171.5 billion USD in 2008. In 2016, China had a surplus from FDI flows by approximately 41.6 billion USD. Along with the improvement of FDI flows, Chinese exchange reserves also increased with strong integration of the regional and global economies. The changes in the Chinese reserves were similar to the FDI inflows in the early 2000s. The GDP of the Chinese economy consistently increased from the mid-2000s to 2017. These pieces of evidence imply that (i) China has been strongly associated with the global financial system, and (ii) the Chinese government prepared carefully and well for the enhancement of its domestic financial market.
Statistically, Okazaki and Fukumoto (2011) conducted a comprehensive study on the five pillars of the Chinese financial system. For the first pillar, the Chinese government improves its financial independence by reducing external debts and fostering exchange reserves. Second, the government strengthens its fiscal position by keeping a low ratio of fiscal deficit to GDP and an affordable ratio of government’s debt to GDP. Third, the Chinese government orients its economy toward a low leveraged system in which its economic activities are modestly dependent on bank loans. Fourth, besides the external independent strategy, domestic savings in China are surprisingly higher than many other nations (such as India, Japan, and the U.S.) and other economic zones (for example, the ASEAN 4, Central & Eastern Europe 13) in 2007. Fifth, improving the stability of the banking system is another important pillar, explaining the country’s success during the two economic downturns (the ASEAN crisis in 1997 and the world economic crisis in 2008). After accession to the World Trade Organization (WTO) in 2001, the Chinese government took almost five years to prepare its banking sector before completely opening for foreign participation.
On grounds of current literature, there is endless debate on the finance–growth nexus. Various empirical papers have captured different effects of finance on growth. Generally, as panel data is generally utilized at an aggregate level, previous empirical studies were conducted to identify typical influences of finance on economic growth or vice versa. Our paper claims that for a special case country such as China, the finance–growth nexus cannot be considered in isolation.
Previously, empirical studies examined this important link using panel data of many nations at the aggregate level (Anwar and Cooray 2012; Edison et al. 2002; Gourinchas and Jeanne 2006; Imbs 2006; Kose et al. 2003; Lane and Milesi-Ferretti 2003; Menyah et al. 2014). Other papers employed financial market time-series data for a single country (Cheung et al. 2005; Girardin and Liu 2007; Guiso et al. 2004; Peia and Roszbach 2015). Limited studies are found to have used time-series analysis at the aggregate level (e.g., Ang (2008b, 2010); and (Anwar and Sun 2011)).
We note that limited studies have been conducted to examine the incredible success of China with a focus on financial integration with the world economy. The most updated data on financial integration generally known as de facto and de jure financial globalization, which were initially developed by Dreher (2006), Dreher et al. (2008), and recently updated by Gygli et al. (2019), are utilized in this paper. In addition, this study contributes to the current literature of time-series analysis on the finance–growth nexus for a single nation using the aggregate level. To deal with the critical issues of the small sample in the time-series analysis, the autoregressive distributed lag (ARDL) model is utilized in order to explore the long-term co-integration relationship between financial integration, both de facto and de jure financial globalization, and economic growth.
The structure of the paper is as follows. Following this introduction, a literature review on the finance–growth nexus and the growth effect of financial integration is examined in Section 2. In Section 3, research methodology and data including (i) model specification, (ii) time-series analysis method, and (iii) variables and data sources are discussed. Section 4 reports the empirical results. Discussions of the main findings are in Section 5, followed by the conclusions and policy implications in Section 6.
2. Literature Review
An intensive literature review revealed the influence of financial development on economic growth and development. There are two distinct channels in this effect: (i) capital accumulation and (ii) total factor of productivity (TFP) (Ang 2008a; Anwar and Sun 2011; Arestis et al. 2014; Greenwood and Jovanovic 1990; Gurley and Shaw 1955; King and Levine 1993). Financial integration as an element of financial development can be involved in either capital accumulation or the TFP channel. The integration of world economies can affect capital accumulation through FDI or foreign debts. For the TFP channel, regulations on financial integration affect the motivation of international financial innovation as well as the participation of foreign or domestic investors in the national or global market, which directly and indirectly affect economic growth. As such, financial integration has the potential to influence economic growth and development. In relation to financial development, the literature was developed on the basis of financial depth and financial stability to extended concepts such as financial liberalization, financial inclusion, and financial integration. The abstract concept of “integration” (economic integration or financial integration) has emerged along with the development of international economics.
There are various perspectives on the relationship between financial development and economic development. On the one hand, Levine (2005); Levine et al. (2000); Levine and Zervos (1998); and King and Levine (1993) discuss the important role of financial market development to foster economic growth and development. Especially, a well-developed financial system can efficiently allocate capital resources to productive users. On that basis, it enhances economic development. In contrast, Robinson (1979) argues that financial development does not enhance economic growth. The development of the financial markets passively reacts to economic growth due to the increase of the financial demand.
There are also two opposite schools of thoughts arguing the implications of financial restrictions. In accordance with a Schumpeterian view, Ang and Mckibbin (2007); Gurley and Shaw (1955); Goldsmith (1969); and Hicks (1969) agree that a well-developed financial system can enhance economic development. The creation and innovation of financial institutions, financial services, financial products, and financial derivatives force the saving–investing cycle to perform more efficiently. However, from a Keynesian perspective, e.g., (Studart 1993; Loizos 2018; Xu and Gui 2019), a more expanded financial system with various participations can reduce the power of the governments in terms of managing the economy. Loosened regulation and supervision on the financial system create a risk of instability and an open-to-attack system. Then it requires repression on a financial system such as a high level of compulsory reserves, interest rate control, exchange rate control, and many others. As a result, it is argued that financial repression serves better for economic development through stabilizing the performance of the economy as expressed in the Keynesian view.
After an excellent expansion of the Keynesian school of thought after post-war decades, McKinnon (1973) and Shaw (1973)1 challenge this ideology (Ang 2008b; Durusu-Ciftci et al. 2017; Fry 1989; Levine 2005; Levine et al. 2000; Levine and Zervos 1998; King and Levine 1993). These authors criticize the policies related to financial repression in which interest rate control and high reserve requirements lead to lower savings, less capital accumulation and inefficient financial allocation. On the other hand, the McKinnon-Shaw school of thought encourages a free financial system, named “financial liberalization” where interest rate as an example is freely adjusted, and the system will efficiently adapt to the market mechanism.
At the aggregate level, a vast majority of empirical studies explore financial integration in terms of financial globalization or financial liberalization (Ang 2008a; Ang 2008b; Anwar and Sun 2011; Bekaert et al. 2005; Bussière and Fratzscher 2008; Dreher 2006; Dreher et al. 2008; Eichengreen et al. 2011; Gourinchas and Jeanne 2006; Gygli et al. 2019; Levine et al. 2000; Wolde-Rufael 2009). Many studies find a link between financial integration and growth. However, these papers also indicate the complexity of the finance–growth nexus. For example, Ang (2008b) presents a complex relationship between financial development and economic growth in Malaysia. Financial development enhances growth in Malaysia. However, regulations from the Malaysian governments on its financial system negatively affect national economic growth. Another study on the Malaysian financial system comes from Anwar and Sun (2011). This paper presents a positive contribution of financial development to the Malaysian capital stock but not to the economic growth. For the cross-country analysis, Bussière and Fratzscher (2008) argue that countries will benefit in the short run right after the liberalization of the financial system. Then, economic growth will not increase as fast as initially thought and even decrease in the medium and long run. Gourinchas and Jeanne (2006) confirm the relationship between financial integration and welfare gains in developing countries. Wolde-Rufael (2009) examines the causality between finance and growth in Kenya and finds a bidirectional causal relationship between domestic credits and economic growth, liquid liabilities and economic growth. On the basis of the analyses by Dreher (2006) and Dreher et al. (2008); Gygli et al. (2019) extend a dataset on globalization indices and consider that globalization involving financial globalization enhances economic growth.
Theoretically, financial integration can be considered as an aspect of financial development. The concept of “integration” is relatively closed to “liberalization”. However, the process of integration implies the expansion of the domestic market to global financial systems. The term of liberalization, on the other hand, expresses how dynamic the market can be. Financial integration emphasizes a level of a globalized financial system, and financial liberalization suggests a free-regulated financial system. In particular circumstances, financial integration and financial liberalization can be used as alternatives. A globalized financial system requires limited or free regulations, and in turn, a limited-regulated financial market encourages a globalized financial system. On these bases, current theories do not support a clear direction of the influence of financial integration on economic growth and development.
For China, since the early 2000s, evidence exists to confirm that the integration of the Chinese financial market and the Chinese government’s orientation on its financial system appears to be different. On the one hand, huge capital flows across Chinese borders. On the other hand, strict regulations are imposed by the Chinese government on its domestic finance to the global financial market. These issues have attracted considerable attention from academics and practitioners (Girardin and Liu 2007; Groenewold et al. 2004; Hatemi-J and Roca 2004; Huang et al. 2000; Yang et al. 2003). For financial integration, empirical studies focus on bilateral integration between the Chinese stock market and the world stock markets. Various studies fail to find any empirical evidence in relation to the bilateral integration between the Chinese stock prices and the prices in other markets such as the U.S., Taiwan, and Hong Kong (Groenewold et al. 2004; Hatemi-J and Roca 2004; Huang et al. 2000). For the Chinese government’s restrictions on the domestic financial system, Girardin and Liu (2007) discuss the de jure financial opening and find a co-integrated relationship between the Shanghai market and the S&P 500 market. In addition, Okazaki and Fukumoto (2011) examine the role of restrictions on the financial sectors of economic growth in China. The authors confirm the important role of financial development and the Chinese government regulations on the financial system in the process of economic growth and development in China.
An overview of the finance–growth nexus with a particular focus on Chinese highlights and interests was conducted for this paper. First, there is no clear empirical evidence of the growth effect of financial integration in China, especially at the aggregate level. Second, the Chinese financial system has exhibited two opposite effects: (i) huge capital flows across Chinese borders and (ii) strict regulations from the Chinese government on financial integration. However, previous empirical studies solely consider the growth effects from the actual financial integration (or the de facto integration) or financial regulations from the Chinese government (the de jure integration). These gaps encourage us to empirically explore the growth effect of financial integration in China at the aggregate level. As such, in this paper, we employ the recently updated data on financial integration, generally known as de facto and de jure financial globalization, recently updated by Gygli et al. (2019).
3. Methodology
3.1. Model Specification
The aggregate output is considered an aspect of economic growth. Many papers have employed the Cobb–Douglas production function (Ang 2008a; Ang 2008b; Anwar and Sun 2011; Arestis et al. 2014; Greenwood and Jovanovic 1990; Gurley and Shaw 1955; King and Levine 1993). The function can be expressed as follows:
where: Y is the GDP at time t, TFP is the total factor of productivity in year t, K is domestic capital in period t, L is labor force in year t, and αi (i = 1, 2, 3) is the production elasticity of the TFP, K, and L, respectively.
Various studies employ the aggregate production function to examine the relationship between financial integration (or financial development) and economic growth with the view that financial integration is an element of the TFP. However, other papers usually separate financial factors from the TFP (Ang 2010; Anwar and Sun 2011). These studies have established a determinant function of TFP to control for other related elements:
Log(Yt) = α1log(FIt) + α2log(Kt) + α3log(Lt) + εt
Log(Yt) = α1log(TFPt) + α2log(Kt) + α3log(Lt) + α4log(FIt) + ωt
Log(TFPt) = Σβilog(Xit) + υt
Log(Yt) = α2log(Kt) + α3log(Lt) + α4log(FIt) + Σβilog(Xit) + υt + ωt
3.2. Time-Series Analysis
To examine the co-integration relationship between financial integration and economic growth in China, the vector of auto-regressive (VAR) or structural vector of auto-regressive (SVAR) and auto-regressive distributed lags (ARDL) models appear to be the two most appropriate methods. The VAR conducts a simultaneous regression system in which each variable is alternatively treated as the dependent variable. The regressors are the remaining variables and their lags, including the lags of the dependent variable. As such, the VAR and SVAR has the advantage in dealing with endogenous problems among interested variables. Moreover, the VAR and SVAR model exhibits more power with large samples. Estimates from the VAR model are better if we employ a quarterly or monthly dataset. In addition, Johansen co-integration techniques based on the VAR framework allow us to test whether a co-integration relationship exists among considered variables (Vo et al. 2019a; Vo et al. 2019d).
On the other hand, the ARDL model based on the error correction mode (ECM) can report both short-run and long-run effects (Nguyen et al. 2019a; Nguyen et al. 2019b; Phuc and Duc 2019). Compared to Johansen co-integration techniques, the ARDL bound test allows us to examine a long-term co-integration within a small sample (Vo et al. 2019b; Vo et al. 2019c; Vo et al. 2020). The ARDL bound test can process a mix of variables having I(0) and I(1), while the Johansen test restricts all variables to the same order of stationarity. Furthermore, if the unit root occurs with a structural break, the normal unit root test such as the Augmented Dickey–Fuller test or the Phillips–Perron test can produce misleading conclusions. As such, the Johansen co-integration test can also lead to a biased conclusion. In this case, the ARDL bound test has the advantage as a better estimation which takes into account structural breaks regardless of whether the variables included in the analysis are I(0) or I(1). As such, the ARDL model is more appropriate in this study compared to the VAR model (Phuc and Duc 2019). We developed the ARDL models as follows:
where FI denotes financial integration; Δ represents the first different order, meaning the short-term effect; bj denotes the long-term effects.
To ensure the efficiency of the ARDL model, several restrictions are required for a valid verification. First, all variables utilized in the model need to be I(0) or I(1). Second, we need to examine whether the dependent variable has a unit root with a structural break or not. Third, as a rule of thumb, the adjustment coefficient of the bound test should carry a negative estimate, and the absolute value should not be too small. Fourth, no serial correlation in the model is expected and tested. Last but not least, post-estimated tests are also conducted to ensure the reliability and robustness of the estimates.
In addition, even though the ARDL model has an advantage in identifying a co-integration relationship among interested variables, the model fails to capture a causal relationship between the independent and dependent variables. Ang (2008a) argues that causality in the time-series analysis is not appropriate. However, our extensive literature review indicates that time-series analysis with data for a country can also be used to examine the critical causality of the variables of interest. This paper utilizes a Granger causality test to identify if financial integration promotes economic growth in China.
3.3. Variables and Data Sources
There is no unique measure of financial integration for countries. There are typically three types of measurements for financial integration: (i) a representative proxy (Ang (2008a, 2008b); Anwar and Cooray (2012)), (ii) multi-variables (Anwar and Sun 2011; Wolde-Rufael 2009), and (iii) a computed index (Dreher 2006; Dreher et al. 2008; Gygli et al. 2019). The first type of measurement is the simplest solution. However, the proxy is widely criticized as a low-quality measure of financial integration because a single aspect cannot capture different characteristics of financial integration. The multi-variable approach employs a group of indices which represent financial integration. This second approach exhibits the weakness of the first approach. The approach, however, can potentially violate the multi-correlated problem and the autocorrelation issue among variables due to the use of highly related variables and the inclusion of too many variables in the regression model.
From the above consideration, computing an index of financial integration from various variables in order to take into account many aspects of financial integration appears to be appropriate. Moreover, this new index can overcome multi-correlation and autocorrelation because many variables are now excluded from the regression model. However, as expected, the index has its own weakness in representing various aspects of financial integration. Other indices such as the trade opening index have also faced the same issue. For example, a trade openness index of China in 2017 was 37.8 per cent indicating that total import and export of China accounts for 37.8 per cent of China’s GDP in 2017. This index fails to present how much the trading sector in China generated in terms of the U.S. dollar in 2017. The financial integration index also faces a similar measurement problem.
This study focuses on the significance of the Chinese financial system integrating into the global system and the effect of this integration on the economic growth and development in China. As such, we are interested in the quality of financial integration in China. Two largest datasets compute the index for financial integration. The first one is the Indicators of Financial Integration database provided by the IMF. The second one is the KOF database developed by the KOF Swiss Economic Institute. Given their coverage, the KOF database is utilized in this paper.
The KOF globalization indices were introduced by Dreher (2006); Dreher et al. (2008), and recently updated by Gygli et al. (2019). Currently, the computed index is updated to include 220 regions and countries from 1970 to 2015. This source of data is generally considered as the largest database on the economics of globalization, including the financial globalization index. This dataset is related to various globalization measurements such as economic globalization, including trading globalization and financial globalization; social globalization; and political globalization. Moreover, the KOF database provides both de jure and de facto measurement for every single category. In this paper, we employ a financial globalization index (both de jure and de facto financial integration or globalization) as a measure for the degree of financial integration in China.
It is important to note the differences between financial integration de facto and financial integration de jure from various studies including Dreher (2006); Dreher et al. (2008); and Gygli et al. (2019). Financial integration de facto includes foreign direct investment, portfolio investment, international debt, and international reserves. The financial integration de facto can be considered a proxy for “real monetary value” for any national financial market. In contrast, financial integration de jure includes investment restrictions, capital account openness 1 (Chinn–Ito index of financial openness) and capital account openness 2 (Jahan–Wang index of the openness of the capital account). This financial integration de jure can be considered a good proxy for the management (intervention) of the government with regard to financial integration of the national financial market into the regional and the world economies and markets.
To explore whether financial integration influences economic growth in China, the World Development Indices (WDI) database provided by the World Bank are also utilized. In particular, the current Chinese GDP represents the term of aggregated output (Y), the Chinese domestic capital formation is proxied for the capital sector (K), and the unemployment rate is a proxy for Labor (L).
4. Research Results
4.1. Descriptive Statistics
As presented in Table 1, there is a difference between financial integration (FI) de facto and the financial integration de jure with regard to the estimates and the trends across the years. On average, the real financial activity is more integrated than the policies on financial integration from the Chinese government (26.58 versus 13.56). However, in 1970, the two indices were low (7.17 for FI de facto, and 13.56 for FI de jure) indicating an autarky system. From 1986, the FI de facto started to exceed the FI de jure, meaning that the Chinese financial system became more dynamic than the regulations imposed by the Chinese government. Especially, in 2001, 2002, and 2008, the FI de jure index was at the lowest (respectively 7.4, 7.4, and 7.1) indicating that the Chinese government had heavily managed the financial market. In contrast, regarding the global financial crisis in 2008 and 2009, the financial globalization de facto in China remained at a high level.
With the increase in financial integration de facto, other financial indices representing the financial depth of China appeared to be enhanced. For example, the money supply measured by broad money to GDP in China consistently increased from 1978 from 26.4% to 202% in 2017. The standard deviation presented in Table 1 indicates a large dispersion in the share of the money supply to GDP in China from 1970 to 2015. However, the trend of the money supply was quite stable.
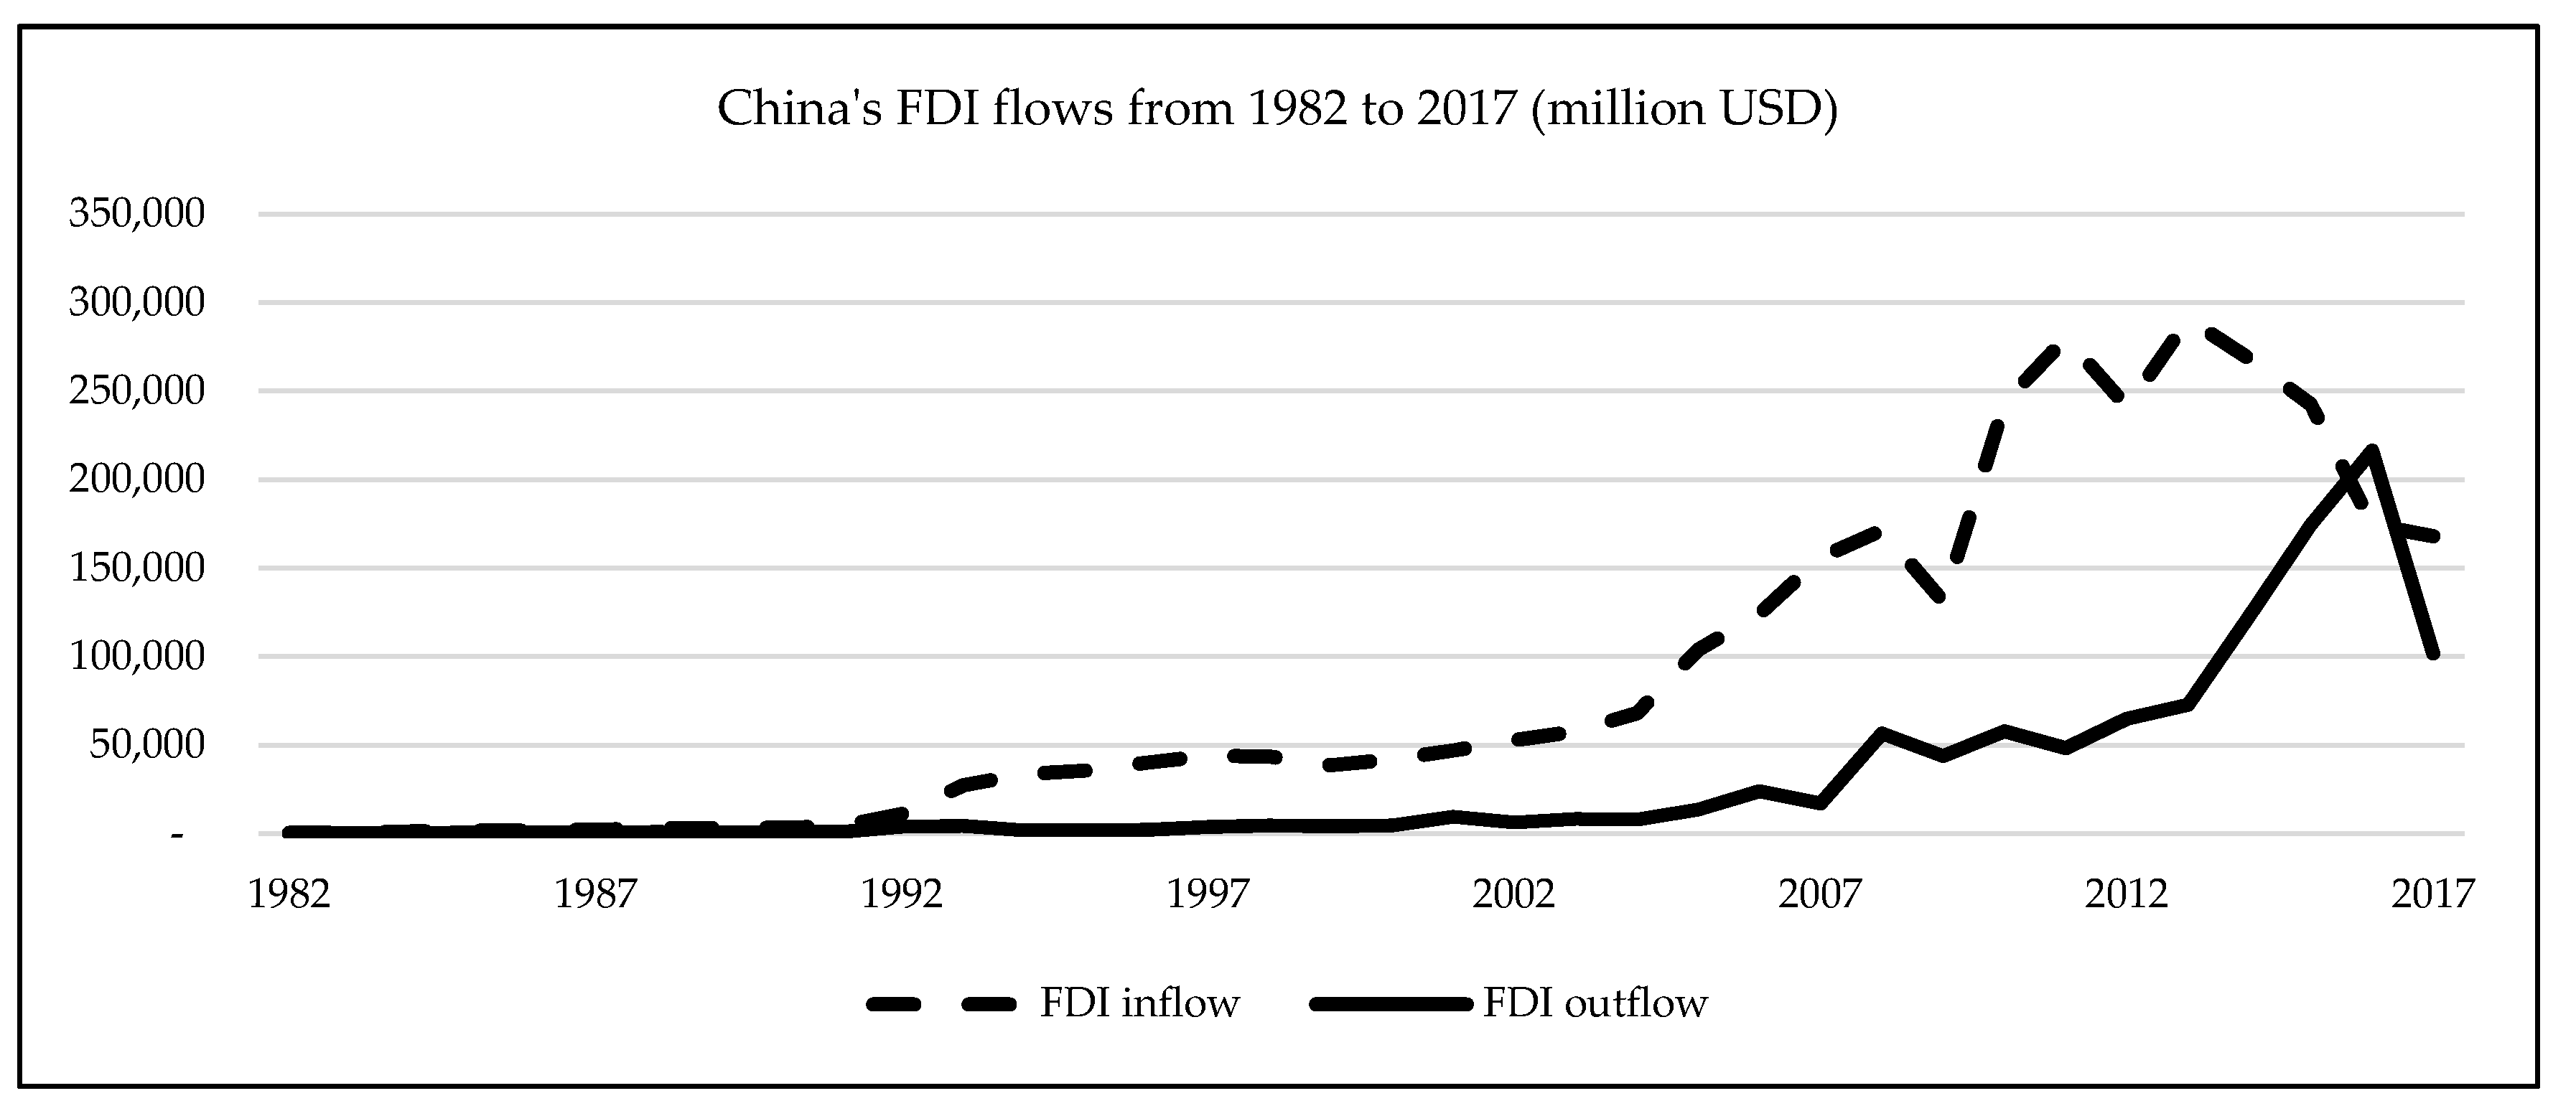
It is noted that the FDI flows in China have fluctuated significantly during the 2010–2017 period, as presented in Figure 1. Figure 1 indicates that China attracted a substantial amount of FDI from 2004 to 2013. Two breaks were identified in China’s FDI inflow. The first break occurred in 2009, a year after the global financial crisis in 2008. The second decline was in 2012, which was the peak of the global economic recession. However, from 2014, divestment was noted from China until now.
On the other hand, FDI outflow from Chinese investors continuously increased from 2007 onward, when the world financial crisis occurred. The investors appeared to recognize the business cycle of the world economy. China’s investment to overseas expanded in 2007 and remained at the same level before significantly increasing in 2013. Moreover, in 2012, China became the second-largest economy in the world.
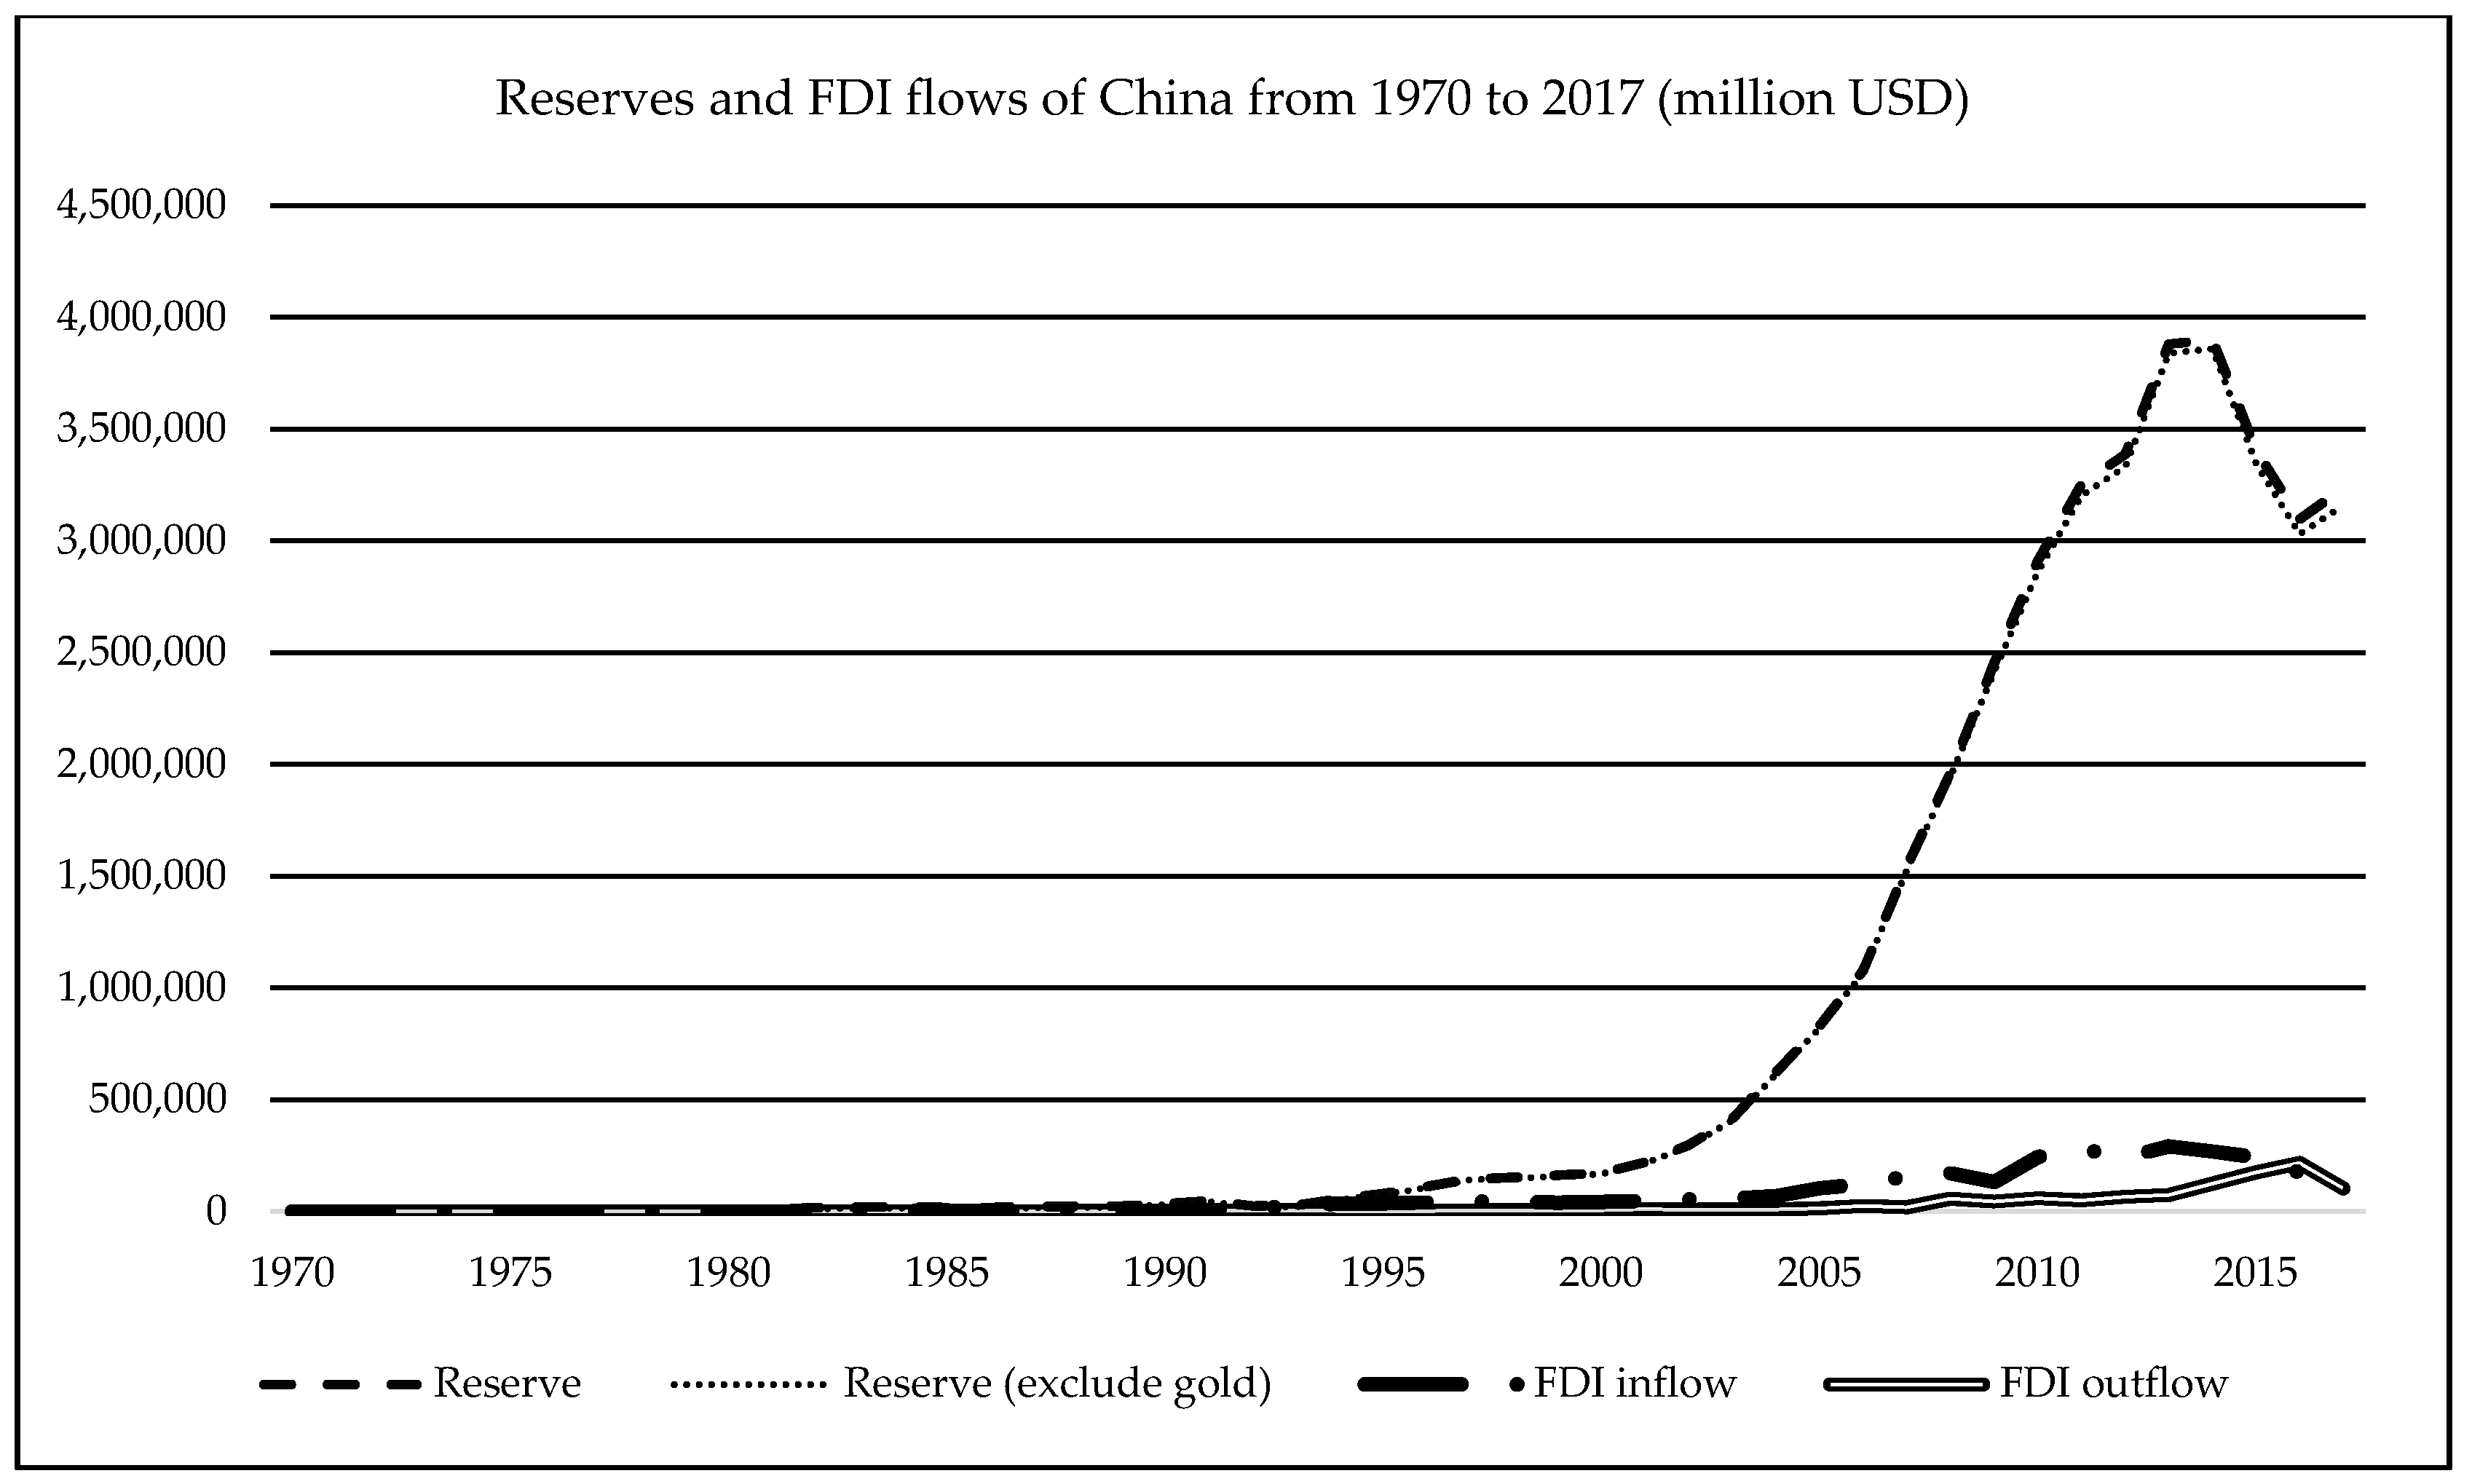
One substantially important factor contributing to the success of China is the support of macroeconomic strategy from the Chinese government. As presented in Figure 2, foreign exchange reserves are explicitly larger than FDI flows. The figure shows that the Chinese government started to accumulate its reserves from the early 2000s with a substantial increase in 2004. The rise of foreign exchange reserves halted in 2013–2014 and then reduced until 2016. It could be a coincidence that the People’s Bank of China started raising its foreign reserves just a few years before the world financial crisis in 2008, and continuously enhanced the reserves until the global recession in 2012. There were big jumps by many Chinese hi-tech companies into the global market that made the world think of the slogan “Made in China” again.
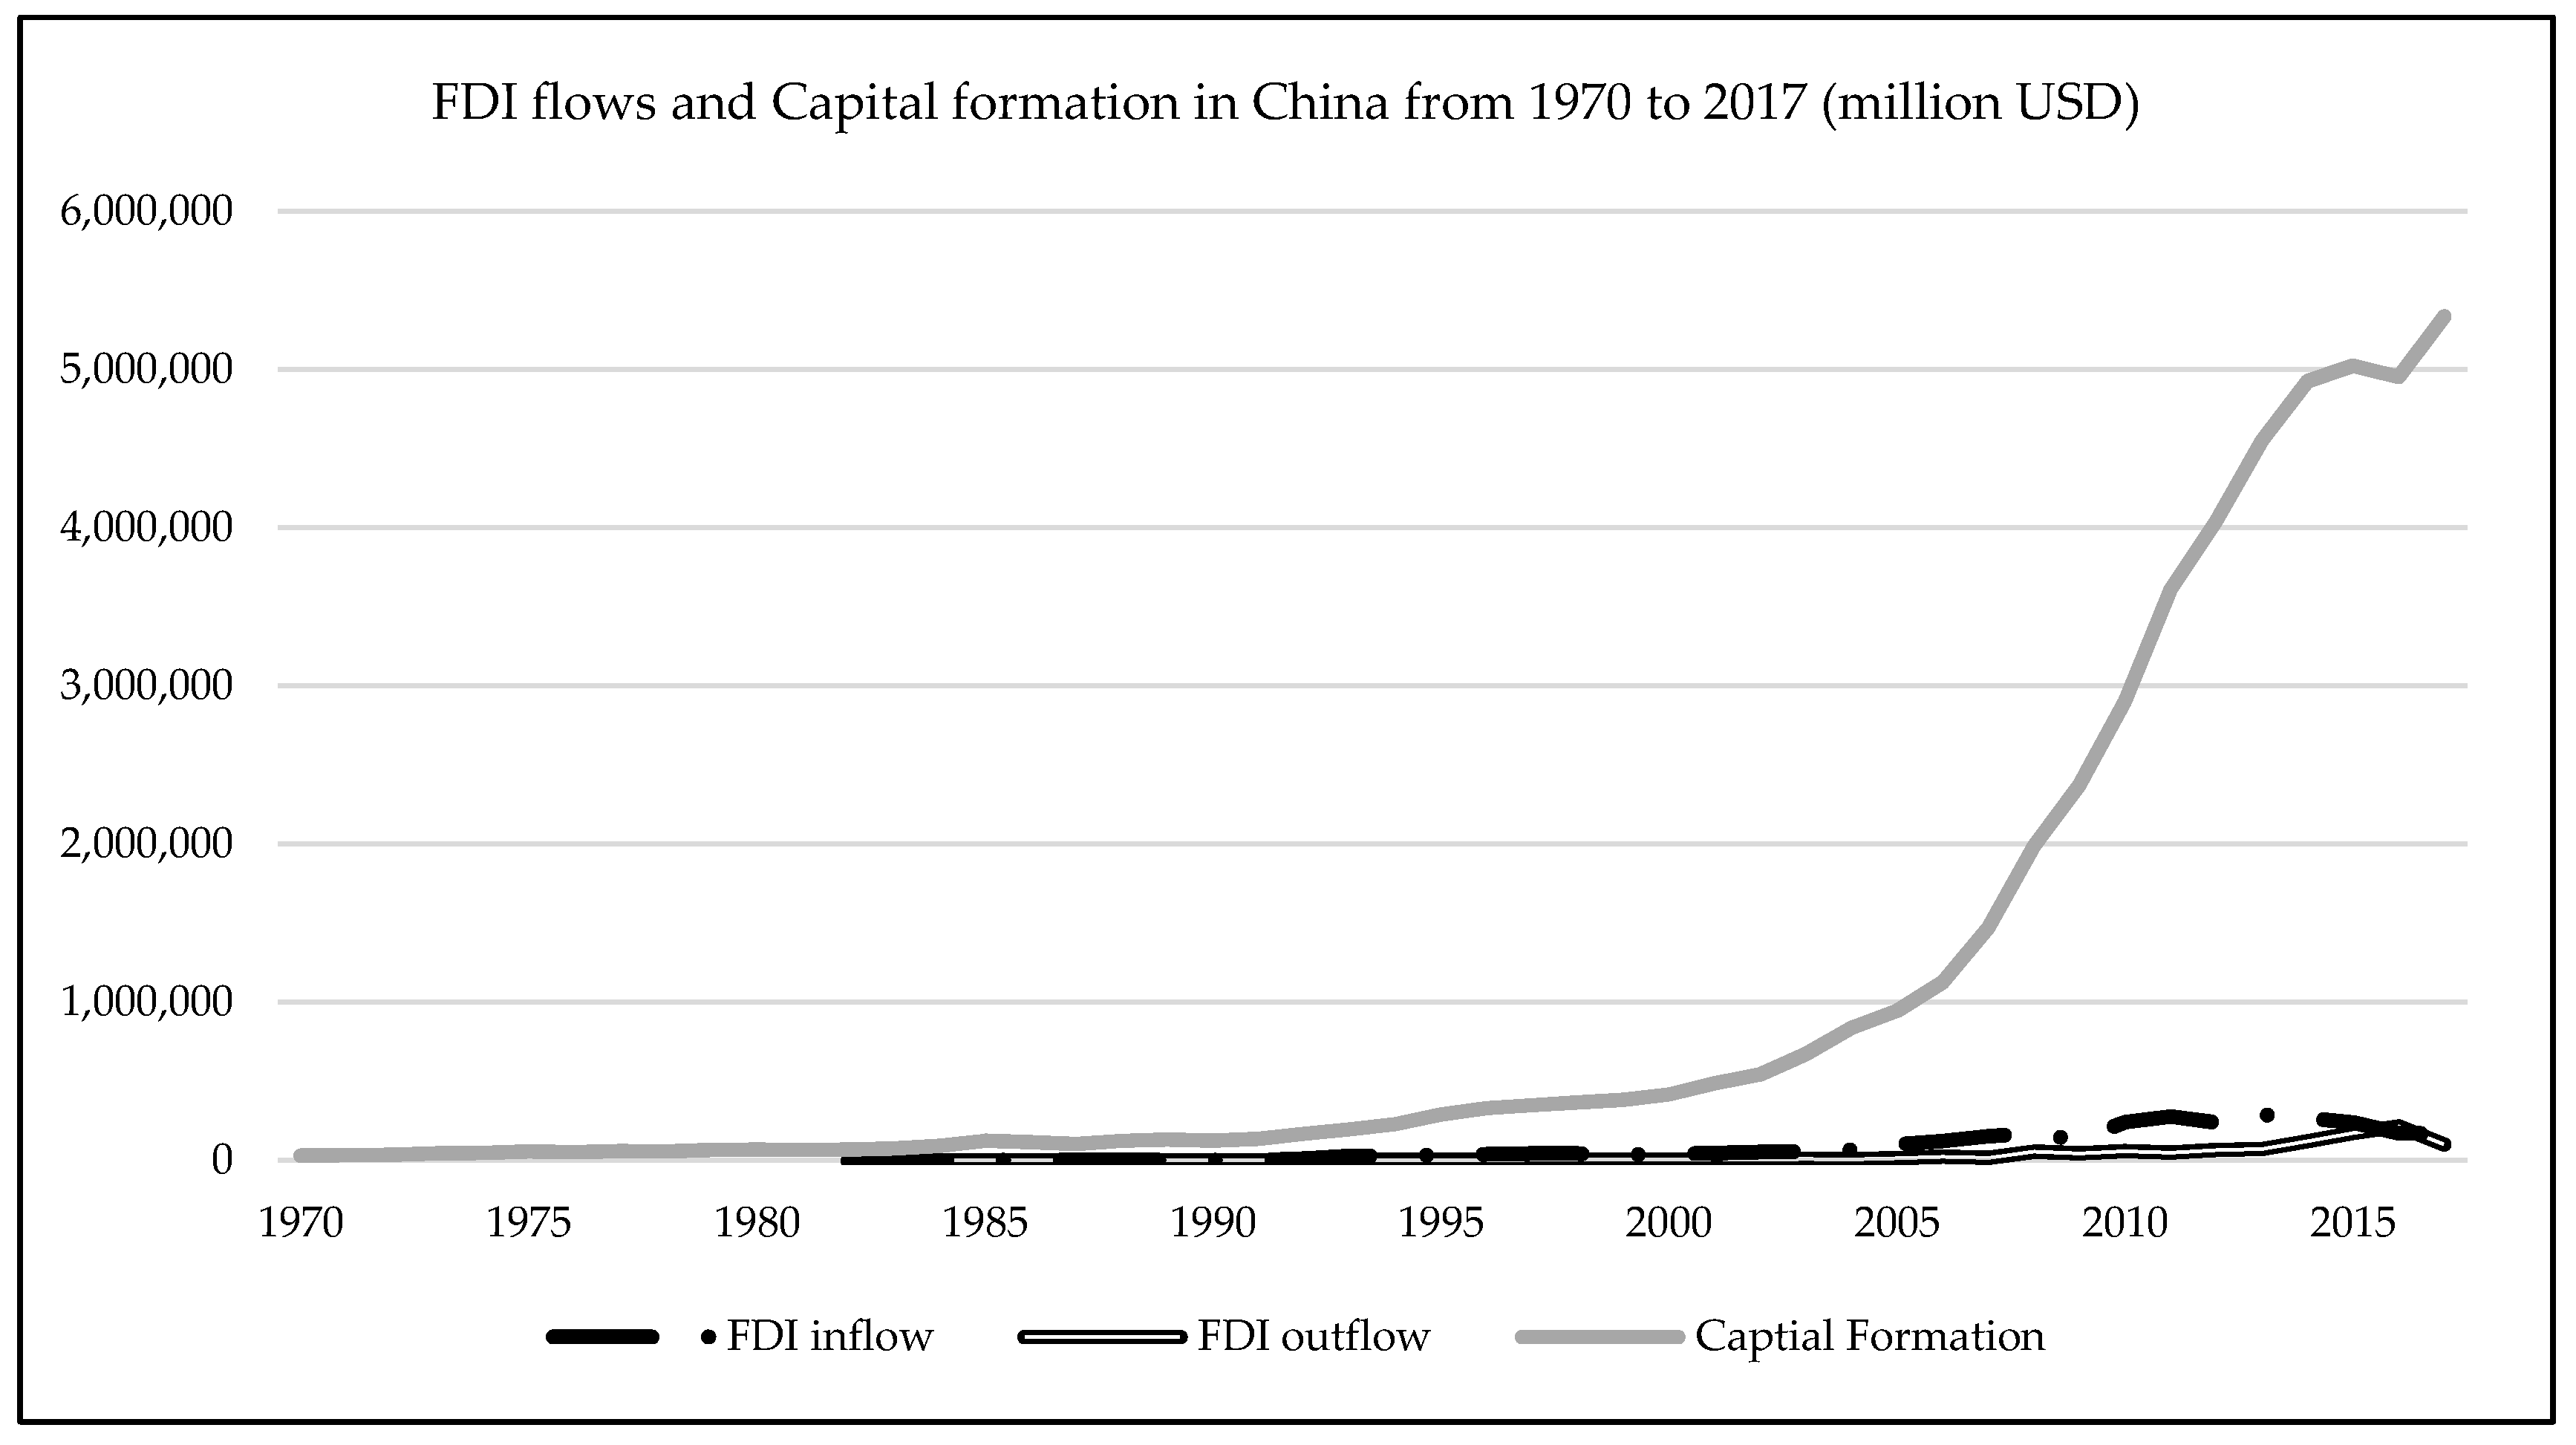
Comparing to FDI flows, capital formation in China’s economy is impressive. The total value in 2017 was 52 times higher than the FDI outflow and 32 times higher than the FDI inflow. An impressive increase in capital formation in China started from the mid-2000s just before the world financial crisis in 2008–2009. After a global recession in 2014, capital formation seemed to maintain its stable level. Figure 3 presents a significant accumulation of capital formation in China, which occurred during the two crises.
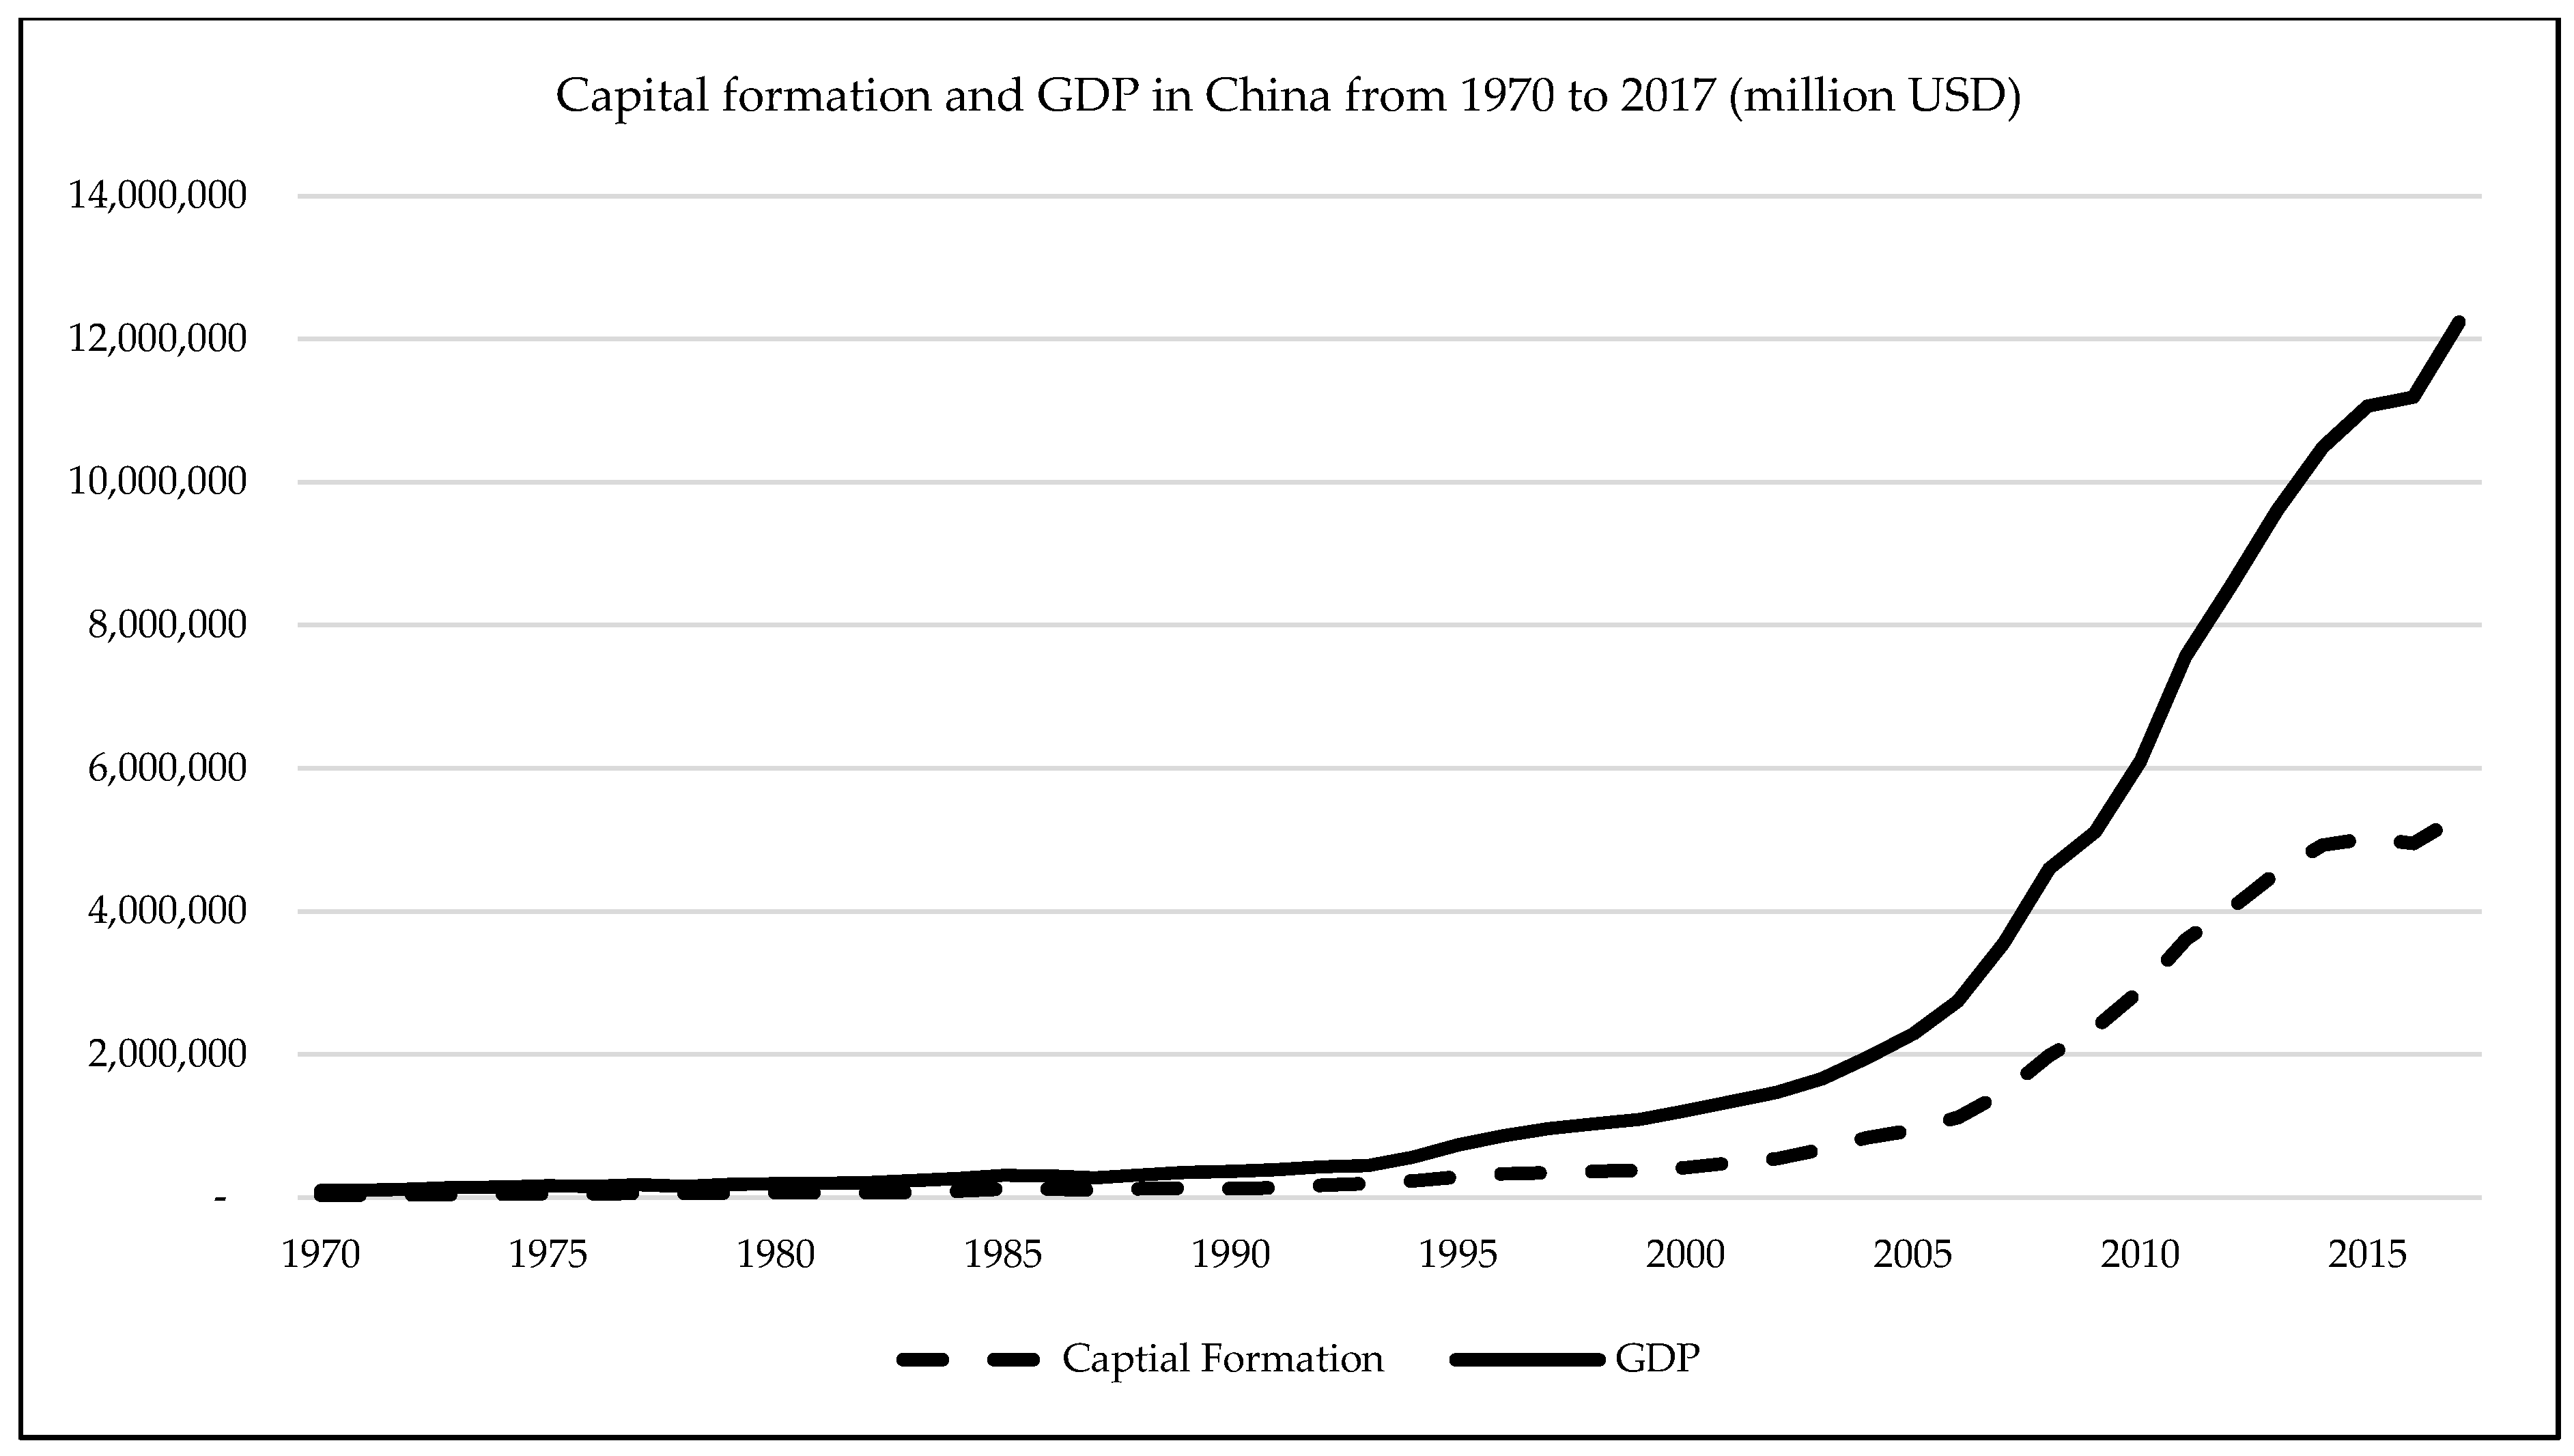
Regardless of the world financial crisis in 2008 and the global economic recession in 2012, economic development in China measured by current GDP continues increasing with incredible speed. Chinese GDP increased by six times from 2004 to 2017 from around two thousand billion USD to more than twelve thousand billion USD as presented in Figure 4.
Table 2 shows that financial integration (FI) de facto and capital formation have a strong correlation with GDP and GDP per capita. Regulations on financial globalization represented by the FI de jure have a weak correlation with economic growth in China during the researched period. Capital formation indicates an inter-relationship between economic growth and financial integration in China. Surprisingly, the unemployment rate appears to have a positive correlation with GDP, per capita GDP, and capital formation in China.
4.2. Co-Integration Analysis
The adopted methods (ARDL and ECM models) to identify whether financial integration is co-integrated with economic growth require various tests to be conducted, including the unit root test, unit root test with a breakpoint, test for co-integration in general, co-integration with a break, and a long-term co-integration test. In this sub-section, results from all related tests to identify the co-integration relationship between financial integration and economic growth in China are reported.
The initial requirement for the ARDL model is that all variables are stationary at I(0) or I(1). Table 3, which presents Dicky–Fuller and Zivot–Andrews unit root tests, indicates that there is no variable with the unit root at the first difference. Moreover, FI de jure is stationary at I(0). Thus, the ARDL and ECM models are more appropriate than the VAR in order to illustrate the co-integration relationship between financial integration and economic growth in China.
The Gregory–Hansen test and ARDL bound test are the basic tests used to examine co-integration in this paper. Due to the mixed stationary variables, the Johansen–Juselius test, which was developed on the basis of the VAR model, can provide biased conclusions on the co-integration between financial integration and economic growth in China. However, once the Gregory–Hansen and ARDL bound tests are conducted, the Johansen–Juselius test can also be considered a robustness test.
Table 4 reports that a co-integration relationship, including the structural breaks, occurred in models with the existence of financial integration de jure. In contrast, a vector co-integration with structural break did not occur in the models involving the financial integration de facto. As such, for long-term co-integration using the ARDL bound test, we employ breakpoints from the Gregory–Hansen test of co-integration with a structural break.
The result of the ARDL bound test confirms that long-term co-integration occurred between financial integration and economic growth in China. Results from Table 5 show that a long-term co-integration with a structural break is statistically significant at the 5% level in the models, including financial integration de jure. Moreover, models involving financial integration de facto appear to have a long-term co-integration relationship at the 1% significant level.
An interesting aspect of the results reported in Table 6 is that financial integration, especially the integration de facto, has inverse effects on economic development in the short run and the long run. In the short run, financial integration de facto positively affects economic development after one or two years. However, in the long term, the integration negatively affects either the GDP per capita or the GDP of China.
Table 6 indicates both long-run and short-run effects of financial integration on the economic growth in China with the presence of capital formation and unemployment rate, which are required in the Cobb–Douglas production function. The first two columns report results in which GDP per capita is a dependent variable. GPD is employed in models 3 and 4 in the last two columns. FI de jure and FI de facto are presented respectively in models 1 and 3, and 2 and 4. All the adjustments are negative and significant at the 1% level, meaning that the long-term co-integration is strongly valid in all models considered in this paper.
The final step in examining a long-term co-integration between financial integration and economic growth is to ensure all of the robustness tests are valid. Robustness tests are reported in Table 7. All four models cannot pass the Breusch–Godfrey test for higher-order serial correlation. Although these pre-tests and results can confirm the long term co-integration between financial integration and economic development in China, ARDL or ECM models do not indicate a true causality between the two. As such, the Granger test for causality between variables in those models is employed to examine the directions of causality among these factors.
5. Discussions
As presented in Table 6 of this paper, we consider that there are short-run gains and long-run pains of financial integration in China. In the short term, the integrated financial system encourages the movement of capital transactions across Chinese borders, then enhances economic growth after one or two years. The FDI flows and capital formation increased in China from the middle of the 2000s. However, in the long term, both financial integration de facto and de jure restrain Chinese economic growth.
In addition, financial integration de jure in China is always maintained at a low level, and it negatively affects Chinese economic growth in comparison to the financial integration de facto. Table 6 shows that the financial integration de jure does not affect economic growth in the short run. This evidence implies that the Chinese government is extremely careful with its integrated strategies. The Chinese government has heavily managed its financial system. The central bank increases its reserves and money supply at the same time in order to strengthen the domestic financial system.
The Granger causality test indicates a bidirectional causality between financial integration de facto and economic growth in China. It implies that not only is economic growth in China affected by financial integration de facto, but the level of integration of the financial market in China is also adjusted by its economic performance. This bidirectional causality confirms the view discussed in the literature on the complex relationship between financial development and economic growth. In contrast, the regulation on financial integration does not have any causal relationship with economic growth in China. It could be argued that as a “domestic protectionism” strategy, the Chinese government mostly focuses on securing its domestic market from potential volatility from the global financial market.
6. Conclusions and Policy Implications
China’s economic growth and development have been very impressive for the rest of the world, in particular for the developing and emerging countries. A strong economy and well-disciplined and developed financial markets have also attracted great attention and interest. This paper is conducted to provide additional evidence on the finance–growth nexus in this country. In particular, we examine whether financial integration fosters economic growth in China and whether long-term co-integration exists between these two interesting and important aspects of financial integration and economic growth. In this paper, the Cobb–Douglas production function is employed in order to establish and explore the link between the growth effects of financial integration in China. With a relatively small sample of yearly data, the ARDL model is utilized to identify long-term co-integration between financial integration and economic growth in China. In addition, we apply a Granger causality test to define and examine a causal relationship between these two interesting variables.
Findings from this paper indicate that financial integration, including financial integration de facto and financial integration de jure, has long-term co-integration with GDP and GDP per capita in China. The Chinese government has been successful by maintaining two opposite financial situations to foster national economic growth. On one hand, substantial capital flows occur across Chinese borders, represented by the financial integration de facto. The financial integration de facto is positively associated with economic growth in China in the short term. On the other hand, strict regulations on financial integration, represented by the financial integration de jure, from the Chinese government, do not appear to affect economic growth in the short run. However, in the long run, both de facto financial integration and de jure financial integration in China significantly reduce GDP and GDP per capita. These findings may imply that greater financial integration and globalization impose a potential risk on the Chinese economy by limiting economic growth. Moreover, the complexity of finance–growth nexus is confirmed by a Granger bidirectional causality between financial integration and economic growth in China.
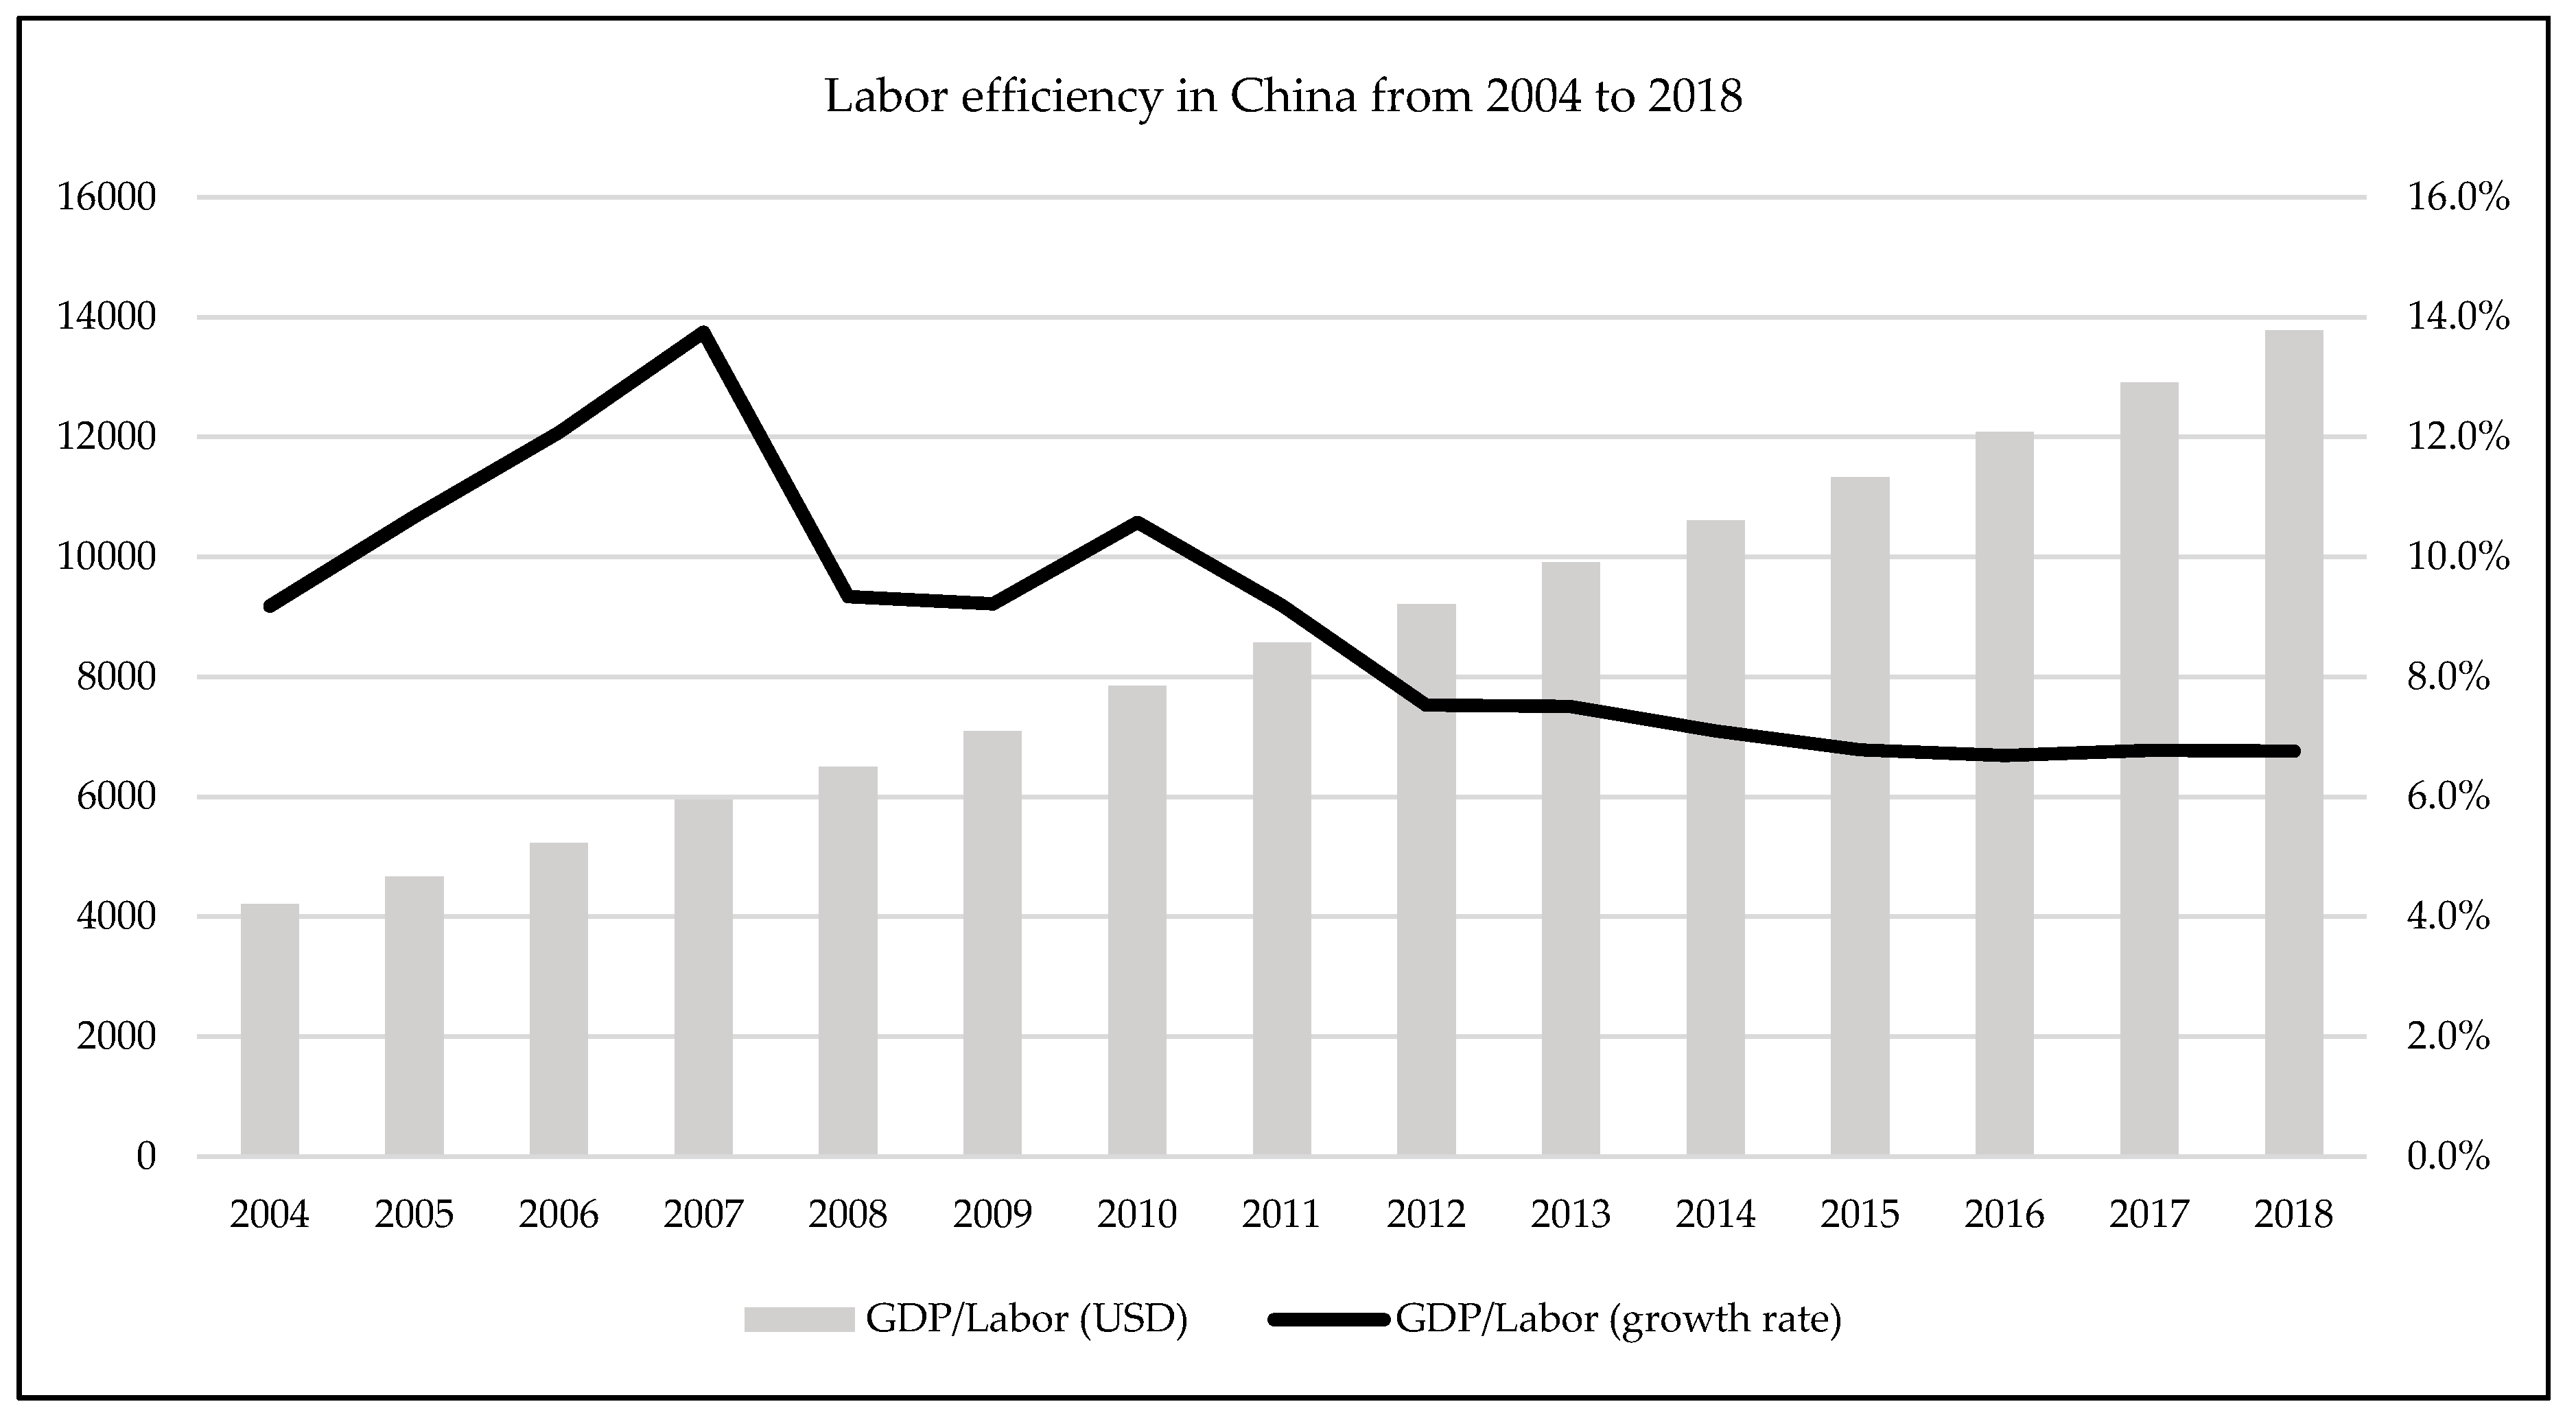
Implications for policy have emerged based on these empirical findings. First, in the short term, the Chinese government should utilize the growth effect of financial integration. It means that further integration with the global economy will enhance and improve economic growth in China. However, due to a negative association between financial integration and economic growth in the long run, the Chinese government should carefully reconsider its financial integration strategies to ensure that financial integration continues enhancing economic growth. For other developing countries, improving financial integration may be one of the most important steps to enhance economic growth. Second, unemployment is an ambiguous element affecting Chinese economic growth. A positive relationship between the unemployment rate and economic growth in the long term raises a concern for the Chinese government about its labor efficiency and/or national productivity in the future. For example, Figure 7 indicates that the growth rate of labor efficiency in China, measured by the growth rate of GDP per labor, has continuously declined since 2010. As such, expanding the economic scale or improving labor efficiency is a very important strategy for the Chinese government in the future. This view is also true for other emerging markets in order to continuously improve labor efficiency and total factor productivity of the nation.
Last but not least, our current paper could not cover various aspects of financial integration, which is generally considered as a complex issue in the modern world. First, the choice of time-series analysis at the aggregate level leads to the challenge of a small sample—a yearly dataset. The challenge was that we had limited options to select control variables. Adding more variables into the empirical analyses leads to a lower degree of freedom which is not optimal for time-series analysis. The more variables are employed, the lower the degree of efficiency of estimated results. As such, we could not add some classical variables which are usually employed in panel studies on the finance–growth nexus, for example, agriculture, industry, or human capital. Second, the non-linear relationship between finance and growth was not tested in our current study. The ARDL model estimates the linear relationship between the dependent variable and other regressors. As such, further studies can be conducted using quarterly or monthly data on financial integration and economic growth in order to examine a non-linear relationship between finance and growth.
Author Contributions
D.H.V.: Conceptualization, Validation, Supervision, Writing—original draft preparation, Writing—review and editing. A.T.V.: Formal analysis, Data curation. C.M.H.: Methodology, Writing—original draft preparation, Writing—review and editing, Data curation. All authors have read and agreed to the published version of the manuscript.
Funding
This research is funded by Ho Chi Minh City Open University, grant number E2019.24.3.
Conflicts of Interest
The authors declare no conflict of interest.
References
- Ang, James B. 2008a. A survey of recent developments in the literature of finance and growth. Journal of Economic Surveys 22: 536–76. [Google Scholar] [CrossRef]
- Ang, James B. 2008b. What are the mechanisms linking financial development and economic growth in Malaysia? Economic Modelling 25: 38–53. [Google Scholar] [CrossRef]
- Ang, James B. 2010. Does foreign aid promote growth? Exploring the role of financial liberalization. Review of Development Economics 14: 197–212. [Google Scholar] [CrossRef]
- Ang, James B., and Warwick J. McKibbin. 2007. Financial liberalization, financial sector development and growth: Evidence from Malaysia. Journal of Development Economics 84: 215–33. [Google Scholar] [CrossRef]
- Anwar, Sajid, and Arusha Cooray. 2012. Financial development, political rights, civil liberties and economic growth: Evidence from South Asia. Economic Modelling 29: 974–81. [Google Scholar] [CrossRef]
- Anwar, Sajid, and Sizhong Sun. 2011. Financial development, foreign investment and economic growth in Malaysia. Journal of Asian Economics 22: 335–42. [Google Scholar] [CrossRef]
- Arestis, Philip, Georgios Chortareas, and Georgios Magkonis. 2014. The financial development and growth nexus: A meta-analysis. Journal of Economic Surveys 29: 549–65. [Google Scholar] [CrossRef] [Green Version]
- Bekaert, Geert, Campbell R. Harvey, and Christian Lundblad. 2005. Does financial liberalization spur growth? Journal of Financial Economics 77: 3–55. [Google Scholar] [CrossRef] [Green Version]
- Bussière, Matthieu, and Marcel Fratzscher. 2008. Financial openness and growth: Short-run gain, long-run pain? Review of International Economics 16: 69–95. [Google Scholar] [CrossRef]
- Cheung, Yin-Wong, Menzie D. Chinn, and Eiji Fujii. 2005. Dimensions of financial integration in greater China: Money markets, banks and policy effects. International Journal of Finance & Economics 10: 117–32. [Google Scholar]
- Dreher, Axel. 2006. Does globalization affect growth? Evidence from a new index of globalization. Applied Economics 38: 1091–110. [Google Scholar] [CrossRef]
- Dreher, Axel, Noel Gaston, and Pim Martens. 2008. Measuring Globalisation: Gauging its Consequences. New York: Springer. [Google Scholar]
- Durusu-Ciftci, Dilek, M. Serdar Ispir, and I. Hakan Yetkiner. 2017. Financial development and economic growth: Some theory and more evidence. Journal of Policy Modeling 39: 290–306. [Google Scholar] [CrossRef]
- Edison, Hali J., Ross Levine, Luca Ricci, and Torsten Sløk. 2002. International financial integration and economic growth. Journal of International Money and Finance 21: 749–76. [Google Scholar] [CrossRef] [Green Version]
- Eichengreen, Barry, Rachita Gullapalli, and Ugo Panizza. 2011. Capital account liberalization, financial development and industry growth: A synthetic view. Journal of International Money and Finance 30: 1090–106. [Google Scholar] [CrossRef] [Green Version]
- Fry, Maxwell J. 1989. Financial development: Theories and recent experience. Oxford Review of Economic Policy 5: 13–28. [Google Scholar] [CrossRef]
- Girardin, Eric, and Zhenya Liu. 2007. The financial integration of China: New evidence on temporally aggregated data for the A-share market. China Economic Review 18: 354–71. [Google Scholar] [CrossRef]
- Goldsmith, Raymond William. 1969. Financial Structure and Development. New Haven: Yale University Press. [Google Scholar]
- Gourinchas, Pierre-Olivier, and Olivier Jeanne. 2006. The elusive gains from international financial integration. The Review of Economic Studies 73: 715–41. [Google Scholar] [CrossRef] [Green Version]
- Greenwood, Jeremy, and Boyan Jovanovic. 1990. Financial development, growth, and the distribution of income. Journal of Political Economy 98: 1076–107. [Google Scholar] [CrossRef] [Green Version]
- Groenewold, Nicolaas, Sam Hak Kan Tang, and Yanrui Wu. 2004. The dynamic interrelationships between the greater China share markets. China Economic Review 15: 45–62. [Google Scholar] [CrossRef]
- Guiso, Luigi, Tullio Jappelli, Mario Padula, and Marco Pagano. 2004. Financial market integration and economic growth in the E.U. Economic Policy 19: 524–77. [Google Scholar] [CrossRef] [Green Version]
- Gurley, John G., and Edward S. Shaw. 1955. Financial aspects of economic development. The American Economic Review 45: 515–38. [Google Scholar]
- Gygli, Savina, Florian Haelg, Niklas Potrafke, and Jan-Egbert Sturm. 2019. The KOF globalization index–revisited. The Review of International Organizations 14: 1–32. [Google Scholar]
- Hatemi-J, Abdulnasser, and Eduardo D. Roca. 2004. Do birds of the same feather flock together?: The case of the Chinese states equity markets. Journal of International Financial Markets, Institutions and Money 14: 281–94. [Google Scholar] [CrossRef]
- Hicks, John Richard. 1969. A Theory of Economic History. Oxford: Oxford University Press. [Google Scholar]
- Huang, Bwo-Nung, Chin-Wei Yang, and John Wei-Shan Hu. 2000. Causality and co-integration of stock markets among the United States, Japan and the South China Growth Triangle. International Review of Financial Analysis 9: 281–97. [Google Scholar] [CrossRef]
- Imbs, Jean. 2006. The real effects of financial integration. Journal of International Economics 68: 296–324. [Google Scholar] [CrossRef] [Green Version]
- King, Robert G., and Ross Levine. 1993. Finance, entrepreneurship and growth. Journal of Monetary Economics 32: 513–42. [Google Scholar] [CrossRef]
- Kose, M. Ayhan, Eswar S. Prasad, and Marco E. 2003. Financial integration and macroeconomic volatility. IMF Staff Papers 50: 119–42. [Google Scholar] [CrossRef] [Green Version]
- Lane, Philip R., and Gian Maria Milesi-Ferretti. 2003. International financial integration. IMF Staff Papers 50: 82–113. [Google Scholar]
- Levine, Ross. 2005. Finance and growth: Theory and evidence. Handbook of Economic Growth 1: 865–934. [Google Scholar]
- Levine, Ross, and Sara Zervos. 1998. Stock markets, banks, and economic growth. American Economic Review 88: 537–58. [Google Scholar]
- Levine, Ross, Norman Loayza, and Thorsten Beck. 2000. Financial intermediation and growth: Causality and causes. Journal of Monetary Economics 46: 31–77. [Google Scholar] [CrossRef] [Green Version]
- Loizos, Konstantinos. 2018. The financial repression-liberalization debate: Taking stock, looking for a synthesis. Journal of Economic Surveys 32: 440–68. [Google Scholar] [CrossRef]
- McKinnon, Ronald I. 1973. Money and Capital in Economic Development. Washington: Brookings Institution Press. [Google Scholar]
- Menyah, Kojo, Saban Nazlioglu, and Yemane Wolde-Rufael. 2014. Financial development, trade openness and economic growth in African countries: New insights from a panel causality approach. Economic Modelling 37: 386–94. [Google Scholar] [CrossRef]
- Nguyen, Ha Minh, Ngoc Hoang Bui, and Duc Hong Vo. 2019a. The Nexus between Economic Integration and Growth: Application to Vietnam. Annals of Financial Economics 14. [Google Scholar] [CrossRef]
- Nguyen, Ha Minh, Ngoc Hoang Bui, Duc Hong Vo, and Michael McAleer. 2019b. Energy consumption and economic growth: Evidence from Vietnam. Journal of Reviews on Global Economics 8: 350–61. [Google Scholar] [CrossRef] [Green Version]
- Okazaki, Kumiko, and Tomoyuki Fukumoto. 2011. Macro-Financial Linkage and Financial Deepening in China after the Global Financial Crisis (No. 11-E-02). Tokyo: Institute for Monetary and Economic Studies, Bank of Japan. [Google Scholar]
- Peia, Oana, and Kasper Roszbach. 2015. Finance and growth: Time series evidence on causality. Journal of Financial Stability 19: 105–18. [Google Scholar] [CrossRef]
- Phuc, Nguyen Van, and Vo Hong Duc. 2019. Macroeconomics Determinants of Exchange Rate Pass-through: New Evidence from the Asia-Pacific Region. Emerging Markets Finance and Trade 24: 1–16. [Google Scholar] [CrossRef]
- Robinson, Joan. 1979. The generalization of the general theory. In The Generalization of the General Theory and Other Essays. London: Palgrave Macmillan, pp. 1–76. [Google Scholar]
- Shaw, Edward Stone. 1973. Financial Deepening in Economic Development. New York: Oxford University Press. [Google Scholar]
- Studart, Rogério. 1993. Financial repression and economic development: Towards a post-Keynesian alternative. Review of Political Economy 5: 277–98. [Google Scholar] [CrossRef]
- Vo, Anh The, Chi Minh Ho, and Duc Hong Vo. 2019a. Understanding the Exchange Rate Pass-through to Consumer Prices in Vietnam using the SVAR Approach. International Journal of Emerging Markets 15: 971–89. [Google Scholar] [CrossRef]
- Vo, Duc Hong, Son Van Huynh, Anh The Vo, and Dao Thi-Thieu Ha. 2019b. The importance of the financial derivatives markets to economic development in the world’s four major economies. Journal of Risk and Financial Management 12: 35. [Google Scholar] [CrossRef] [Green Version]
- Vo, Duc Hong, Phuc Van Nguyen, Ha Minh Nguyen, Anh The Vo, and Thang Cong Nguyen. 2019c. Derivatives Market and Economic Growth Nexus: Policy Implications for Emerging Markets. The North American Journal of Economics and Finance. in press. [Google Scholar] [CrossRef]
- Vo, Duc Hong, Tan Ngoc Vu, Anh The Vo, and Michael McAleer. 2019d. Modeling the Relationship between Crude Oil and Agricultural Commodity Prices. Energies 12. [Google Scholar] [CrossRef] [Green Version]
- Vo, Duc Hong, Anh The Vo, Chi Minh Ho, and Ha Minh Nguyen. 2020. The Role of Renewable Energy, Alternative and Nuclear Energy in Mitigating Carbon Emissions in the CPTPP Countries. Renewable Energy. forthcoming. [Google Scholar] [CrossRef]
- Wang, Zhi, and G. Edward Schuh. 2000. Economic integration among Taiwan, Hong Kong and China: A computable general equilibrium analysis. Pacific Economic Review 5: 229–62. [Google Scholar] [CrossRef]
- Wolde-Rufael, Yemane. 2009. Re-examining the financial development and economic growth nexus in Kenya. Economic Modelling 26: 1140–46. [Google Scholar] [CrossRef]
- Xu, Guangdong, and Binwei Gui. 2019. From financial repression to financial crisis? The case of China. Asian-Pacific Economic Literature 33: 48–63. [Google Scholar] [CrossRef]
- Yang, Jian, Jame W. Kolari, and Insik Min. 2003. Stock market integration and financial crises: The case of Asia. Applied Financial Economics 13: 477–86. [Google Scholar] [CrossRef]
- Yin, Haitao, and Chunbo Ma. 2009. International integration: A hope for a greener China? International Marketing Review 26: 348–67. [Google Scholar] [CrossRef]
| 1 |
Figure 1.
FDI flows in China from 1982 to 2017 (million USD).

Figure 2.
Exchange rate reserve and FDI flows in China from 1970 to 2017 (million USD).

Figure 3.
Flows and capital formation in China from 1970 to 2017 (million USD).

Figure 4.
Capital formation and current GDP in China from 1970 to 2017 (million USD).

Figure 5.
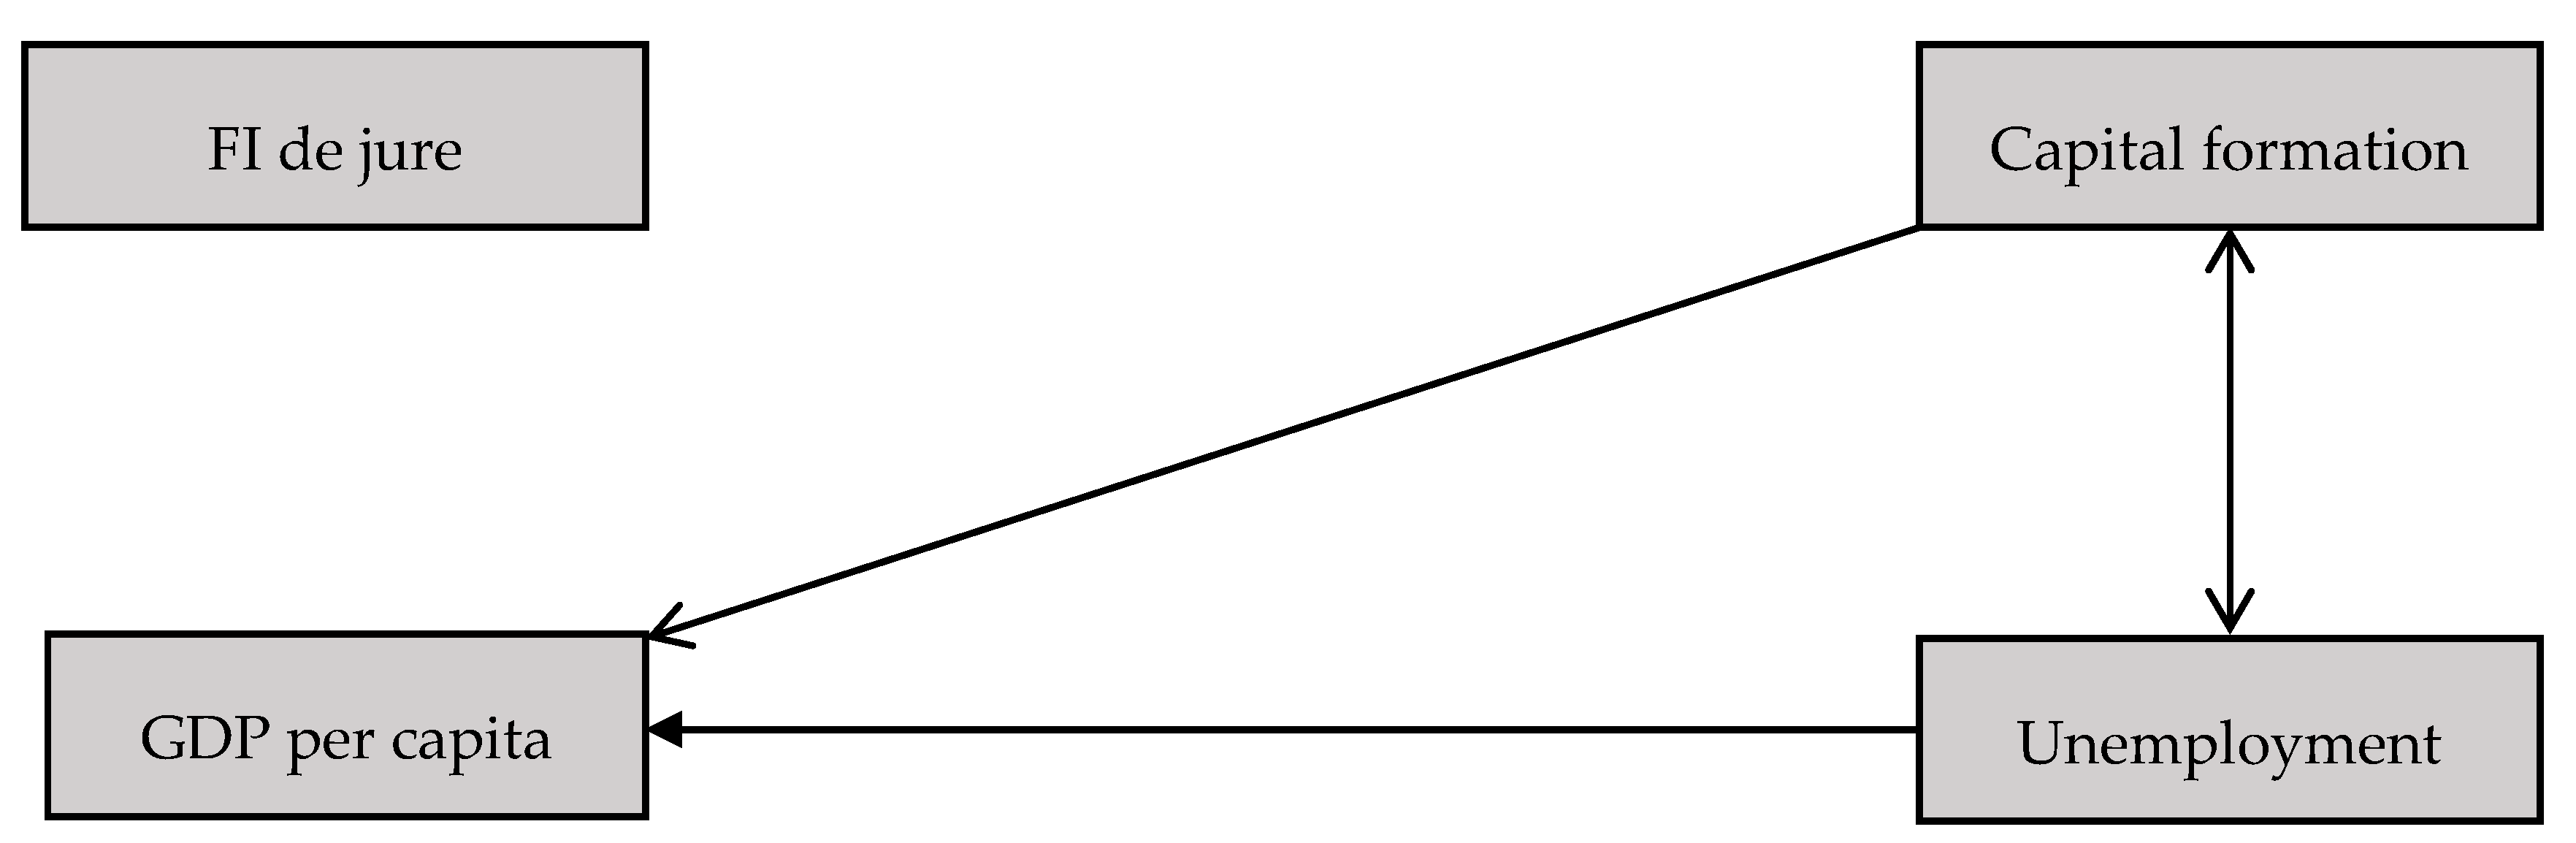
Causal link among variables in model 3 (the arrow implies the causal direction).

Figure 6.
Causal link among variables in model 4 (the arrow implies the causal direction).

Figure 7.
Labor efficiency in China from 2004 to 2018 (data from the World Development Indicators database).
Figure 7.
Labor efficiency in China from 2004 to 2018 (data from the World Development Indicators database).


Table 1.
The descriptive statistics of variables.
| Variable | Obs | Mean | Std. Dev. | Min | Max |
|---|---|---|---|---|---|
| Year | 46 | 1993 | 13 | 1970 | 2015 |
| FI de facto | 46 | 26.58 | 15.91 | 6.91 | 49.73 |
| FI de Jure | 46 | 13.56 | 3.16 | 7.13 | 21.21 |
| PI | 46 | 71.03 | 18.73 | 39.19 | 93.60 |
| % of FDI inflow to GDP | 34 | 2.92% | 1.69% | 0.21% | 6.19% |
| % of FDI outflow to GDP | 34 | 0.53% | 0.37% | 0.02% | 1.58% |
| % Money to GDP | 39 | 108.91% | 53.74 | 24.19% | 202.07% |
| FDI inflow (mil $) | 34 | 82,900 | 95,300 | 430 | 291,000 |
| FDI outflow (mil $) | 34 | 22,500 | 39,000 | 44 | 174,000 |
| Capital Formation (mil $) | 46 | 5,780,000 | 8,990,000 | 74,500 | 31,300,000 |
| GDP (mil $) | 46 | 1,960,000 | 3,010,000 | 92,600 | 11,100,000 |
| GDP per capita | 46 | 1497.70 | 2196.54 | 113.16 | 8069.21 |
| GDP growth | 46 | 9.24 | 3.59 | (1.57) | 19.30 |
| Unemployment rate | 37 | 3.39 | 0.98 | 1.80 | 5.40 |
Table 2.
Correlation matrix among variables.
| Log (GDP) | Log (GDP pc) | Log (FI de Facto) | Log (FI de Jure) | Log (Capital) | Unemployment | |
|---|---|---|---|---|---|---|
| Log (GDP) | 1 | |||||
| Log (GDPpc) | 0.9990 | 1 | ||||
| Log (FI de facto) | 0.8996 | 0.8819 | 1 | |||
| Log (FI de jure) | 0.1859 | 0.1988 | 0.0359 | 1 | ||
| Log (Capital) | 0.9822 | 0.9740 | 0.9600 | 0.1374 | 1 | |
| Unemployment | 0.4131 | 0.4269 | 0.0981 | 0.2110 | 0.3412 | 1 |
Table 3.
Unit root test processed by Dicky–Fuller and Zivot–Andrews methods.
| Dicky–Fuller | Zivot–Andrews | |||
|---|---|---|---|---|
| Variable | Level | First Difference | Level | First Difference |
| GDP | −0.998 | −3.548 ** | −2.617 | −3.255 ** |
| GDP per capita | −1.135 | −3.545 ** | −2.610 | −3.245 ** |
| FI de facto | −1.189 | −4.193 *** | −3.301 | −3.278 ** |
| FI de jure | −4.392 *** | −6.056 *** | −5.013 ** | −4.942 ** |
| Capital | −2.106 | −4.050 *** | −4.388 | −3.320 ** |
| Unemployment | −1.468 | −4.570 *** | −5.739 *** | −5.362 ** |
**, *** Respectively represent 5%, and 1% level of statistical significance.
Table 4.
Co-integration with break by Gregory–Hansen test.
| Model | Break Type | Has Co-Integration | Breakpoint |
|---|---|---|---|
| 1 GDPpc (FIdj, Capital, Unemploy) | Level | No | |
| Regime | Yes | 1987 | |
| Trend | No | ||
| Regime and Trend | Yes | 1986 | |
| 2 GDPpc (FIdf, Capital, Unemploy) | Level | No | |
| Regime | No | ||
| Trend | No | ||
| Regime and Trend | No | ||
| 3 GDP (FIdj, Capital, Unemploy) | Level | No | |
| Regime | Yes | 1987 | |
| Trend | No | ||
| Regime and Trend | Yes | 1986 | |
| 4 GDP (FIdf, Capital, Unemploy) | Level | No | |
| Regime | No | ||
| Trend | No | ||
| Regime and Trend | No |
Table 5.
The ARDL bound test for long-term co-integration.
| Mode 1 | Optimal Lags | Breakpoint | F-Statistic |
|---|---|---|---|
| GDPpc (FIdj, Capital, Unemploy) | 3, 2, 4, 4 | 1987 | 4.928 ** |
| GDPpc (FIdf, Capital, Unemploy) | 2, 3, 0, 4 | no | 9.325 *** |
| GDP (FIdj, Capital, Unemploy) | 3, 2, 4, 4 | 1987 | 4.740 ** |
| GDP (FIdf, Capital, Unemploy) | 2, 3, 0, 4 | no | 9.187 *** |
**, *** Respectively represent 5%, and 1% level of statistical significance.
Table 6.
Long-run and short-run results on the effect of financial integration on economic development in China.
Table 6.
Long-run and short-run results on the effect of financial integration on economic development in China.
| Variable | Mode 1 (GDP Per Capita) | Mode 2 (GDP Per Capita) | Mode 3 (GDP) | Mode 4 (GDP) |
|---|---|---|---|---|
| Adjustment | −0.242 *** | −0.272 *** | −0.253 *** | −0.269 *** |
| (0.0696) | (0.0537) | (0.0729) | (0.0528) | |
| Long-run effect | ||||
| FI de jure | −0.445 * | −0.427 * | ||
| (0.235) | (0.225) | |||
| FI de facto | −0.844 *** | −0.766 *** | ||
| (0.246) | (0.248) | |||
| Capital formation | 0.878 *** | 1.017 *** | 0.919 *** | 1.040 *** |
| (0.101) | (0.0847) | (0.0962) | (0.0854) | |
| Unemployment | 0.176 | 0.158 * | 0.162 | 0.169 * |
| (0.156) | (0.0877) | (0.149) | (0.0879) | |
| Short-run effect | ||||
| ∆FI de facto (Lag 1) | 0.336 *** | 0.326 *** | ||
| (0.113) | (0.113) | |||
| ∆FI de facto (Lag 2) | 0.273 *** | 0.271 *** | ||
| (0.0925) | (0.0923) | |||
| ∆GDP per capita (Lag 1) | 0.237 | 0.253 * | ||
| (0.179) | (0.123) | |||
| ∆GDP per capita (Lag 2) | −0.405 ** | |||
| (0.168) | ||||
| ∆GDP (Lag 1) | 0.242 | 0.243 * | ||
| (0.177) | (0.122) | |||
| ∆GDP (Lag 2) | −0.398 ** | |||
| (0.167) | ||||
| ∆Capital formation (Lag 3) | 0.486 *** | 0.472 *** | ||
| (0.157) | (0.156) | |||
| ∆Unemployment | −0.0837 | −0.114 ** | −0.0831 | −0.113 ** |
| (0.0598) | (0.0408) | (0.0597) | (0.0406) | |
| ∆Unemployment (Lag 2) | −0.103 * | 0.0559 | −0.100 * | 0.0573 |
| (0.0534) | (0.0399) | (0.0530) | (0.0397) | |
| ∆Unemployment (Lag 3) | −0.0455 | −0.0843 ** | −0.0452 | −0.0829 ** |
| (0.0521) | (0.0332) | (0.0520) | (0.0331) | |
| Constant | −4.191 *** | −5.393 *** | 0.629 | 0.0345 |
| (1.306) | (1.161) | (0.517) | (0.436) | |
| Observations | 33 | 33 | 33 | 33 |
| R-squared | 0.836 | 0.848 | 0.828 | 0.841 |
Note: Standard errors in parentheses *, **, *** respectively represent 10%, 5%, and 1% level of statistical significance. Only significant variables are reported.
Table 7.
Robustness tests.
| Test | Mode 1 (GDP Per Capita) | Mode 2 (GDP Per Capita) | Mode 3 (GDP) | Mode 4 (GDP) |
|---|---|---|---|---|
| Durbin–Watson | 0.2207 | 0.1066 | 0.2389 | 0.1059 |
| LM test with ARCH effect | 0.3185 | 0.7143 | 0.3702 | 0.7884 |
| Breusch–Godfrey test | 0.0837 * | 0.0512 * | 0.0994 * | 0.0508 * |
| White’s test | 0.4180 | 0.4180 | 0.4180 | 0.4180 |
| Heteroskedasticity | 0.4066 | 0.5030 | 0.4641 | 0.4722 |
Durbin–Watson test for first-order serial correlation, LM test with ARCH effect tests for heteroskedasticity with ARCH effect, Breusch–Godfrey test for higher-order autocorrelation, White’s test for testing homoscedasticity, and the last test is for heteroscedasticity. Reported results are p-values of robustness tests. * Respectively represent 10% level of statistical significance.
© 2020 by the authors. Licensee MDPI, Basel, Switzerland. This article is an open access article distributed under the terms and conditions of the Creative Commons Attribution (CC BY) license (http://creativecommons.org/licenses/by/4.0/).
Share and Cite
MDPI and ACS Style
Vo, D.H.; Vo, A.T.; Ho, C.M. Does Financial Integration Enhance Economic Growth in China? Economies 2020, 8, 65. https://doi.org/10.3390/economies8030065
AMA Style
Vo DH, Vo AT, Ho CM. Does Financial Integration Enhance Economic Growth in China? Economies. 2020; 8(3):65. https://doi.org/10.3390/economies8030065
Chicago/Turabian StyleVo, Duc Hong, Anh The Vo, and Chi Minh Ho. 2020. "Does Financial Integration Enhance Economic Growth in China?" Economies 8, no. 3: 65. https://doi.org/10.3390/economies8030065
Note that from the first issue of 2016, this journal uses article numbers instead of page numbers. See further details here.