The Impacts of China–Africa Economic Relation on Factor Productivity of African Countries


School of Economics and Management, Southwest Jiaotong University, No.111, Section 1, North Erthuan Road, Chengdu 610031, China
*
Author to whom correspondence should be addressed.
Economies 2020, 8(2), 47; https://doi.org/10.3390/economies8020047
Submission received: 21 April 2020
/
Revised: 22 May 2020
/
Accepted: 27 May 2020
/
Published: 4 June 2020
(This article belongs to the Special Issue The Theory Applications of Finance and Macroeconomics)
Abstract
:This study attempts to empirically examine the impacts of the China–Africa economic relationship on factor productivity. The two-step system Generalized method of moments (GMM) estimator is applied to analyze the impacts of the Africa–China economic relationship on factor productivity of 44 African countries controlling Africa–China trade, Chinese foreign direct investment (FDI), and aid allocation to African countries for the periods 2003–2017. The estimation strategy controls endogeneity concerns. Another novelty of this study is calculating total factor productivity (TFP) using the regression approach and driving capital stock data. Additionally, the institutional quality index of countries is derived using principal component analysis. The findings of this study refer that the impact of the China–Africa economic relationship on the TFP of African countries is conditional to the domestic institutional quality of African countries. The results imply that the productivity embodied by the Africa–China economic relationship should be backed by the domestic adaptive capacity to use the benefit of China–Africa economic relations to excel factor productivity. Hence, the capability of African countries to benefit from the China–Africa economic relationship to enhance factor productivity should improve the institutional quality.
1. Introduction
For developing nations, like African countries, the adoption of technology from the international market is vital, since it might be the only way for them to improve their productivity growth and technical progress. The nexus of openness and factor productivity in terms of attracting foreign direct investment (FDI), aid allocation and trade openness to enhance the factor productivity of the domestic economy is essential to study. The impacts of foreign trade and FDI on economic growth and development flow to the FDI and trade partner countries indirectly speeds up productivity growth through fostering technological transfer from a technologically innovative developed economy to less technologically innovative developing countries (Blomstrom 1986; Busse and Königer 2012). Particularly, trade and investment in capital goods, technological inputs and equipment related to foreign research and development can improve the productivity of importing countries by being integrated into production processes (Lucas 1988; Le 2008; Alcala and Ciccone 2004). Besides, technology transfer through international trade and the FDI takes on even more importance for productivity growth in developing countries, including African countries, as they undertake minimal domestic research and development (Henry et al. 2009).
The impact of China–Africa economic relation on the total factor productivity (TFP) of African countries is debatable. For example, some scholars argue that the trade relationship between Africa and China has an insignificant or negative effect on factor productivity and economic growth for African countries and is more dominated by China’s economic interests to access critical resources (Adisu et al. 2010; Busse et al. 2016). As well as this, some researchers argue that Africa’s trade with China is centered on Chinese interest in Africa and is deteriorating the African economy. Conversely, others consider that Africa’s trade with China is benefiting Africa by triggering its economic growth. Additionally, Elu and Price (2010) found that increasing trade with China had no direct effect on the country’s total productivity. It might even negatively affect total productivity, making it harder for Africans to work toward industrialization. Furthermore, they found that for Sub-Saharan manufacturing firms, increasing their trade with China does not help them transfer technology and managerial know-how and skills that enhance firm-level productivity.
The extent of productivity spillover and skill transfer by Chinese companies to host countries is a crucial topic of debate. Foster et al. (2008) argue that Chinese FDI in Africa has little skills transfer to Africans. Shen (2013) also finds that private Chinese FDI has a negative impact on technological transfer. Likewise, Wang et al. (2014) argue that Chinese FDI is currently domestic-oriented to enhance domestic productivity and strengthen domestic production in China. Thus, technology transfers to host countries from Chinese FDI are limited.
China–Africa economic relations can also be revealed in terms of Chinese financial aid to African countries. A number of studies have been conducted regarding the motives of the financial aid (Dreher and Fuchs 2015), its effect on the African economy (Sun 2014; Busse et al. 2016) and the link among Chinese aid, FDI and trade activities (Sanfilippo 2010). However, empirical studies on the nexus of Chinese financial aid and total factor productivity of African countries are limited.
Therefore, the major objective of this study is to analyze the impacts of the China–Africa economic relationship on the TFP of African countries. More specifically, it is mainly concerned with the impacts of China–Africa trade, Chinese FDI, and financial aid to Africa on the TFP of African countries. Besides, the absorptive capacity of African countries in terms of institutional quality is included in the study, using the interaction terms of institutional quality indicators with the China–Africa economic relationship. Likewise, interaction among China–Africa trade, Chinese aid and FDI are examined, as Chinese financial aid and trade have interacted with FDI, and one instrument conditioned the other one.
This study is crucial for a few reasons. First, it examines the impacts of the China–Africa economic relationship on the TFP for 44 African countries, emphasizing the China–Africa economic interaction instruments, which is an under-researched topic. Second, we employ the two-step system GMM estimator that helps control the endogeneity concern. Third, it examined the mediating role of African countries’ institutional quality in the nexus of the China–Africa economic relationship and TFP of African countries. Fourth, it also examined the complementary of China–Africa trade, Chinese FDI, and aid to African countries, as they are mixed and affect each other. Finally, given the significance of the China–Africa economic relationship, this study provides a policy framework and foundation for further intensifying the Africa–China economic linkage. Besides this, the study will provide a sound basis for further research on the China–Africa economic relationship. To preview our main results, we found that the impacts of China–Africa trade, Chinese FDI, and aid allocation to African countries on TFP of African countries are conditional to African countries’ domestic absorptive capacity.
The rest of this paper is organized as follows. Part two presents the stylized facts of China–Africa economic relationship. Part three discusses the literature review. Part four explains the data and methodology of the study. Part five presents the results and findings of the study, and part six gives discussions and policy implications.
2. Stylized Facts of China–Africa Economic Relationship
2.1. Overview of China–Africa Trade
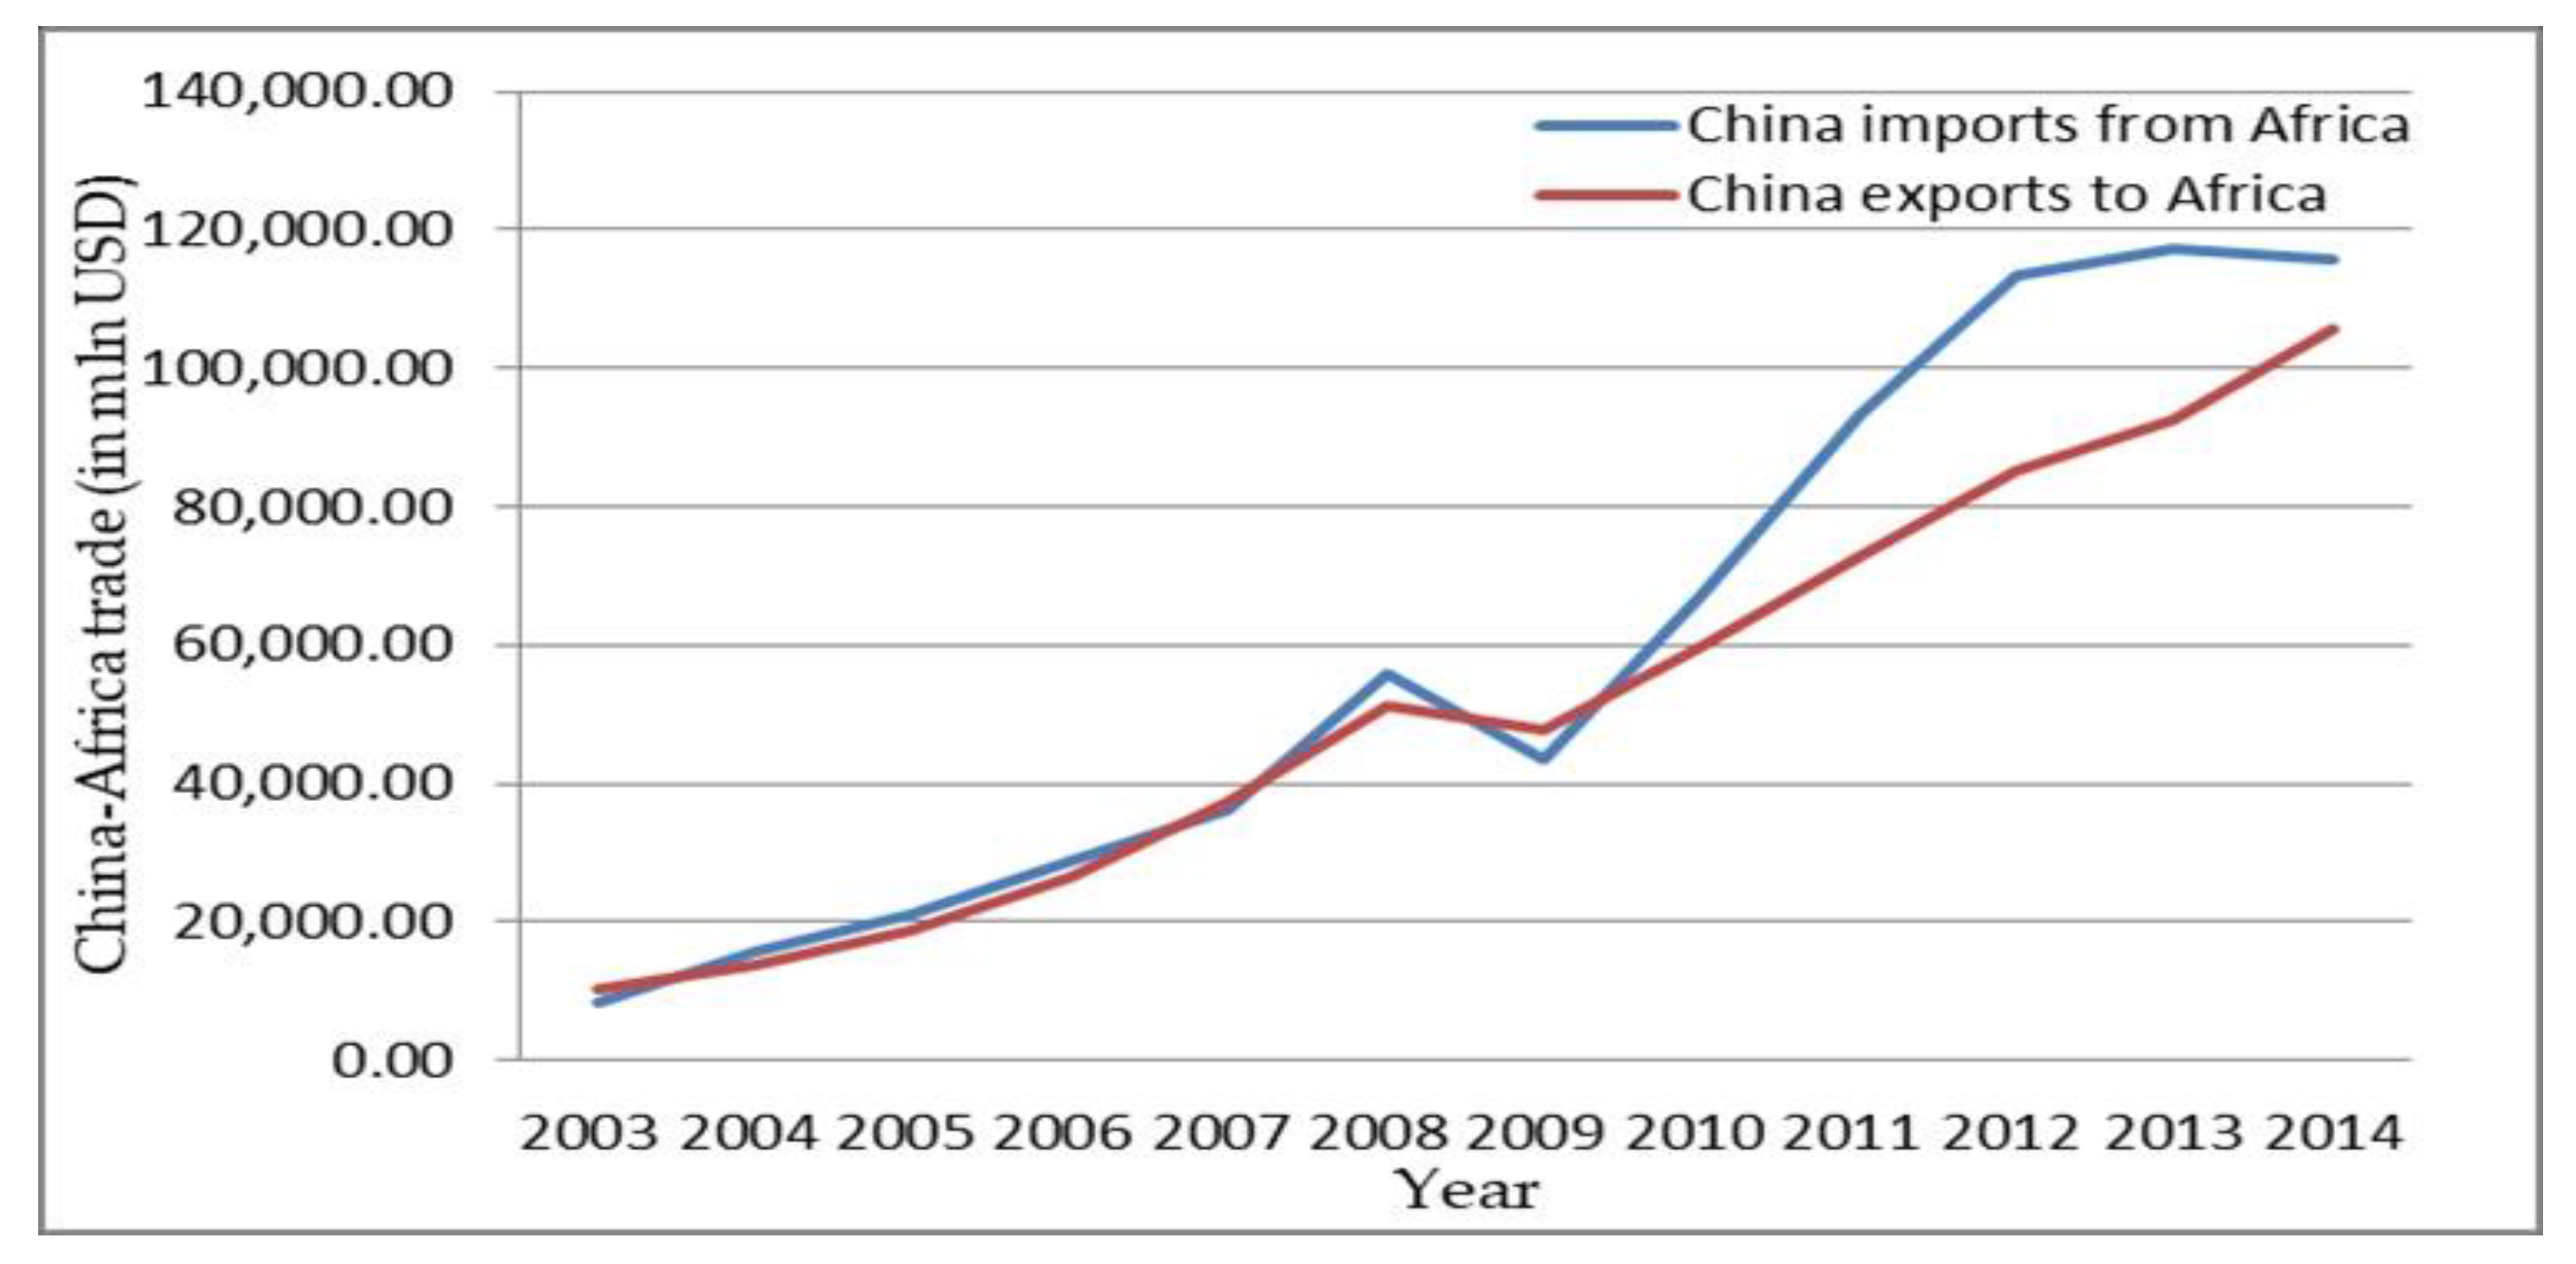
China has a long trade relationship with African countries. However, the fastest growing of trade between African countries and China has been registered in the last two decades. Trade between China and Africa has been increased at the fastest rate since 2000. Total trade between Africa and China has registered a compound growth rate of 24.7% in the last two decades. In general, Africa is much more dependent on China for trade. The pattern of China–Africa trade is depicted in Figure 1 below.
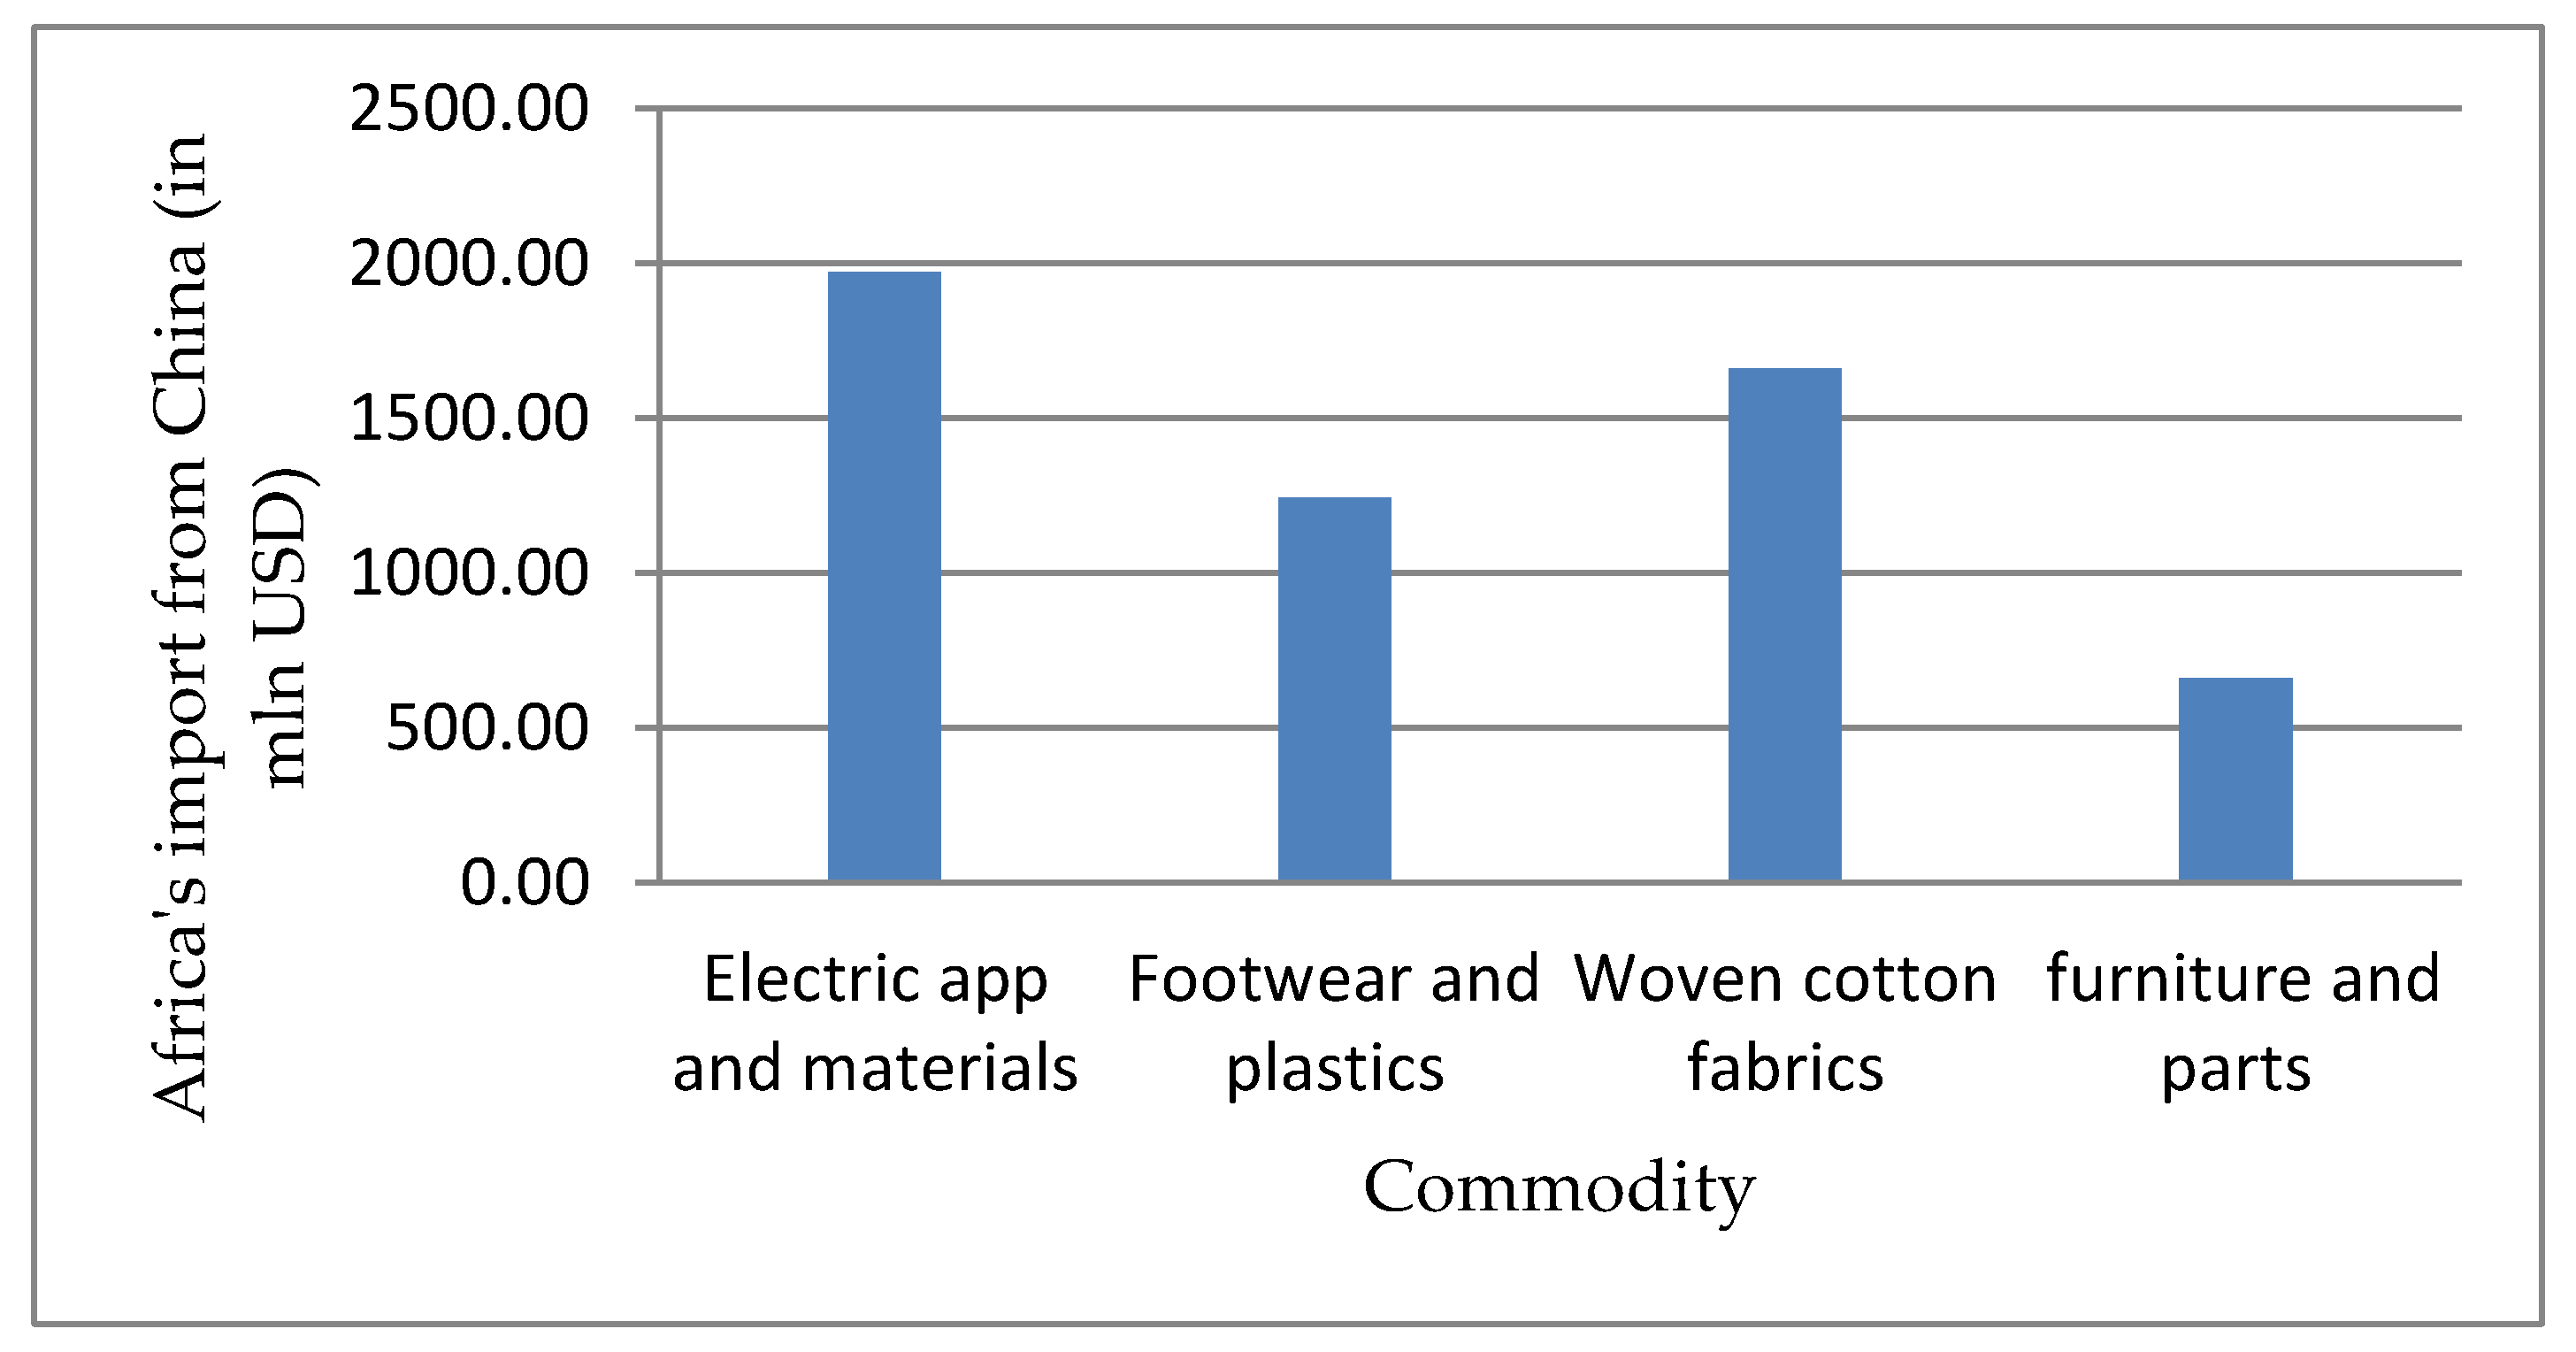
Trade between African countries and China can be split in to imports from China and exports to China from African countries. The major commodities African countries imported from China for the last two decades have been electronic equipment, machinery, clothing and textile goods, transport materials, footwear and plastic commodities (see Figure 2). Among these commodities, electronic equipment and machinery import were first in share. Clothing and textile, transport equipment and materials, footwear and plastic products imported from China to African countries have also increased significantly (Tralac 2014), for example, the imports of some countries such as Algeria, Central Africa Republic, Chad, Ethiopia, Mali, Rwanda, Zambia and Zimbabwe Trucks, tractors and motor vehicles for the transport, television receivers and electric app for line telephony. Additionally, countries like Benin, Gambia, Madagascar, Mauritania, Tanzania and Togo imported textile and clothing products.
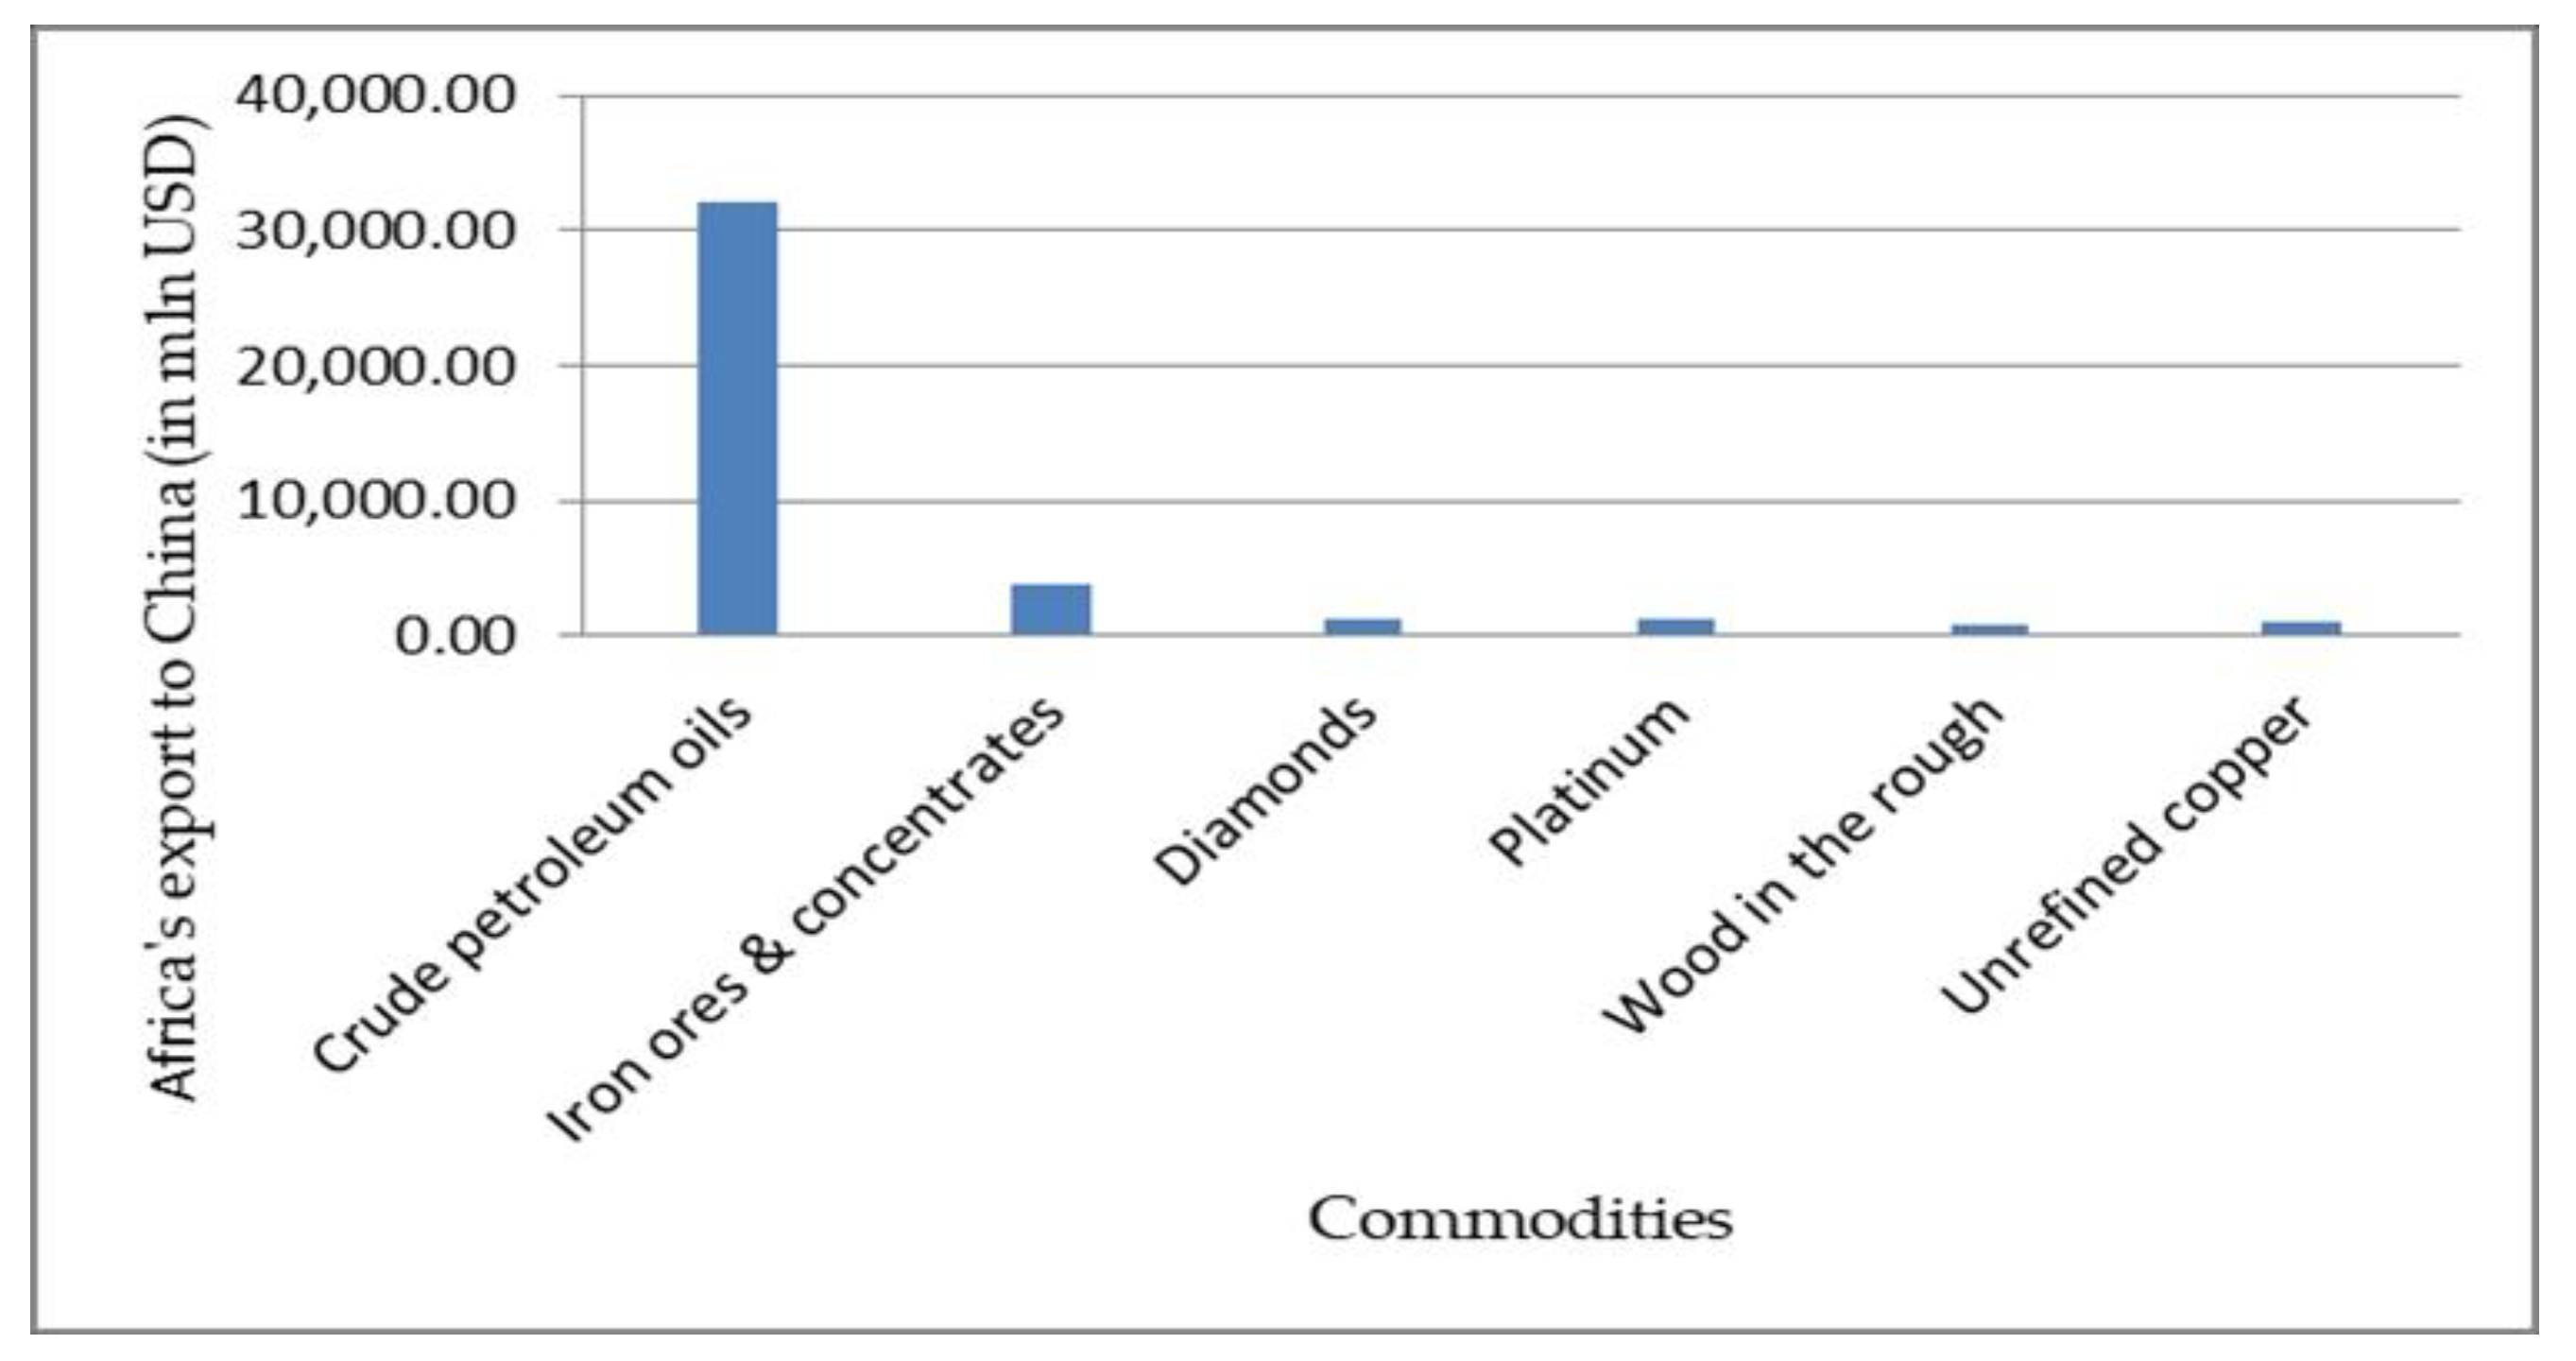
Regarding the export of African countries to China, it was concentrated on mineral products, base metals, precious stones, other unclassified primary commodities, with only a few shares of textiles and clothes. The composition of African countries’ exports to China has been reported in Figure 3 below.
Figure 3 above shows that more than 58% of total Africa’s export to China is primarily mineral products such as crude oil, natural gas and copper. The major exporting African countries to China are South Africa, Sudan, Angola, Democratic Republic of Congo and Equatorial Guinea, which are relatively abundant in natural resources and minerals.
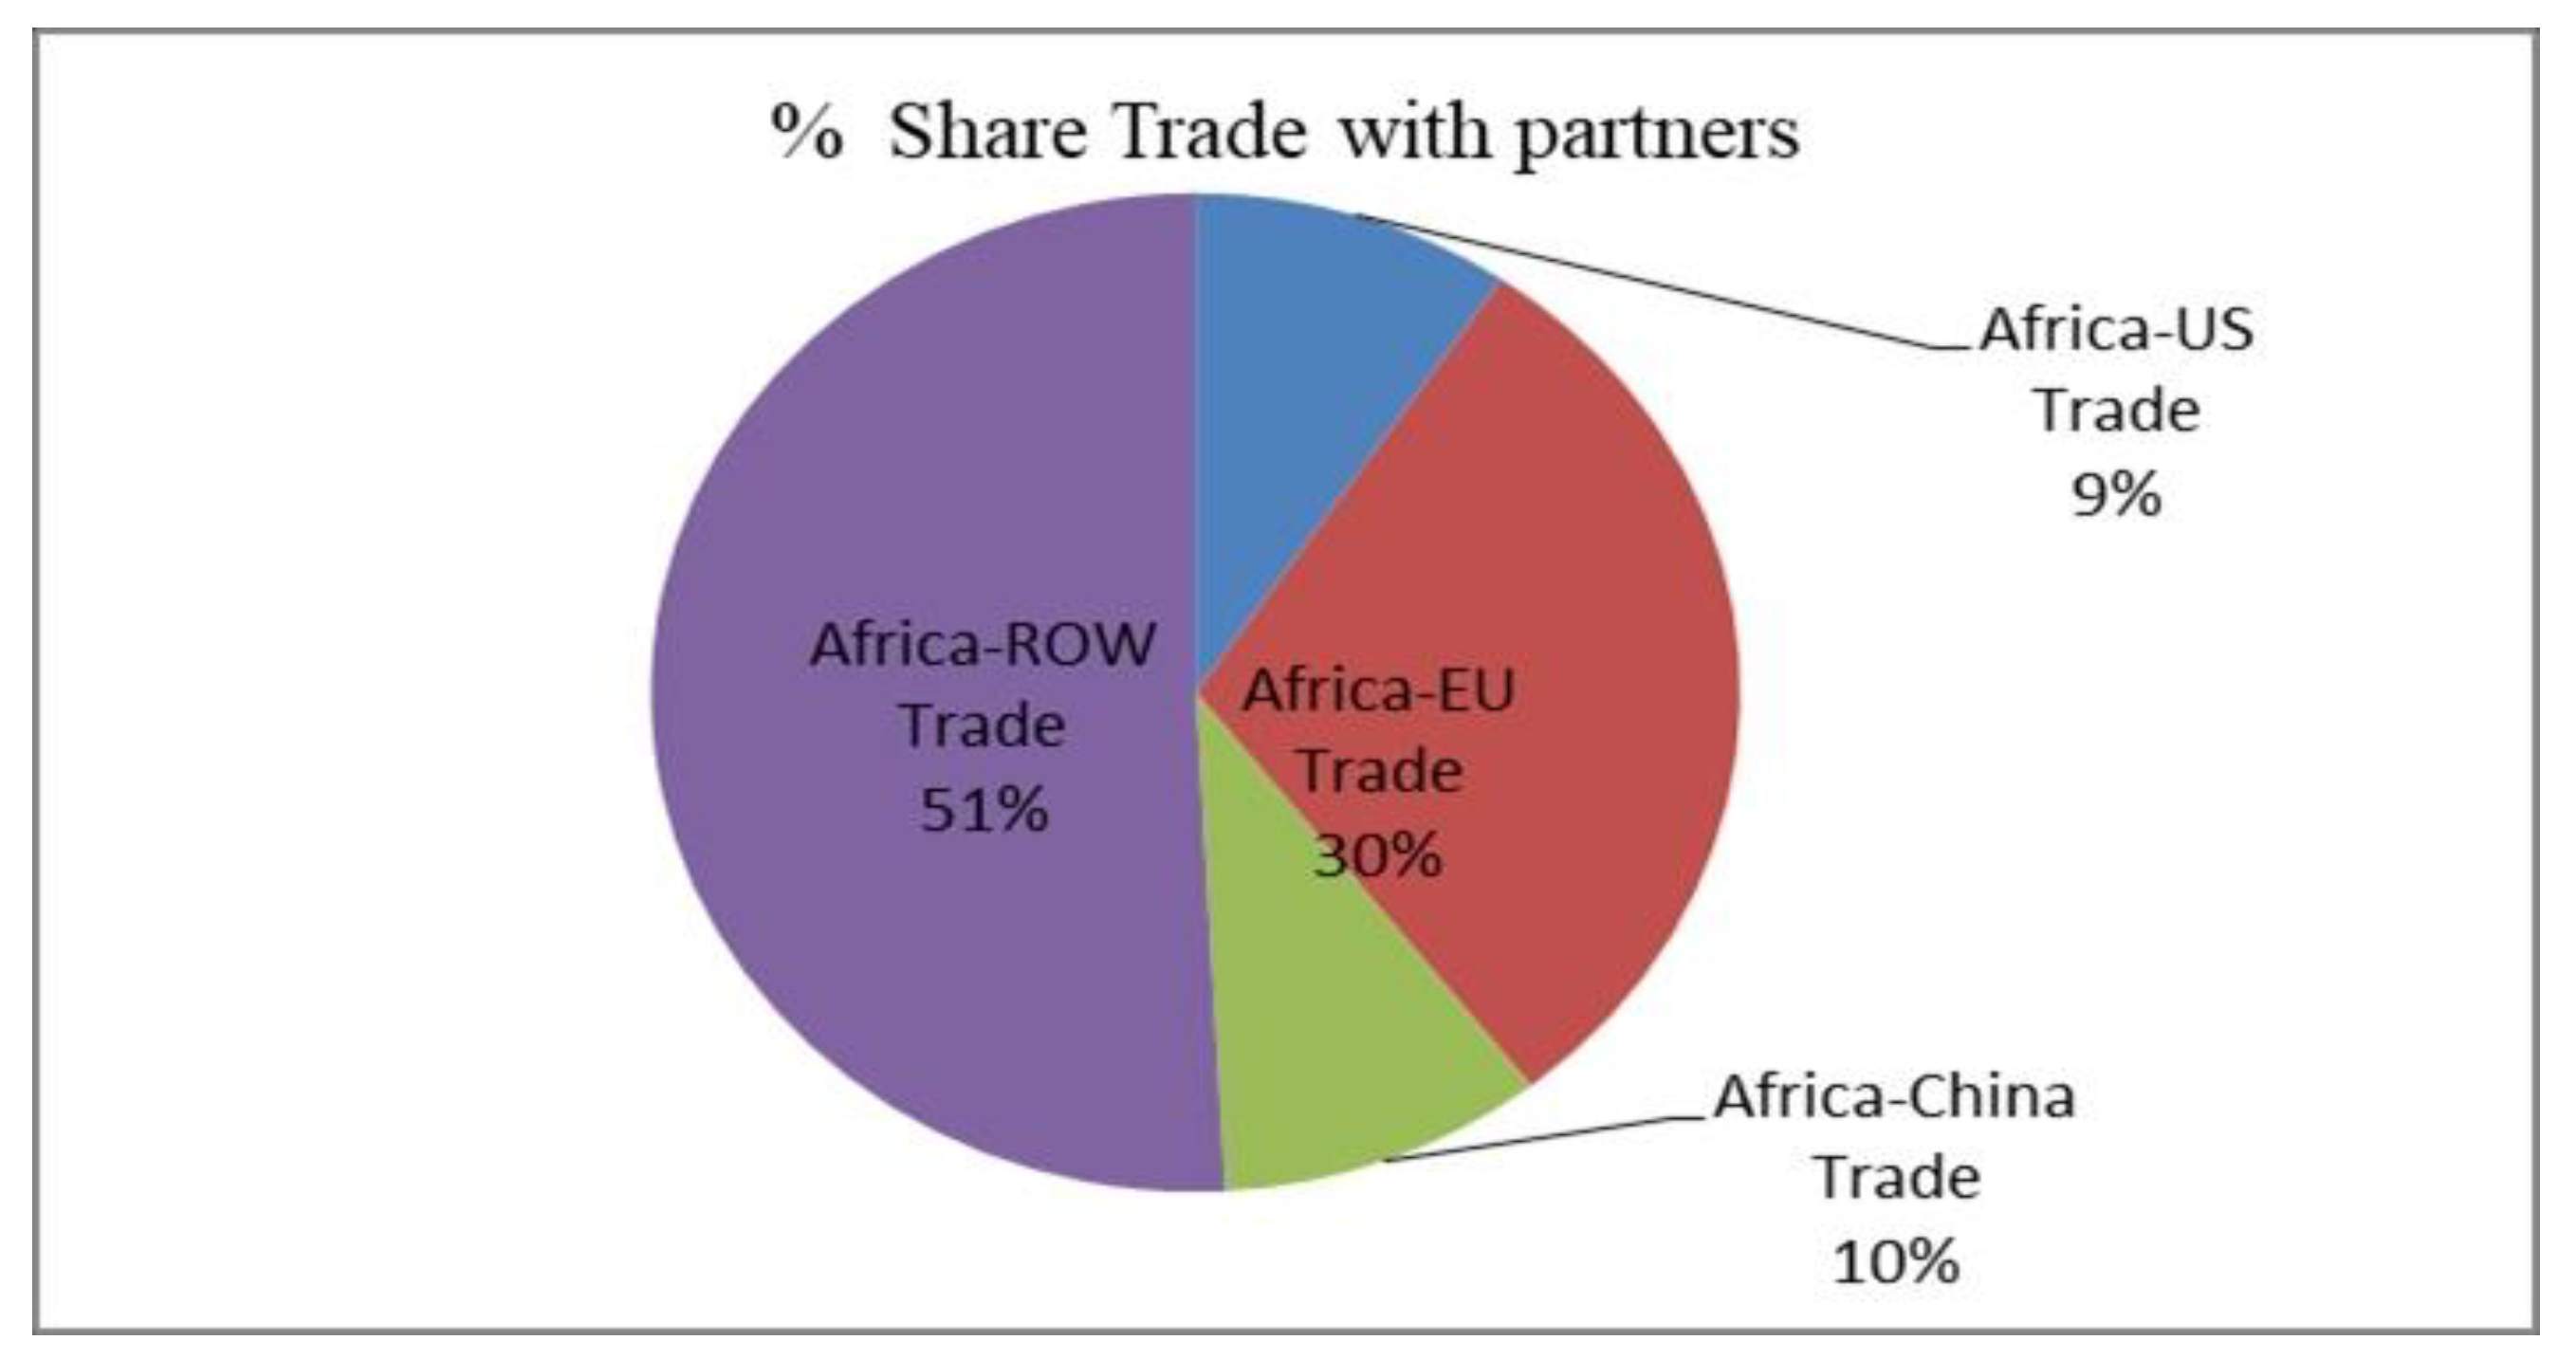
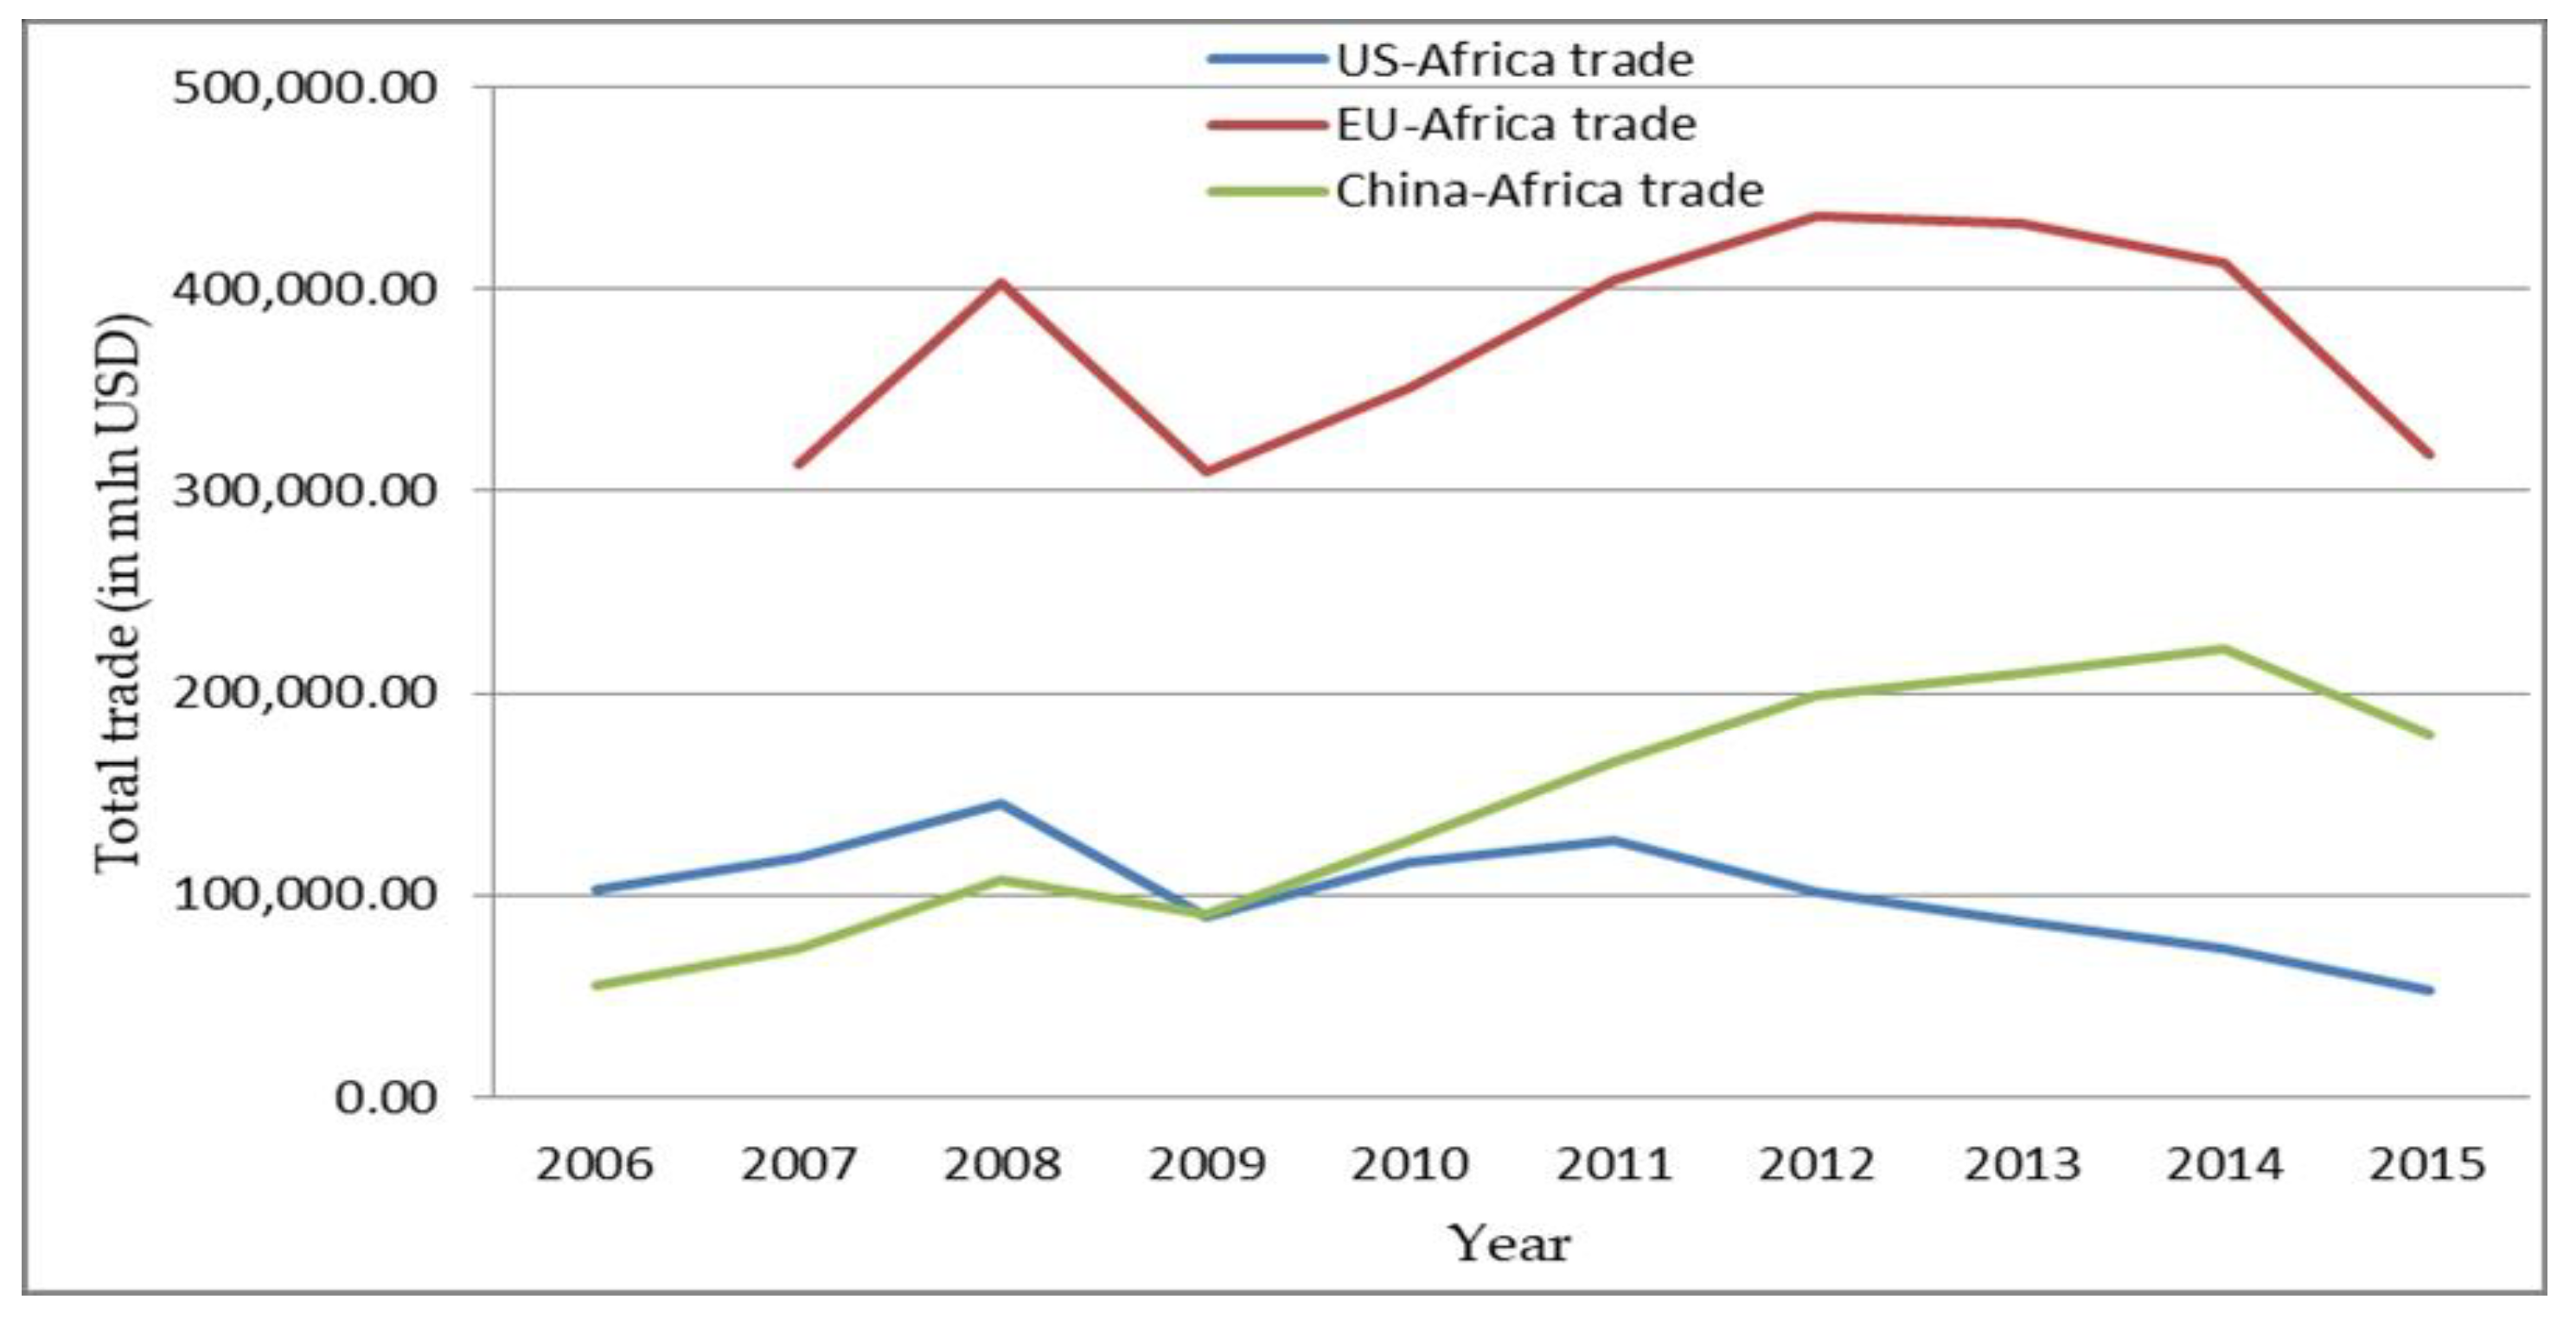
Furthermore, the China–Africa trade has grown significantly compared to Africa’s traditional trade partners. The average share of Africa’s foreign trade with its three major trading partners—the US, EU and China—was 49%, having a percent share of 9, 30 and 10, respectively, for the last two decades. The share is almost half of Africa’s total trade with its all trade partners (see Figure 4).
The average growth rate of total trade between Africa and China was the highest compared to Africa’s trade with the United States and European Union countries. China–Africa trade was grown at the fastest rate since 2000, achieving over 209 billion USD in 2013, more than double the Africa–US bilateral trade (Tralac 2014). As we can see from the trend of growth, the gap between the Africa–China and Africa–US bilateral trade is also growing. The growth rate of total trade between Africa and China is growing faster than the growth rate of trade between Africa and the European Union. In terms of volume, however, Africa’s trade with the European Union member countries is at the top (see Figure 5).
2.2. Chinese FDI Flow to African Countries
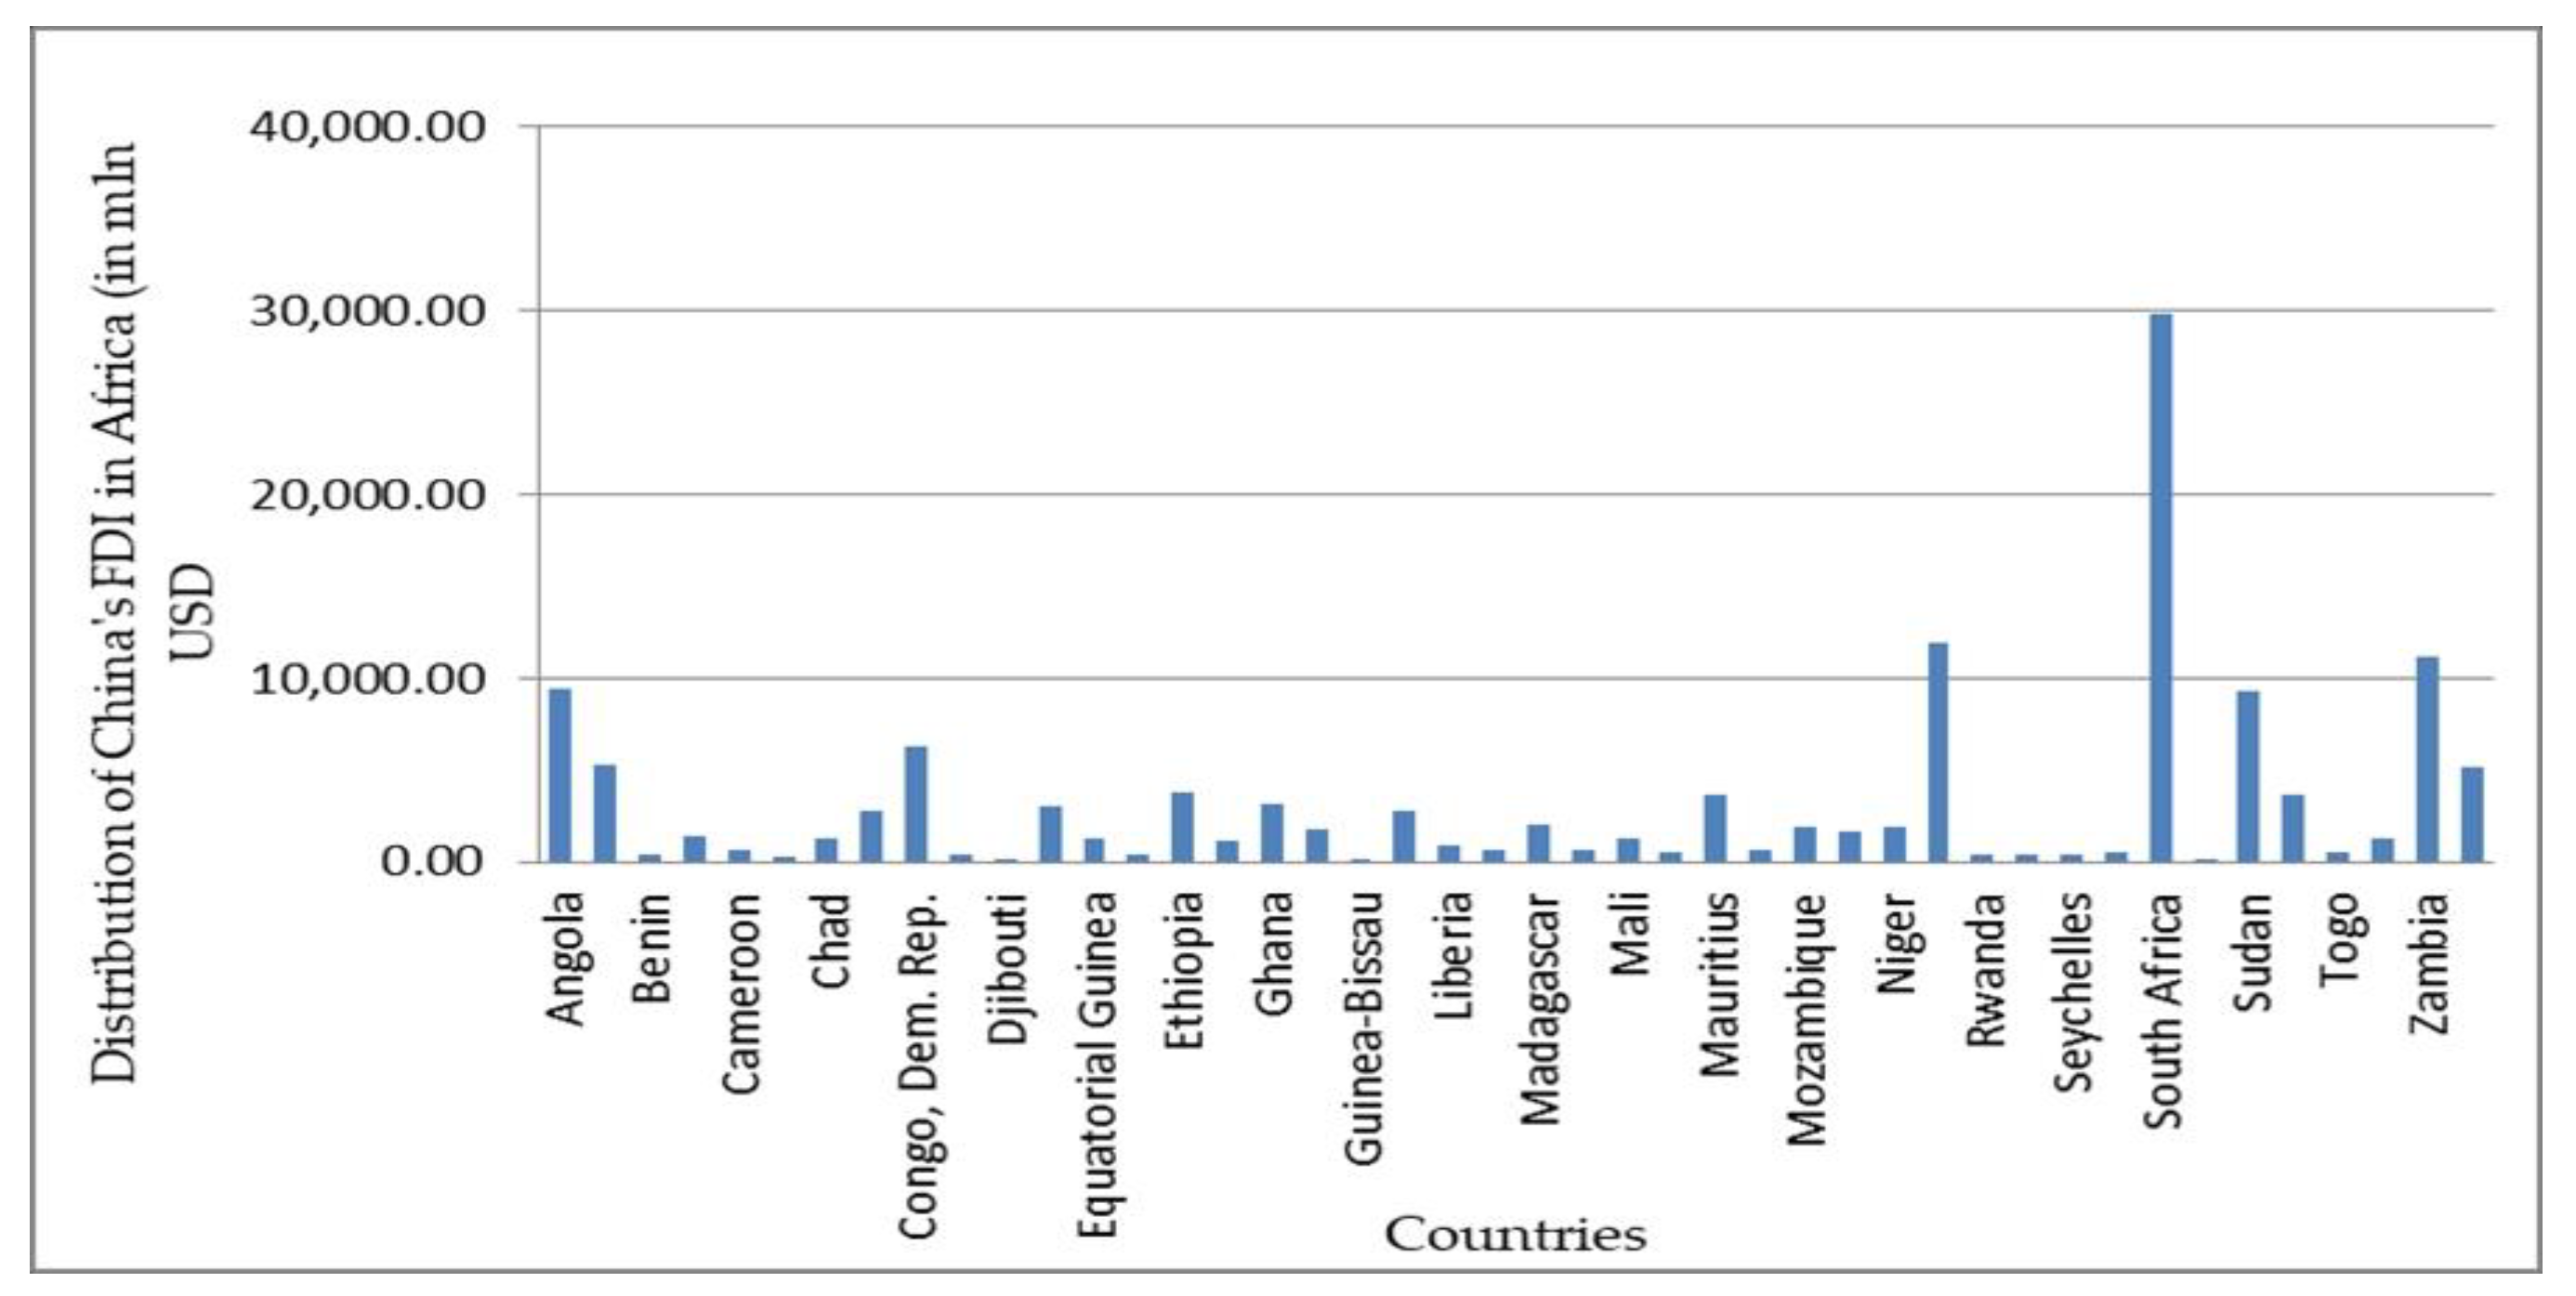
Chinese FDI reaches almost all African countries, including those that do not have a formal diplomatic relationship with China (São Tomé and Príncipe). This indicates that Chinese outward foreign direct investment plays a prominent role in China’s economic interaction with many African countries. Furthermore, this strong interrelationship between Chinese foreign direct investment and economic cooperation indicates China’s significant role in African countries’ economic arena. However, the bulk of Chinese investment is focused on a few resource-rich countries and slow expansion to resource-poor countries (Pigato and Tang 2015). A host country’s natural resources have a significant contribution to China’s decision on the actual amount to invest in the country; it does not affect its decision as to whether to invest in the country or not (Sanfilippo 2010; Rian and Blomkvist 2013; Kolstad and Wiig 2011; Ming 2010). As one can observe from Figure 6 below, South Africa is the top destination, followed by Nigeria, Zambia, Angola, Sudan and the Democratic Republic of Congo. Meanwhile, state-owned enterprises are prominent in China’s natural resource and energy industries and have dominated this form of Chinese investment within Sub-Saharan African countries.
For example, in 2014, 50% of China’s FDI stock in Africa was allocated to only six African countries, with South Africa having the largest share at 18%. Interestingly, the other five countries, such as Algeria, Nigeria, Zambia, the Democratic Republic of the Congo, and Sudan, are all resource-rich countries. The report attributes this trend to the Chinese central government state-owned enterprises’ focus on the petroleum and non-ferrous metals sectors.
Chinese companies have increasingly been locating in Nigeria. As of 2013, according to the local investment agency, there were 208 registered Chinese companies in Nigeria focusing on oil and gas, construction and telecommunication (Umejei 2015).
However, the flows of FDI to the top five countries have been declining since 2011, an indication that Chinese FDI in Africa has started to diversify away from resource-rich countries into other economies in Africa. Moreover, while the top countries possess significant natural resources, these are not necessarily the main reasons for the Chinese investment presence. For example, the surge of Chinese FDI flows to South Africa was driven by the one-time purchase of shares in Standard Bank, as described above. In contrast, Chinese investment in Nigeria is not limited to oil, given that the majority of Nigeria’s oil investment is from Dutch, Italian and American companies and the diversity of Chinese investment activities as described by Chen et al. (2018).
2.3. Chinese Aid Allocation to African Countries
Chinese aid covered about 20 percent of the total financial aid of the committee of Organization for Economic Cooperation and Development’s Development Assistance for the periods between 2001 and 2011. In contrast to Western countries’ foreign aid, which comes primarily in the form of direct money and material transfers, Chinese foreign aid comprises primarily of quick, flexible, and predominantly unconditional export credits and infrastructure investment loans (Wang et al. 2014).
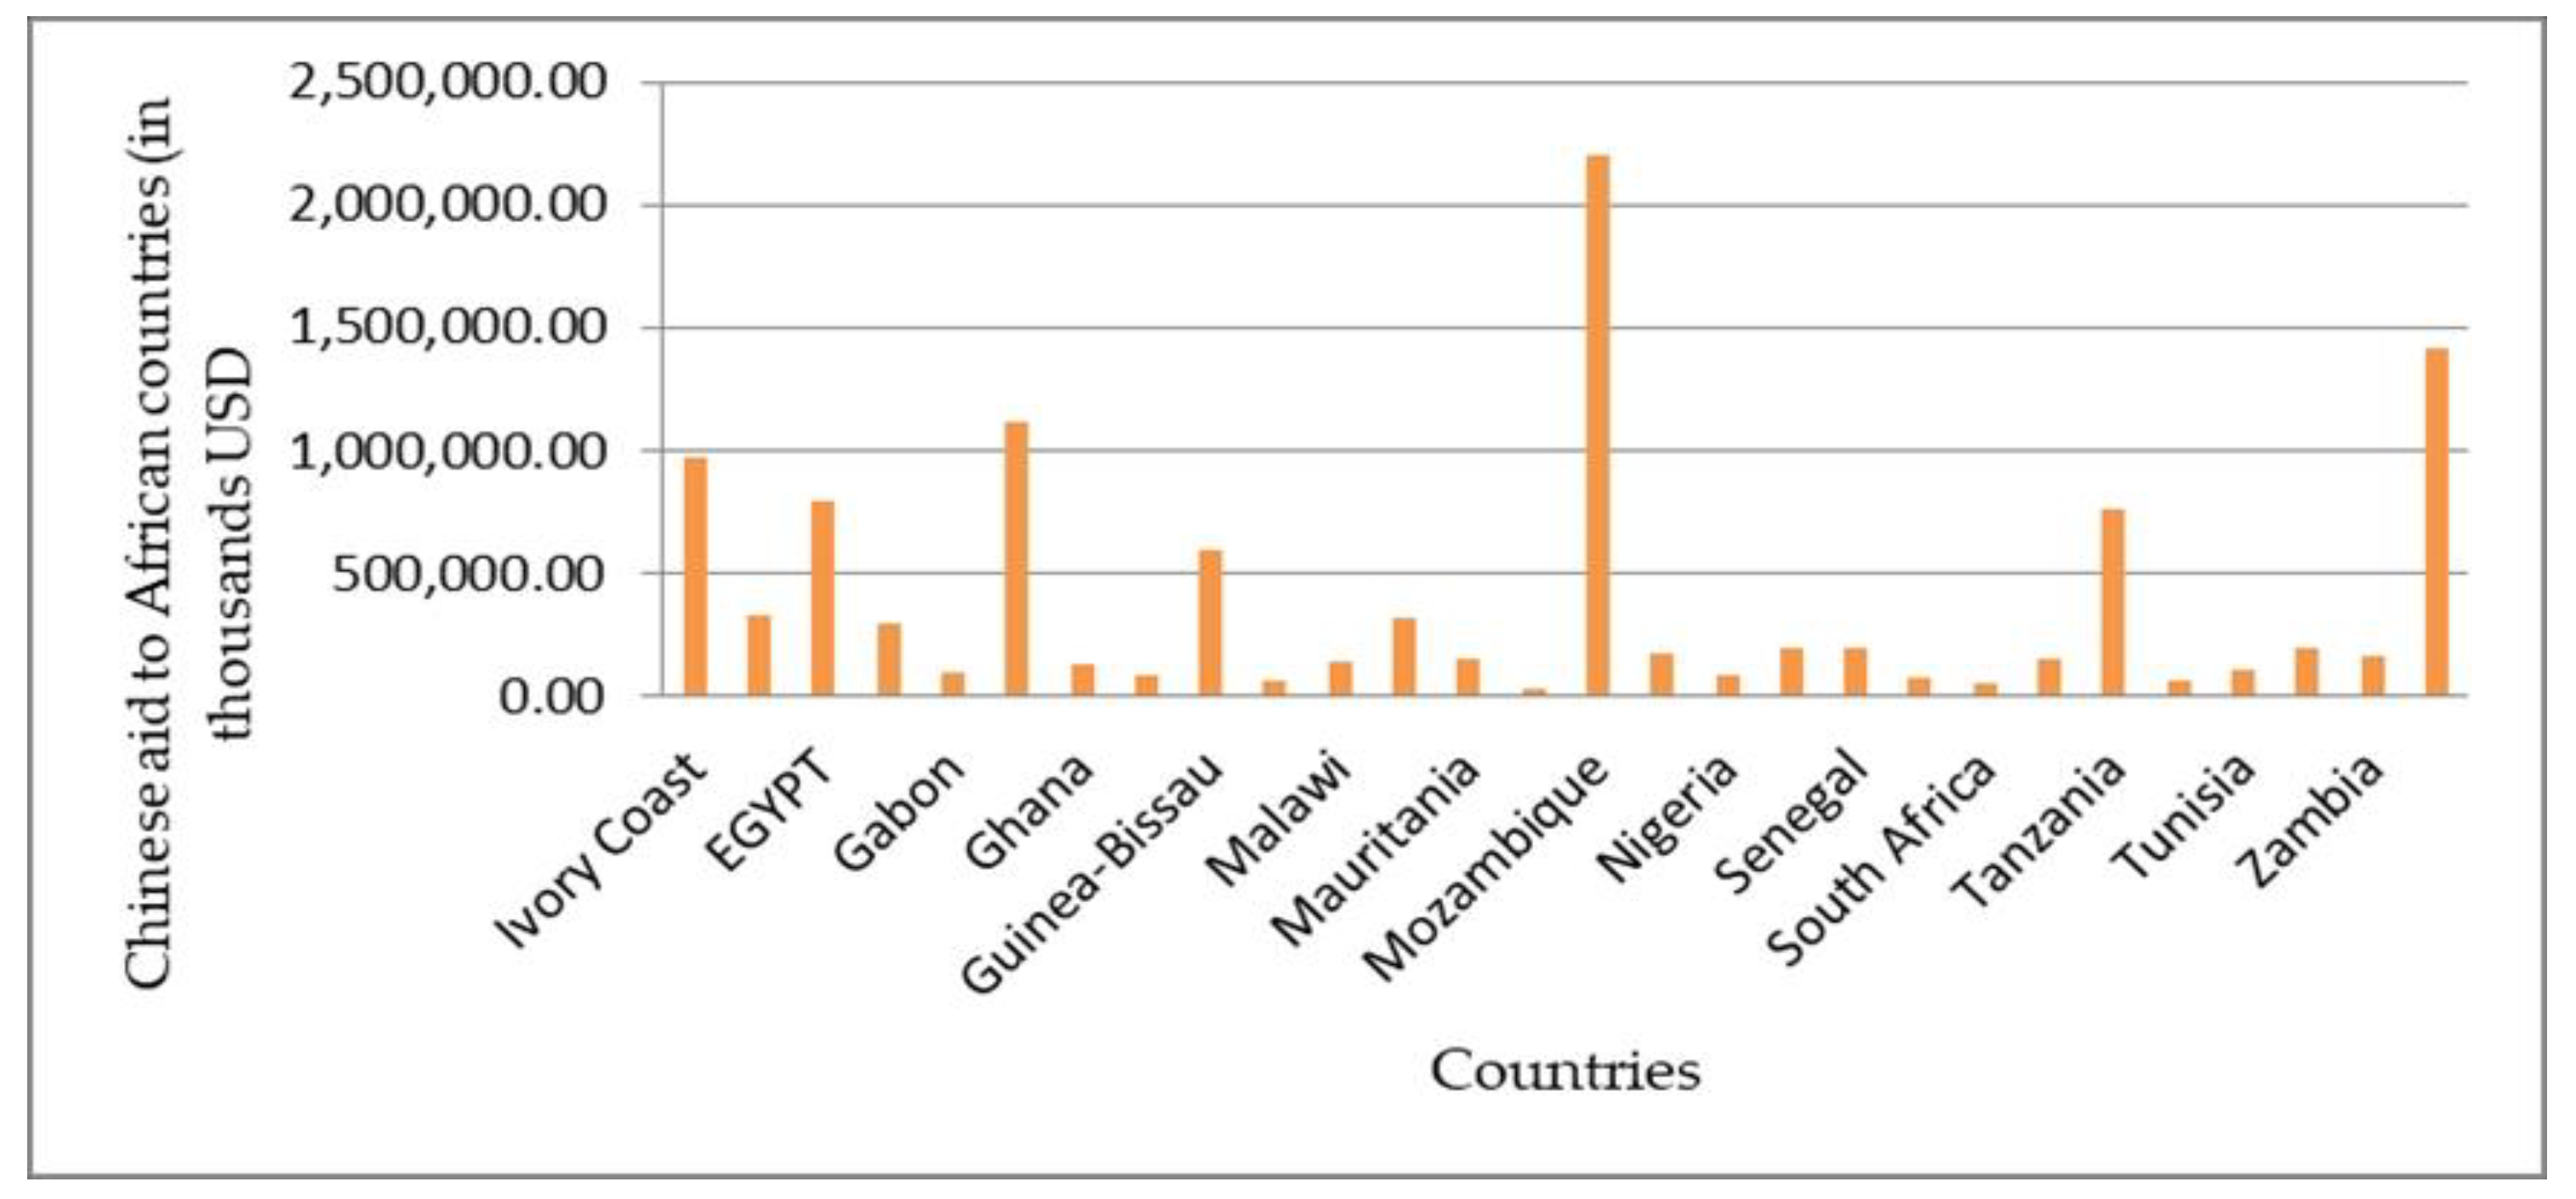
Africa is one of China’s most emphasized regions to receive Chinese foreign financial assistance. Since the launch of the Forum on China–Africa Cooperation (FOCAC) in 2000, Chinese official development assistance to African countries has increased significantly. In 2009, China allocated 47% of its total foreign development assistance to African countries. This was almost half of total Chinese foreign financial assistance, indicating that Africa is the top destination for Chinese aid allocation. The top five Chinese aid receipt African countries from 2000–2013 were Mozambique, Zimbabwe, Gambia, Ivory Coast and Egypt (see Figure 7).
In comparison, Chinese governments, banks, and contractors extended loans totaling 86.9 billion US dollars to African governments and state-owned enterprises between 2000 and 2014. Of this, 24.2 billion US dollars were for transportation, 17.6 billion US dollars for energy, and 9.0 billion US dollars for mining (Jyhjong et al. 2016). Fifty-four percent of Chinese loans in this period were made to five countries: Angola, Ethiopia, Sudan, Kenya and the Democratic Republic of Congo.
Lending to Angola is heavily tied to the country’s oil, with about half of loans being made to the state-owned oil company and the other half being oil-backed infrastructure loans. In contrast, the loan portfolio in Ethiopia is spread out across transportation, communications and energy (hydropower), among other sectors (Jyhjong et al. 2016). About 56% of China’s loans to Africa from 2003 to 2011 were backed by commodities (Brautigam and Gallagher 2014). This has exposed their portfolio to serious risk in the face of falling oil prices and may prompt them to diversify their loan portfolio away from commodity—especially oil-backed lending (Gallagher et al. 2016).
According to a 2011 white paper on China’s foreign aid, published by the State Council of China, Chinese foreign aid can fall into three categories: grants, interest-free loans and concessional loans (China Africa Research Initiative 2017). Grants are primarily used to assist recipient nations to construct hospitals, schools and low-cost homes, and assist well-digging or water-supply projects, as well as other small and medium social welfare projects. In addition, grants are used in projects in the areas of development cooperation, human resources, technical collaboration, and urgent humanitarian and in-kind assistance (China’s Information Office of the State Council 2011).
Interest-free loans are primarily used to help loan recipient nations build public infrastructure and launch initiatives to enhance their livelihood. Usually, the tenure of such loans is 20 years, including ten years of repayment, five years of use, and five years of grace time. Interest-free loans are currently granted primarily to developing nations with comparatively excellent financial circumstances (China’s Information Office of the State Council 2011).
Concessional loans are used fundamentally to assist loan recipient nations to undertake productive projects that generate social and economic opportunities as well as medium- and large-sized infrastructure projects or to provide mechanical and electrical products, complete plants, technical services and other equipment. Concessional loans are raised on the market by China’s Export-Import Bank, and as the loan interest is smaller than the People’s Bank of China’s benchmark interest, the distinction is made up by the State as financial subsidies. Currently, China’s concessional loans have an annual interest rate of between 2% and 3%, and the repayment period is generally 15 to 20 years (including 5 to 20 years) (China’s Information Office of the State Council 2011).
Chinese aid comprises mainly quick, flexible and mainly unconditional export credits and infrastructure loans (often with little or no interest) (Wang et al. 2014). However, it is allocated in a number of sectors, and emergency and economic development. It is mainly allocated to different sectors such as health, communication, education, infrastructure, energy, agriculture, trade and tourism, banking and financial services (Guillon and Mathonnat 2017).
3. Literature Review and Hypothesis Development
3.1. China–Africa Trade and Total Factor Productivity
The impact of international trade on economic growth has been well studied following the endogenous growth model (Rivera-Batiz and Romer 1991). This theory argues that trade among countries is inclined to promote economic growth by positively affecting domestic productivity and taking advantage of economies of scale, which encourages specialization and productivity. This theory further gives the reason that trade openness stimulates competition, which forces local firms to innovate for higher production efficiency and improvement in production.
Douglas C. North formulated the export base theory based on the justification that foreign trade is an engine of growth. It stems from the notion within the export base theory that the growth of exports provides externality and productivity benefits to trading economies. This theory suggests that regional growth in output and employment is a function of exogenous demand for a region’s exports, assuming a perfect elasticity of input supply and export demand (Leichenko 2009). Based on these reasons, international trade contributes to the development of economic sectors and industries by influencing the global allocation of economic resources among countries, including technology transfer. As a result, international trade can play an important role in determining global knowledge, skill, managerial know-how, and technology transfer.
According to the report by UNCTAD (2014), the impact of international trade on productivity improvement is based on two assumptions. The first assumption is that as goods and services are traded among countries, the technology embodied in them is transferred to trading countries. An essential part of the knowledge embodied in capital goods or necessary for their productive use is tacit knowledge, which is not easily transferable or not transferrable at all. The second assumption is that a significant determinant in technology and knowledge transfer is the cost of access. In this regard, the case for trade liberalization argues that reducing legal, regulatory and political barriers to trade, and in particular for goods that have a high technology component, would reduce the cost of technology and knowledge transfer. From this angle, restrictive trade practices limit the flow of goods and services and make it inherently costlier for local firms to adopt technologies embodied in the imported goods, while open trade encourages the flow of goods and services and may positively affect economic growth by lowering the barriers to technology and know-how adoption (UNCTAD 2014).
Based on this traditional perspective, a number of empirical studies have been conducted on the impact of trade on total factor productivity. For instance, the study by Mayer (2001) justifies that international trade, more especially, machinery and equipment relating to foreign research and development, is one of the ways to transfer technologies and productivity to trading countries. This analysis is supported by the study of Söderbom and Teal (2003) that analyzed openness as sources of productivity growth and found a significant effect of trade openness on factor productivity growth. Besides, Alcala and Ciccone (2004) study examined the impacts of international trade on factor productivity and found that international trade has an economically significant and statistically robust positive effect on total factor productivity.
Furthermore, the recent study by Sun and Heshmati (2012) investigates the impacts of international trade on economic growth and development in China through analyzing the effect of foreign trade on the improvement of productivity. The findings of their study show that trade volume and trade structure towards high-tech exports result in positive effects on productivity improvement in different regions in China.
More specifically, a few studies have been conducted on the nexus of China–Africa trade and total factor productivity of African countries. For example, Yin and Vaschetto (2011) and Busse et al. (2016) provide evidence that Chinese trade with African countries has a displacement effect on African firms and affects productivity negatively.
The limitations of the literature mentioned above would stem from the failure to consider the absorptive capacity of developing countries, including African economies. If the countries have better institutional quality, they can maximize the benefit from foreign trade. This can be argued because better institutional quality reduces uncertainties related to international trade activities. It can reduce the issues of imperfect contract enforcement and protection of intellectual property rights, so the competition brought by foreign firms becomes fierce (Yu 2010). This improves its effect on the productivity of the local economy of the trading countries. Therefore, better institutional quality could accelerate the growth effect of China–Africa trade openness by better facilitating the efficiency improvement process and strengthening the advantages of economies of scale.
Hypothesis 1 (H1).
The impact of China–Africa trade on TFP is conditional to domestic absorptive capacity.
3.2. China FDI and Total Factor Productivity
The relationship between FDI and total factor productivity has been given due consideration in the recent literature. The role of FDI on productivity stems from its root from neoclassical exogenous models and endogenous growth models. The neoclassical growth model assumes technological progress to be exogenous and growth is a function of capital accumulation. However, in the new growth models, technological change has a vital role in economic growth. In the endogenous growth models of Romer (1990) and Lucas (1988), economic growth is driven by the stock of human capital and technological changes. Endogenous growth theory postulates that the FDI spillover effect can be transformed into productivity improvement and, consequently, economic growth (Grossman and Helpman 1991). In these endogenous growth models, FDI can affect economic growth in FDI-receiving countries through technology transfer, diffusion, and spillover effects. Hence, the theoretical bases for empirical studies on the impacts of FDI on economic growth can be from the neo-classical models of growth or from endogenous growth models.
Based on the basic theories of FDI and total factor productivity, Jude and Levieuge (2016) reveal that a weak domestic institutional environment is significantly associated with high transaction costs, and increased risk for long-term commitment. In turn, this loosens the linkages between foreign affiliates and domestic firms, limiting the spillover effect of FDI. On the other hand, reliable institutional quality enhances the positive effect of FDI on factor productivity. The findings of Jude and Levieuge (2016) are supported by the results of Baltabaev (2013) that showed that an increase in FDI would lead to an improvement in productivity growth in FDI-hosting countries subject to the local conditions (absorptive capacities) of domestic economies can determine the benefit from possible externalities of FDI to host countries.
Elu and Price (2010) reveal no relationship between productivity-enhancing foreign direct investments with China. Likewise, Wang et al. (2014) showed that technology spillover from Chinese investment in African countries is limited partly due to skill mismatch. Additionally, Shen (2013) also finds that private Chinese FDI has a negative effect on technological transfer and has a mixed impacts in terms of local industrialization. The major limitations of these studies might be not considering the local absorptive capacity of African countries in the analysis, which will be solved by this study.
In line with the arguments of Baltabaev (2013) and Jude and Levieuge (2016), we suggest that the positive effect of FDI on economic growth will be stronger in countries with relatively high institutional quality. Thus, good institutions like the rule of law, lack of corruption, efficient government and good regulations can create synchronization between the domestic and foreign firms by providing them with competitive playfields and encourage them in healthy competition.
Hypothesis 2 (H2).
The impact of Chinese FDI on the total factor productivity of African countries is a positive subject to domestic institutional quality.
3.3. Chinese Financial Aid and Total Factor Productivity
Currently, the development economics concentrates not only on direct sources of growth (and development) but also on its indirect causes such as productivity (Kliber and Świerczyńska 2019). Financial aid that directly or indirectly expedites technology transfer and learning in developing countries can be mutually beneficial.
Decomposing financial aid by type of flow for 24 African countries, Kliber and Świerczyńska (2019) investigate the effect of the official development aid on the total factor productivity of Sub-Saharan African countries over the period 1995–2014. The study results show that the total value of financial aid does not enhance total factor productivity. This implies that the implementation of technical cooperation enables the absorption of technology and contributes to the increase in technology development in recipient Sub-Saharan African countries. According to Nachega and Fontaine (2006), aid can contribute to total factor productivity growth, especially if it involves investments in infrastructure (roads, power points, irrigation). Additionally, Alvi and Senbeta (2012) findings claim that aid negatively affects total factor productivity; it reduces the efficacy of financial institutions and causes efficiency losses. The institutional quality can positively affect the aid–growth relationship. In conclusion, it is enough to control the impact of corruption, political instability and lack of transparency, which are common in countries with weak institutions, on the use of aid, in order to examine the role institutional quality in the relationship between economic growth and financial aid (Addison and Baliamoune-Lutz 2006). However, few studies have been conducted in the nexus of Chinese financial aid and total factor productivity of African countries. Therefore, based on the general literature, we develop the following hypothesis.
Hypothesis 3 (H3).
the impact of Chinese aid on the total factor productivity of African counties is positive subject to the institutional environment of African countries.
4. Methodology and Data
4.1. Estimation of the TFP
This section attempts to highlight the strategy used in this study to calculate the TFP of sample African countries. The static panel data approach is employed to estimate parameters that are used to calculate TFP, because if there is no model specification problem and no data, it can avoid measurement problems related to labor shares in the model (Park 2010).
In the approach, a specific form of the production function is assumed, and then the coefficient of the parameters are found using the input and output data. The output elasticity is calculated from the function, and, in turn, TFP is derived. This study is based on the Solow (1956) growth model that he conducted to show the relationship between production (Yit) and factors of production, such as physical capital (CAPit), the labor force (LABit), energy and natural resources extraction (Rit) and technology (Ait). It can be shown as per the following Cobb–Douglas specifications of the production function. TFP, in this case, is the residual of the growth model. The panel model specification can be written as
Based on this specification, there are two basic approaches to calculate TFP. These approaches are growth accounting and regression-based approaches.
The growth accounting approach utilizes available data on output, labor input and capital, and uses output elasticities to calculate TFP and to separate the contribution of TFP on growth. Among the fundamental issues in this approach, one basic problem is that the output elasticities are not observed. One commonly used approach to deal with this problem is to impose assumptions of constant returns to scale and competitive labor markets. This assumption indicates that the output elasticities are equal to the shares of each input. This is very appropriate since only the labor shares are needed for the derivation and the actual labor shares can be collected from each country’s national accounts data. Nonetheless, the problem is that the labor share data depends on the data for compensation for employees, which suffer from various measurement errors and are unavailable for most of the economies (Park 2010).
The regression-based approach considers a specific form of production function and estimates the parameters of production function utilizing the input and output data. In principle, the regression-based approach does not assume a competitive market assumption. Hence it does not use labor share data in the estimation. Different functional forms are supposed in the estimation for the production function of Cobb–Douglas. Constant elasticity of substitution, transcendental logarithmic form, depending on the nature of technology and the restrictions on output elasticities, are among the areas for the assumptions. Output elasticities can be derived from the factors of the estimated coefficients and, in turn, the TFP can be calculated. Compared to the first one, this method has the advantage of avoiding measurement problems related to labor shares and strong assumptions regarding labor markets (Park 2010). The specification of the production function will be specified as
The logarithm transformation of the Cobb–Douglas specifications of production function can be written as
The difference between output represented by Yit and inputs (capital, labor and natural resources) represents TFP, which is specified in the following equation
where α is the elasticity of output to the capital stock, β measures elasticity of output to labor, i is for different countries and t is the time in a year. We assumed less than unitary elasticity, as this is consistent with approximate constant capital shares in the long-term. Therefore, TFP for the sample countries for the given period (2003–2017) is calculated using Equation (4). The inclusion of human capital as one of the inputs in the production function is relevant (Romer 1990; Lucas 1988). However, it is ignored in this specification because of the data availability. Therefore, we emphasized physical capital stock, energy, and natural resources and labor force.
Another issue to be addressed here is capital stock data. Since data for the capital stock were not found, they were calculated from the gross fixed capital formation. Among these issues, the major concern was raised in the measurement of factor inputs, especially capital stock. In constructing capital stock series from investment series, many critical assumptions are bound to be made to compromise the choice of measurement methods. These include the valuation method of capital inputs, choice of deflators, depreciation methods, assumptions on capacity utilization rate, use of weights in the aggregation of sub inputs, a choice between gross or net capital stock, and choice between using depreciation or obsolescence concept (Park 2010).
The method used by Alvi and Ahmed (2014) used to calculate capital stock is adapted to calculate the TFP of African countries in this study
where KI is initial capital stock, GrFiKI represents gross fixed capital formation, δ is depreciation rate for capital per year and θ represents the average growth rate of gross fixed capital formation. A five percent depreciation rate is used following the preposition of Alvi and Ahmed (2014) and World Bank (2011) as they used a 5% depreciation rate to estimate capital stocks of several countries. Annual series data for the capital stock for each year can be calculated using
where Kt a capital stock is at the current year, Kt−1 is capital stock in the previous year; GrFiKt is the real gross fixed capital formation.
4.2. The TWO-step System GMM for the TFP Specification
This section aims to provide a wide discussion on the method used to examine the impacts of the China–Africa economic relationship (China–Africa trade, Chinese FDI and aid allocation) on the TFP of African countries. The two-step system GMM estimator is applied to analyze the impacts of the China–Africa economic relationship on the TFP of African countries. Since our model for estimation of the effect of China–Africa economic relationship is based on a panel dataset of cross-country and time-series observations, a two-step GMM system estimator is used. Using TFP estimated from Equation (4) as a dependent variable, the model that relates the dependent variable with its determinants is specified in the following formula
where lagTFPit is lagged value of dependent variable (TFP), infrit the level of infrastructure proxied by ICT infrastructure, creit credit to private sector, healit is the expenditure to health sector, fdichinait is Chinese FDI to African countries, tradechinait is China–Africa trade, aidchinait is Chinese aid to African countries, insit is institutional quality indicator, efreeit is economic freedom and INTRait is to represent interaction terms. ηit is the stochastic term.
In Equation (7), the insit variable represents the index of the institutional quality of countries. In addition, the interaction terms represented by INTRAit can be specified as per the following variables, including (ins.aid, ins.fdi, openaid, openindex, openfdi)
where ins.aid represents the interaction term of financial aid from China and domestic institutional quality of African countries. ins.fdi is a variable indicating the conditional effect of Chinese FDI to the domestic institutional quality of African countries. openaid shows the interaction between Africa–China trade openness and Chinese financial aid flow to African countries. openindex is the interaction term representing the interaction among China–Africa trade, Chinese FDI to Africa and Chinese financial aid flow to African countries and openfdi indicates the conditional effect of FDI to Africa–China trade openness.
4.3. The Data and Instrument of Measurement
This study used data for the periods 2003–2017 based on the data availability for 44 African countries. The sample of countries included in the study is reported in Appendix B. The data used for this research are drawn from various sources. China–Africa trade, Chinese FDI and aid allocation (loans to African countries) was maintained from Johns Hopkins China–Africa Research Institute website. The Johns Hopkins China Africa Institute compiled Chinese FDI to Africa from United Nations Com Trade (UNCTAD) bilateral FDI Statistics and China Statistical Yearbook. The definitions and sources of data are presented in Table 1.
4.4. Diagnostic Tests
Wald test is conducted for the overall performance of the two-step GMM estimator. The Arellano and Bond test is used to test for autocorrelation. Arellano and Bond (1991) introduced a test for autocorrelation in dynamic panel data estimation for the fixed T, large N context similar to our model as we have 44 countries and a 15-year time period.
An overidentification test was conducted using Hansen statistics. If the estimation is exactly identified, the detection of invalid instruments is impossible. However, if the system is overidentified, a test statistic for the joint validity of the moment conditions (identifying restrictions) falls naturally out of the GMM framework.
5. Results and Findings
In this sub-section, we spell out the derivation of TPF and the effects of China–Africa economic relationship on the TFP of African countries. The China–Africa trade, FDI and aid allocation, by offering more generous incentive packages and justifying their actions with the expected knowledge of externalities generated by foreign affiliates, can affect the level of domestic productivity of African countries. Hence, the emphasis of this section is on the impacts of Chinese FDI, aid allocation and China–Africa trade on the TFP of African countries. The first section mainly focuses on the derivation of TFP using the Cobb–Douglas production function. The second section contains the nexus of China–Africa economic relations and the TFP of African countries controlling the mediating role of institutional quality of African countries, as well as controlling the complementarity of China–Africa economic relationship instruments.
5.1. Derivation of TFP
The Solow (1956) suggests that TFP is the key economic growth factor. If the economy is based solely on capital accumulation without technological progress, the declining returns on capital accumulation will eventually slow economic growth to zero. In the development process, the rate of technological progress is the dominant factor in the long run. An economy with a higher growth rate of productivity than others can always overrun her contestants in the long run. In chapter four, it was stated that there are two different approaches to calculate TFP. These are the growth accounting approach that utilizes the available data on output, labor input and capital, and uses output elasticities to calculate TFP, and the regression-based approach that considers a specific form of production function and estimates the parameters of production function utilizing the input and output data. This study uses the regression-based approach for its superiority over the growth accounting approach and its simplicity. After driving TFP growth patterns for the sample countries using the regression approach, we proceed to analyze the effects different factors influencing TFP, giving due emphasis to Africa–China trade, Chinese FDI flow and aid allocation to African countries.
TFP is estimated based on comprehensive country-level panel data for 44 African countries. The Fixed Effect model is employed to estimate TFP using the Solow (1956) growth model considering technology as a residual. The necessary data for the calculation of the TFP growth are real GDP per capita (output), capital stock, natural resources extraction and labor participation. The specification shows the relationship between production (Yit) and factors of production, such as physical capital, labor force and technology. Hence TFP, in this case, is calculated by subtracting the contribution of capital, labor and natural resources extraction rate from the total output. The capital stock data were derived from the gross fixed capital formation.
As we have Random effect and Fixed effect static panel data models, one should select the most convenient method to drive TFP. The most commonly used technique to evaluate the models is the Hausman test. Therefore, the Hausman test was conducted to choose between the Fixed Effect Model (FEM) and Random Effect Model (REM). According to the results of the test, we failed to reject FEM. Thus, the FEM was applied to drive TFP. Since we assumed increasing economies of scale, the sum of the coefficients of labor and capital is greater than one. The results reported in Table 2 below show the elasticity of capital and labor force. Using this elasticity, we then derived the residual of the model, deducting the sum of the products of the coefficients of labor and coefficient of capital with their values from the total output or production.
The results reported in Table 2 below show the elasticity of capital, energy and natural resources and labor force. To test the sensitivity of the estimates, we repeated the exercise using fixed capital formation. The results of the alternative estimation are reported in Table A6 in Appendix A. Using this elasticity, the residual of the model is derived deducting the sum of the products of the coefficients of labor, capital and energy with their values from the total output or production. Nonetheless, this exercise does not attempt to explain the forces that drive the growth rates of each of the inputs or factor shares.
The coefficients of capital stock and labor force are robustly positive, indicating that they have a significant effect on output (real GDP per capita). However, the impact of natural resource extraction has a negative effect on output.
Natural resource extraction is negatively associated with GDP per capita, which might be because of appreciation of the exchange rate and the negative consequences related to institutional quality, such as deterioration in governance, corruption, rent-seeking and conflict (Van der Ploeg 2011).
The coefficient of labor is consistent with the standard cross-country analysis that supposes that a two-thirds share of output is commonly assigned to labor (Gollin 2002). However, as human capital is not considered in the analysis, the magnitude of the labor’s coefficient will decrease when decomposed to skilled and non-skilled labor.
On the other hand, the coefficient of physical capital did not reach a one-third share of output. Unlike in the simple model with two factors (labor and physical capital), the magnitude of the coefficient is lower, partly because the residual share (TFP) will have a large growth accounting share and human capital may also contribute relatively larger amounts. Additionally, the share is inconsistent as we have a controlled additional variable (natural resources extraction) unlike the traditional two factors model in the growth accounting. Furthermore, it is argued that traditional estimators can be biased upwards because of measurement error (Caselli 2005). This further implies that creating the incentives for productive factor accumulation is more important for output than factor accumulation itself (Easterly and Levine 2001). Likewise, Ekanayake and Moslares (2020) in the nexus of remittances and economic growth (GDP per capita growth) controlling capital, labor, human capital and remittance found the consistent magnitude (0.0644) of physical capital on GDP per capita growth. Based on the results in Table 2, TFP is derived using the coefficients of capital, labor and natural resources extraction rate. The TFP here is the residual estimated using the coefficients of labor and capital.
The estimates of TFP derived from Table 2 are almost consistent with the growth rate of TFP of Sub-Saharan African countries estimated by Kim and Loayza (2019) for the period 2004–2014. The estimates of TFP derived show the same pattern of TFP growth. For example, some countries, such as Mozambique and Zimbabwe, have quite low average TFP growth rates (negative). Similarly, the values of TFP for these countries are negative in our estimates. Furthermore, their estimates indicate that for Sub-Saharan Africa, TFP growth rates increase from around −1 in 1994 to +1 in the time spanning 1994–2014. Our result shows nearly the same result (average of 1.962), even though the time span is different (2003–2017).
5.2. The Impact of China–Africa Economic Relation on TFP
In the section mentioned above, TFP is calculated, and its values are derived. Therefore, using TFP calculated in the above section, reported in Table 2 as the dependent variable, we examine the effects of trade openness between China and Africa and Chinese FDI flow and aid allocation to African countries on the TFP of African countries conditional to institutional quality. The results of the two-step system GMM model are reported in Table 3. We have regressed controlling the mediating role of an institutional quality index derived using governance indicators such as the absence of violence and instability, government effectiveness, regulatory quality, the rule of law, control of corruption and voice and accountability. The indices of institutional quality, educational level, doing business and border and transport efficiency are derived using principal component analysis. The results of the index of the institutional quality, business environment and transport efficiency are reported in Table A1, Table A2, Table A3 and Table A4, respectively, in Appendix A.
We fail to reject the Hansen test’s insignificant statistics for all system GMM (see Table 3). Therefore, this confirms that the instruments satisfy the orthogonality condition, or all instruments are valid in the model. Similarly, the Wald test for the joint significance of the variables does not reject our model specification. The serial correlation test does not reject the null that there is no second-order serial correlation. Therefore, these diagnostic tests validate the use of the two-step system GMM model to analyze the impact of variables on TFP.
We repeated the exercise controlling additional covariates such as education, doing business environment and transport efficiency indices. However, because of the significant decrease in sample size, the results are reported separately in Table A5 in Appendix A. Thus, these covariates are excluded from further analysis.
The coefficient of the lag of TFP is positive and statistically significant. Besides, the level of infrastructure of African countries has a robust positive effect on the TFP of African countries. Likewise, the effect of health expenditure on TFP is significantly positive, implying that African countries’ health expenditures improve the TFP of African countries. Furthermore, economic freedom has a positive effect on the TFP of African countries.
Turning to our explanatory variables of primary interest, the sign of the coefficient of trade between Africa and China is positive and statistically significant in Column (I) in Table 3. However, the coefficients of Chinese aid allocation and FDI to African countries are insignificant in Column (I), implying that the individual effect of these variables does not have an impact on TFP.
Unlike the previous literature, we further investigate the impacts of the China–Africa economic relationship incorporating the productivity-enhancing domestic absorptive capacity of African countries. We claim that the results presented in Table 3 Column (I) are logical because the Africa–China economic relationship can be constrained by the domestic absorptive capacity of African countries. It should be supported by the domestic absorptive capacity of countries incorporating institutional quality indicators of African countries. For example, it is argued that the absence of good institutions in the developing world has been a significant cause of slow economic growth, and that good institutions or governance are essential for long-term development in the development process through helping countries utilize technology transferred through international trade. Hence, based on the above explanation, we incorporated the interaction term of Africa–China trade, Chinese FDI and aid allocation variables and institutional quality indicator of African countries (Table 3 in Column (II) to Column (IV)). The impact of China–Africa trade on the TFP of African countries is strongly positive. Furthermore, the coefficient of the interaction of the China–Africa trade and institutional quality is positive and significant, revealing that the effect of China–Africa trade is increasing to institutional quality improvement. Therefore, the result is consistent with the hypothesis stated in the study.
In contrast to the coefficients of Chinese FDI and aid alone, the interaction of Chinese FDI with domestic institutional quality of African countries has a robust positive impact on factor productivity for African countries. Therefore, Chinese FDI promotes productivity improvement as the countries’ institutional quality improves considerably (Table 3). Therefore, the result is in line with the hypothesis (H2). Likewise, the coefficient of the interaction term of Chinese financial aid and domestic institutional quality has changed to be positive and statistically significant. Thus, the result supported the acceptance of the hypothesis of the study (Table 4).
Therefore, the government’s ability to formulate and implement sound policies and regulations that are conducive to the private sector and government capacity to keep political stability and avoid ethnic tensions and internal and external conflict is worthwhile for African countries to realize trade benefits. Likewise, effectiveness in evaluating the bureaucratic quality and governments’ commitment to policies is essential to utilize productivity-enhanced technology transfer from China efficiently.
Increase in trade between Africa and China and Chinese FDI and financial aid flow, hence, should be backed by good domestic institutions to change the impact of Africa–China trade, Chinese FDI and financial aid to positive. Therefore, overall improvement in institutional quality is a critical tool to benefit African countries in terms of their TFP from the Africa–China economic relationship.
We also examined the complementarity of China–Africa economic relationship instruments as Africa–China trade, Chinese FDI and aid allocation have been carefully combined (McCormick 2008). Additionally, an increase in trade between countries and an open economy has been known to attract FDI flow and receive more financial aid from trade partner countries (Asamoah et al. 2019). As a result, the interaction terms are included in the model specification. Thus, the results using interaction terms of China–Africa trade and Chinese FDI, Chinese FDI and aid allocation and three of them have been reported in Table 5 below.
The interaction of China–Africa trade and Chinese FDI has a positive and significant effect on the TFP of African countries. Thus, trade relations between countries can also draw attention to resources and markets that can provide investment opportunities. Besides, the interaction term of Chinese aid allocation and FDI is robustly positive. Therefore, from a theoretical standpoint, the financial aid could be complementary to foreign investment. This justification is in line with the arguments that appropriately targeted foreign aid can have an infrastructure effect, which in turn will invite foreign investment and expanding trade through reducing costs of trade and facilitating doing business environment. Finally, the interaction of China–Africa trade, Chinese aid allocation and FDI has a strongly positive effect on TFP of African countries.
5.3. Robustness Test
To check the sensitivity of the result reported in Table 3, we re-examined the model excluding some Chinese major economic partner African countries (South Africa, Zambia and Sudan).
The results are reported in Table 6 below.
The signs of coefficients of our interest variables (China–Africa economic relationship instruments and the interaction terms) and their significance are similar to our results in Table 3. The conditional impacts of China–Africa trade and Chinese FDI and aid allocation on TFP subject to the institutional quality of African countries are statistically robust and reinforce the results in Table 3 (see Table 6).
Similarly, the impacts of the interaction terms of all China–Africa economic relationship instruments on the TFP of African countries are robustly positive and support results in Table 5. That is, the interaction of China–Africa trade openness and FDI to positive and statistically significant, revealing that trade openness between China and African countries fuels the TFP of Chinese FDI and aid allocation to African countries (see Table 7).
6. Discussion and Policy Implications
6.1. Discussion
The theoretical models predict that economic relationships among countries and exposure to external activities of the countries significantly influence countries’ economic performance and result in the differences in economic development. For instance, in their theoretical models, Grossman and Helpman (1991) show that trade among countries can enhance the transfer of new technologies and facilitate countries’ productivity improvement. That is, in addition to its direct effect on capital accumulation, trade among countries can positively impact the economic performance of trading countries through channels such as technology transfers, scale economies and comparative advantage. Therefore, it can generate economic growth by facilitating the diffusion of knowledge and technology from the direct import of high-tech goods.
However, unlike the theoretical notion of the trade-total factor productivity nexus, our findings indicate that the China–Africa trade has a significant negative effect on the total factor of productivity when included in our regression individually. However, it enhances the total factor productivity of African countries subject to the domestic institutional environment as its coefficient turns positively and robustly significant when interacting with African countries’ institutional quality. This finding is inconsistent with the findings of Mayer (2001), Söderbom and Teal (2003), Alcala and Ciccone (2004) and Sun and Heshmati (2012), who found that international trade has an economically significant and statistically robust positive effect on factor productivity.
This finding is further loosely explained because the impact of trade on total factor productivity partly depends on the components of international trade. Among the components of international trade, capital goods imports, intermediate goods imports and exports of manufactured commodities can play a significant role in the TFP of trading countries. In this regard, the China–Africa trade plays a considerable role in enhancing the TFP of African countries. For example, the major commodities African countries imported from China for the last two decades were some goods such as machinery, clothing and textile goods, transport materials, footwear, and plastic commodities. Among these commodities, machinery import was first in share. It has grown by 24% on average. Hence, this plausibly justifies that the China–Africa trade should play a positive role on the total factor productivity of African countries. However, the average institutional quality indicators of African countries are mostly less than the rest of the world. It is worth emphasizing that the China–Africa trade productivity gain depends on the quality of institutions (Dollar and Kraay 2004; Matthew and Folasade 2014). Thus, the weakness of institutional quality negatively affects total factor productivity enhancement of China–Africa trade. On the other hand, countries that have a higher quality of institutions experience larger productivity growth responses of China–Africa trade.
In sum, the relationship between China–Africa trade and factor productivity hinges on African countries’ institutional environment. Hence, our results reveal that the China–Africa trade fosters the total factor productivity of African countries when institutional quality improves. In other words, an environment with high-quality governance seems to be more favorable to the emergence of new knowledge and it allows using productivity or skill transfer embodied in the trade integration, allowing the economy to grow faster.
Additionally, this study investigates the effect of Chinese FDI on the total factor productivity of African countries. The relationship between total factor productivity and FDI emanates from endogenous growth theory that assumes that the FDI spillover effect can be transformed into productivity improvement (Grossman and Helpman 1991). The theory argues that FDI can affect economic growth in FDI-receiving countries through affecting factor productivity.
From the previous literature, it is justifiable to conclude that the impact of FDI on factor productivity is also controversial. Some claim that it has a positive effect on total factor productivity (Herzer 2011; Khordagui and Saleh 2013) and others argue that it has a negative effect on the total factor productivity of FDI-hosting countries (Elu and Price 2010; Shen 2013; Wang et al. 2014).
The findings of our study imply that the effect of Chinese FDI on total factor productivity of African countries is negative and changed to positive when its effect on TFP is mediated by African countries’ institutional environment (see Table 3). This result indicates that the effect of Chinese FDI on the total factor productivity of African countries depends on the level of institutional quality of FDI hosting countries. This finding is logical as a good level of institutional development can favor synergies between FDI and local firms, and hence promote productivity spillovers. On the contrary, the weak institutional framework can negatively affect productive activities and may result in less exploitation of knowledge spillovers by domestic firms. Furthermore, it can be argued that institutions can influence not only the quantity but also the quality of FDI, as foreign firms are non-homogeneous and of varying quality concerning knowledge-spillovers (Ali et al. 2010). Therefore, good institutions effectively channel information to market participants and allow proper exploitation of market opportunities, which in turn favors technology transfer.
In conclusion, this study has extended the relationship between Chinese FDI and total factor productivity based on the endogenous growth theory controlling the mediating role of institutional quality of African countries. It comes with the evidence that the productivity improvement effect of Chinese FDI is conditional to the absorptive capacity of African countries.
Finally, the relationship between Chinese financial aid and total factor productivity of African countries is addressed in detail. According to some studies, the effect of financial aid concentrates not only on direct sources of growth but also on its indirect causes, such as productivity (Kliber and Świerczyńska 2019). It can contribute to total factor productivity growth, especially if it involves investments in infrastructure (Nachega and Fontaine 2006).
However, based on the gaps of the big push theory, another paradigm has emerged, which argues that financial aid works in countries where institutional and macroeconomic frameworks are robust (Burnside and Dollar 2000). That is, financial aid fails to achieve its expected results because of the poor policy environment in the aid-receiving countries (Easterly 2006). Based on this theory, it is claimed that foreign aid has a positive effect on economic growth through supplementing technological skill and productivity (Fayissa and El-kaissy 2012). Hence, financial aid is more effective when the country has strong institutions. To come up with the conclusion, it is enough to control the impact of corruption, political instability and lack of transparency which are common in countries with weak institutions on the use of aid in order to examine the role institutional quality in the relationship between economic growth and financial aid (Addison and Baliamoune-Lutz 2006).
Based on this theoretical framework, the findings of this study support the evidence that aid has a dampening effect on TFP growth when considered individually (see Table 3). Thus, Chinese financial aid flow to African countries requires a conducive institutional environment that positively impacts total factor productivity. These results are in line with the findings of Alvi and Senbeta (2012) reveal aid has a dampening effect on TFP growth. Chinese FDI positively affects the total factor productivity of African countries provided that absorptive capacity is high. Hence, the result concludes that the domestic institutional quality of African countries is vital for improvement in FDI effect on total factor productivity. Therefore, this finding implies that, to enhance the total factor productivity improvement effect of Chinese financial aid, the institutional framework is needed in African countries. This implies that Chinese financial aid allocation should be based on the basis of country performance, combining governance and general policy environment related to institutional quality.
6.2. Practical Implications
Improving institutional quality is an essential aspect of developing economies. Promoting economic openness to the rest of the world in the presence of poor institutional quality, as characterized by corruption, the weak rule of law, ineffective government and regulatory quality, and poor contract enforcement policies may have an adverse effect on the economic performance of the countries. In other words, institutional environment weakness diverts resources from productive sectors to the less productive and rent-seeking sectors (Kandiero and Wadhawan 2003). As countries provide their interaction in the economic relationships among countries in terms of FDI, trade and financial aid, complementary policies such as institutional quality should also be taken into significant consideration.
This study provides new evidence that Chinese FDI to African countries has a positive role on factor productivity when the institutional environment of African countries has a robust and moderate productivity and FDI relationship. From theoretical assumptions, the difference in institutional quality is strongly associated with differences in economic performance across countries. That is, countries with poorer institutional performance perform badly, while countries with better institutional quality tend to perform better in enhancing FDI to boost the productivity of host countries. It is, therefore, imperative to suppose that improvement in countries’ institutional environment has a role in altering the FDI-TFP nexus. In other words, stronger institutions like good and efficient governance, the rule of law and lack of corruption can speed up the process of technology spillover to domestic firms and contributes to the productivity enhancement of FDI inflow, whereas week institutions like the presence of corruption, lack rule of law and property rights could prevent domestic firms from reaping the benefits of the knowledge spillover and productivity improvement effect from the FDI firms. Therefore, the same level of FDI could be expected to induce a different level of productivity improvement in different economies with different levels of institutional quality (Baltabaev 2013; Jude and Levieuge 2016).
To sum up, the benign impacts of Chinese FDI flow to African countries remain contingent upon timely and appropriate policy action by the relevant national authorities to improve the institutional quality environment. In order to benefit from FDI-led productivity, the improvement in the institutional framework should precede FDI attraction, as better institutional quality contributes to the FDI-induced productivity.
The decision to offer financial aid to low-income countries can be made on purely economic grounds. However, in practice, it has been heavily influenced by the commercial and political calculations of donor countries that can be solved by a strong institutional quality in aid-receiving countries. In the minds of many politicians and scholars, this is seen less as effective in speeding up economic growth and more as a humanitarian gesture to less fortunate people. However, if aid-receiving countries have a strong institutional quality, it can positively contribute to the economic growth and factor productivity of aid-receiving countries. Therefore, to maximize the growth benefits of financial aid, there should be a strong institutional quality with commitments to greater transparency and more effective monitoring and accountability in aid handling. Financial aid is more effective in countries where there is good governance and institutional quality.
As a result of this study implies, the impacts of Chinese financial aid on the factor productivity of African countries is conditional to the institutional level of African countries. It gives a good foundation for policymakers to develop policy measures that can improve African countries’ institutional quality. Improvement in institutional quality, in turn, helps countries efficiently use Chinese financial aid for the targeted purposes mitigating both local and donor purposes that divert the aid from its purpose.
Additionally, from the policy point of view, especially promoting China–Africa trade, this study gives a detailed analysis looking at its effect on productivity spillover incorporating the institutional environment of African countries. Among major China’s trading partners among African countries, one can find Angola, South Africa and the Republic of Congo at the forefront. The average institutional-quality performance of Angola and the Republic of Congo is among the weakest. The weak institutional environment, in turn, negatively influences the effects of China–Africa trade on the factor productivity of the countries. Thus, to benefit from China trade, African countries should build sound institutional quality so that they can benefit from the productivity spillover and the accumulation effect of a trade relationship with China.
Furthermore, from both theoretical and practical aspects, it is supposed that trade can benefit countries if they export their comparative advantage or commodity-intensive to abundant resources in the production and import comparatively disadvantaged or commodity-intensive to scarce resources. The nature of the China–Africa trade relationship indicates that African countries mostly export natural resources and raw materials (mineral products, base metals, precious stones, other unclassified primary commodities with only a few shares of textile and clothes) to China. They import processed commodities (machinery, clothing and textile goods, transport materials, footwear and plastic commodities). Therefore, the pattern of trade flow between China and Africa fits the theoretical predictions of international trade as African countries have a comparative advantage in terms of raw materials as a result of their abundance, and they are importing relatively disadvantaged commodities from China. However, from the perspective of practical implications, improvement in the institutional quality of African countries can enhance the factor productivity of China–Africa trade through improving regulatory quality and effectiveness of government, reducing corruption and maintaining the rule of law, and stability. Thus, policymakers should take into account measures that can improve African countries’ institutional environment in the effort to expand their trade capacities to stimulate total factor productivity.
Another practical implication of this study is that it is difficult to separately determine the impacts of the China–Africa economic relationship instruments (China–Africa trade, Chinese FDI and financial aid flow). From general consensus, an increase in trade between countries, and, to that effect, an open economy, has been known to attract FDI flow and receive more financial aid from trade partner countries (Asamoah et al. 2019). These mean that there is an intersection among trade, FDI and aid allocation and examining the impacts of these instruments separately may not give the full conclusion of the impact of China–Africa economic relationship. That is, the effect of financial aid flow from China to African countries on factor productivity is significant and conditional to trade linkage between China and African countries and Chinese FDI flow. From trade-related initiatives, Chinese aid allocation has a meaningful role in facilitating the trade relationship. In this regard, the composition of Chinese financial aid is significantly different from traditional aid providers because the significant amount of China’s financial aid allocation to African countries is toward infrastructure sectors. Thus, Chinese aid allocation should further emphasize financing infrastructural investment.
Furthermore, from the theoretical standpoint, development financial aid could be complementary to foreign investment. This justification is in line with the arguments that appropriately targeted foreign aid can have an infrastructure effect, which in turn will invite foreign investment and expand trade through reducing the costs of trade and facilitating a business environment. When a donor gives aid for trade that is dedicated to infrastructure, enhancing the production capacity for trade facilitation in general, these measures should reduce trade costs, and hence boost exports and attract FDI. Chinese aid can ease critical bottlenecks in African countries by financing public infrastructure that would not have been undertaken by private actors to facilitate trade and FDI flow. Therefore, improving the synergies between Chinese FDI flows and financial aid through providing carefully targeted financial assistance leverages FDI flows and enhance its productivity effect. Besides, trade relations between countries can also draw attention to resources and markets that can provide investment opportunities. Hence, unsurprisingly, greater trade correlates with greater investment flows and stimulates FDI to enhance the factor productivity of host countries. Thus, this study suggests that African countries should promote trade relations with China.
Author Contributions
Conceptualization, M.M. and D.G.B.; methodology, software and data curation, D.G.B.; validation, M.M., J.Y. and D.G.B.; formal analysis, supervision, project administration, and funding acquisition, J.Y.; investigation, resources, writing—original draft preparation, writing—review and editing, and visualization, M.M. All authors have read and agreed to the published version of the manuscript.
Funding
This research was funded by National Natural Science Foundation grant number 71572156 and Sichuan Wine Development Research Center under grant number CJZB18-02.
Conflicts of Interest
The authors declare no conflict of interest.
Appendix A
Additional Tables
The results reported in Table A1, Table A2 and Table A3 are calculated using principal component analysis. Multivariate analysis often starts with data involving a substantial number of correlated variables. Principal component analysis (PCA) is a dimension-reduction tool that can be used to reduce a large set of variables to a small set that still contains most of the information in the large set. It is a mathematical operation that converts (potentially) a number of correlated variables into a (lower) amount of uncorrelated variables called the main components. The first main component accounts for as much information variation as necessary, and as much of the remaining variation as possible is accounted for by each successor component. We select this method because it allows us to apply a purely mathematical transformation without considering any priors about the underlying data structure.
We have derived institutional quality indicators from six single variables using principal component analysis that aim to reduce the dimensionality in data. This changes the data into new aggregate variables. The first aggregate indicator is the business environment. Each principal component is essentially the weighted average of the variables included. The variances of the principal components are eigenvalues of the components. The first principal component usually has the maximum variance for any of the combinations. The rule of law and regulatory quality mostly explain institutional quality as their values are relatively larger compared to the values of control of corruption, government effectiveness, voice and accountability and stability and absence of violence. The first component has an eigenvalue greater than 1 (4.565) and shows 76% of the weight.
Likewise, the education index is derived using primary, secondary and tertiary enrollment to proxy human capital (Table A2). The doing business and transport efficiency indices are derived to proxy business environment. Doing business is calculated using procedure to register property, minimum capital required to start job and cost to register property (Table A3). Documents to export and import as well as time to export and import are used to calculate border and transport efficiency (Table A4). The first components of both doing business and transport efficiency are used.

Table A1.
Principal component analysis for institutional quality African countries.
| Component | PC 1 | PC 2 | PC 3 | PC 4 | PC 5 | PC 6 |
| Eigenvalue | 4.565 | 0.613 | 0.460 | 0.178 | 0.104 | 0.079 |
| Proportion | 0.761 | 0.102 | 0.077 | 0.030 | 0.017 | 0.013 |
| Cumulative | 0.761 | 0.863 | 0.940 | 0.969 | 0.987 | 1.000 |
| Eigenvector | ||||||
| Variable | Vector 1 | Vector 2 | Vector 3 | Vector 4 | Vector 5 | Vector 6 |
| Control corruption | 0.428 | −0.240 | −0.120 | 0.778 | −0.338 | 0.162 |
| Rule of law | 0.448 | −0.178 | −0.051 | −0.072 | 0.134 | −0.861 |
| Regulatory quality | 0.435 | 0.071 | −0.282 | −0.565 | −0.613 | 0.180 |
| Government effectiveness | 0.433 | −0.152 | −0.370 | −0.125 | 0.692 | 0.397 |
| Absence of instability | 0.368 | −0.209 | 0.868 | −0.158 | 0.043 | 0.203 |
| Voice and accountability | 0.322 | 0.916 | 0.117 | 0.177 | 0.110 | −0.027 |
Source: computed by authors.
Table A2.
Index of educational achievement.
| Component | PC1 | PC2 | PC3 |
| Eigenvalue | 1.941 | 0.898 | 0.161 |
| Proportion | 0.647 | 0.299 | 0.054 |
| Cumulative | 0.647 | 0.946 | 1.000 |
| Eigenvector | |||
| Variable | Eigenvector 1 | Eigenvector 2 | Eigenvector 3 |
| Primary | 0.331 | 0.935 | 0.127 |
| Secondary | 0.680 | −0.143 | −0.719 |
| Tertiary | 0.654 | −0.324 | 0.684 |
Table A3.
Index of doing business.
| Component | PC1 | PC2 | PC3 | |
| Eigenvalue | 1.456 | 0.901 | 0.643 | |
| Proportion | 0.485 | 0.300 | 0.214 | |
| Cumulative | 0.485 | 0.786 | 1.000 | |
| Eigenvector | ||||
| Variable | Eigenvector 1 | Eigenvector 2 | Eigenvector 3 | |
| Procedure to register property | −0.4257 | 0.9012 | 0.0817 | |
| Minimum capital required to start job | 0.6309 | 0.3604 | −0.6871 | |
| Cost to register property | 0.6487 | 0.241 | 0.7219 | |
Source: computed by authors.
Table A4.
Index of transport and border efficiency.
| Component | PC1 | PC2 | PC3 | PC4 |
| Eigenvalue | 2.618 | 1.036 | 0.282 | 0.064 |
| Proportion | 0.654 | 0.259 | 0.071 | 0.016 |
| Cumulative | 0.654 | 0.913 | 0.984 | 1.000 |
| Eigenvectors | ||||
| Variable | Eigenvector 1 | Eigenvector 2 | Eigenvector 3 | Eigenvector 4 |
| Document (import) | 0.4771 | 0.5144 | −0.6684 | 0.247 |
| Document (export) | 0.4665 | 0.5377 | 0.6748 | −0.195 |
| Time (import) | 0.5358 | −0.4454 | −0.2134 | −0.6848 |
| Time (export) | 0.5174 | −0.4979 | 0.229 | 0.6573 |
Table A5.
The effects of China–Africa economic relationship on TFP controlling additional covariates (education index, doing business and transport efficiency.
Table A5.
The effects of China–Africa economic relationship on TFP controlling additional covariates (education index, doing business and transport efficiency.
| Variables | Estimates |
|---|---|
| loglagtfp | 0.638 *** (0.105) |
| logmob | −0.002 *** (0.001) |
| logcre | −0.001 (0.001) |
| logfdinorm | 0.016 (0.015) |
| logtradenorm | 0.041 *** (0.011) |
| logloannorm | −0.012 (0.021) |
| logins | 0.007 (0.006) |
| logefree | 0.036 ** (0.018) |
| doingbusiness | −0.002 (0.001) |
| education | 0.008 *** (0.002) |
| btransport | −0.001 (0.000) |
| _cons | 0.643 *** (0.192) |
| Obs. | 145 |
| Groups | 29 |
| Wald (p-value) | 0.000 |
| AB2 (Ch2-sta) p-value | 0.209 |
| Hansen (Ch2sta) p-value | 0.999 |
Notes: *** significant at 1%, ** significant at 5%, * significant at 10%, standard error in parenthesis, AB2test is Arellano and Bond tests for autocorrelation, Hansen test is test for over-identification, Wald: overall fitness of the model test, Obs.: observations, Group: Group of countries.
Table A6.
Alternative regression for TFP derivation.
| loglaborit | 0.127 * (0.067) |
| lognaturalit | −0.010 *** (0.003) |
| logcapitalit | 0.095 *** (0.010) |
| Cons. | 3.067 *** (1.001) |
| Time fixed effect | yes |
| Obs. | 514 |
| Group | 39 |
| Wald chi2(2) p-value | 0.000 |
| sigma_u | 0.860 |
| sigma_e | 0.058 |
| rho | 0.995 |
Notes: *** significant at 1%, * significant at 10%, standard error in parenthesis and Obs: observations. Dependent variable: logarithm form of GDP per capita. Source: Authors’ calculations.
Appendix B. African Countries Included in the Sample
Angola, Benin, Burkina Faso, Botswana, Ivory Coast, Cameroon, Congo Republic, Comoros, Cabo Verde, Djibouti, Algeria, Egypt, Ethiopia, Gabon, Ghana, Guinea, Gambia, Guinea-Bissau, Kenya, Liberia, Libya, Morocco, Madagascar, Mali, Mozambique, Mauritania, Mauritius, Malawi, Namibia, Niger, Nigeria, Rwanda, Sudan, Senegal, Sierra Leone, Seychelles, Chad, Togo, Tunisia, Tanzania, Uganda, South Africa, Zambia and Zimbabwe
References
- Addison, Tony, and Mina Baliamoune-Lutz. 2006. Economic Reform when Institutional Quality is Weak: The Case of the Maghreb. Journal of Policy Modeling 289: 1029–43. [Google Scholar] [CrossRef]
- Adisu, Kinfu, Thomas Sharkey, and Sam C. Okoroafo. 2010. The Impact of Chinese Investment in Africa. International Journal of Business and Management 5: 3–9. [Google Scholar] [CrossRef] [Green Version]
- Alcala, Francisco, and Antonio Ciccone. 2004. Trade and Productivity. Quarterly Journal of Economics 119: 613–46. [Google Scholar] [CrossRef]
- Ali, Fathi, Norbert Fiess, and Ronald MacDonald. 2010. Do Institutions Matter for Foreign Direct Investment? Open Economic Review 21: 201–19. [Google Scholar] [CrossRef]
- Alvi, Shahzad, and Ather Maqsood Ahmed. 2014. Analyzing the Impact of Health and Education on Total Factor Productivity: A Panel Data Approach. Indian Economic Review 49: 109–23. [Google Scholar]
- Alvi, Eskander, and Aberra Senbeta. 2012. Foreign Aid: Good for Investment, Bad for Productivity. Oxford Development Studies 40: 139–61. [Google Scholar] [CrossRef]
- Arellano, Manuel, and Stephen Bond. 1991. Some Tests of Specification for Panel Data: Monte Carlo Evidence and an Application to Employment Equations. The Review of Economic Studies 58: 277–297. [Google Scholar] [CrossRef] [Green Version]
- Asamoah, Lawrence, Emmanuel Kwasi Mensah, and Eric Amoo Bondzie. 2019. Trade Openness, FDI and Economic Growth in Sub-Saharan Africa: Do institutions matter? Transnational Corporations Review 11: 65–79. [Google Scholar] [CrossRef]
- Baltabaev, Botirjan. 2013. Foreign Direct Investment and Total Factor Productivity Growth: New Macro-Evidence. The World Economy 37: 311–34. [Google Scholar] [CrossRef]
- Blomstrom, Magnus. 1986. Foreign Investment and Productive Efficiency: The Case of Mexico. Journal of Industrial Economics 35: 97–110. [Google Scholar] [CrossRef]
- Brautigam, Deborah, and Kevin P. Gallagher. 2014. Bartering Globalization: China’s Commodity-backed Finance in Africa and Latin America. Global Policy 5: 346–52. [Google Scholar] [CrossRef]
- Burnside, Craig, and David Dollar. 2000. Aid, Policies, and Growth. American Economic Review 90: 847–68. [Google Scholar] [CrossRef] [Green Version]
- Busse, Matthias, and Jens Königer. 2012. Trade and Economic Growth: A Re-examination of the Empirical Evidence. Hamburg Institute of International Economics Research Paper No. 123. Hamburg: Hamburg Institute of International Economics (HWWI). [Google Scholar]
- Busse, Matthias, Ceren Erdogan, and Henning Mühlen. 2016. China’s Impact on Africa: The Role of Trade, FDI and Aid. KYKLOS 69: 228–62. [Google Scholar] [CrossRef]
- Caselli, Francesco. 2005. Accounting for Cross-Country Income Differences. In Handbook of Economic Growth. Amsterdam: Elsevier, vol. 1, pp. 679–742. [Google Scholar]
- Chen, Wenjie, David Dollar, and Heiwai Tang. 2018. Why is China investing in Africa? Evidence from the firm level. World Bank Economic Review 32: 610–32. [Google Scholar] [CrossRef] [Green Version]
- China Africa Research Initiative. 2017. Chinese Foreign Aid 2017. Available online: http://www.sais-cari.org/data-chinese-foreign-aid-to-africa (accessed on 13 December 2019).
- China’s Information Office of the State Council. 2011. White Paper on China’s Foreign Aid. Available online: https://www.eu-china.net/upload/pdf/nachrichten/2011-04-21Chinas-ForeignAid-WhitePaper.pdf (accessed on 15 December 2019).
- Dollar, David, and Aart Kraay. 2004. Trade, Growth, and Poverty. The Economic Journal 114: F22–F49. [Google Scholar] [CrossRef] [Green Version]
- Dreher, Axel, and Andreas Fuchs. 2015. Rogue Aid? An Empirical Analysis of China’s Aid Allocation. Canadian Journal of Economics 48: 988–1023. [Google Scholar] [CrossRef]
- Easterly, William. 2006. The White Man’s Burden: Why the West’s Efforts to Aid the Rest have done so Much Ill and so Little Good. New York: Penguin Press. [Google Scholar]
- Easterly, William, and Ross Levine. 2001. It’s Not Factor Accumulation: Stylized Facts and Growth Models. The World Bank Economic Review 15: 177–219. [Google Scholar] [CrossRef]
- Ekanayake, E.M., and Carlos Moslares. 2020. Do Remittances Promote Economic Growth and Reduce Poverty? Evidence from Latin American Countries. Economies 8: 35. [Google Scholar] [CrossRef]
- Elu, Juliet, and Gregory N. Price. 2010. Does China Transfer Productivity Enhancing Technology to Sub-Saharan Africa? Evidence from Manufacturing Firms. African Development Review 22: 587–98. [Google Scholar] [CrossRef]
- Fayissa, Bichaka, and Mohammed I. El-Kaissy. 2012. Foreign aid and the Economic Growth of Developing countries (LDCs): Further Evidence. Studies in Comparative International Development 34: 37–50. [Google Scholar] [CrossRef]
- Foster, Vivien, Butterfield William, Chen Chuan, and Pushak Nataliya. 2008. Building Bridges: China’s Growing Role as Infrastructure Financier for Sub-Saharan Africa. Trends and Policy Options No. 5. Washington: World Bank, Washington: PPIAF. [Google Scholar]
- Gallagher, Kevin P., Rohini Kamal, Yongzhong Wang, and Yanning Chen. 2016. Fueling Growth and Financing Risk. The Benefits and Risks of China’s Development Financing in the Global Energy Sector. GEGI Working Paper No. 002. Boston: Boston University. [Google Scholar]
- Gollin, Douglas. 2002. Getting Income Shares Right. Journal of Political Economy 110: 458–74. [Google Scholar] [CrossRef] [Green Version]
- Grossman, Gene M., and Elhanan Helpman. 1991. Quality Ladders in the Theory of Growth. The Review of Economic Studies 58: 43–61. [Google Scholar] [CrossRef] [Green Version]
- Guillon, Marlène, and Jacky Mathonnat. 2017. Is There a Strategy in China’s Health Official Development Assistance to African Countries? Étudeset Documents, No. 20. France: CERDI. [Google Scholar]
- Henry, Michael, Richard Kneller, and Chris Milner. 2009. Trade, technology transfer and national efficiency in developing countries. European Economic Review 53: 237–54. [Google Scholar] [CrossRef]
- Herzer, Dierk. 2011. The Long-run Relationship between Outward Foreign Direct Investment and Total Factor Productivity: Evidence for Developing Countries. Journal of Development Studies 47: 767–85. [Google Scholar] [CrossRef]
- Jude, Cristina, and Gregory Levieuge. 2016. Growth Effect of Foreign Direct Investment in Developing Economies: The Role of Institutional Quality. The World Economy 40: 715–42. [Google Scholar] [CrossRef]
- Jyhjong, Hwang, Deborah Bräutigam, and Janet Eom. 2016. How Chinese Money is Transforming Africa: It’s Not What You Think. CARI Policy Brief 11. Baltimore: Johns Hopkins University. [Google Scholar]
- Kandiero, Tonia, and Satish Wadhawan. 2003. Institutional Quality, Openness, and Investment in Africa. South African Journal of Economics and Management Science 16: 346–68. [Google Scholar] [CrossRef] [Green Version]
- Khordagui, Nagwa Hosny, and Gehan Saleh. 2013. FDI and Absorptive Capacity in Emerging Economies. Topics in Middle Eastern and African Economies 15: 141–72. [Google Scholar]
- Kim, Young Eun, and Norman V. Loayza. 2019. Productivity Growth: Patterns and Determinants across the World. World Bank Group Policy Research Working Paper No. 8852. Washington: World Bank. [Google Scholar]
- Kliber, Agata, and Katarzyna Andrzejczak Świerczyńska. 2019. Can Aid Stimulate Productivity in Sub-Saharan Africa? A Dynamic Panel Approach. Business and Economic Horizons 15: 158–86. [Google Scholar]
- Kolstad, Ivar, and Arne Wiig. 2011. Better the Devil You Know? Chinese Foreign Direct Investment in Africa. Journal of African Business 12: 31–50. [Google Scholar] [CrossRef]
- Le, Hoi Quoc. 2008. The Theories of Trade, FDI and Technology Transfer: A Survey. Working Paper No. 13. Hanoi: Development and Policies Research Center (DEPOCEN). [Google Scholar]
- Leichenko, Robin M. 2009. Exports, Employment and Production: A Causal Assessment of US States and Regions. Economic Geography 76: 303–25. [Google Scholar] [CrossRef]
- Lucas, Robert E. 1988. On the Mechanics of Economic Development. Journal of Monetary Economics 22: 3–42. [Google Scholar] [CrossRef]
- Matthew, Oluwatoyin, and Adegboye B. Folasade. 2014. Trade Openness, Institutions and Economic Growth in sub-Saharan Africa (SSA). Developing Country Studies 4: 18–30. [Google Scholar]
- Mayer, Jörg. 2001. Technology Diffusion, Human Capital and Economic Growth in Developing Countries. UNCTAD Discussion Paper 154. Geneva: UNCTAD. [Google Scholar]
- McCormick, Dorothy. 2008. China & India as Africa’s New Donors: The Impact of Aid on Development. Review of African Political Economy 35: 73–92. [Google Scholar]
- Ming, Wang. 2010. Empirical Study on African Energy Resources and China’s Outflow Foreign Direct Investment 2002–2007. International Journal of Business Research 10: 195–201. [Google Scholar]
- Nachega, Jean-Claude, and Thomson Fontaine. 2006. Economic Growth and Total Factor Productivity in Niger. IMF Working Paper, No. 06/208. Washington: International Monetary Fund. [Google Scholar]
- Park, Jungsoo. 2010. Projection of Long-Term Total Factor Productivity Growth for 12 Asian Economies. Asian Development Bank Economics Working Paper No. 227. Mandaluyong: Asian Development Bank. [Google Scholar]
- Pigato, Miria, and Wenxia Tang. 2015. China and Africa: Expanding Economic Ties in an Evolving Global Context. Working Paper No. 95161. Washington: World Bank. [Google Scholar]
- Rian, Drogendijk, and Katarina Blomkvist. 2013. Drivers and Motives for Chinese Outward Foreign Direct Investments in Africa. Journal of African Business 14: 75–84. [Google Scholar]
- Rivera-Batiz, Luis A., and Paul M. Romer. 1991. Economic Integration and Endogenous Growth. The Quarterly Journal of Economics 106: 531–55. [Google Scholar] [CrossRef]
- Romer, Paul M. 1990. Endogenous Technological Change. Journal of Political Economy 98: S71–S102. [Google Scholar] [CrossRef] [Green Version]
- Sanfilippo, Marco. 2010. Chinese FDI to Africa: What Is the Nexus with Foreign Economic Cooperation? African Development Review 22: 599–614. [Google Scholar] [CrossRef]
- Shen, Xiaofang. 2013. Private Chinese Investment in Africa: Myths and Realities. World Bank Policy Research Working Paper, No. 6311. Washington: World Bank. [Google Scholar]
- Söderbom, Mans, and Francis Teal. 2003. Openness and Human Capital as Sources of Productivity Growth: An Empirical Investigation. CSAE Working Paper No. 06. Oxford: Centre for the Study of African Economies, University of Oxford. [Google Scholar]
- Solow, Robert M. 1956. A contribution to the Theory of Economic Growth. Quarterly Journal of Economics 70: 65–94. [Google Scholar] [CrossRef]
- Sun, Yun. 2014. China’s Aid to Africa: Monster or Messiah? Washington: Brookings East Asia Commentary. [Google Scholar]
- Sun, Peng, and Almas Heshmati. 2012. International Trade and its Effects on Economic Growth in China. China Economic Policy Review 1: 35–60. [Google Scholar]
- Tralac. 2014. Trade and Law Centre, Africa–China Trade. Available online: http://www.tralac.org/resources/our-resources/4795-Africa–China-trade.html (accessed on 11 November 2018).
- Umejei, Emeka. 2015. China’s Engagement with Nigeria: Opportunity or Opportunist? African East Asian Affairs: The China Monitor 3–4: 54–78. [Google Scholar]
- UNCTAD. 2014. Transfer of Technology and Knowledge Sharing for Development Science, Technology and Innovation issues for Developing Countries. UNCTAD Current Studies on Science, Technology and Innovation No. 8. Geneva: UNCTAD. [Google Scholar]
- Van der Ploeg, Frederick. 2011. Natural Resources: Curse or Blessing? Journal of Economic Literature 492: 366–420. [Google Scholar] [CrossRef] [Green Version]
- Wang, Bijun, Rui Mao, and Qin Gou. 2014. Overseas Impacts of China’s Outward Direct Investment. Asian Economic Policy Review 9: 227–49. [Google Scholar] [CrossRef]
- World Bank. 2011. The Changing Wealth of Nations: Measuring Sustainable Development in the New Millennium. Washington: The World Bank. [Google Scholar]
- Yin, Jason Z., and Sofia Vaschetto. 2011. China’s Business Engagement in Africa. Chinese Economy 44: 43–57. [Google Scholar] [CrossRef]
- Yu, Miaojie. 2010. Trade, Democracy, and the Gravity Equation. Journal of Development Economics 91: 289–300. [Google Scholar] [CrossRef]
Figure 1.
Africa–China trade. Note: Computed by authors based on data from Global Trade Atlas.

Figure 2.
Composition of import of Africa from China. Note: Authors’ own calculation based on data compiled by Trade and Law Centre, Africa–China.
Figure 2.
Composition of import of Africa from China. Note: Authors’ own calculation based on data compiled by Trade and Law Centre, Africa–China.

Figure 3.
Composition of Africa’s export to China. Note: Authors’ own calculation based on data compiled by Trade and Law Centre, Africa–China.
Figure 3.
Composition of Africa’s export to China. Note: Authors’ own calculation based on data compiled by Trade and Law Centre, Africa–China.

Figure 4.
The percentage share of trade with partners. Note: computed by authors.

Figure 5.
The pattern of Africa’s trade with major trade partners. Note: calculated by authors based on data for Africa–US trade from the Census Bureau and Africa–China from Global Trade Atlas.
Figure 5.
The pattern of Africa’s trade with major trade partners. Note: calculated by authors based on data for Africa–US trade from the Census Bureau and Africa–China from Global Trade Atlas.

Figure 6.
Distribution of Chinese FDI in Africa. Note: Authors’ computation from China–Africa Research Initiative AidData.
Figure 6.
Distribution of Chinese FDI in Africa. Note: Authors’ computation from China–Africa Research Initiative AidData.

Figure 7.
Chinese financial aid to Africa. Note: Computed by the author from China–Africa Research Initiative AidData.
Figure 7.
Chinese financial aid to Africa. Note: Computed by the author from China–Africa Research Initiative AidData.

Table 1.
Definition of variables and source of data.
| Variable | Definition of Variables | Source of Data |
|---|---|---|
| loggdpcit | Logarithm form of real GDP per capita (in Million US Dollar at constant 2005 US dollar) | WDI |
| loglabit | Logarithm form of the labor force (in Million labor unit) | WDI |
| logkit | Logarithm form of capital derived from gross fixed capital formation (in Million US Dollar) | WDI |
| loginsit | Logarithm form of institutional quality index of countries | WGI |
| logcreit | Logarithm form of credit to private sector from banks (% of GDP) | WDI |
| loghealit | Logarithm form of health expenditure (% GDP) to proxy human capital | WDI |
| lognaturalit | Logarithm form of natural resources extraction rate (% of GNI) | WDI |
| logchinatradeit | Logarithm form of the trade between China to African countries | China Africa Research Initiative |
| logaidchinait | Logarithm form of official development assistance (aid) from China to Africa particularly loan | China Africa Research Initiative |
| loginfrit | Logarithm form of mobile subscription of African countries | WDI |
| logcreit | Logarithm form of the domestic credit to private sector per GDP | WDI |
| logfdichinait | Logarithm form of Chinese FDI flow to African countries | China Africa Research Initiative |
Table 2.
Derivation of parameters to calculate total factor productivity (TFP).
| Variables | I (REM) | II(FEM) |
|---|---|---|
| lnlaborit | 0.527 *** (0.030) | 0.630 *** (0.027) |
| lncapitalit | 0.044 *** (0.008) | 0.032 *** (0.007) |
| lnenergyit | −0.006 * (0.003) | −0.009 *** (0.003) |
| Constant | −1.944 *** (0.414) | −3.248 *** (0.373) |
| Obs. | 498 | 498 |
| Group | 37 | 37 |
| Wald chi2(2) p-value | 0.000 | 0 |
| sigma_u | 0.510 | 1.252 |
| sigma_e | 0.064 | 0.064 |
| rho | 0.985 | 0.997 |
| Hausman fixed random: chi2(2) = (b−B)’[(V_b−V_B)^(−1)](b−B) | 0.000 |
Notes: *** significant at 1%, * significant at 10%, standard error in parenthesis and Obs: observations. Dependent variable: logarithm form of GDP per capita. Source: Authors’ calculations.
Table 3.
The effects of China–Africa economic relationship on the TFP of African countries.
| Variables | I | II | III | IV |
|---|---|---|---|---|
| lnlagtfpit | 0.859 *** (0.012) | 0.792 *** (0.014) | 0.882 *** (0.013) | 0.893 *** (0.017) |
| lninfrit | 0.001 *** (0.000) | 0.001 * (0.000) | 0.002 *** (0.000) | 0.002 *** (0.000) |
| lncreit | 0.002 *** (0.001) | −0.001 ** (0.001) | 0.000 (0.001) | −0.001 (0.000) |
| lnhealit | 0.006 *** (0.001) | 0.006 *** (0.001) | 0.007 *** (0.001) | 0.008 *** (0.001) |
| lnfdichinait | 0.001 (0.004) | 0.001 (0.001) | −0.004 *** (0.001) | −0.005 *** (0.001) |
| lntradechinait | 0.013 *** (0.002) | −0.008 ** (0.004) | −0.062 *** (0.009) | 0.008 *** (0.003) |
| lnloanchinait | 0.003 (0.002) | −0.003 (0.002) | 0.007 *** (0.002) | −0.017 * (0.010) |
| lninsit | −0.005 ** (0.002) | −0.002 (0.002) | −0.008 *** (0.001) | −0.006 *** (0.002) |
| lnefreeit | 0.004 * (0.002) | −0.006 * (0.004) | 0.005 *** (0.002) | 0.006 *** (0.002) |
| ins.fdiit | 0.002 *** (0.000) | |||
| ins.tradeit | 0.044 *** (0.005) | |||
| ins.aidit | 0.004 ** (0.002) | |||
| _cons | 0.259 *** (0.022) | 0.405 *** (0.031) | 0.220 *** (0.027) | 0.193 *** (0.032) |
| Obs. | 397 | 397 | 397 | 397 |
| Groups | 35 | 35 | 35 | 35 |
| Wald (p-value) | 0.000 | 0.000 | 0.000 | 0.000 |
| AB2 (Ch2-sta) p-value | 0.511 | 0.152 | 0.732 | 0.623 |
| Hansen (Ch2sta) p-value | 0.983 | 0.992 | 0.949 | 0.965 |
Notes: *** significant at 1%, ** significant at 5%, * significant at 10%, standard error in parenthesis, AB2test is Arellano and Bond tests for autocorrelation, Hansen test is test for over-identification, Wald: overall fitness of the model test, Obs.: observations, Group: Group of countries.
Table 4.
Hypothesis test.
| Parameter | Estimate | Std. Err. | z-Value | p-Value | Decision |
|---|---|---|---|---|---|
| H1 (ins.tradeit) | 0.044 | 0.005 | 8.25 | 0.000 | supported |
| H2 (ins.fdiit) | 0.002 | 0.000 | 9.72 | 0.000 | supported |
| H3 (ins.aidit) | 0.004 | 0.002 | 2.38 | 0.017 | supported |
Notes: ins.tradeit, ins.fdiit and ins.aidit are the interaction terms of China–Africa trade and institutional quality, Chinese FDI and institutional quality and Chinese aid and institutional quality, respectively.
Table 5.
The effects of China–Africa economic relationship on the TFP of African countries.
| Variables | I | II | III | IV |
|---|---|---|---|---|
| lnlagtfpit | 0.859 *** (0.012) | 0.783 *** (0.016) | 0.884 *** (0.015) | 0.894 *** (0.016) |
| lninfrit | 0.001 *** (0.000) | −0.001 (0.001) | 0.002 *** (0.000) | 0.002 *** (0.000) |
| lncreit | 0.002 *** (0.001) | 0.000 (0.001) | 0.000 (0.001) | 0.000 (0.001) |
| lnhealit | 0.006 *** (0.001) | 0.003 *** (0.001) | 0.007 *** (0.001) | 0.008 *** (0.001) |
| lnfdichinait | 0.001 (0.004) | 0.002 ** (0.001) | −0.005 *** (0.001) | −0.004 *** (0.001) |
| lntradechinait | 0.013 *** (0.002) | −0.012 *** (0.003) | 0.001 (0.002) | 0.003 (0.003) |
| lnloanchinait | 0.003 (0.002) | 0.001 (0.002) | −0.053 *** (0.009) | −0.001 (0.002) |
| lninsit | −0.005 ** (0.002) | 0.004 (0.002) | −0.005 *** (0.001) | −0.007 *** (0.001) |
| lnefreeit | 0.004 * (0.002) | −0.003 (0.003) | 0.003 *** (0.001) | 0.004 ** (0.002) |
| trade.fdiit | 0.002 *** (0.000) | |||
| fdi.aidit | 0.008 *** (0.001) | |||
| trade.fdi.aidit | 0.291 *** (0.051) | |||
| _cons | 0.259 *** (0.022) | 0.419 *** (0.034) | 0.212 *** (0.030) | 0.195 *** (0.032) |
| Obs. | 397 | 397 | 397 | 397 |
| Groups | 35 | 35 | 35 | 35 |
| Wald (p-value) | 0.000 | 0.000 | 0.000 | 0.000 |
| AB2 (Ch2-sta) p-value | 0.511 | 0.105 | 0.449 | 0.624 |
| Hansen (Ch2sta) p-value | 0.983 | 0.938 | 0.938 | 0.915 |
Notes: *** significant at 1%, ** significant at 5%, standard error in parenthesis, AB2test is Arellano and Bond tests for autocorrelation, Hansen test is test for over-identification, Wald: overall fitness of the model test, Obs.: observations, Group: Group of countries.
Table 6.
The effects of China–Africa economic relationship on the TFP of African countries.
| Variables | I | II | III | IV |
|---|---|---|---|---|
| lnlagtfpit | 0.839 *** (0.018) | 0.682 *** (0.023) | 0.827 *** (0.015) | 0.851 *** (0.017) |
| lninfrit | 0.002 *** (0.000) | 0.001 (0.000) | 0.001 *** (0.00) | 0.002 *** (0.000) |
| lncreit | 0.000 (0.001) | 0.001 (0.001) | 0.001 (0.001) | 0.000 (0.001) |
| lnhealit | 0.008 *** (0.001) | 0.002 (0.002) | 0.006 *** (0.002) | 0.009 *** (0.002) |
| lnfdichinait | 0.002 (0.002) | 0.015 *** (0.003) | 0.005 (0.004) | 0.003 (0.003) |
| lntradechinait | 0.003 (0.002) | −0.001 (0.003) | −0.116 *** (0.040) | 0.005 * (0.003) |
| lnloanchinait | 0.005 * (0.003) | 0.002 (0.002) | 0.005 (0.003) | −0.024 ** (0.010) |
| lninsit | −0.006 *** (0.002) | 0.007 ** (0.003) | −0.010 *** (0.003) | −0.005 ** (0.002) |
| lnefreeit | 0.002 * (0.001) | −0.015 *** (0.004) | 0.005 *** (0.001) | 0.002 (0.001) |
| ins.fdiit | 0.002 *** (0.000) | |||
| ins.tradeit | 0.078 *** (0.025) | |||
| ins.aidit | 0.005 *** (0.002) | |||
| _cons | 0.305 *** (0.036) | 0.626 *** (0.051) | 0.332 *** (0.032) | 0.276 *** (0.035) |
| Obs. | 382 | 382 | 382 | 382 |
| Groups | 33.000 | 33 | 33 | 33 |
| Wald (p-value) | 0.000 | 0.000 | 0.000 | 0.000 |
| AB2 (Ch2-sta) p-value | 0.728 | 0.062 | 0.841 | 0.713 |
| Hansen (Ch2sta) p-value | 0.903 | 0.992 | 0.993 | 0.962 |
Notes: *** significant at 1%, ** significant at 5%, * significant at 10%, standard error in parenthesis, AB2test is Arellano and Bond tests for autocorrelation, Hansen test is test for over-identification, Wald: overall fitness of the model test, Obs.: observations, Group: Group of countries.
Table 7.
The effects of China–Africa economic relationship on the TFP of African countries.
| Variables | I | II | III | IV |
|---|---|---|---|---|
| lnlagtfpit | 0.839 *** (0.018) | 0.650 *** (0.013) | 0.847 *** (0.016) | 0.851 *** (0.019) |
| lninfrit | 0.002 *** (0.000) | −0.002 *** (0.000) | 0.002 *** (0.000) | 0.002 *** (0.000) |
| lncreit | 0.000 (0.001) | 0.003 *** (0.001) | 0.000 (0.001) | −0.001 (0.001) |
| lnhealit | 0.008 *** (0.001) | −0.001 (0.002) | 0.006 *** (0.002) | 0.008 *** (0.002) |
| lnfdichinait | 0.002 (0.002) | 0.015 *** (0.003) | 0.004 (0.003) | 0.004 (0.003) |
| lntradechinait | 0.003 (0.002) | −0.009 ** (0.004) | 0.002 (0.003) | 0.002 (0.002) |
| lnloanchinait | 0.005 * (0.003) | 0.001 (0.002) | −0.034 ** (0.013) | 0.000 (0.002) |
| lninsit | −0.006 *** (0.002) | 0.005 ** (0.002) | −0.002 (0.002) | −0.007 *** (0.001) |
| lnefreeit | 0.002* (0.001) | −0.010 *** (0.004) | 0.000 (0.001) | 0.002 (0.002) |
| trade.fdiit | 0.003 *** (0.000) | |||
| fdi.aidit | 0.006 *** (0.002) | |||
| trade.fdi.aidit | 0.172 * (0.094) | |||
| _cons | 0.305 *** (0.036) | 0.696 *** (0.031) | 0.286 *** (0.034) | 0.281 *** (0.040) |
| Obs. | 382 | 382 | 369 | 382 |
| Groups | 33.000 | 33 | 33 | 33 |
| Wald (p-value) | 0.000 | 0 | 0 | 0 |
| AB2 (Ch2-sta) p-value | 0.728 | 0.144 | 0.428 | 0.78 |
| Hansen (Ch2sta) p-value | 0.903 | 0.992 | 0.991 | 0.925 |
Notes: *** significant at 1%, ** significant at 5%, * significant at 10%, standard error in parenthesis, AB2test is Arellano and Bond tests for autocorrelation, Hansen test is test for over-identification, Wald: overall fitness of the model test, Obs.: observations, Group: Group of countries.
© 2020 by the authors. Licensee MDPI, Basel, Switzerland. This article is an open access article distributed under the terms and conditions of the Creative Commons Attribution (CC BY) license (http://creativecommons.org/licenses/by/4.0/).
Share and Cite
MDPI and ACS Style
Miao, M.; Yushi, J.; Borojo, D.G. The Impacts of China–Africa Economic Relation on Factor Productivity of African Countries. Economies 2020, 8, 47. https://doi.org/10.3390/economies8020047
AMA Style
Miao M, Yushi J, Borojo DG. The Impacts of China–Africa Economic Relation on Factor Productivity of African Countries. Economies. 2020; 8(2):47. https://doi.org/10.3390/economies8020047
Chicago/Turabian StyleMiao, Miao, Jiang Yushi, and Dinkneh Gebre Borojo. 2020. "The Impacts of China–Africa Economic Relation on Factor Productivity of African Countries" Economies 8, no. 2: 47. https://doi.org/10.3390/economies8020047
Note that from the first issue of 2016, this journal uses article numbers instead of page numbers. See further details here.