
Duration of the Membership in the World Trade Organization and Aid for Trade Flows

World Trade Organization, Rue de Lausanne 154, CH-1211 Geneva, Switzerland
Economies 2023, 11(6), 168; https://doi.org/10.3390/economies11060168
Submission received: 24 April 2023
/
Revised: 8 June 2023
/
Accepted: 9 June 2023
/
Published: 14 June 2023
(This article belongs to the Section Economic Development)
Abstract
:In examining the effect of membership in the World Trade Organization (WTO) on the amounts of Aid for Trade (AfT) that accrue to developing countries, Lee et al. (2015) (The World Economy, 38, 2015 and 1462) have found that developing country members of the World Trade Organization (WTO) received higher AfT flows than non-WTO developing members. The present paper deepens the analysis by Lee et al. (2015) by investigating the effect of the duration of WTO membership on the amounts of AfT flows that accrue to recipient countries. The duration of membership in the WTO captures both the membership in the WTO and the time spent by a country in the organization. The main argument in this analysis is that the duration of WTO membership matters more than the mere WTO membership for the degree of liberalization in AfT recipient countries’ trade regimes and their participation in international trade, the latter being a critical determinant of the AfT flows supplied by donors. This analysis has relied on a panel dataset of 136 countries over the period from 2002 to 2019, and the two-step generalized method of moments estimator. It has established that countries receive higher AfT flows as their membership duration increases, and the amounts of these resource inflows increase as recipient countries further liberalize their trade regime and further participate in international trade. Additionally, the effect of the duration of WTO membership on total AfT flows depends on donor-countries’ commercial self-interest in recipient countries, including the latter’s economic growth performance and endowment in natural resources.
JEL Classification:
F1; O191. Introduction
In a recent paper, Lee et al. (2015) have investigated the effect of membership in the World Trade Organization (WTO) on the amounts of Aid for Trade (AfT) that accrue to developing countries. The present article aims to deepen this study by examining the extent to which the duration of membership in the WTO affects the amounts of AfT flows that accrue to developing countries. In contrast with the work of Lee et al. (2015) that focuses on mere membership in the WTO, the present analysis considers both the membership and the time spent by a given AfT recipient country as a member of the WTO.
Aid for Trade (AfT), as part of the official development assistance, is now recognized as an important policy tool for fostering the integration of developing countries into the multilateral trading system. The initiative to secure special financial resources to enhance the participation of developing countries in international trade dates back to the year 2005, when, at the Hong Kong Ministerial Conference, Trade Ministers of the World Trade Organization (WTO) agreed to set up the AfT Initiative. The desire to mobilize greater financial resources for the development of the international trade sector came from the realization by WTO Members that developing countries were marginalized in the world trade due to a number of structural constraints1 that were undermining their connection to international markets (e.g., Hallaert 2010; Hallaert and Munro 2009). The AfT Initiative aims to help address these constraints, notably by “assisting developing countries, particularly least developed countries2 (LDCs) build the supply-side capacity and trade-related infrastructure that they need to assist them to implement and benefit from WTO Agreements and more broadly to expand their trade” (WTO 2005, p. 57). After the launch of the AfT initiative, many of the studies that have examined its effectiveness have reported a positive effect of AfT flows, including on developing countries’ export performance (e.g., Benziane et al. 2022)3 and, under certain conditions, on economic growth performance (e.g., Naito 2016) and poverty reduction (e.g., Gnangnon 2021a). These studies highlight the importance of AfT flows for developing countries. One question that merits investigation is whether longstanding WTO developing members states receive higher or lower AfT flows than relatively new developing member states?
Several works have investigated the factors underpinning the supply of AfT flows (e.g., Gamberoni and Newfarmer 2014; Tadasse and Fayissa 2009; Lee et al. 2015; Gnangnon 2017, 2019, 2021b). Among these studies, only Lee et al. (2015) have considered how membership (or not) in the WTO of AfT recipient countries affects the amounts of AfT that accrue to them. Using AfT commitments data over the period from 2001 to 2010, Lee et al. (2015) have observed that WTO developing members received 24.1 per cent more AfT dollars and a 43.3 per cent greater number of AfT projects than non-WTO developing members. Although LDC WTO members received more AfT than non-WTO LDCs, the difference has not increased since the launch of the AfT initiative. Finally, for LDC members, WTO membership has exerted a higher positive effect on AfT for building productive capacity and AfT for trade policy and regulation than on AfT for economic infrastructure.
However, studying only the effect of WTO membership on AfT inflows does not tell the full story about the relationship between such a membership and AfT flows. We argue that the duration of a developing country’s membership in the WTO for a developing country may matter most for the amounts of AfT that it receives from donors. This is because such a duration captures not only mere membership in the WTO, but also the time (the number of years) spent by a country as a member of the organization. Relying simply on WTO membership to perform the analysis, therefore, disregards the second aspect of this membership, which is the time spent as a WTO member. For example, Dutt (2020) has uncovered that WTO membership exerts a strong positive effect on trade flows, and the magnitude of this effect increases almost monotonically with years of membership. In light of the potential relationship between developing countries’ participation in international trade and AfT flows (e.g., Gnangnon 2017, 2021b; Lee et al. 2015), one could question whether there is (or not) a relationship between the duration of WTO membership and AfT inflows. The relevance of this question lies in the rejection of the hypothesis of the Kruskal–Wallis test (Kruskal and Wallis 1952) that the amounts of AfT that accrue to recipient countries are equally distributed regardless of these countries’ membership duration of WTO membership. In fact, we performed the Kruskal–Wallis test (Kruskal and Wallis 1952), which is a nonparametric test similar to the one-way analysis of variance. It allows for the comparison of the distribution of outcomes among three or more independent (unmatched) groups. The null hypothesis of this test is that the distribution of an outcome is equal among the different groups that are the subject of the test. In particular, we used the Kruskal–Wallis test to examine whether the amounts of AfT that accrue to recipient-countries are the same regardless of the duration of WTO membership. Using a panel dataset of 136 countries over the period from 2002 to 2019, we performed this test over the full sample, the sub-sample of LDCs, and the sub-sample of ‘Other countries’ in the full sample (i.e., NonLDCs). The chi-squared statistics and the related p-value (which is in parenthesis) for the full sample, the LDCs, and the NonLDCs are, respectively, 92.5 (0.0001), 57.7 (0.0002), and 61.5 (0.0001). As these p-values are lower than 0.05 (at the 5% level), we therefore rejected the above-mentioned null hypothesis, and concluded that the duration of WTO membership genuinely matters for the AfT amounts that are received by countries from donors.
The present paper purports to address this question. In addition to focusing on the duration of membership in the WTO rather than on mere membership, it complements the work by Lee et al. (2015) in two main ways. First, in contrast with Lee et al. (2015), the paper uses AfT disbursements data rather than AfT commitments data, the former reflecting more accurately the amounts of AfT that accrue to recipient countries. Second, it explores some possible channels through which the duration of WTO membership can affect AfT flows to recipients.
The WTO membership duration can be crucial for donors’ supply of AfT flows to recipient countries. The rationale for this is that, on the one hand, the recipient country’s level of trade policy liberalization (or trade openness) is an important determinant of donors’ AfT supply (e.g., Lee et al. 2015; Gnangnon 2019, 2021b), while on the other hand, the membership duration can affect extent of the AfT recipients’ trade policy liberalization and degree of trade openness, including their level of participation in international trade (e.g., Dutt 2020).
The WTO members’ trade policy is subject to transparency4 rules and rigorous scrutiny by their counterparts at the WTO (which is referred to as the multilateral surveillance of trade policies), notably the Trade Policy Review Mechanism5. The WTO provides for a stable and predictable trading environment thanks to members’ commitments to reducing and binding tariff rates, and to limiting the utilization of non-tariff trade barriers6 (e.g., Chowdhury et al. 2021; Koopman et al. 2020; Mansfield and Reinhardt 2008). WTO Members have to disclose their trade regulations and notify changes to these regulations7 to the WTO (e.g., Chowdhury et al. 2021) and WTO bodies, including the Councils and Committees as well as the Trade Policy Review Mechanism (TPRM) who monitor the fulfilment of these obligations by members (e.g., Chaisse and Matsushita 2013; Ghosh 2010; Laird 1999). Moreover, the dispute settlement legal rulings of the WTO contribute to promoting multilateral trade liberalization both by addressing trade problems for complainants and improving market access for all WTO members (e.g., Shin and Ahn 2019). Many studies have established that membership8 in the WTO contributes to strongly promoting trade flows, including export and import flows (e.g., Chang and Lee 2011; Chemutai and Escaith 2017; Dutt 2020; Eicher and Henn 2011; Larch et al. 2019; Subramanian and Wei 2007; Tomz et al. 2007). Membership in the WTO can also help improve governance9, domestic policies, and trade-related institutions (e.g., Aaronson and Abouharb 2014; Basu 2008; Drabek and Bacchetta 2004).
Building on these benefits of membership in the WTO, a number of recent papers have documented the potential positive effects of the duration of WTO membership on the utilization of non-reciprocal trade preferences by developing countries (Gnangnon 2021c), investment-oriented remittances inflows (Gnangnon 2023a), and trade cost reduction (Gnangnon 2023b). The argument at the heart of these papers is that as the duration of their membership increases, WTO members improve their trade regimes, including by further liberalizing their trade policies and achieving higher levels of trade openness. As a result, one could expect that donors would supply higher AfT flows to countries that have made efforts to reform their trade regimes (by improving governance and trade-related domestic policies and institutions) and experience greater trade openness (e.g., Gnangnon 2017, 2018, 2021b; Lee et al. 2015). In this scenario, the duration of WTO membership will exert a positive effect on AfT inflows (hypothesis 1), and the greater the degree of trade policy liberalization (or trade openness), the higher the magnitude of this positive effect (hypothesis 2). On the other hand, donors may prefer to supply greater AfT flows to countries that, due to capacity constraints (including human, financial, and institutional capacity constraints), have not been capable of liberalizing their trade regimes, as expected. This argument is further supported by the fact that government effectiveness is a proxy for recipient countries’ ability to use aid effectively (e.g., Lee et al. 2015). In this case, the duration of the WTO membership would exert a positive effect in countries with low levels of trade policy liberalization (or trade openness) (hypothesis 3).
On another note, recipient countries’ natural resource endowment (that represents their natural resource wealth) and economic growth performance (as a proxy for their market potential) reflect donors’ commercial self-interest and are therefore two important determinants of the supply of AfT flows by donor countries (Lee et al. 2015). One may, therefore, question whether AfT recipient countries that are well endowed in natural resources or enjoy higher economic growth performance receive higher AfT flows as the duration membership expands. From the theoretical perspective, one can postulate that donors may be willing to supply higher AfT flows to countries that are well endowed in natural resources or that enjoy a high economic growth performance. Donors will do because they may be willing to either exploit these natural resources or export to these countries, as a higher economic growth in the recipient countries could translate into a higher demand for foreign products10. In this case, as recipient countries expand their membership duration in the WTO and eventually experience an improvement in their economic growth performance11, they would enjoy higher AfT flows. The amounts of such aid are likely to increase as their economic growth performance rises. Similarly, the duration of WTO membership could exert a positive effect on AfT flows for countries that are well endowed in natural resources, with the magnitude of this positive effect increasing as the endowment in natural resources rises.
Overall, we can expect that the duration of WTO membership would positively affect AfT flows in countries with fast growth or that are well endowed in natural resources (hypothesis 4). It is, however, possible that membership duration will positively influence AfT flows to recipient countries that have low economic growth performance, or those that are less endowed in natural resources. The argument here is that being less endowed in natural resources may signify limited opportunities to raise domestic financial resources (i.e., natural resource rents), apart from eventually mobilizing higher public revenue. In this case, donors may be willing to supply higher AfT flows to these countries, in particular to the less developed countries among them that are in need of huge amounts of financial resources for their economic development. As a result, one can expect that membership duration will induce higher AfT flows in countries that are less endowed in natural resources. Along the same lines, donors may opt for extending higher AfT flows to low-growth performing countries, with a view to helping them expand their exports, and eventually increase their imports from these donors. In summary, an alternative assumption to hypothesis 4 is hypothesis 5, which is as follows. We expect that as low-economic growth performing countries or countries less endowed in natural resources expand their membership duration, they would receive higher AfT flows (hypothesis 5).
The empirical analysis has established that the duration of WTO membership has exerted a positive effect on total AfT flows, including both AfT flows for economic infrastructure and AfT flows for productive capacities. The duration of WTO membership exerts no significant effect on AfT related to trade policy and regulation. On another note, countries that further liberalize their trade regimes and improve their participation in international trade receive higher AfT flows as they experience an increase in the duration of WTO membership. Donor-countries’ commercial interest in recipient countries proxied by the latter’s economic growth performance and endowment in natural resources also influence the amounts of AfT flows that accrue to recipient countries.
The remaining part of this paper empirically tests hypotheses 1 to 6, and is organized around three sections. Section 2 lays down the model specification that will help perform the empirical analysis, and briefly explains the econometric approach used to estimate this model specification and its different variants. It also briefly presents a data analysis. Section 3 interprets the empirical outcomes, and Section 4 provides a robustness check analysis. Section 5 concludes.
2. Empirical Strategy
This section first presents the model specification that allows for the empirical testing of the hypotheses set out above (see Section 2.1). It then provides some graphical analyses of the variables of interest in this study (see Section 2.2). Finally, it discusses the econometric method used to perform the empirical analysis (see Section 2.3).
2.1. Model Specification
To empirically test hypotheses 1 to 6, we follow previous works on the macroeconomic determinants of AfT flows (e.g., Lee et al. 2015; Gnangnon 2017, 2018, 2019, 2021b), and postulate the following baseline model specification12.
i and t are, respectively, the subscripts for an AfT recipient country and the time-period. We have constructed an unbalanced panel dataset of 136 AfT recipient countries, using non-overlapping sub-periods of 3-year average data, with a view to reducing the effect of business cycles on variables at hand. These sub-periods are 2002–2004; 2005–2007; 2008–2010; 2011–2013; 2014–2016; and 2017–2019. represent countries’ heterogeneity, i.e., their unobserved time-invariant fixed effects. stands for global shocks that simultaneously affect all countries’ AfT inflows. is a well-behaving error term. to are coefficients that we will estimate.
The dependent variable “AfT” is the real gross disbursements of AfT flows, expressed in constant prices 2019, US Dollar. AfT variables used in this analysis are described in Table A1 under Appendix A. They are the total AfT flows (“AfTTOT”), but also its three components, namely, AfT flows for the build-up of economic infrastructure (“AfTINFRA”), AfT flows for fostering productive capacities (“AfTPROD”), and AfT related to trade policy and regulation (“AfTPOL”).
The variable “NUMBWTO”, which is our key regressor of interest, is the “transformed” indicator of a country’s duration of WTO membership. For a given country, it represents the time elapsed since the country has joined the WTO, denoted “NUMBWTO1”. The latter takes the value of “0” for years during which the country was not a WTO member. It takes the value of “1” the first year the country became a WTO member (i.e., the year it acceded to the WTO), and is incremented by 1 for every subsequent (additional) year. Note that, for any country that had joined the WTO before 2002 (which is the first year of the period under analysis), the value of “1” has been attributed to the year (i.e., between 1995 and 2002) during which the country had acceded to the WTO, and then incremented by “1” for every additional year until the last year of the period under analysis. For example, for countries that joined the WTO in 1995, the variable “NUMBWTO1” takes the value of “1” in 1995, and hence “8” in 2002, “9” in 2003, … and “25” in 2019. The variable “NUMBWTO1” takes the value of “0” for every year from 2002 to 2019 for countries that are not WTO Members. For a given country, the higher the value of the indicator “NUMBWTO1”, the greater the duration of the WTO membership. As the variable “NUMBWTO1” contains many zeros and has a skewed distribution, it has been transformed using the following formula: NUMBWTO .
All other regressors are described in Table A1 under Appendix A. Table A2 under Appendix A reports the descriptive statistics related to variables in model (1), and Table A3 under Appendix A contains the list of countries used in the analysis as well as their membership duration as at 2019.
The variable “GDPC” represents real per capita income, and is a proxy for countries’ development level. It has been introduced in model (1) along with its squared term, with a view to capturing the potential non-linear relationship between AfT recipient countries’ real per capita income and the amounts of AfT that accrue to them; AfT inflows are expected to fall as the real per capita income increases (e.g., Lee et al. 2015; Gnangnon 2021b).
The variable “NonAfT” represents NonAfT flows, i.e., the portion of total development aid (i.e., the official development aid) devoted to sectors in the economy other than the trade and trade-related sectors. We expect a positive effect of NonAfT flows on total AfT flows, in particular if donors give priorities to both trade and non-trade-related sectors in recipient countries (e.g., Gnangnon 2021b).
The variables “GROWTH” and “RENT” are, respectively, the economic growth rate (as a proxy for the market potential) and the endowment in natural resources (proxied by the share of natural resources rents in GDP) of recipient countries (e.g., Lee et al. 2015). As noted above, these two variables have been introduced in model (1) in order to take into account the effect of donors’ commercial self-interest on the amounts of AfT supplied to developing countries. As is also emphasized above, it is possible that countries that are well endowed in natural resources or experience an improvement in their economic growth performance may receive higher AfT flows.
Finally, the variable “POP”, which represents the population size, has been introduced in the baseline model (1) in order to capture the effect of the size of recipient countries on AfT flows (e.g., Gnangnon 2018, 2021b; Lee et al. 2015). For example, donors may provide higher amounts of AfT to smaller countries than to larger ones, because it is relatively easier for them to exert a higher political influence on smaller countries than on larger ones (e.g., Younas 2008).
All variables except for the economic growth rate and the share of natural resources rents in GDP have been transformed into natural logarithms in order to reduce their skewed distributions.
2.2. Data Analysis
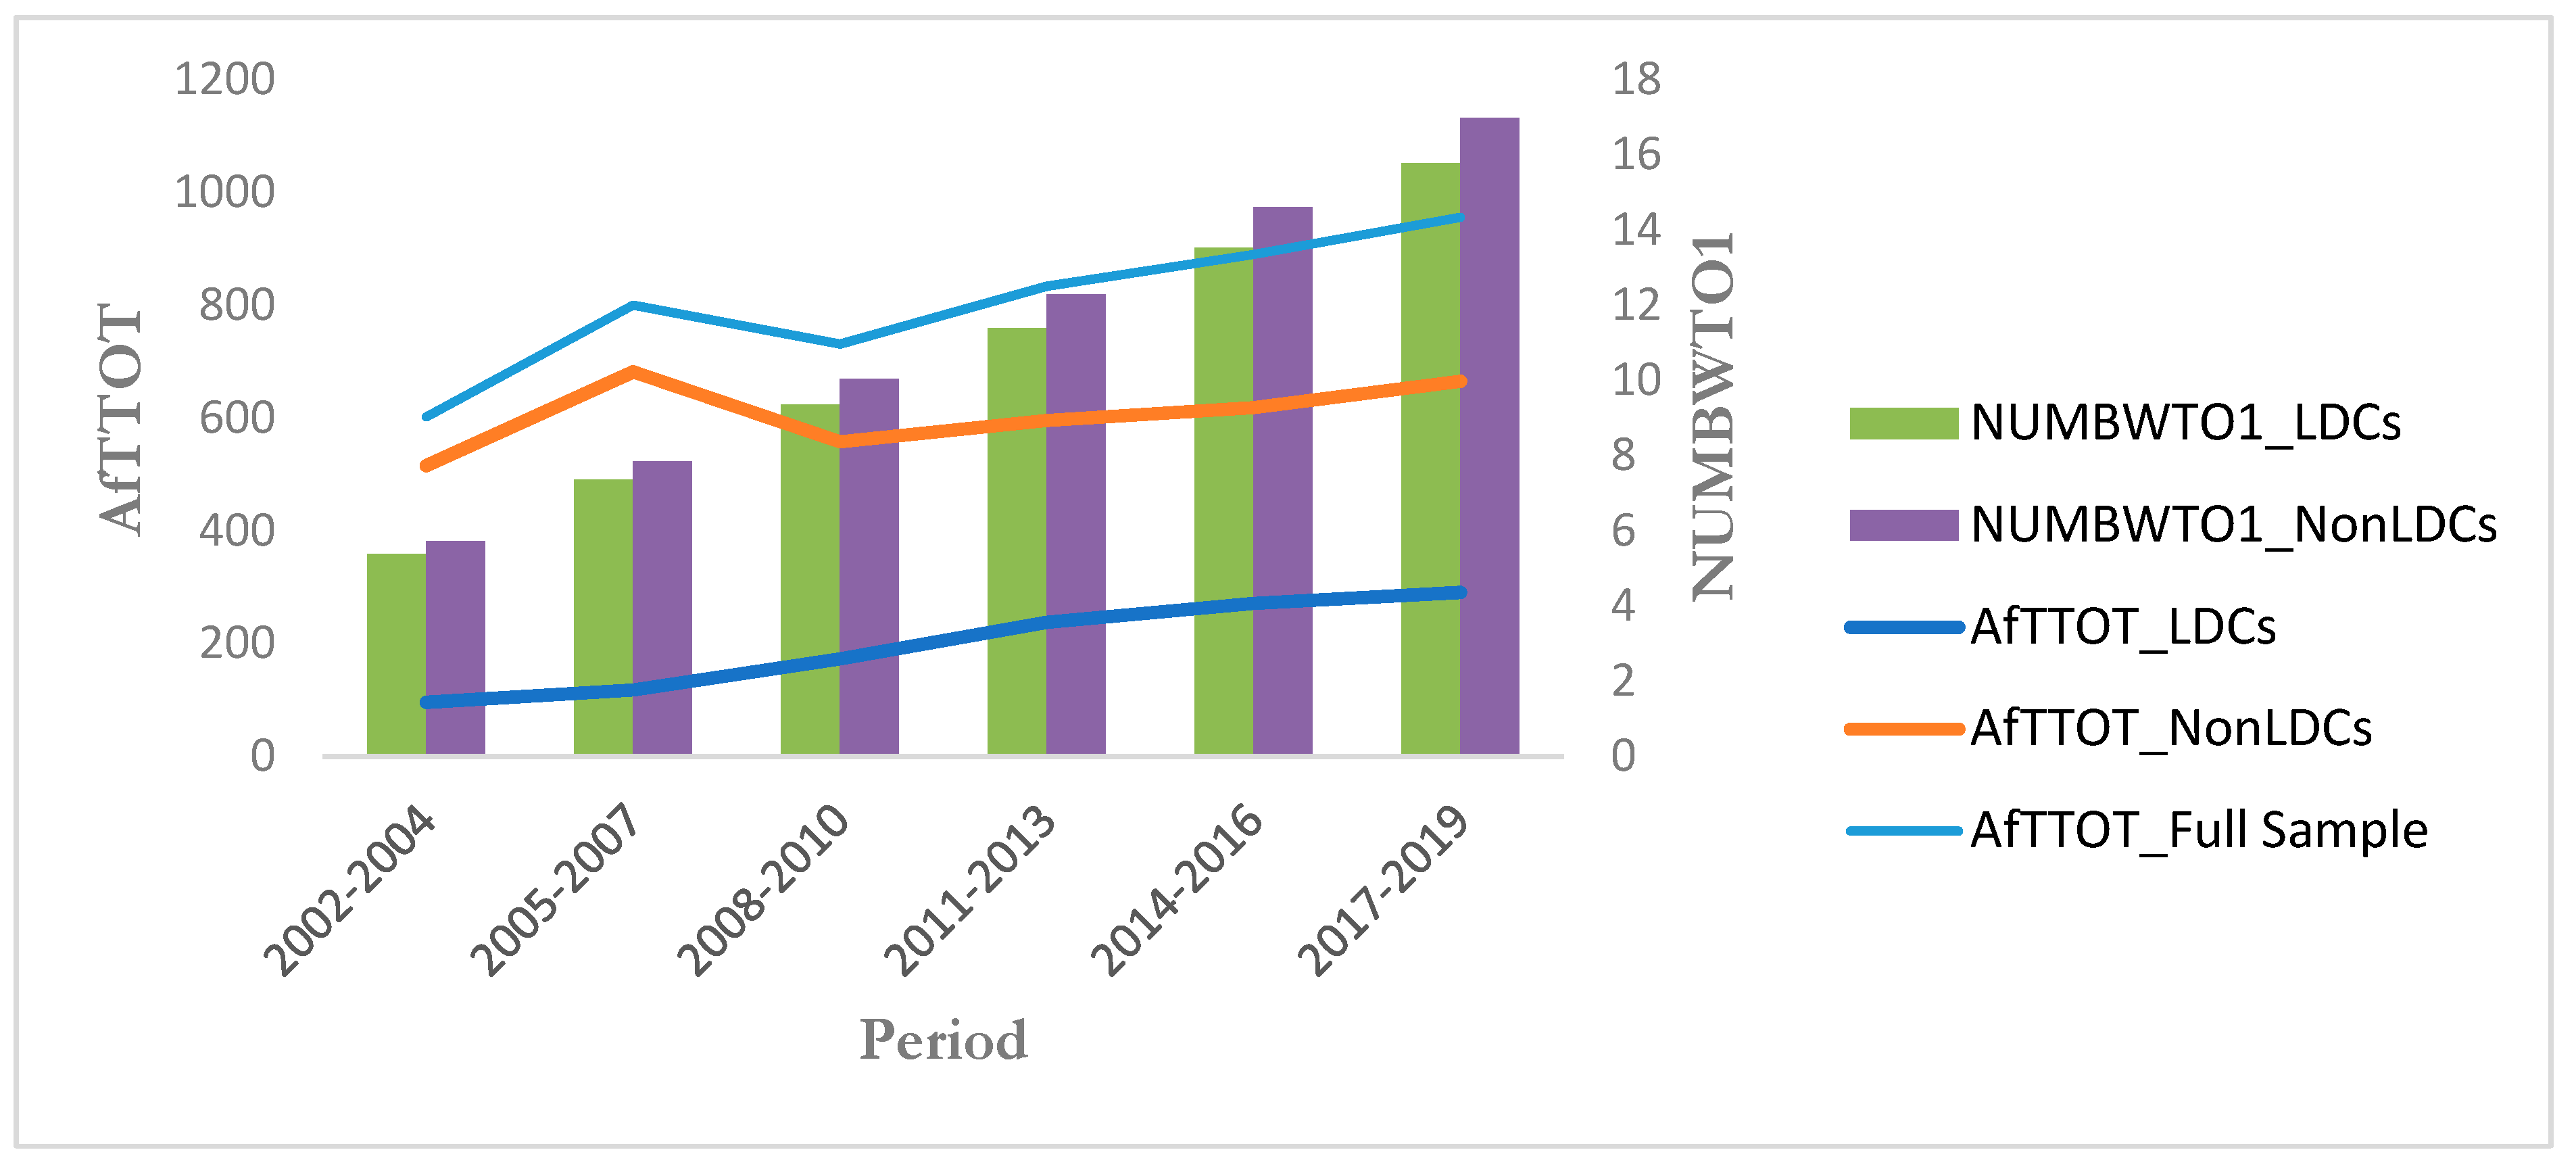
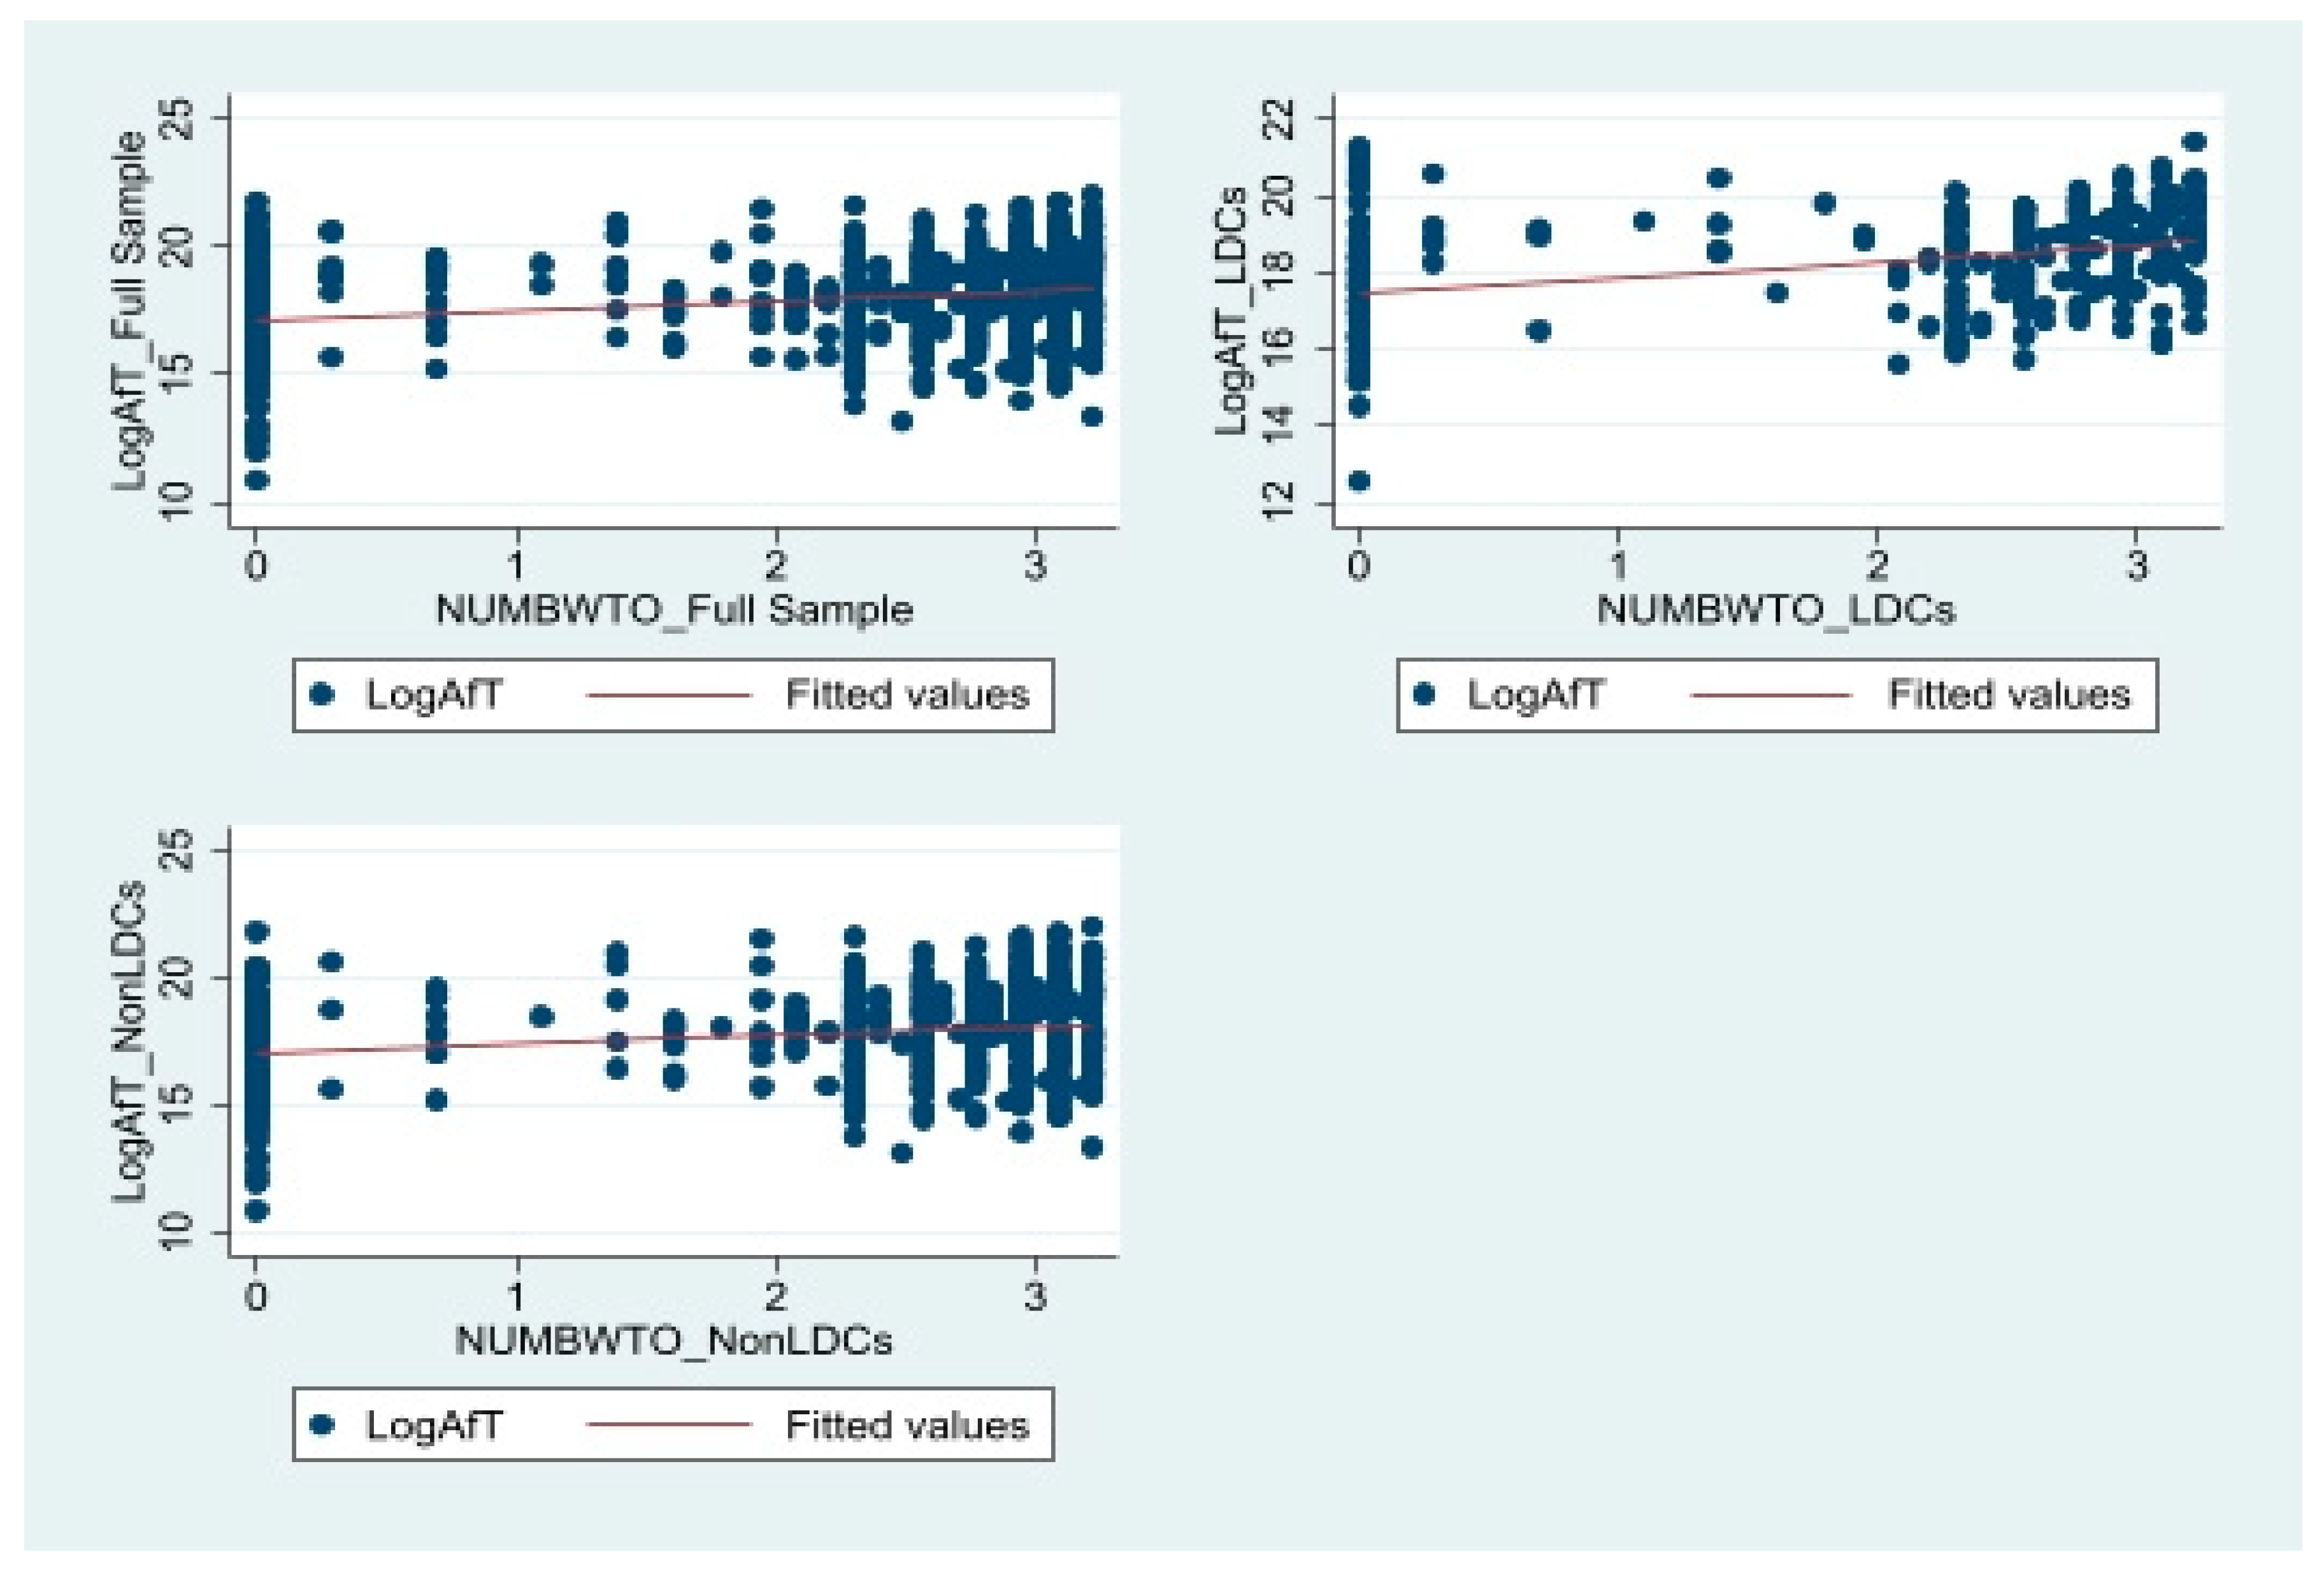
We start by presenting in Figure 1 the evolution of total AfT flows over the full sample, and sub-samples of LDCs and NonLDCs (i.e., countries in the full sample not classified as LDCs). We also compare the duration of WTO membership in LDCs and NonLDCs. Figure 2 displays the correlation pattern between the duration of WTO membership and total AfT flows, over the full sample, and the sub-samples of LDCs and NonLDCs.
Figure 1 indicates that after an increase13 in total AfT flows from US$602.11 million in 2002–2004 to US$799.80 million in 2005–2007, AfT flows plummeted to US$730.78 million in 2008–2010, probably due to the 2007 global financial crisis. These resource inflows then moved upward to reach US$955.93 million in 2017–2019. AfT flows to NonLDCs showed a pattern similar to the one observed over the full sample, and are higher than AfT flows to LDCs over the full period. For NonLDCs, total AfT moved from US$515.49 million in 2002–2004 to US$681.91 million in 2005–2007, and after declining to US$557.7 million in 2008–2010, they increased steadily to reach US$665.12 million in 2017–2019. In contrast, for LDCs, total AfT consistently increased from US$96.03 million in 2002–2004 to US$290.8 million in 2017–2019.
Figure 2 shows positive correlations between total AfT flows and the duration of WTO membership both over the full sample, and the sub-samples of LDCs and NonLDCs.
2.3. Econometric Approach
Following previous works on the determinants of AfT, we estimated model (1) and its different variants described below using the two-step system generalized method of moments (GMM) estimator of Blundell and Bond (1998). This estimator has the advantage of overcoming endogeneity issues that can undermine dynamic panel datasets with a small time dimension and a large cross-section dimension, and where series exhibits a strong persistence over time (e.g., Alonso-Borrego and Arellano 1999). The endogeneity problems here essentially concern the bias introduced by the correlation between the lagged dependent variable and countries’ unobserved time invariant effects in the error term, and the bi-directional causality between the dependent variable and a number of regressors, including the variables “NUMBWTO”, “NonAfT”, “GROWTH”, “RENT”, “GDPC”, and its squared term in the baseline model (1) (see Lee et al. 2015; Gnangnon 2017, 2018, 2021b). In the regressions performed in the present analysis, all these regressors were considered as endogenous. It is also important to note that the two-step system GMM estimator allows for handling endogeneity biases arising from measurement errors and omitted variables. The use of this estimator amounts to estimating a system of equations, which contains an equation in differences and an equation in levels. In this system of equations, lagged first differences are used as instruments for the levels equation, and lagged levels are used as instruments for the first-difference equation.
The correctness of the estimated models are checked by means of the standard diagnostic tests, which are the Arellano–Bond test of the presence of first-order serial correlation in the first-differenced error term (AR (1)); the Arellano–Bond test of the absence of second-order autocorrelation in the first-differenced error term (denoted AR (2)); and the Sargan/Hansen test of over-identifying restrictions (OID) that tests the validity of the instruments used in the regressions. In addition and although not necessary, we present the results of the test of absence of third-order autocorrelation in the first-differenced error term (denoted AR3)). This is because the absence of the third-order autocorrelation in the first-differenced error term can be an indicator of the absence of omitted variable biases in the analysis. The models estimated are considered as correctly specified if the p-value of the statistic related to the AR(1) test is lower than 0.1 at the 10% level, and if the p-values of the statistics related, respectively, to the AR(2) test, AR(3) test and OID test are all higher than 0.1 at the 10% level. Finally, we ensure that the models estimated do not suffer from instrument proliferation, as the number of instruments are always well below the number of countries in the panel dataset (e.g., Roodman 2009).
While the two-step system GMM estimator is our main econometric estimator to perform the empirical analysis, we also found it useful to present the results of the estimation of the baseline model (1) by means of the standard econometric estimators, namely the pooled ordinary least squares (“POLS”) and the within fixed effects (“FE”) estimators14. The outcomes of these estimations are displayed in columns [1] and [2] of Table 1. Using these two estimators also allows for a comparison between the related outcomes with those obtained when using the two-step system GMM estimator, but also contributes to verifying the correctness of the baseline model (1). The model can be considered here as correctly specified if the coefficient of the lagged dependent variable obtained when utilizing the two-step system GMM estimator is lower than the coefficient of the same variable when using the POLS estimator, but higher than the coefficient of the same variable when utilizing the FE estimator (Bond et al. 2001).
The different specifications of model (1) estimated by the two-step system GMM estimator to test hypotheses 1 to 6 set out in Section 1 are as follows.
Hypothesis 1 is tested by estimating the baseline model (1)—where the variable “AfT” is measured by total AfT flows—results of which are provided in column [3] of Table 1. Column [4] of Table 1 also contains results that help test hypothesis 1, as these results allow examining the effect of the duration of WTO membership on AfT flows in LDCs versus NonLDCs. This specification of model (1) contains the dummy “LDC” and the multiplicative variable between the relevant AfT indicator and the dummy “LDC”. The latter takes the value of 1 for LDCs, and 0 otherwise. Results in Table 2 also allow testing hypothesis 1 as they stem from the estimation of three specifications of model (1) where the variable “AfT” is measured by each of the three components of total AfT flows.
From now onwards, the variable “AfT” is essentially measured by total AfT flows. To test hypothesis 2 (or alternatively hypothesis 3), we estimate different variants of model (1) in which we introduce the multiplicative variable between the indicator of total AfT flows, and an indicator of trade openness. To reiterate, hypothesis 2 is related to the extent to which the effect of the duration of WTO membership on AfT flows depends on the level of trade policy/trade openness. For the sake of this analysis, we use three different indicators of trade openness, namely the ‘de jure’ trade openness and ‘de facto’ trade openness indicators. Especially, we use two ‘de jure’ trade openness indicators, which are the applied tariff rate (%) (weighted mean for all products), denoted “TARIFF”, and the score of freedom to trade internationally (i.e., the indicator of trade policy) denoted “TP”. This indicator was developed by the Heritage Foundation (see Miller et al. 2021) and is a composite measure of the absence of tariff and non-tariff barriers that affect the imports and exports of goods and services. Higher values of “TP” indicate greater trade policy liberalization. The indicator of de facto trade openness used in the analysis is the trade openness indicator proposed by Squalli and Wilson (2011). It is calculated as the ratio of the sum of a country’s exports and imports of goods and services to its GDP, adjusted by the proportion of a country’s trade level relative to the average world trade (see Squalli and Wilson 2011, p. 1758). More than the standard indicator of de facto trade openness (measured by the share of exports and imports of goods and services in GDP), the de facto trade openness indicator by Squalli and Wilson (2011) genuinely reflects countries’ participation in international trade. The results of the estimation of these variants of model (1) are in Table 3.
Estimates reported in Table 4 allow for testing hypothesis 4 (or alternatively hypothesis 5) (see results in columns [1] and [2]). These estimates arise from the estimation of specifications of model (1) that include the interaction between the variable measuring total AfT flows and the indicator of economic growth on the one hand, and the interaction between the same AfT variable and the indicator of natural resource endowments on the other.
3. Empirical Results
The estimates presented in Table 1, Table 2, Table 3, Table 4 and Table 5 show that the coefficients of the one-period lag of the dependent variable are always positive and significant at the 1% level. These findings are in line with those obtained by the above-mentioned previous works on the determinants of AfT flows. They indicate that a dynamic specification of model (1) was essential for exploring the effect of the duration of WTO membership on AfT flows. Moreover, we find from the results in Table 1 that the coefficient of the lagged dependent variable in column [3] (results based on the GMM estimator) amounts to 0.541. It is lower than the coefficient of the same variable in column [1] (results based on the POLS estimator), which amounts to 0.668, but higher than the coefficient of the same variable in column [2] (results based on the FE estimator), which amounts to 0.212. These findings thus meet the recommendation by Bond et al. (2001). On another note, the outcomes of the GMM-related diagnostic tests that are reported at the bottom of columns [3] and [4] of Table 1, Table 2, Table 3, Table 4 and Table 5 indicate that the related variants of model (1) are correctly specified. On the basis of these findings, we conclude that the two-step system GMM approach is suitable for performing the empirical analysis.
Results in columns [1] and [2] of Table 1 show that the duration of WTO membership positively and significantly affects (at the 5% level) total AfT flows. However, the magnitude of this effect obtained by means of the FE estimator (it amounts to 0.173—see column [2]) is far higher than the one obtained when using the POLS estimator (it amounts to 0.022—see column [1]). At the same time, the results in column [3] of the same table indicate that the duration of WTO membership positively and significantly influences (at the 1% level) total AfT flows. The magnitude of this effect (0.127) is lower than the one obtained in column [2] of the same table. As the GMM-based estimates are the most reliable ones, we conclude that an additional year of WTO membership (that represents a 100 per cent increase in the duration of WTO membership—i.e., in the values of the indicator “NUMBWTO1”) leads to an increase in total AfT flows by 12.7 per cent. Across the three columns of Table 1, NonAfT flows appear to be positively and significantly (at the 1% level) associated with total AfT flows. The results in column [4] of Table 1 indicate that as the duration of WTO membership increases, LDCs experience lower total AfT flows (and in particular AfT flows for economic infrastructure) than NonLDCs. The net effects of the duration of membership in the WTO on total AfT flows for LDCs and NonLDCs are, respectively, 0.05 (=0.190 − 0.142) and 0.19. This signifies that an additional year of WTO membership leads to an increase in total AfT flows of 5 per cent for LDCs and 19 per cent for NonLDCs. In summary, the results in columns [3] and [4] lend support to hypothesis 1, although they suggest that the membership duration exerts a higher positive effect on AfT flows that accrue to NonLDCs than to LDCs.
The effects of the other control variables are not the same in the three columns of Table 1. Focusing specifically on the estimates of the control variables in columns [3] and [4] of the table, we find that there is (at the conventional significance levels) no non-linear relationship between real per capita income and total AfT flows (as found in previous studies) in column [3] of the table. However, we observe that this non-linear relationship is significant at the 5% level in column [4] of the table. In the two last columns of Table 1, we observe that at the 1% level, countries that enjoy a higher economic growth performance receive higher AfT inflows. Also at the 1% level, an increase in the share of natural resources rents in GDP leads to lower AfT flows. The latter findings runs in contrast with our theoretical expectation and suggest that donors tend to supply higher total AfT flows to countries that are less endowed in natural resources. This may be due to the fact an increase in the share of natural resource rents in GDP may be an indication of increasing wealth, and hence there is less need for financial resources to invest in the trade sector. However, as noted above, there may an interaction between the effect of the duration of WTO membership and the share of natural resource rents in GDP on total AfT flows. This is what we will test in hypotheses 4/5. Finally, population size is positively associated with AfT flows, although only at the 10% level in column [3], and at the 5% level in column [4]. It is worth noting at this stage of the analysis that the results of the control variables in Table 2, Table 3, Table 4 and Table 5 are largely consistent with those in columns [3] and [4] of Table 1.
The outcomes in Table 2 suggest that as countries’ duration of membership in the WTO increases, they enjoy higher AfT flows for economic infrastructure and higher AfT flows for productive capacities (the coefficients of the variable “NUMBWTO” are positive and significant at the 1% level in columns [1] and [2]). One year more of membership in the WTO is associated with an increase in AfT flows for economic infrastructure of 14.3 per cent, and AfT flows for productive capacities of 7 per cent. However, the duration of WTO membership exerts no significant effect (at the conventional significance levels) on AfT flows related to trade policy and regulation.
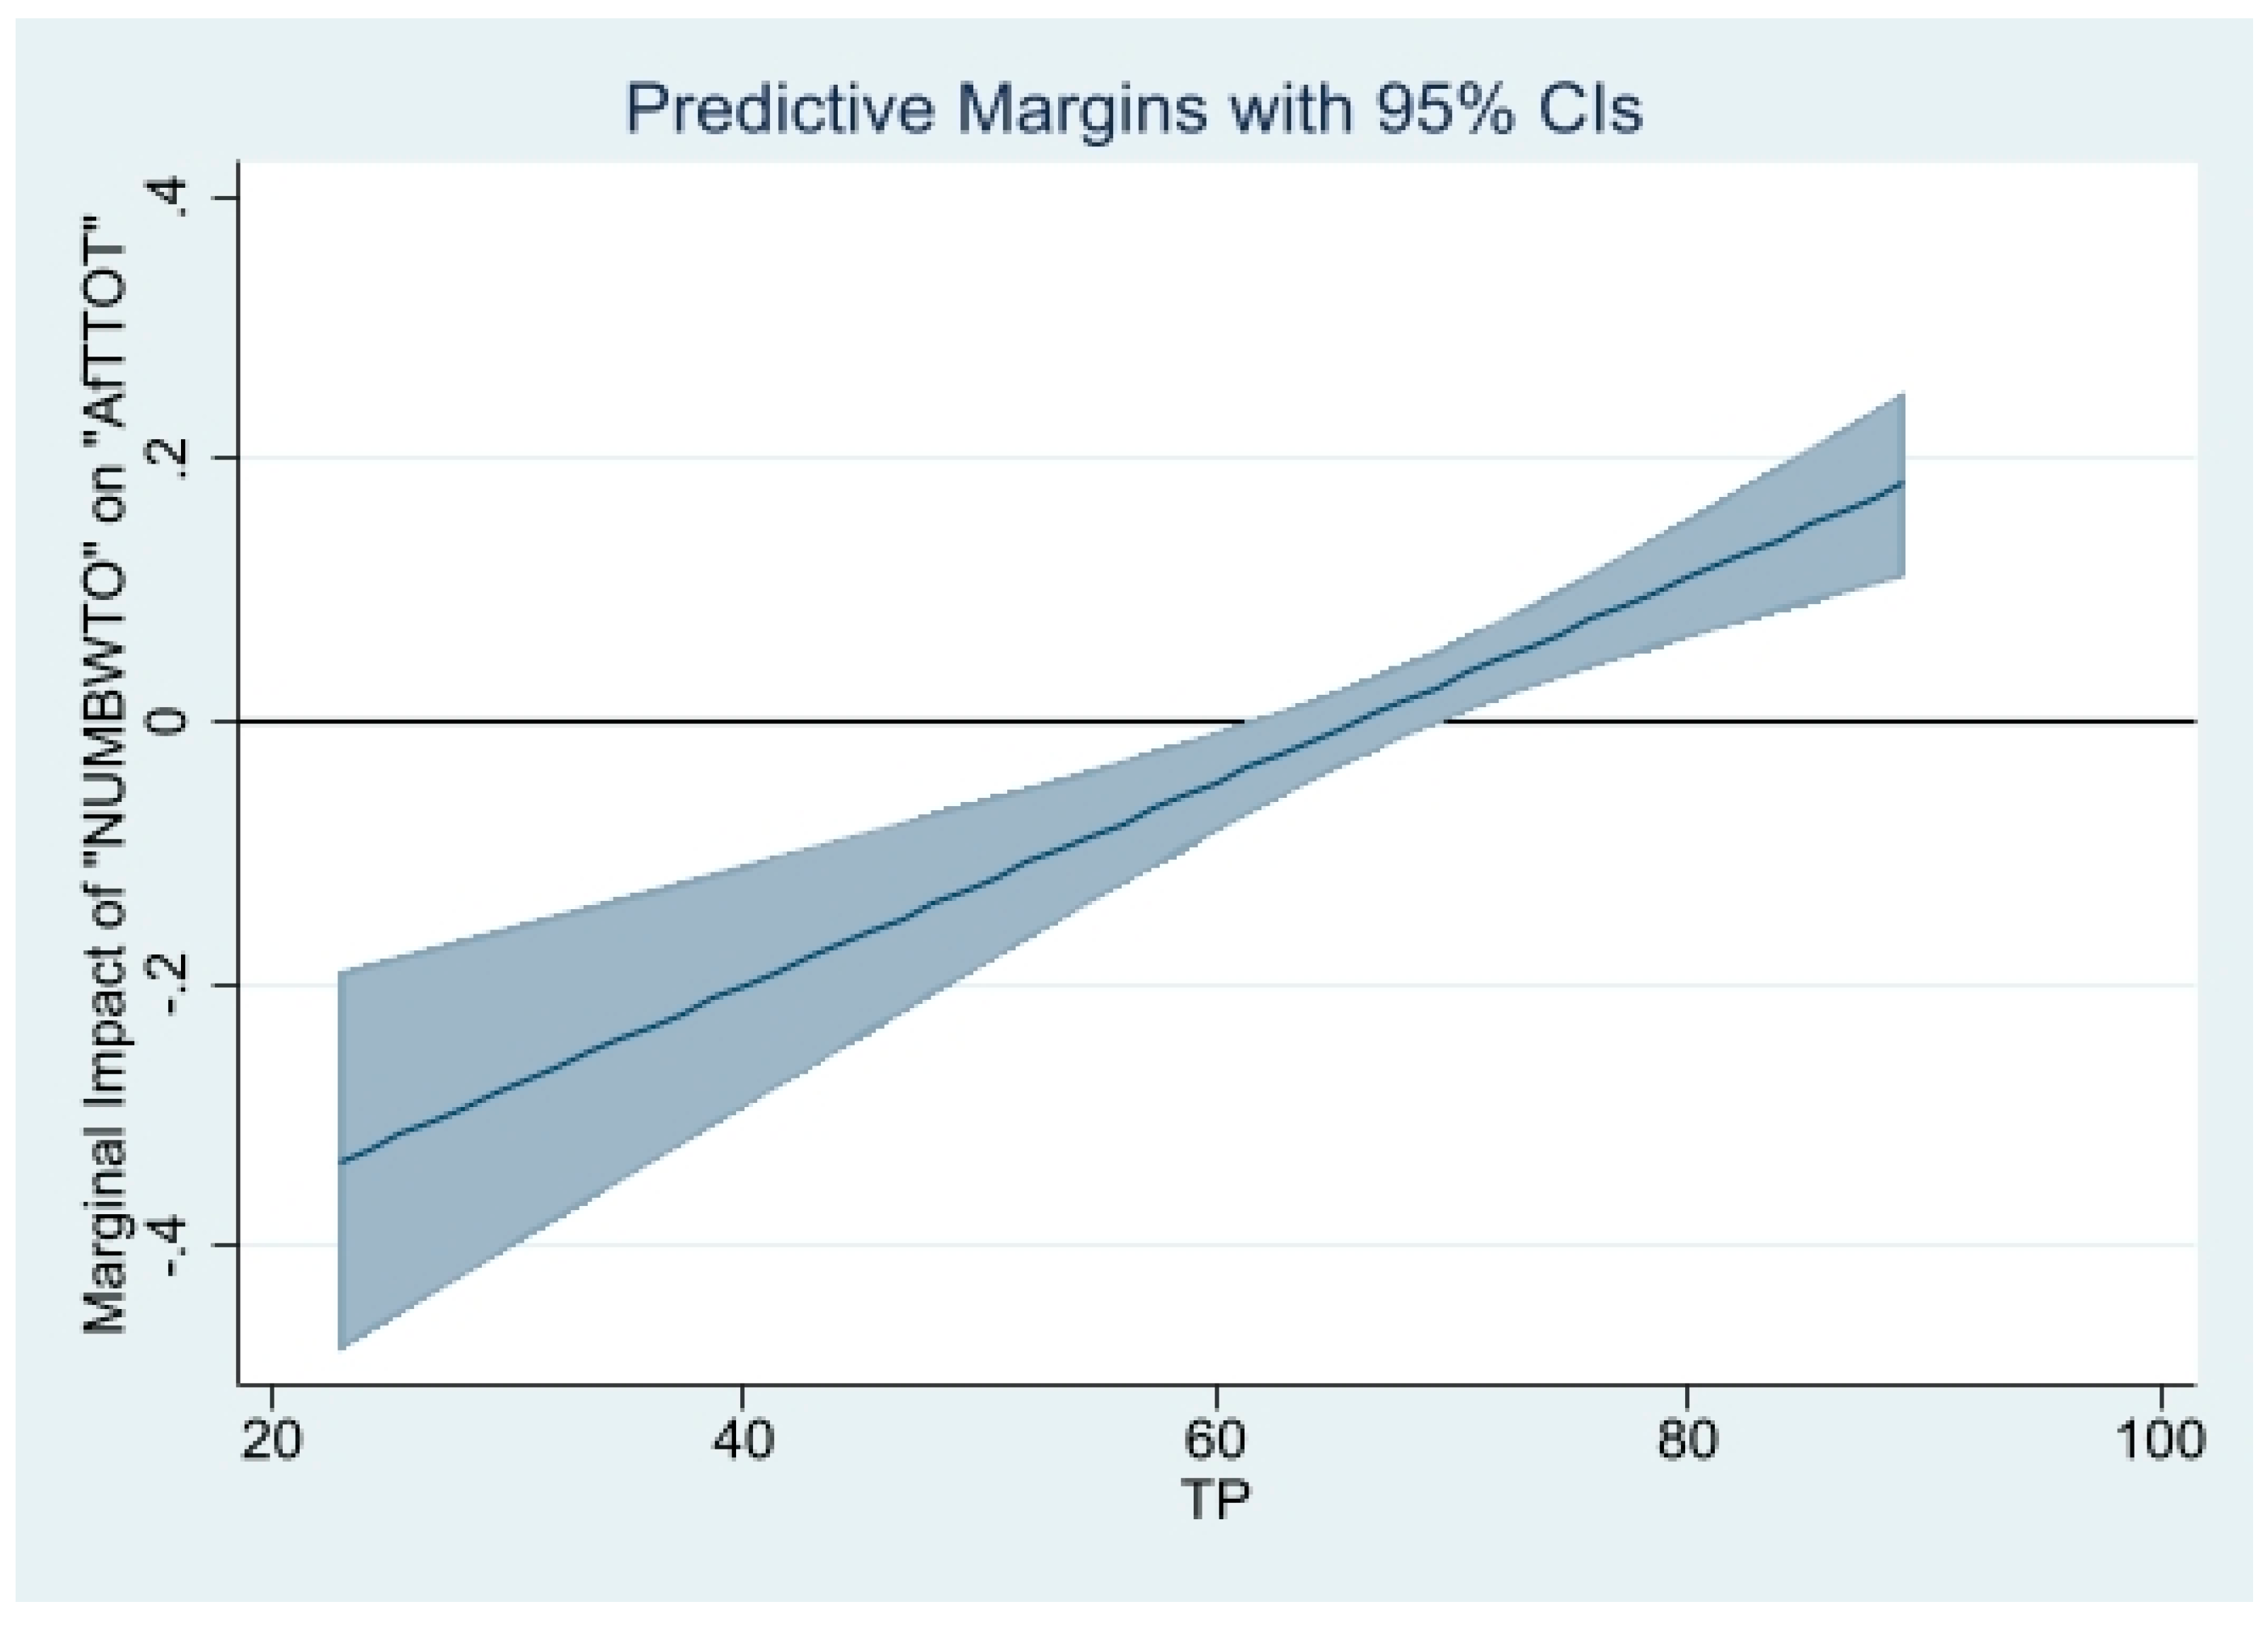
The estimates in column [1] of Table 3 indicate that the coefficient of the variable “NUMBWTO” is negative and significant at the 1% level, while the coefficient of the multiplicative variable “NUMBWTO * TP” is positive and significant at the 1% level. The combination of these two outcomes suggests that an increase in the duration of WTO membership leads to higher AfT flows when countries’ degree of trade policy liberalization exceeds (on average over the full sample) the level of 66 (=0.514/0.00779) (otherwise the effect is negative). The descriptive statistics reported in Table A2 under Appendix A indicate that the values of the variable “TP” in the full sample range from 27.4 to 89.2. Figure 3 presents, at the 95 per cent confidence interval, the marginal impact of the duration of WTO membership on total AfT flows for varying degrees of trade policy liberalization. It shows that this marginal impact is positive and significant for levels of trade policy liberalization higher than 69.3. Otherwise, it is, at best, statistically nil (including for levels of trade policy liberalization ranging from 61.3 to 69.3), or negative and significant (including for degrees of trade policy liberalization lower than 61.3). These outcomes indicate that countries that experience greater trade policy liberalization receive higher amounts of total AfT flows as the duration of their membership in the WTO increases: the magnitude of the positive effect of the duration of WTO membership on total AfT flows increases as the degree of trade policy liberalization rises.
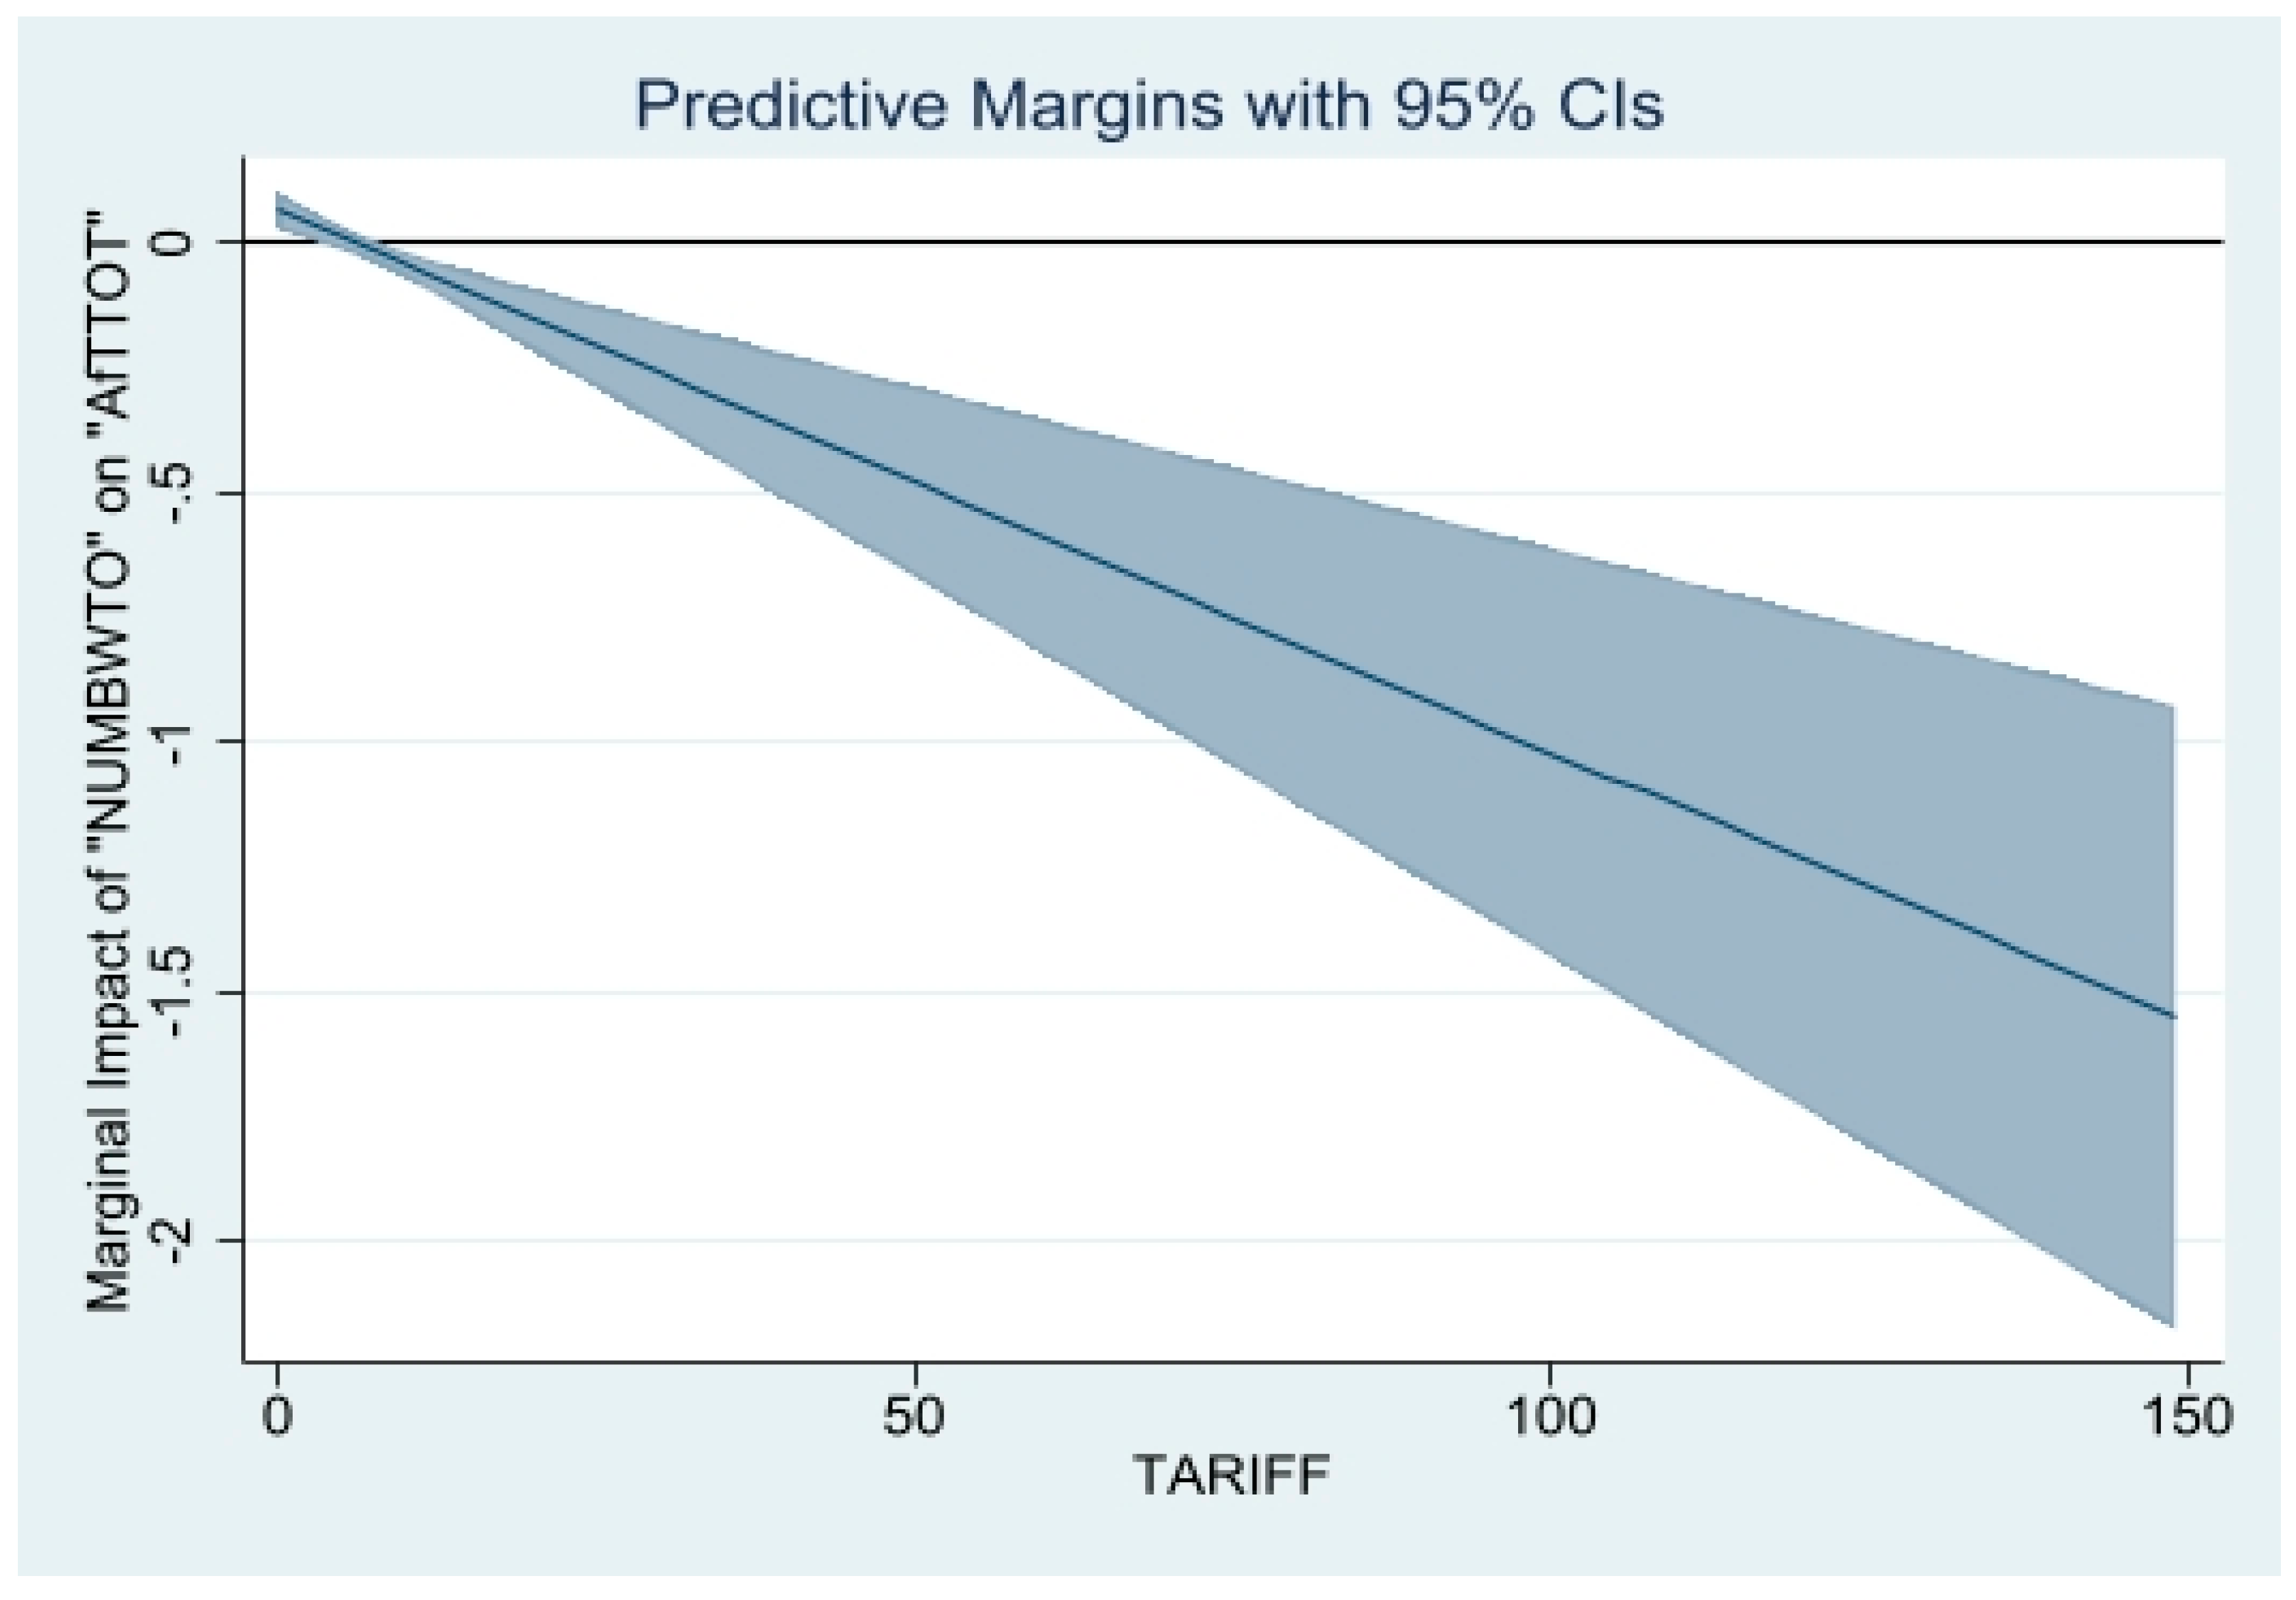
The estimates in column [2] of Table 3 confirm the findings in column [1] of the same table, as they reveal that the coefficient of the variable “NUMBWTO” is positive and significant at the 1% level, while the coefficient of the multiplicative variable “NUMBWTO * TARIFF” is negative and significant at the 1% level. The combination of these two outcomes suggest that the duration of WTO membership positively influences AfT flows only in countries that implement lower tariffs, that is, where the average tariff on all products is lower than 6% (=0.0650/0.0108) (values of the variable “TARIFF” range between 0.47 and 149.07 in the full sample—see Table A2 under Appendix A). In other words, countries that implement lower tariffs (i.e., tariffs lower than 6%) on imported products receive higher AfT flows as the duration of their WTO membership increases; otherwise, they experience lower AfT flows as their WTO duration membership increases. Figure 4 presents, at the 95 per cent confidence interval, the marginal impact of the duration of WTO membership on total AfT flows for varying tariff rates. It confirms the previous finding by indicating that it is only for tariff rates lower than 5.96% (approximately 6%) that the duration of WTO membership is associated with higher AfT flows. Countries whose tariff rates are higher than 6% experience a fall in AfT flows, and the magnitude of this negative effect rises (in absolute value) as the tariff rates increase.
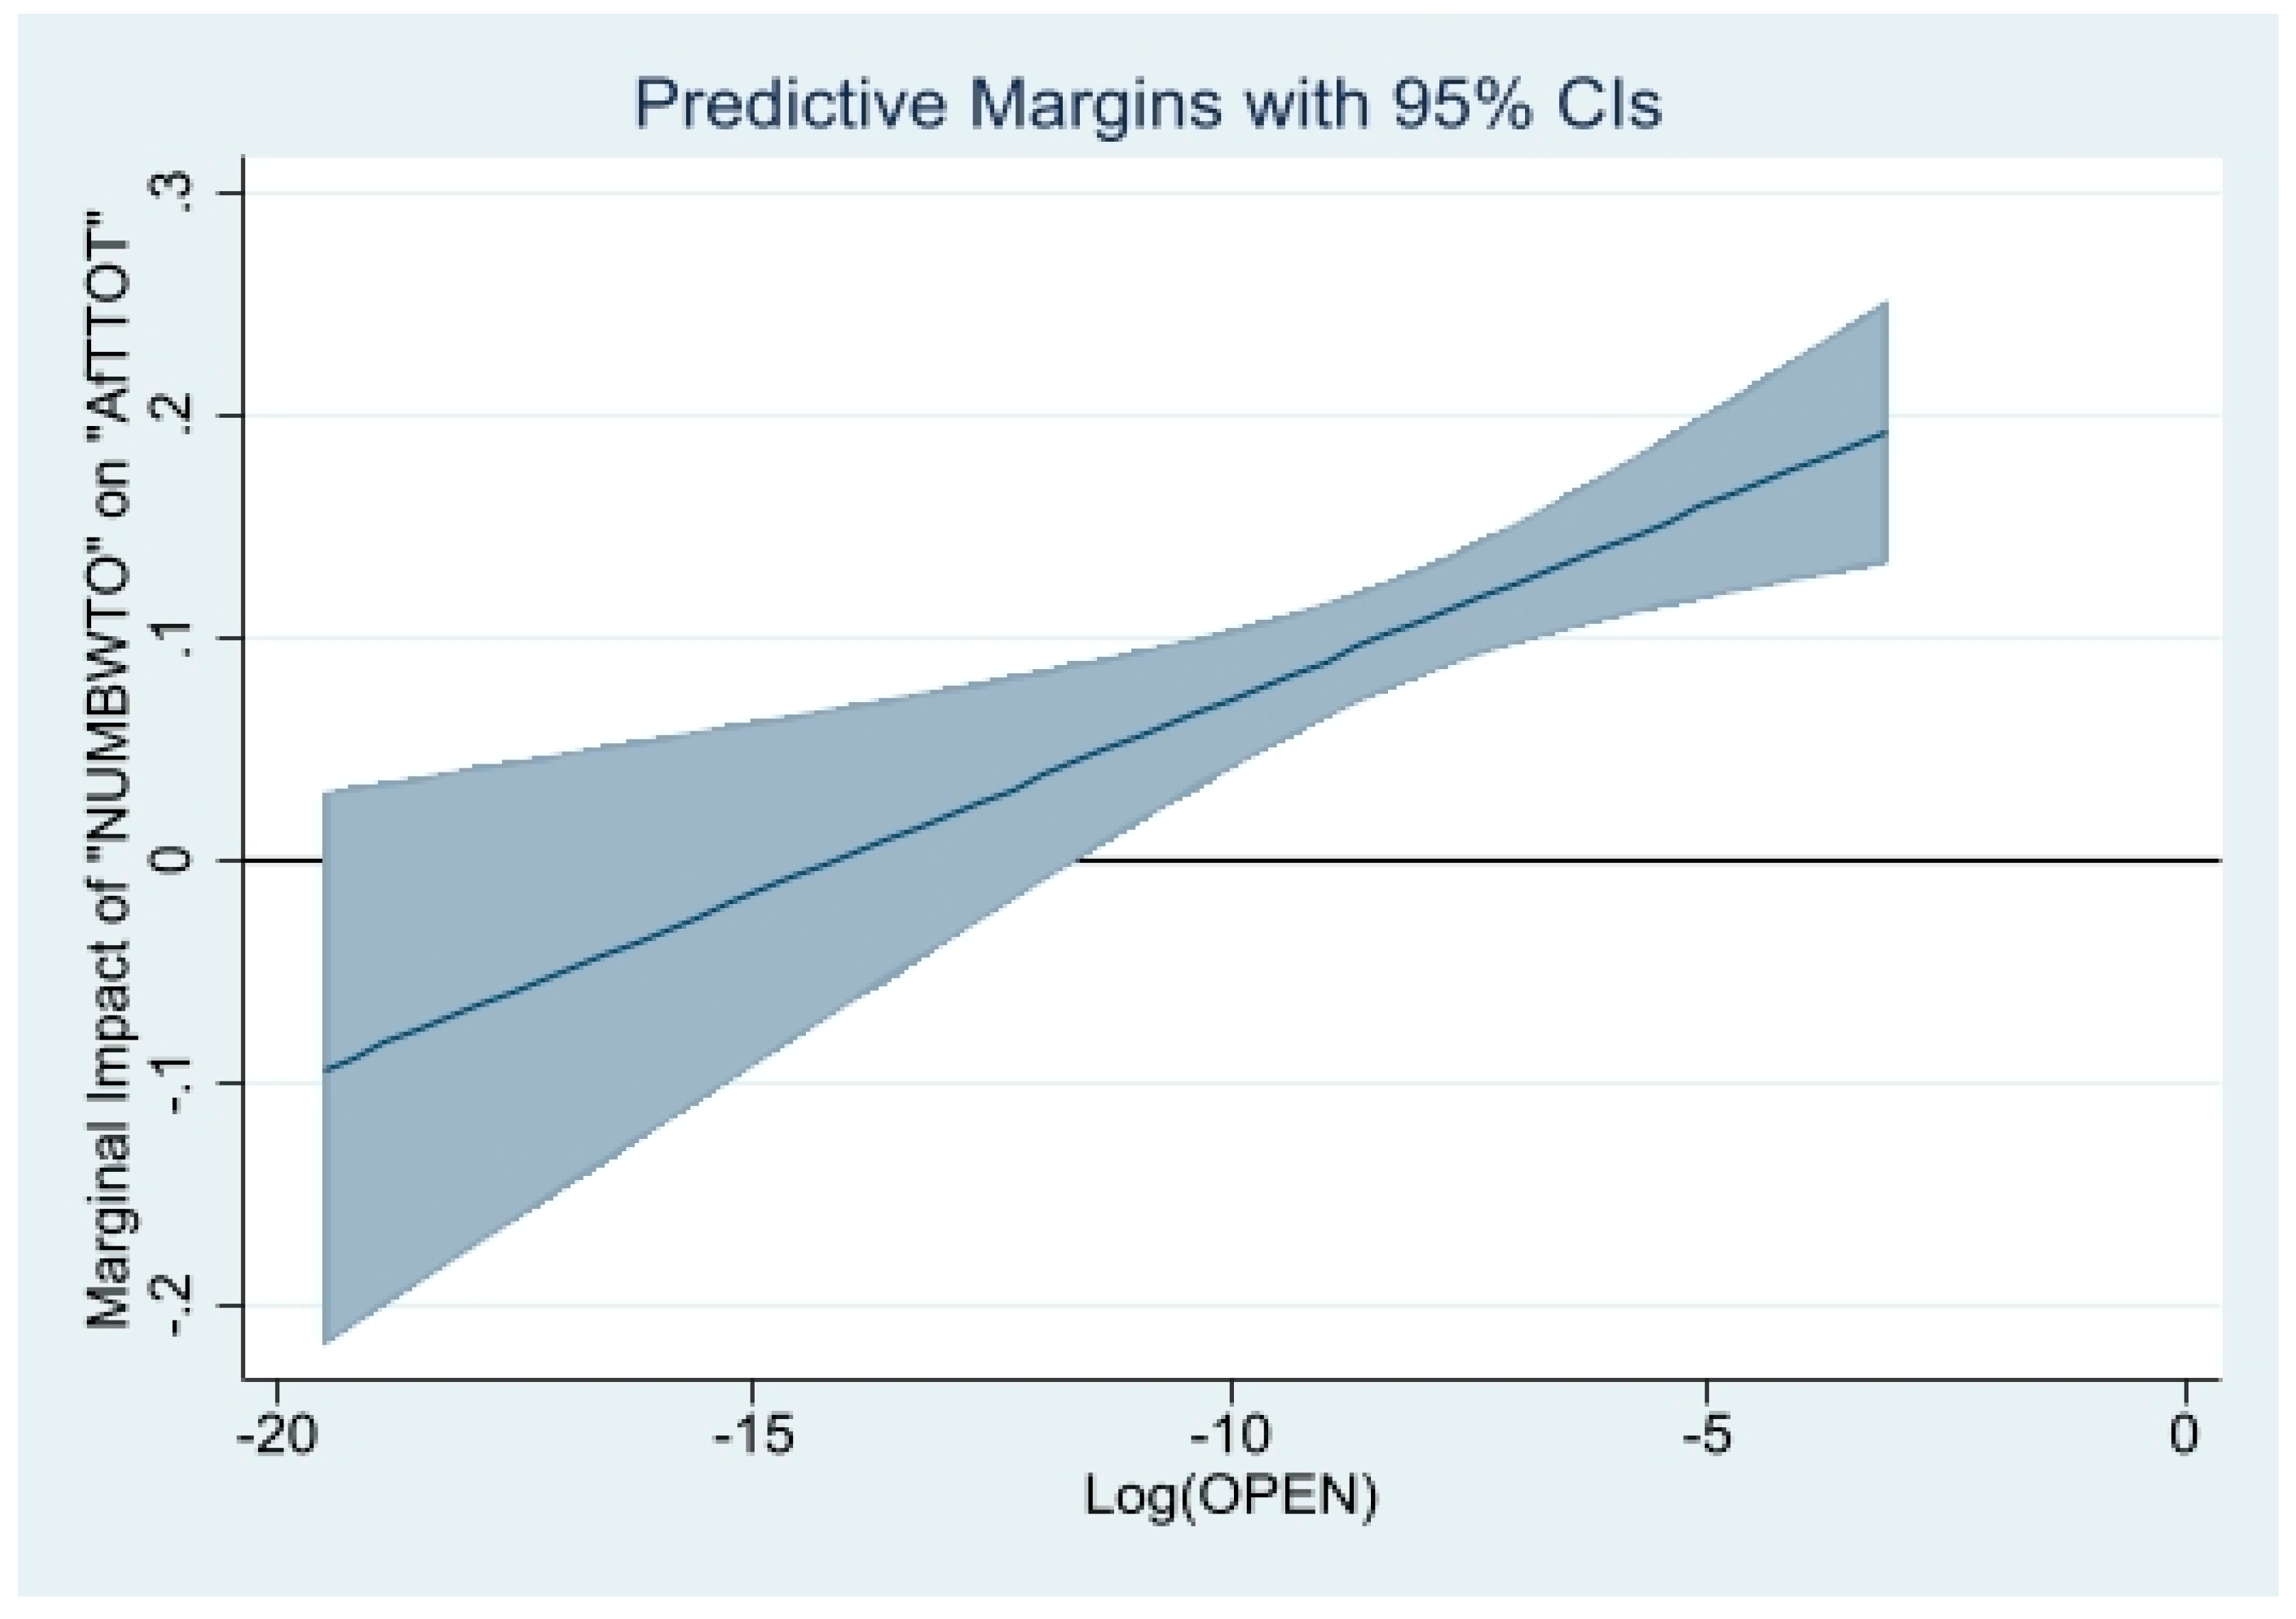
Finally, the estimates in column [3] of Table 3 show that the coefficient of the variables “NUMBWTO” and (“NUMBWTO * [Log(OPEN)]”) are positive and significant at the 1% level. These outcomes, therefore, tend to suggest that regardless of the level of countries’ participation in international trade, they always receive higher AfT flows as their membership duration increases. Additionally, the magnitude of this positive impact of the duration of WTO membership on total AfT flows increases as countries’ level of integration into the global trading system improves. As these outcomes are ‘average’ effects across countries in the full sample, we display in Figure 5, at the 95 per cent confidence interval, the marginal impact of the duration of WTO membership on total AfT flows for varying degrees of integration into the global trading system. It appears that this marginal impact is significant only for values of the variable “OPEN” higher than 0.000008815. We conclude that the duration of WTO membership exerts a positive effect on AfT flows only in countries whose level of integration into the world trade is higher than 0.0000088, and the greater this level of trade integration, the higher the positive effect of the membership duration on total AfT flows. For countries whose level of integration into the world trade is lower than 0.0000088, there is no significant effect of the duration of WTO membership on total AfT flows. In a nutshell, Table 3 conveys the message that as countries improve their level of trade openness, including their trade policy liberalization and the degree of participation in international trade, they enjoy higher AfT flows, as their WTO membership duration increases. This finding clearly supports hypothesis 2 (at the expense of hypothesis 3).
Turning to outcomes provided in Table 4, we note from column [1] that the coefficient of “NUMBWTO” is yet positive, but not significant at the 10% level. At the same time, the interaction term of the variable “NUMBWTO * GROWTH” is positive and significant at the 1% level. These outcomes suggest that as they expand their membership duration, countries receive higher amounts of AfT when they improve their economic growth performance. The greater the economic growth rate, the higher the magnitude of the positive effect of the membership duration on total AfT flows. On the other side, results in column [2] of Table 4 indicate a positive and significant coefficient (at the 1% level) of the variable “NUMBWTO”, but a negative and significant coefficient (also at the 1% level) of the interaction variable “NUMBWTO *RENT”. These suggest that, on average, over the full sample, the duration of their membership in the WTO is associated with higher AfT flows in countries whose shares of total natural resource rents in GDP are lower than 29.7% (=0.219/0.0106). For these countries, the lower the share of total natural resource rents in GDP, the higher the amounts of total AfT flows that would accrue to them. Conversely, countries whose shares of total natural resource rents in GDP exceed 29.7% receive lower AfT flows as they expand the duration of their membership in the WTO. These patterns of outcomes in columns [1] and [2] of Table 4 are observed in column [3] of the same table when we included both the interaction variables “NUMBWTO * GROWTH” and “NUMBWTO * RENT” in the baseline model (1).
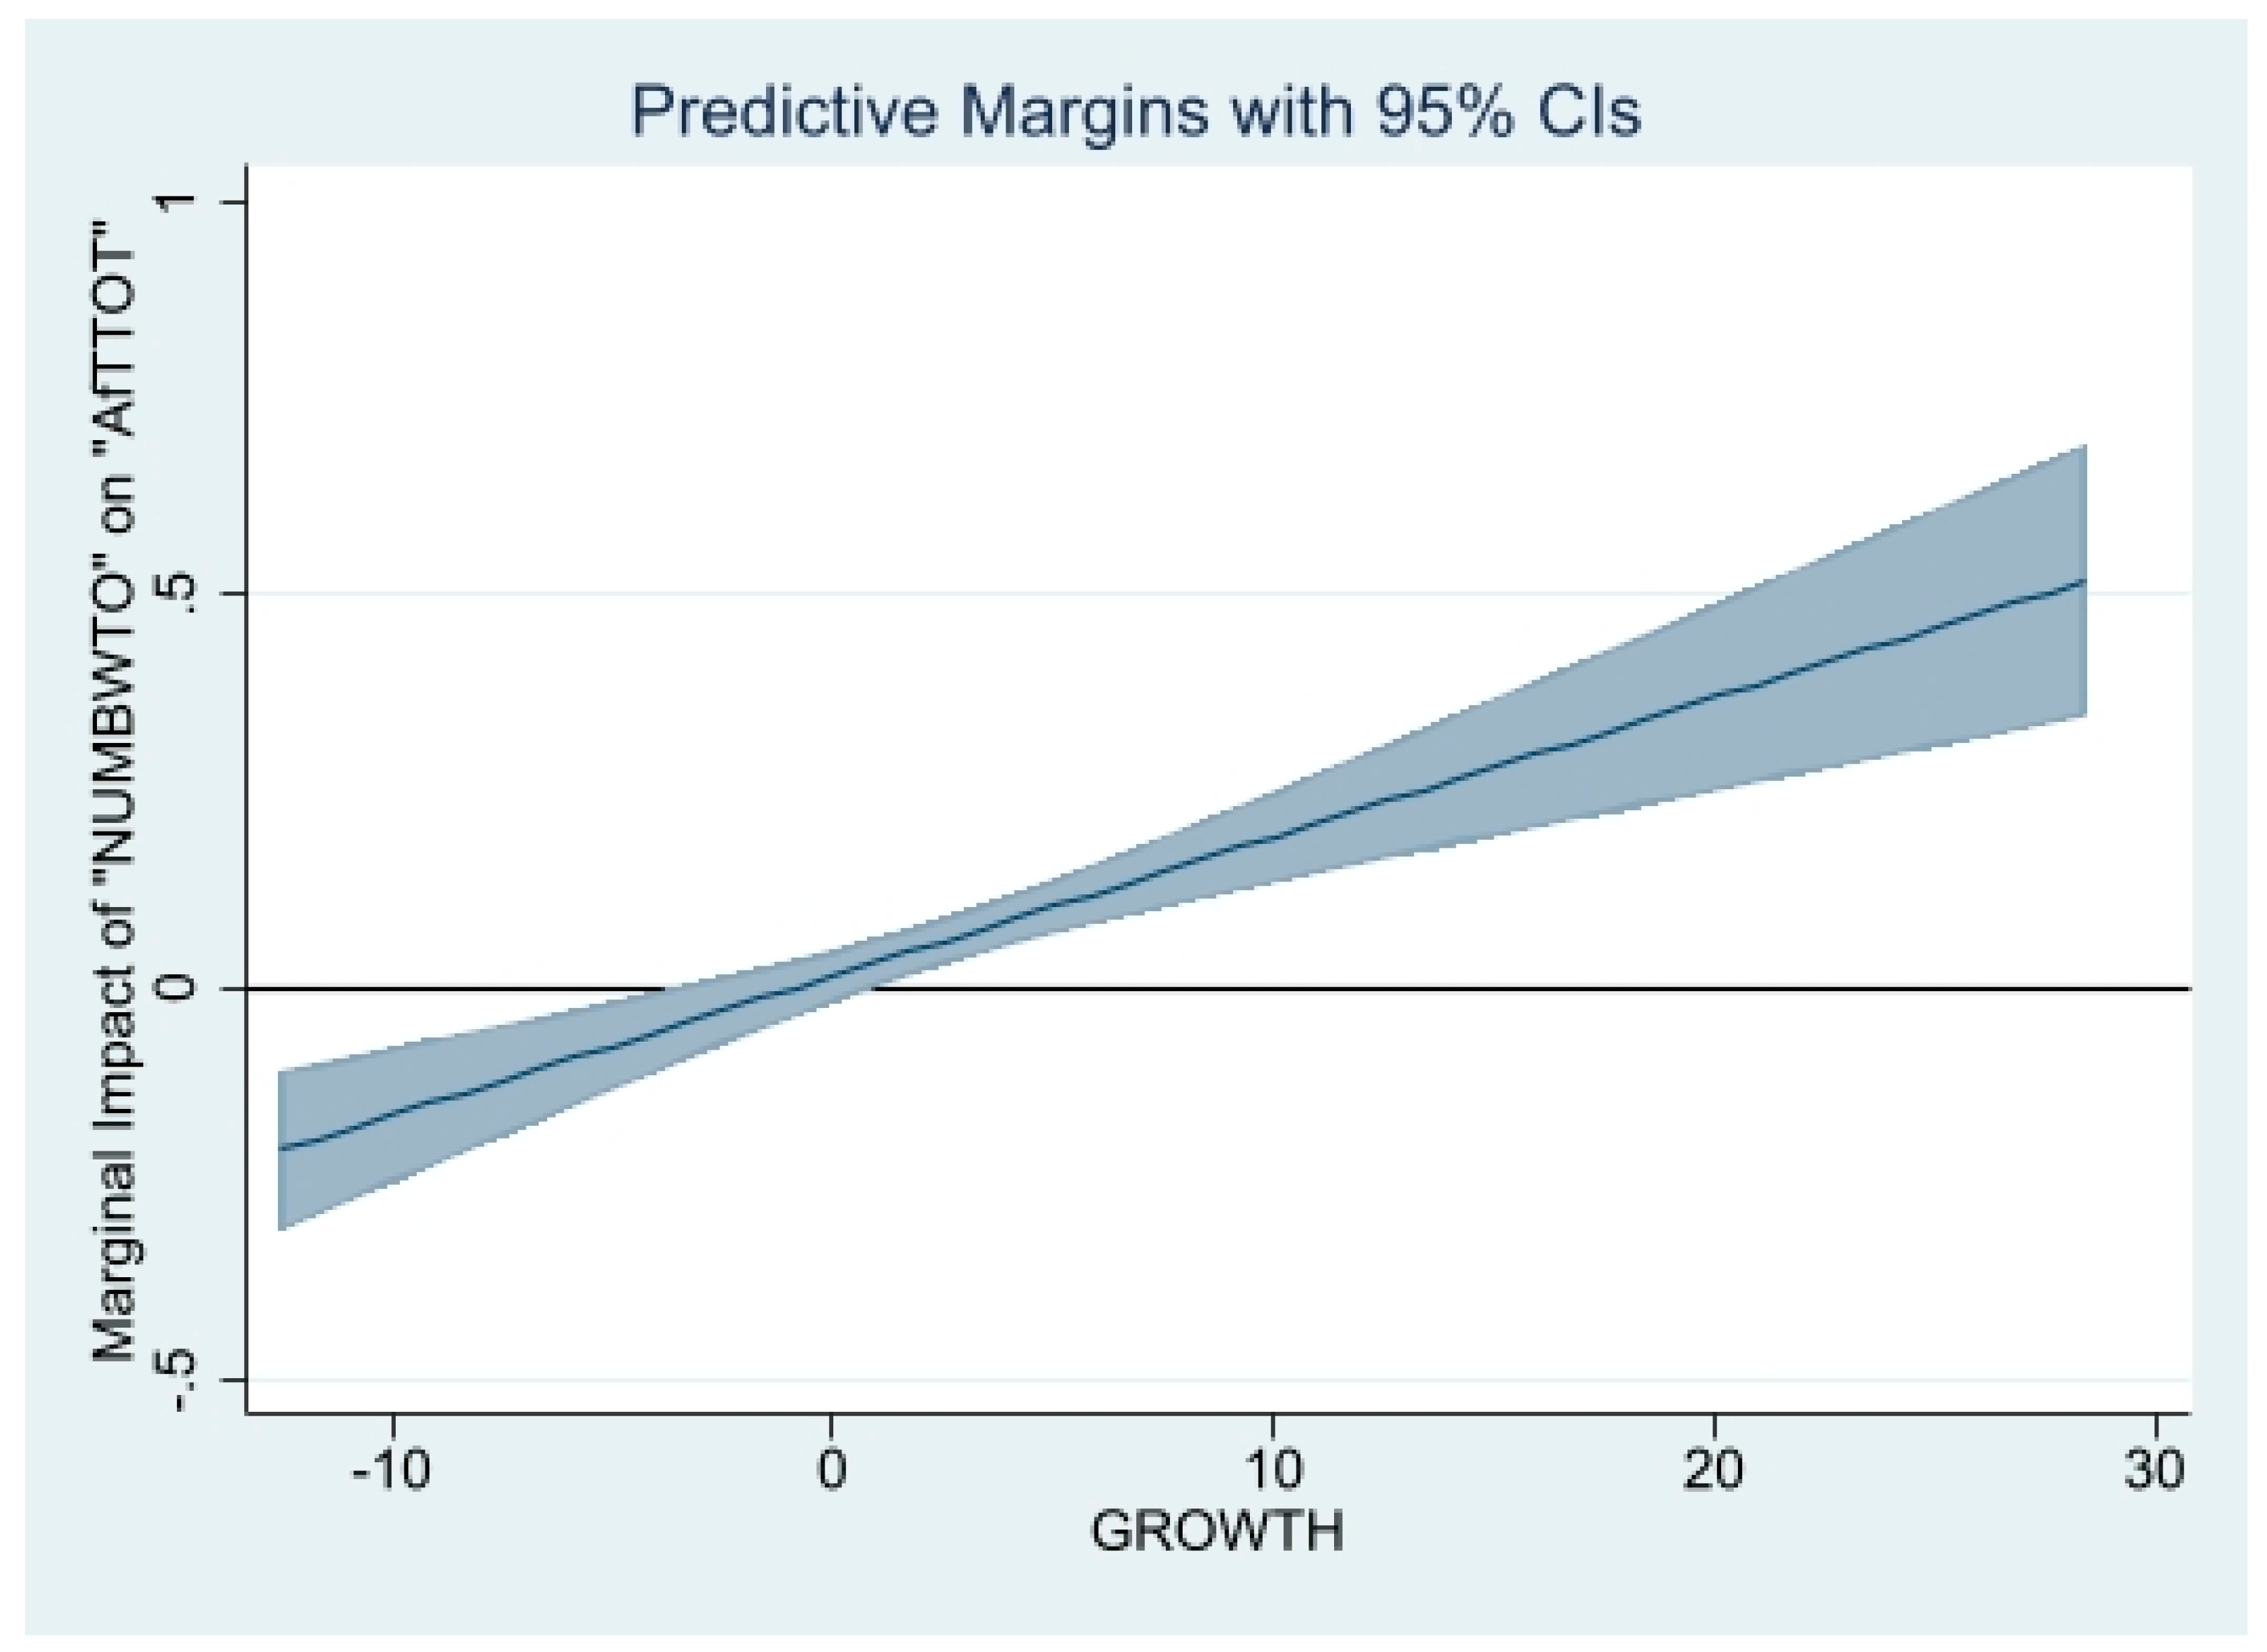
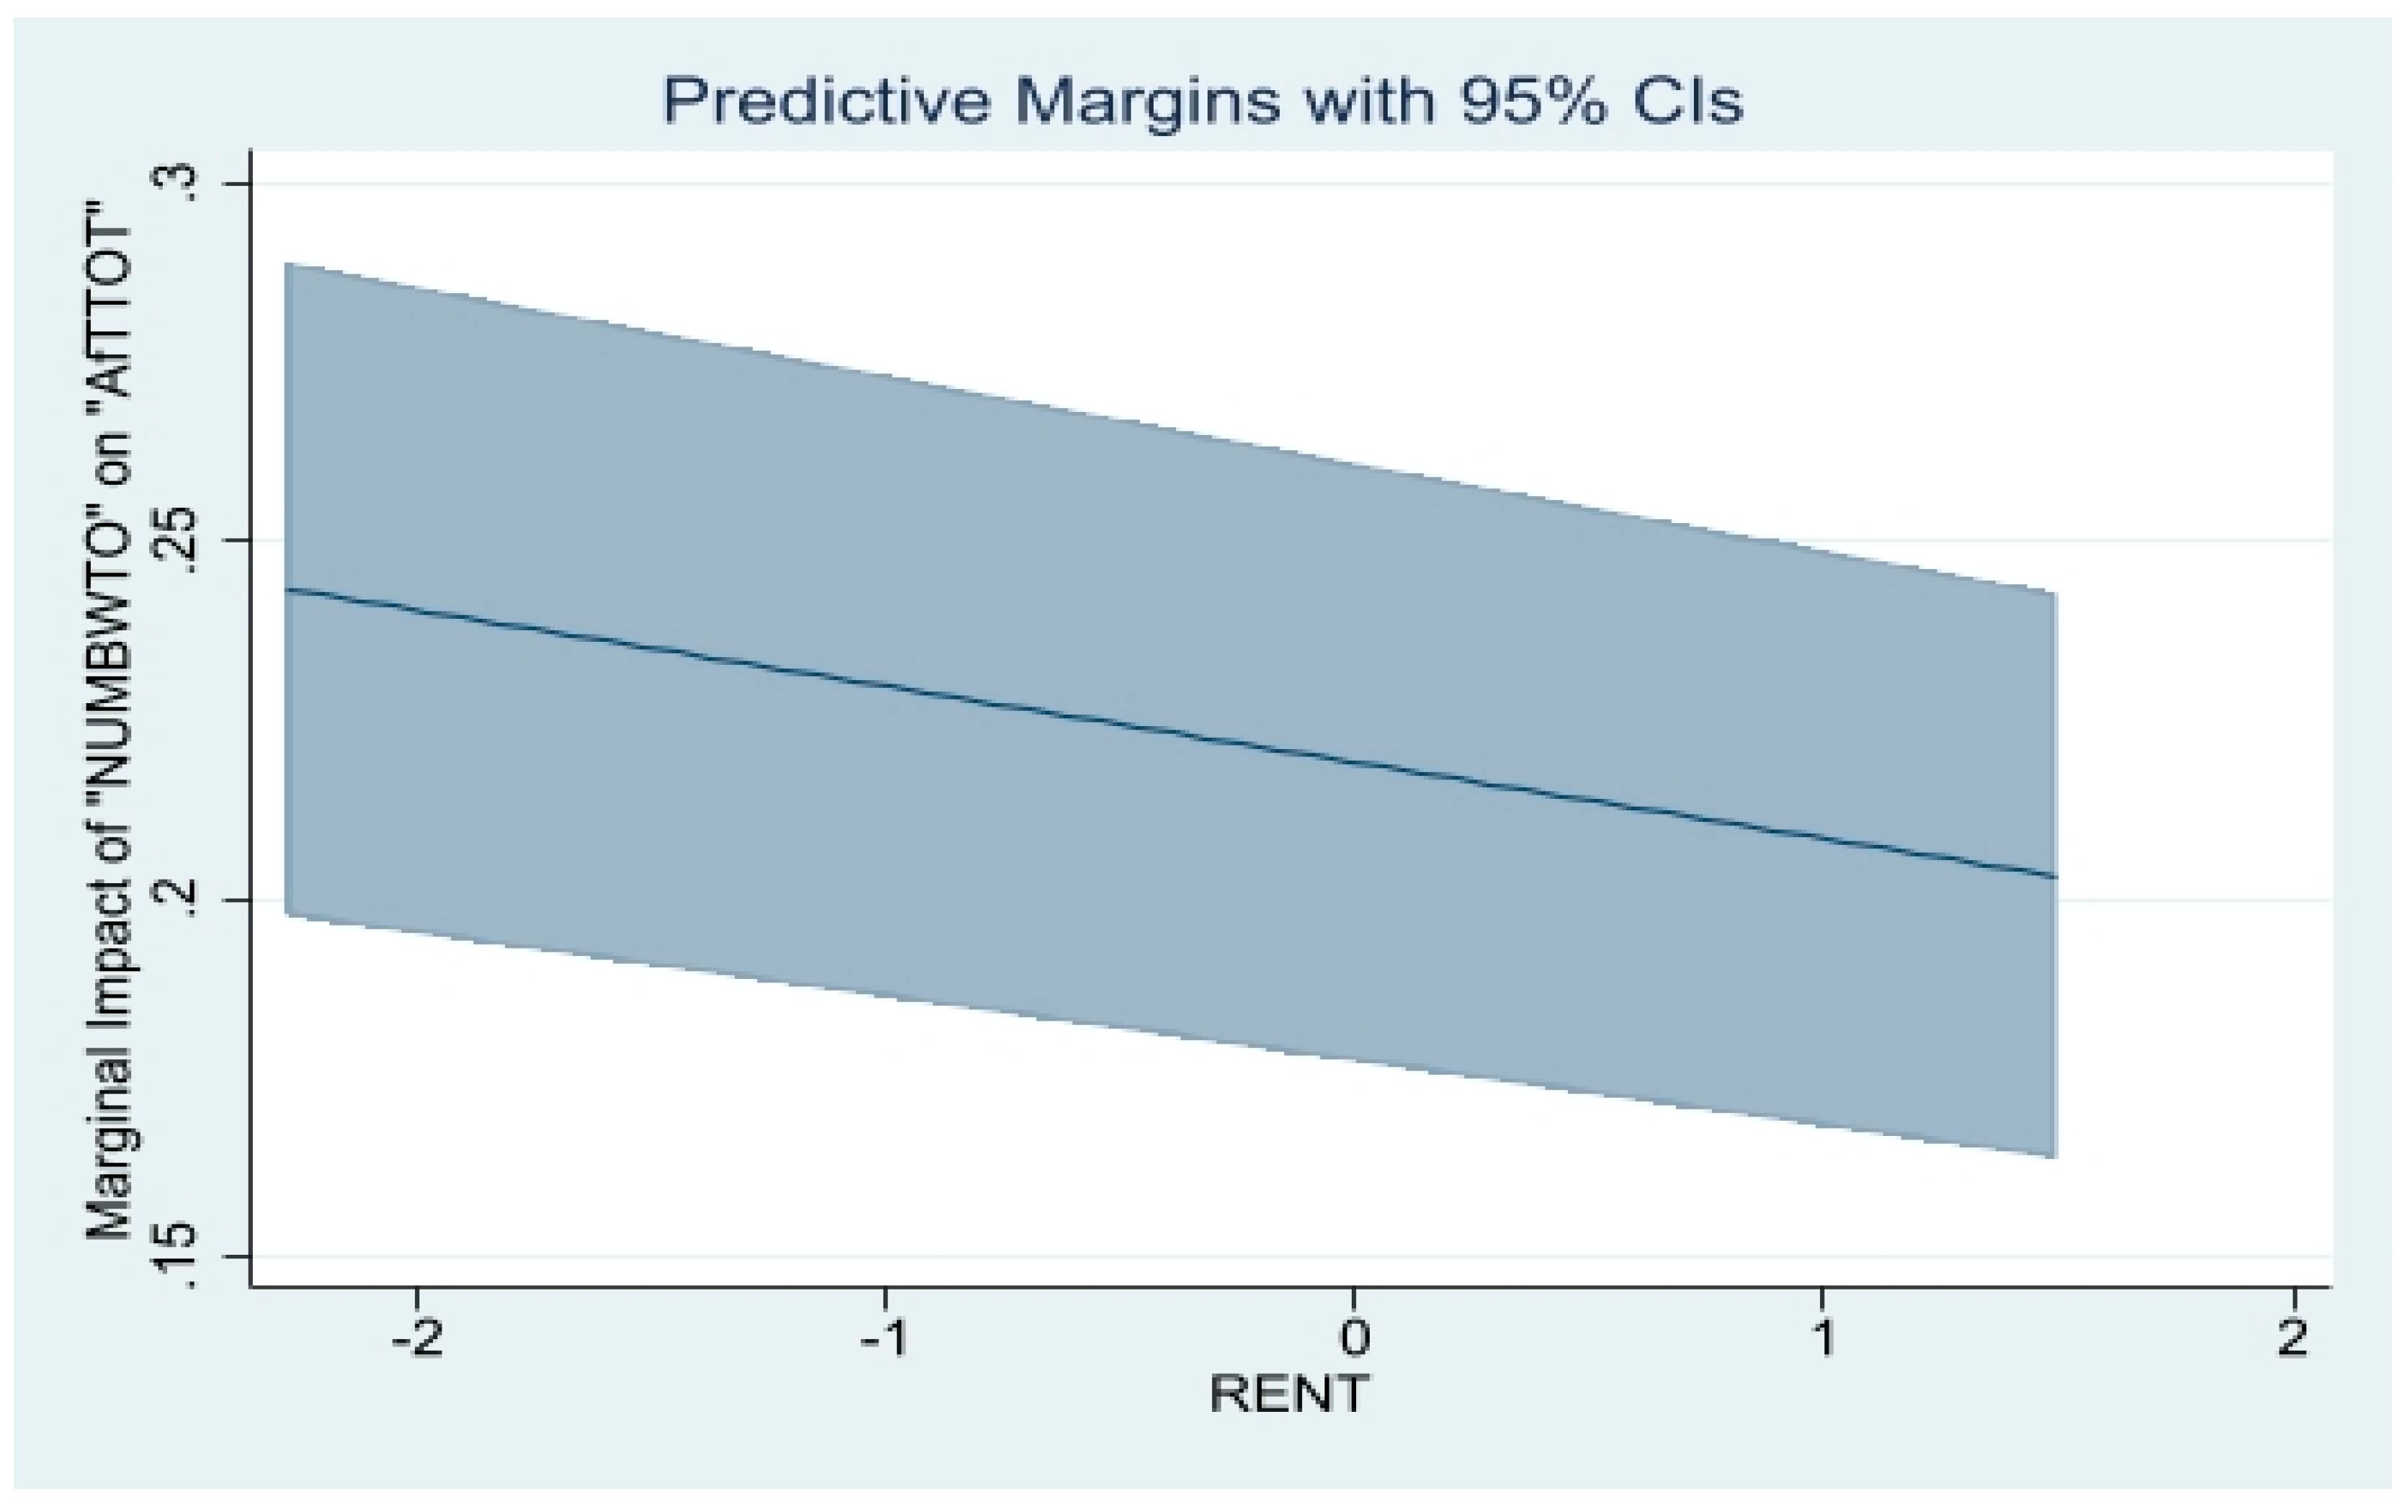
Building on results in column [1] of the table, we display in Figure 6, at the 95 per cent confidence interval, the marginal impact of the duration of WTO membership on total AfT flows for different economic growth rates. It appears that donors supply lower AfT flows to low-growth performing countries (i.e., countries whose economic growth rates are lower than −3.33 per cent) that experience an increase in the duration of WTO membership. Countries whose economic growth rates range from −3.33 per cent to 0.85 per cent experience no significant effect of membership duration on total AfT flows. In contrast, countries whose economic growth rate exceeds 0.85 per cent receive higher AfT flows from donors as their membership duration increases, and the higher the economic growth performance, the greater the magnitude of the positive effect of the duration of WTO membership on total AfT flows. Finally, we depict in Figure 7, at the 95 per cent confidence interval, the marginal impact of the duration of WTO membership on total AfT flows for different shares of natural resource rents in GDP. It appears from this Figure that the marginal impact of the duration of WTO membership on total AfT flows is always positive and significant (for all shares of natural resource rents in GDP), but the magnitude of this positive effect declines as the share of natural resource rents in GDP increases. Overall, these findings tend to lend credence to hypothesis 4 (at the expense of hypothesis 5). This is because donors tend to reward countries that improve their economic growth performance (as far as the economic growth rate is higher than 0.85 per cent) with higher AfT flows as their membership duration increases. At the same time, while donors still supply higher AfT flows to countries endowed with natural resources and that experience an increase in the duration of WTO membership, these amounts of AfT flows diminish as the share of natural resource rents in GDP rises.
4. Robustness Check Analysis
The indicator of the duration of membership in the WTO used in the previous analysis has been computed over the period running from the year (1995) of the inception of the WTO. However, as constructed, this indicator does not take into account the fact that many AfT recipient countries were already members of the General Agreement on Tariffs and Trade (GATT) (the predecessor of the WTO) before joining the WTO. The present section aims to take into account this difference in the timing of membership in the GATT/WTO among countries when investigating the effect of membership duration on AfT flows. The difference between the effect of the duration of membership in the GATT/WTO and the duration of membership in the WTO on AfT flows lies mainly in the extent of liberalization commitments undertook by member states when joining the GATT and the WTO.
In fact, not all GATT-contracting parties (or member states) joined the GATT and the WTO through the same accession procedures (e.g., Cao and Flach 2015; Tang and Wei 2009). The first group of countries contains former colonies that had the possibility to invoke Article XXVI 5(c)16 of the GATT to join the GATT. This group of countries was exempt from long negotiation procedures and from commitments to extensive policy reforms when joining the GATT. We denote these countries “Article26 member states”. In contrast, states that did not invoke the GATT under Article XXVI 5(c) to join the GATT underwent long negotiation processes and undertook extensive liberalization policy reforms. We denote these countries “non-Article26 member states”. The third group of countries (which were not original WTO Members, and which we denote “Article 12 member states”) comprises countries that joined the WTO under Article XII17 of the Marrakesh Agreement establishing the WTO. These countries joined the WTO through more stringent procedures than the ones undergone by original WTO members (i.e., contracting parties of the GATT), in particular non-Article26 member states. The trade liberalization commitments of these member states cover a wider range of areas and are more extensive than those of non-Article26 member states.
Against this background, we use the two-step system GMM estimator to test the robustness of the findings in the previous analysis by replacing in model (1) the variable “NUMBWTO” with the variable “NUMB” (which is the duration of the GATT/WTO membership). We first estimate the specifications of model (1) that are similar to the ones estimated above and whose results were reported in columns [3] and [4] of Table 1 (i.e., those outcomes that allow for obtaining the effect of the membership duration on total AfT flows over the full sample, as well as over LDCs and NonLDCs). The results of these estimations are presented in columns [1] and [2] of Table 5. Second, columns [3] to [5] of the same table display outcomes that allow for an exploration of the effect of the duration of membership in the GATT/WTO, respectively, on Article26 member states, Article12 member states, and non-Article26 member states. These results are obtained by estimating several variants of model (1) (with “NUMB” as our measure of the membership duration) that include the dummy variable for each sub-sample (Article26 member states, Article12 member states, and non-Article26 member states) and the interaction between that dummy and the variable “NUMB”. The dummies “ART26”, “ART12”, and “NonART26” are, respectively, dummies for the sub-samples of Article26 member states, Article12 member states, and non-Article26 member states. The sets of countries contained in each of these sub-samples are provided in Table A4 under Appendix A.
Third, the outcomes in Table 6 allow for testing hypothesis 2 (or alternatively hypothesis 3) set out above. To obtain these results, we estimate the specifications of model (1) similar to the ones described in Section 3, and whose results are presented in Table 6. In particular, here we use the variable “NUMB” and not “NUMBWTO” to examine the extent to which the effect of the duration of membership in the GATT/WTO on total AfT flows depends on recipient countries’ level of trade policy liberalization (or trade openness).
We first note from all columns of Table 5 and Table 6 that the coefficients of the lagged dependent variable are all positive and significant. Furthermore, the outcomes of the diagnostic tests, results of which are provided at the bottom of these columns, confirm that all the variants of the model (1) whose outcomes are presented in these two tables are correctly specified.
Regarding the estimates themselves, we note at the outset that the estimates associated with the control variables in Table 5 and Table 6 are, to a large extent, consistent with those in column [3] of Table 1. The results in column [1] of Table 5 confirm the findings from column [3] of Table 1: the duration of the membership in the GATT/WTO exerts a positive effect on total AfT flows. This signifies that longstanding WTO Members receive higher AfT flows than relatively new members, and even more than states that have not yet joined the WTO. An additional year of membership in the GATT/WTO is associated with an increase in total AfT flows of 9.1 per cent, a magnitude of effect which is slightly lower than the one obtained in column [3] of Table 1 (in the latter, AfT flows increased by 12.7 per cent further to an additional year of membership in the WTO). Estimates in column [2] of Table 5 show that LDCs have experienced a lower positive effect of their membership duration in the GATT/WTO on total AfT flows. The net effects of the duration of GATT/WTO membership on total AfT flows in LDCs and NonLDCs are, respectively, 0.035 (=0.131 − 0.0958) and 0.13. These outcomes, although different in terms of magnitude from the ones obtained in column [4] of Table 1, do confirm that membership duration exerts a higher positive effect on total AfT flows to NonLDCs than AfT flows to LDCs. We also note from columns [3] and [4] of Table 5 that, at the 5% level, the magnitude of the positive effect of the duration of membership in the GATT/WTO on total AfT flows for Article26 member states and Article12 member states amount, respectively, to 0.238 and 0.135. While these outcomes may reflect differentiated effects of the membership duration on AfT flows across countries within each of these sub-samples, it nevertheless appears that, on average, Article26 member states receive higher amounts of total AfT flows than Article12 member states do. Taken at face value, these outcomes suggest that donors tend to supply higher AfT flows to Article26 member states than to Article12 member states, probably for reasons other than trade liberalization commitments. One of these reasons could be the existence of old colonial relations between those donors and Article26 member states. Interestingly, we obtain from column [5] of Table 5 that the net effect of the duration of membership in the GATT/WTO on total AfT flows for non-Article26 member states amounts to 0.275 (=0.0781 + 0.197), which is higher than that of Article26 member states, and consequently than that of Article12 member states.
The results in Table 6 are consistent with those in Table 3, although with different coefficients, and statistical significances of these coefficients.
In light of the findings in Table 5 and Table 6, we conclude that the use of the duration of GATT/WTO membership in replacement of the duration of WTO membership in the analysis does not alter the findings obtained from Table 2 and Table 3. Overall, our results are robust to an alternative measure of membership duration.
5. Conclusions
This paper contributes to the literature on the macroeconomic determinants of AfT flows, by complementing the work by Lee et al. (2015) who have explored the effect of developing countries’ membership in the WTO on the AfT flows that they receive from donor countries. In particular, the present paper has investigated the effect of AfT recipients’ duration of WTO membership on the total amounts of AfT flows received from donors. The analysis has used a set of 136 countries over the period from 2002 to 2019, and revealed that as countries experience a higher duration of membership in the WTO, they enjoy higher total AfT flows, including both AfT flows for economic infrastructure and AfT flows for productive capacities. The duration of WTO membership exerts no significant effect on AfT flows related to trade policy and regulation. LDCs experience lower AfT total flows than other countries as their WTO membership duration increases. On another note, donors supply higher AfT flows to countries that improve their participation in international trade (including through greater trade policy liberalization and trade openness) as their membership duration rises. These results remained qualitatively unchanged when we take into account the duration of the membership in the GATT for some WTO member states.
The effect of the duration of WTO membership on the total AfT flows offered to recipient countries also depends on donors’ commercial interests in recipient countries, proxied by the economic growth performance and the endowment in natural resources of these countries. The analysis has established that the duration of WTO membership is associated with higher AfT flows in countries that improve their economic growth rate performance and, in particular, if the latter is higher than 0.85%. The magnitude of this positive AfT flow effect of membership duration increases as the recipients’ economic growth rate rises. Furthermore, this effect is always positive for various shares of natural resource rents in GDP, but donors tend to supply higher AfT flows to countries with lower shares of natural resource rents in GDP than to countries with relatively higher shares of natural resource rents in GDP.
AfT flows are critical for the integration of developing countries, including LDCs in the global trading system. The present study adds to the findings on the benefits of membership in the WTO by showing that the duration of such a membership influences the amount of AfT that accrue to recipient countries. In particular, countries that endeavour to further liberalize their trade regimes and better participate in international trade are encouraged by donor-countries through higher AfT flows.
An avenue for future research could be to explore how the duration of the membership in the WTO could affect AfT flows through the channels of institutional and governance quality.
Funding
This research received no external funding.
Informed Consent Statement
Not applicable.
Data Availability Statement
The data used in this analysis is available online in the public databases, could be obtained upon request.
Acknowledgments
This article represents the personal opinions of individual staff members and is not meant to represent the position or opinions of the WTO or its Members, nor the official position of any WTO staff members. The author thanks the anonymous Reviewers for their comments on the earlier version of the article. Any errors or omissions are the fault of the author.
Conflicts of Interest
I hereby confirm that there is no actual or potential conflict of interest including any financial, personal or other relationships with other people or organizations within three years of beginning the submitted work that could inappropriately influence, or be perceived to influence, the work.
Appendix A

Table A1.
Definition and Source of variables.
| Variables | Definition | Source |
|---|---|---|
| AfTTOT, AfTINFRA, AfTPROD, AfTPOL | “AfTTOT” is the total real gross disbursements of total Aid for Trade. “AfTINFRA” is the real gross disbursements of Aid for Trade allocated to the buildup of economic infrastructure. “AfTPROD” is the real gross disbursements of Aid for Trade for building productive capacities. “AfTPOL” is the real gross disbursements of Aid allocated for trade policies and regulation. All four AfT variables are expressed in constant prices 2019, US Dollar. | Author’s calculation based on data extracted from the OECD statistical database on development, in particular the OECD/DAC-CRS (Organization for Economic Cooperation and Development/Donor Assistance Committee)-Credit Reporting System (CRS). Aid for Trade data cover the following three main categories (the CRS Codes are in brackets): Aid for Trade for Economic Infrastructure (“AfTINFRA”), which includes transport and storage (210), communications (220), and energy generation and supply (230); Aid for Trade for Building Productive Capacity (“AfTPROD”), which includes banking and financial services (240), business and other services (250), agriculture (311), forestry (312), fishing (313), industry (321), mineral resources and mining (322), and tourism (332); and Aid for Trade policy and regulations (“AfTPOL”), which includes trade policy and regulations and trade-related adjustment (331). |
| NUMBWTO | This is the transformed indicator of a country’s duration of membership in GATT and WTO. Let us denote “NUMB1” the duration of GATT7WTO membership for a given country. It represents the time elapsed since the country has joined either the then GATT or the WTO (for Article XII Members). This variable takes the value of “0” for years during which the country was not a GATT or WTO member. It takes the value of “1” the first year the country had joined the GATT or WTO (i.e., the year it acceded to the GATT or WTO), and is incremented by 1 for every subsequent (additional) year spent as GATT/WTO member. As the GATT entered into effect in 1948, this variable takes the value of 1 for countries that joined the GATT in 1948., and the value of 72 in 2019. For the other countries that were GATT Members before joining the WTO, the variable “NUMB1” took the value of 1 for the first year of the GATT membership, and is incremented by 1 for every additional year until 2019. For states that were not GATT Members but joined the WTO (including under WTO’s Article XII), it took the value of 1 for the first year of WTO membership, and is incremented for every additional year until 2019. As the variable “NUMB1” contains many zeros, and has a skewed distribution, it has been transformed using the following formula: NUMBWTO | Author’s computation based on data collected from the website of the WTO. The list of countries (128) that had signed GATT by 1994 is accessible online at: https://www.wto.org/english/thewto_e/gattmem_e.htm (accessed on 20 January 2020) The list of states that were GATT Members, and that joined the WTO, as well as those that joined the WTO under the WTO’s Article XII is accessible online at: (https://www.wto.org/english/thewto_e/whatis_e/tif_e/org6_e.htm (accessed 20 January 2020) |
| NonAfT | This is the measure of the development aid allocated to other sectors in the economy than the trade sector. It has been computed as the difference between the gross disbursements of total ODA and the gross disbursements of total Aid for Trade (both being expressed in constant prices 2019, US Dollar). | Author’s calculation based on data extracted from the OECD/DAC-CRS database. |
| TP | This is the indicator of trade policy, measured by the trade freedom score. The latter is a component of the Economic Freedom Index. It is a composite measure of the absence of tariff and non-tariff barriers that affect imports and exports of goods and services. The trade freedom score is graded on a scale of 0 to 100, with a rise in its value indicating lower trade barriers, i.e., higher trade liberalization, while a decrease in its value reflects rising trade protectionism. | Heritage Foundation (see Miller et al. 2021) |
| TARIFF | This is the applied tariff rate (%) (weighted mean for all products). | Author’s calculation based on data extracted from the World Development Indicators (WDI), 2021. |
| OPEN | This is the indicator of a country’s participation in international trade. It is basically the measure of trade openness proposed by Squalli and Wilson (2011). It is calculated as the ratio of the sum of a country’s exports and imports of goods and services to its GDP, adjusted by the proportion of a country’s trade level relative to the average world trade (see Squalli and Wilson 2011, p. 1758). | WDI |
| RENT | Total natural resources rents (% of GDP) | WDI |
| GDP | Gross Domestic Product (constant 2010 US$) | WDI |
| GROWTH | Growth rate of the real GDP per capita (constant 2010 US$), annual percentage | WDI |
| POP | This is the measure of the total Population | WDI |
Table A2.
Descriptive statistics on variables used in the analysis.
| Variable | Observations | Mean | Standard Deviation | Minimum | Maximum |
|---|---|---|---|---|---|
| AfTTOT | 664 | 215,000,000 | 387,000,000 | 53,334.33 | 3,670,000,000 |
| AfTINFRA | 664 | 128,000,000 | 262,000,000 | 11,374.00 | 3,170,000,000 |
| AfTPROD | 664 | 82,900,000 | 148,000,000 | 16,850.67 | 1,840,000,000 |
| AfTPOL | 652 | 3,979,265 | 9,792,189 | −29,447 | 165,000,000 |
| NUMBWTO1 | 664 | 12.32 | 8.49 | 0.00 | 24.00 |
| NUMB1 | 664 | 26.6747 | 22.87465 | 0 | 71 |
| NonAfT | 664 | 638,000,000 | 935,000,000 | 2,419,856.00 | 12,400,000,000 |
| TP | 596 | 70.38 | 10.22 | 27.40 | 89.20 |
| TARIFF | 572 | 7.72 | 7.71 | 0.47 | 149.07 |
| OPEN | 616 | 0.00 | 0.00 | 0.0000000033 | 0.0445 |
| GROWTH | 664 | 4.20 | 3.44 | −12.52 | 29.30 |
| RENT | 664 | 8.19 | 11.00 | 0.00 | 62.08 |
| GDPC | 664 | 4056.08 | 3605.41 | 211.01 | 19,230.04 |
| POP | 664 | 42,800,000 | 162,000,000 | 9944.67 | 1,390,000,000 |
Table A3.
Duration of the WTO membership as at 2019 (end-year of the period under analysis).
| Country | Membership Duration | Country | Membership Duration | Country | Membership Duration | Country | Membership Duration |
|---|---|---|---|---|---|---|---|
| Afghanistan ** | 4 | Dominican Republic | 25 | Liberia ** | 4 | Sao Tome and Principe ** | 0 |
| Albania | 20 | Ecuador | 24 | Libya | 0 | Senegal ** | 25 |
| Algeria | 0 | Egypt, Arab Rep | 25 | Madagascar ** | 25 | Serbia | 0 |
| Angola ** | 25 | El Salvador | 25 | Malawi ** | 25 | Seychelles | 5 |
| Antigua and Barbuda | 25 | Equatorial Guinea | 0 | Malaysia | 25 | Sierra Leone ** | 25 |
| Argentina | 25 | Eritrea ** | 0 | Maldives | 25 | Solomon Islands ** | 23 |
| Armenia | 17 | Eswatini | 25 | Mali ** | 25 | South Africa | 25 |
| Azerbaijan | 0 | Ethiopia ** | 0 | Marshall Islands | 0 | South Sudan ** | 0 |
| Bangladesh ** | 25 | Fiji | 25 | Mauritania ** | 25 | Sri Lanka | 25 |
| Belarus | 0 | Gabon | 25 | Mauritius | 25 | St. Lucia | 25 |
| Belize | 25 | Gambia ** | 23 | Mexico | 25 | St. Vincent and the Grenadines | 25 |
| Benin ** | 24 | Georgia | 20 | Micronesia, Fed. Sts. | 0 | Sudan ** | 0 |
| Bhutan ** | 0 | Ghana | 25 | Moldova | 19 | Suriname | 25 |
| Bolivia | 25 | Grenada | 24 | Mongolia | 23 | Tajikistan | 7 |
| Bosnia and Herzegovina | 0 | Guatemala | 25 | Montenegro | 8 | Tanzania ** | 25 |
| Botswana | 25 | Guinea ** | 25 | Morocco | 25 | Thailand | 25 |
| Brazil | 25 | Guinea-Bissau ** | 25 | Mozambique ** | 25 | Timor-Leste ** | 0 |
| Burkina Faso ** | 25 | Guyana | 25 | Myanmar ** | 25 | Togo ** | 25 |
| Burundi ** | 25 | Haiti ** | 24 | Namibia | 25 | Tonga | 13 |
| Cabo Verde | 12 | Honduras | 25 | Nauru | 0 | Tunisia | 25 |
| Cambodia ** | 16 | India | 25 | Nepal ** | 16 | Turkey | 25 |
| Cameroon | 25 | Indonesia | 25 | Nicaragua | 25 | Turkmenistan | 0 |
| Central African Republic ** | 25 | Iran | 0 | Niger ** | 23 | Tuvalu ** | 0 |
| Chad ** | 24 | Iraq | 0 | Nigeria | 25 | Uganda ** | 25 |
| Chile | 25 | Jamaica | 25 | North Macedonia | 17 | Ukraine | 1 |
| China | 19 | Jordan | 20 | Pakistan | 25 | Uruguay | 25 |
| Colombia | 25 | Kazakhstan | 5 | Palau | 0 | Uzbekistan | 0 |
| Comoros ** | 0 | Kenya | 25 | Panama | 22 | Vanuatu ** | 8 |
| Congo, Dem. Rep ** | 25 | Kiribati ** | 0 | Papua New Guinea | 23 | Venezuela, RB | 25 |
| Congo, Rep | 25 | Kosovo | 0 | Paraguay | 25 | Vietnam | 13 |
| Costa Rica | 25 | Kyrgyz Republic | 22 | Peru | 25 | West Bank and Gaza | 0 |
| Cote d’Ivoire | 25 | Lao PDR ** | 1 | Philippines | 25 | Yemen, Rep ** | 6 |
| Cuba | 25 | Lebanon | 0 | Rwanda ** | 23 | Zambia ** | 25 |
| Dominica | 25 | Lesotho ** | 25 | Samoa | 8 | Zimbabwe | 25 |
Note: Countries for which the duration of WTO membership is ‘0’ in 2019 are de-facto non-WTO Members. LDCs are marked with the symbol ‘**’ in the Table.
Table A4.
List of sub-samples defined on the basis of the stringency of the accession procedures to the GATT/WTO.
Table A4.
List of sub-samples defined on the basis of the stringency of the accession procedures to the GATT/WTO.
| Article XXVI5(c) Member States | Article XII Member States | Non-Article XXVI5(c) Member States | Non-GATT/WTO States | |
|---|---|---|---|---|
| Angola | Namibia | Afghanistan | Argentina | Algeria |
| Antigua and Barbuda | Niger | Albania | Bangladesh | Azerbaijan |
| Belize | Nigeria | Armenia | Bolivia | Belarus |
| Benin | Papua New Guinea | Cabo Verde | Brazil | Bhutan |
| Botswana | Rwanda | Cambodia | Chile | Bosnia and Herzegovina |
| Burkina Faso | Senegal | China | Colombia | Comoros |
| Burundi | Sierra Leone | Ecuador | Congo, Dem. Rep. | Equatorial Guinea |
| Cameroon | Solomon Islands | Georgia | Costa Rica | Eritrea |
| Central African Republic | St. Lucia | Jordan | Cuba | Ethiopia |
| Chad | St. Vincent and the Grenadines | Kazakhstan | Dominican Republic | Iran, Islamic Rep. |
| Congo, Rep. | Suriname | Kyrgyz Republic | Egypt, Arab Rep. | Iraq |
| Cote d’Ivoire | Tanzania | Lao PDR | El Salvador | Kiribati |
| Dominica | Togo | Liberia | Guatemala | Kosovo |
| Eswatini | Uganda | Moldova | Haiti | Lebanon |
| Fiji | Zambia | Mongolia | Honduras | Libya |
| Gabon | Montenegro | India | Marshall Islands | |
| Gambia, The | Nepal | Mexico | Micronesia, Fed. Sts. | |
| Ghana | North Macedonia | Morocco | Nauru | |
| Grenada | Panama | Myanmar | Palau | |
| Guinea | Samoa | Nicaragua | Sao Tome and Principe | |
| Guinea-Bissau | Seychelles | Pakistan | Serbia | |
| Guyana | Tajikistan | Paraguay | South Sudan | |
| Indonesia | Ukraine | Peru | Sudan | |
| Jamaica | Vanuatu | Philippines | Timor-Leste | |
| Kenya | Vietnam | South Africa | Turkmenistan | |
| Lesotho | Yemen, Rep. | Sri Lanka | Tuvalu | |
| Madagascar | Thailand | Uzbekistan | ||
| Malawi | Tonga | West Bank and Gaza | ||
| Malaysia | Tunisia | |||
| Maldives | Turkey | |||
| Mali | Uruguay | |||
| Mauritania | Venezuela, RB | |||
| Mauritius | Zimbabwe | |||
Notes: “non-GATT/WTO states” are states that are not at all GATT/WTO members. “non-Article XXVI5(c) member states” are those states that are neither Article XXVI5(c) member states, nor Article XII member states. This group of countries does not include non-GATT/WTO states.
| 1 | These structural impediments to developing countries’ participation in international trade include for example the lack of trade-related infrastructure and capacity (e.g., Hallaert and Munro 2009). The infrastructural deficiency concerns both hard infrastructure (such as highways, railroads, ports) and soft infrastructure such as transparency, customs efficiency, institutional reforms that would help reduce the burdensome time-consuming border procedures (e.g., Portugal-Perez and Wilson 2012). |
| 2 | The category of LDCs has been defined as such by the United Nations as the group of countries qualified as the poorest and most vulnerable to exogenous economic and environmental shocks. Information on the LDCs could be found online at: https://www.un.org/ohrlls/content/least-developed-countries (accessed on 20 February 2021). |
| 3 | Benziane et al. (2022) have provided the most recent literature survey on the subject matter. |
| 4 | Further details on the fulfilment of the transparency objective by WTO Councils and Committees are available online at: https://www.wto.org/english/tratop_e/monitor_e/monitor_e.htm (accessed on 20 February 2021). |
| 5 | Information on the WTO’s role of overseeing national trade policies is accessible online at: https://www.wto.org/english/tratop_e/tpr_e/tp_int_e.htm (accessed on 20 February 2021). |
| 6 | Koopman et al. (2020) have documented the positive effects of the membership in the WTO. |
| 7 | Basic information on the TPRM’s role concerning the WTO’s transparency objective can be found online at: https://www.wto.org/english/thewto_e/whatis_e/tif_e/agrm11_e.htm (accessed on 20 February 2021). |
| 8 | Anderson (2016) and Koopman et al. (2020) have provided literature surveys on the benefits of the WTO membership. |
| 9 | It is worth noting that Ferrantino (2010) has uncovered that the accession to the WTO exerts no significant effect on governance, and Choudhury (2019) has also obtained no significant effect of WTO membership on domestic corruption. |
| 10 | Hühne et al. (2014) have established empirically that while AfT flows increase exports by recipient countries, these resources inflows also induce a rise in the imports by recipient countries from donor countries. |
| 11 | For example, Brotto et al. (2021), Cling et al. (2009) and Tang and Wei (2009) have found that the membership in the WTO is positively associated with economic growth performance. One may, therefore, assume that an increase in the duration of WTO membership would also exert a positive effect on economic growth, although this assumption needs to be tested empirically in future research. |
| 12 | It is important to note that while the institutional and governance quality in an AfT recipient country could affect the amount of AfT flows received by a given country, we have not included such an indicator in Equation (1) not only because it is highly correlated with the indicator of economic growth. We have stated above that the membership in the WTO helps improve countries’ governance, and could, therefore, affect AfT flows through this channel. However, testing here the hypothesis concerning whether the effect of the duration of the membership in the WTO on AfT flows depends on the quality of institution and governance, goes beyond the scope of this paper. |
| 13 | Such an increase can be attributed to the AfT Initiative, which had helped mobilized greater financial resources in favour of the trade sector in developing countries immediately after the launch of this Initiative in 2005 (see Gnangnon 2019). |
| 14 | Standard errors of the coefficients obtained from the regressions based on these two estimators have been corrected using the Driscoll and Kraay (1998) technique. The latter corrects for the autocorrelation, heteroscedasticity, and any form of cross-sectional dependence in the error-term. |
| 15 | In the full sample, the values of the variable “OPEN” range between 0.0000000033 and 0.0445—see Table A2 under Appendix A. |
| 16 | The GATT Article XXVI 5(c) reads as follows: If any of the customs territories, in respect of which a contracting party has accepted this Agreement, possesses or acquires full autonomy in the conduct of its external commercial relations and of the other matters provided for in this Agreement, such territory shall, upon sponsorship through a declaration by the responsible contracting party establishing the above-mentioned fact, be deemed to be a contracting party. GATT Article XXVI 5(c) is accessible online at: https://www.wto.org/english/res_e/publications_e/ai17_e/gatt1994_art26_gatt47.pdf (accessed on February 2021). |
| 17 | Article XII of the Marrakesh Agreement establishing the WTO provides that “Any State or separate customs territory possessing full autonomy in the conduct of its external commercial relations and of the other matters provided for in this Agreement and the Multilateral Trade Agreements may accede to this Agreement, on terms to be agreed between it and the WTO. Such accession shall apply to this Agreement and the Multilateral Trade Agreements annexed thereto” (see Article XII.1). Further information on Article XII is available online at: https://www.wto.org/english/docs_e/legal_e/04-wto.pdf (accessed on February 2021) and https://www.wto.org/english/thewto_e/acc_e/acces_e.htm (accessed on February 2021). |
References
- Aaronson, Susan Ariel, and Rodwan Abouharb. 2014. Does the WTO help member states improve governance? World Trade Review 13: 547–82. [Google Scholar] [CrossRef]
- Alonso-Borrego, César, and Manuel Arellano. 1999. Symmetrically normalized instrumental-variable estimation using panel data. Journal of Business & Economic Statistics 17: 36–49. [Google Scholar]
- Anderson, Kym. 2016. Contributions of the GATT/WTO to Global Economic Welfare: Empirical Evidence. Journal of Economic Surveys 30: 56–92. [Google Scholar] [CrossRef] [Green Version]
- Basu, Sudip Ranjan. 2008. Does WTO accession Affect Domestic Economic Policies and Institutions? HEI Working Paper No.: 03/2008. Geneva: The Graduate Institute of International Studies. [Google Scholar]
- Benziane, Yakoub, Siong Hook Law, Anitha Rosland, and Muhammad Daaniyall Abd Rahman. 2022. Aid for trade initiative 16 years on: Lessons learnt from the empirical literature and recommendations for future directions. Journal of International Trade Law and Policy 21: 79–104. [Google Scholar] [CrossRef]
- Blundell, Richard, and Stephen Bond. 1998. Initial Conditions and Moment Restrictions in Dynamic Panel Data Models. Journal of Econometrics 87: 115–43. [Google Scholar] [CrossRef] [Green Version]
- Bond, Stephen, Anke Hoeffler, and Jonathan Temple. 2001. GMM Estimation of Empirical Growth Models. CEPR Paper DP3048. London: Centre for Economic Policy Research. [Google Scholar]
- Brotto, André, Adam Jakubik, and Roberta Piermartini. 2021. WTO Accession and Growth: Tang and Wei Redux. WTO Staff Working Paper ERSD-2021-1. Geneva: World Trade Organization. [Google Scholar]
- Cao, Vinh T. H., and Lisandra Flach. 2015. The Effect of GATT/WTO on Export and Import Price Volatility. The World Economy 38: 2049–79. [Google Scholar] [CrossRef]
- Chaisse, Julien, and Mitsuo Matsushita. 2013. Maintaining the WTO’s Supremacy in the International Trade Order: A Proposal to Refine and Revise the Role of the Trade Policy Review Mechanism. Journal of International Economic Law 16: 9–36. [Google Scholar] [CrossRef]
- Chang, Pao-Li, and Myoung-Jae Lee. 2011. The WTO trade effect. Journal of International Economics 85: 53–71. [Google Scholar] [CrossRef]
- Chemutai, Vicky, and Hubert Escaith. 2017. Measuring World Trade Organization (WTO) Accession Commitments and their Economic Effects. Journal of International Commerce, Economics and Policy 8: 1750007. [Google Scholar] [CrossRef]
- Choudhury, Sanchari. 2019. WTO membership and corruption. European Journal of Political Economy 60: 101806. [Google Scholar] [CrossRef]
- Chowdhury, Abdur, Xuepeng Liu, Miao Wang, and M. C. Wong. 2021. The Role of Multilateralism of the WTO in International Trade Stability. World Trade Review 20: 668–89. [Google Scholar] [CrossRef]
- Cling, Jean-Pierre, Mohamed Ali Marouani, Mireille Razafindrakoto, Anne-Sophie Robilliard, and Francois Roubaud. 2009. The distributive impact of Vietnam’s accession to the WTO. Économie Internationale 2: 43–71. [Google Scholar] [CrossRef]
- Drabek, Zdenek, and Marc Bacchetta. 2004. Tracing the Effects of WTO Accession on Policymaking in Sovereign States: Preliminary Lessons from the Recent Experience of Transition Countries. The World Economy 27: 1083–125. [Google Scholar] [CrossRef]
- Driscoll, John C., and Aart C. Kraay. 1998. Consistent Covariance Matrix Estimation with Spatially Dependent Panel Data. Review of Economics and Statistics 80: 549–60. [Google Scholar] [CrossRef]
- Dutt, Pushan. 2020. The WTO is not passé. European Economic Review 128: 103507. [Google Scholar] [CrossRef]
- Eicher, Theo S., and Christian Henn. 2011. In search of WTO trade effects: Preferential trade agreements promote trade strongly, but unevenly. Journal of International Economics 83: 137–53. [Google Scholar] [CrossRef]
- Ferrantino, Michael J. 2010. Policy Anchors: Do Free Trade Agreements and WTO Accessions Serve as Vehicles for Developing-country Policy Reform? In Is the World Trade Organization Attractive Enough for Emerging Economies? Edited by Zdenek Drabek. Palgrave Macmillan Books. London: Palgrave Macmillan, chp. 5. pp. 139–75. [Google Scholar]
- Gamberoni, Elisa, and Richard Newfarmer. 2014. Aid for Trade: Do Those Countries that Need It, Get It? The Word Economy 37: 511–78. [Google Scholar] [CrossRef]
- Ghosh, Arunabha. 2010. Developing countries in the WTO Trade Policy Review Mechanism. World Trade Review 9: 419–55. [Google Scholar] [CrossRef]
- Gnangnon, Sèna Kimm. 2017. Multilateral Trade Liberalisation, Export Share in the International Trade Market and Aid for Trade. Journal of International Commerce, Economics and Policy 8: 1750014. [Google Scholar] [CrossRef]
- Gnangnon, Sèna Kimm. 2018. Relative Trade Preferential Margin and Aid for Trade Allocation. The International Trade Journal 32: 240–67. [Google Scholar] [CrossRef]
- Gnangnon, Sèna Kimm. 2019. Has the WTO’s Aid for Trade Initiative Delivered on Its Promise of Greater Mobilization of Development Aid in Favor of the Trade Sector in Developing Countries? International Trade Journal 33: 519–41. [Google Scholar] [CrossRef]
- Gnangnon, Sèna Kimm. 2021a. Aid for Trade flows and Poverty Reduction. Singapore Economic Review, 1–44. [Google Scholar] [CrossRef]
- Gnangnon, Sèna Kimm. 2021b. Do Donors provide higher Aid for Trade flows to Recipient-Countries that Diversify Export Products or Is It the Other Way Around? Arthaniti: Journal of Economic Theory and Practice, 09767479211036657. [Google Scholar] [CrossRef]
- Gnangnon, Sèna Kimm. 2021c. WTO Membership, the Membership Duration and the Utilization of Non-Reciprocal Trade Preferences Offered by the QUAD Countries. Kiel and Hamburg: ZBW—Leibniz Information Centre for Economics. [Google Scholar]
- Gnangnon, Sèna Kimm. 2023a. Duration of membership in the world trade organization and investment-oriented remittances inflows. The Quarterly Review of Economics and Finance 88: 258–77. [Google Scholar] [CrossRef]
- Gnangnon, Sèna Kimm. 2023b. Duration of the Membership in the GATT/WTO, Structural Economic Vulnerability and Trade Costs. Journal of Risk and Financial Management 16: 282. [Google Scholar] [CrossRef]
- Hallaert, Jean-Jacques. 2010. Increasing the Impact of Trade Expansion on Growth: Lessons from Trade Reforms for the Design of Aid for Trade. OECD Trade Policy Papers, No. 100. Paris: OECD Publishing. [Google Scholar]
- Hallaert, Jean-Jacques, and Laura Munro. 2009. Binding Constraints to Trade Expansion: Aid for Trade Objectives and Diagnostics Tools. OECD Trade Policy Papers, No. 94. Paris: OECD Publishing. [Google Scholar]
- Hühne, Philipp, Birgit Meyer, and Peter Nunnenkamp. 2014. Who Benefits from Aid for Trade? Comparing the Effects on Recipient versus Donor Exports. Journal of Development Studies 50: 1275–88. [Google Scholar] [CrossRef] [Green Version]
- Koopman, Robert, John Hancock, Roberta Piermartini, and Eddy Bekkers. 2020. The Value of the WTO. Journal of Policy Modeling 42: 829–49. [Google Scholar] [CrossRef]
- Kruskal, William H., and W. Allen Wallis. 1952. Use of ranks in one-criterion variance analysis. Journal of the American Statistical Association 47: 583–621. [Google Scholar] [CrossRef]
- Laird, Sam. 1999. The WTO’s Trade Policy Review Mechanism—From Through the Looking Glass. The World Economy 22: 741–64. [Google Scholar] [CrossRef]
- Larch, Mario, José Antonio Monteiro, Roberta Piermartini, and Yoto V. Yotov. 2019. On the effects of GATT/WTO membership on trade: They are positive and large after all. In WTO Staff Working Papers ERSD-2019-09. Geneva: World Trade Organization (WTO). [Google Scholar]
- Lee, Hyun-Hoon, Donghyun Park, and Meehwa Shin. 2015. Do Developing-country WTO Members Receive More Aid for Trade (AfT)? The World Economy 38: 1462–85. [Google Scholar] [CrossRef]
- Mansfield, Edward D., and Eric Reinhardt. 2008. International institutions and the volatility of international trade. International Organization 62: 621–52. [Google Scholar] [CrossRef] [Green Version]
- Miller, Terry, Anthony B. Kim, James M. Roberts, and Patrick Tyrrell. 2021. 2021 Index of Economic Freedom, Institute for Economic Freedom. Washington, DC: The Heritage Foundation. [Google Scholar]
- Naito, Takumi. 2016. Aid for Trade and Global Growth. Review of International Economics 24: 1178–201. [Google Scholar] [CrossRef]
- Portugal-Perez, Alberto, and John S. Wilson. 2012. Export Performance and Trade Facilitation Reform: Hard and Soft Infrastructure. World Development 40: 1295–307. [Google Scholar] [CrossRef] [Green Version]
- Roodman, David. 2009. A note on the theme of too many instruments. Oxford Bulletin of Economic and Statistics 71: 135–58. [Google Scholar] [CrossRef]
- Shin, Wonkyu, and Dukgeun Ahn. 2019. Trade Gains from Legal Rulings in the WTO Dispute Settlement System. World Trade Review 18: 1–31. [Google Scholar] [CrossRef] [Green Version]
- Squalli, Jay, and Kenneth Wilson. 2011. A New Measure of Trade Openness. The World Economy 34: 1745–70. [Google Scholar] [CrossRef]
- Subramanian, Arvind, and Shang-Jin Wei. 2007. The WTO Promotes Trade, Strongly but Unevenly. Journal of International Economics 72: 151–75. [Google Scholar] [CrossRef] [Green Version]
- Tadasse, Badassa, and Bichaka Fayissa. 2009. Determinants of the Allocation of US Aid for Trade. Working Paper 200901. Duluth: Department of Economics and Finance, University of Minnesota-Duluth. [Google Scholar]
- Tang, Man-Keung K., and Shang-Jin Wei. 2009. The value of making commitments externally: Evidence from WTO accessions. Journal of International Economics 78: 216–29. [Google Scholar] [CrossRef] [Green Version]
- Tomz, Michael, Judith L. Goldstein, and Douglas Rivers. 2007. Do We Really Know that the WTO Increases Trade? Comment. American Economic Review 97: 2005–18. [Google Scholar] [CrossRef]
- World Trade Organization (WTO). 2005. Ministerial Declaration on Doha Work Programme. Paper presented at the Sixth Session of Trade Ministers Conference, Hong Kong, China, December 13–18. [Google Scholar]
- Younas, Javed. 2008. Motivation of Bilateral Aid Allocation: Altruism or Trade Benefits. European Journal of Political Economy 24: 661–74. [Google Scholar] [CrossRef]
Figure 1.
Duration of WTO membership and total AfT flows over the full sample and sub-samples of LDCs and NonLDCs. Source: Author. Note: The variable “AfTTOT” is the gross disbursements of total Aid for Trade, and expressed in million US$, constant 2019 prices. The variable “NUMBWTO1” is the non-transformed indicator of the duration of WTO membership.

Figure 2.
Duration of WTO membership and Total AfT flows. Source: Author. Note: The variable “AfTTOT” is the gross disbursements of total Aid for Trade, and expressed in million US$, constant 2019 prices. The variable “NUMBWTO1” is the non-transformed indicator of the duration of WTO membership.
Figure 2.
Duration of WTO membership and Total AfT flows. Source: Author. Note: The variable “AfTTOT” is the gross disbursements of total Aid for Trade, and expressed in million US$, constant 2019 prices. The variable “NUMBWTO1” is the non-transformed indicator of the duration of WTO membership.

Figure 3.
Marginal Impact of “NUMBWTO” on “AfTTOT” for varying degrees of trade policy liberalization. Source: Author.
Figure 3.
Marginal Impact of “NUMBWTO” on “AfTTOT” for varying degrees of trade policy liberalization. Source: Author.

Figure 4.
Marginal Impact of “NUMBWTO” on “AfTTOT” for varying levels of tariffs. Source: Author.

Figure 5.
Marginal Impact of “NUMBWTO” on “AfTTOT” for varying levels of participation in international trade. Source: Author.
Figure 5.
Marginal Impact of “NUMBWTO” on “AfTTOT” for varying levels of participation in international trade. Source: Author.

Figure 6.
Marginal Impact of “NUMBWTO” on “AfTTOT” for varying economic growth rates. Source: Author.
Figure 6.
Marginal Impact of “NUMBWTO” on “AfTTOT” for varying economic growth rates. Source: Author.

Figure 7.
Marginal Impact of “NUMBWTO” on “AfTTOT” for varying levels of natural resource dependence. Source: Author.
Figure 7.
Marginal Impact of “NUMBWTO” on “AfTTOT” for varying levels of natural resource dependence. Source: Author.

Table 1.
Effect of the duration of WTO membership on total AfT flows. Estimators: POLS, FE, and Two-Step System GMM.
Table 1.
Effect of the duration of WTO membership on total AfT flows. Estimators: POLS, FE, and Two-Step System GMM.
| POLS | FE | Two-Step System GMM | ||
|---|---|---|---|---|
| Variables | Log(AfTTOT) | Log(AfTTOT) | Log(AfTTOT) | Log(AfTTOT) |
| (1) | (2) | (3) | (4) | |
| Log(AfTTOT)t−1 | 0.668 *** | 0.212 *** | 0.541 *** | 0.537 *** |
| (0.0330) | (0.0587) | (0.0158) | (0.0180) | |
| NUMBWTO | 0.0219 ** | 0.173 ** | 0.127 *** | 0.190 *** |
| (0.0110) | (0.0675) | (0.0198) | (0.0192) | |
| NUMBWTO * LDC | −0.142 *** | |||
| (0.0402) | ||||
| LDC | 0.623 *** | |||
| (0.141) | ||||
| Log(GDPC) | 0.641 *** | 1.164 *** | 0.575 * | 1.257 *** |
| (0.223) | (0.308) | (0.336) | (0.417) | |
| [Log(GDPC)]2 | −0.0426 *** | −0.0143 | −0.0326 | −0.0682 ** |
| (0.0145) | (0.0254) | (0.0215) | (0.0265) | |
| Log(NonAfT) | 0.311 *** | 0.356 *** | 0.464 *** | 0.480 *** |
| (0.0401) | (0.0384) | (0.0391) | (0.0373) | |
| GROWTH | 0.00638 | −0.00651 | 0.0174 *** | 0.0160 *** |
| (0.0114) | (0.00847) | (0.00379) | (0.00399) | |
| RENT | −0.0117 *** | 0.0116 *** | −0.0168 *** | −0.0177 *** |
| (0.000912) | (0.00361) | (0.00148) | (0.00147) | |
| Log(POP) | 0.0155 | 1.069 *** | 0.0491 * | 0.0572 ** |
| (0.0106) | (0.143) | (0.0253) | (0.0249) | |
| Constant | −2.462 *** | −17.97 *** | ||
| (0.940) | (3.302) | |||
| Observations-Countries | 664-136 | 664-136 | 664-136 | 664-136 |
| R-squared | 0.881 | |||
| Within R-squared | 0.3740 | |||
| AR1 (p-Value) | 0.0000 | 0.0000 | ||
| AR2 (p-Value) | 0.2188 | 0.2320 | ||
| AR3 (p-Value) | 0.9394 | 0.8980 | ||
| OID (p-Value) | 0.3521 | 0.2290 | ||
Note: * p-value < 0.1; ** p-value < 0.05; *** p-value < 0.01. Robust Standard Errors are in parenthesis. In the regression based on the two-step system GMM estimator, the variables “NUMBWTO”, “NonAfT”, “GROWTH”, “RENT”, “GDPC”, and its squared term and the interaction variable have been treated as endogenous. The variable “POP” has been treated as exogenous. Time dummies have been included in the regressions. The latter have used a maximum of 4 lags of the dependent variable as instruments, and 3 lags of endogenous variables as instruments.
Table 2.
Effect of the duration of WTO membership on the components of total AfT flows. Estimator: Two-Step System GMM.
Table 2.
Effect of the duration of WTO membership on the components of total AfT flows. Estimator: Two-Step System GMM.
| Variables | Log(AfTINFRA) | Log(AfTPROD) | Log(AfTPOL) |
|---|---|---|---|
| (1) | (2) | (3) | |
| One-period lag of the dependent variable | 0.504 *** | 0.438 *** | 0.467 *** |
| (0.0139) | (0.0156) | (0.0205) | |
| NUMBWTO | 0.143 *** | 0.0697 *** | 0.00980 |
| (0.0244) | (0.0167) | (0.0360) | |
| Log(GDPC) | 0.940 ** | 2.694 *** | 3.056 *** |
| (0.465) | (0.337) | (0.642) | |
| [Log(GDPC)]2 | −0.0563 * | −0.180 *** | −0.190 *** |
| (0.0296) | (0.0214) | (0.0418) | |
| Log(NonAfT) | 0.588 *** | 0.404 *** | 0.701 *** |
| (0.0539) | (0.0305) | (0.0759) | |
| GROWTH | 0.0363 *** | 0.0486 *** | 0.0161 |
| (0.00505) | (0.00586) | (0.0115) | |
| RENT | −0.0237 *** | −0.0103 *** | −0.0191 *** |
| (0.00231) | (0.00124) | (0.00324) | |
| Log(POP) | −0.0165 | 0.0725 *** | −0.0426 |
| (0.0338) | (0.0200) | (0.0385) | |
| Observations-Countries | 664-136 | 664-136 | 631-136 |
| AR1 (p-Value) | 0.0000 | 0.0000 | 0.0000 |
| AR2 (p-Value) | 0.0000 | 0.8677 | 0.1431 |
| AR3 (p-Value) | 0.9389 | 0.8662 | 0.5669 |
| OID (p-Value) | 0.4083 | 0.3158 | 0.1990 |
Note: * p-value < 0.1; ** p-value < 0.05; *** p-value < 0.01. Robust Standard Errors are in parenthesis. The variables “NUMBWTO”, “NonAfT”, “GROWTH”, “RENT”, “GDPC”, and its squared term and the interaction variables have been treated as endogenous. The variable “POP” has been treated as exogenous. Time dummies have been included in the regressions. The latter have used a maximum of 4 lags of the dependent variable as instruments, and 3 lags of endogenous variables as instruments.
Table 3.
Effect of the duration of WTO membership on total AfT flows. Estimator: Two-Step System GMM.
Table 3.
Effect of the duration of WTO membership on total AfT flows. Estimator: Two-Step System GMM.
| Variables | Log(AfTTOT) | Log(AfTTOT) | Log(AfTTOT) |
|---|---|---|---|
| (1) | (2) | (3) | |
| Log(AfTTOT)t-1 | 0.541 *** | 0.579 *** | 0.544 *** |
| (0.0130) | (0.0159) | (0.00886) | |
| NUMBWTO | −0.514 *** | 0.0650 *** | 0.247 *** |
| (0.110) | (0.0191) | (0.0465) | |
| NUMBWTO * TP | 0.00779 *** | ||
| (0.00159) | |||
| NUMBWTO * TARIFF | −0.0108 *** | ||
| (0.00224) | |||
| NUMBWTO * [Log(OPEN)] | 0.0175 *** | ||
| (0.00549) | |||
| TP | −0.00391 * | ||
| (0.00236) | |||
| TARIFF | 0.0192 *** | ||
| (0.00492) | |||
| Log(OPEN) | 0.0745 *** | ||
| (0.0215) | |||
| Log(NonAfT) | 0.403 *** | 0.392 *** | 0.364 *** |
| (0.0264) | (0.0236) | (0.0183) | |
| Log(GDPC) | 3.166 *** | 1.986 *** | 0.722 *** |
| (0.315) | (0.270) | (0.267) | |
| [Log(GDPC)]2 | −0.208 *** | −0.130 *** | −0.0582 *** |
| (0.0205) | (0.0176) | (0.0173) | |
| GROWTH | 0.0141 *** | 0.0160 *** | 0.0185 *** |
| (0.00344) | (0.00360) | (0.00276) | |
| RENT | −0.0129 *** | −0.0195 *** | −0.0126 *** |
| (0.00167) | (0.00147) | (0.00123) | |
| Log(POP) | 0.0439 ** | −0.0138 | −0.0620 *** |
| (0.0208) | (0.0128) | (0.0190) | |
| Observations-Countries | 596-127 | 572-128 | 616-129 |
| AR1 (p-Value) | 0.0000 | 0.0000 | 0.0000 |
| AR2 (p-Value) | 0.7031 | 0.2937 | 0.1008 |
| AR3 (p-Value) | 0.8074 | 0.6784 | 0.4753 |
| OID (p-Value) | 0.2301 | 0.1493 | 0.3881 |
Note: * p-value < 0.1; ** p-value < 0.05; *** p-value < 0.01. Robust Standard Errors are in parenthesis. The variables “NUMBWTO”, “TP”, “TARIFF”, “OPEN”, “FDICST”, “NonAfT”, “GROWTH”, “RENT”, “GDPC”, and its squared term and the interaction variables have been treated as endogenous. The variable “POP” has been treated as exogenous. Time dummies have been included in the regressions.
Table 4.
Does the effect of the duration of WTO membership on total AfT flows depend on donors’ commercial self-interest (economic growth and natural resource rents)? Estimator: Two-Step System GMM.
Table 4.
Does the effect of the duration of WTO membership on total AfT flows depend on donors’ commercial self-interest (economic growth and natural resource rents)? Estimator: Two-Step System GMM.
| Variables | Log(AfTTOT) | Log(AfTTOT) | Log(AfTTOT) |
|---|---|---|---|
| (1) | (2) | (3) | |
| Log(AfTTOT)t-1 | 0.525 *** | 0.575 *** | 0.577 *** |
| (0.0155) | (0.0156) | (0.0198) | |
| NUMBWTO | 0.0138 | 0.219 *** | 0.122 *** |
| (0.0175) | (0.0213) | (0.0291) | |
| NUMBWTO * GROWTH | 0.0177 *** | 0.0234 *** | |
| (0.00335) | (0.00403) | ||
| NUMBWTO * RENT | −0.0106 *** | −0.0114 *** | |
| (0.00127) | (0.00150) | ||
| Log(NonAfT) | 0.461 *** | 0.480 *** | 0.549 *** |
| (0.0412) | (0.0363) | (0.0512) | |
| Log(GDPC) | −0.103 | 0.888 ** | 0.806 |
| (0.394) | (0.411) | (0.606) | |
| [Log(GDPC)]2 | 0.00860 | −0.0557 ** | −0.0483 |
| (0.0250) | (0.0266) | (0.0387) | |
| GROWTH | 0.00105 | 0.00209 | −0.0240 *** |
| (0.00398) | (0.00463) | (0.00739) | |
| RENT | −0.0139 *** | 0.00214 | 0.00685 ** |
| (0.00147) | (0.00211) | (0.00292) | |
| Log(POP) | 0.0284 | 0.00589 | −0.0596 * |
| (0.0252) | (0.0245) | (0.0315) | |
| Observations-Countries | 664-136 | 664-136 | 664-136 |
| AR1 (p-Value) | 0.0000 | 0.0000 | 0.0000 |
| AR2 (p-Value) | 0.2041 | 0.2755 | 0.2466 |
| AR3 (p-Value) | 0.7966 | 0.8770 | 0.6686 |
| OID (p-Value) | 0.2194 | 0.4794 | 0.1734 |
Note: * p-value < 0.1; ** p-value < 0.05; *** p-value < 0.01. Robust Standard Errors are in parenthesis. The variables “NUMBWTO”, “GOVEFF”, “REGQUAL”, “NonAfT”, “GROWTH”, “RENT”, “GDPC”, and its squared term and the interaction variables have been treated as endogenous. The variable “POP” has been treated as exogenous. Time dummies have been included in the regressions.
Table 5.
Effect of the duration of the GATT/WTO membership on AfT flows. Estimator: Two-Step System GMM.
Table 5.
Effect of the duration of the GATT/WTO membership on AfT flows. Estimator: Two-Step System GMM.
| Variables | Log(AfTTOT) | Log(AfTTOT) | Log(AfTTOT) | Log(AfTTOT) | Log(AfTTOT) |
|---|---|---|---|---|---|
| (1) | (2) | (3) | (4) | (5) | |
| Log(AfTTOT)t−1 | 0.546 *** | 0.553 *** | 0.532 *** | 0.561 *** | 0.555 *** |
| (0.0165) | (0.0203) | (0.0177) | (0.0172) | (0.0173) | |
| NUMB | 0.0911 *** | 0.131 *** | 0.238 *** | 0.135 *** | 0.0781 *** |
| (0.0237) | (0.0313) | (0.0260) | (0.0195) | (0.0246) | |
| NUMB * LDC | −0.0958 ** | ||||
| (0.0387) | |||||
| LDC | 0.396 *** | ||||
| (0.148) | |||||
| NUMB * ART26 | −0.142 * | ||||
| (0.0731) | |||||
| NUMB * ART12 | 0.0134 | ||||
| (0.0545) | |||||
| NUMB * NonART26 | 0.197 *** | ||||
| (0.0725) | |||||
| ART26 | 0.0825 | ||||
| (0.270) | |||||
| ART12 | 0.235 * | ||||
| (0.140) | |||||
| NonART26 | −0.666 ** | ||||
| (0.276) | |||||
| Log(NonAfT) | 0.431 *** | 0.433 *** | 0.382 *** | 0.459 *** | 0.433 *** |
| (0.0395) | (0.0401) | (0.0411) | (0.0455) | (0.0439) | |
| GROWTH | 0.0170 *** | 0.0151 *** | 0.0134 *** | 0.00983 *** | 0.0141 *** |
| (0.00396) | (0.00428) | (0.00482) | (0.00361) | (0.00413) | |
| RENT | −0.0192 *** | −0.0188 *** | −0.0127 *** | −0.0147 *** | −0.0181 *** |
| (0.00154) | (0.00151) | (0.00174) | (0.00156) | (0.00176) | |
| Log(GDPC) | 0.957 *** | 1.180 ** | 0.127 | 0.129 | 0.750 * |
| (0.357) | (0.473) | (0.454) | (0.461) | (0.412) | |
| [Log(GDPC)]2 | −0.0600 *** | −0.0698 ** | −0.0123 | −0.00494 | −0.0475 * |
| (0.0230) | (0.0299) | (0.0295) | (0.0293) | (0.0269) | |
| Log(POP) | 0.0521 * | 0.0474 * | 0.0468 | 0.0149 | 0.0359 |
| (0.0285) | (0.0284) | (0.0365) | (0.0314) | (0.0315) | |
| Observations-Countries | 664-136 | 664-136 | 664-136 | 664-136 | 664-136 |
| Number of Instruments | 97 | 96 | 96 | 96 | 96 |
| AR1 (p-Value) | 0.0000 | 0.0000 | 0.0000 | 0.0000 | 0.0000 |
| AR2 (p-Value) | 0.2280 | 0.2347 | 0.2481 | 0.2373 | 0.2388 |
| AR3 (p-Value) | 0.9653 | 0.9255 | 0.8606 | 0.9834 | 0.9485 |
| OID (p-Value) | 0.2620 | 0.2189 | 0.2095 | 0.2650 | 0.1755 |
Note: * p-value < 0.1; ** p-value < 0.05; *** p-value < 0.01. Robust Standard Errors are in parenthesis. The variables “NUMB”, “NonAfTTOT”, “GROWTH”, “RENT”, “GDPC”, and its squared term and the interaction variables have been treated as endogenous. The variable “POP” has been treated as exogenous. Time dummies have been included in the regressions.
Table 6.
Effect of the duration of the GATT/WTO membership on AfT flows. Estimator: Two-Step System GMM.
Table 6.
Effect of the duration of the GATT/WTO membership on AfT flows. Estimator: Two-Step System GMM.
| Variables | Log(AfTTOT) | Log(AfTTOT) | Log(AfTTOT) |
|---|---|---|---|
| (1) | (2) | (3) | |
| Log(AfTTOT)t-1 | 0.541 *** | 0.574 *** | 0.545 *** |
| (0.0136) | (0.0174) | (0.00827) | |
| NUMB | −0.504 *** | 0.0398 * | 0.0825 ** |
| (0.0943) | (0.0205) | (0.0330) | |
| NUMB * TP | 0.00726 *** | ||
| (0.00138) | |||
| NUMB * TARIFF | −0.0116 *** | ||
| (0.00177) | |||
| NUMB * [Log(OPEN)] | 0.00636 | ||
| (0.00411) | |||
| TP | −0.00486 ** | ||
| (0.00234) | |||
| TARIFF | 0.0173 *** | ||
| (0.00443) | |||
| Log(OPEN) | 0.129 *** | ||
| (0.0234) | |||
| Log(NonAfT) | 0.407 *** | 0.404 *** | 0.367 *** |
| (0.0288) | (0.0235) | (0.0203) | |
| GROWTH | 0.00966 ** | 0.0121 *** | 0.0194 *** |
| (0.00401) | (0.00419) | (0.00295) | |
| RENT | −0.0142 *** | −0.0179 *** | −0.0157 *** |
| (0.00174) | (0.00160) | (0.00104) | |
| Log(GDPC) | 3.233 *** | 1.857 *** | 1.188 *** |
| (0.384) | (0.280) | (0.259) | |
| [Log(GDPC)]2 | −0.212 *** | −0.123 *** | −0.0905 *** |
| (0.0248) | (0.0181) | (0.0164) | |
| Log(POP) | 0.0747 *** | −0.0178 | −0.0863 *** |
| (0.0220) | (0.0124) | (0.0217) | |
| Observations-Countries | 596-127 | 572-128 | 616-129 |
| Number of Instruments | 105 | 105 | 105 |
| AR1 (p-Value) | 0.0000 | 0.0000 | 0.0000 |
| AR2 (p-Value) | 0.8188 | 0.3213 | 0.1097 |
| AR3 (p-Value) | 0.8532 | 0.6604 | 0.4203 |
| OID (p-Value) | 0.2512 | 0.1779 | 0.4717 |
Note: * p-value < 0.1; ** p-value < 0.05; *** p-value < 0.01. Robust Standard Errors are in parenthesis. The variables “NUMB”, “TP”, “TARIFF”, “OPEN”, “NonAfTTOT”, “GROWTH”, “RENT”, “GDPC”, and its squared term and the interaction variables have been treated as endogenous. The variable “POP” has been treated as exogenous. Time dummies have been included in the regressions.
Disclaimer/Publisher’s Note: The statements, opinions and data contained in all publications are solely those of the individual author(s) and contributor(s) and not of MDPI and/or the editor(s). MDPI and/or the editor(s) disclaim responsibility for any injury to people or property resulting from any ideas, methods, instructions or products referred to in the content. |
© 2023 by the author. Licensee MDPI, Basel, Switzerland. This article is an open access article distributed under the terms and conditions of the Creative Commons Attribution (CC BY) license (https://creativecommons.org/licenses/by/4.0/).
Share and Cite
MDPI and ACS Style
Gnangnon, S.K. Duration of the Membership in the World Trade Organization and Aid for Trade Flows. Economies 2023, 11, 168. https://doi.org/10.3390/economies11060168
AMA Style
Gnangnon SK. Duration of the Membership in the World Trade Organization and Aid for Trade Flows. Economies. 2023; 11(6):168. https://doi.org/10.3390/economies11060168
Chicago/Turabian StyleGnangnon, Sena Kimm. 2023. "Duration of the Membership in the World Trade Organization and Aid for Trade Flows" Economies 11, no. 6: 168. https://doi.org/10.3390/economies11060168
Note that from the first issue of 2016, this journal uses article numbers instead of page numbers. See further details here.