
Is the Tea Bag Index (TBI) Useful for Comparing Decomposition Rates among Soils?


Kyushu Research Center, Forestry and Forest Products Research Institute, FFPRI, Kurokami 4-11-16, Kumamoto 860-0862, Japan
Ecologies 2022, 3(4), 521-529; https://doi.org/10.3390/ecologies3040038
Submission received: 21 September 2022
/
Revised: 29 October 2022
/
Accepted: 10 November 2022
/
Published: 15 November 2022
(This article belongs to the Special Issue Feature Papers of Ecologies 2022)
Abstract
:The Bag Index (TBI) is a novel approach using standardized materials (i.e., commercial tea bags) to evaluate organic matter decomposition by determining two indexes: the early stage decomposition constant k (k_TBI) and litter stabilization factor S (S_TBI). k_TBI is defined as the decomposition constant of an asymptote model describing the decomposition curve of rooibos tea, whereas S is the ratio of the stabilized to total hydrolysable fractions of green tea. However, it was recently revealed that both k_TBI and S_TBI deviate from the actual S and k values accurately determined by fitting an asymptote model to the time series mass of green and rooibos teas remaining (k_fitting and S_fitting, respectively). Nevertheless, k_TBI and S_TBI, which can be determined in a cost- and labor-effective manner, might indicate the relative values of k_fitting and S_fitting across different soils and be useful for comparative analyses. Therefore, this study investigated the positive correlations of k_TBI and S_TBI with k_fitting and S_fitting, respectively, in which case these indexes are useful for comparative analyses. However, the result showed that k_TBI was negatively correlated with k_fitting. This study underscores the importance of obtaining time-series data for accurately determining the decomposition constant of an asymptote model describing the decomposition curve of rooibos tea. S_TBI was positively correlated with S_fitting, implying that S_TBI can be used as an indicator of S.
1. Introduction
Decomposition is an essential ecological process with an important role in nutrient recycling and carbon dynamics. Accordingly, various studies have evaluated the impact of anthropogenic environmental changes, including climate change and eutrophication, on litter decomposition rates [1]. Because the impact on decomposition rates is largely influenced by the variability in litter chemistry, which regulates litter decomposition, standardized materials are essential for evaluating the global-scale impact of environmental changes on litter decomposition.
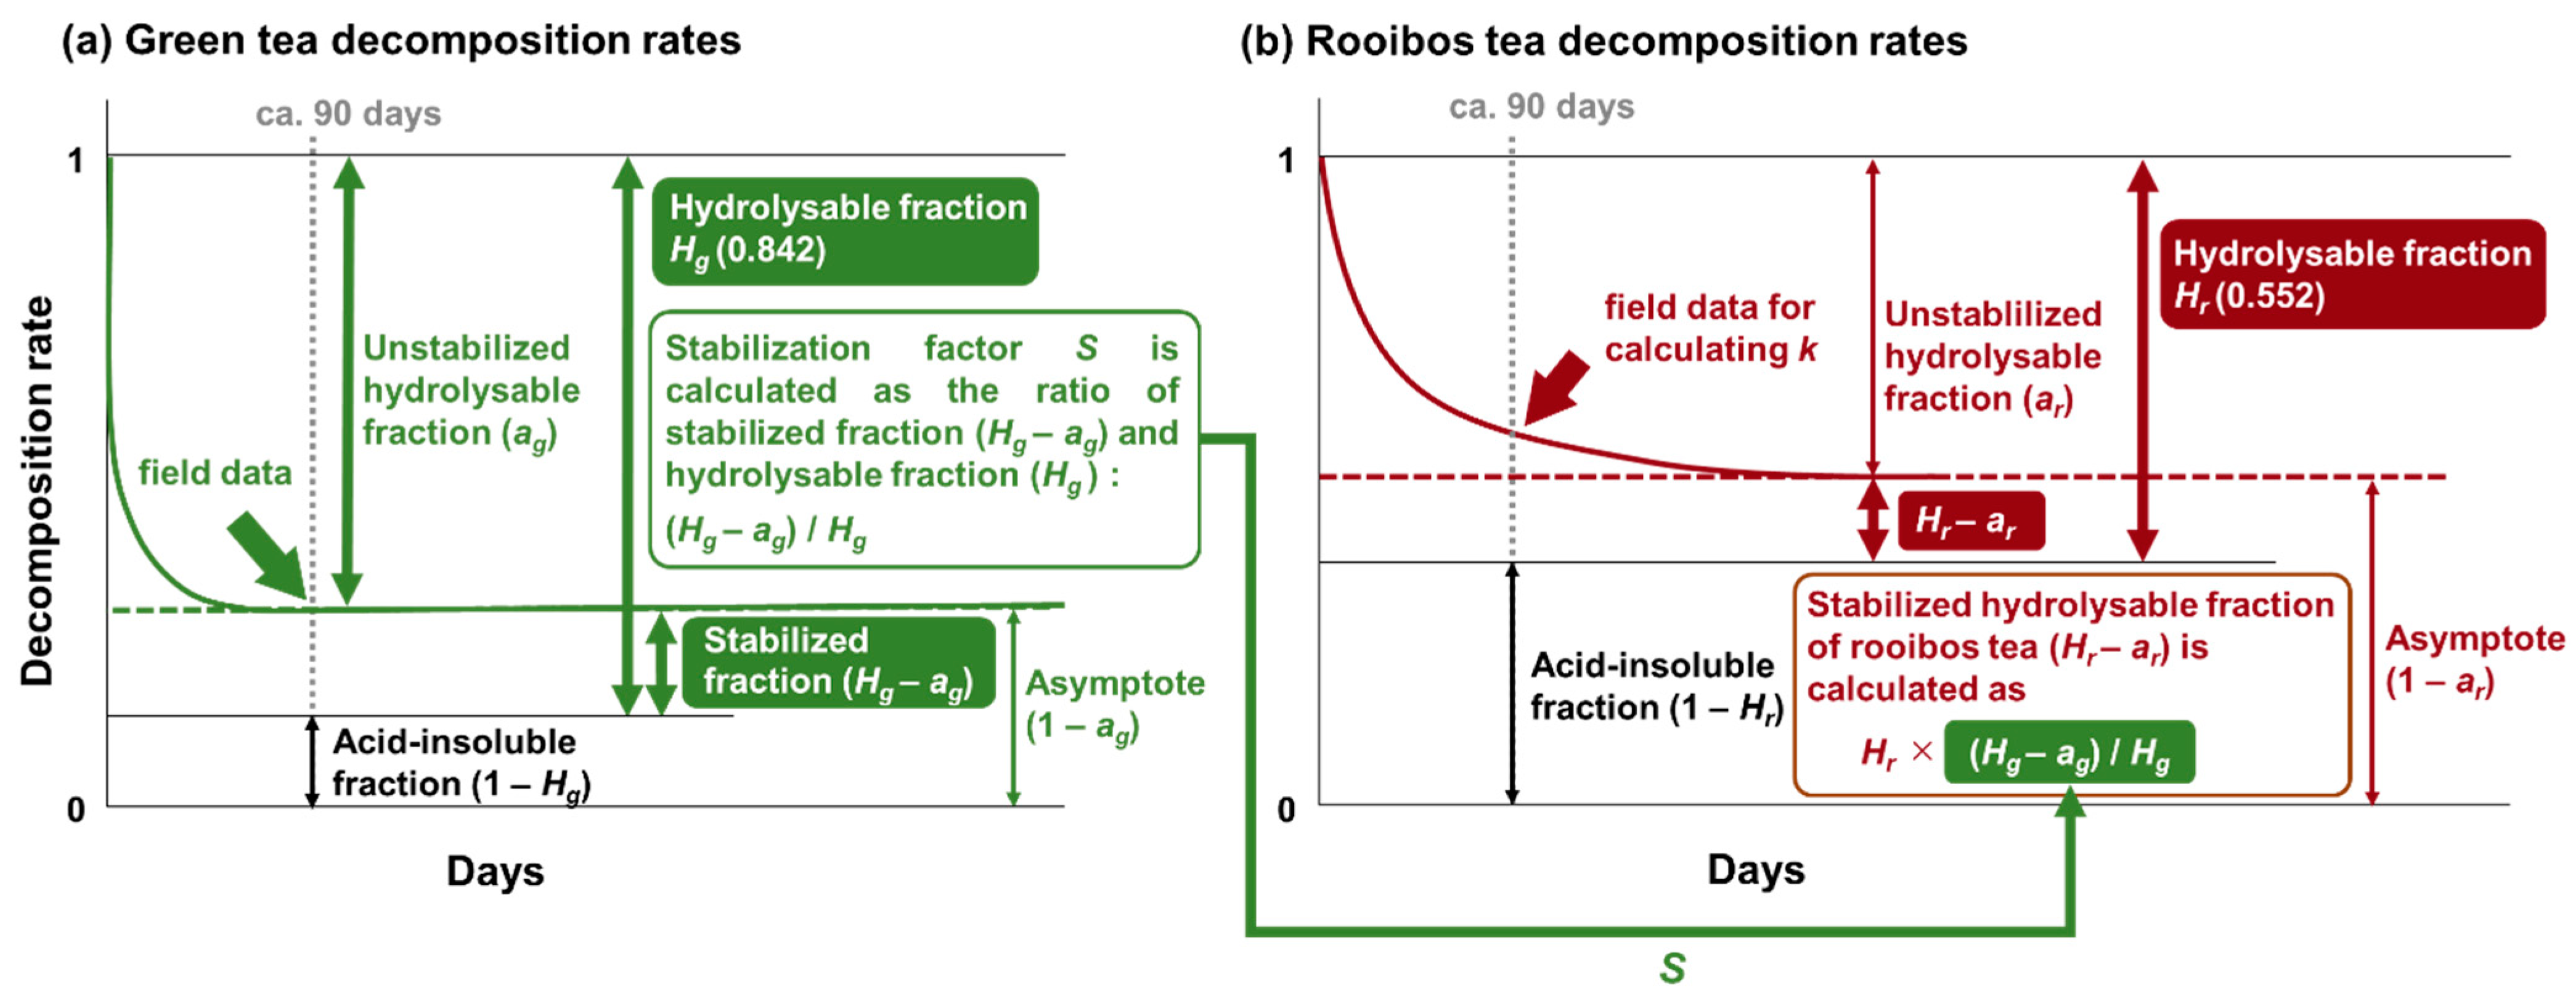
The Tea Bag Index (TBI) was proposed as a novel approach using standardized materials (i.e., commercial green and rooibos tea bags [2]) to evaluate organic matter decomposition. This approach was designed to determine two decomposition indexes, the decomposition constant k (hereafter k_TBI) and stabilization factor S (hereafter S_TBI), which indicate the early decomposition rate and litter stabilization, respectively [2] (see Figure 1). Originally, this approach was proposed for promoting citizen science [2], but researchers are increasingly using this approach for academic studies, including studies to clarify the precise decomposition mechanisms [3,4,5,6].
In the TBI approach, k_TBI is defined as the decomposition constant of an asymptote model describing the decomposition curve of rooibos tea (Figure 1b), while S_TBI is calculated as the ratio of the stabilized to hydrolysable fractions of green tea. The TBI approach enables determination of k_TBI and S_TBI using a single pair of mass loss values for the two types of tea during an approximately 90-day incubation (Figure 1). Namely, time-series data are not required. This is possible because the TBI approach assumes that most of the unstabilized hydrolysable fraction of green tea is decomposed within 90 days (the first assumption), and the stabilization factor S (i.e., the ratio of the stabilized to total hydrolysable fractions) of rooibos tea equals that of green tea (second assumption). In the TBI approach, the hydrolysable fractions of green and rooibos teas were divided into unstabilized (i.e., ag and ar, respectively) and stabilized (i.e., 1 − ag and 1 − ar, respectively) fractions. Using the first assumption, ag can be approximated to the mass loss ratio of green tea at the end of the approximately 90-day incubation. Therefore, stabilization factor S (S_TBI) can be determined using the approximated ag and Hg (0.842, determined by Keuskamp et al. (2013) [2]) (i.e., 1 − ag/Hg, Figure 1). Using the second assumption, stabilized hydrolysable fraction of rooibos tea (i.e., Hr − ar) can be determined by multiplying Hr (0.552, determined by Keuskamp et al. (2013) [2]) by S_TBI, and therefore ar can be calculated as multiplication of Hr by (1 – S_TBI). k_TBI can be determined by fitting an asymptote model to the mass of rooibos tea remaining at the end of the approximately 90-day incubation (Figure 1, see also Section 2.2.).
However, Mori (2022) [7] recently reported that these essential premises for determining k_TBI and S_TBI are not always satisfied by demonstrating that both k_TBI and S_TBI deviated from k and S, respectively, which were determined accurately by fitting an asymptote model to the time-series mass of the remaining green and rooibos teas (k_fitting and S_fitting). Nevertheless, k_TBI and S_TBI, which can be determined in a cost- and labor-effective way, might be useful for comparative analyses, indicating the relative values of k and S across different soils. Therefore, this study investigated the correlations of k_TBI and S_TBI with k_fitting and S_fitting, respectively, to examine if they are positively correlated with each other, in which case these indexes are useful for comparative analyses. Data for the analysis were collected from literature on the time-series mass of both green and rooibos teas remaining. An incubation study was performed to obtain time-series tea decomposition data under relatively dry conditions.
2. Materials and Methods
2.1. Incubation Study
An incubation study was performed to investigate the correlations of k_TBI and S_TBI with k_fitting and S_fitting, respectively, under relatively dry conditions. A surface soil sample (0–10 cm) collected in a Japanese cedar (Cryptomeria japonica [L. f.] D. Don) plantation at the Tatsudayama research site in Kumamoto, Japan (32.82° N, 130.73° E) was used for the incubation. The average annual temperature in the study area is 17.1 °C, and the annual precipitation is 1951 mm (Agro-Meteorological Grid Square Data of the National Agriculture and Food Research Organization). The soil sample was sieved through a 4 mm sieve. Large pieces of organic matter were removed from the soil sample. Because the incubation study aimed to obtain data under relatively dry conditions, the soil was pre-incubated to decrease the soil water content. The initial soil water content of 0.39 (w/w) decreased to 0.31 (w/w) during the 25 h drying process. After pre-incubation, green (EAN: 8714100770542; Lipton, London, UK) and rooibos (EAN: 8722700188438; Lipton, London, UK) tea bags were buried in 100 g of fresh soil in a polyethylene terephthalate bottle. Although Lipton has changed the bag material from 0.25 mm woven mesh to nonwoven mesh, the tea materials inside were unchanged (see Teatime 4 Science; https://www.teatime4science.org/ (accessed on 1 December 2021)). Therefore, I reproduced woven tea bags using the tea inside the nonwoven tea bags and 0.25 mm of mesh (For detailed information, see Mori et al. (2021) [8]). The teas were oven-dried at 70 °C for >72 h, and the initial mass was recorded before the start of incubation. Five bottles were placed in an incubator at 25 °C for 5, 13, 23, 58, and 90 days. The bottles were covered with polyethylene sheets to prevent water evaporation [9]. At the end of the incubation, the tea bags were immediately placed in an oven and dried at <70 °C to prevent further decomposition. Then, after cleaning the surface soil and removing the bags, the teas were oven dried at 70 °C for >72 h and weighed.
2.2. Determination of k_TBI, S_TBI, k_Fitting, and S_Fitting
k_TBI was calculated following Keuskamp et al. (2013) [2] as follows:
where Mloss_R is the mass loss ratio of rooibos tea during an incubation period of t days (generally t = 90), and ar is the unstabilized hydrolysable fraction of rooibos tea determined as follows (because it is assumed that the stabilization factor S of rooibos tea equals that of green tea):
where Hr (0.552) is the hydrolysable fraction of rooibos tea [2], and S_TBI is determined as follows:
where Hg (0.842) is the hydrolysable fraction of rooibos tea [2], and ag is the unstabilized hydrolysable fraction of green tea. In the framework of the TBI approach, ag equals the mass loss ratio of green tea during a 90-day incubation because it is assumed that most of the unstabilized hydrolysable fraction of green tea is decomposed within 90 days.
k_TBI = (ln(ar) − ln(ar − Mloss_R))/t
ar = Hr × (1 − S_TBI)
S_TBI = 1 − ag/Hg
k_fitting and S_fitting were calculated following Mori (2022) [7]. k_fitting was calculated by fitting the asymptote model to the mass of rooibos tea remaining as follows:
where t is the number of days after the start of incubation. The asymptote (1 − ar_fitting) and k_fitting of the model were determined by nonlinear regression (“nls” library). The mass of green tea remaining was fitted by the asymptote model:
where the asymptote (1 − ag_fitting) and k_fitting_G of the model were determined by nonlinear regression in the same manner. S_fitting was determined by the following equation:
Mass of rooibos tea remaining = ar_fitting × e−k_fitting×t + (1 − ar_fitting)
Mass of green tea remaining = ag_fitting × e−k_fitting_G×t + (1 − ag_fitting)
S_fitting = 1 − ag_fitting/Hg
2.3. Data Collection from the Literature
Data were collected from published reports of k_TBI, S_TBI, and the time-series mass of green and rooibos teas remaining [2,7,10,11]. Data for aquatic ecosystems [12,13,14] were not included in this analysis, because the initial leaching of the soluble fraction would change the decomposition curves [13]. Data taken from field experiments [15] were also excluded because environmental conditions such as temperature and moisture were not constant during the incubation. Data using tea bags with nonwoven mesh were included. Different mesh sizes can affect the decomposition pattern of teas by changing the water content inside the tea bags or community composition of decomposers [11]. However, these changes are not problematic in this analysis because those changes influence the k_TBI, S_TBI, and time-series mass loss of green and rooibos teas similarly. To extract data from figures, DataThief 3.0 was used [16]. k_TBI, S_TBI, k_fitting, and S_fitting were calculated as described in Section 2.2. If the mass loss data of the teas were not reported on day 90 of an incubation study, the data were estimated using the fitted asymptote model (data from Keuskamp et al. (2013) [2]), or the data from day 91 were used instead (data from Duddigan et al. (2020) [10]). In the present analysis, data collected from the same study area but different subplots or from different incubation studies under different environmental conditions were treated as independent. A linear mixed-effects model with method (TBI vs fitting) as a fixed effect and incubation condition (such as soil type and incubated temperature) as a random effect was used to examine the differences between parameters (S, k, and asymptote) obtained by the TBI approach and those obtained by fitting the asymptote model to the time series data. R ver. 4.0.2 [17] was used for the statistical analysis.
3. Results and Discussion
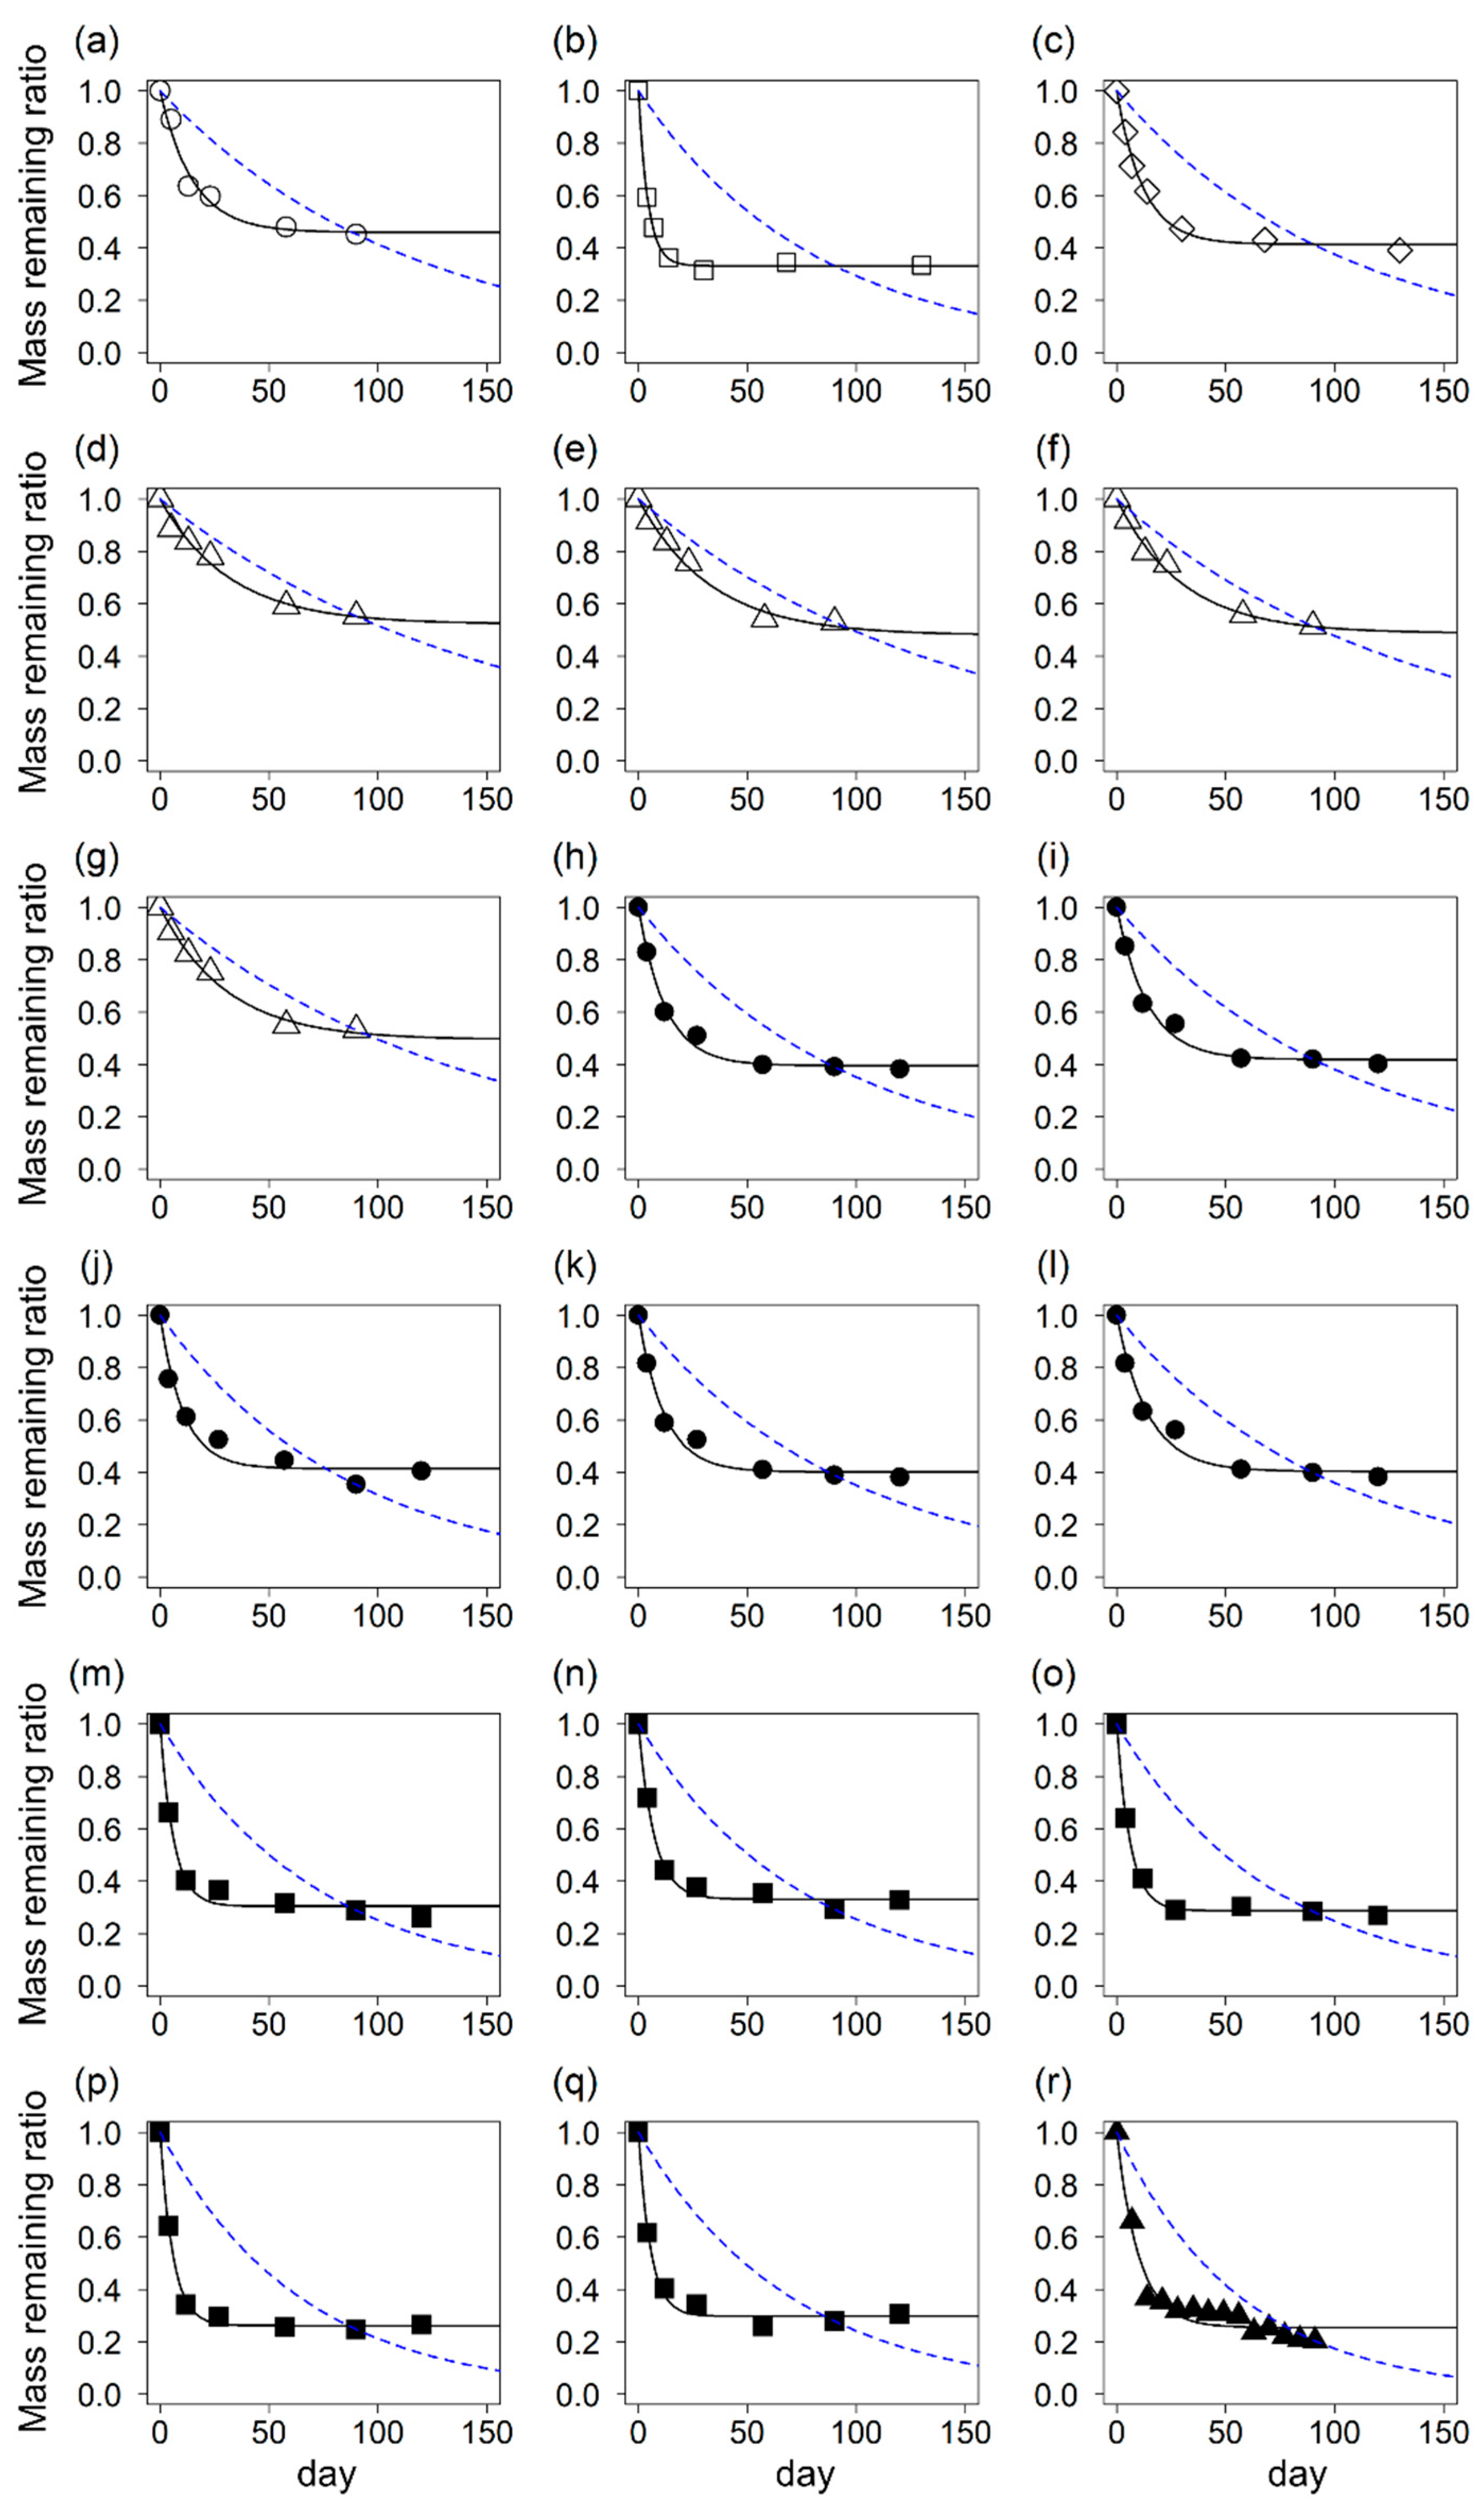
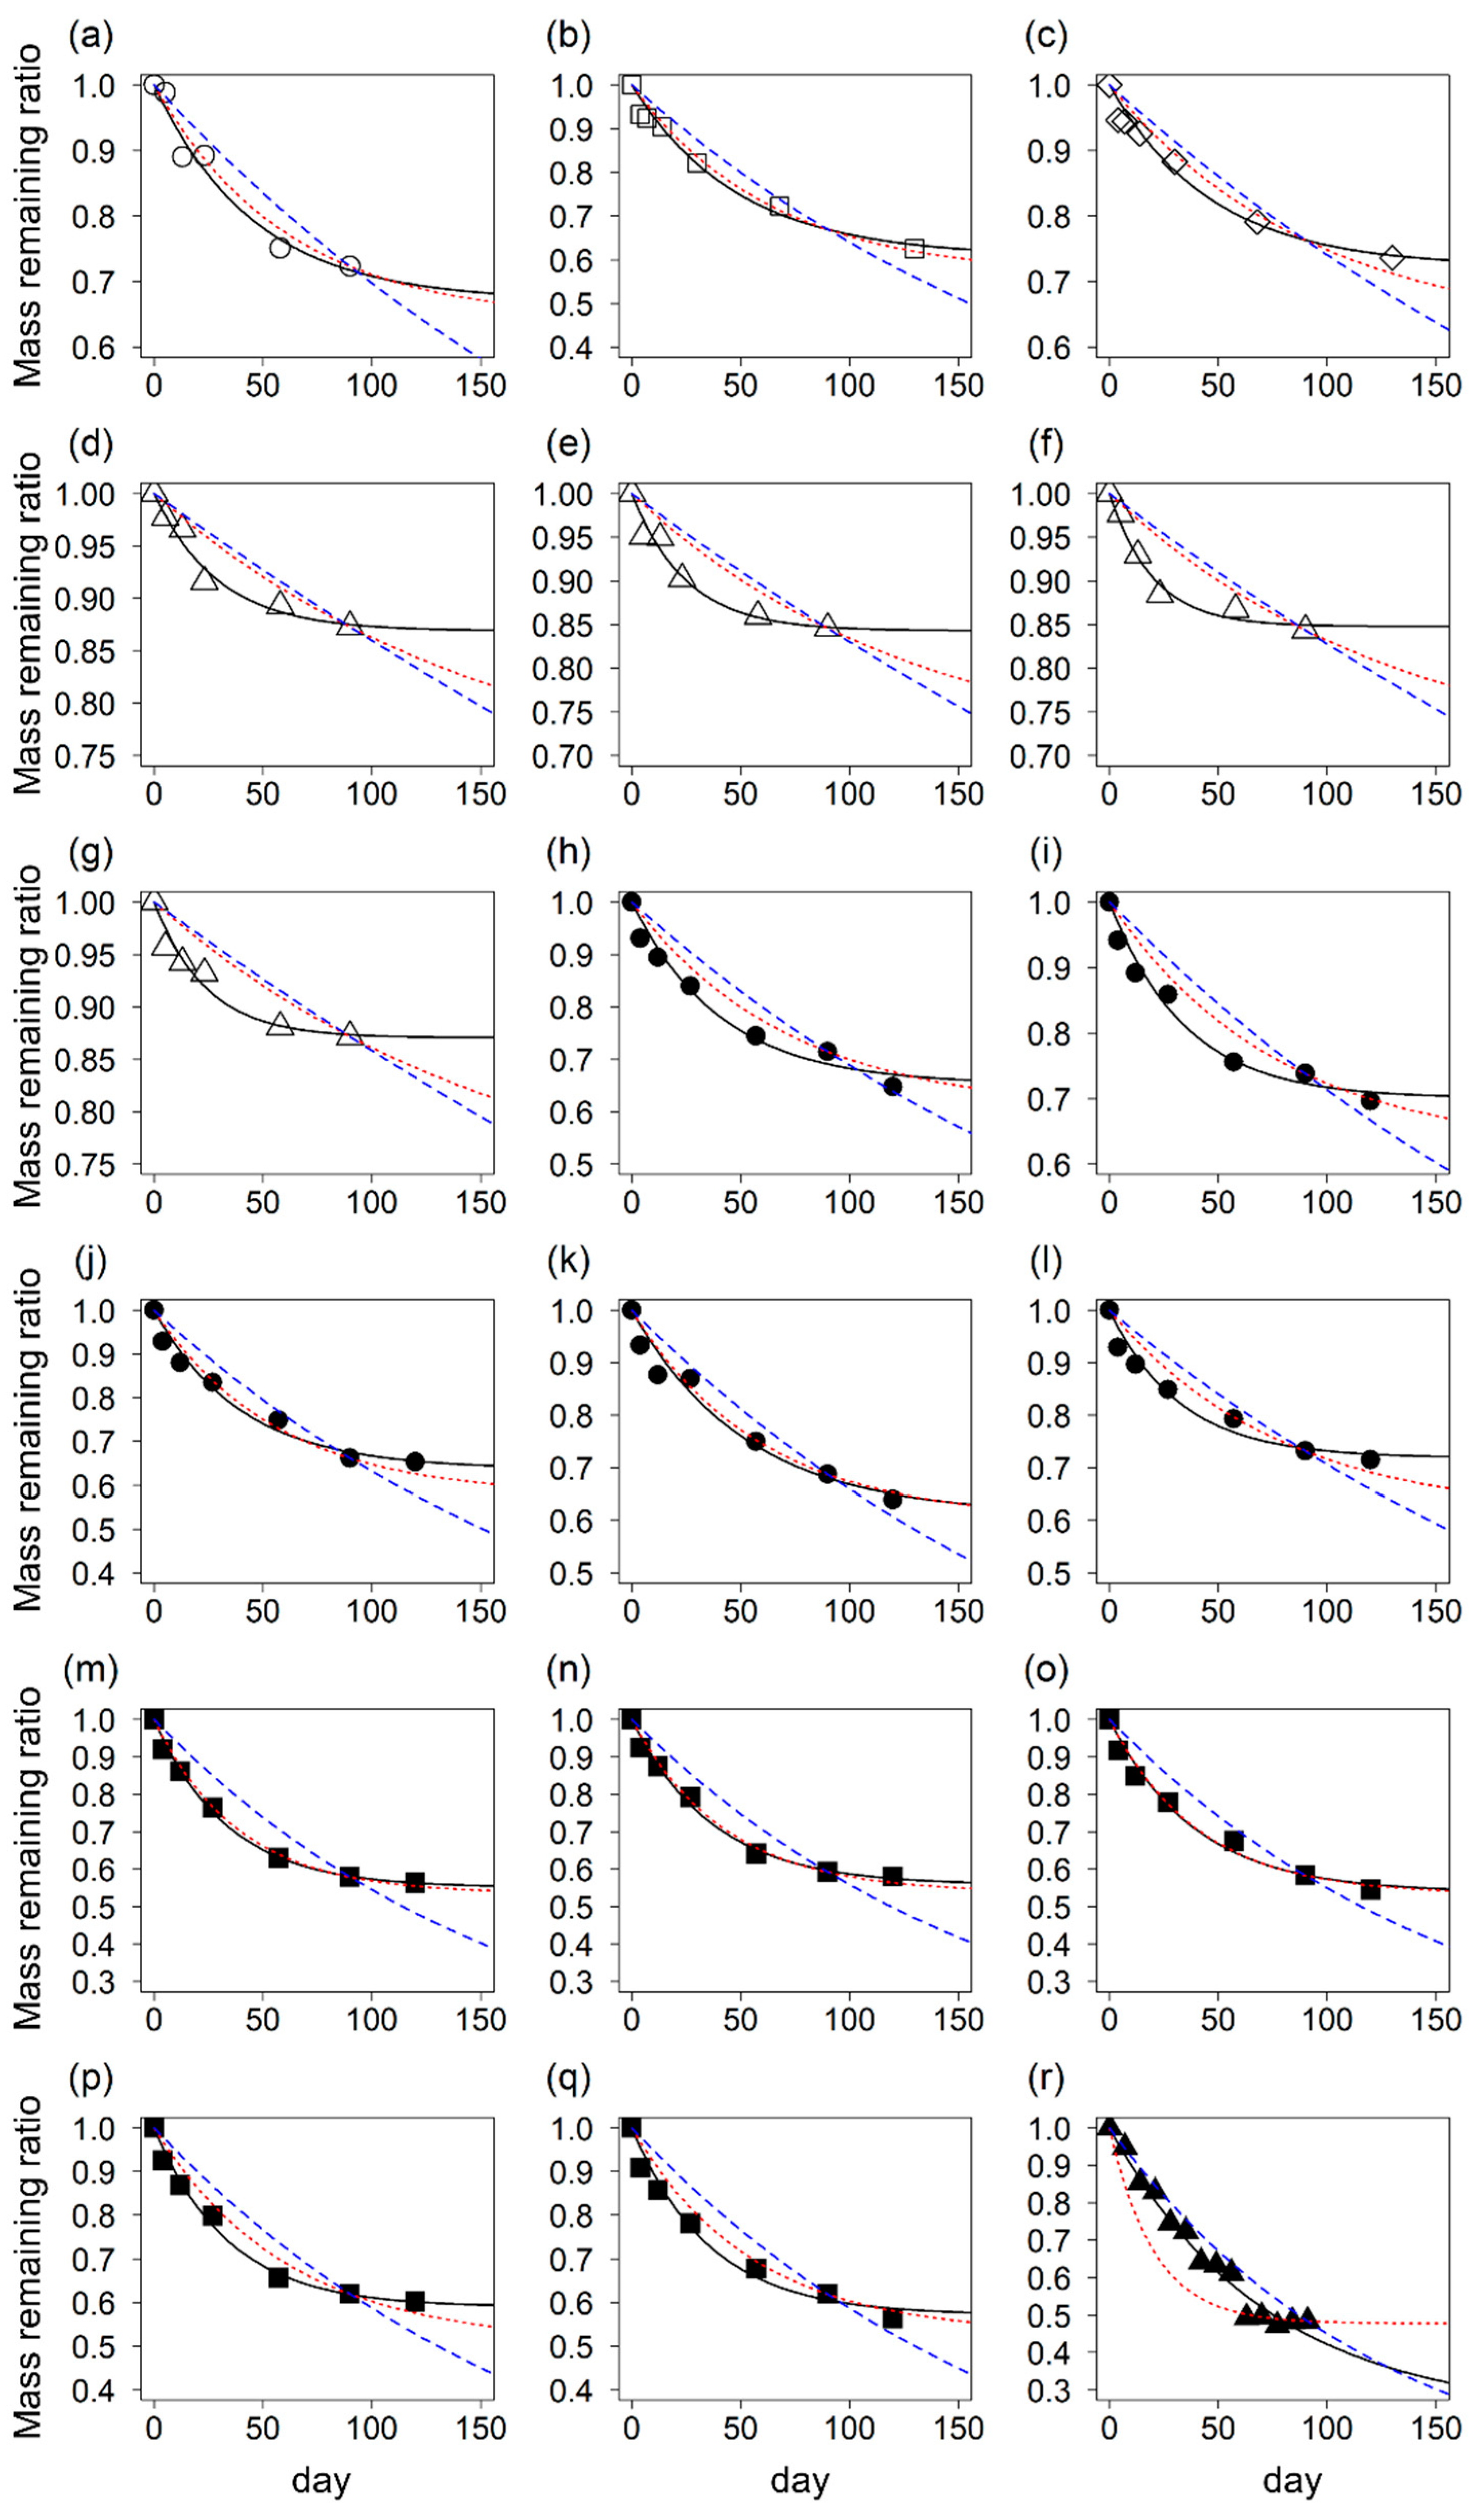
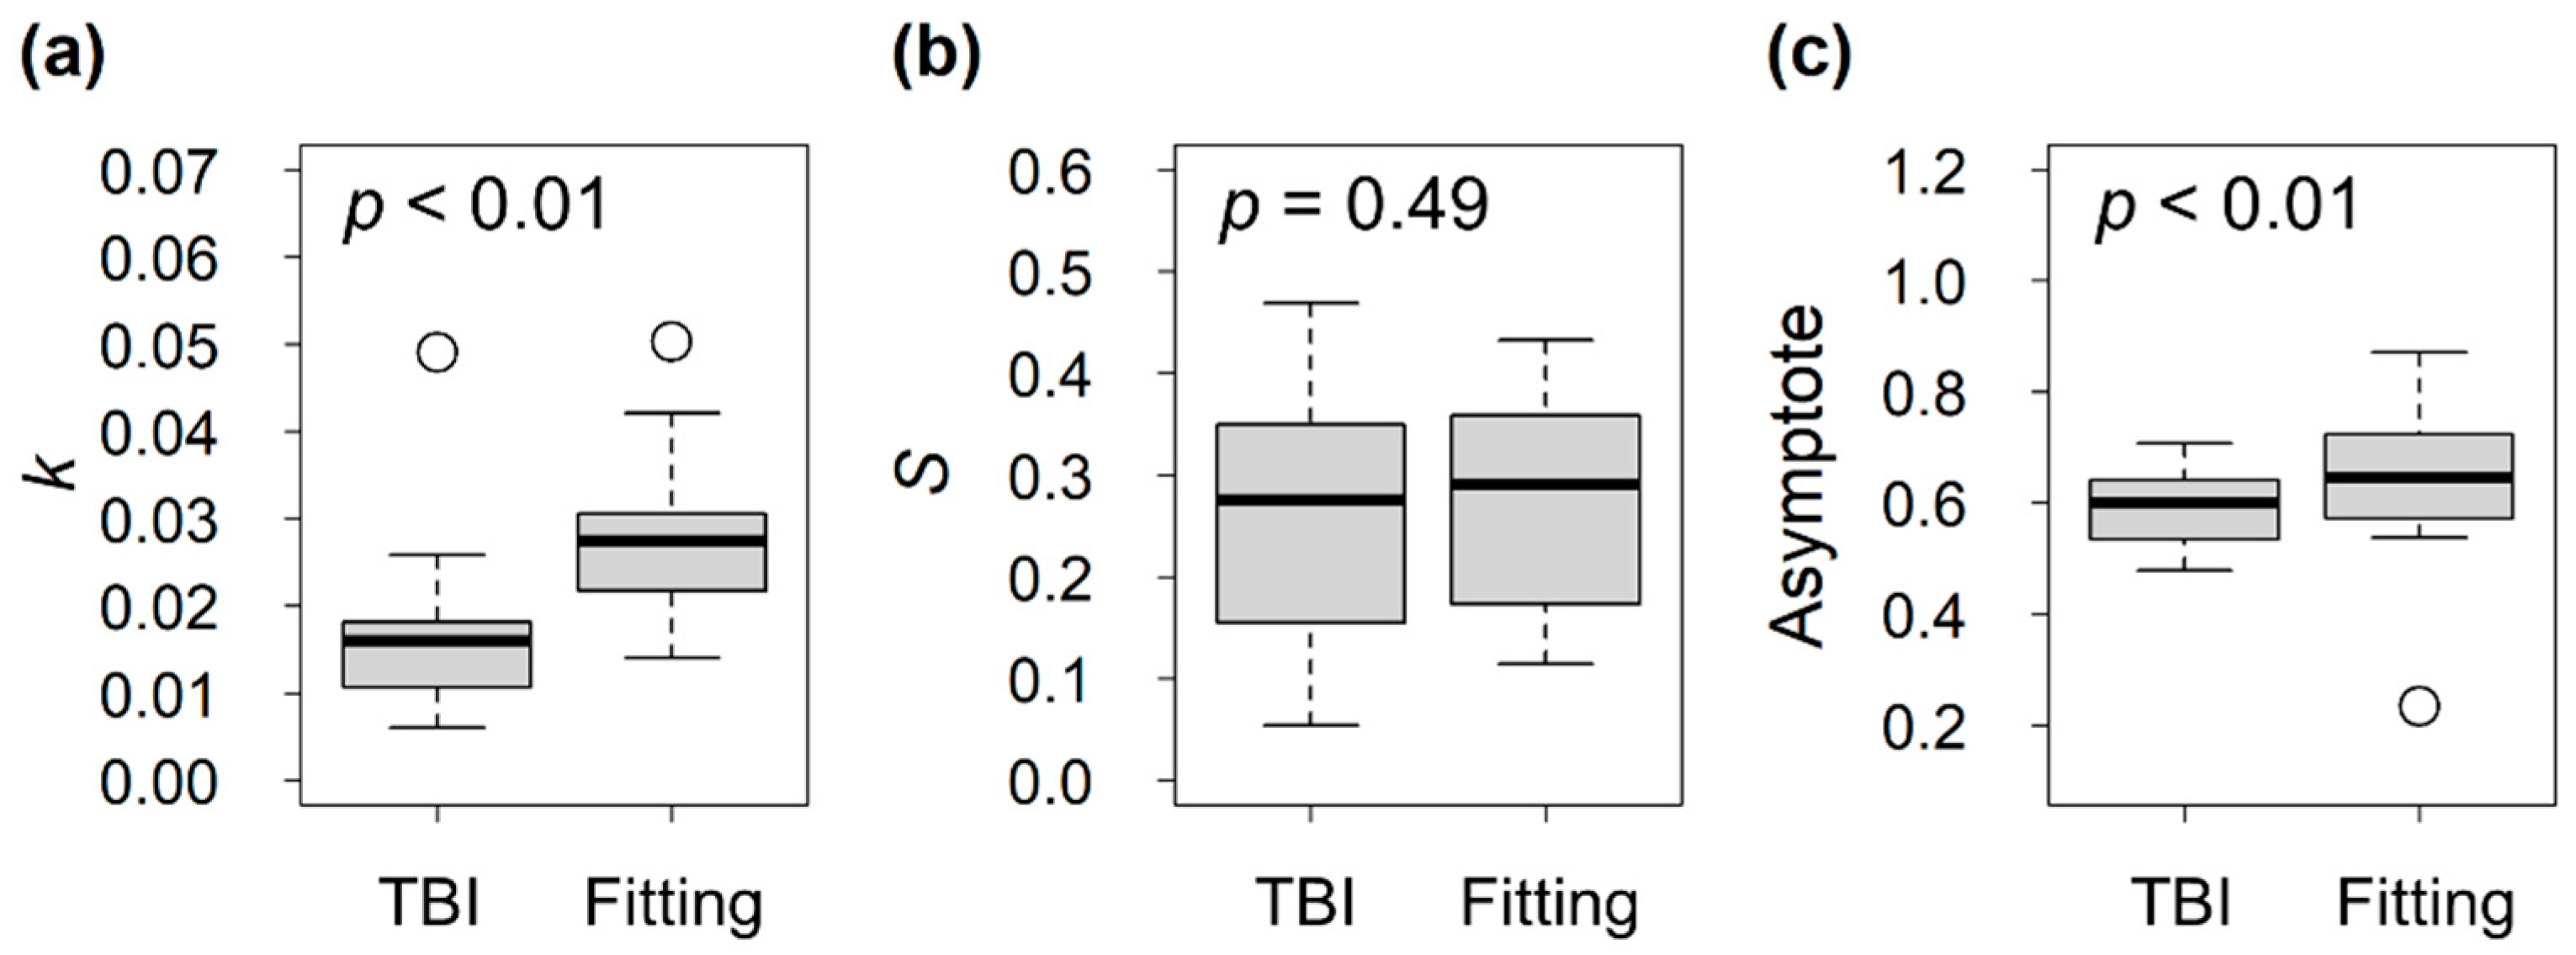
All of the time-series data on the masses of both green and rooibos tea remaining after decomposition, including the data obtained in the present incubation study (Figure 2a and Figure 3a), were well fitted by the asymptote model (Figure 2 and Figure 3). The fittings of the asymptote model were much better than those of the single exponential model (Figure 2 and Figure 3), which justified the use of the asymptote model rather than the single exponential model for describing the decomposition of teas in the TBI approach. The decomposition curves of rooibos tea were well described by the TBI-based asymptote model in some, but not all, of the incubation studies (Figure 2a,b,j,k,m–o). As Mori (2022) suggested, the TBI-based asymptote model did not well describe the decomposition curve in some soils (Figure 2d–g,i,r), most likely because the essential premise of the TBI approach, i.e., the stabilization factors of rooibos and green teas are equal, was not satisfied [7]. Indeed, the asymptote obtained by the fitting differed significantly from that calculated based on the TBI approach (p < 0.01, Figure 4c). The asymptote (i.e., 1 − ar) was underestimated by the TBI approach because unstabilized hydrolisable fraction in rooibos tea (i.e., ar) was overestimated by the TBI approach in most cases (Figure 5a). This unsatisfied assumption of the TBI approach resulted in significant differences between k_TBI and k_fitting (p < 0.01, Figure 4a). These results underscore the importance of obtaining time-series mass loss data of teas for accurately determining the early stage decomposition rate k of the asymptote model, as suggested previously [7,18].
The purpose of this study was to test if S_TBI and k_TBI are indicative of the relative values of S_fitting and k_fitting across different soils. If S_TBI and k_TBI are positively correlated with S_fitting and k_fitting, respectively, they can be used as an indicator of the relative decomposition rate across different soils, which would be useful for comparative analyses, although they do not determine k and S accurately. However, the results showed that k_TBI and k_fitting were not positively correlated but were significantly negatively correlated (Figure 6a). This indicates that k_TBI is not indicative of the asymptote model-based decomposition constant k and is therefore not useful for comparative analysis of the decomposition rates of rooibos tea among soils. The negative correlation between k_TBI and k_fitting was observed probably because of the following mechanism. The overestimation of ar_TBI became greater as ar_fitting decreased (Figure 5a). Because smaller ar_fitting was associated with larger k_fitting (Figure 5b), greater overestimation of ar_TBI was associated with larger k_fitting. Because overestimation of ar_TBI causes underestimation of k_TBI [19], underestimation of k_TBI became greater as k_fitting became larger, which caused negative correlations between k_TBI as k_fitting. On the other hand, S_TBI and S_fitting were significantly positively correlated (Figure 5b), indicating that S_TBI can be used as an indicator of S. Furthermore, the regression line was close to the 1:1 line, and the difference between S_TBI and S_fitting was not significant (p = 0.49, Figure 4b). Although a previous study reported that S_TBI and S_fitting were slightly but significantly different [7], the difference might be negligible. More data are required to examine this.
The finding that the k_TBI does not indicate the asymptote model-based decomposition constant k does not reduce the value of the TBI approach. The tea bags provide effective standardized materials for evaluating organic matter decomposition; the method is cost-effective and reduces the effort needed to prepare litter bags. Because of these advantages, obtaining time-series data is not difficult using the TBI approach, and I recommend obtaining time-series data to determine the early-stage decomposition constant k of rooibos tea. Alternatively, to reduce the effort in obtaining decomposition data as much as possible, I recommend using the raw mass loss data of rooibos tea, rather than k_TBI, as suggested previously [19], because k_TBI is biased by an unsatisfactory assumption of the TBI approach: the stabilization factors of rooibos and green teas are equal.
This study demonstrated that k_TBI does not indicate the relative decomposition rate across different soils and is not useful for comparative analyses. However, it might be possible to overcome the unsatisfactory assumption of the TBI approach to improve the k_TBI calculation if the asymptote of the rooibos tea decomposition curve can be predicted by the mass loss data of green tea (Figure 5a, note that ar_TBI is the constant factor of ag_TBI). Because the currently obtained data are insufficient to test this, more time-series data need to be obtained from various soil types.
4. Conclusions
The present study examined if k_TBI and S_TBI, which can be determined in a cost- and labor-effective manner, indicates the relative values of k_fitting and S_fitting across different soils and be useful for comparative analyses. The correlations of k_TBI and S_TBI with k_fitting and S_fitting, respectively, were examined, because if they are positively correlated with each other, these indexes are useful for comparative analyses. However, the result showed that k_TBI was negatively correlated with k_fitting, indicating that k_TBI is not indicative of the asymptote model-based decomposition constant k and is therefore not useful for comparative analysis of the decomposition rates of rooibos tea among soils. This study underscores the importance of obtaining time-series data for accurately determining the decomposition constant of an asymptote model describing the decomposition curve of rooibos tea. Nevertheless, S_TBI was positively correlated with S_fitting, indicating that S_TBI can be used as an indicator of S.
Funding
This research was funded by JSPS KAKENHI Grant Number JP19K15879.
Data Availability Statement
Data supporting the reported results can be sent upon request by the corresponding author.
Acknowledgments
I thank Yumiko Sakamoto and Akane Sakumori for their assistance on the laboratory work.
Conflicts of Interest
The author declares no conflict of interest.
References
- Knorr, M.; Frey, S.; Curtis, P. Nitrogen additions and litter decomposition: A meta analysys. Ecology 2005, 86, 3252–3257. [Google Scholar] [CrossRef] [Green Version]
- Keuskamp, J.A.; Dingemans, B.J.J.; Lehtinen, T.; Sarneel, J.M.; Hefting, M.M. Tea Bag Index: A novel approach to collect uniform decomposition data across ecosystems. Methods Ecol. Evol. 2013, 4, 1070–1075. [Google Scholar] [CrossRef]
- Petraglia, A.; Cacciatori, C.; Chelli, S.; Fenu, G.; Calderisi, G.; Gargano, D.; Abeli, T.; Orsenigo, S.; Carbognani, M. Litter decomposition: Effects of temperature driven by soil moisture and vegetation type. Plant Soil 2019, 435, 187–200. [Google Scholar] [CrossRef]
- Fujii, S.; Mori, A.S.; Koide, D.; Makoto, K.; Matsuoka, S.; Osono, T.; Isbell, F. Disentangling relationships between plant diversity and decomposition processes under forest restoration. J. Appl. Ecol. 2017, 54, 80–90. [Google Scholar] [CrossRef]
- Fanin, N.; Bezaud, S.; Sarneel, J.M.; Cecchini, S.; Nicolas, M.; Augusto, L. Relative Importance of Climate, Soil and Plant Functional Traits During the Early Decomposition Stage of Standardized Litter. Ecosystems 2020, 23, 1004–1018. [Google Scholar] [CrossRef]
- Fung, T.K.; Richards, D.R.; Leong, R.A.T.; Ghosh, S.; Tan, C.W.J.; Drillet, Z.; Leong, K.L.; Edwards, P.J. Litter decomposition and infiltration capacities in soils of different tropical urban land covers. Urban Ecosyst. 2022, 25, 21–34. [Google Scholar] [CrossRef]
- Mori, T. Validation of the Tea Bag Index as a standard approach for assessing organic matter decomposition: A laboratory incubation experiment. Ecol. Indic. 2022, 141, 109077. [Google Scholar] [CrossRef]
- Mori, T.; Aoyagi, R.; Taga, H.; Sakai, Y. Effects of water content and mesh size on tea bag decomposition. Ecologies 2021, 2, 175–186. [Google Scholar] [CrossRef]
- Mori, T.; Ishizuka, S.; Konda, R.; Wicaksono, A.; Heriyanto, J.; Hardjono, A.; Ohta, S. Effects of phosphorus addition on N2O emissions from an Acacia mangium soil in relatively aerobic condition. Tropics 2016, 25, 117–125. [Google Scholar] [CrossRef] [Green Version]
- Duddigan, S.; Shaw, L.J.; Alexander, P.D.; Collins, C.D.; Society, R.H. Chemical Underpinning of the Tea Bag Index: An Examination of the Decomposition of Tea Leaves. Appl. Environ. Soil Sci. 2020, 2020, 6085180. [Google Scholar] [CrossRef]
- Mori, T. Can Nonwoven Tea Bags Be Used to Determine the Tea Bag Index? Ecologies 2022, 3, 175–182. [Google Scholar] [CrossRef]
- Mori, T. Tea Bags—Standard Materials for Testing Impacts of Nitrogen Addition on Litter Decomposition in Aquatic Ecosystems? Nitrogen 2021, 2, 259–267. [Google Scholar] [CrossRef]
- Mori, T.; Ono, K.; Sakai, Y. Testing the Tea Bag Index as a potential indicator for assessing litter decomposition in aquatic ecosystems. bioRxiv 2021. [Google Scholar] [CrossRef]
- Seelen, L.M.S.; Flaim, G.; Keuskamp, J.; Teurlincx, S.; Arias Font, R.; Tolunay, D.; Fránková, M.; Šumberová, K.; Temponeras, M.; Lenhardt, M. An affordable and reliable assessment of aquatic decomposition: Tailoring the Tea Bag Index to surface waters. Water Res. 2019, 151, 31–43. [Google Scholar] [CrossRef] [PubMed]
- Teo, A.; Kristensen, N.P.; Keuskamp, J.A.; Evans, T.A.; Foo, M.; Chisholm, R.A. Validation and extension of the Tea Bag Index to collect decomposition data from termite-rich ecosystems. Pedobiologia 2020, 80, 150639. [Google Scholar] [CrossRef]
- Tummers, B. DataThief III. 2006. Available online: http://datathief.org/ (accessed on 9 November 2022).
- R Core Team. R: A Language and Environment for Statistical Computing; Statistical, R Foundation for Computing: Vienna, Austria, 2020; Available online: https://www.R-project.org/ (accessed on 28 May 2022).
- Mori, T.; Nakamura, R.; Aoyagi, R. Risk of misinterpreting the Tea Bag Index: Field observations and a random simulation. Ecol. Res. 2022, 37, 381–389. [Google Scholar] [CrossRef]
- Mori, T.; Hashimoto, T.; Sakai, Y. Evaluating the tea bag method as a potential tool for detecting the effects of added nutrients and their interactions with climate on litter decomposition. bioRxiv 2021. [Google Scholar] [CrossRef]
Figure 1.
The concept of the Tea Bag Index (TBI) approach. The figure is modified from Mori (2022) [7]. The (a) left and (b) right figures are the decomposition curves of green and rooibos teas, respectively. ag and ar are the unstabilized hydrolysable fractions of green and rooibos teas, respectively. Hg (0.842) and Hr (0.552) are the hydrolysable fractions of green and rooibos teas, respectively. The S in the figure indicates S_TBI. The decomposition constant k (k_TBI) can be determined by fitting an asymptote model (Mass of rooibos tea remaining = ar × e−k×t + (1 − ar), see Equation (4)), to the mass of rooibos tea remaining at the end of the approximately 90-day incubation.

Figure 2.
Mass remaining ratios of green tea during the incubation studies. Symbols in the figure indicate the proportion of green tea remaining. Different symbol indicates different incubation condition (such as soil type and incubated temperature). Black lines indicate the fit to the asymptote model. Dashed blue lines indicate the single exponential model describing green tea decomposition. Data were obtained from the present incubation study (a), Keuskamp et al. (2013) [2] (b,c), Mori (2022) [7] (d–g), Mori (2022) [11] (h–q), and Duddigan et al. (2020) [10] (r). Data points in figures (b,c,r) indicate mean values.

Figure 3.
Mass remaining ratio of rooibos tea during incubation studies. Symbols in the figure indicate the proportion of rooibos tea remaining. Different symbol indicates different incubation condition (such as soil type and incubated temperature). Black lines indicate fitting to the asymptote mode. Dotted red lines indicate the asymptote model describing rooibos tea decomposition based on the TBI approach. Dashed blue lines indicate the single exponential model describing rooibos tea decomposition. Data were obtained from the present incubation study (a), Keuskamp et al. 2013 (b,c), Mori 2022a (d–g), Mori 2022b (h–q), and Duddigan et al. 2020 (r). Data points in figures (b,c,r) indicate mean values.

Figure 4.
Comparisons of (a) k, (b) S, and (c) asymptote (i.e., 1 − ar) obtained by the TBI approach and those obtained by fitting the asymptote model to the time series data. Statistical significances were examined using a linear mixed-effects model.
Figure 4.
Comparisons of (a) k, (b) S, and (c) asymptote (i.e., 1 − ar) obtained by the TBI approach and those obtained by fitting the asymptote model to the time series data. Statistical significances were examined using a linear mixed-effects model.

Figure 5.
Relationships between (a) ar_TBI and ar_fitting and (b) ar_fitting and k_fitting. Dashed line indicates the 1:1 line.
Figure 5.
Relationships between (a) ar_TBI and ar_fitting and (b) ar_fitting and k_fitting. Dashed line indicates the 1:1 line.

Figure 6.
Relationships between (a) k_fitting and k_TBI and (b) S_fitting and S_TBI. Dashed lines indicate the 1:1 lines.
Figure 6.
Relationships between (a) k_fitting and k_TBI and (b) S_fitting and S_TBI. Dashed lines indicate the 1:1 lines.

Publisher’s Note: MDPI stays neutral with regard to jurisdictional claims in published maps and institutional affiliations. |
© 2022 by the author. Licensee MDPI, Basel, Switzerland. This article is an open access article distributed under the terms and conditions of the Creative Commons Attribution (CC BY) license (https://creativecommons.org/licenses/by/4.0/).
Share and Cite
MDPI and ACS Style
Mori, T. Is the Tea Bag Index (TBI) Useful for Comparing Decomposition Rates among Soils? Ecologies 2022, 3, 521-529. https://doi.org/10.3390/ecologies3040038
AMA Style
Mori T. Is the Tea Bag Index (TBI) Useful for Comparing Decomposition Rates among Soils? Ecologies. 2022; 3(4):521-529. https://doi.org/10.3390/ecologies3040038
Chicago/Turabian StyleMori, Taiki. 2022. "Is the Tea Bag Index (TBI) Useful for Comparing Decomposition Rates among Soils?" Ecologies 3, no. 4: 521-529. https://doi.org/10.3390/ecologies3040038